Recensione breve del portatile Dell XPS 13 9360 QHD+ i7-7500U


| SD Card Reader | |
| average JPG Copy Test (av. of 3 runs) | |
| MSI GT73VR 6RF | |
| Dell XPS 13 9360 QHD+ i7 | |
| Asus Zenbook UX360UA-C4159T | |
| maximum AS SSD Seq Read Test (1GB) | |
| Dell XPS 13 9360 QHD+ i7 | |
| MSI GT73VR 6RF | |
| Asus Zenbook UX360UA-C4159T | |
| Networking | |
| Wi-Fi Client 1m 512KB | |
| Wi-Fi Server 1m 512KB |
| |||||||||||||||||||||||||
Distribuzione della luminosità: 84 %
Al centro con la batteria: 396.2 cd/m²
Contrasto: 1489:1 (Nero: 0.266 cd/m²)
ΔE ColorChecker Calman: 3.9 | ∀{0.5-29.43 Ø4.71}
ΔE Greyscale Calman: 4.16 | ∀{0.09-98 Ø4.96}
88.7% sRGB (Argyll 1.6.3 3D)
57.5% AdobeRGB 1998 (Argyll 1.6.3 3D)
64.6% AdobeRGB 1998 (Argyll 3D)
89.4% sRGB (Argyll 3D)
62.8% Display P3 (Argyll 3D)
Gamma: 2.31
CCT: 6514 K
| Dell XPS 13 9360 QHD+ i7 Sharp SHP144A, IPS, 13.3", 3200x1800 | HP Spectre x360 13-w023dx Chi Mei CMN1367, IPS, 13.3", 1920x1080 | HP EliteBook 1030 G1-X2F03EA Sharp SHP1465, IPS, 13.3", 3200x1800 | Asus Zenbook UX360UA-C4159T AU Optronics AOU272D / B133HAN02.7, IPS, 13.3", 1920x1080 | Apple MacBook Air 13 inch 2015-03 Apple APP9CF0, TN LED, 13.3", 1440x900 | |
|---|---|---|---|---|---|
| Display | 2% | 7% | 3% | -35% | |
| Display P3 Coverage (%) | 62.8 | 65.4 4% | 67.6 8% | 64.8 3% | 40.1 -36% |
| sRGB Coverage (%) | 89.4 | 90.4 1% | 94.7 6% | 93.1 4% | 59.8 -33% |
| AdobeRGB 1998 Coverage (%) | 64.6 | 65.8 2% | 69 7% | 66 2% | 41.51 -36% |
| Response Times | 14% | 8% | 34% | ||
| Response Time Grey 50% / Grey 80% * (ms) | 43.6 ? | 33.2 ? 24% | 42.4 ? 3% | 29 ? 33% | |
| Response Time Black / White * (ms) | 29.2 ? | 28 ? 4% | 25.6 ? 12% | 19 ? 35% | |
| PWM Frequency (Hz) | 50 ? | ||||
| Screen | -28% | -1% | -16% | -18% | |
| Brightness middle (cd/m²) | 396.2 | 334.6 -16% | 401 1% | 344 -13% | 329 -17% |
| Brightness (cd/m²) | 357 | 319 -11% | 369 3% | 326 -9% | 310 -13% |
| Brightness Distribution (%) | 84 | 90 7% | 85 1% | 86 2% | 82 -2% |
| Black Level * (cd/m²) | 0.266 | 0.336 -26% | 0.35 -32% | 0.27 -2% | 0.405 -52% |
| Contrast (:1) | 1489 | 996 -33% | 1146 -23% | 1274 -14% | 812 -45% |
| Colorchecker dE 2000 * | 3.9 | 6.21 -59% | 3.5 10% | 5.53 -42% | 3.96 -2% |
| Colorchecker dE 2000 max. * | 7.58 | 12 -58% | 6.33 16% | 10.01 -32% | 7.51 1% |
| Greyscale dE 2000 * | 4.16 | 7.71 -85% | 4.13 1% | 6.67 -60% | 3.51 16% |
| Gamma | 2.31 95% | 2.36 93% | 2.28 96% | 2.43 91% | 3.83 57% |
| CCT | 6514 100% | 6458 101% | 6508 100% | 7012 93% | 6711 97% |
| Color Space (Percent of AdobeRGB 1998) (%) | 57.5 | 58.6 2% | 61.56 7% | 60 4% | 38.4 -33% |
| Color Space (Percent of sRGB) (%) | 88.7 | 90 1% | 94.64 7% | 93 5% | 59.8 -33% |
| Media totale (Programma / Settaggio) | -4% /
-16% | 5% /
2% | 7% /
-6% | -27% /
-22% |
* ... Meglio usare valori piccoli
Tempi di risposta del Display
| ↔ Tempi di risposta dal Nero al Bianco | ||
|---|---|---|
| 29.2 ms ... aumenta ↗ e diminuisce ↘ combinato | ↗ 9.2 ms Incremento | 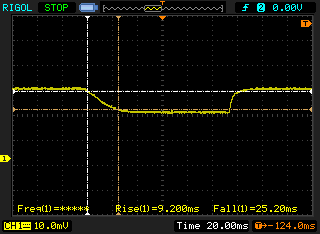 |
| ↘ 20 ms Calo | ||
| Lo schermo mostra tempi di risposta relativamente lenti nei nostri tests e potrebbe essere troppo lento per i gamers. In confronto, tutti i dispositivi di test variano da 0.1 (minimo) a 240 (massimo) ms. » 78 % di tutti i dispositivi è migliore. Questo significa che i tempi di risposta rilevati sono peggiori rispetto alla media di tutti i dispositivi testati (19.8 ms). | ||
| ↔ Tempo di risposta dal 50% Grigio all'80% Grigio | ||
| 43.6 ms ... aumenta ↗ e diminuisce ↘ combinato | ↗ 13.6 ms Incremento | 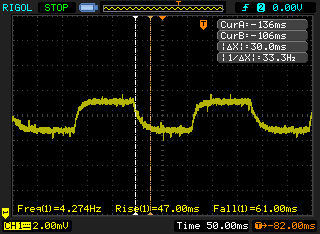 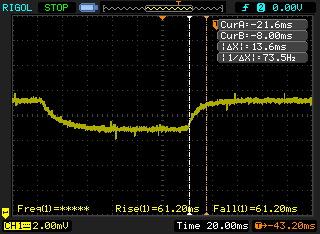 |
| ↘ 30 ms Calo | ||
| Lo schermo mostra tempi di risposta lenti nei nostri tests e sarà insoddisfacente per i gamers. In confronto, tutti i dispositivi di test variano da 0.165 (minimo) a 636 (massimo) ms. » 73 % di tutti i dispositivi è migliore. Questo significa che i tempi di risposta rilevati sono peggiori rispetto alla media di tutti i dispositivi testati (31 ms). | ||
Sfarfallio dello schermo / PWM (Pulse-Width Modulation)
| flickering dello schermo / PWM non rilevato | 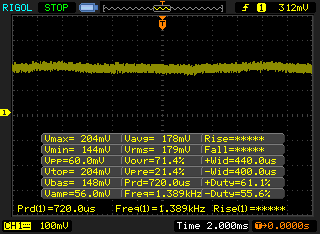 | ||
In confronto: 52 % di tutti i dispositivi testati non utilizza PWM per ridurre la luminosita' del display. Se è rilevato PWM, una media di 7757 (minimo: 5 - massimo: 343500) Hz è stata rilevata. | |||
| Cinebench R15 | |
| CPU Single 64Bit | |
| MSI CX72-7QL | |
| Intel Skull Canyon NUC6i7KYK | |
| Dell XPS 13 9360 QHD+ i7 | |
| Acer Aspire E5-774G-78NA | |
| Lenovo U31-70 80M5003EGE | |
| Dell XPS 13 9360 QHD+ i5 | |
| Lenovo Y40-59423035 | |
| HP EliteBook 1030 G1-X2F03EA | |
| CPU Multi 64Bit | |
| Intel Skull Canyon NUC6i7KYK | |
| MSI CX72-7QL | |
| Dell XPS 13 9360 QHD+ i7 | |
| Acer Aspire E5-774G-78NA | |
| Dell XPS 13 9360 QHD+ i5 | |
| HP EliteBook 1030 G1-X2F03EA | |
| Lenovo U31-70 80M5003EGE | |
| Lenovo Y40-59423035 | |
| Cinebench R11.5 | |
| CPU Single 64Bit | |
| MSI CX72-7QL | |
| Dell XPS 13 9360 QHD+ i7 | |
| Intel Skull Canyon NUC6i7KYK | |
| Acer Aspire E5-774G-78NA | |
| Lenovo U31-70 80M5003EGE | |
| Dell XPS 13 9360 QHD+ i5 | |
| HP EliteBook 1030 G1-X2F03EA | |
| Lenovo Y40-59423035 | |
| CPU Multi 64Bit | |
| Intel Skull Canyon NUC6i7KYK | |
| MSI CX72-7QL | |
| Dell XPS 13 9360 QHD+ i7 | |
| Acer Aspire E5-774G-78NA | |
| Dell XPS 13 9360 QHD+ i5 | |
| HP EliteBook 1030 G1-X2F03EA | |
| Lenovo U31-70 80M5003EGE | |
| Lenovo Y40-59423035 | |
| Cinebench R10 | |
| Rendering Multiple CPUs 32Bit | |
| Intel Skull Canyon NUC6i7KYK | |
| MSI CX72-7QL | |
| Dell XPS 13 9360 QHD+ i7 | |
| Acer Aspire E5-774G-78NA | |
| Lenovo U31-70 80M5003EGE | |
| Rendering Single 32Bit | |
| MSI CX72-7QL | |
| Dell XPS 13 9360 QHD+ i7 | |
| Intel Skull Canyon NUC6i7KYK | |
| Acer Aspire E5-774G-78NA | |
| Lenovo U31-70 80M5003EGE | |
| wPrime 2.10 - 1024m | |
| Lenovo Y40-59423035 | |
| Dell XPS 13 9360 QHD+ i5 | |
| Dell XPS 13 9360 QHD+ i7 | |
| MSI CX72-7QL | |
| Intel Skull Canyon NUC6i7KYK | |
| Super Pi Mod 1.5 XS 32M - 32M | |
| Lenovo Y40-59423035 | |
| Dell XPS 13 9360 QHD+ i7 | |
| MSI CX72-7QL | |
| Intel Skull Canyon NUC6i7KYK | |
* ... Meglio usare valori piccoli
| PCMark 8 | |
| Home Score Accelerated v2 | |
| Intel Skull Canyon NUC6i7KYK | |
| HP Spectre x360 13-w023dx | |
| HP Spectre 13 | |
| Asus Zenbook UX360UA-C4159T | |
| Dell XPS 13 9360 QHD+ i7 | |
| Dell XPS 13 9360 QHD+ i5 | |
| Work Score Accelerated v2 | |
| Intel Skull Canyon NUC6i7KYK | |
| HP Spectre x360 13-w023dx | |
| HP Spectre 13 | |
| Asus Zenbook UX360UA-C4159T | |
| Dell XPS 13 9360 QHD+ i7 | |
| Creative Score Accelerated v2 | |
| Intel Skull Canyon NUC6i7KYK | |
| HP Spectre x360 13-w023dx | |
| HP Spectre 13 | |
| Dell XPS 13 9360 QHD+ i7 | |
| PCMark 8 Home Score Accelerated v2 | 2855 punti | |
| PCMark 8 Creative Score Accelerated v2 | 4172 punti | |
| PCMark 8 Work Score Accelerated v2 | 4176 punti | |
Aiuto | ||
| Dell XPS 13 9360 QHD+ i7 Toshiba NVMe THNSN5256GPUK | HP Spectre x360 13-w023dx Samsung PM951 NVMe MZVLV512 | HP EliteBook 1030 G1-X2F03EA Sandisk X300 SD7SN6S-512G-1006 | Apple MacBook Air 13 inch 2015-03 Apple SSD SD0256F | Dell XPS 13 9360 QHD+ i5 Toshiba NVMe THNSN5256GPUK | |
|---|---|---|---|---|---|
| CrystalDiskMark 3.0 | 16% | -38% | 18% | -1% | |
| Read Seq (MB/s) | 1214 | 1376 13% | 387.5 -68% | 1352 11% | 1168 -4% |
| Write Seq (MB/s) | 655 | 571 -13% | 348.7 -47% | 1111 70% | 329 -50% |
| Read 512 (MB/s) | 1019 | 679 -33% | 239.9 -76% | 880 -14% | 1015 0% |
| Write 512 (MB/s) | 445.7 | 571 28% | 335.3 -25% | 1023 130% | 307 -31% |
| Read 4k (MB/s) | 35.55 | 42.66 20% | 30.34 -15% | 21.93 -38% | 33 -7% |
| Write 4k (MB/s) | 130 | 137.9 6% | 75.9 -42% | 30.94 -76% | 132 2% |
| Read 4k QD32 (MB/s) | 537 | 535 0% | 311.3 -42% | 339.5 -37% | 525 -2% |
| Write 4k QD32 (MB/s) | 173.8 | 361.2 108% | 192.8 11% | 342.9 97% | 325 87% |

| 3DMark | |
| 1280x720 Cloud Gate Standard Graphics | |
| Intel Skull Canyon NUC6i7KYK | |
| MSI CX72-7QL | |
| Dell XPS 13 9360 QHD+ i7 | |
| Asus X302UV-FN016T | |
| Dell XPS 13 9360 QHD+ i5 | |
| Lenovo Ideapad 510S-13ISK | |
| HP Pavilion x2 12-b000ng | |
| Dell Vostro 3546 JAN15HSW1601_1K9_Win | |
| Lenovo B50-50 80S2000QGE | |
| 1920x1080 Fire Strike Graphics | |
| Intel Skull Canyon NUC6i7KYK | |
| Asus X302UV-FN016T | |
| MSI CX72-7QL | |
| Dell XPS 13 9360 QHD+ i7 | |
| Dell XPS 13 9360 QHD+ i5 | |
| Lenovo Ideapad 510S-13ISK | |
| HP Pavilion x2 12-b000ng | |
| Lenovo B50-50 80S2000QGE | |
| Dell Vostro 3546 JAN15HSW1601_1K9_Win | |
| 3DMark 11 | |
| 1280x720 Performance GPU | |
| Intel Skull Canyon NUC6i7KYK | |
| Asus X302UV-FN016T | |
| MSI CX72-7QL | |
| Dell XPS 13 9360 QHD+ i7 | |
| Dell XPS 13 9360 QHD+ i5 | |
| Lenovo Ideapad 510S-13ISK | |
| HP Pavilion x2 12-b000ng | |
| Lenovo B50-50 80S2000QGE | |
| Dell Vostro 3546 JAN15HSW1601_1K9_Win | |
| 1280x720 Performance Combined | |
| Intel Skull Canyon NUC6i7KYK | |
| MSI CX72-7QL | |
| Asus X302UV-FN016T | |
| Dell XPS 13 9360 QHD+ i7 | |
| Dell XPS 13 9360 QHD+ i5 | |
| Lenovo Ideapad 510S-13ISK | |
| HP Pavilion x2 12-b000ng | |
| Lenovo B50-50 80S2000QGE | |
| Dell Vostro 3546 JAN15HSW1601_1K9_Win | |
| 3DMark 06 Standard Score | 9655 punti | |
| 3DMark 11 Performance | 1771 punti | |
| 3DMark Ice Storm Standard Score | 55532 punti | |
| 3DMark Cloud Gate Standard Score | 6460 punti | |
| 3DMark Fire Strike Score | 876 punti | |
| 3DMark Fire Strike Extreme Score | 401 punti | |
Aiuto | ||
| BioShock Infinite | |
| 1280x720 Very Low Preset | |
| Acer TravelMate P278-MG-76L2 | |
| Acer Aspire E5-574-53YZ | |
| MSI CX72-7QL | |
| Dell XPS 13 9360 QHD+ i7 | |
| Lenovo ThinkPad Yoga 12 20DK002EPB | |
| HP ProBook 650 G2 V1A44ET | |
| 1366x768 Medium Preset | |
| Acer TravelMate P278-MG-76L2 | |
| Acer Aspire E5-574-53YZ | |
| MSI CX72-7QL | |
| Dell XPS 13 9360 QHD+ i7 | |
| Lenovo ThinkPad Yoga 12 20DK002EPB | |
| HP ProBook 650 G2 V1A44ET | |
| 1366x768 High Preset | |
| Acer TravelMate P278-MG-76L2 | |
| Acer Aspire E5-574-53YZ | |
| MSI CX72-7QL | |
| Dell XPS 13 9360 QHD+ i7 | |
| Lenovo ThinkPad Yoga 12 20DK002EPB | |
| HP ProBook 650 G2 V1A44ET | |
| basso | medio | alto | ultra | |
|---|---|---|---|---|
| BioShock Infinite (2013) | 55 | 28.2 | 26.1 | 8.3 |
| The Witcher 3 (2015) | 15.7 | |||
| Dota 2 Reborn (2015) | 59.6 | 50.7 | 27 | 24.2 |
| Rise of the Tomb Raider (2016) | 21.8 | 12.5 | 6.2 | |
| Overwatch (2016) | 49.7 | 34.8 | 16.4 | |
| FIFA 17 (2016) | 56 gravi problemi grafici (flickering and slowdowns) | |||
| Battlefield 1 (2016) | 30.3 | |||
| Titanfall 2 (2016) | 36.6 | 24.9 |
Rumorosità
| Idle |
| 28.8 / 28.8 / 30.8 dB(A) |
| Sotto carico |
| 34.8 / 34.8 dB(A) |
 | ||
30 dB silenzioso 40 dB(A) udibile 50 dB(A) rumoroso |
||
min: | ||
| Dell XPS 13 9360 QHD+ i7 HD Graphics 620, i7-7500U, Toshiba NVMe THNSN5256GPUK | HP Spectre x360 13-w023dx HD Graphics 620, i7-7500U, Samsung PM951 NVMe MZVLV512 | HP Spectre 13 HD Graphics 520, 6500U, Samsung PM951 NVMe MZVLV256 | Apple MacBook Air 13 inch 2015-03 HD Graphics 6000, 5650U, Apple SSD SD0256F | Dell XPS 13 9360 QHD+ i5 HD Graphics 620, i5-7200U, Toshiba NVMe THNSN5256GPUK | |
|---|---|---|---|---|---|
| Noise | -4% | -6% | -9% | -4% | |
| off /ambiente * (dB) | 28.8 | 29.1 -1% | 28.5 1% | 30.3 -5% | |
| Idle Minimum * (dB) | 28.8 | 29.1 -1% | 28.5 1% | 29.2 -1% | 30.6 -6% |
| Idle Average * (dB) | 28.8 | 29.1 -1% | 30.9 -7% | 29.2 -1% | 30.6 -6% |
| Idle Maximum * (dB) | 30.8 | 31.2 -1% | 31.6 -3% | 29.2 5% | 32.2 -5% |
| Load Average * (dB) | 34.8 | 37.3 -7% | 38.8 -11% | 40.2 -16% | 32.2 7% |
| Load Maximum * (dB) | 34.8 | 39.6 -14% | 41.4 -19% | 46.3 -33% | 38.5 -11% |
* ... Meglio usare valori piccoli
(-) La temperatura massima sul lato superiore è di 50.8 °C / 123 F, rispetto alla media di 35.9 °C / 97 F, che varia da 21.4 a 59 °C per questa classe Subnotebook.
(-) Il lato inferiore si riscalda fino ad un massimo di 50.8 °C / 123 F, rispetto alla media di 39.2 °C / 103 F
(+) In idle, la temperatura media del lato superiore è di 25.7 °C / 78 F, rispetto alla media deld ispositivo di 30.8 °C / 87 F.
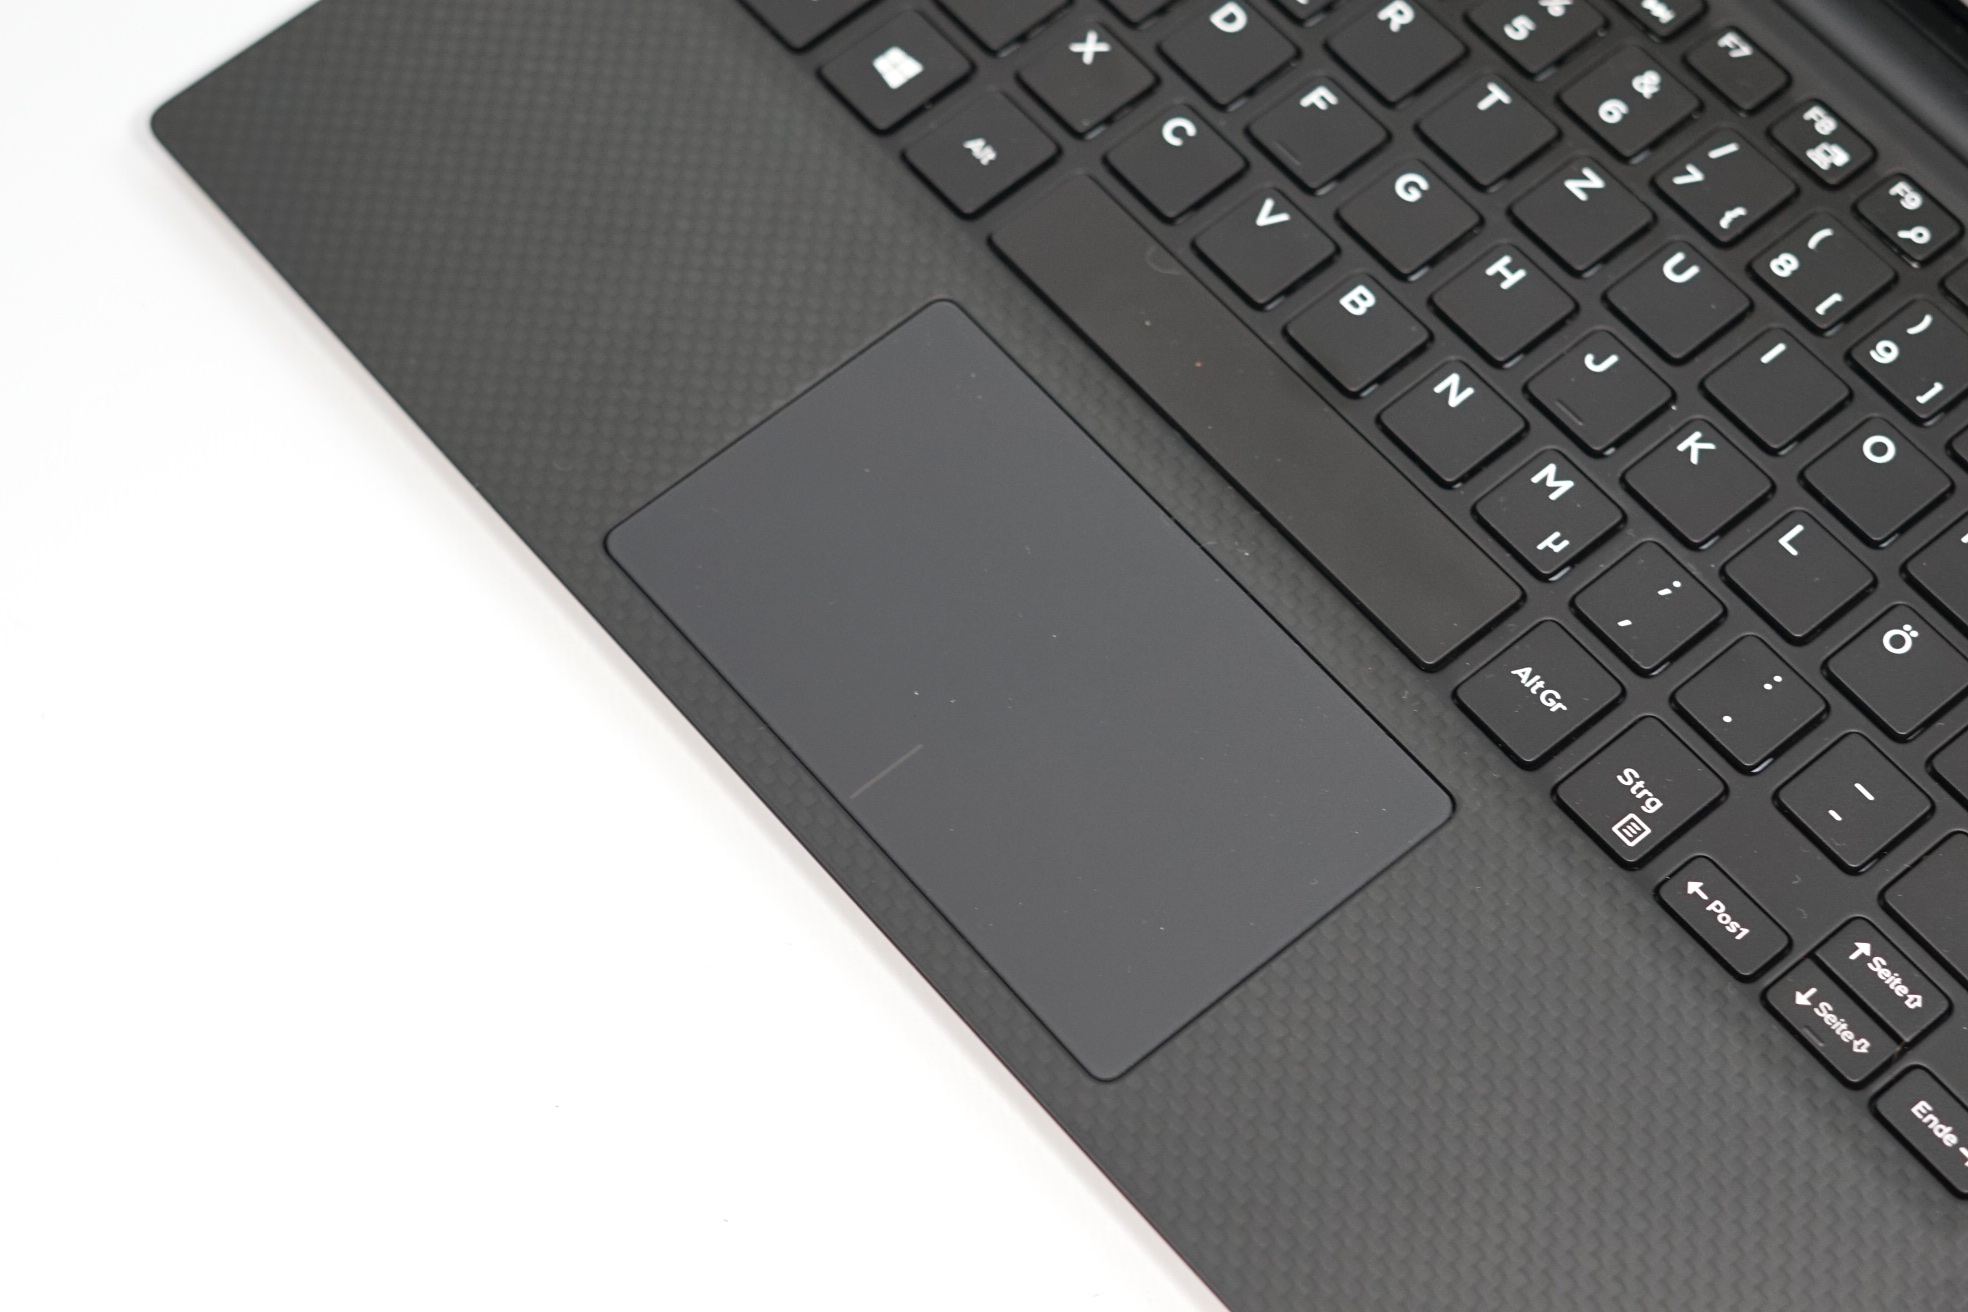
(+) I poggiapolsi e il touchpad sono piu' freddi della temperatura della pelle con un massimo di 31 °C / 87.8 F e sono quindi freddi al tatto.
(-) La temperatura media della zona del palmo della mano di dispositivi simili e'stata di 28.2 °C / 82.8 F (-2.8 °C / -5 F).
Dell XPS 13 9360 QHD+ i7 analisi audio
(±) | potenza degli altiparlanti media ma buona (72.4 dB)
Bassi 100 - 315 Hz
(±) | bassi ridotti - in media 6.5% inferiori alla media
(±) | la linearità dei bassi è media (12.6% delta rispetto alla precedente frequenza)
Medi 400 - 2000 Hz
(+) | medi bilanciati - solo only 4.6% rispetto alla media
(+) | medi lineari (6.9% delta rispetto alla precedente frequenza)
Alti 2 - 16 kHz
(+) | Alti bilanciati - appena 3.4% dalla media
(-) | alti non lineari (18.9% delta rispetto alla precedente frequenza)
Nel complesso 100 - 16.000 Hz
(±) | la linearità complessiva del suono è media (20.8% di differenza rispetto alla media
Rispetto alla stessa classe
» 68% di tutti i dispositivi testati in questa classe è stato migliore, 7% simile, 25% peggiore
» Il migliore ha avuto un delta di 5%, medio di 18%, peggiore di 53%
Rispetto a tutti i dispositivi testati
» 56% di tutti i dispositivi testati in questa classe è stato migliore, 8% similare, 36% peggiore
» Il migliore ha avuto un delta di 4%, medio di 23%, peggiore di 134%
Apple MacBook 12 (Early 2016) 1.1 GHz analisi audio
(+) | gli altoparlanti sono relativamente potenti (83.6 dB)
Bassi 100 - 315 Hz
(±) | bassi ridotti - in media 11.3% inferiori alla media
(±) | la linearità dei bassi è media (14.2% delta rispetto alla precedente frequenza)
Medi 400 - 2000 Hz
(+) | medi bilanciati - solo only 2.4% rispetto alla media
(+) | medi lineari (5.5% delta rispetto alla precedente frequenza)
Alti 2 - 16 kHz
(+) | Alti bilanciati - appena 2% dalla media
(+) | alti lineari (4.5% delta rispetto alla precedente frequenza)
Nel complesso 100 - 16.000 Hz
(+) | suono nel complesso lineare (10.2% differenza dalla media)
Rispetto alla stessa classe
» 7% di tutti i dispositivi testati in questa classe è stato migliore, 2% simile, 90% peggiore
» Il migliore ha avuto un delta di 5%, medio di 18%, peggiore di 53%
Rispetto a tutti i dispositivi testati
» 5% di tutti i dispositivi testati in questa classe è stato migliore, 1% similare, 94% peggiore
» Il migliore ha avuto un delta di 4%, medio di 23%, peggiore di 134%
| Off / Standby | |
| Idle | |
| Sotto carico |
|
Leggenda:
min: | |
| Dell XPS 13 9360 QHD+ i7 i7-7500U, HD Graphics 620, Toshiba NVMe THNSN5256GPUK, IPS, 3200x1800, 13.3" | HP Spectre x360 13-w023dx i7-7500U, HD Graphics 620, Samsung PM951 NVMe MZVLV512, IPS, 1920x1080, 13.3" | HP EliteBook 1030 G1-X2F03EA 6Y75, HD Graphics 515, Sandisk X300 SD7SN6S-512G-1006, IPS, 3200x1800, 13.3" | Apple MacBook Air 13 inch 2015-03 5650U, HD Graphics 6000, Apple SSD SD0256F, TN LED, 1440x900, 13.3" | Dell XPS 13 9360 QHD+ i5 i5-7200U, HD Graphics 620, Toshiba NVMe THNSN5256GPUK, , 3200x1800, 13.3" | |
|---|---|---|---|---|---|
| Power Consumption | -4% | -3% | 11% | 9% | |
| Idle Minimum * (Watt) | 6.4 | 5.5 14% | 4 37% | 2.7 58% | 3.7 42% |
| Idle Average * (Watt) | 6.6 | 6.7 -2% | 8 -21% | 5.7 14% | 6.1 8% |
| Idle Maximum * (Watt) | 6.8 | 7.1 -4% | 8.6 -26% | 6 12% | 6.5 4% |
| Load Average * (Watt) | 27.5 | 33.1 -20% | 26.5 4% | 32.1 -17% | 29.5 -7% |
| Load Maximum * (Watt) | 32.4 | 35.2 -9% | 34.8 -7% | 36.2 -12% | 33 -2% |
* ... Meglio usare valori piccoli
| Dell XPS 13 9360 QHD+ i7 i7-7500U, HD Graphics 620, 60 Wh | HP Spectre x360 13-w023dx i7-7500U, HD Graphics 620, 57.8 Wh | HP EliteBook 1030 G1-X2F03EA 6Y75, HD Graphics 515, 40 Wh | Apple MacBook Air 13 inch 2015-03 5650U, HD Graphics 6000, 54 Wh | Dell XPS 13 9360 QHD+ i5 i5-7200U, HD Graphics 620, 60 Wh | |
|---|---|---|---|---|---|
| Autonomia della batteria | 5% | -24% | 14% | 4% | |
| Reader / Idle (h) | 17.6 | 20.6 17% | 10.3 -41% | 26.2 49% | |
| WiFi v1.3 (h) | 8.6 | 9.3 8% | 5.1 -41% | 10.3 20% | 8.8 2% |
| Load (h) | 2.2 | 2 -9% | 2.4 9% | 1.6 -27% | 2.3 5% |
Pro
Contro
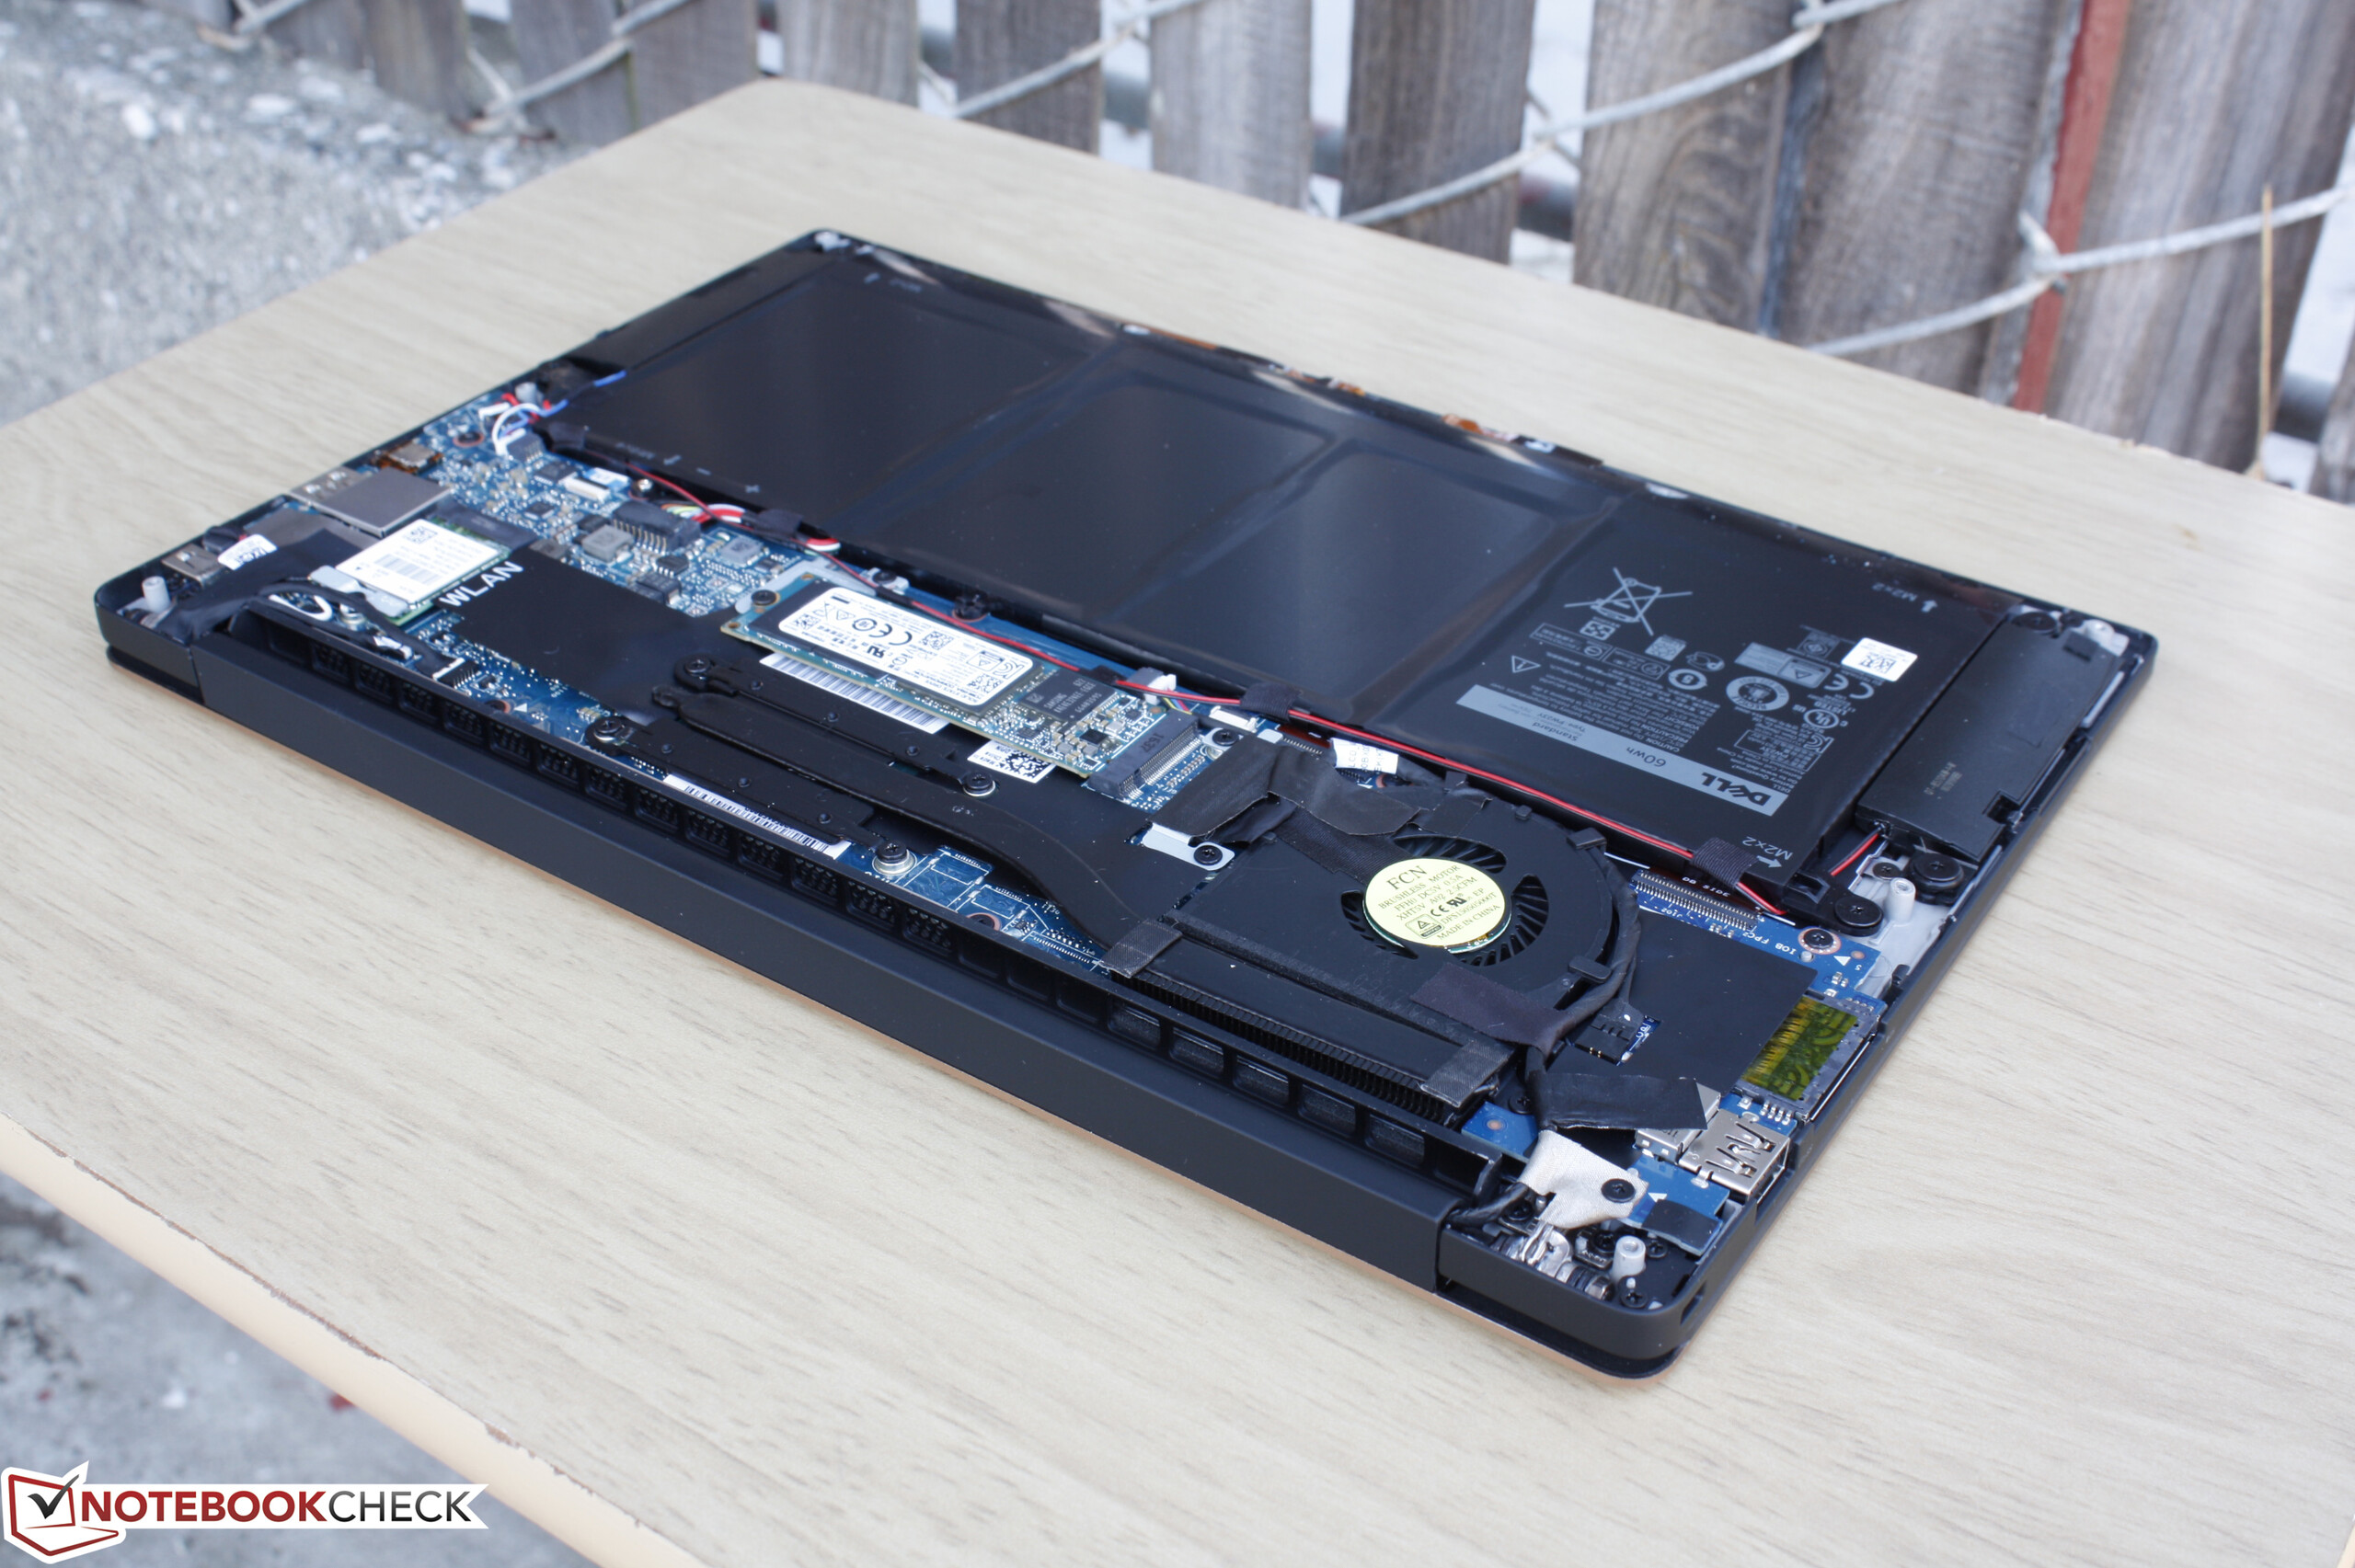
Per la maggioranza di utenti, la parte più importante dell'aggiornamento Kaby Lake XPS 13 9360 è il fatto che lo Skylake XPS 13 9350 ora è più economico. Le variazioni di prestazioni tra questi due (quasi) identici portatili sono talmente minime che coloro che useranno i portatili normalmente, per browsing, o multimedia vedranno davvero pochi benefici con la Kaby Lake. Di fatto, l'XPS 13 9350 SKUs con Iris Graphics riesce a superare la più recente Kaby Lake SKUs se gli utenti hanno bisogno di maggiore potenza grafica.
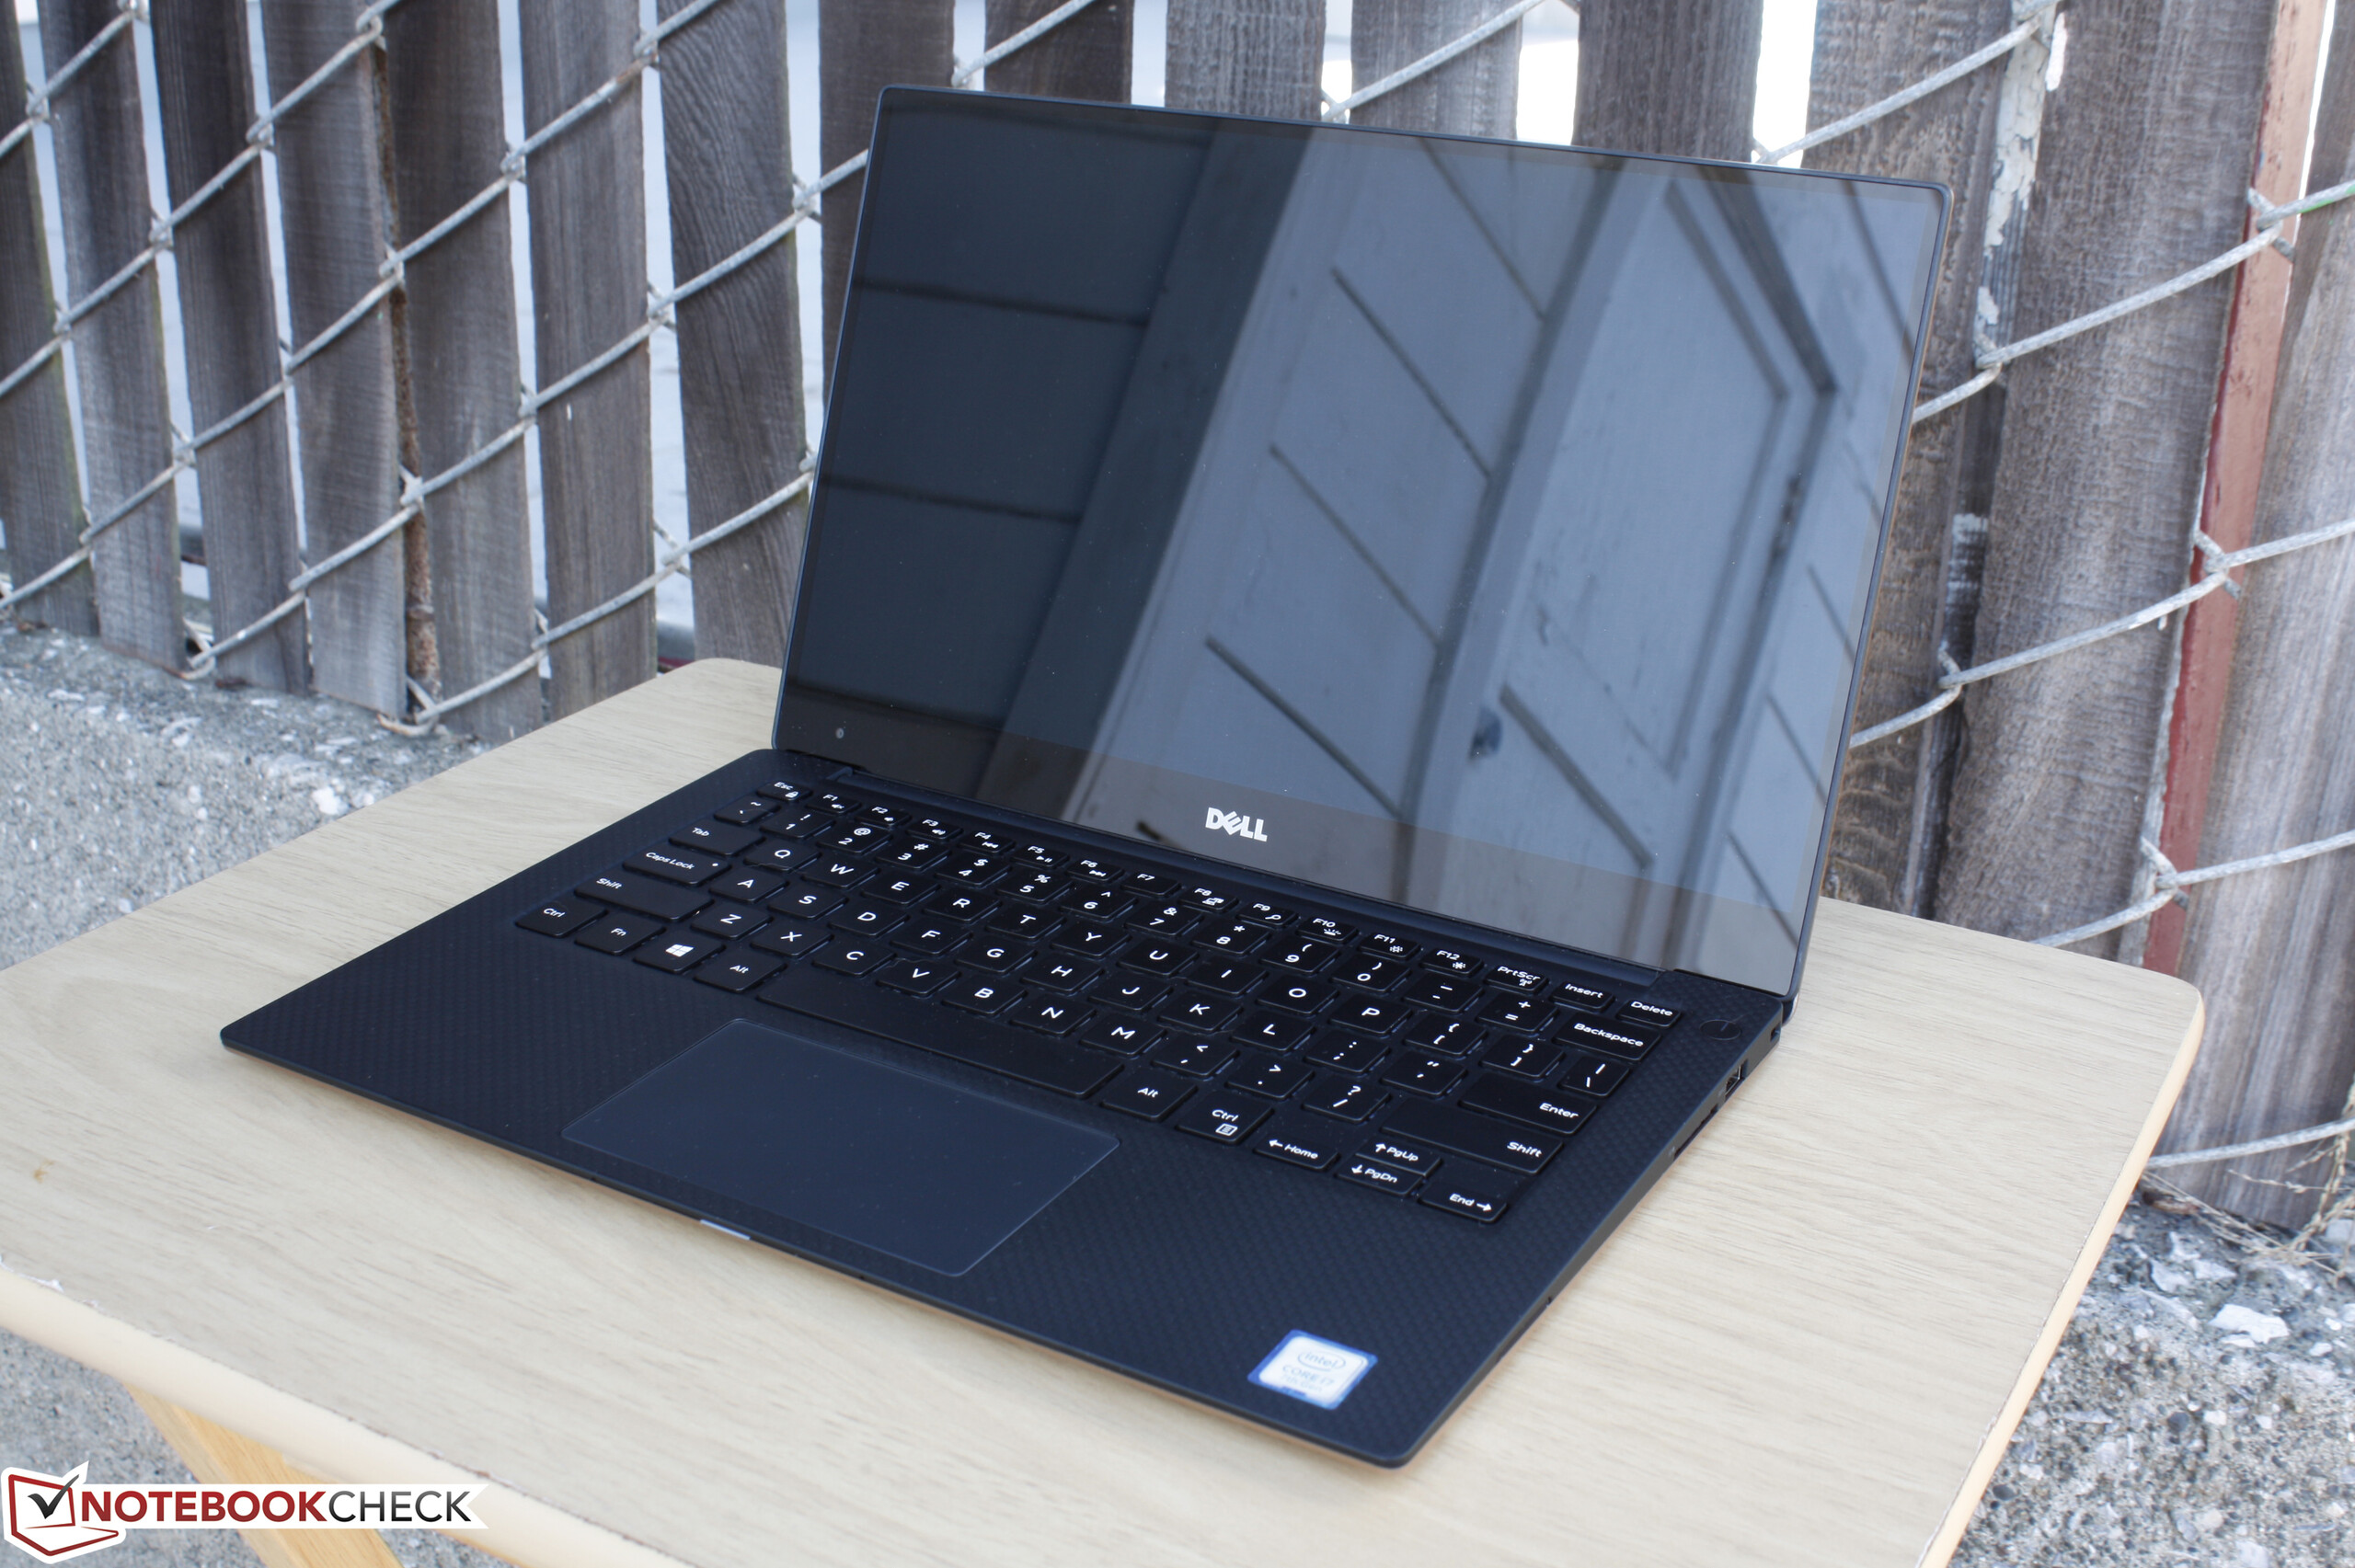
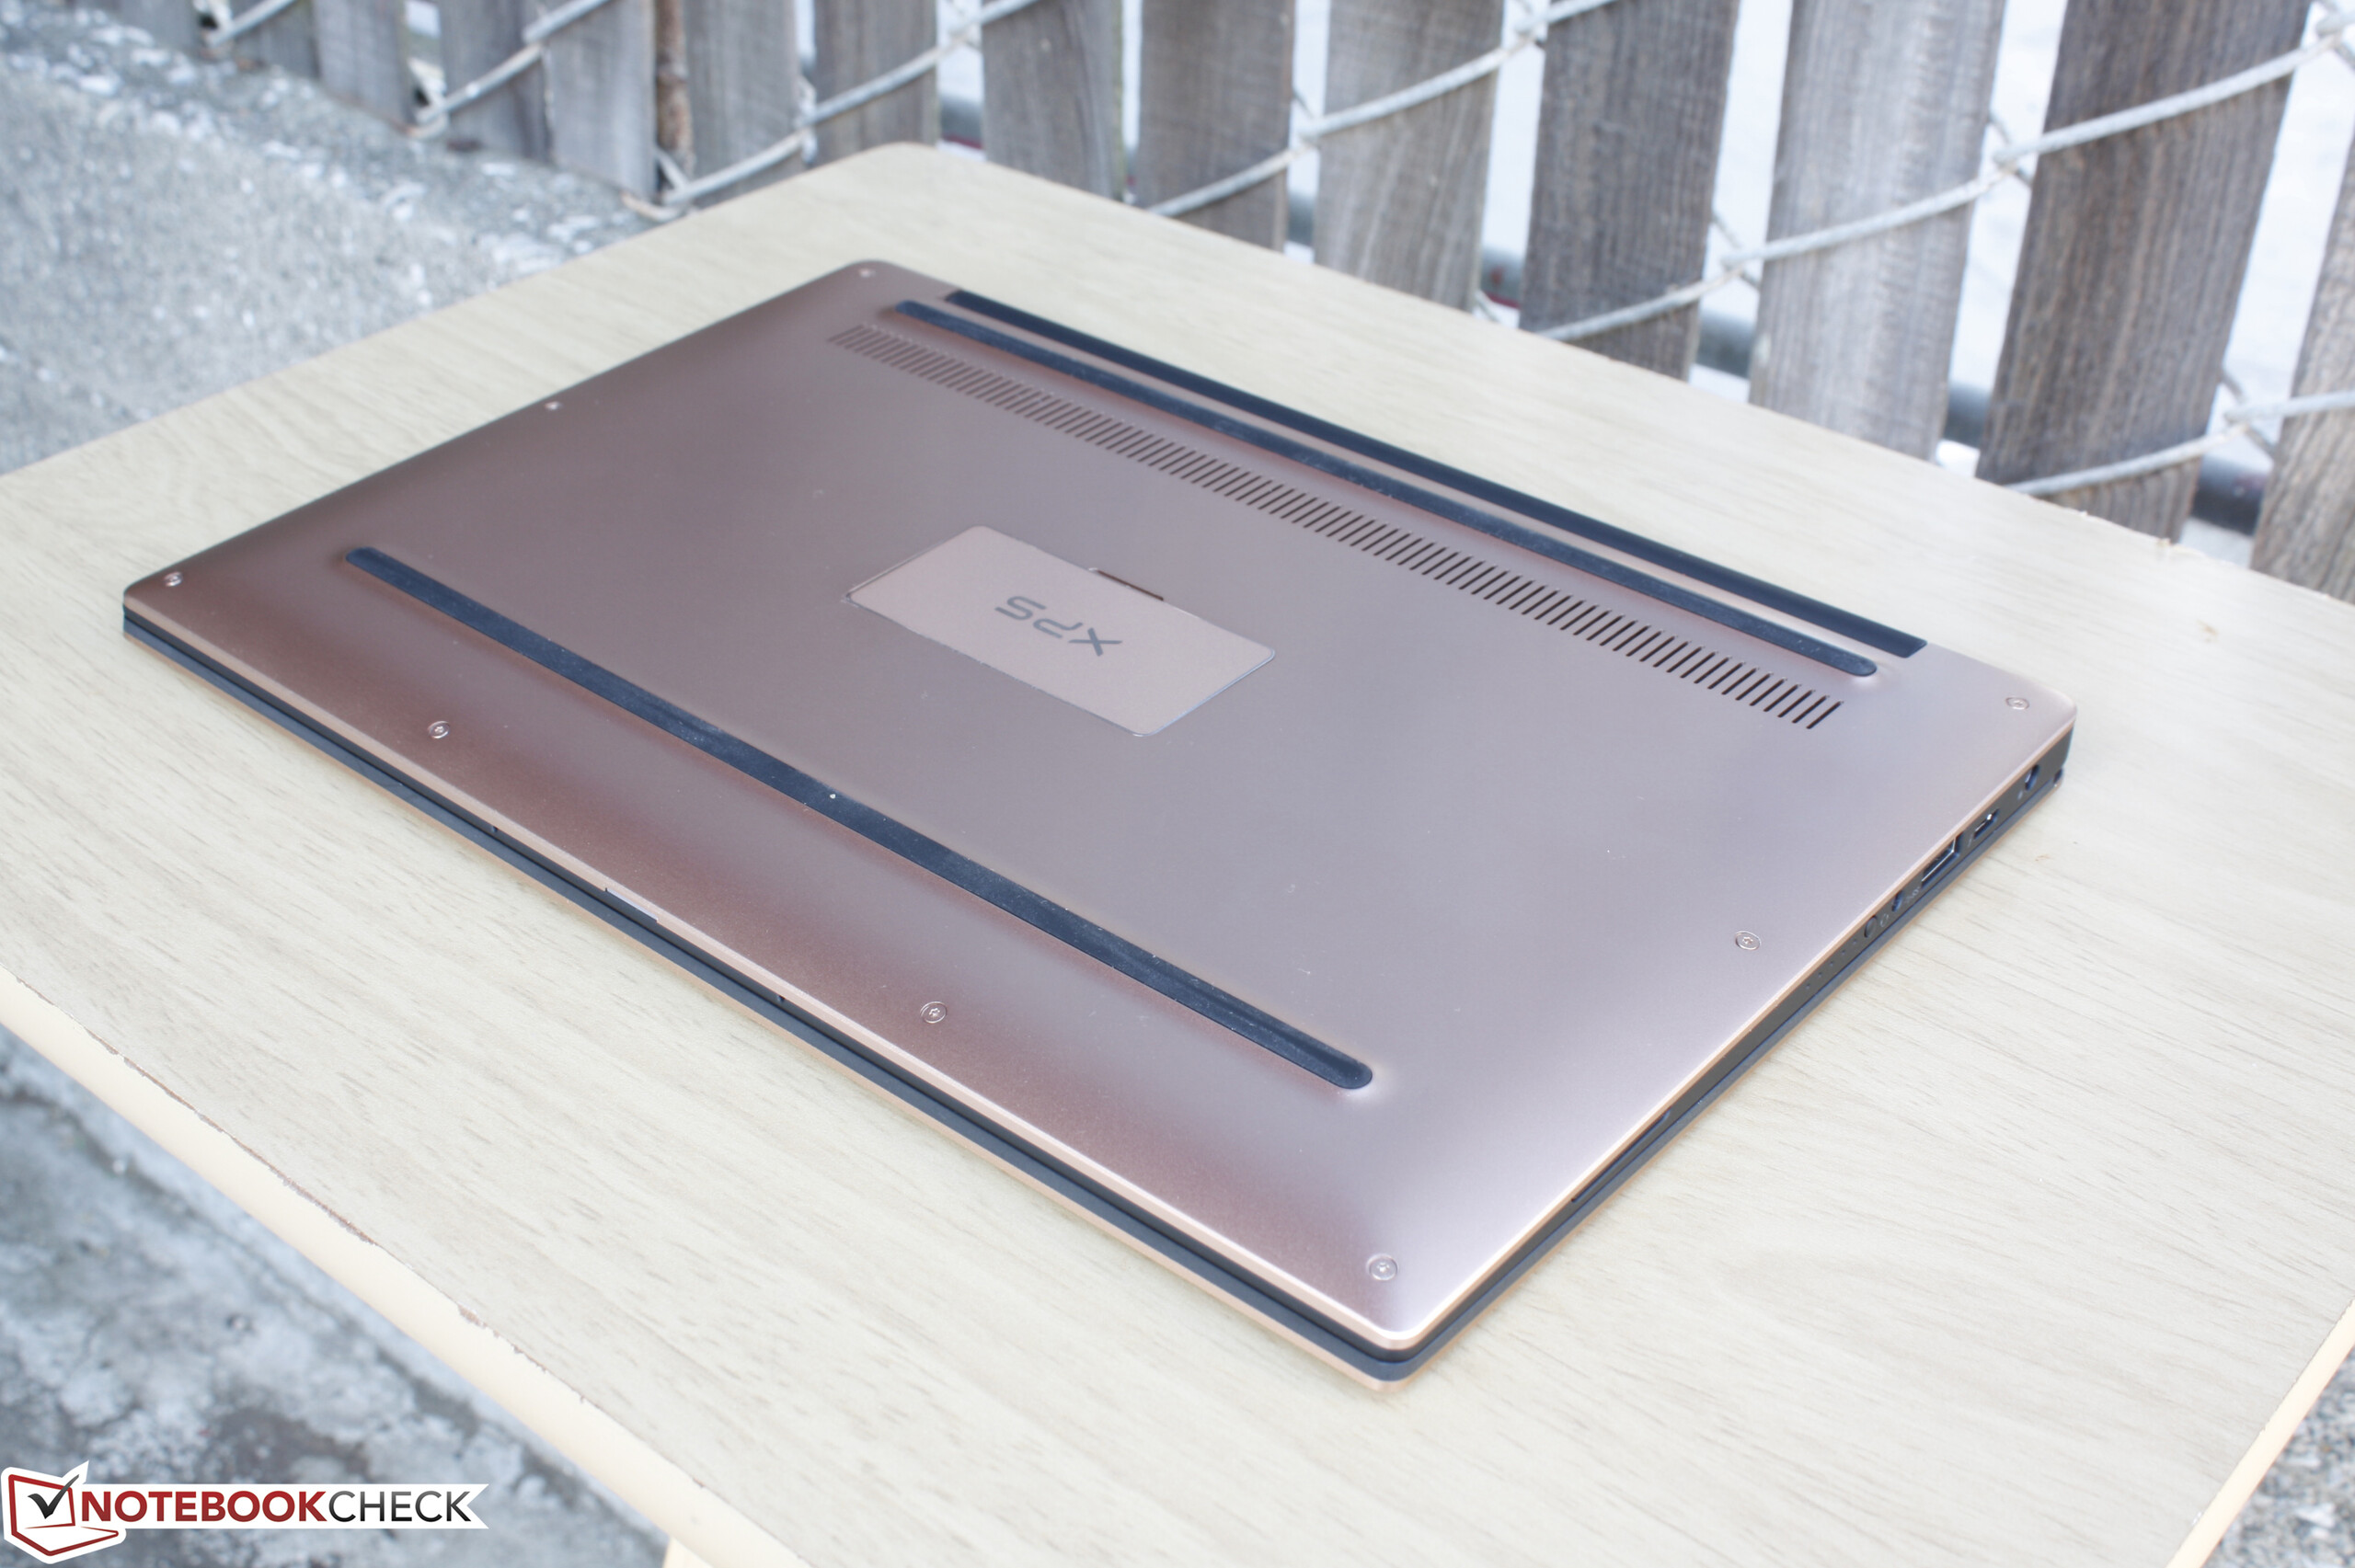
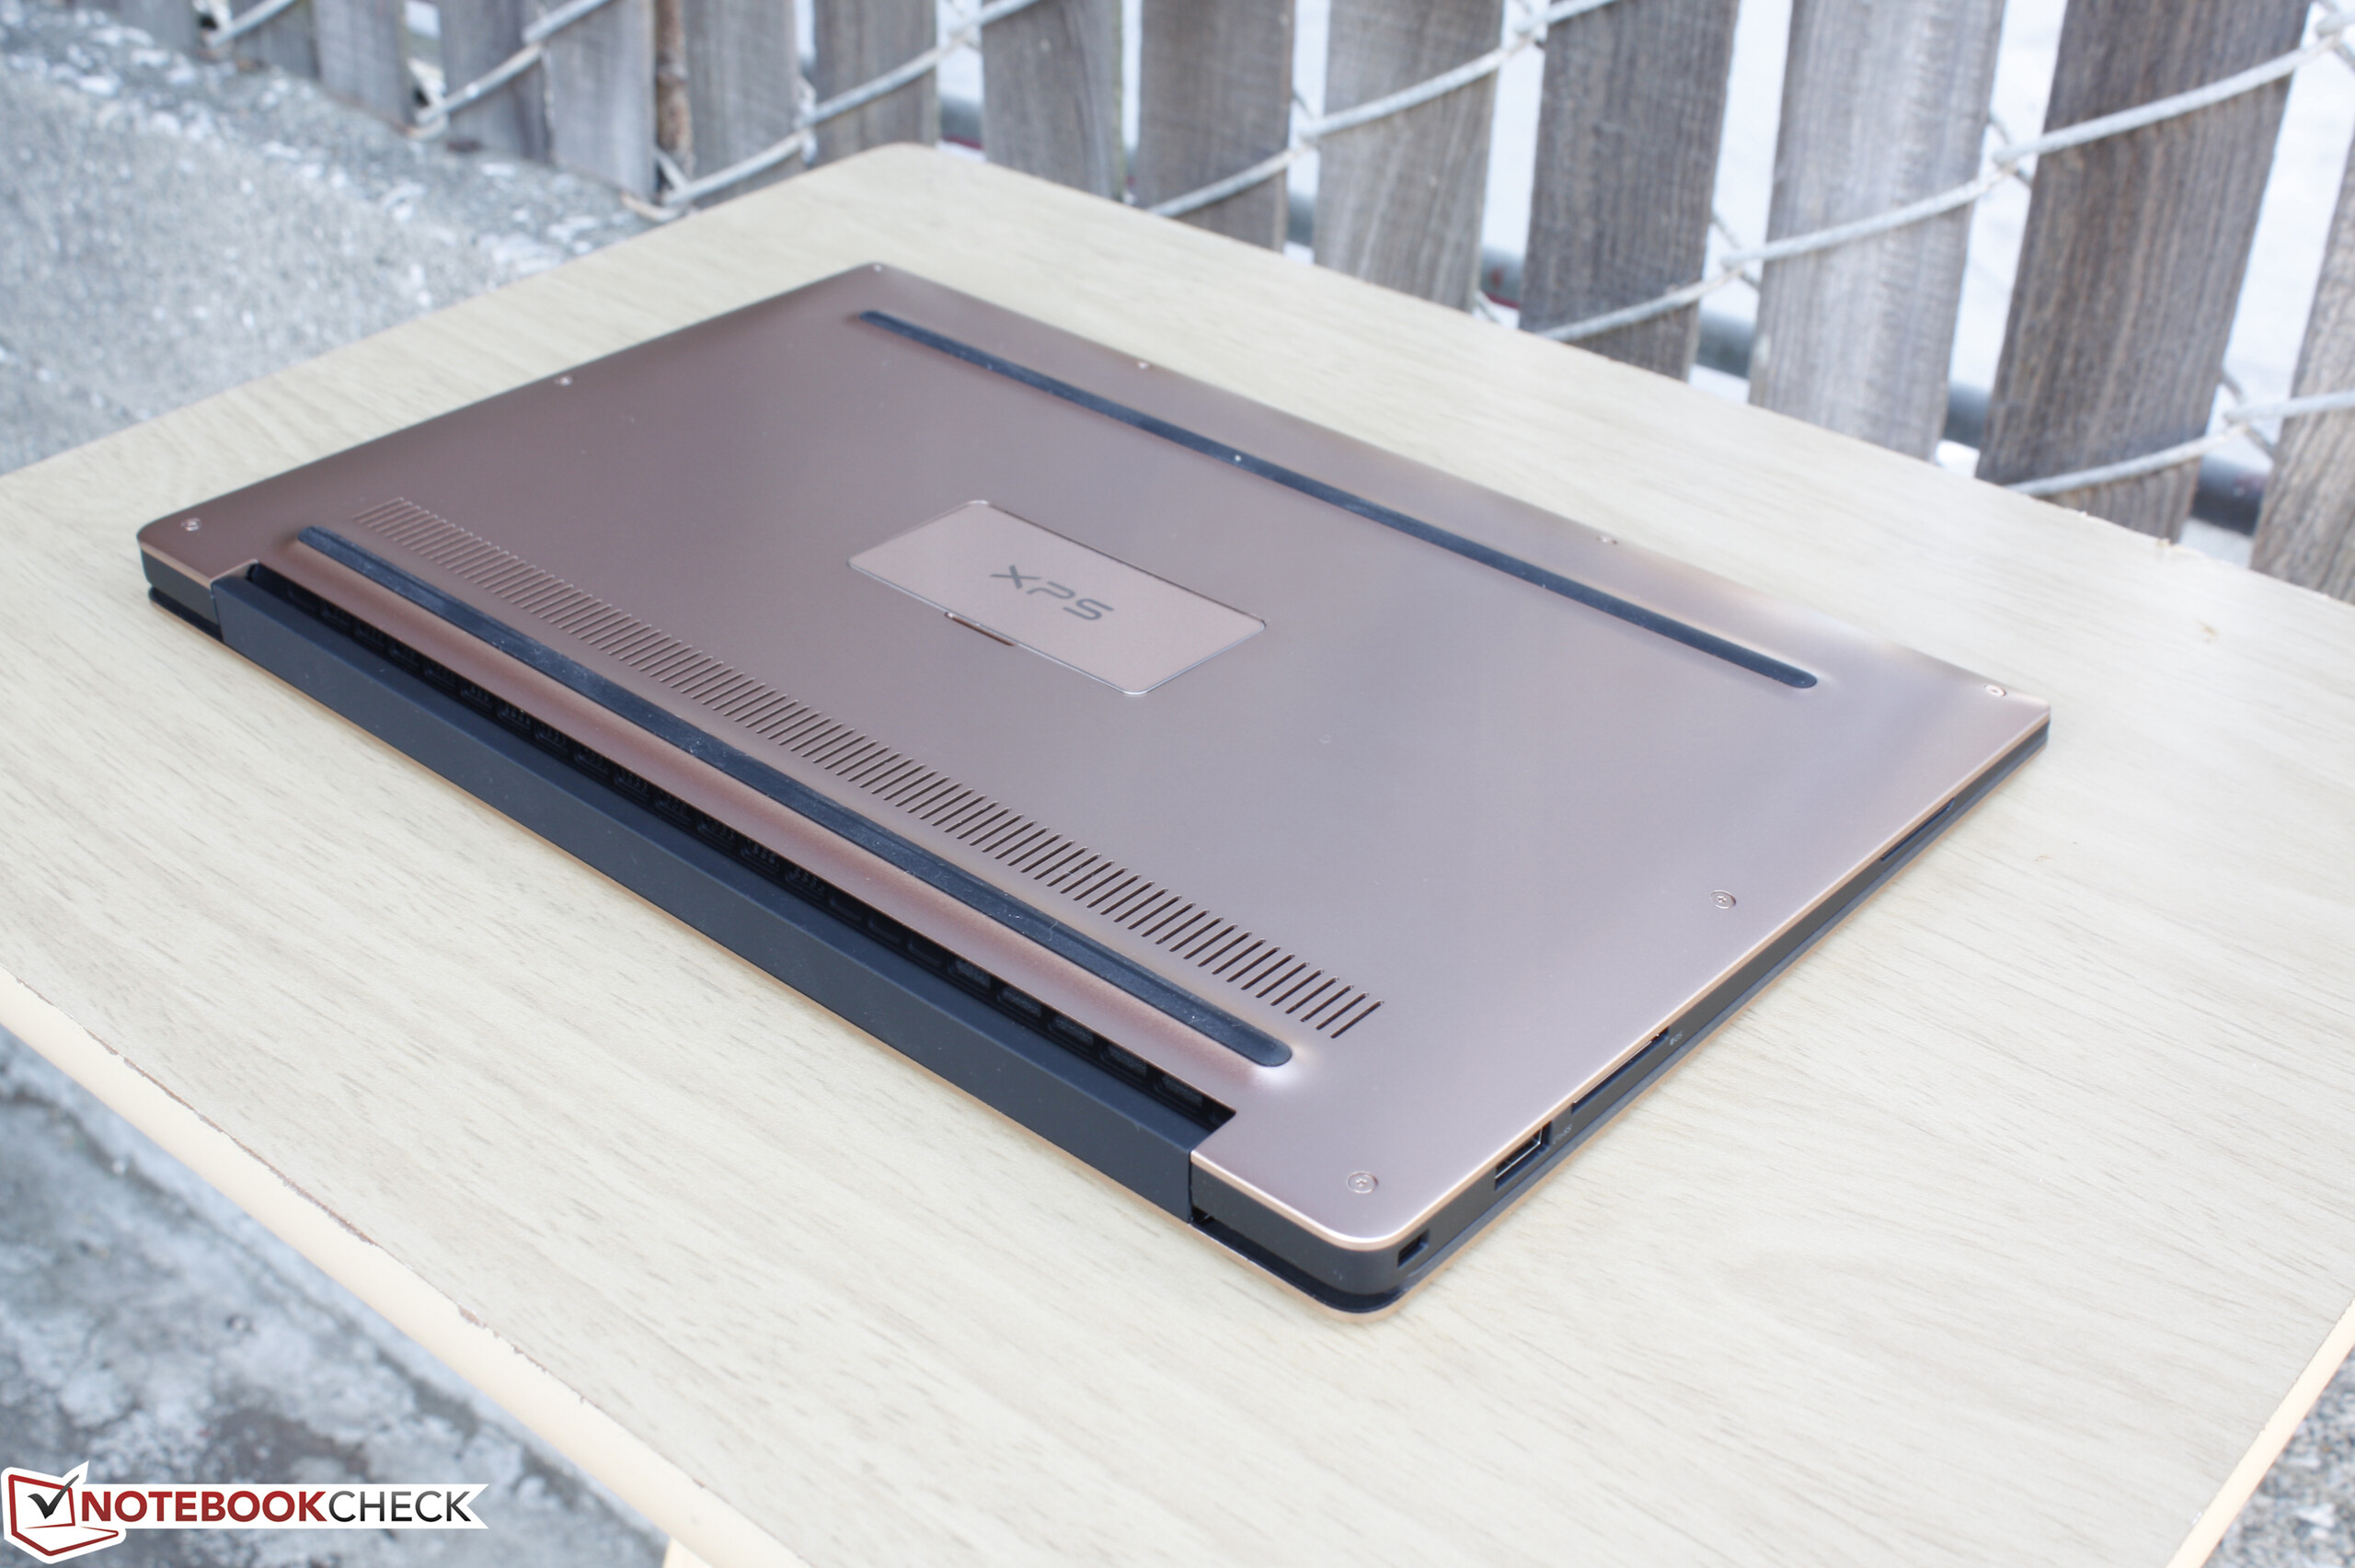
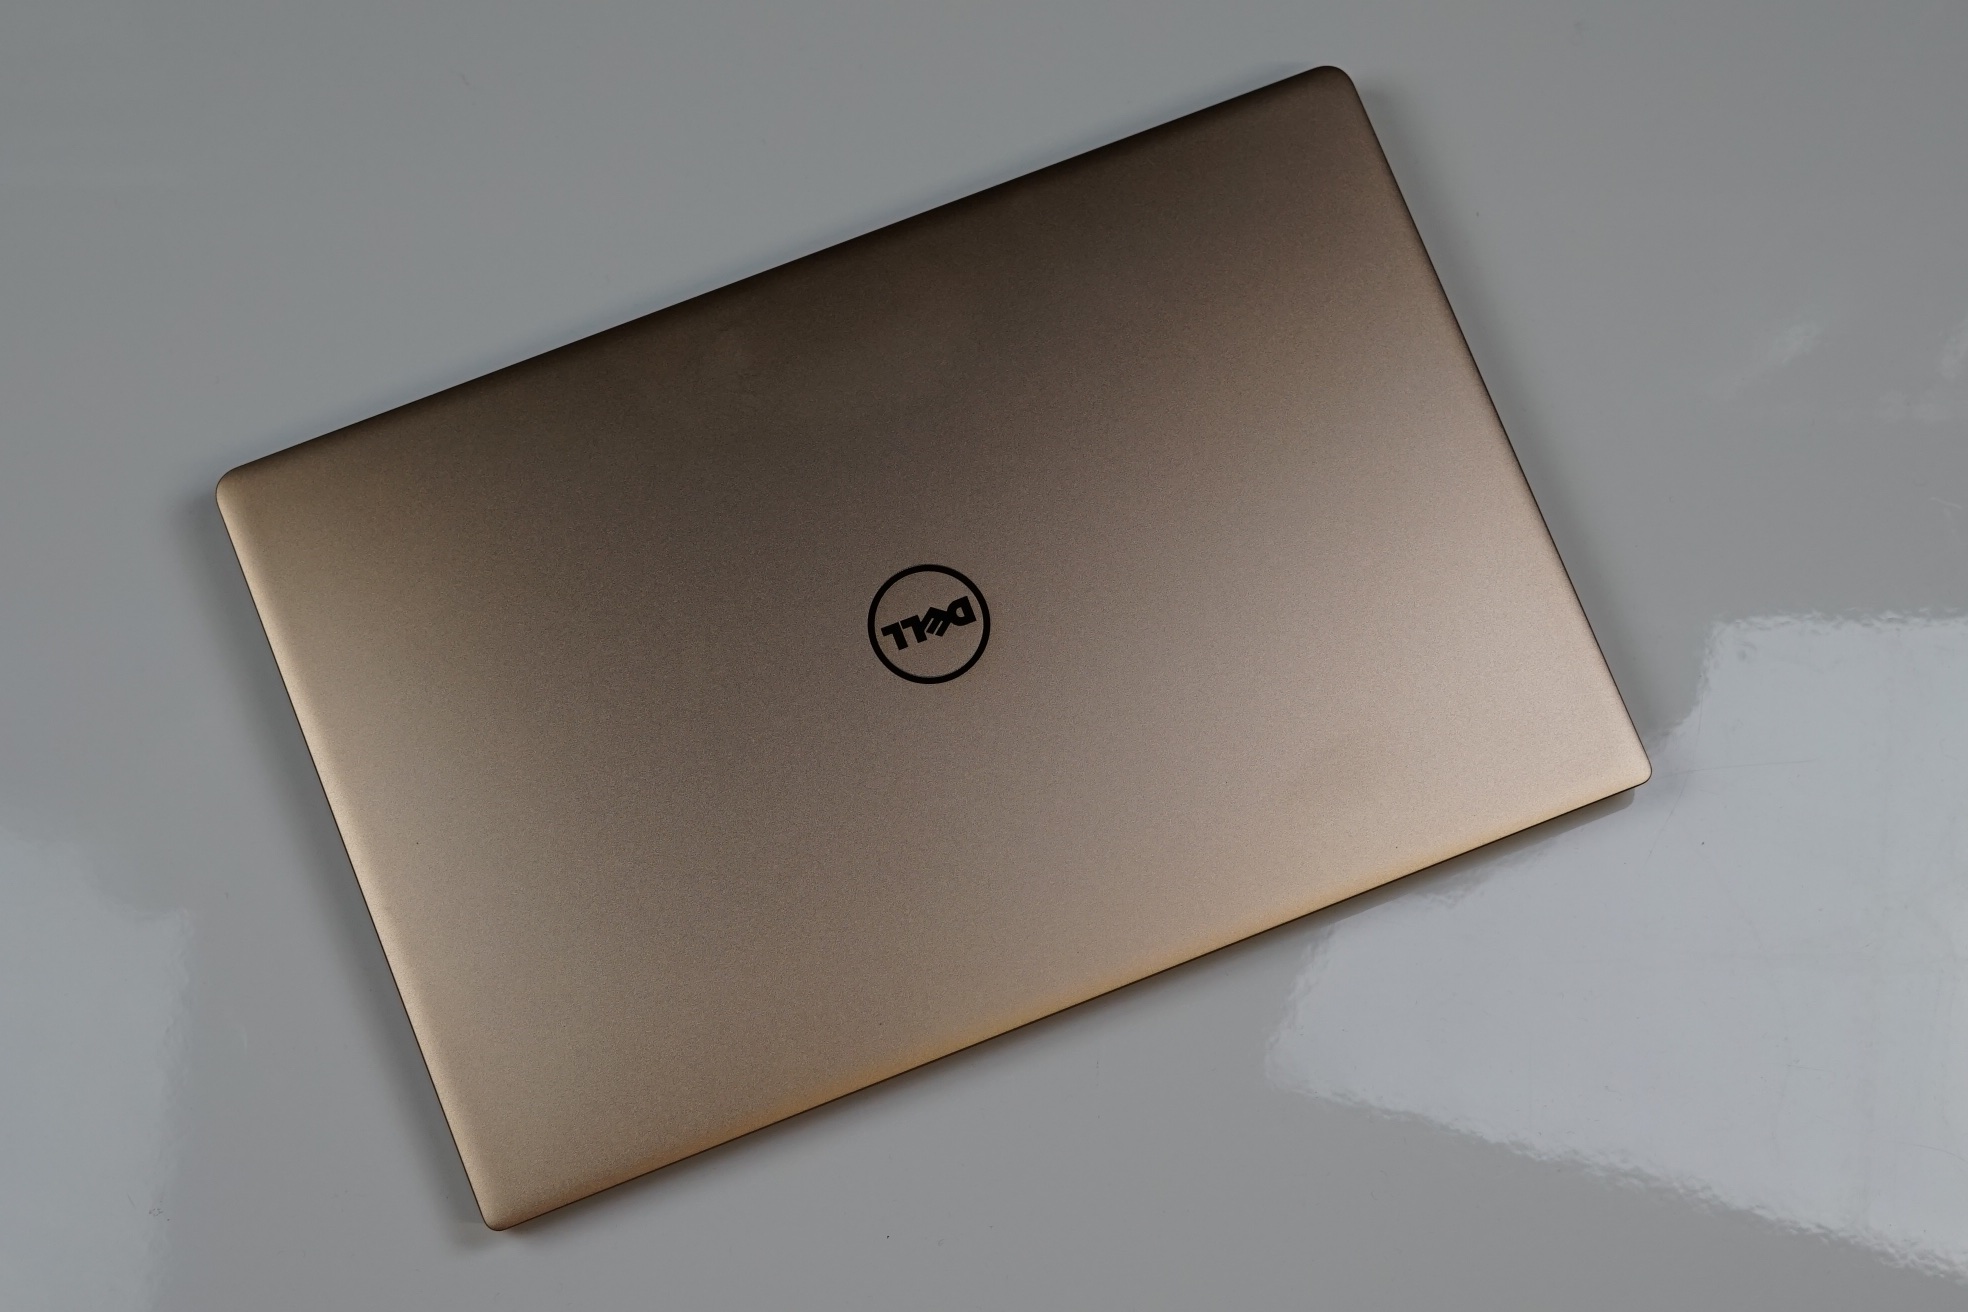
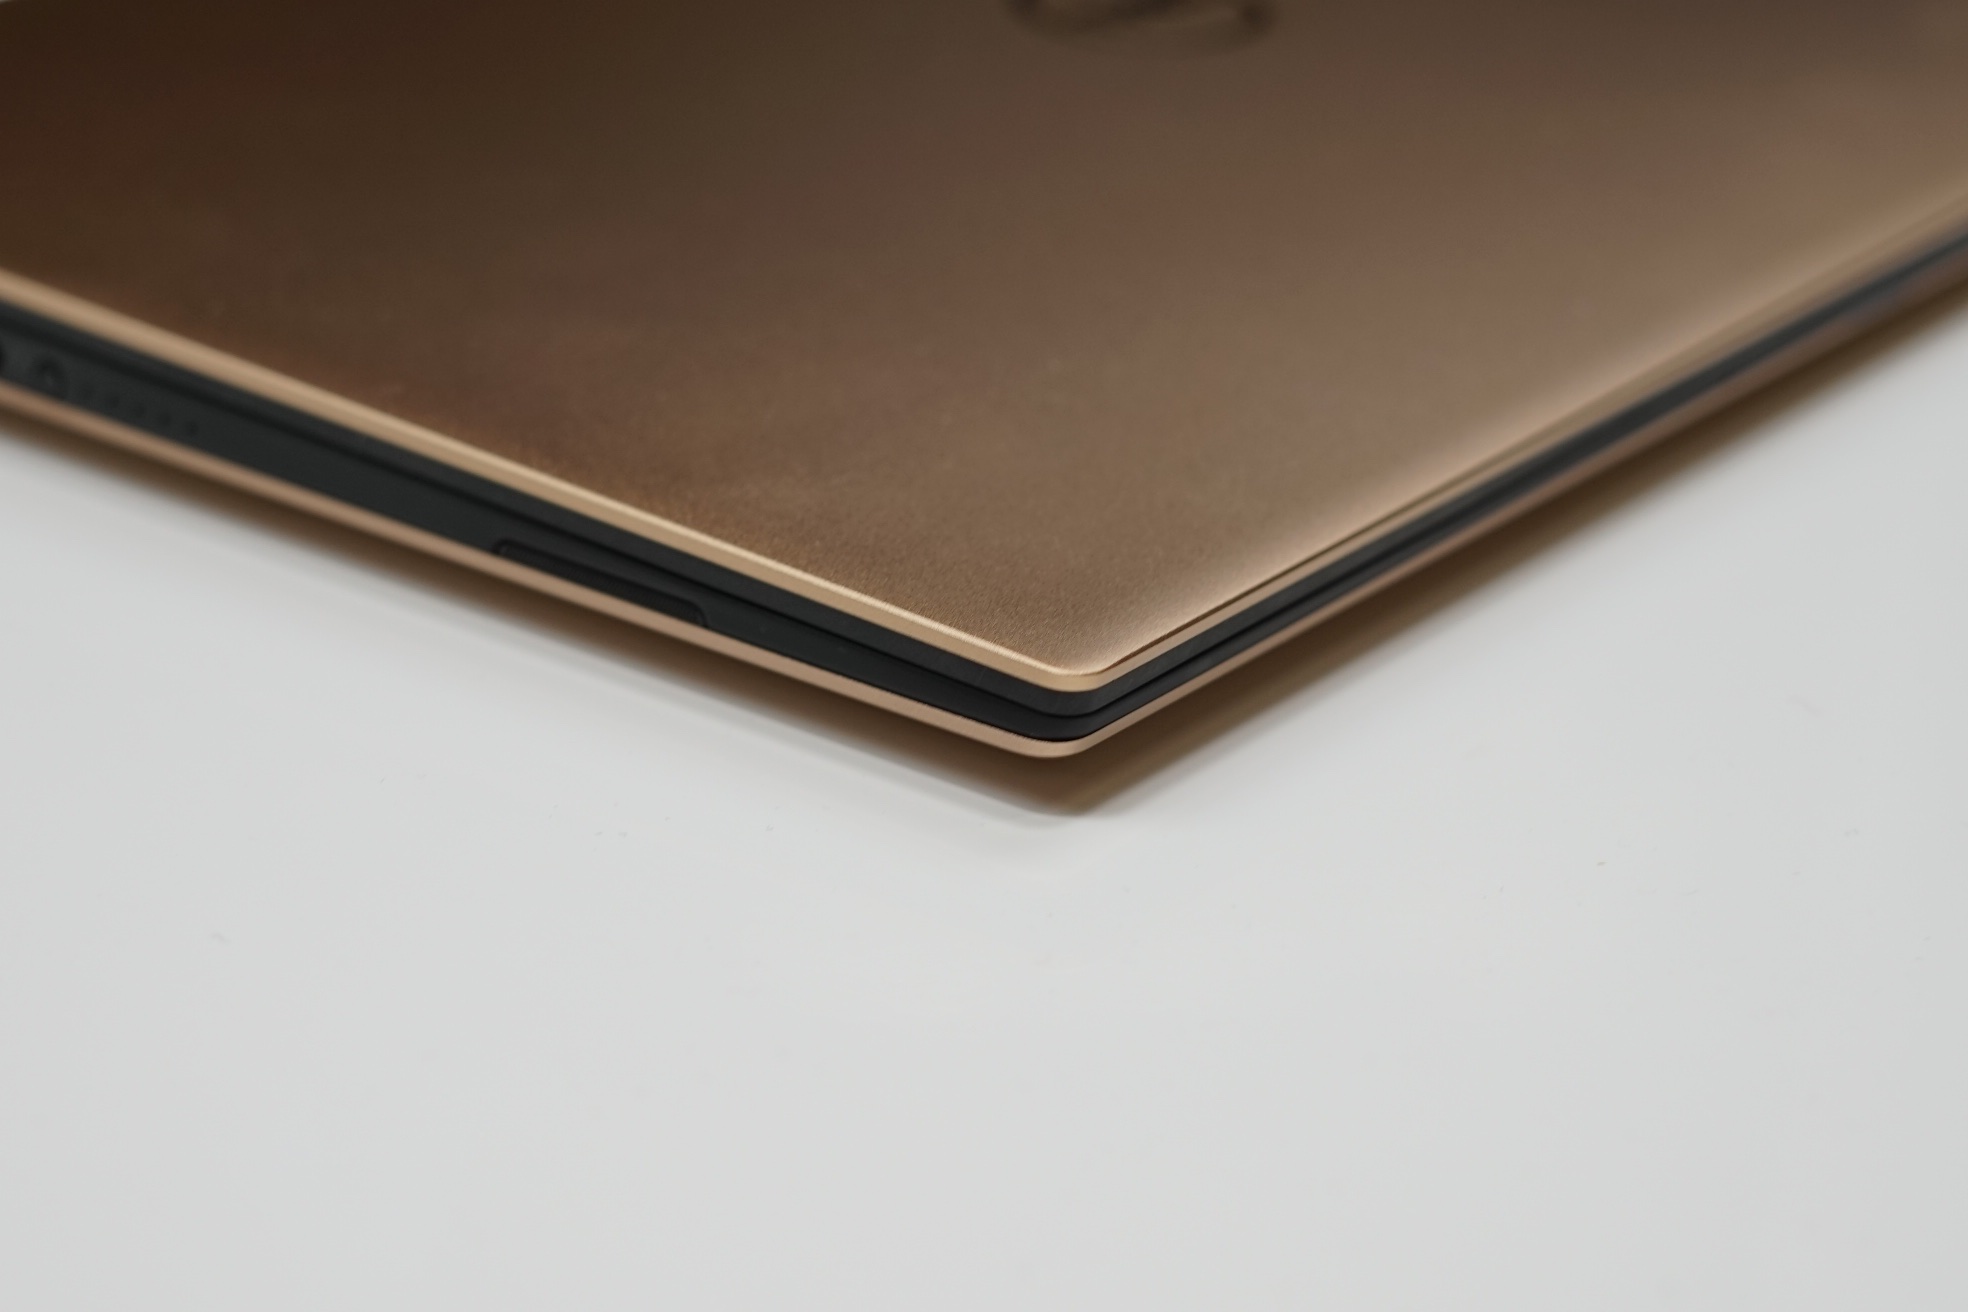
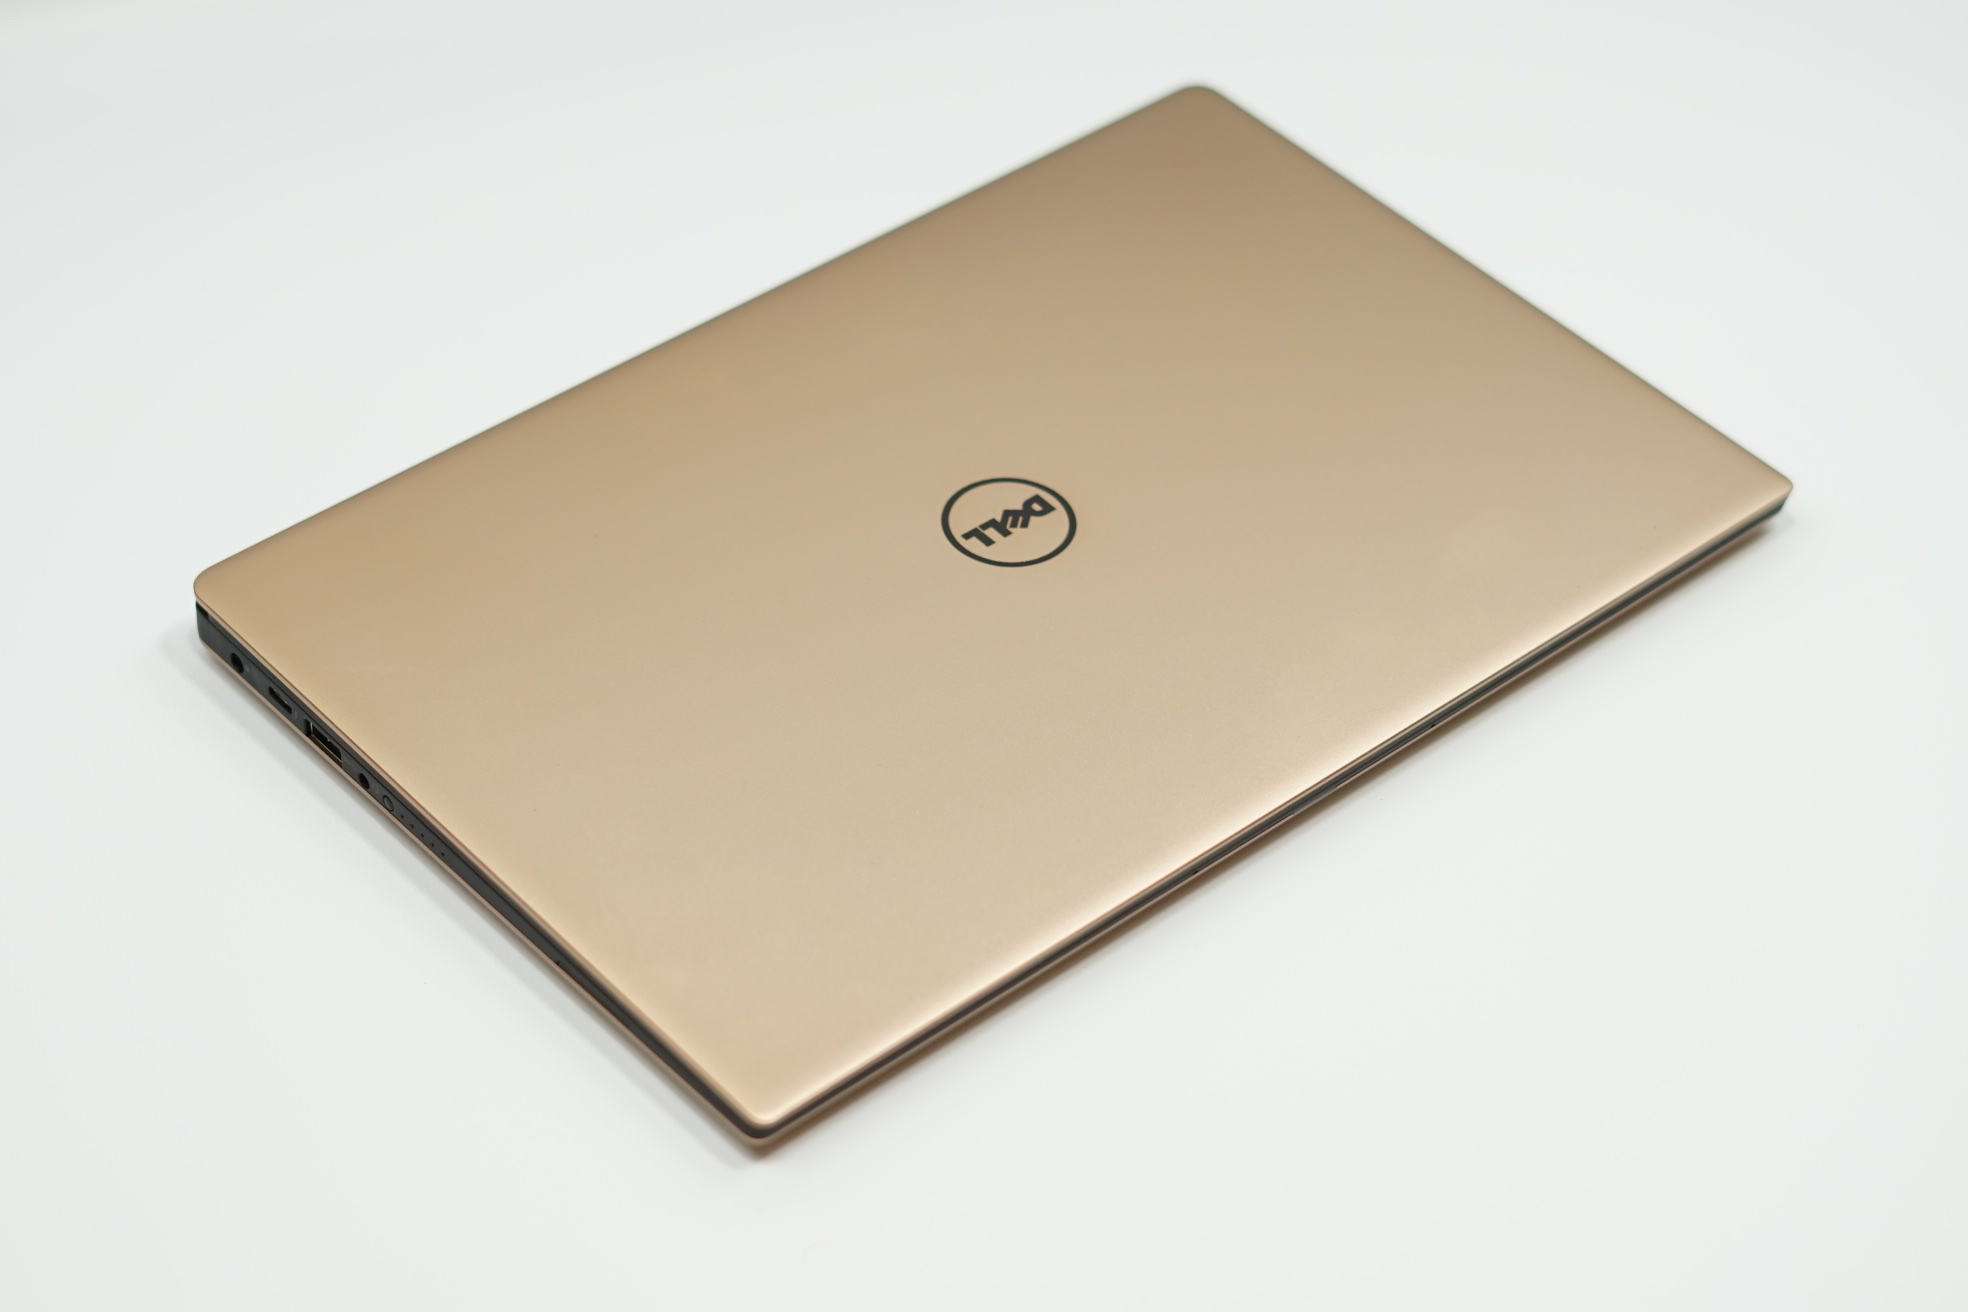
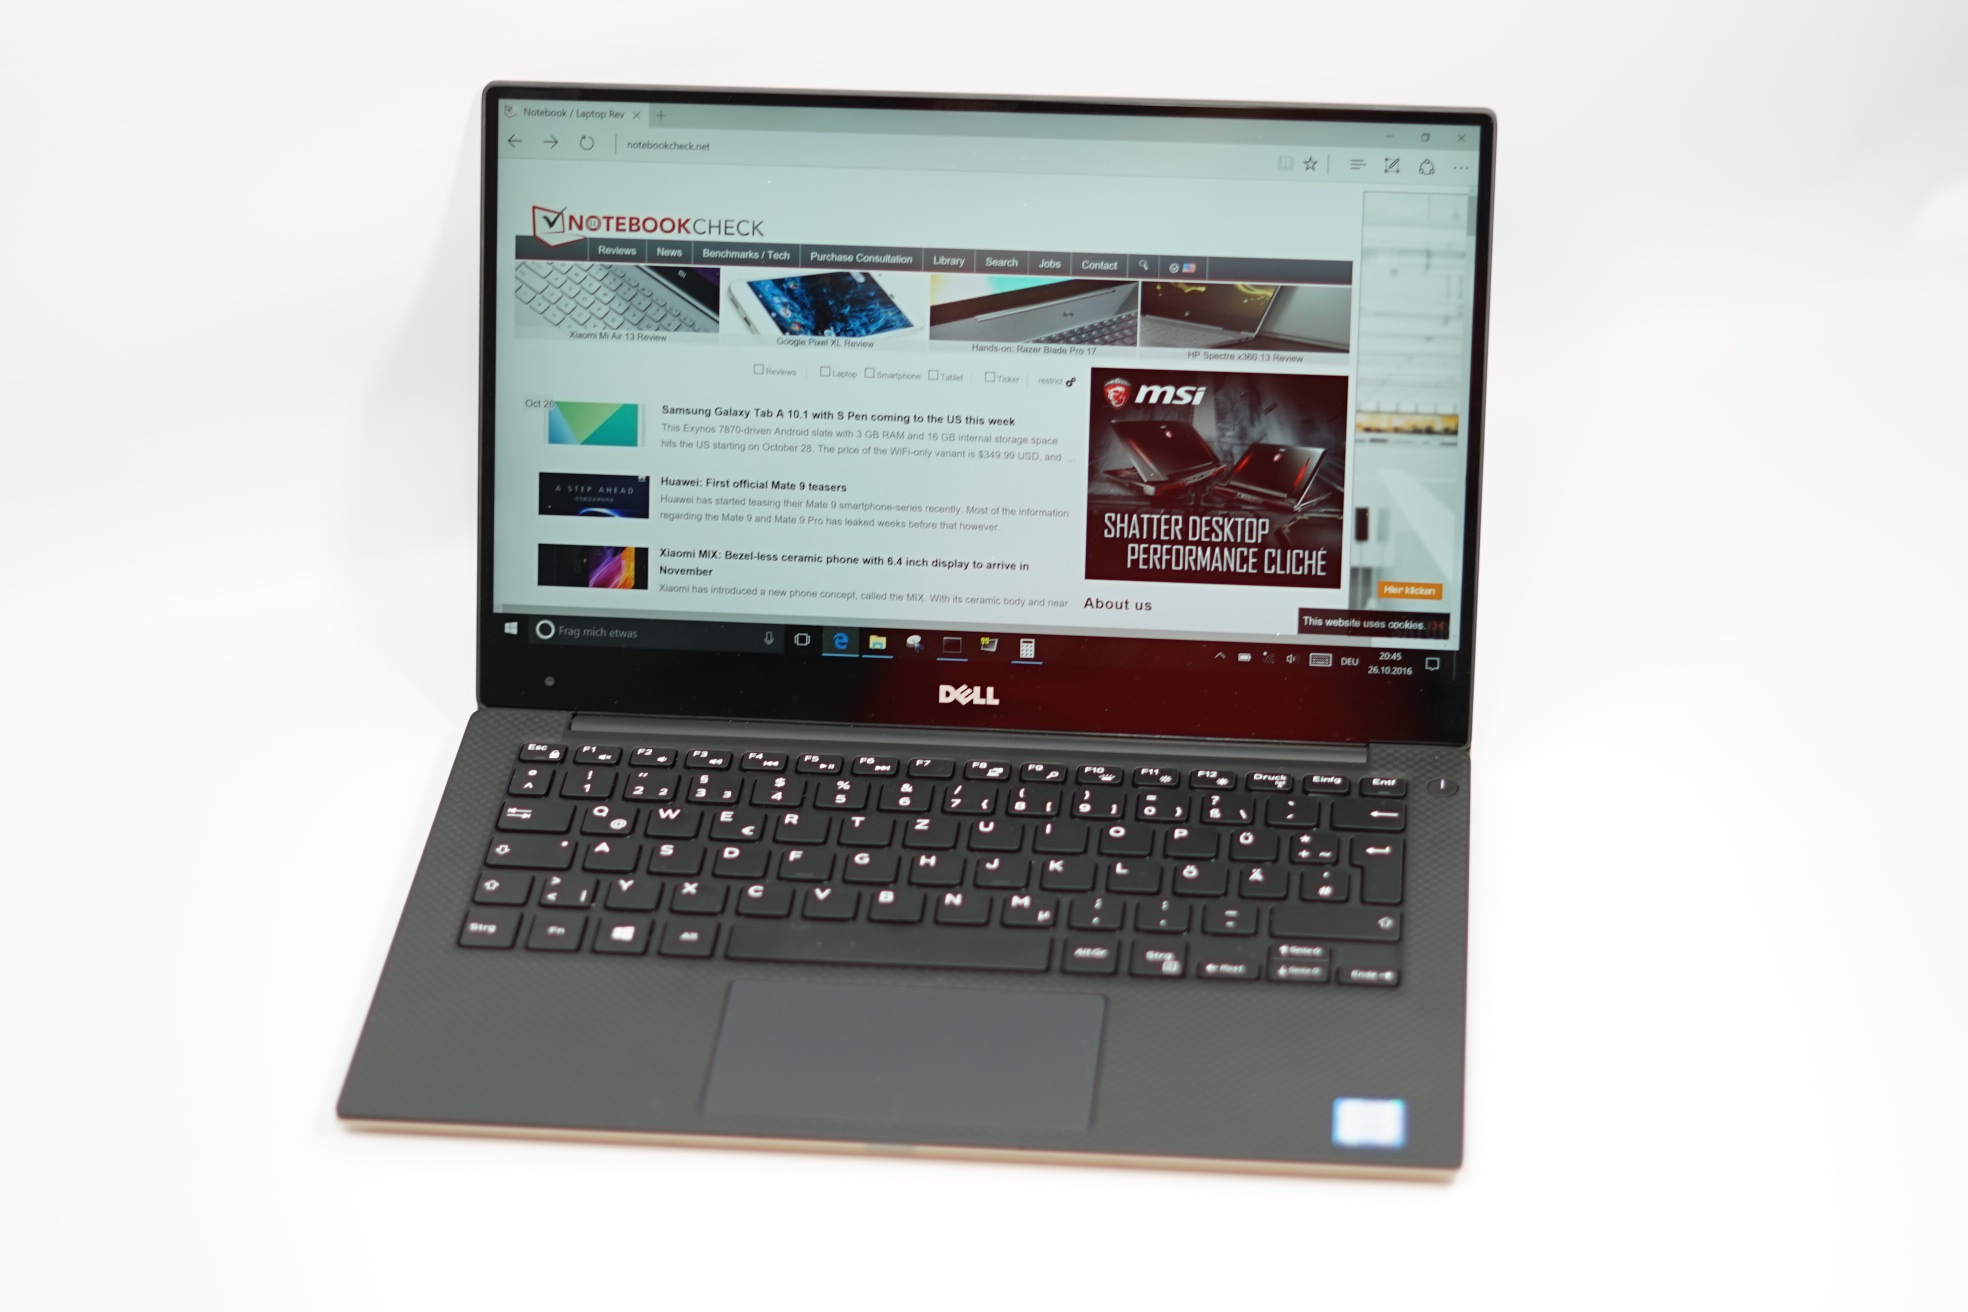
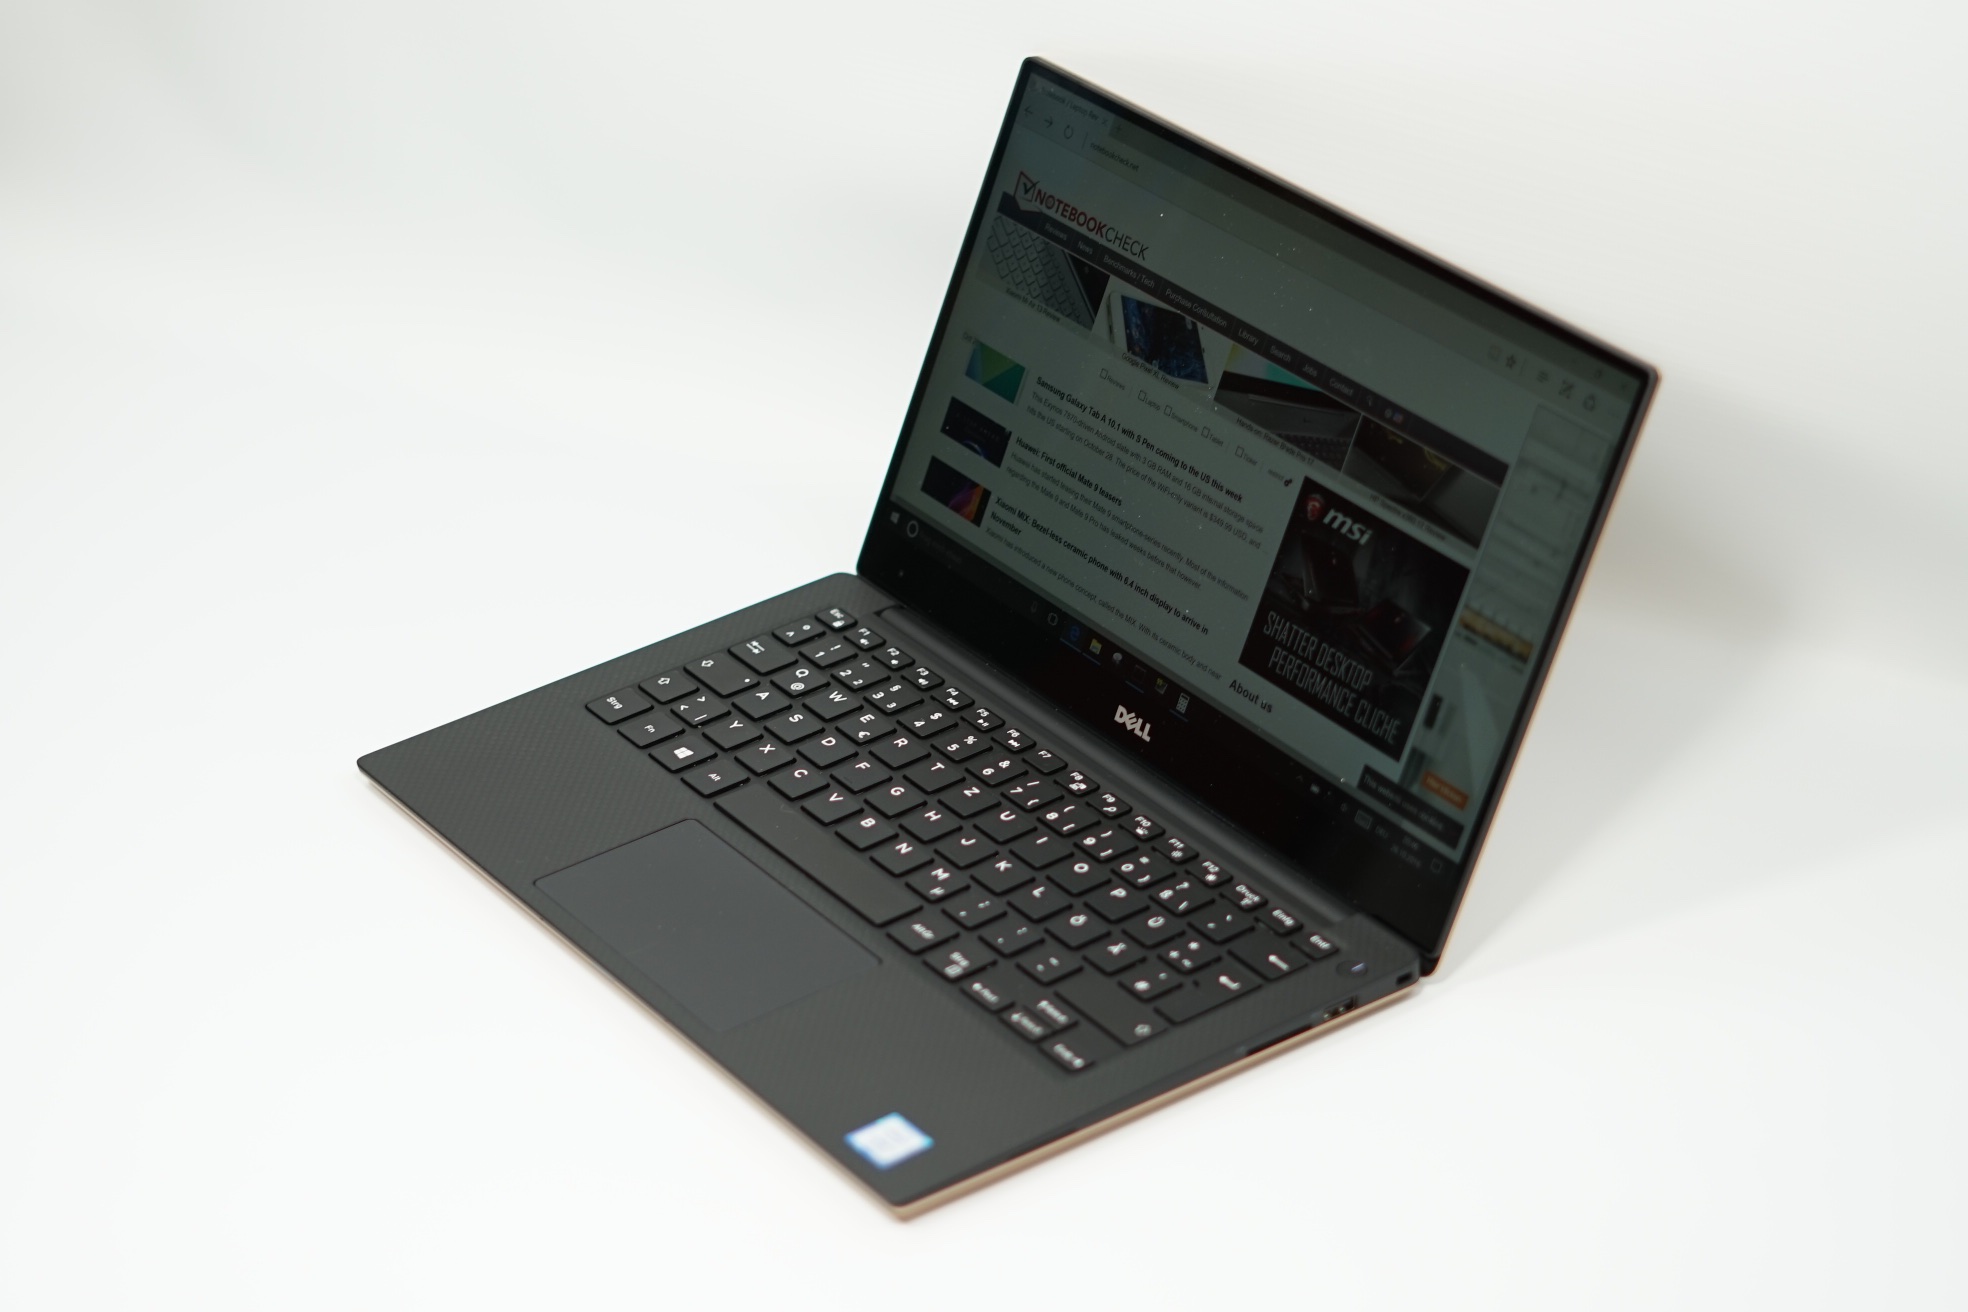
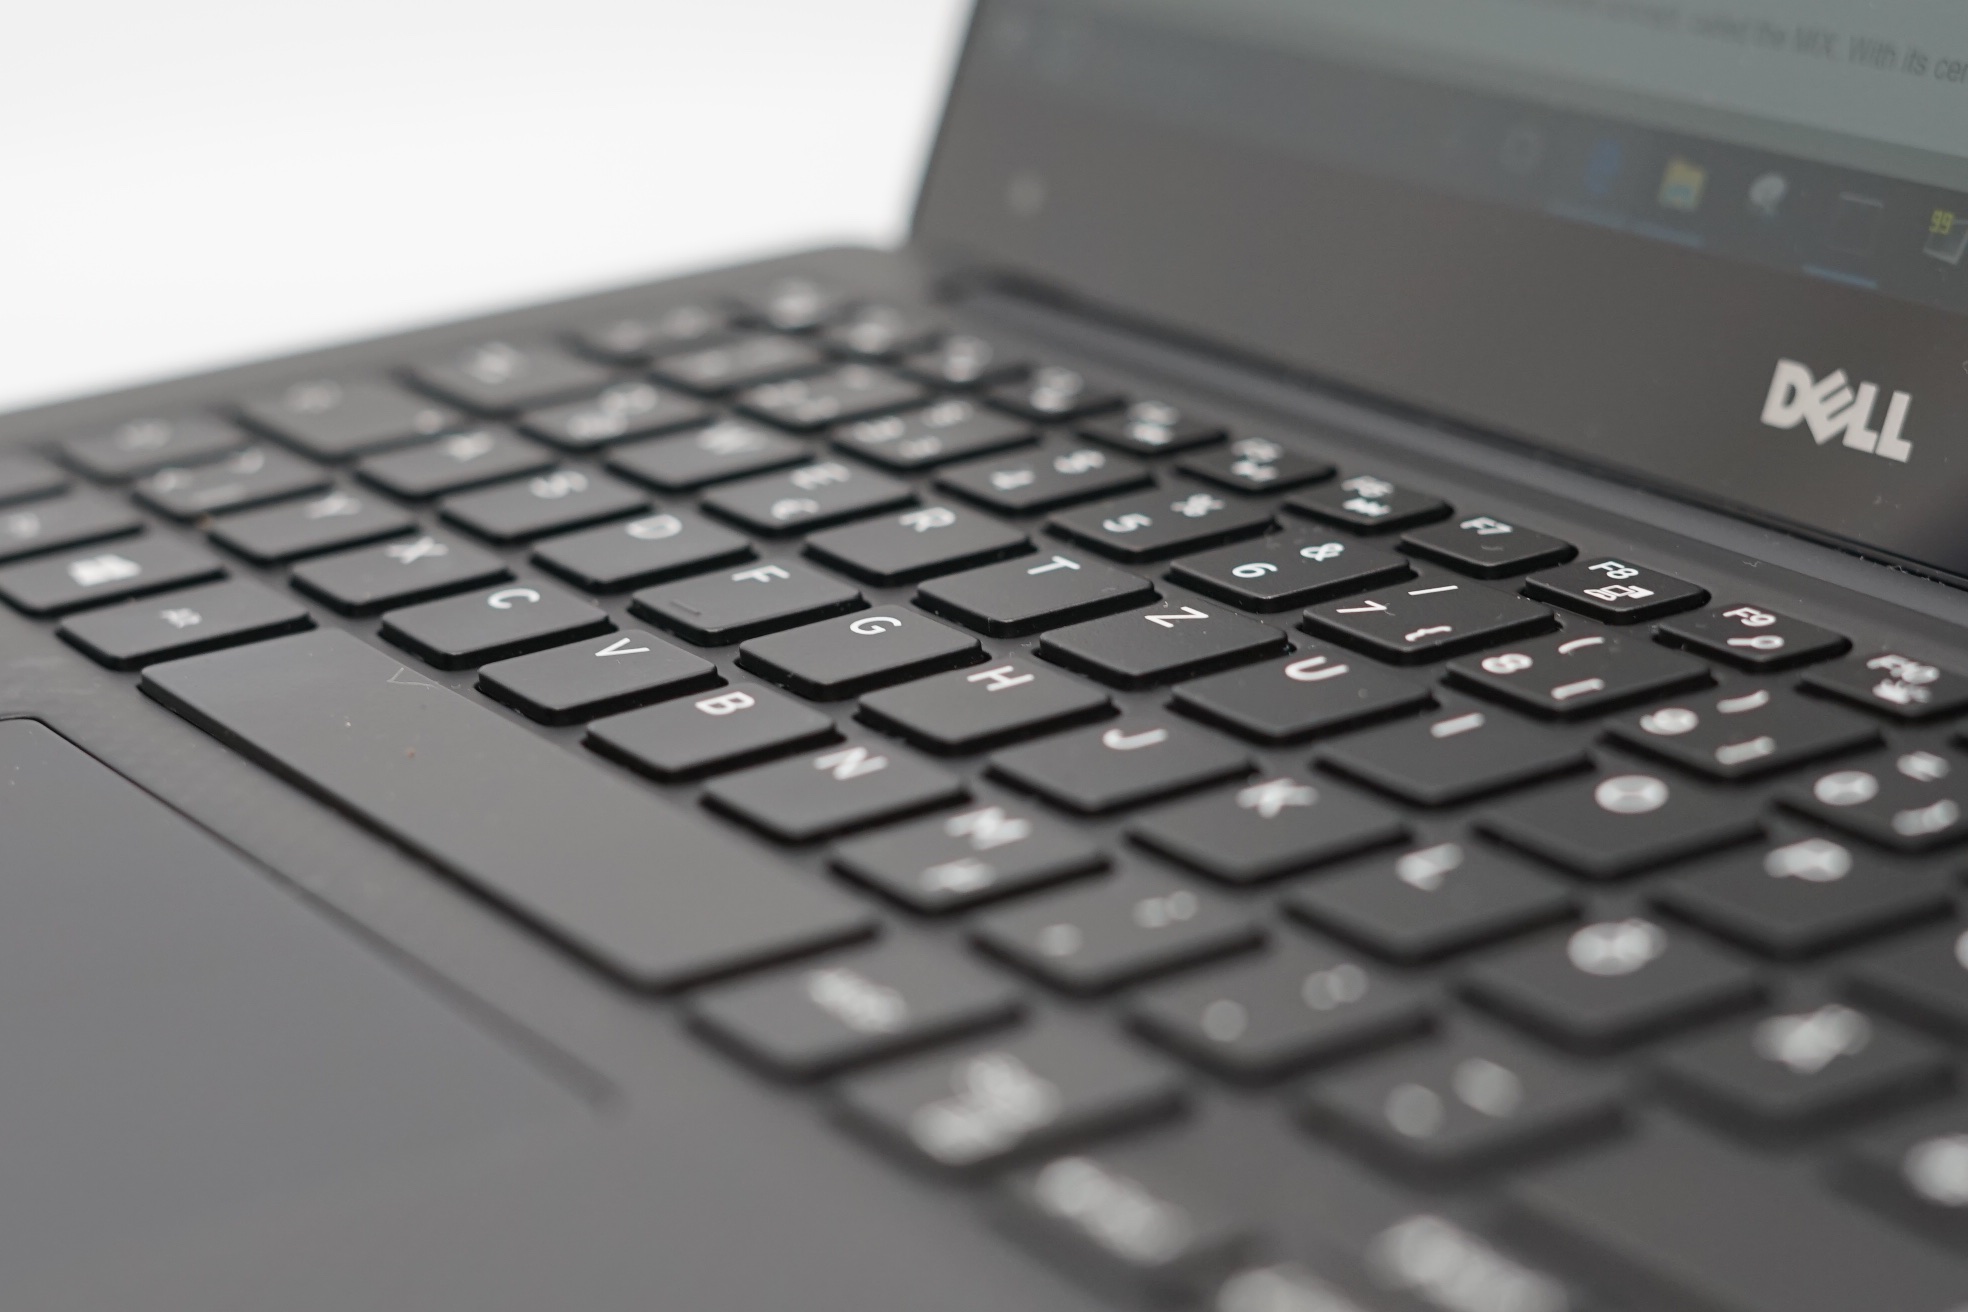
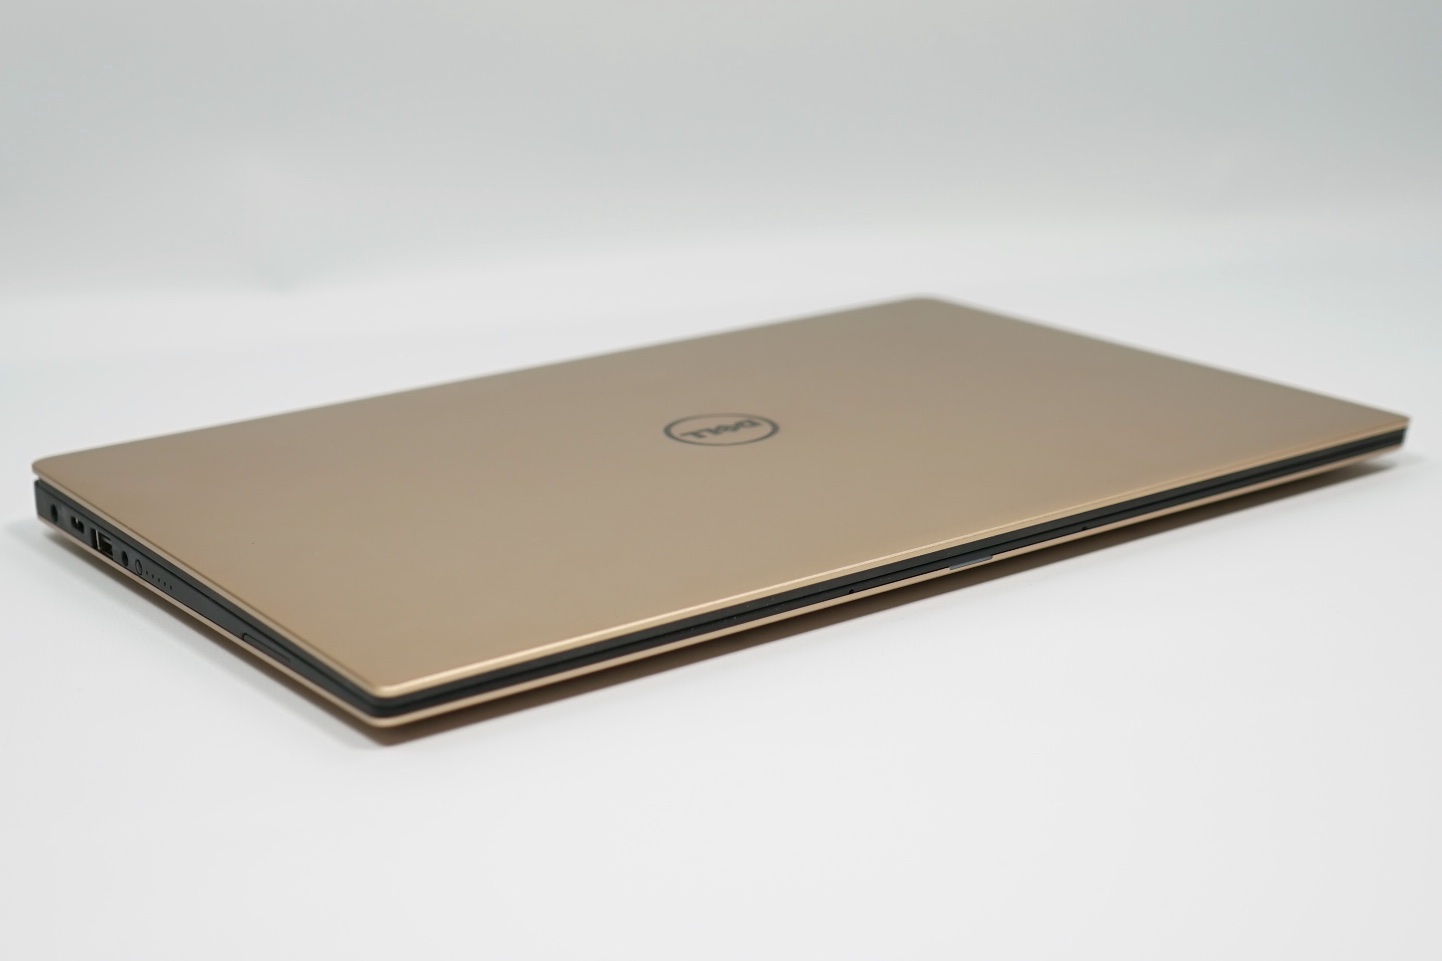
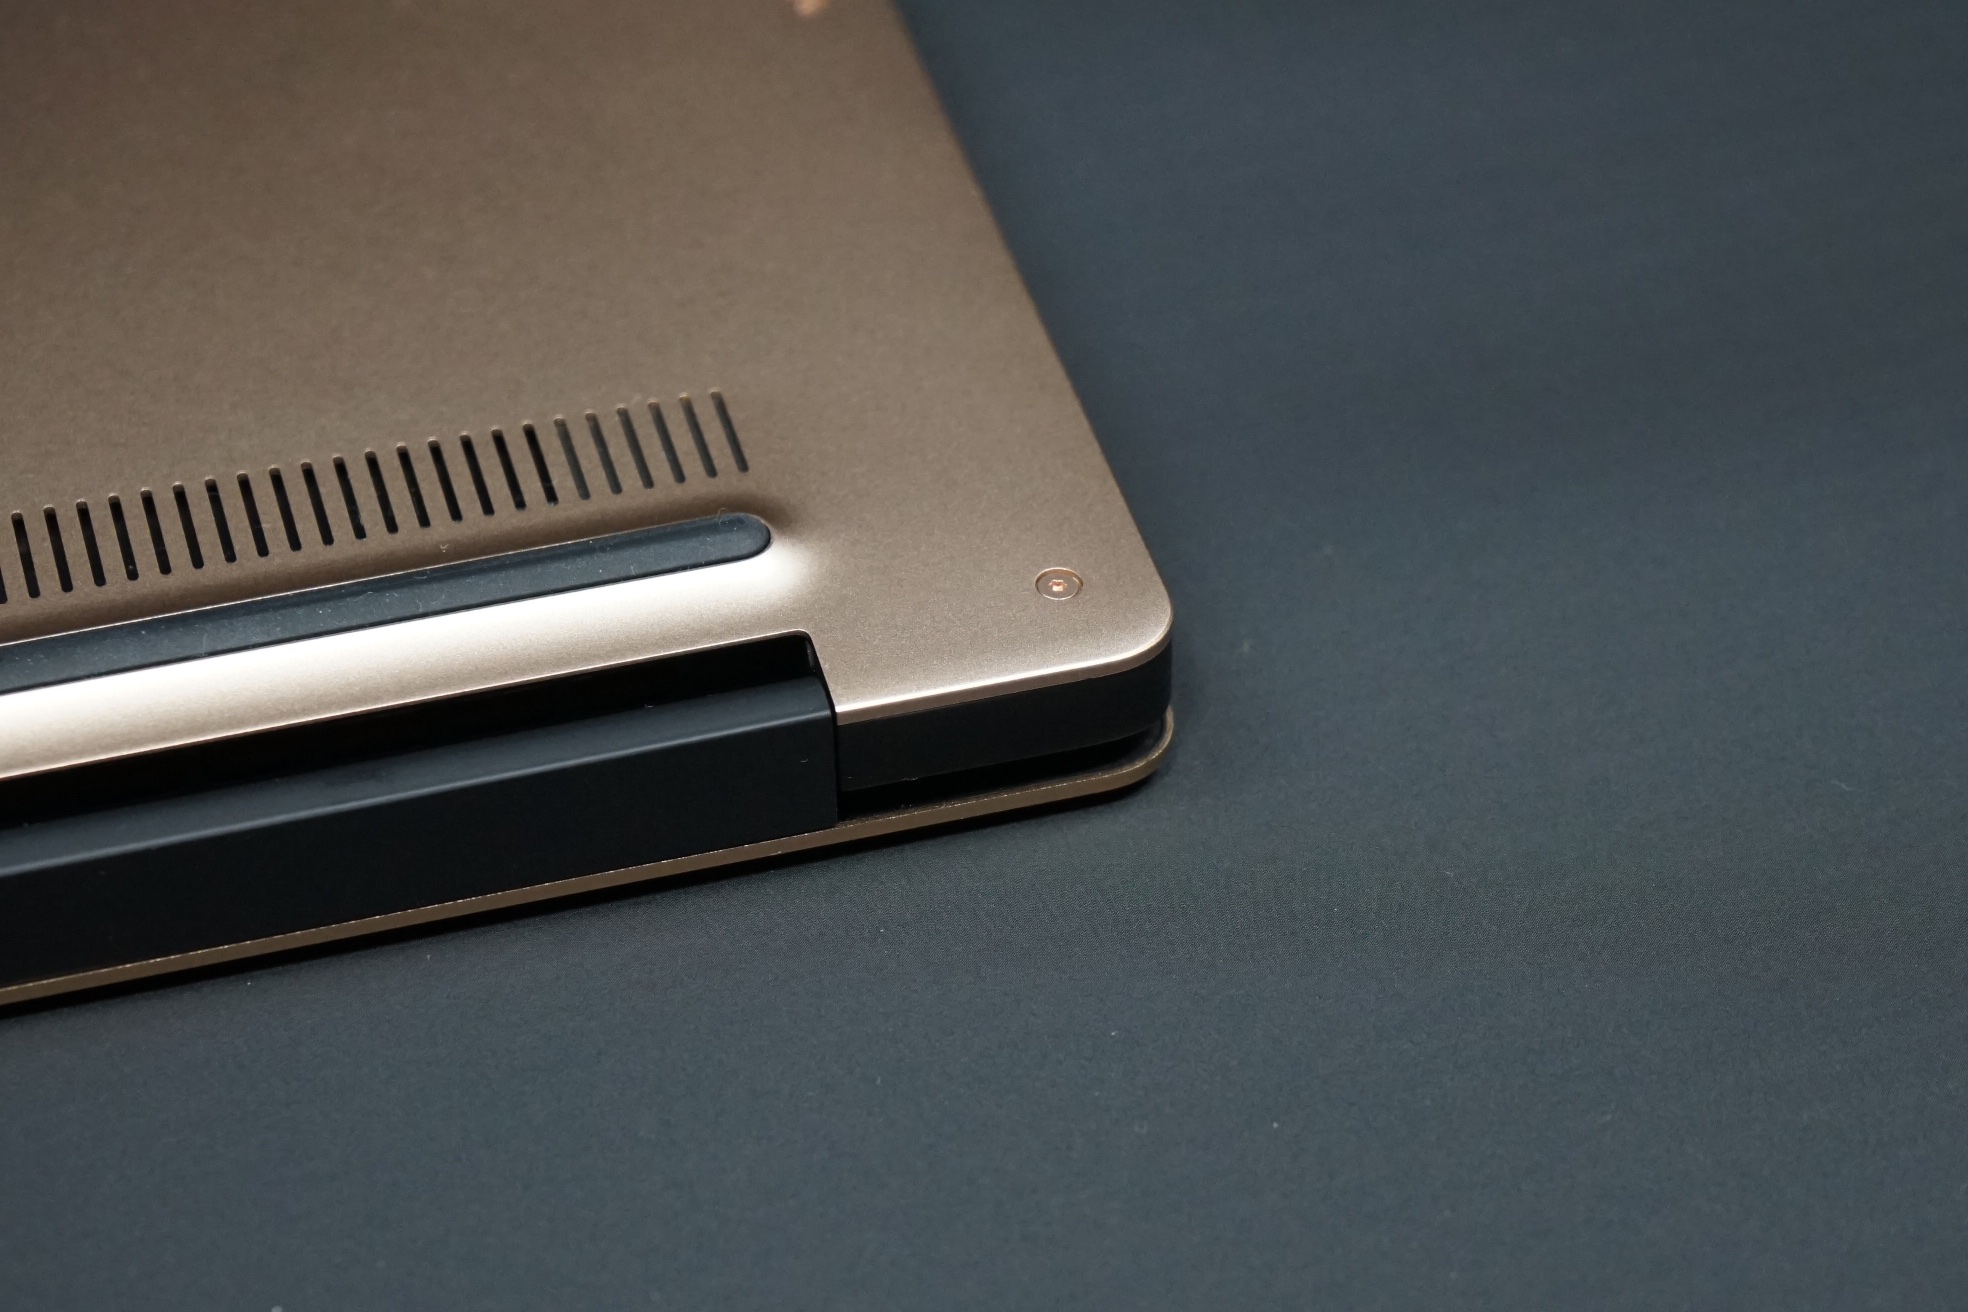
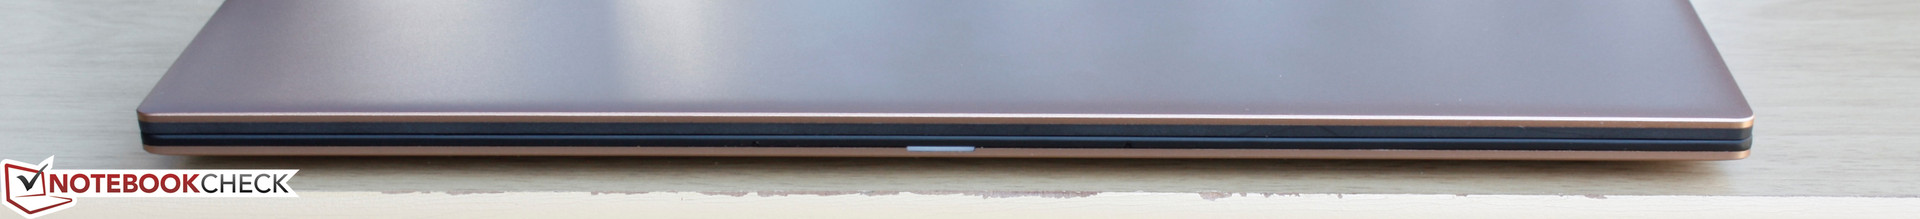
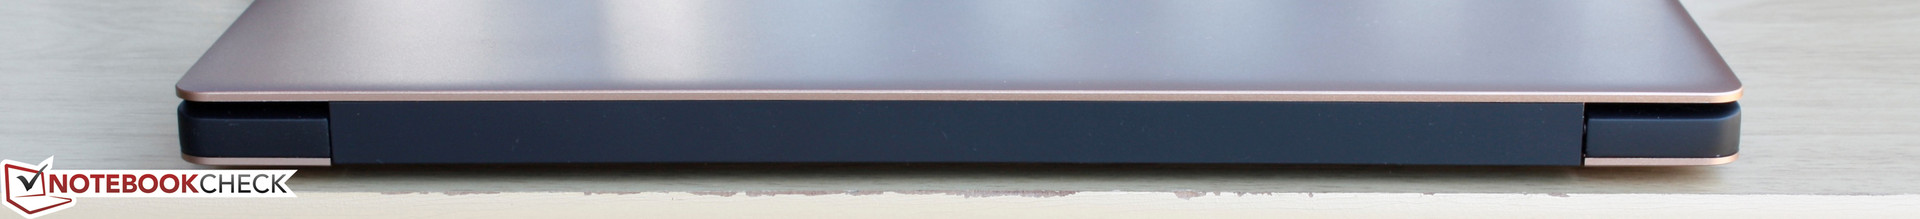
L'XPS 13 è ancora uno dei migliori Ultrabook da 13" tradizionali disponibile con le sue cerniere a 360 gradi o displays sganciabile non importa. Le sue dimensioni ridotte e la qualità del design non possono essere sottovalutate e la sua base supersottile sono già presenti su concorrenti come il recente Yoga 910. Non è cambiato molto per l'XPS 13, ma la serie resta molto competitiva.
Dovrete pagare qualcosa in più per il Kaby Lake XPS 13 e avrete prestazioni leggermente migliori e autonomia superiore. Per il resto, il precedente Skylake XPS 13 continua a dare prestazioni simili ad un prezzo inferiore.
Nota: si tratta di una recensione breve, con alcune sezioni non tradotte, per la versione integrale in inglese guardate qui.
Dell XPS 13 9360 QHD+ i7
- 11/22/2016 v5.1 (old)
Allen Ngo, Klaus Hinum
Price comparison
