Recensione Breve del subnotebook Asus X302UV-FN016T
| |||||||||||||||||||||||||
Distribuzione della luminosità: 88 %
Al centro con la batteria: 218 cd/m²
Contrasto: 436:1 (Nero: 0.5 cd/m²)
ΔE ColorChecker Calman: 3.89 | ∀{0.5-29.43 Ø4.71}
ΔE Greyscale Calman: 4.9 | ∀{0.09-98 Ø4.96}
73% sRGB (Argyll 1.6.3 3D)
46% AdobeRGB 1998 (Argyll 1.6.3 3D)
49.98% AdobeRGB 1998 (Argyll 3D)
72.6% sRGB (Argyll 3D)
48.37% Display P3 (Argyll 3D)
Gamma: 2.41
CCT: 7860 K
Sfarfallio dello schermo / PWM (Pulse-Width Modulation)
| flickering dello schermo / PWM rilevato | 50 Hz | ≤ 90 % settaggio luminosita' | 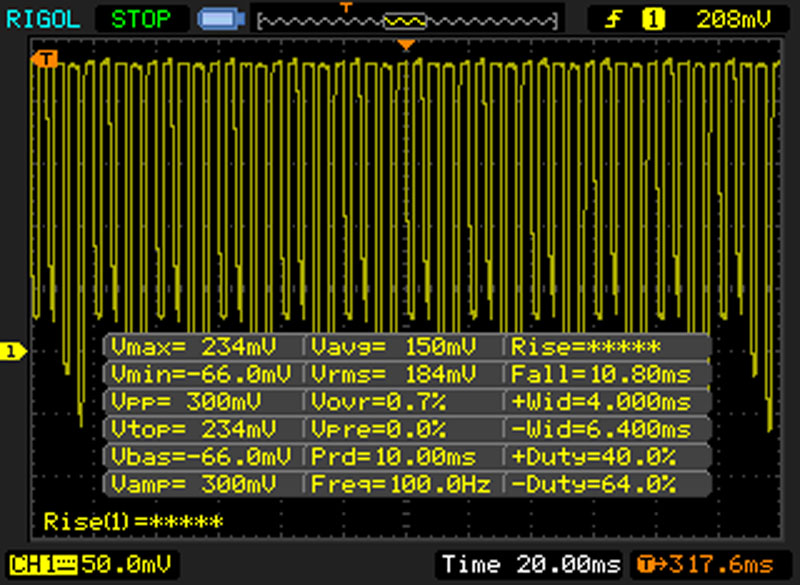 |
Il display sfarfalla a 50 Hz (Probabilmente a causa dell'uso di PWM) Flickering rilevato ad una luminosita' di 90 % o inferiore. Non dovrebbe verificarsi flickering o PWM sopra questo valore di luminosita'. La frequenza di 50 Hz è molto bassa, quindi il flickering potrebbe causare stanchezza agli occhi e mal di testa con un utilizzo prolungato. In confronto: 52 % di tutti i dispositivi testati non utilizza PWM per ridurre la luminosita' del display. Se è rilevato PWM, una media di 7744 (minimo: 5 - massimo: 343500) Hz è stata rilevata. | |||
Tempi di risposta del Display
| ↔ Tempi di risposta dal Nero al Bianco | ||
|---|---|---|
| 23 ms ... aumenta ↗ e diminuisce ↘ combinato | ↗ 6 ms Incremento | 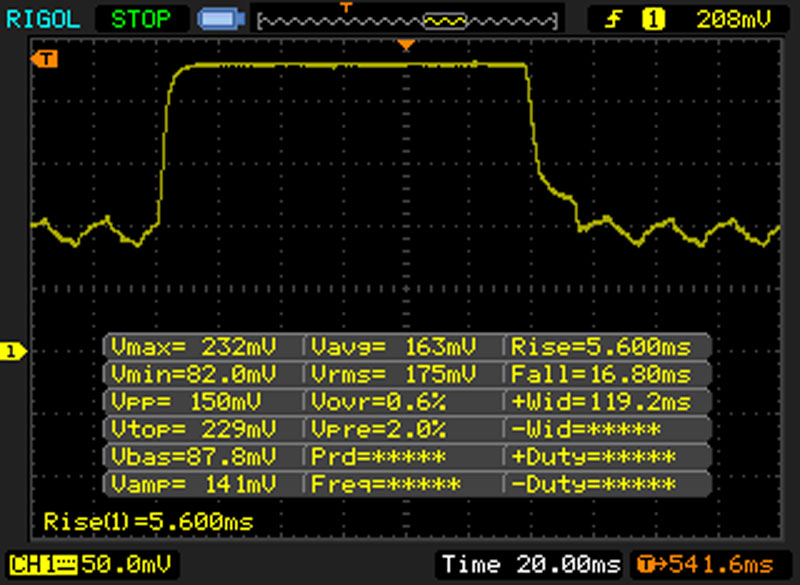 |
| ↘ 17 ms Calo | ||
| Lo schermo mostra buoni tempi di risposta durante i nostri tests, ma potrebbe essere troppo lento per i gamers competitivi. In confronto, tutti i dispositivi di test variano da 0.1 (minimo) a 240 (massimo) ms. » 52 % di tutti i dispositivi è migliore. Questo significa che i tempi di risposta rilevati sono peggiori rispetto alla media di tutti i dispositivi testati (19.8 ms). | ||
| ↔ Tempo di risposta dal 50% Grigio all'80% Grigio | ||
| 42 ms ... aumenta ↗ e diminuisce ↘ combinato | ↗ 20 ms Incremento | 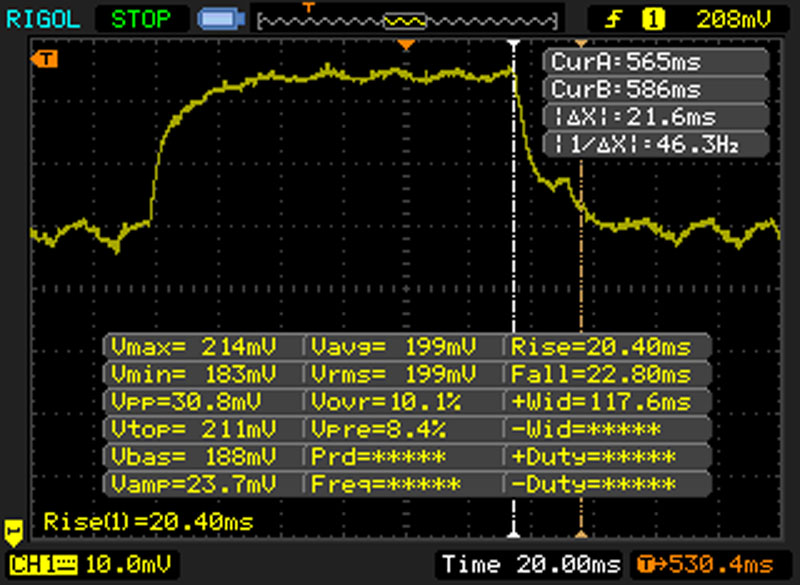 |
| ↘ 22 ms Calo | ||
| Lo schermo mostra tempi di risposta lenti nei nostri tests e sarà insoddisfacente per i gamers. In confronto, tutti i dispositivi di test variano da 0.165 (minimo) a 636 (massimo) ms. » 67 % di tutti i dispositivi è migliore. Questo significa che i tempi di risposta rilevati sono peggiori rispetto alla media di tutti i dispositivi testati (30.9 ms). | ||
| Cinebench R15 | |
| CPU Multi 64Bit | |
| Acer Aspire V3-372-57CW | |
| Apple MacBook Air 13 inch 2015-03 | |
| Asus X302UV-FN016T | |
| Asus Zenbook UX303UB-R4100T | |
| Lenovo U31-70 80M5003EGE | |
| CPU Single 64Bit | |
| Acer Aspire V3-372-57CW | |
| Asus Zenbook UX303UB-R4100T | |
| Lenovo U31-70 80M5003EGE | |
| Asus X302UV-FN016T | |
| Apple MacBook Air 13 inch 2015-03 | |
| Cinebench R10 | |
| Rendering Multiple CPUs 32Bit | |
| Acer Aspire V3-372-57CW | |
| Apple MacBook Air 13 inch 2015-03 | |
| Asus X302UV-FN016T | |
| Asus Zenbook UX303UB-R4100T | |
| Lenovo U31-70 80M5003EGE | |
| Rendering Single 32Bit | |
| Acer Aspire V3-372-57CW | |
| Apple MacBook Air 13 inch 2015-03 | |
| Asus Zenbook UX303UB-R4100T | |
| Lenovo U31-70 80M5003EGE | |
| Asus X302UV-FN016T | |
| Geekbench 3 | |
| 32 Bit Single-Core Score | |
| Acer Aspire V3-372-57CW | |
| Apple MacBook Air 13 inch 2015-03 | |
| Asus Zenbook UX303UB-R4100T | |
| Asus X302UV-FN016T | |
| Lenovo U31-70 80M5003EGE | |
| 32 Bit Multi-Core Score | |
| Acer Aspire V3-372-57CW | |
| Asus Zenbook UX303UB-R4100T | |
| Apple MacBook Air 13 inch 2015-03 | |
| Asus X302UV-FN016T | |
| Lenovo U31-70 80M5003EGE | |
| Sunspider - 1.0 Total Score | |
| Asus X302UV-FN016T | |
| Lenovo U31-70 80M5003EGE | |
| Asus Zenbook UX303UB-R4100T | |
| Acer Aspire V3-372-57CW | |
| JetStream 1.1 - 1.1 Total | |
| Asus Zenbook UX303UB-R4100T | |
| Acer Aspire V3-372-57CW | |
| Asus X302UV-FN016T | |
| Lenovo U31-70 80M5003EGE | |
| Mozilla Kraken 1.1 - Total | |
| Lenovo U31-70 80M5003EGE | |
| Acer Aspire V3-372-57CW | |
| Asus X302UV-FN016T | |
| Asus Zenbook UX303UB-R4100T | |
| Octane V2 - Total Score | |
| Acer Aspire V3-372-57CW | |
| Asus Zenbook UX303UB-R4100T | |
| Asus X302UV-FN016T | |
| Lenovo U31-70 80M5003EGE | |
| Peacekeeper - --- | |
| Acer Aspire V3-372-57CW | |
| Asus Zenbook UX303UB-R4100T | |
| Lenovo U31-70 80M5003EGE | |
| Asus X302UV-FN016T | |
* ... Meglio usare valori piccoli
| PCMark 7 Score | 4955 punti | |
| PCMark 8 Home Score Accelerated v2 | 3466 punti | |
| PCMark 8 Creative Score Accelerated v2 | 3885 punti | |
| PCMark 8 Work Score Accelerated v2 | 4464 punti | |
Aiuto | ||
| PCMark 8 - Home Score Accelerated v2 | |
| Acer Aspire V3-372-57CW | |
| Apple MacBook Air 13 inch 2015-03 | |
| Asus X302UV-FN016T | |
| Asus Zenbook UX303UB-R4100T | |
| Lenovo U31-70 80M5003EGE | |
| PCMark 7 - Score | |
| Acer Aspire V3-372-57CW | |
| Apple MacBook Air 13 inch 2015-03 | |
| Asus Zenbook UX303UB-R4100T | |
| Asus X302UV-FN016T | |
| Lenovo U31-70 80M5003EGE | |

| 3DMark 06 Standard Score | 10781 punti | |
| 3DMark Vantage P Result | 6584 punti | |
| 3DMark 11 Performance | 1888 punti | |
| 3DMark Ice Storm Standard Score | 58897 punti | |
| 3DMark Cloud Gate Standard Score | 5744 punti | |
| 3DMark Fire Strike Score | 1154 punti | |
| 3DMark Fire Strike Extreme Score | 586 punti | |
Aiuto | ||
| 3DMark 11 - 1280x720 Performance | |
| Acer Aspire V3-372-57CW | |
| Asus Zenbook UX303UB-R4100T | |
| Asus X302UV-FN016T | |
| Lenovo U31-70 80M5003EGE | |
| Lenovo B70-80 80MR0006GE | |
| Dell Inspiron 15-5558 | |
| Asus F555LJ-XX110H | |
| Toshiba Satellite C55-C-1NE | |
| Apple MacBook Air 13 inch 2015-03 | |
| 3DMark | |
| 1280x720 Ice Storm Standard Score | |
| Acer Aspire V3-372-57CW | |
| Asus X302UV-FN016T | |
| Apple MacBook Air 13 inch 2015-03 | |
| Asus F555LJ-XX110H | |
| Asus Zenbook UX303UB-R4100T | |
| Lenovo B70-80 80MR0006GE | |
| Toshiba Satellite C55-C-1NE | |
| Lenovo U31-70 80M5003EGE | |
| Dell Inspiron 15-5558 | |
| 1280x720 Cloud Gate Standard Score | |
| Acer Aspire V3-372-57CW | |
| Asus Zenbook UX303UB-R4100T | |
| Apple MacBook Air 13 inch 2015-03 | |
| Lenovo U31-70 80M5003EGE | |
| Asus X302UV-FN016T | |
| Lenovo B70-80 80MR0006GE | |
| Dell Inspiron 15-5558 | |
| Asus F555LJ-XX110H | |
| Toshiba Satellite C55-C-1NE | |
| 1280x720 Sky Diver Score | |
| Asus Zenbook UX303UB-R4100T | |
| Asus X302UV-FN016T | |
| Lenovo U31-70 80M5003EGE | |
| Dell Inspiron 15-5558 | |
| Asus F555LJ-XX110H | |
| 1920x1080 Fire Strike Score | |
| Acer Aspire V3-372-57CW | |
| Asus Zenbook UX303UB-R4100T | |
| Asus X302UV-FN016T | |
| Lenovo U31-70 80M5003EGE | |
| Lenovo B70-80 80MR0006GE | |
| Toshiba Satellite C55-C-1NE | |
| Dell Inspiron 15-5558 | |
| Asus F555LJ-XX110H | |
| Apple MacBook Air 13 inch 2015-03 | |
| 3DMark 06 - 1280x1024 Standard Score AA:0x AF:0x | |
| Acer Aspire V3-372-57CW | |
| Asus Zenbook UX303UB-R4100T | |
| Asus X302UV-FN016T | |
| Apple MacBook Air 13 inch 2015-03 | |
| Lenovo U31-70 80M5003EGE | |
| Asus F555LJ-XX110H | |
| basso | medio | alto | ultra | |
|---|---|---|---|---|
| Diablo III (2012) | 122.8 | 79.3 | 64.7 | 39.1 |
| Tomb Raider (2013) | 104.2 | 52.6 | 30.6 | 14.6 |
| BioShock Infinite (2013) | 77.4 | 43.1 | 35.7 | 12.1 |
| Battlefield 4 (2013) | 54.5 | 37.8 | 26 | 11 |
| GRID: Autosport (2014) | 176.6 | 68.4 | 30.7 | 14.9 |
| Dirt Rally (2015) | 170.3 | 44.4 | 22.6 | |
| Batman: Arkham Knight (2015) | 22 | 19 | 9 | |
| World of Warships (2015) | 97.5 | 65.9 | 29.7 | |
| FIFA 16 (2015) | 91.2 | 51.2 | 31.7 | |
| Anno 2205 (2015) | 38.1 | 19.1 | ||
| Fallout 4 (2015) | 27.9 | 17.4 | ||
| Star Wars Battlefront (2015) | 42.6 | 25.5 | 11.3 | |
| Rainbow Six Siege (2015) | 54.3 | 34.1 | 17.2 | |
| Just Cause 3 (2015) | 31.5 | 24.7 | ||
| Rise of the Tomb Raider (2016) | 23.2 | 14.7 | 8.1 | |
| Far Cry Primal (2016) | 24 | 11 | 9 | |
| The Division (2016) | 29.4 | 18.2 | ||
| Hitman 2016 (2016) | 23.7 | 17.7 | ||
| Need for Speed 2016 (2016) | 28.1 | 24.7 |
| Tomb Raider - 1366x768 Normal Preset AA:FX AF:4x | |
| Toshiba Satellite C70-C-1FT | |
| Asus Zenbook UX303UB-R4100T | |
| HP Envy 15-w000ng x360 | |
| HP Envy 15-w103ng x360 | |
| Asus X302UV-FN016T | |
| Lenovo U31-70 80M5003EGE | |
| Dell Inspiron 15-5558 | |
| Lenovo B70-80 80MR0006GE | |
| Asus F555LJ-XX110H | |
| Apple MacBook Air 13 inch 2015-03 | |
| BioShock Infinite - 1366x768 Medium Preset | |
| Acer Aspire V3-372-57CW | |
| Toshiba Satellite C70-C-1FT | |
| HP Envy 15-w000ng x360 | |
| Asus X302UV-FN016T | |
| Toshiba Satellite C55-C-1NE | |
| Asus F555LJ-XX110H | |
| Apple MacBook Air 13 inch 2015-03 | |
| GRID: Autosport - 1366x768 Medium Preset | |
| Asus Zenbook UX303UB-R4100T | |
| Asus X302UV-FN016T | |
| HP Envy 15-w000ng x360 | |
| Lenovo B70-80 80MR0006GE | |
| Lenovo Yoga 500-14ISK | |
| Lenovo U31-70 80M5003EGE | |
| Asus F555LJ-XX110H | |
| Battlefield 4 - 1024x768 Low Preset | |
| Acer Aspire V3-372-57CW | |
| Asus X302UV-FN016T | |
| HP Envy 15-w000ng x360 | |
| Rainbow Six Siege - 1024x768 Low Preset AA:T AF:Linear | |
| Asus Zenbook UX303UB-R4100T | |
| Asus X302UV-FN016T | |
| Acer Aspire V3-372-57CW | |
| Lenovo U31-70 80M5003EGE | |
| Star Wars Battlefront - 1024x768 Low Preset | |
| Acer Aspire V3-372-57CW | |
| Asus Zenbook UX303UB-R4100T | |
| HP Envy 15-w103ng x360 | |
| Asus X302UV-FN016T | |
| Lenovo U31-70 80M5003EGE | |
| FIFA 16 - 1366x768 High Preset AA:2x MS | |
| Asus Zenbook UX303UB-R4100T | |
| HP Envy 15-w103ng x360 | |
| Asus X302UV-FN016T | |
| Lenovo U31-70 80M5003EGE | |
| Diablo III - 1366x768 High AA:on | |
| Acer Aspire V3-372-57CW | |
| HP Envy 15-w103ng x360 | |
| Asus X302UV-FN016T | |
| Asus F555LJ-XX110H | |
| World of Warships - 1366x768 Medium Preset AF:Trilinear | |
| Asus Zenbook UX303UB-R4100T | |
| HP Envy 15-w103ng x360 | |
| Acer Aspire V3-372-57CW | |
| Asus X302UV-FN016T | |
| Dirt Rally - 1366x768 Medium Preset | |
| Asus Zenbook UX303UB-R4100T | |
| Asus X302UV-FN016T | |
| HP Envy 15-w000ng x360 | |
| Acer Aspire V3-372-57CW | |
| Lenovo U31-70 80M5003EGE | |
| Asus F555LJ-XX110H | |
| Dell Inspiron 15-5558 | |
Rumorosità
| Idle |
| 32.9 / 32.9 / 33 dB(A) |
| HDD |
| 33 dB(A) |
| Sotto carico |
| 33 / 34.6 dB(A) |
 | ||
30 dB silenzioso 40 dB(A) udibile 50 dB(A) rumoroso |
||
min: | ||
(+) La temperatura massima sul lato superiore è di 29.6 °C / 85 F, rispetto alla media di 35.9 °C / 97 F, che varia da 21.4 a 59 °C per questa classe Subnotebook.
(±) Il lato inferiore si riscalda fino ad un massimo di 41 °C / 106 F, rispetto alla media di 39.2 °C / 103 F
(+) In idle, la temperatura media del lato superiore è di 24.4 °C / 76 F, rispetto alla media deld ispositivo di 30.8 °C / 87 F.
(+) I poggiapolsi e il touchpad sono piu' freddi della temperatura della pelle con un massimo di 28.7 °C / 83.7 F e sono quindi freddi al tatto.
(±) La temperatura media della zona del palmo della mano di dispositivi simili e'stata di 28.2 °C / 82.8 F (-0.5 °C / -0.9 F).
| Off / Standby | |
| Idle | |
| Sotto carico |
|
Leggenda:
min: | |
| Autonomia della batteria - WiFi v1.3 | |
| Asus X302UV-FN016T | |
| Acer Aspire V3-372-57CW | |
| Lenovo U31-70 80M5003EGE | |
| Asus Zenbook UX303UB-R4100T | |
| Apple MacBook Air 13 inch 2015-03 | |
| Asus Zenbook UX305UA-FC040T | |
Pro
Contro
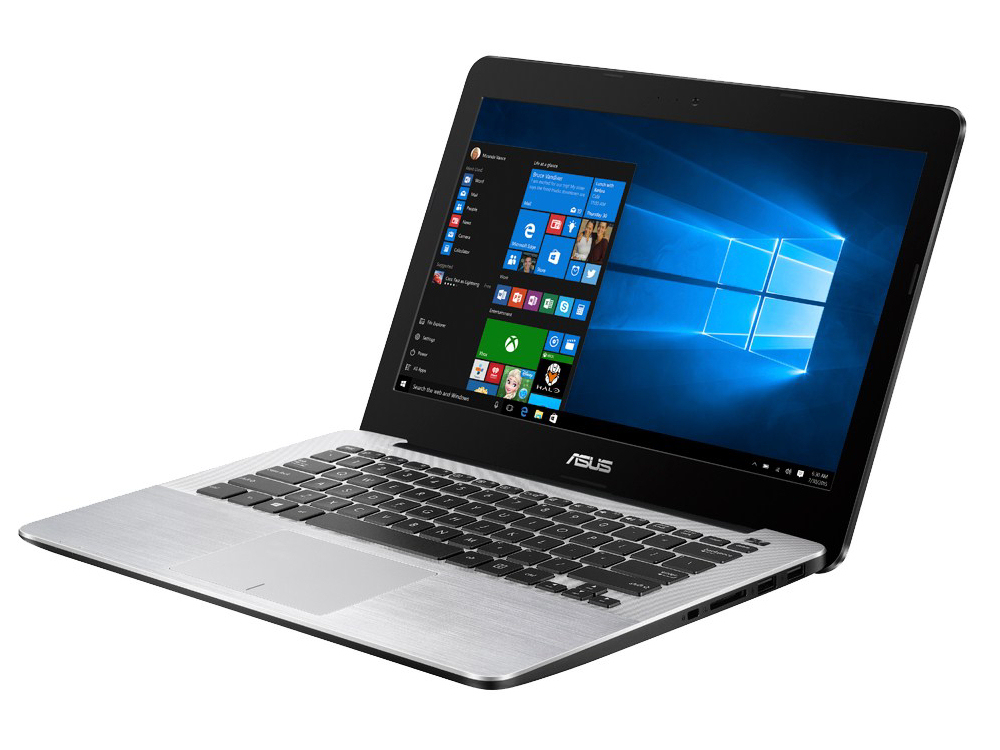
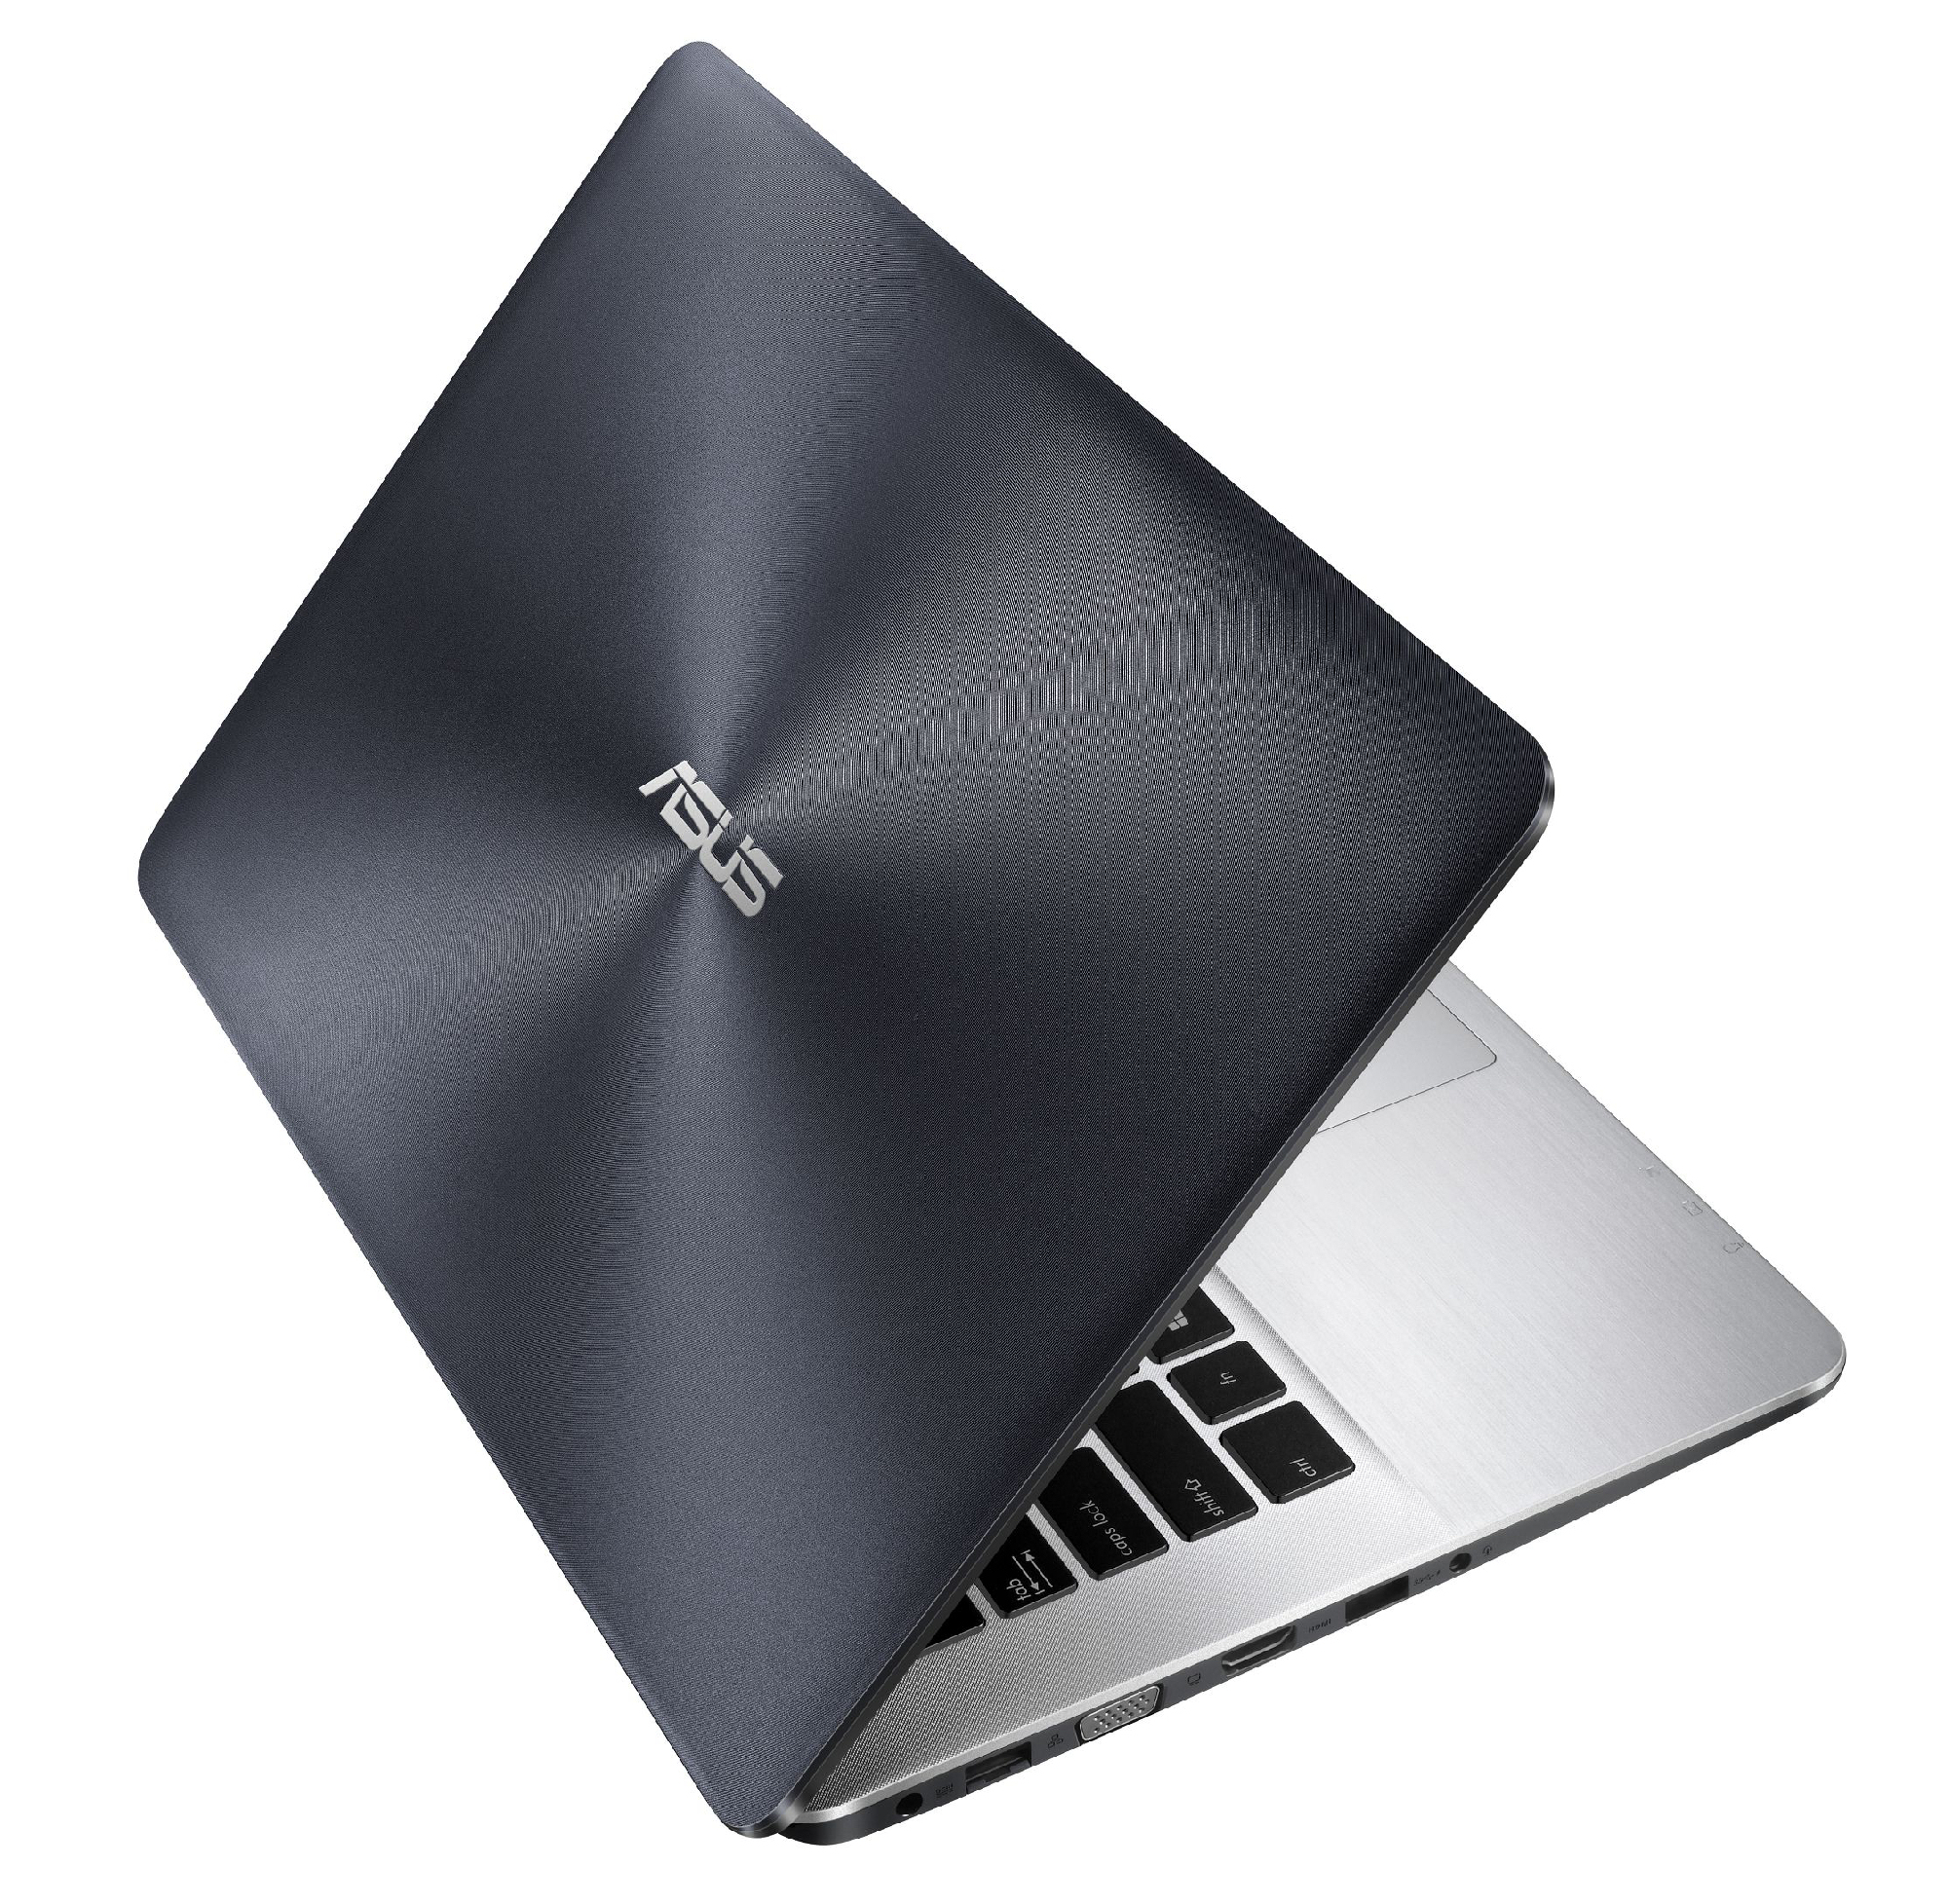
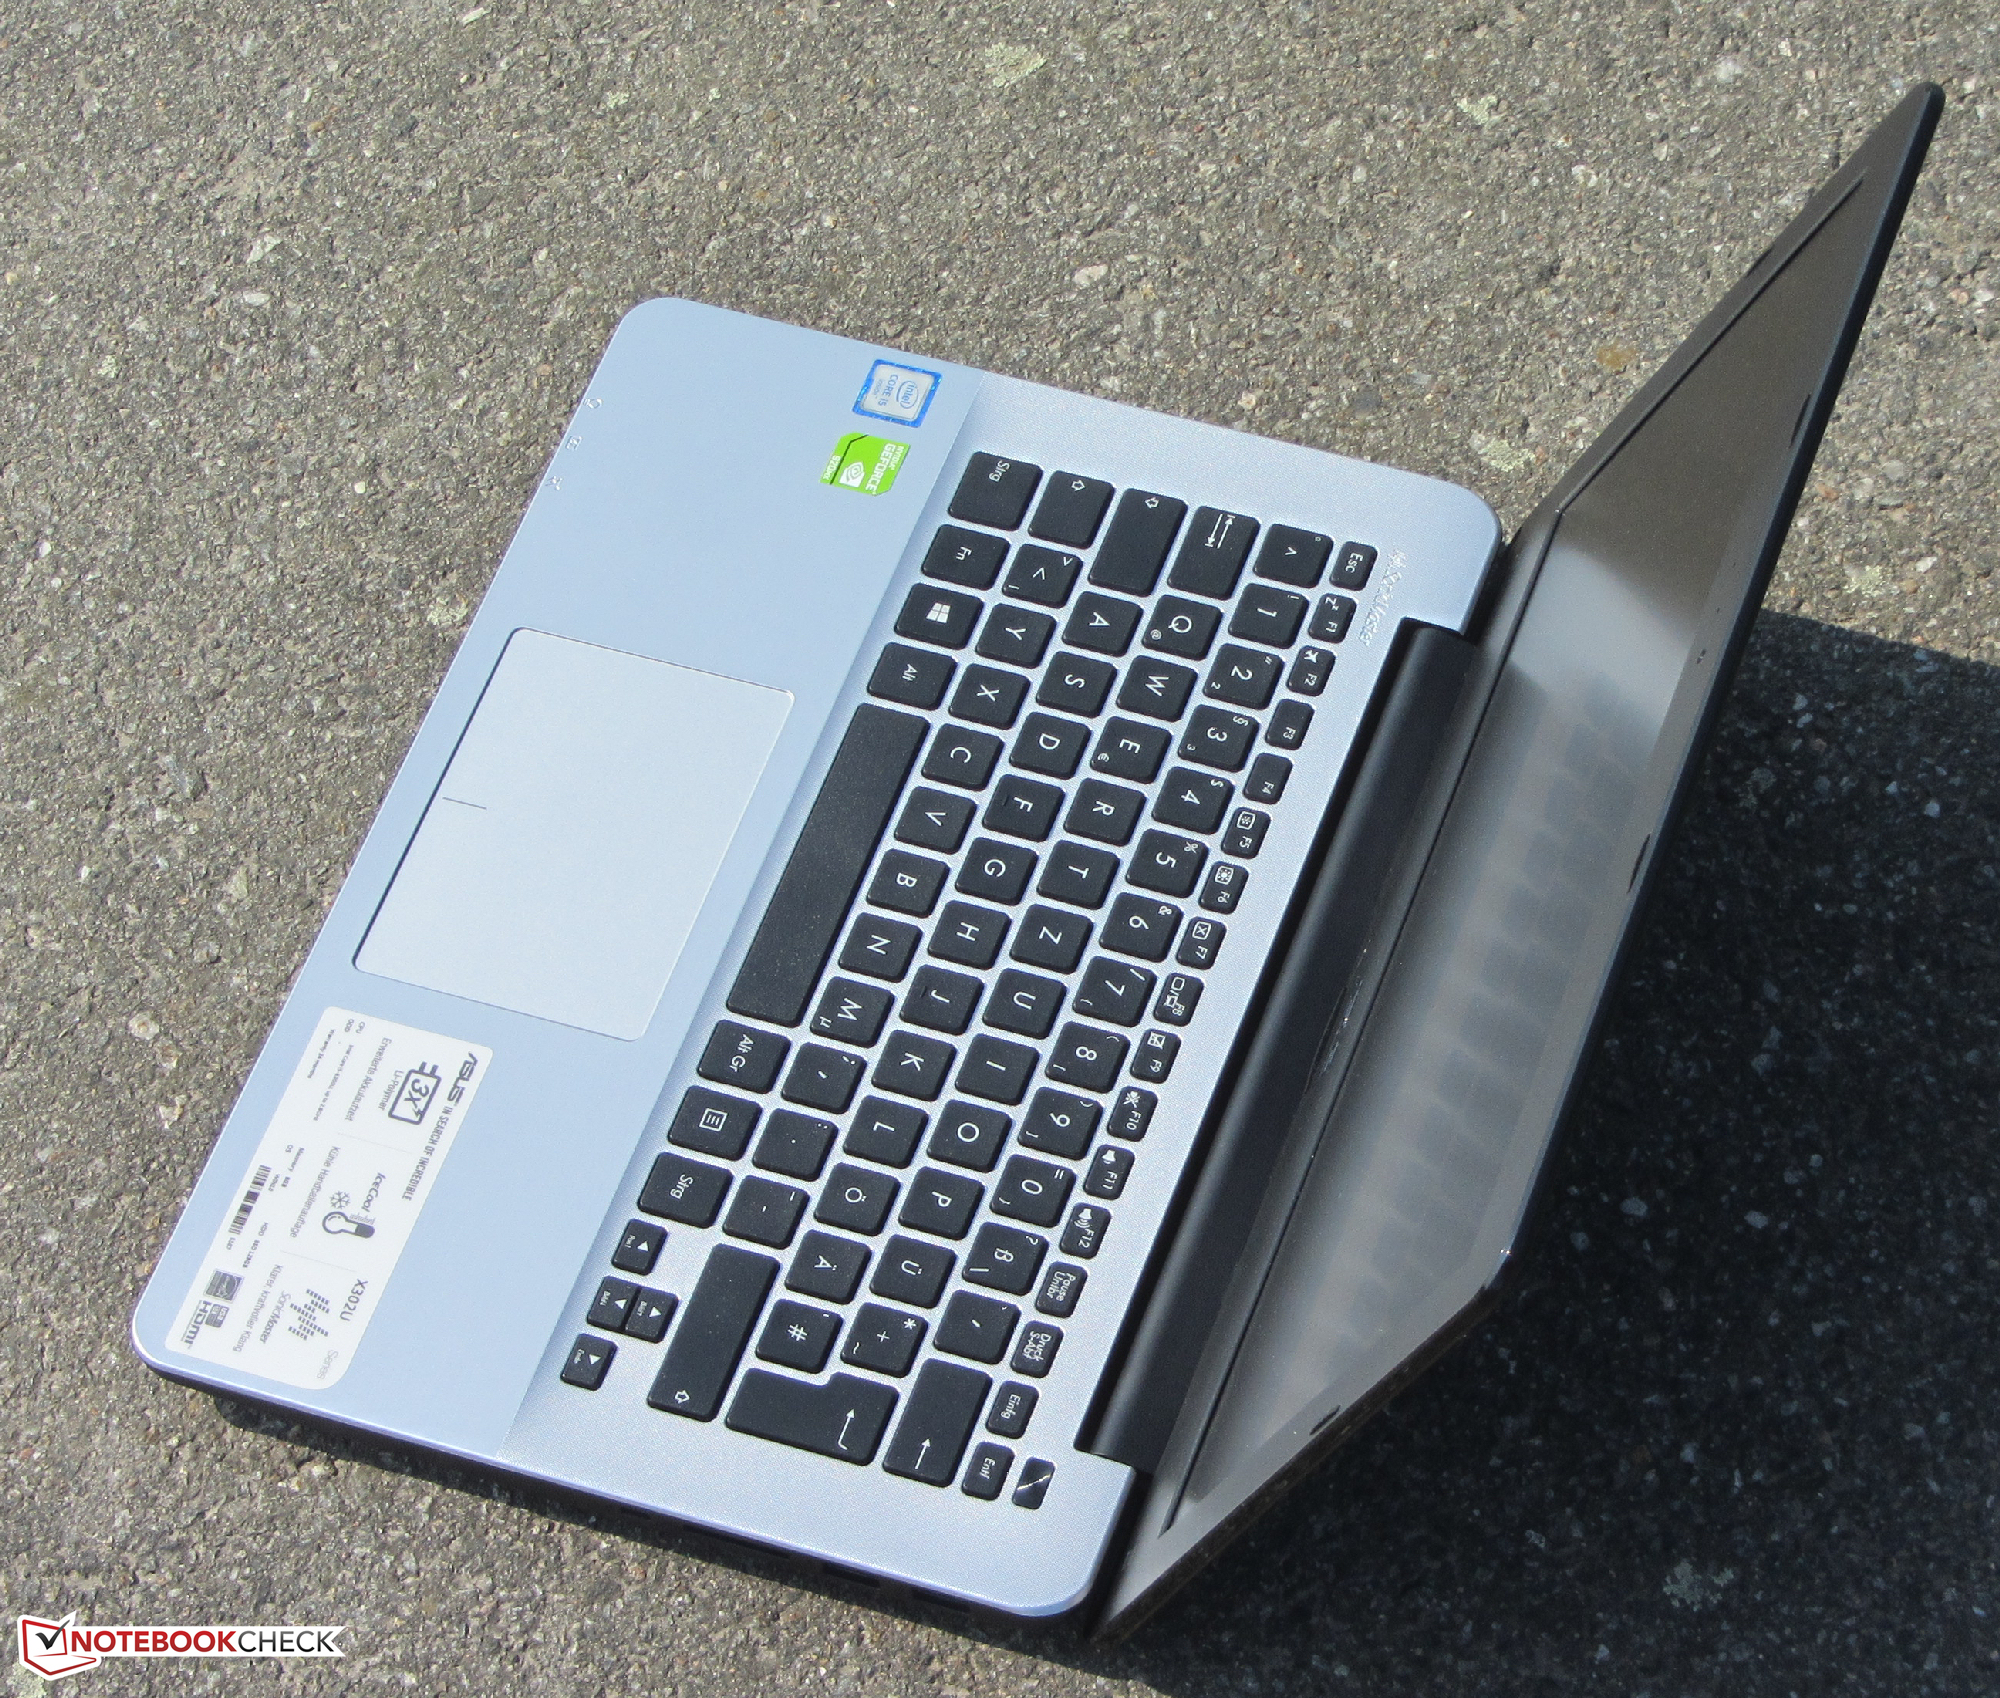
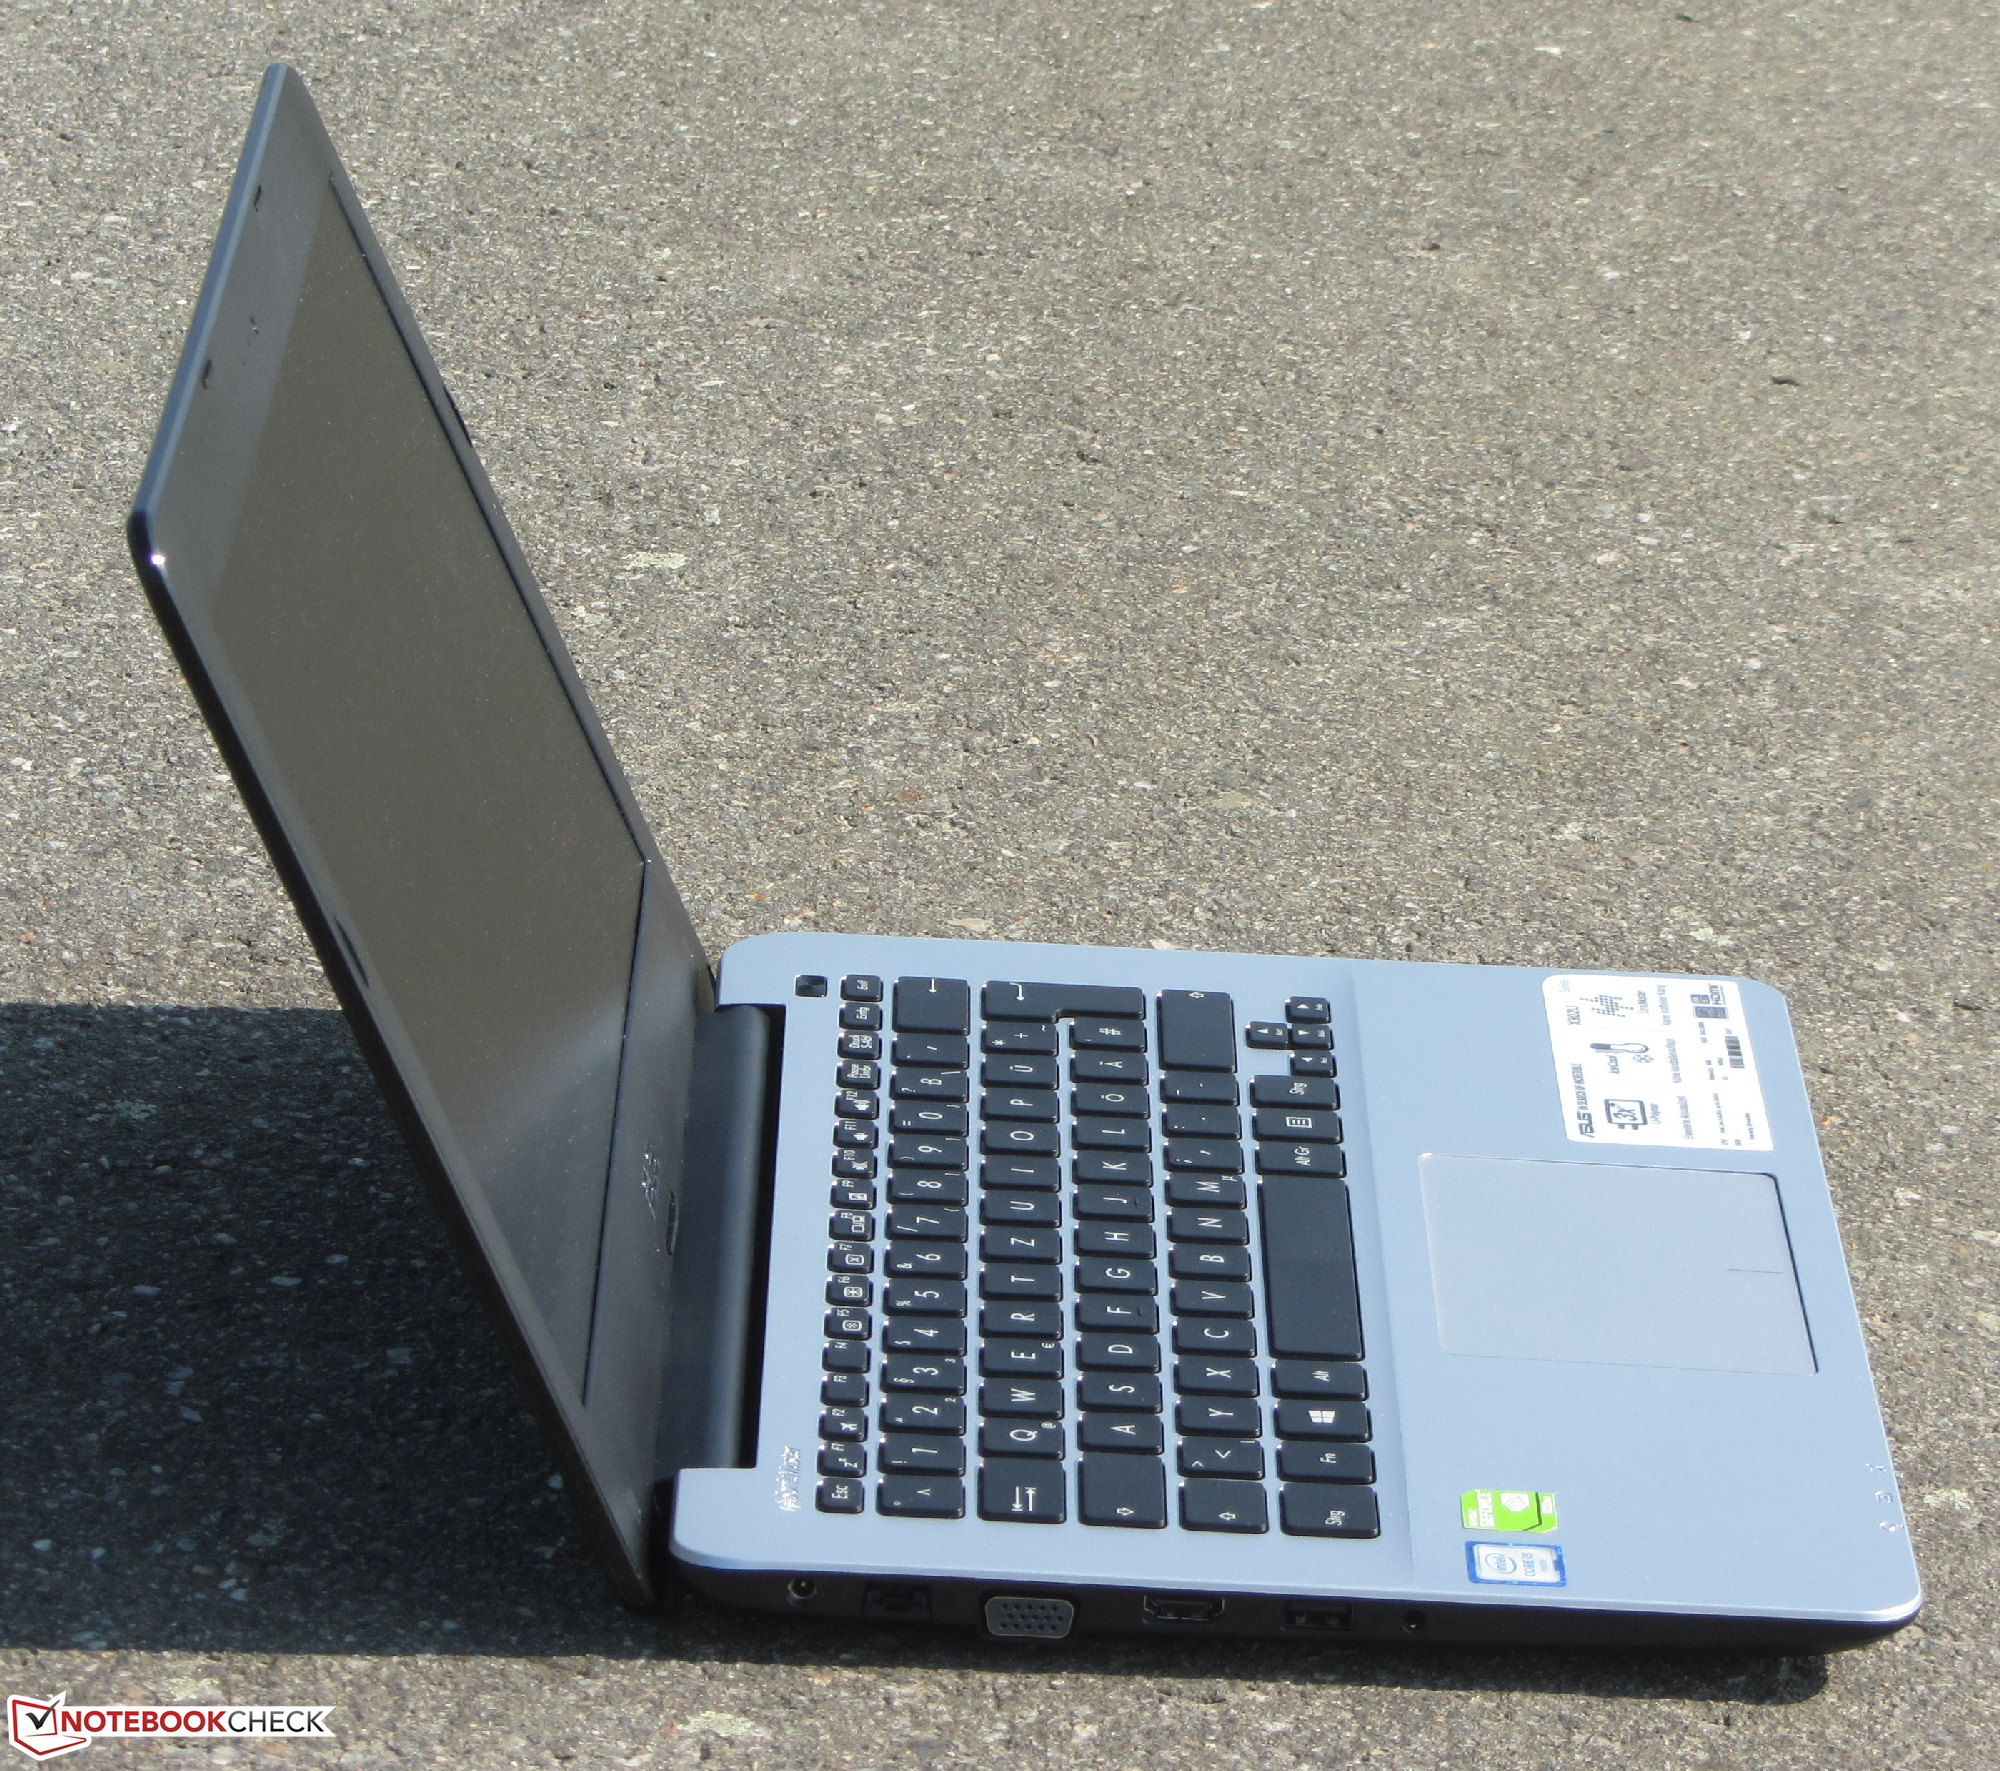
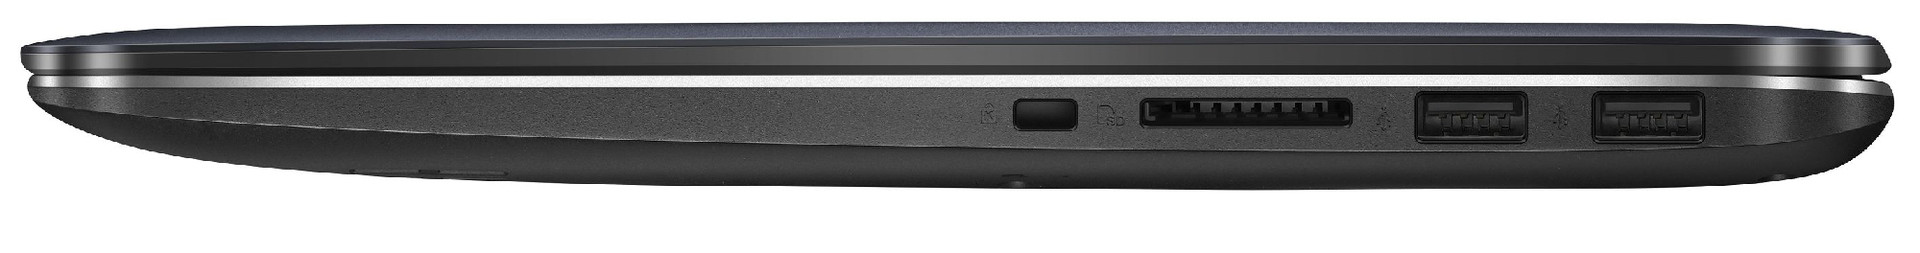
Acer offre un subnotebook da 13.3" con l'X302UV. Con un prezzo di circa 700 Euro (~$788), il modello di test è più economico rispetto ai più noti portatili da 13.3" come l'Apple MacBook Air 13, l'Asus ZenBook UX303, e l'Asus ZenBook UX305. Tuttavia, usa un case in plastica invece di un sottile case in metallo. IN aggiunta, l'X302UV non ha un display IPS.
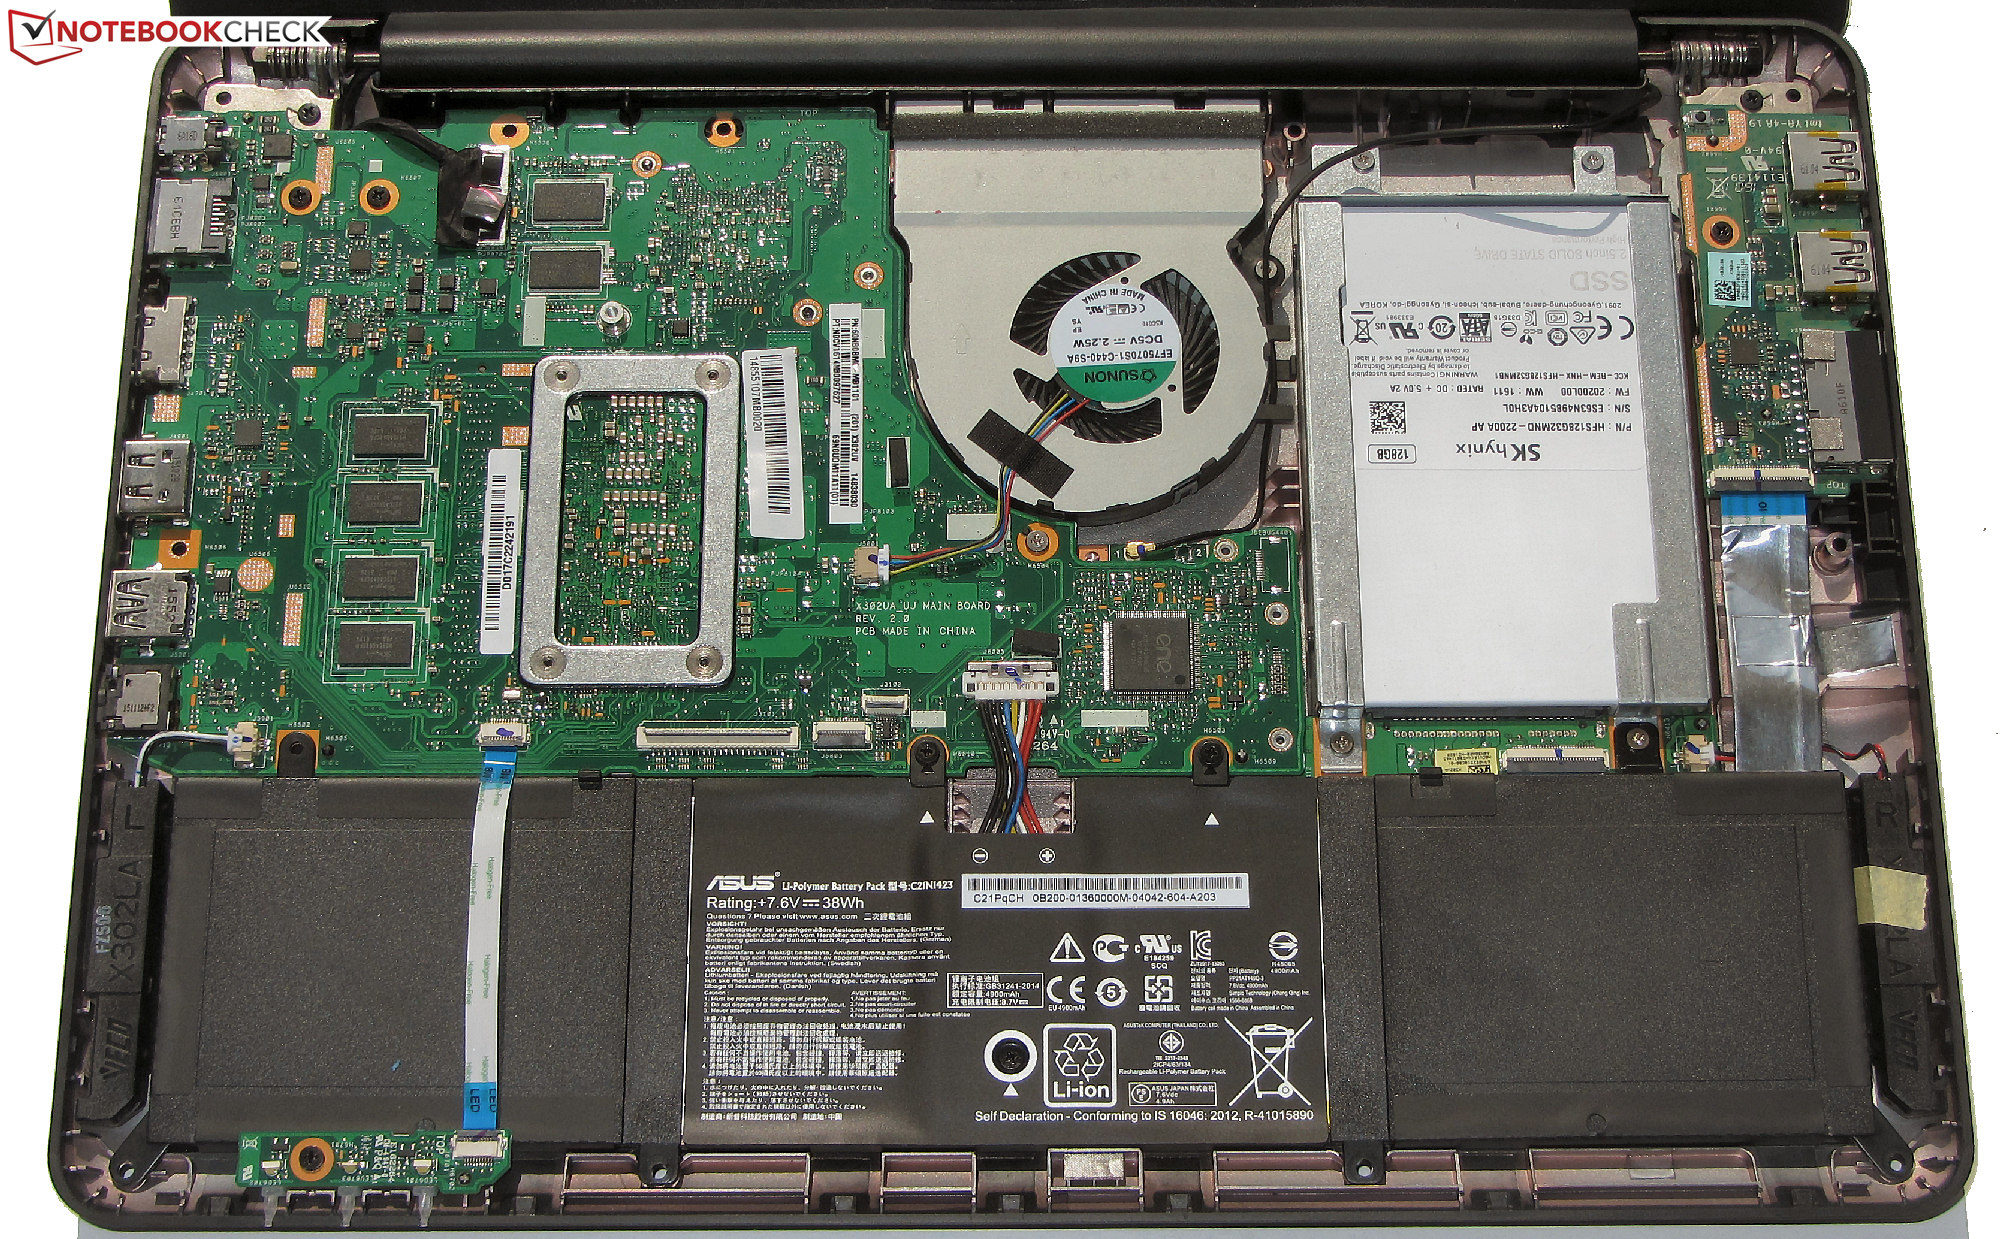
Il processore Skylake ha sufficienti prestazioni CPU per tutti gli scenari. La nuova GeForce 920MX consente in parte anche il gaming. La 920MX va meglio rispetto a modelli simili AMD. Indipendentemente dal carico, il computer resta silenzioso e si scalda poco. Un veloce SSD garantisce un sistema scattante. Con una capacità totale di 128 GB, lo spazio dell'SSD è poco. Ecco dove si fa notare il prezzo. Dovrete aprire il case per sostituire l'SSD. La tastiera non è un modello top, ma è decente. L'autonomia è buona.
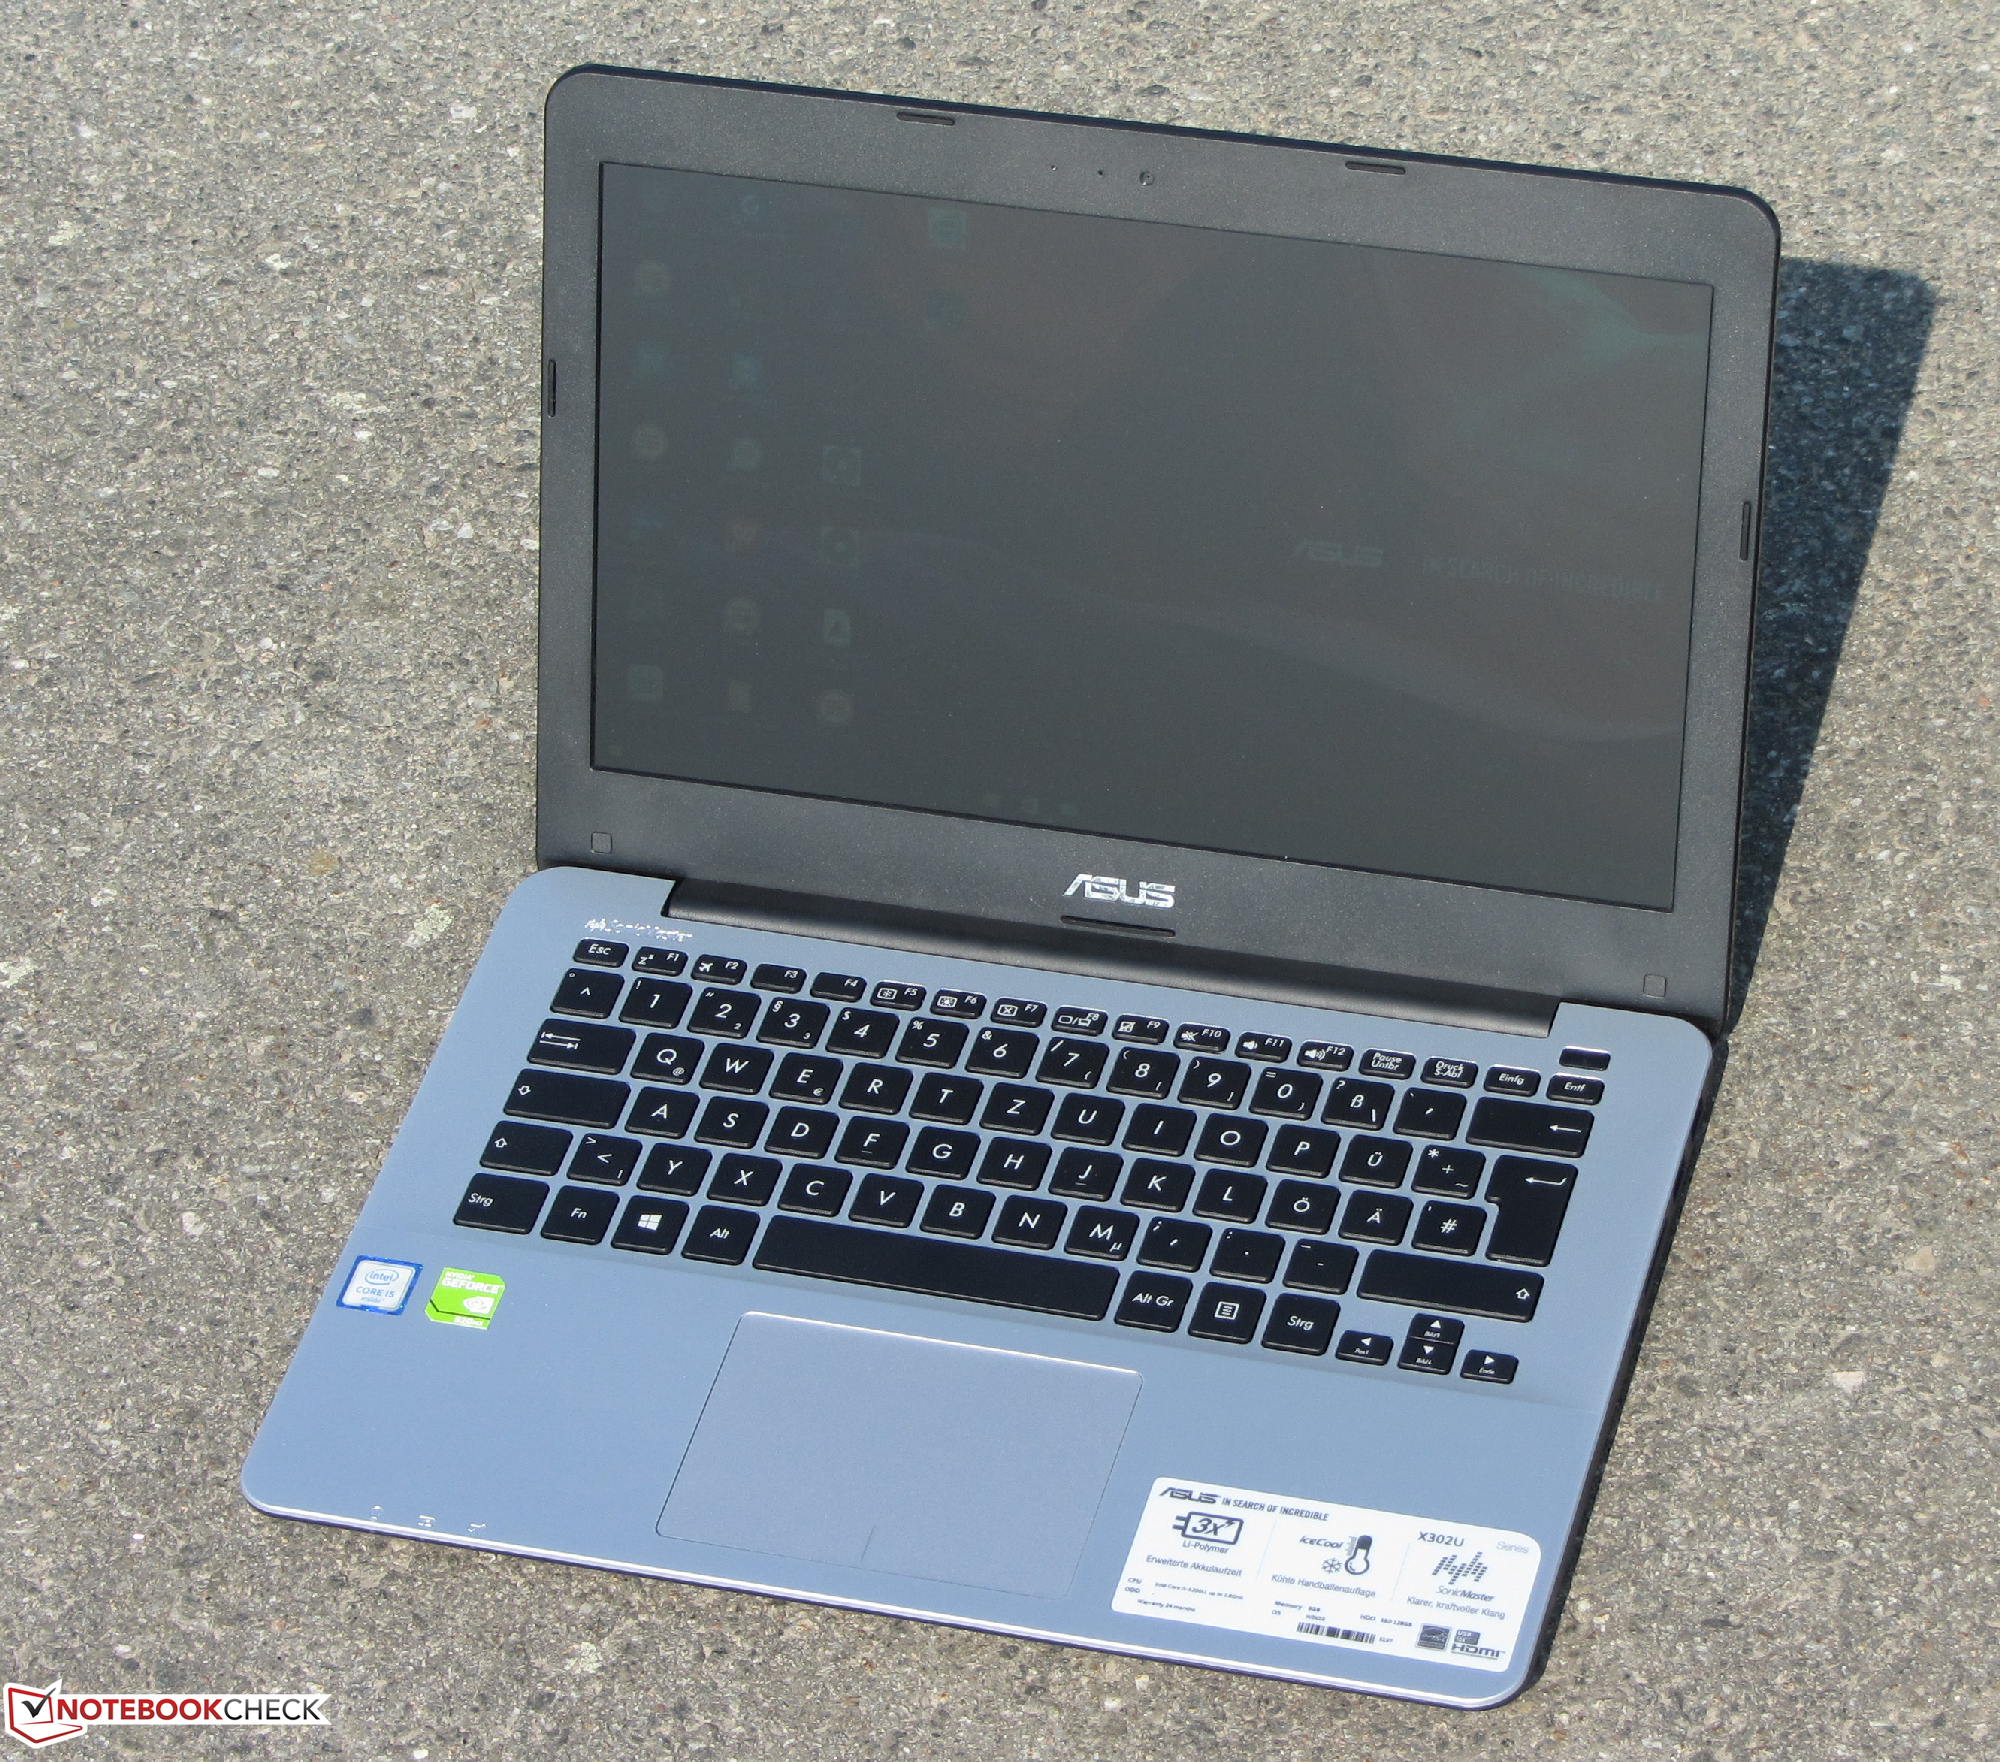
Il display è scuro, con contrasto basso, e angoli di visuale limitati, ed è un punto debole. I displays di subnotebooks in particolare non dovrebbero avere queste caratteristiche.
Quindi, l'X302UV può essere usato solo in ambienti chiusi. Sarebbe stato meglio se Asus avesse montato sul laptop un display migliore rispetto all'SSD. I clienti possono passare ad un SSD da soli, ma non possono migliorare il display.
Nota: si tratta di una recensione breve, con alcune sezioni non tradotte, per la versione integrale in inglese guardate qui.
Asus X302UV-FN016T
- 06/06/2016 v5.1 (old)
Sascha Mölck