Recensione Breve del Subnotebook Asus Zenbook UX305UA-FC040T
| |||||||||||||||||||||||||
Distribuzione della luminosità: 86 %
Al centro con la batteria: 358 cd/m²
Contrasto: 895:1 (Nero: 0.4 cd/m²)
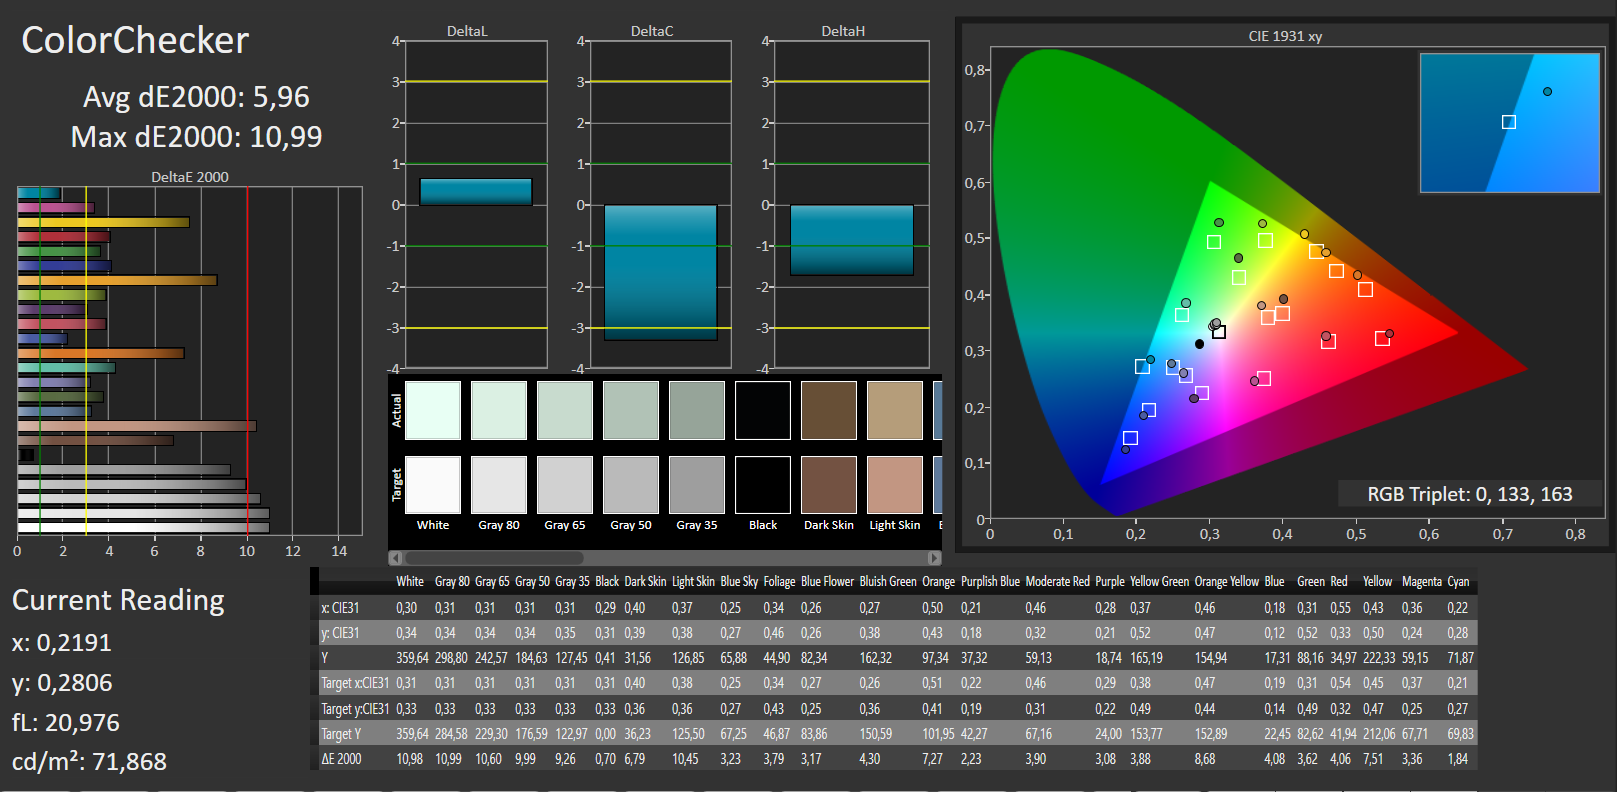
ΔE ColorChecker Calman: 5.96 | ∀{0.5-29.43 Ø4.71}
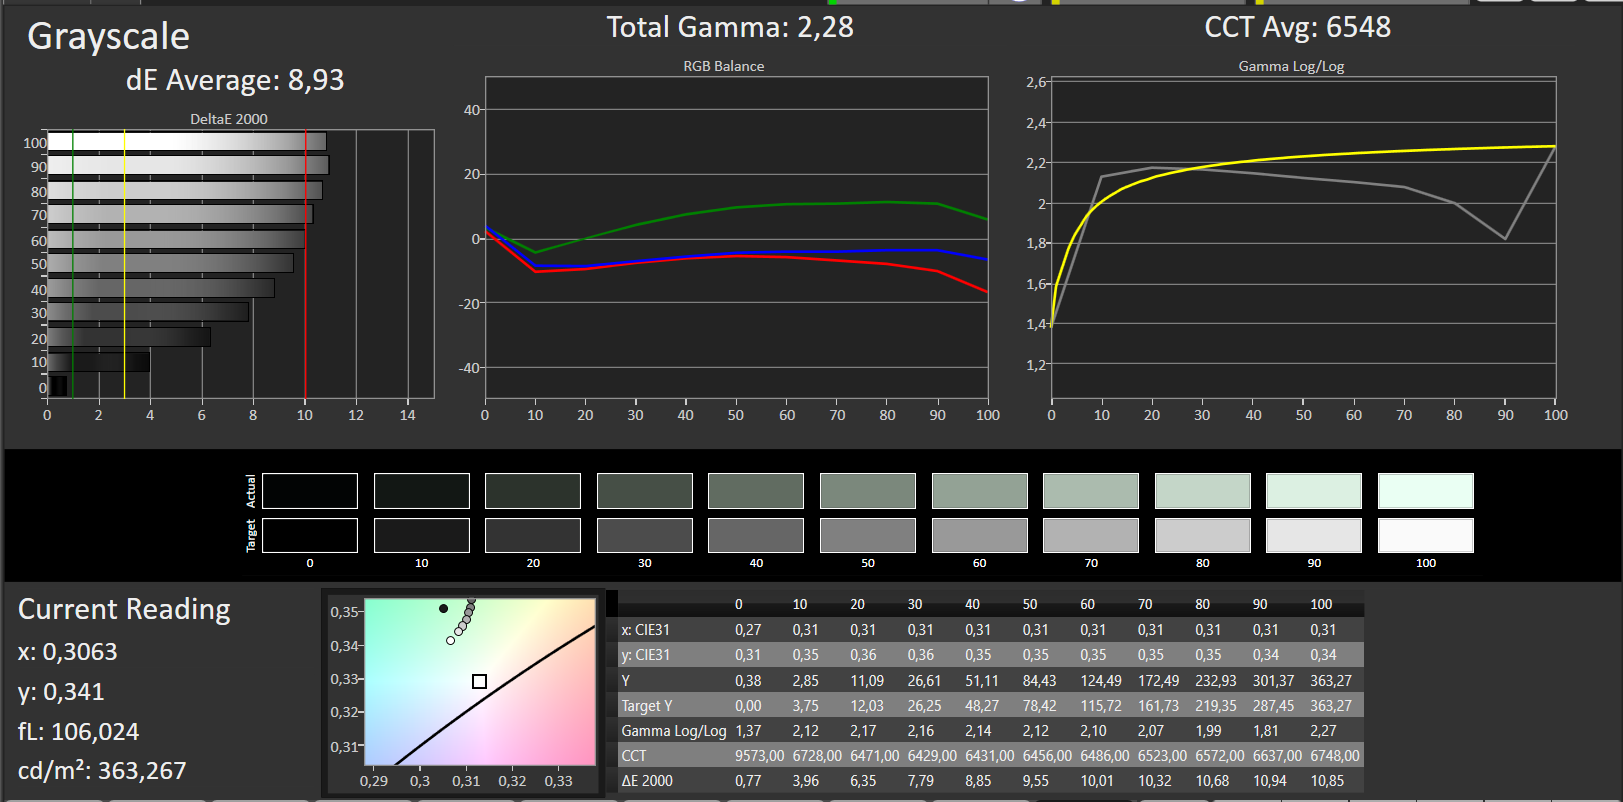
ΔE Greyscale Calman: 8.93 | ∀{0.09-98 Ø4.96}
93% sRGB (Argyll 1.6.3 3D)
60% AdobeRGB 1998 (Argyll 1.6.3 3D)
66.3% AdobeRGB 1998 (Argyll 3D)
92.8% sRGB (Argyll 3D)
65.1% Display P3 (Argyll 3D)
Gamma: 2.28
CCT: 6548 K
Sfarfallio dello schermo / PWM (Pulse-Width Modulation)
| flickering dello schermo / PWM rilevato | 50 Hz | ≤ 20 % settaggio luminosita' | 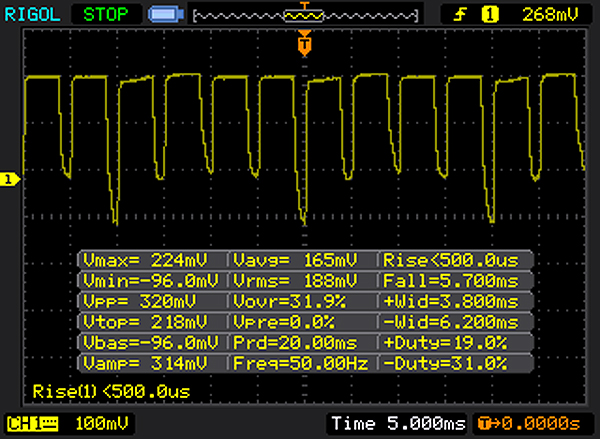 |
Il display sfarfalla a 50 Hz (Probabilmente a causa dell'uso di PWM) Flickering rilevato ad una luminosita' di 20 % o inferiore. Non dovrebbe verificarsi flickering o PWM sopra questo valore di luminosita'. La frequenza di 50 Hz è molto bassa, quindi il flickering potrebbe causare stanchezza agli occhi e mal di testa con un utilizzo prolungato. In confronto: 52 % di tutti i dispositivi testati non utilizza PWM per ridurre la luminosita' del display. Se è rilevato PWM, una media di 7747 (minimo: 5 - massimo: 343500) Hz è stata rilevata. | |||
Tempi di risposta del Display
| ↔ Tempi di risposta dal Nero al Bianco | ||
|---|---|---|
| 28 ms ... aumenta ↗ e diminuisce ↘ combinato | ↗ 8 ms Incremento | 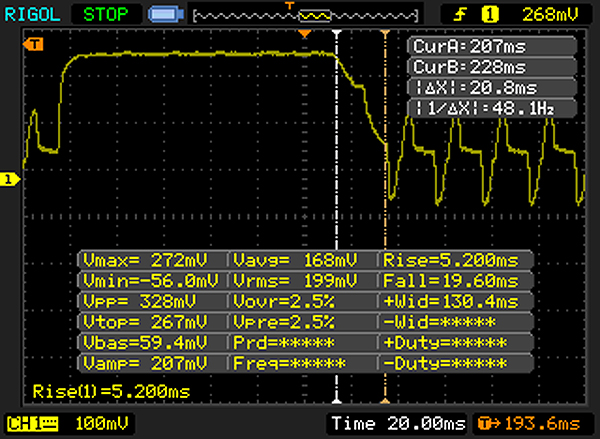 |
| ↘ 20 ms Calo | ||
| Lo schermo mostra tempi di risposta relativamente lenti nei nostri tests e potrebbe essere troppo lento per i gamers. In confronto, tutti i dispositivi di test variano da 0.1 (minimo) a 240 (massimo) ms. » 71 % di tutti i dispositivi è migliore. Questo significa che i tempi di risposta rilevati sono peggiori rispetto alla media di tutti i dispositivi testati (19.8 ms). | ||
| ↔ Tempo di risposta dal 50% Grigio all'80% Grigio | ||
| 25 ms ... aumenta ↗ e diminuisce ↘ combinato | ↗ 15 ms Incremento | 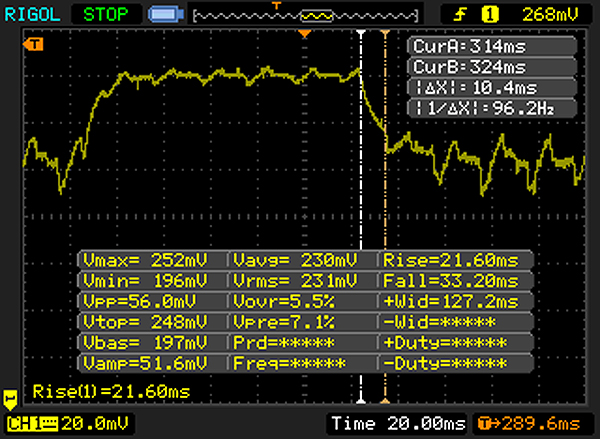 |
| ↘ 10 ms Calo | ||
| Lo schermo mostra tempi di risposta relativamente lenti nei nostri tests e potrebbe essere troppo lento per i gamers. In confronto, tutti i dispositivi di test variano da 0.165 (minimo) a 636 (massimo) ms. » 35 % di tutti i dispositivi è migliore. Questo significa che i tempi di risposta rilevati sono migliori rispettto alla media di tutti i dispositivi testati (31 ms). | ||
| Asus Zenbook UX305UA-FC040T IPS, 1920x1080 | Asus Zenbook UX305LA-FC012H IPS, 1920x1080 | Asus Zenbook UX305CA-EHM1 IPS, 1920x1080 | Dell XPS 13 2016 i7 256GB QHD IGZO , 3200x1800 | Lenovo Yoga 900-13ISK 80MK IPS, 3200x1800 | Apple MacBook Air 13 inch 2015-03 TN LED, 1440x900 | Lenovo U31-70 80M5003EGE IPS, 1920x1080 | Acer Aspire V3-372-50LK IPS, 1920x1080 | |
|---|---|---|---|---|---|---|---|---|
| Display | -2% | -2% | -1% | -3% | -37% | -39% | -39% | |
| Display P3 Coverage (%) | 65.1 | 63.9 -2% | 64.5 -1% | 63.6 -2% | 63.2 -3% | 40.1 -38% | 38.85 -40% | 39.05 -40% |
| sRGB Coverage (%) | 92.8 | 91.6 -1% | 90.4 -3% | 93.6 1% | 88.7 -4% | 59.8 -36% | 58.3 -37% | 58.7 -37% |
| AdobeRGB 1998 Coverage (%) | 66.3 | 65 -2% | 65.5 -1% | 65.5 -1% | 64.9 -2% | 41.51 -37% | 40.17 -39% | 40.35 -39% |
| Response Times | -20% | -34% | -18% | -62% | -35% | |||
| Response Time Grey 50% / Grey 80% * (ms) | 25 ? | 37.6 ? -50% | 40 ? -60% | 38.8 ? -55% | 54 ? -116% | 46 ? -84% | ||
| Response Time Black / White * (ms) | 28 ? | 24.8 ? 11% | 30 ? -7% | 22.4 ? 20% | 30 ? -7% | 24 ? 14% | ||
| PWM Frequency (Hz) | 50 ? | 201.6 ? | 4900 ? | 1316 | ||||
| Screen | 15% | 6% | 17% | -8% | 2% | -2% | -10% | |
| Brightness middle (cd/m²) | 358 | 349 -3% | 324.3 -9% | 285 -20% | 319.8 -11% | 329 -8% | 293 -18% | 250 -30% |
| Brightness (cd/m²) | 351 | 338 -4% | 314 -11% | 281 -20% | 302 -14% | 310 -12% | 289 -18% | 247 -30% |
| Brightness Distribution (%) | 86 | 87 1% | 93 8% | 90 5% | 88 2% | 82 -5% | 93 8% | 87 1% |
| Black Level * (cd/m²) | 0.4 | 0.25 37% | 0.289 28% | 0.18 55% | 0.835 -109% | 0.405 -1% | 0.36 10% | 0.43 -8% |
| Contrast (:1) | 895 | 1396 56% | 1122 25% | 1583 77% | 383 -57% | 812 -9% | 814 -9% | 581 -35% |
| Colorchecker dE 2000 * | 5.96 | 5.49 8% | 6.03 -1% | 4.89 18% | 2.68 55% | 3.96 34% | 4.94 17% | 4.51 24% |
| Colorchecker dE 2000 max. * | 10.99 | 7.51 32% | 9.98 9% | |||||
| Greyscale dE 2000 * | 8.93 | 5.43 39% | 7.89 12% | 5.16 42% | 2.35 74% | 3.51 61% | 4.11 54% | 3.18 64% |
| Gamma | 2.28 96% | 2.17 101% | 2.08 106% | 2.15 102% | 2.09 105% | 3.83 57% | 2.48 89% | 2.43 91% |
| CCT | 6548 99% | 7055 92% | 6490 100% | 7106 91% | 6975 93% | 6711 97% | 7508 87% | 6743 96% |
| Color Space (Percent of AdobeRGB 1998) (%) | 60 | 60 0% | 65.46 9% | 59 -2% | 57 -5% | 38.4 -36% | 37 -38% | 37 -38% |
| Color Space (Percent of sRGB) (%) | 93 | 92 -1% | 90.36 -3% | 93 0% | 88 -5% | 59.8 -36% | 58 -38% | 58 -38% |
| Media totale (Programma / Settaggio) | 7% /
11% | -5% /
1% | -6% /
6% | -10% /
-8% | -18% /
-7% | -34% /
-17% | -28% /
-20% |
* ... Meglio usare valori piccoli
| Geekbench 3 | |
| 32 Bit Single-Core Score | |
| Asus Zenbook UX305UA-FC040T | |
| Apple MacBook Air 13 inch 2015-03 | |
| Asus Zenbook UX305LA-FC012H | |
| Lenovo U31-70 80M5003EGE | |
| 32 Bit Multi-Core Score | |
| Asus Zenbook UX305UA-FC040T | |
| Apple MacBook Air 13 inch 2015-03 | |
| Asus Zenbook UX305LA-FC012H | |
| Lenovo U31-70 80M5003EGE | |
| Sunspider - 1.0 Total Score | |
| Asus Zenbook UX305CA-EHM1 | |
| Lenovo U31-70 80M5003EGE | |
| Asus Zenbook UX305LA-FC012H | |
| Acer Aspire V3-372-50LK | |
| Dell XPS 13 2016 i7 256GB QHD | |
| Asus Zenbook UX305UA-FC040T | |
| JetStream 1.1 - 1.1 Total | |
| Asus Zenbook UX305UA-FC040T | |
| Lenovo U31-70 80M5003EGE | |
| Mozilla Kraken 1.1 - Total | |
| Asus Zenbook UX305LA-FC012H | |
| Lenovo U31-70 80M5003EGE | |
| Acer Aspire V3-372-50LK | |
| Dell XPS 13 2016 i7 256GB QHD | |
| Asus Zenbook UX305UA-FC040T | |
| Octane V2 - Total Score | |
| Asus Zenbook UX305UA-FC040T | |
| Dell XPS 13 2016 i7 256GB QHD | |
| Acer Aspire V3-372-50LK | |
| Asus Zenbook UX305LA-FC012H | |
| Lenovo U31-70 80M5003EGE | |
| Peacekeeper - --- | |
| Asus Zenbook UX305UA-FC040T | |
| Lenovo U31-70 80M5003EGE | |
| Asus Zenbook UX305LA-FC012H | |
* ... Meglio usare valori piccoli
| PCMark 7 Score | 5389 punti | |
| PCMark 8 Home Score Accelerated v2 | 3341 punti | |
| PCMark 8 Creative Score Accelerated v2 | 3937 punti | |
| PCMark 8 Work Score Accelerated v2 | 4225 punti | |
Aiuto | ||

| 3DMark 11 Performance | 1525 punti | |
| 3DMark Ice Storm Standard Score | 56569 punti | |
| 3DMark Cloud Gate Standard Score | 5734 punti | |
| 3DMark Fire Strike Score | 826 punti | |
Aiuto | ||
| 3DMark 06 - 1280x1024 Standard Score AA:0x AF:0x | |
| Apple MacBook Air 13 inch 2015-03 | |
| Lenovo U31-70 80M5003EGE | |
| Asus Zenbook UX305LA-FC012H | |
| basso | medio | alto | ultra | |
|---|---|---|---|---|
| Tomb Raider (2013) | 67.9 | 33.3 | 21.7 | 10.1 |
| BioShock Infinite (2013) | 46.8 | 25.7 | 21.5 | 6.4 |
| Dirt Rally (2015) | 116.6 | 26.6 | 12.5 | 12.5 |
| XCOM 2 (2016) | 16.3 | 5.2 | 2.9 |
| Tomb Raider - 1366x768 Normal Preset AA:FX AF:4x | |
| Lenovo U31-70 80M5003EGE | |
| Dell XPS 13 2016 i7 256GB QHD | |
| Apple MacBook Air 13 inch 2015-03 | |
| Asus Zenbook UX305UA-FC040T | |
| Asus Zenbook UX305LA-FC012H | |
Rumorosità
| Idle |
| 31.3 / 31.3 / 32.2 dB(A) |
| Sotto carico |
| 37.6 / 38 dB(A) |
 | ||
30 dB silenzioso 40 dB(A) udibile 50 dB(A) rumoroso |
||
min: | ||
| Asus Zenbook UX305UA-FC040T 6500U, HD Graphics 520 | Asus Zenbook UX305LA-FC012H 5500U, HD Graphics 5500 | Dell XPS 13 2016 i7 256GB QHD 6500U, HD Graphics 520 | Lenovo Yoga 900-13ISK 80MK 6500U, HD Graphics 520 | Apple MacBook Air 13 inch 2015-03 5650U, HD Graphics 6000 | Lenovo U31-70 80M5003EGE 5500U, GeForce 920M | Acer Aspire V3-372-50LK 6200U, HD Graphics 520 | |
|---|---|---|---|---|---|---|---|
| Noise | 4% | 1% | 6% | -1% | -7% | 6% | |
| off /ambiente * (dB) | 31.3 | ||||||
| Idle Minimum * (dB) | 31.3 | 29.6 5% | 31.8 -2% | 29.7 5% | 29.2 7% | 31.9 -2% | 31.5 -1% |
| Idle Average * (dB) | 31.3 | 29.6 5% | 31.8 -2% | 29.8 5% | 29.2 7% | 32.3 -3% | 31.5 -1% |
| Idle Maximum * (dB) | 32.2 | 29.6 8% | 34.8 -8% | 30 7% | 29.2 9% | 32.3 -0% | 31.5 2% |
| Load Average * (dB) | 37.6 | 39.3 -5% | 34.8 7% | 32 15% | 40.2 -7% | 40.8 -9% | 32.4 14% |
| Load Maximum * (dB) | 38 | 36 5% | 34.8 8% | 38.5 -1% | 46.3 -22% | 46.6 -23% | 32.3 15% |
* ... Meglio usare valori piccoli
(±) La temperatura massima sul lato superiore è di 40.8 °C / 105 F, rispetto alla media di 35.9 °C / 97 F, che varia da 21.4 a 59 °C per questa classe Subnotebook.
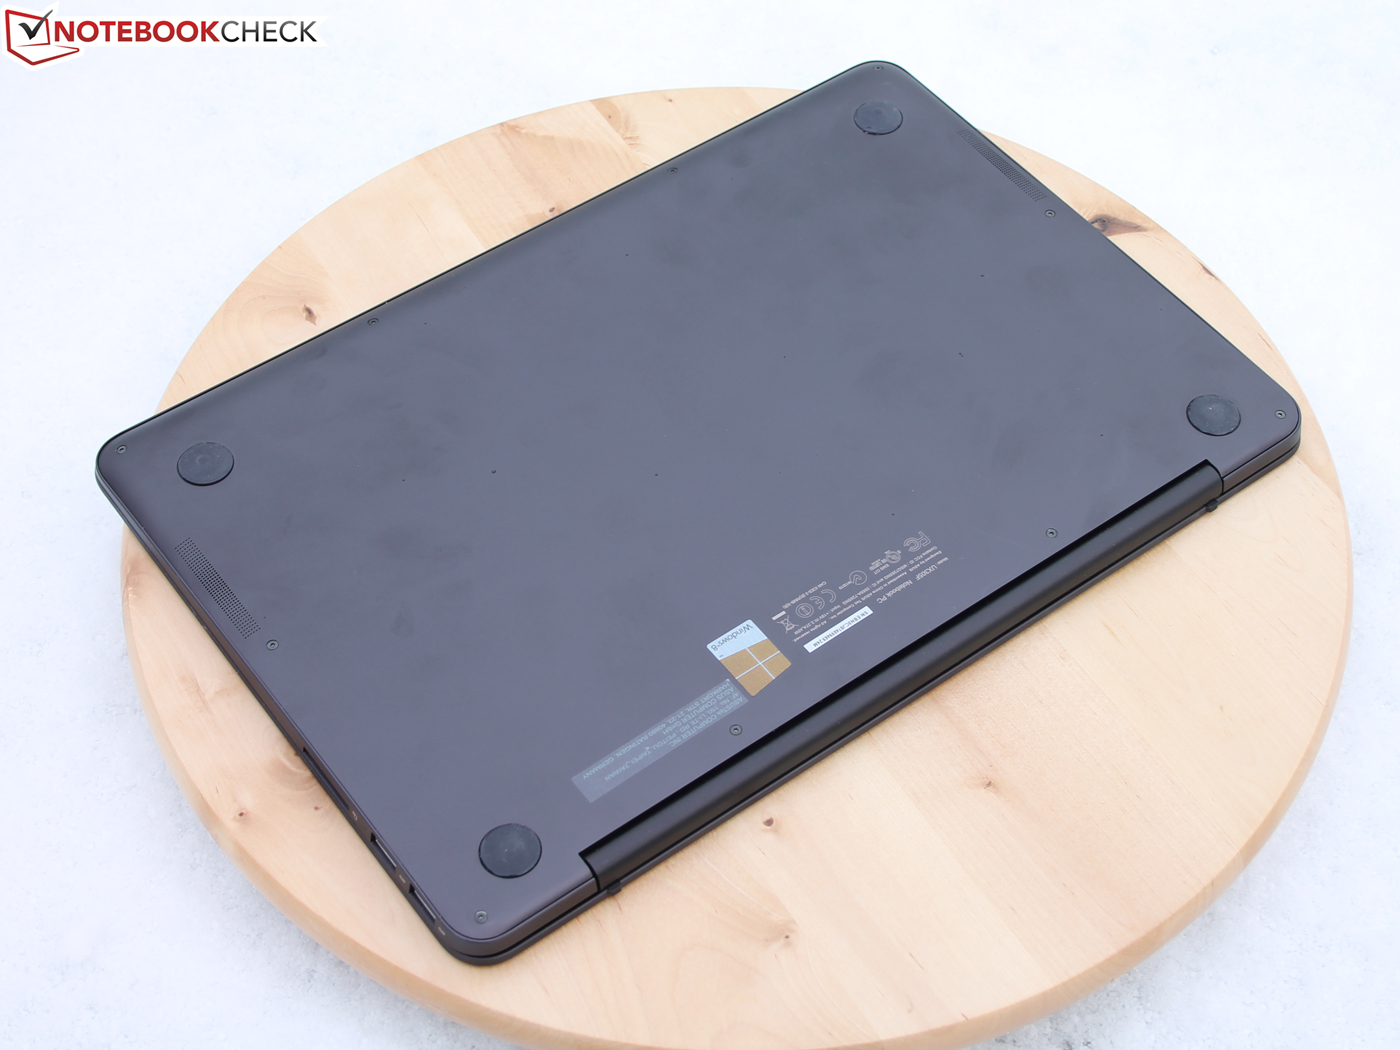
(+) Il lato inferiore si riscalda fino ad un massimo di 37 °C / 99 F, rispetto alla media di 39.2 °C / 103 F
(+) In idle, la temperatura media del lato superiore è di 24.1 °C / 75 F, rispetto alla media deld ispositivo di 30.8 °C / 87 F.
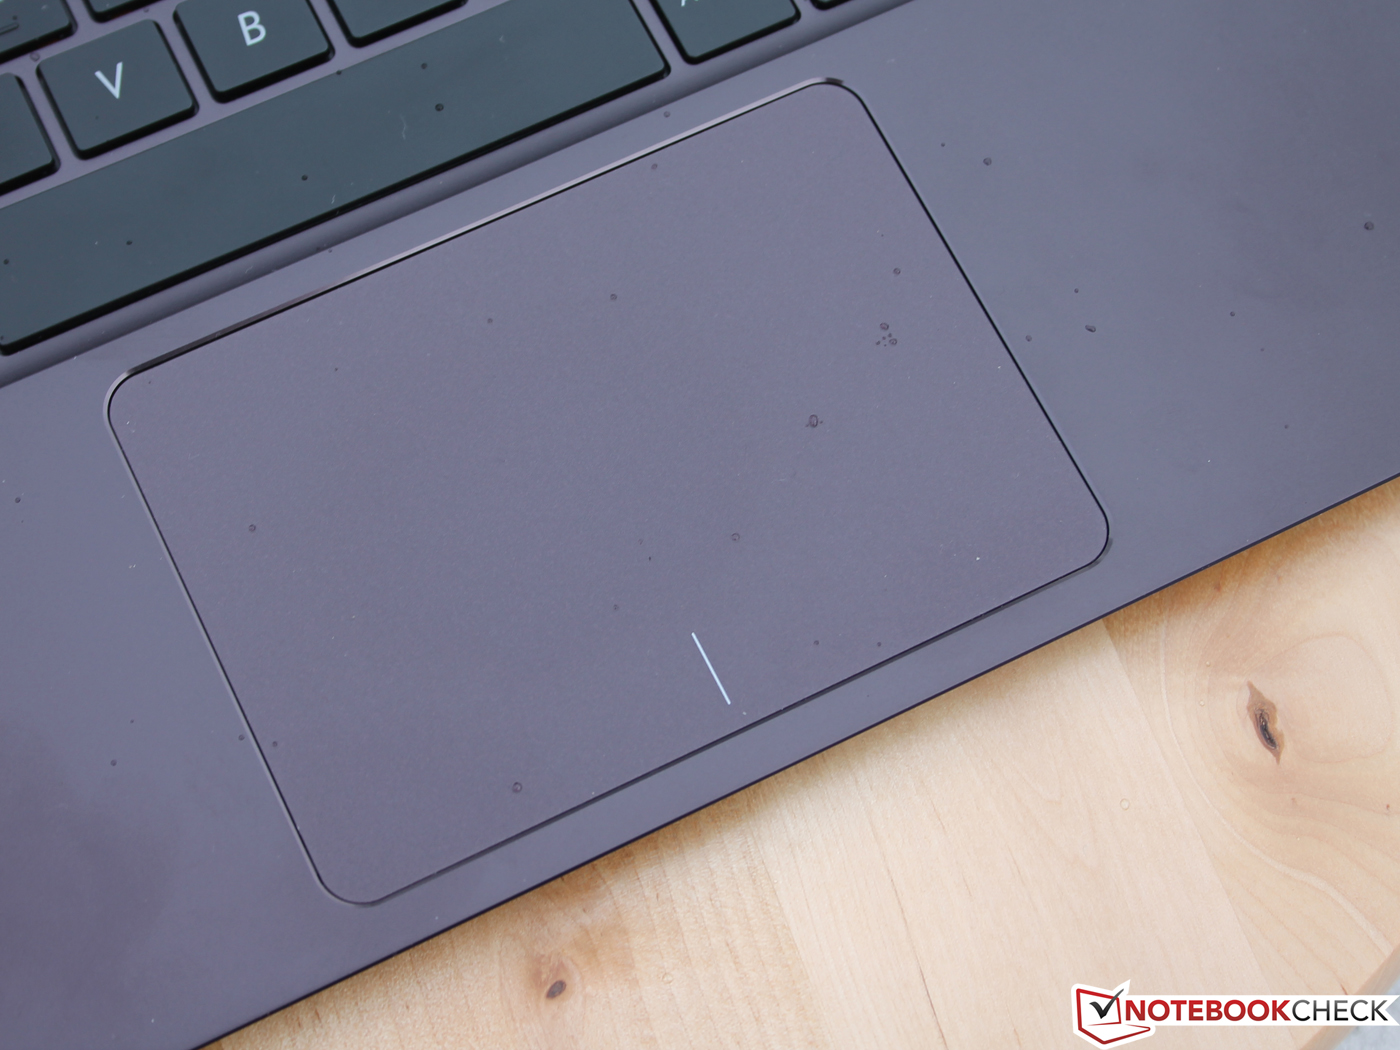
(+) I poggiapolsi e il touchpad sono piu' freddi della temperatura della pelle con un massimo di 27.6 °C / 81.7 F e sono quindi freddi al tatto.
(±) La temperatura media della zona del palmo della mano di dispositivi simili e'stata di 28.2 °C / 82.8 F (+0.6 °C / 1.1 F).
| Asus Zenbook UX305UA-FC040T 6500U, HD Graphics 520 | Asus Zenbook UX305LA-FC012H 5500U, HD Graphics 5500 | Asus Zenbook UX305CA-EHM1 6Y30, HD Graphics 515 | Dell XPS 13 2016 i7 256GB QHD 6500U, HD Graphics 520 | Lenovo Yoga 900-13ISK 80MK 6500U, HD Graphics 520 | Apple MacBook Air 13 inch 2015-03 5650U, HD Graphics 6000 | Lenovo U31-70 80M5003EGE 5500U, GeForce 920M | Acer Aspire V3-372-50LK 6200U, HD Graphics 520 | |
|---|---|---|---|---|---|---|---|---|
| Heat | -9% | 9% | -41% | 0% | -13% | -16% | -27% | |
| Maximum Upper Side * (°C) | 40.8 | 45.9 -13% | 34.6 15% | 57 -40% | 37.4 8% | 43.8 -7% | 40.8 -0% | 49.3 -21% |
| Maximum Bottom * (°C) | 37 | 45 -22% | 35.2 5% | 56 -51% | 36.4 2% | 42.1 -14% | 43.8 -18% | 53.3 -44% |
| Idle Upper Side * (°C) | 25.2 | 25.6 -2% | 22.6 10% | 34.1 -35% | 26.6 -6% | 28.5 -13% | 29.8 -18% | 28.2 -12% |
| Idle Bottom * (°C) | 24.9 | 25 -0% | 23.4 6% | 34.3 -38% | 25.6 -3% | 28.9 -16% | 31.5 -27% | 32.6 -31% |
* ... Meglio usare valori piccoli
| Off / Standby | |
| Idle | |
| Sotto carico |
|
Leggenda:
min: | |
| Asus Zenbook UX305UA-FC040T 6500U, HD Graphics 520 | Asus Zenbook UX305LA-FC012H 5500U, HD Graphics 5500 | Dell XPS 13 2016 i7 256GB QHD 6500U, HD Graphics 520 | Apple MacBook Air 13 inch 2015-03 5650U, HD Graphics 6000 | Lenovo U31-70 80M5003EGE 5500U, GeForce 920M | Acer Aspire V3-372-50LK 6200U, HD Graphics 520 | |
|---|---|---|---|---|---|---|
| Power Consumption | 8% | -46% | 3% | -25% | -7% | |
| Idle Minimum * (Watt) | 3.2 | 2.6 19% | 6.8 -113% | 2.7 16% | 3.9 -22% | 3.8 -19% |
| Idle Average * (Watt) | 6.5 | 6.2 5% | 10 -54% | 5.7 12% | 6.8 -5% | 5.8 11% |
| Idle Maximum * (Watt) | 6.7 | 6.5 3% | 10.5 -57% | 6 10% | 7 -4% | 8.1 -21% |
| Load Average * (Watt) | 30.6 | 30.8 -1% | 30.2 1% | 32.1 -5% | 40 -31% | 30.2 1% |
| Load Maximum * (Watt) | 31 | 27 13% | 33.6 -8% | 36.2 -17% | 51 -65% | 32.4 -5% |
* ... Meglio usare valori piccoli
| Asus Zenbook UX305UA-FC040T 56 Wh | Asus Zenbook UX305LA-FC012H 56 Wh | Asus Zenbook UX305CA-EHM1 45 Wh | Dell XPS 13 2016 i7 256GB QHD 56 Wh | Lenovo Yoga 900-13ISK 80MK 66 Wh | Apple MacBook Air 13 inch 2015-03 54 Wh | Lenovo U31-70 80M5003EGE 35 Wh | Acer Aspire V3-372-50LK 51 Wh | |
|---|---|---|---|---|---|---|---|---|
| Autonomia della batteria | 0% | 7% | -28% | -22% | 0% | -52% | -20% | |
| Reader / Idle (h) | 23.8 | 24.5 3% | 17.5 -26% | 13.1 -45% | 14.1 -41% | 26.2 10% | 8.8 -63% | 15.1 -37% |
| H.264 (h) | 9.1 | 9.7 7% | 4.6 -49% | |||||
| WiFi v1.3 (h) | 9.4 | 9.5 1% | 6.4 -32% | 7.2 -23% | 6.7 -29% | 10.3 10% | 4.2 -55% | 5.8 -38% |
| Load (h) | 2 | 1.8 -10% | 3.6 80% | 1.7 -15% | 2.1 5% | 1.6 -20% | 1.2 -40% | 2.3 15% |
Pro
Contro
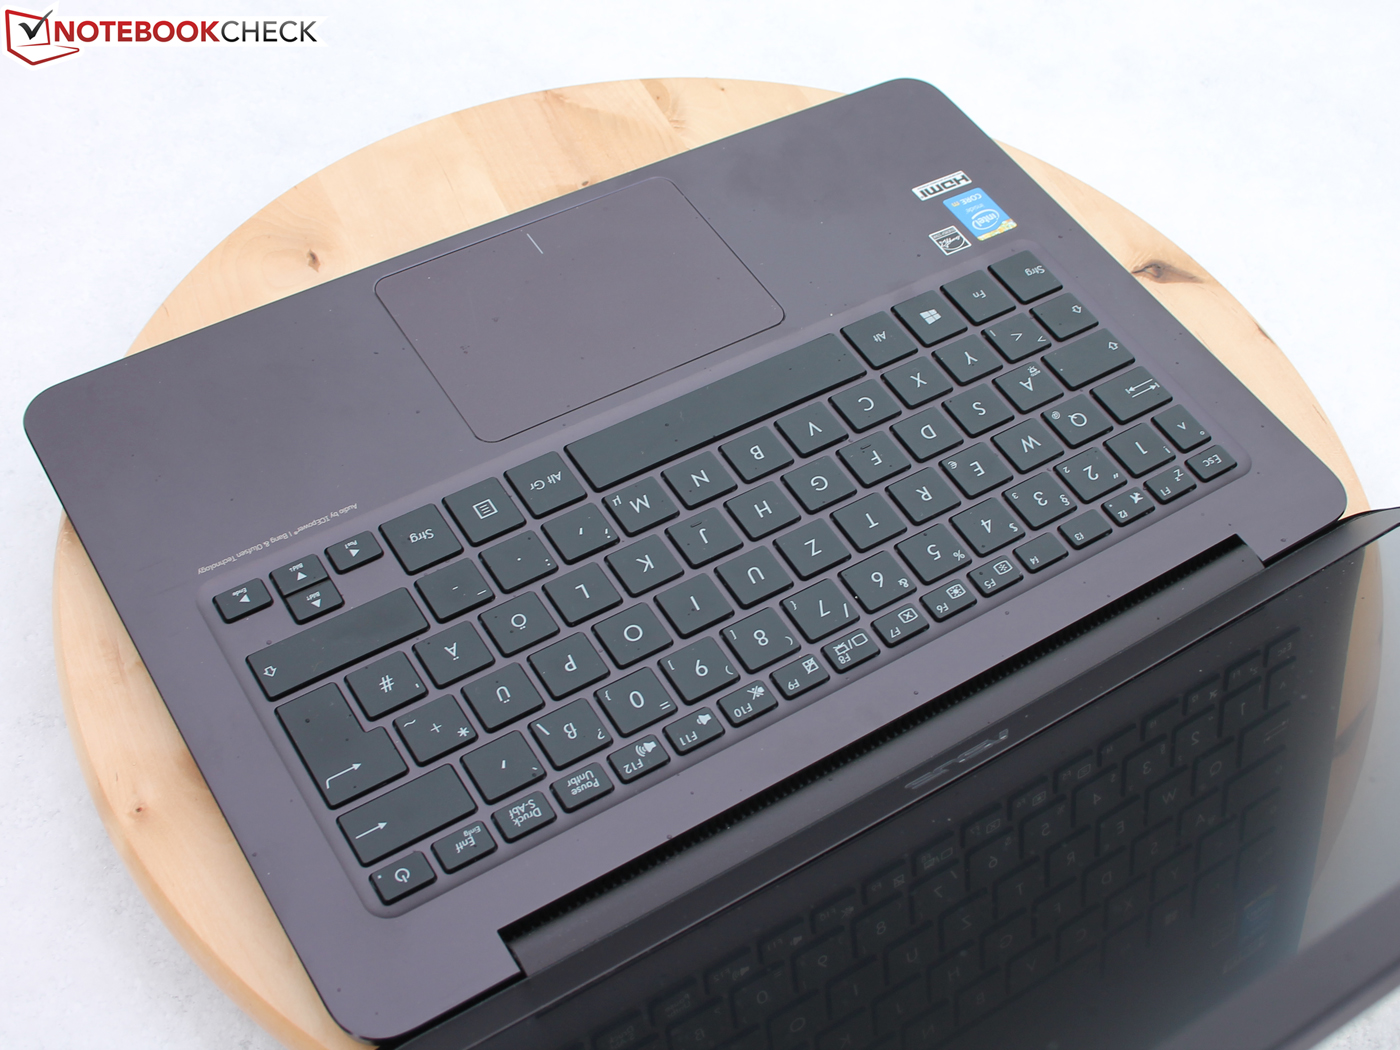
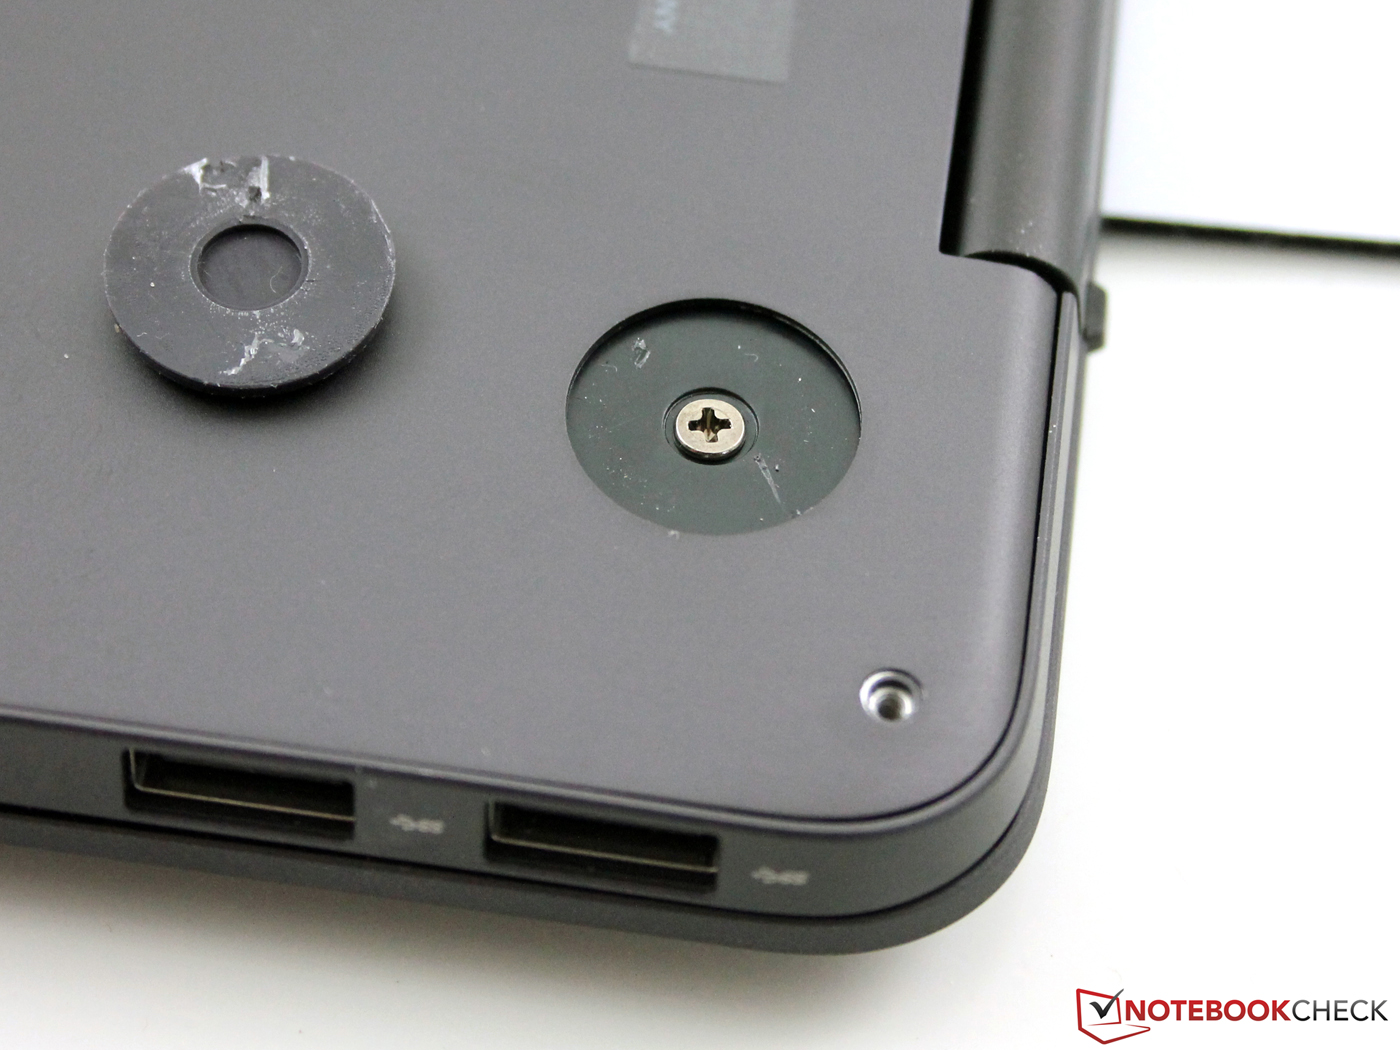
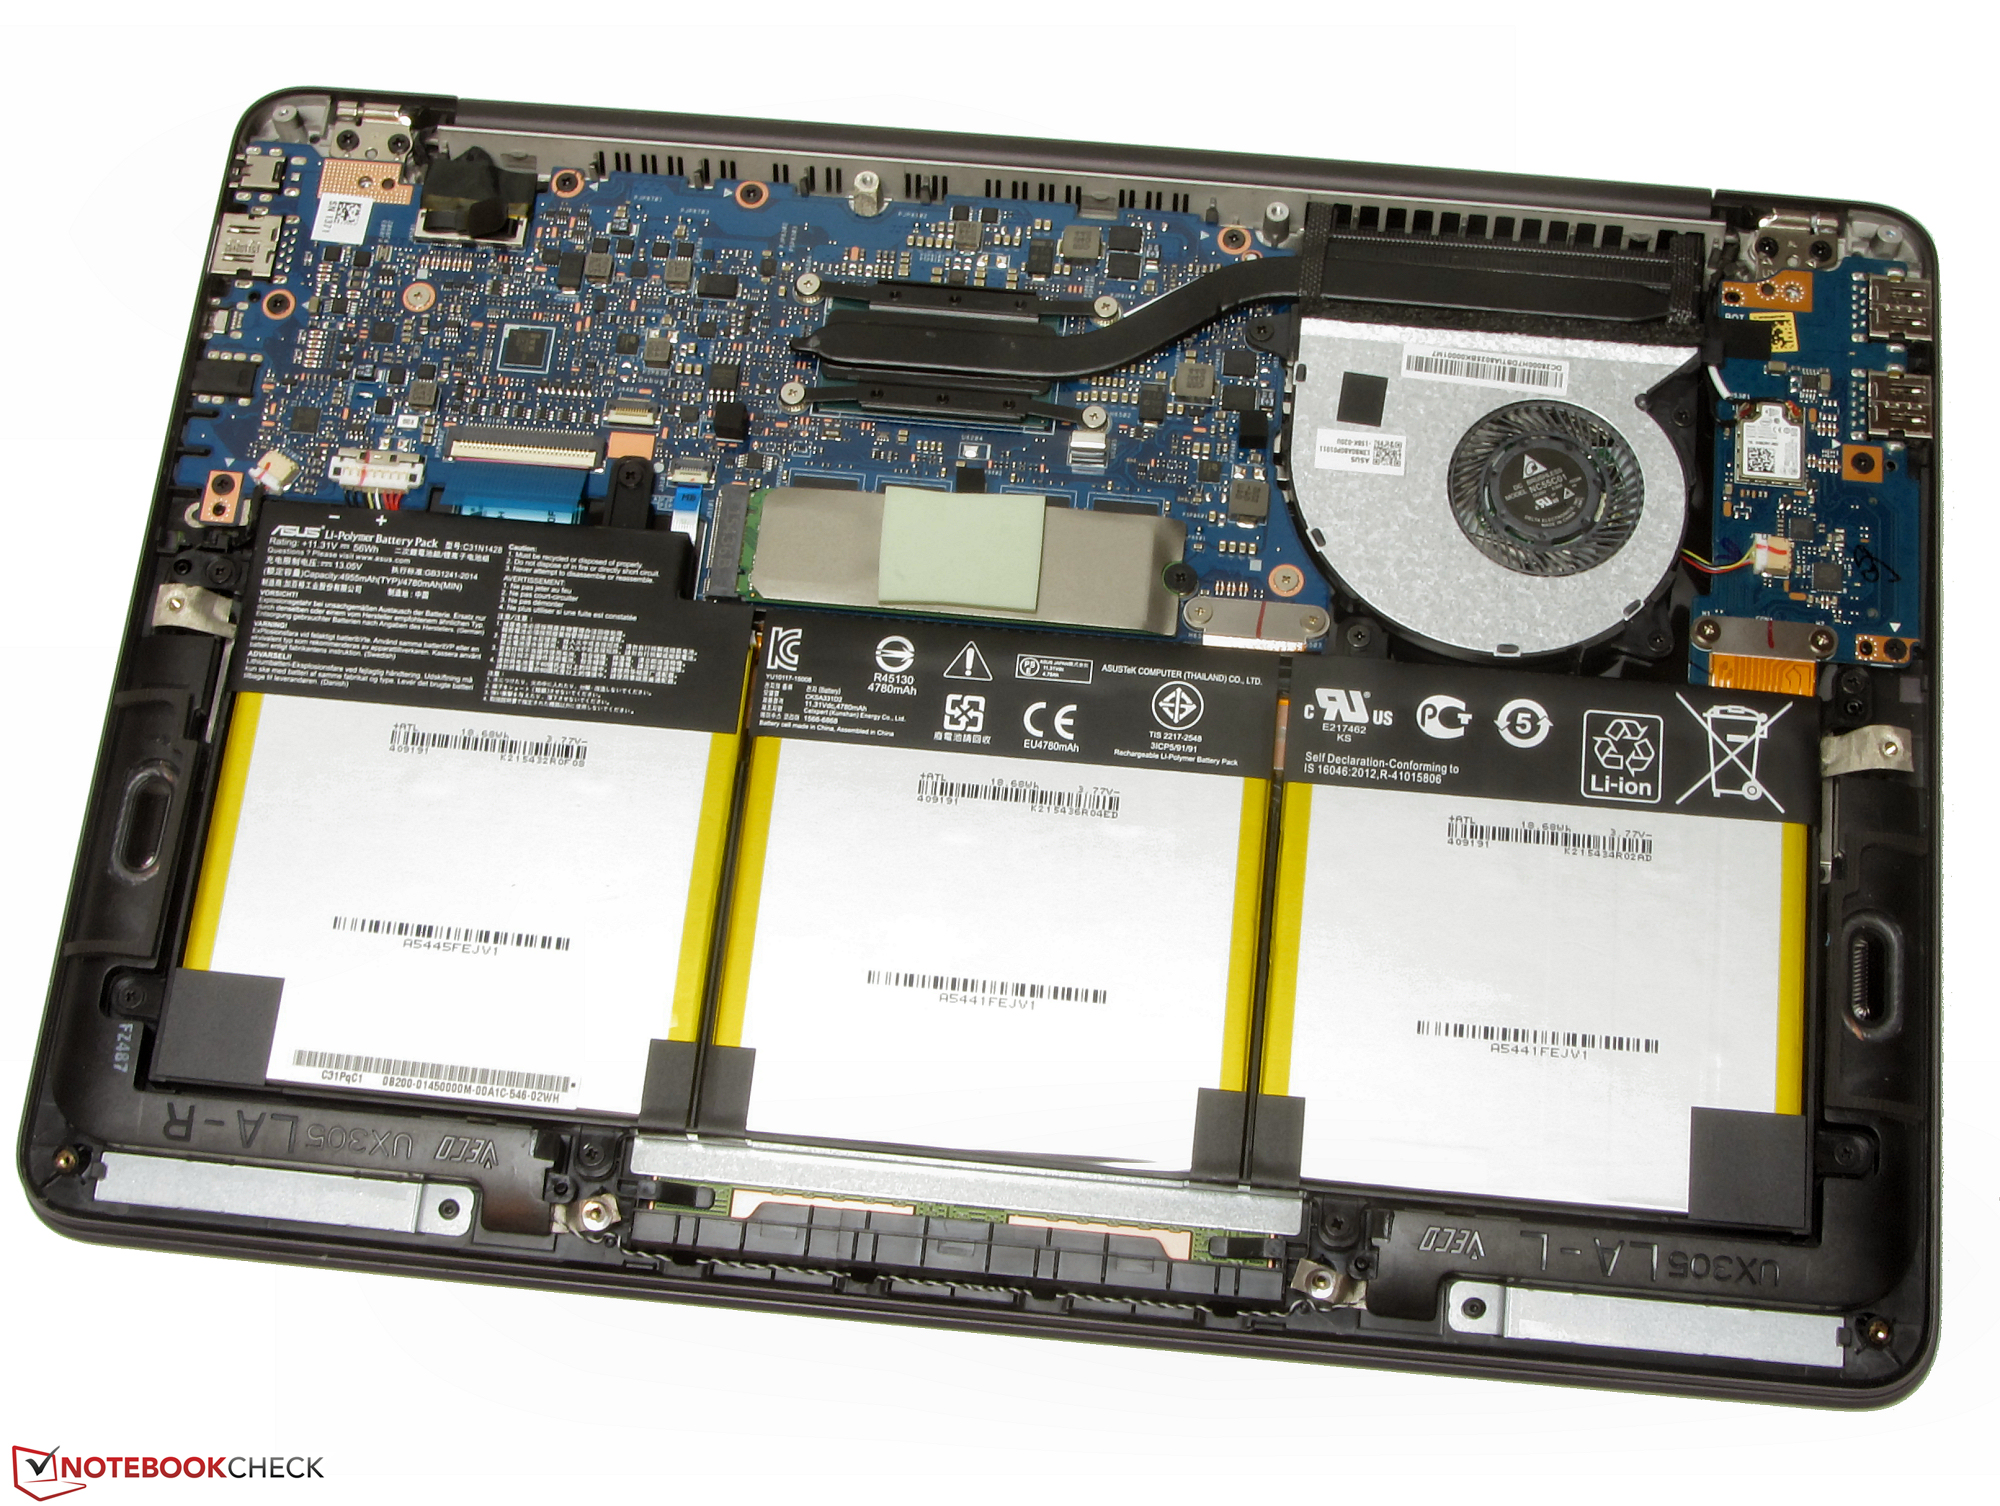
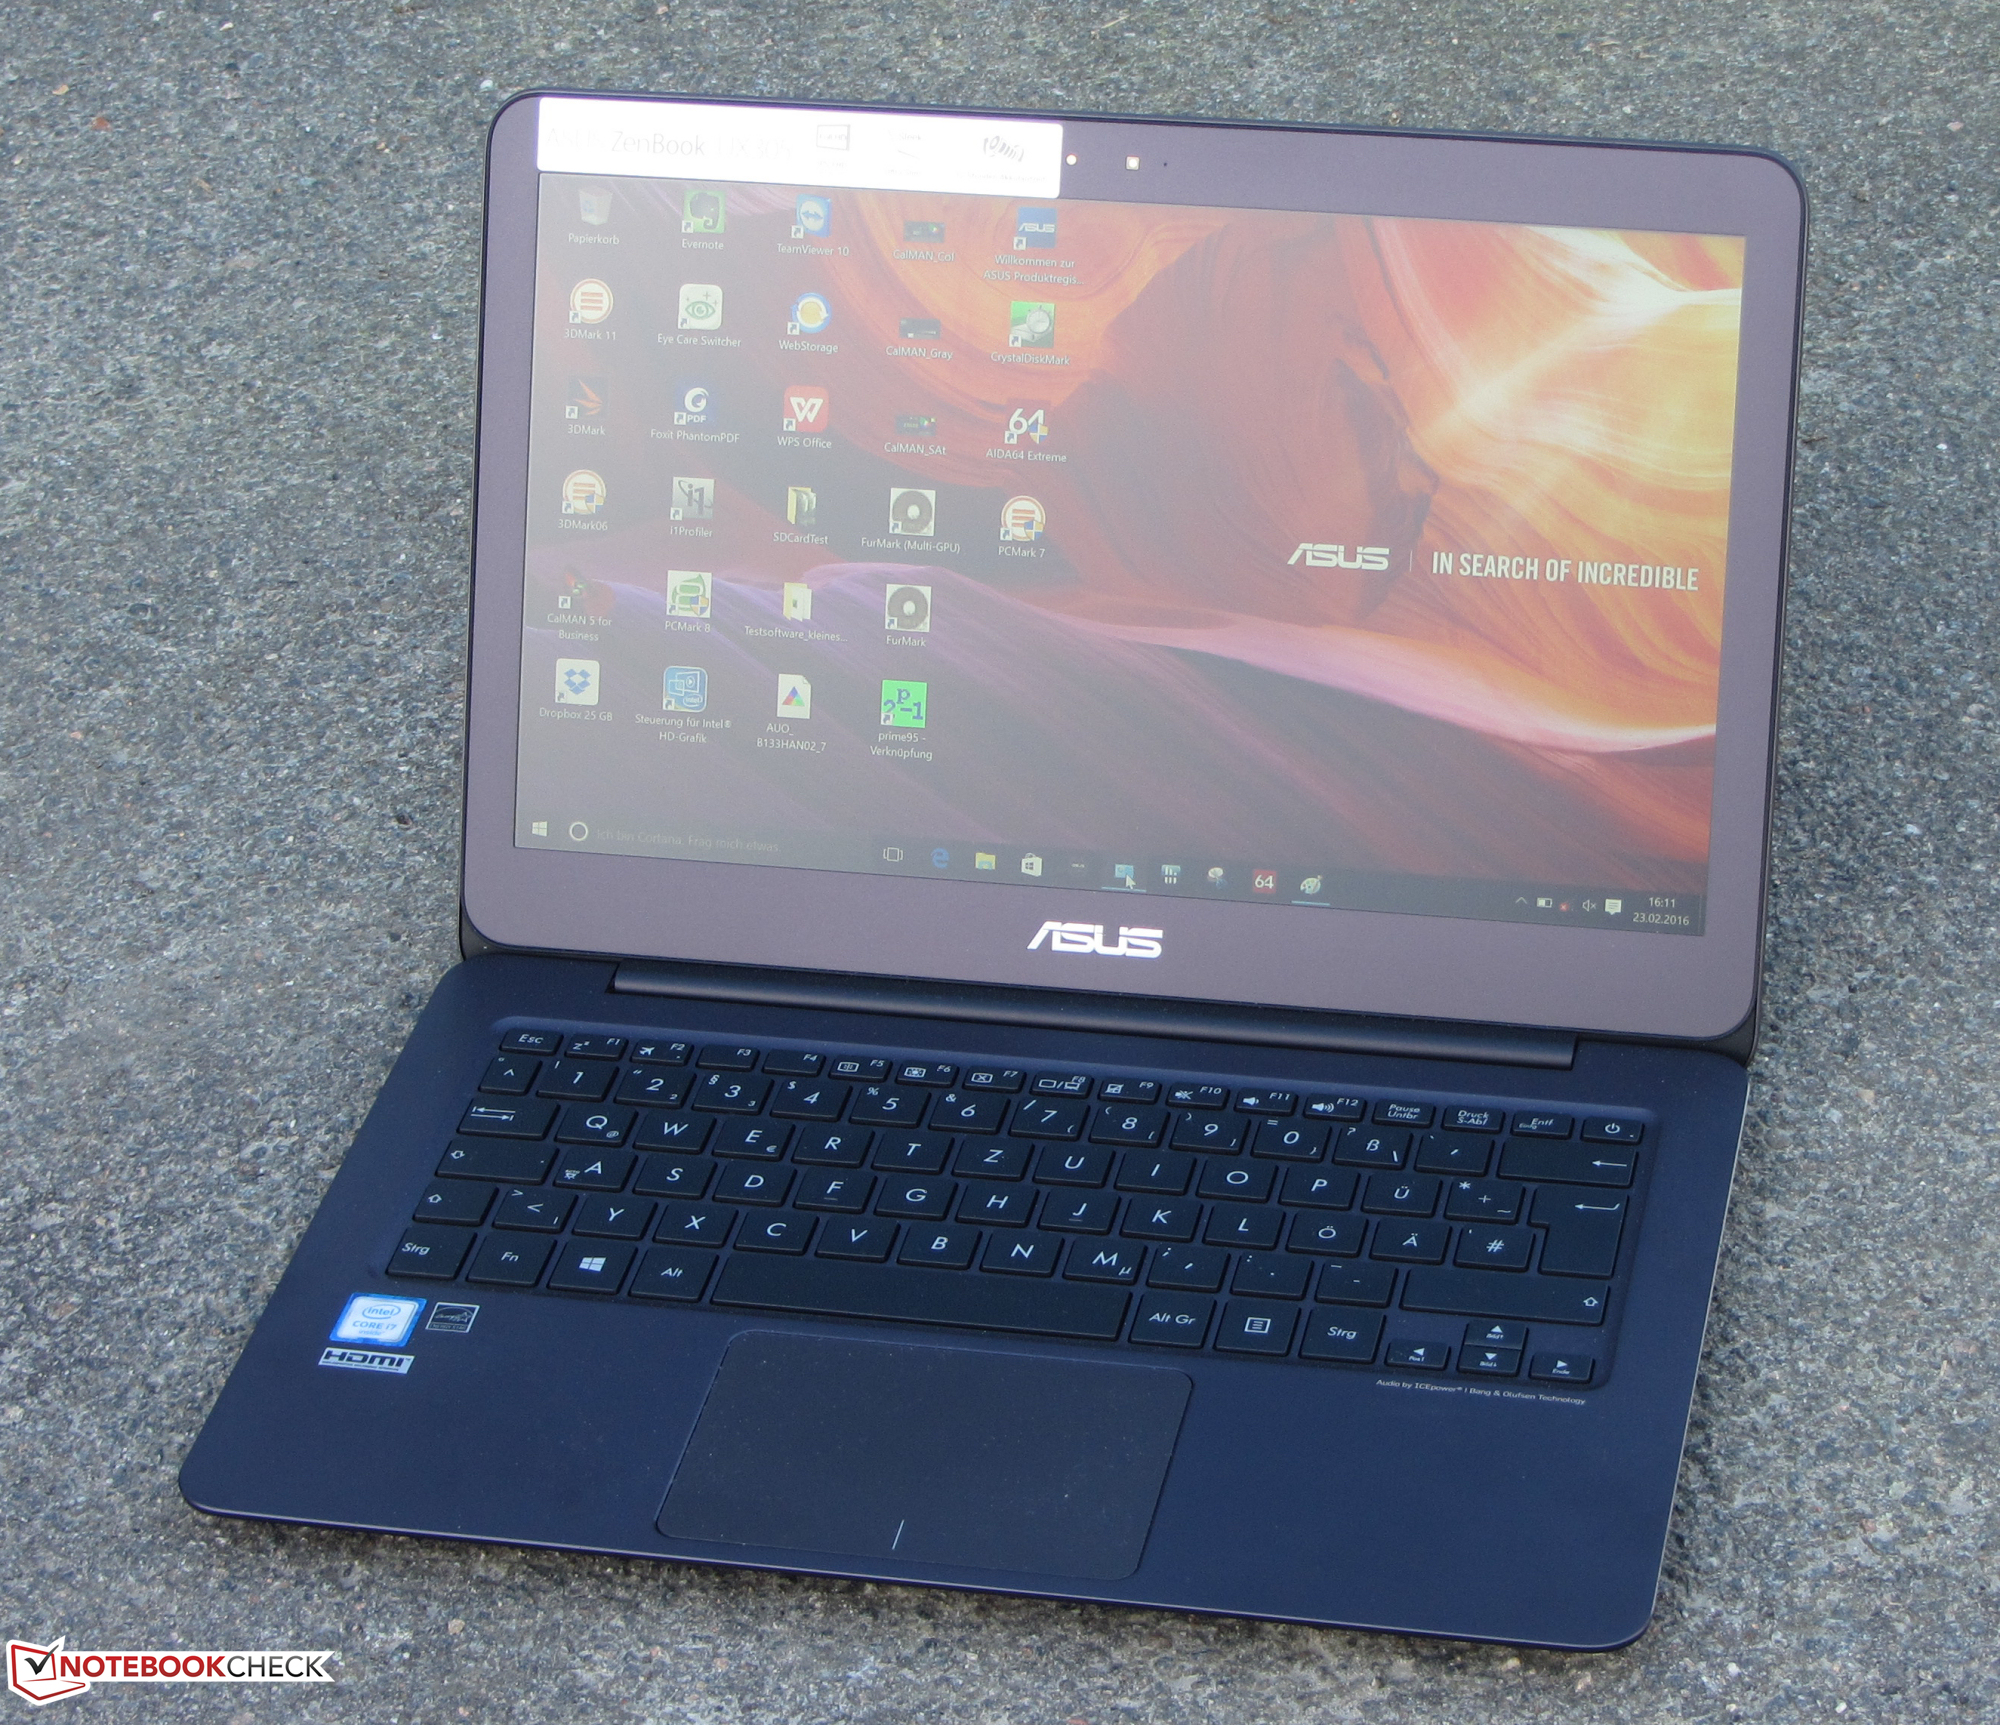
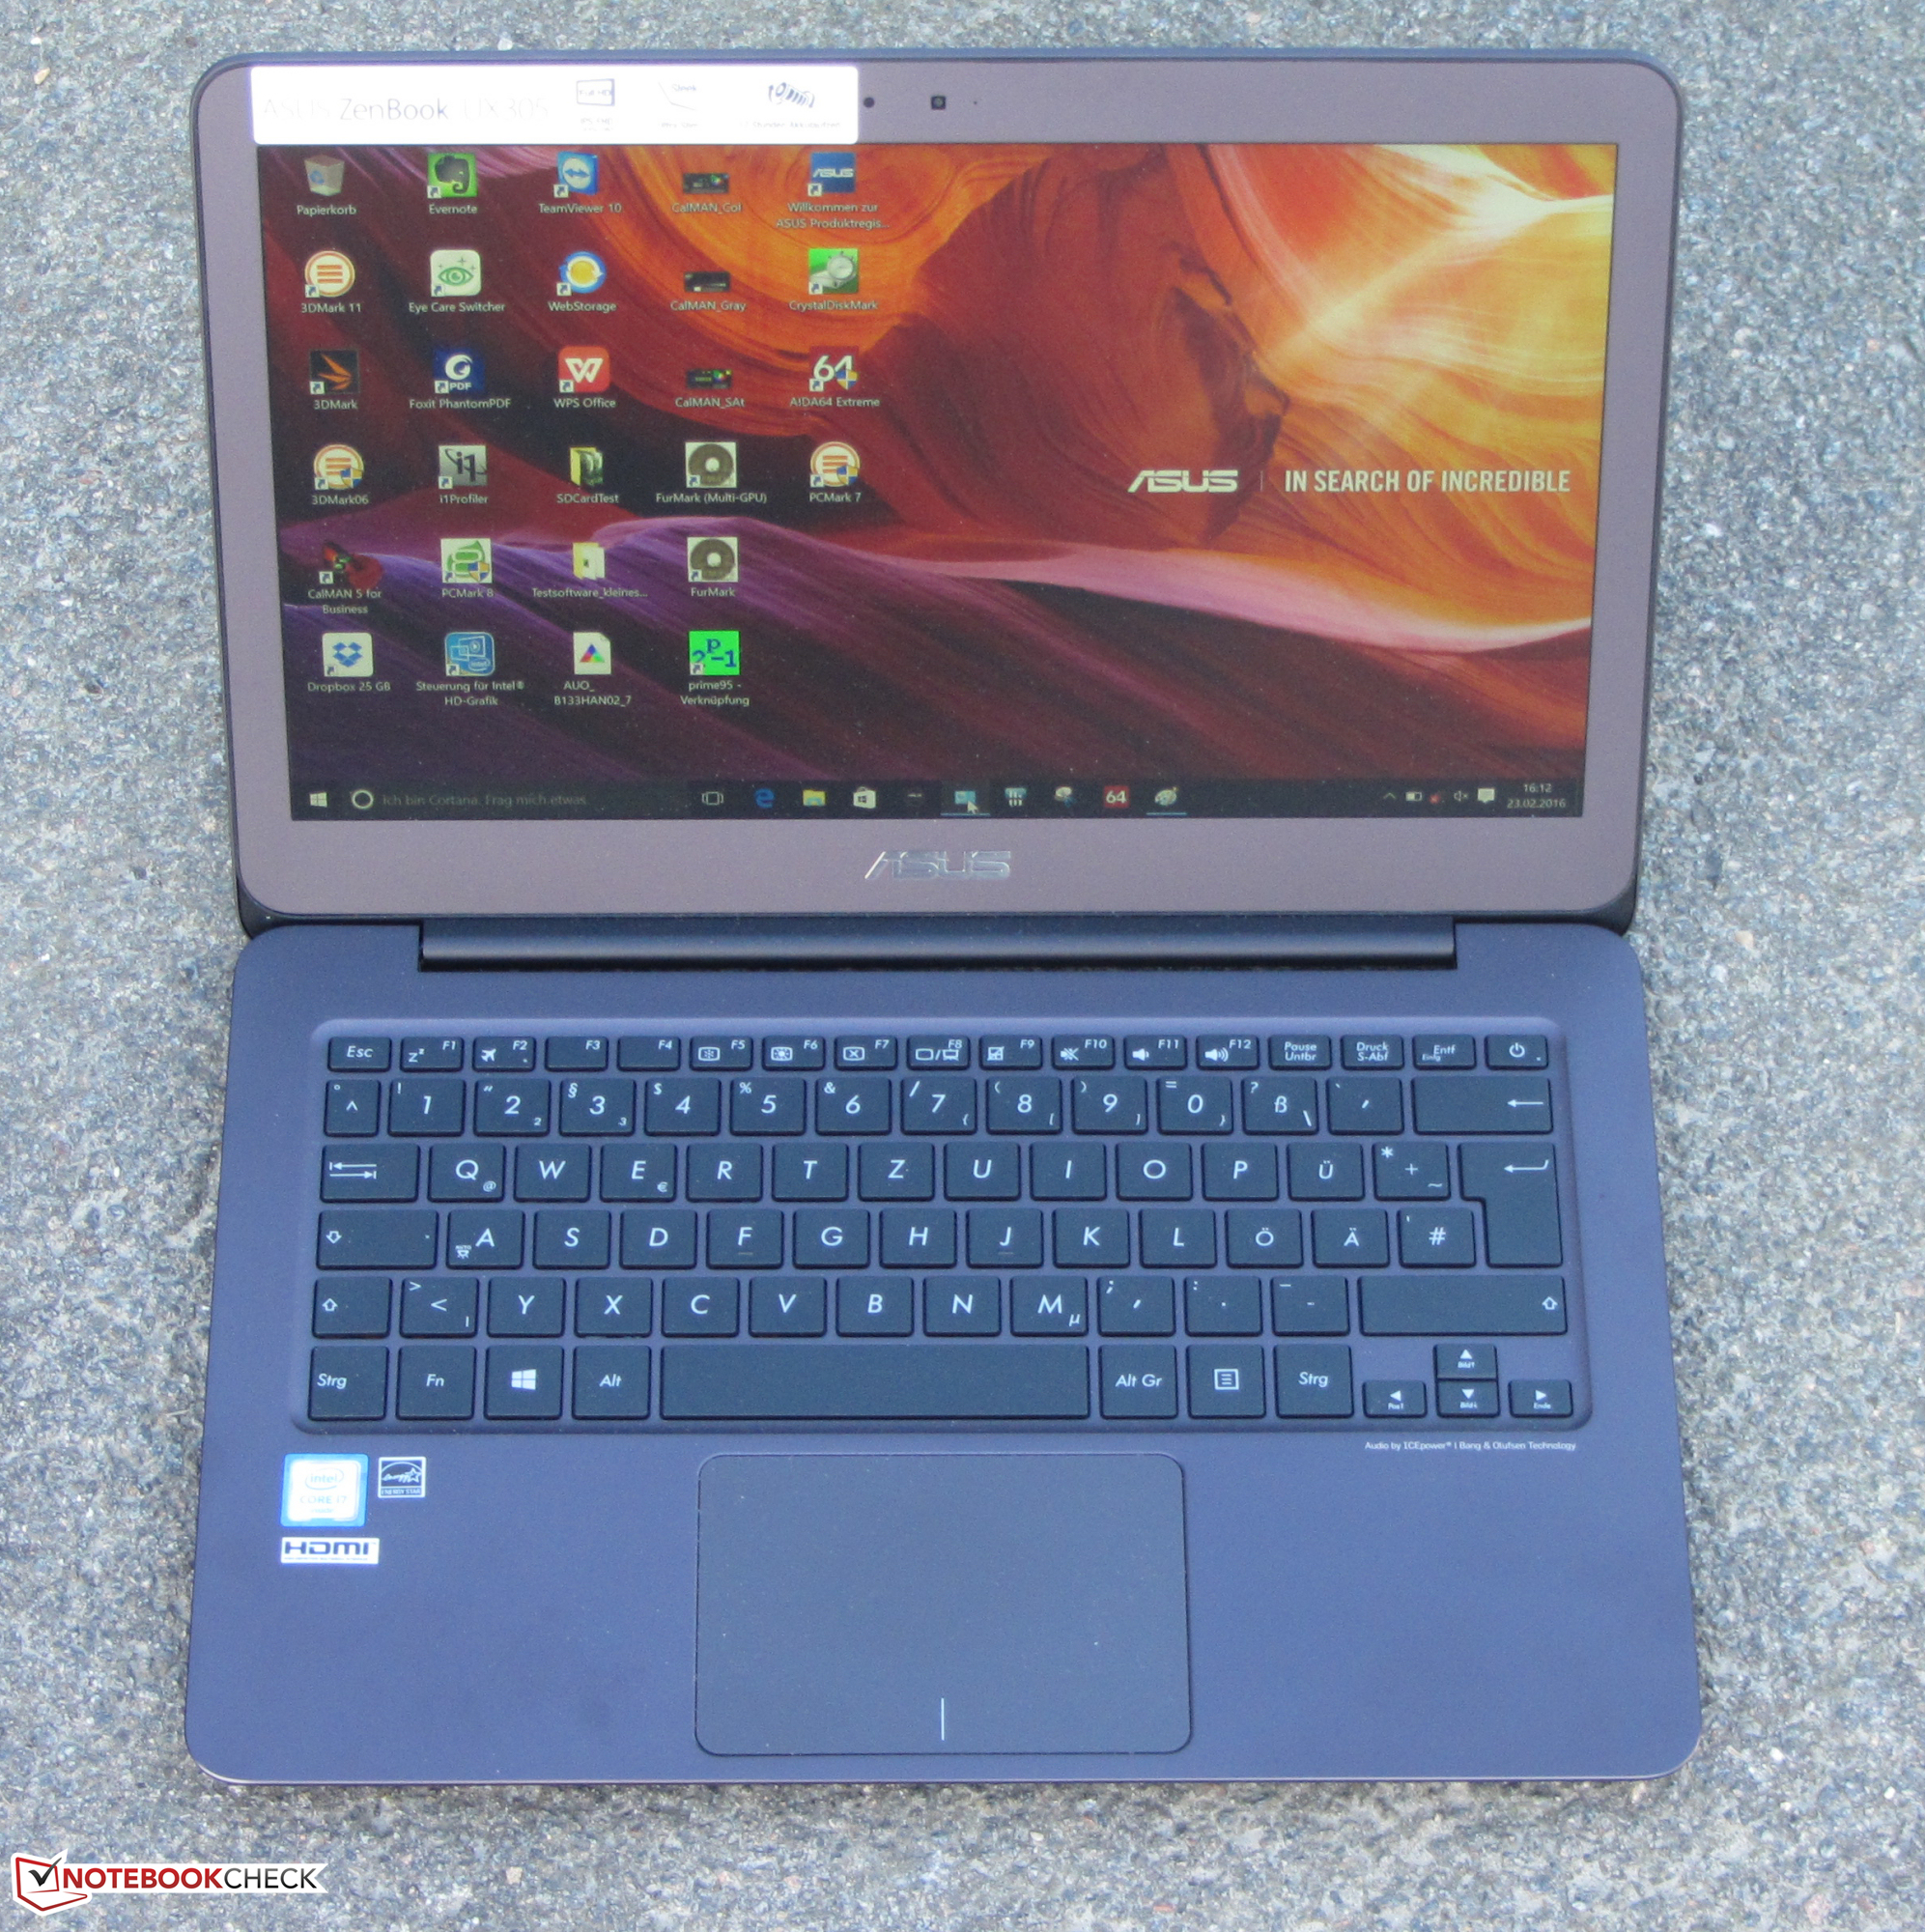
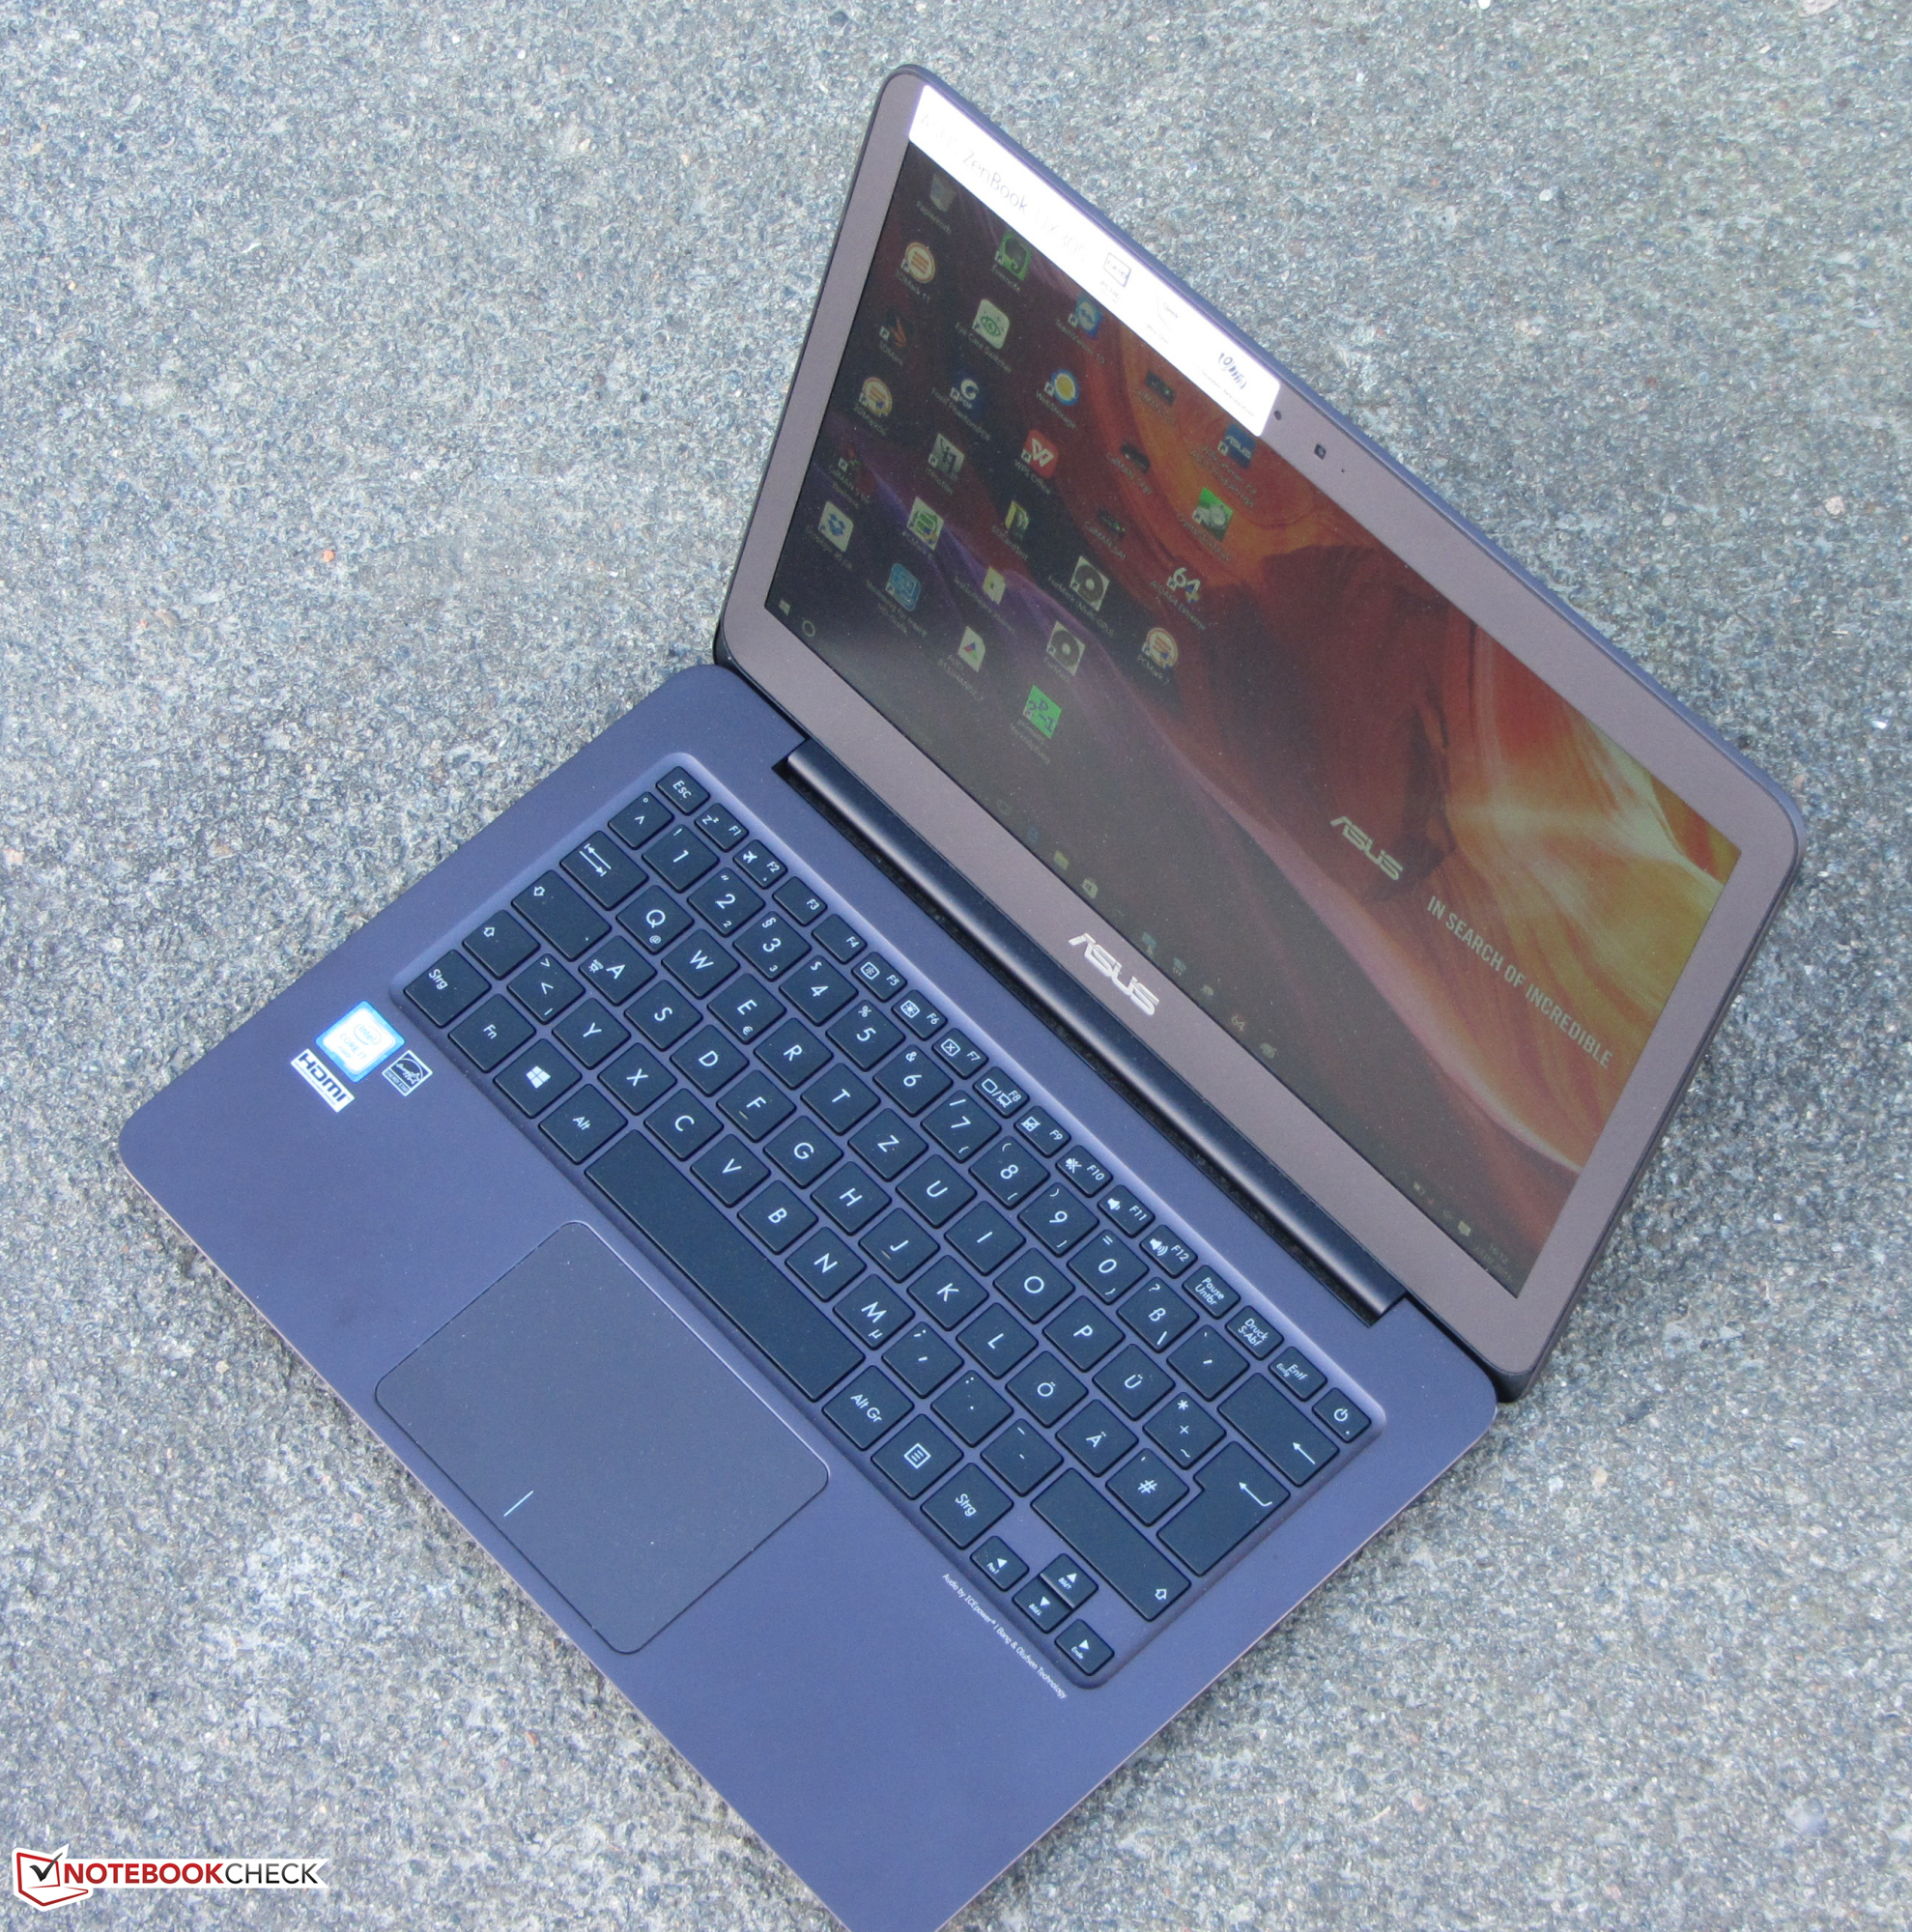
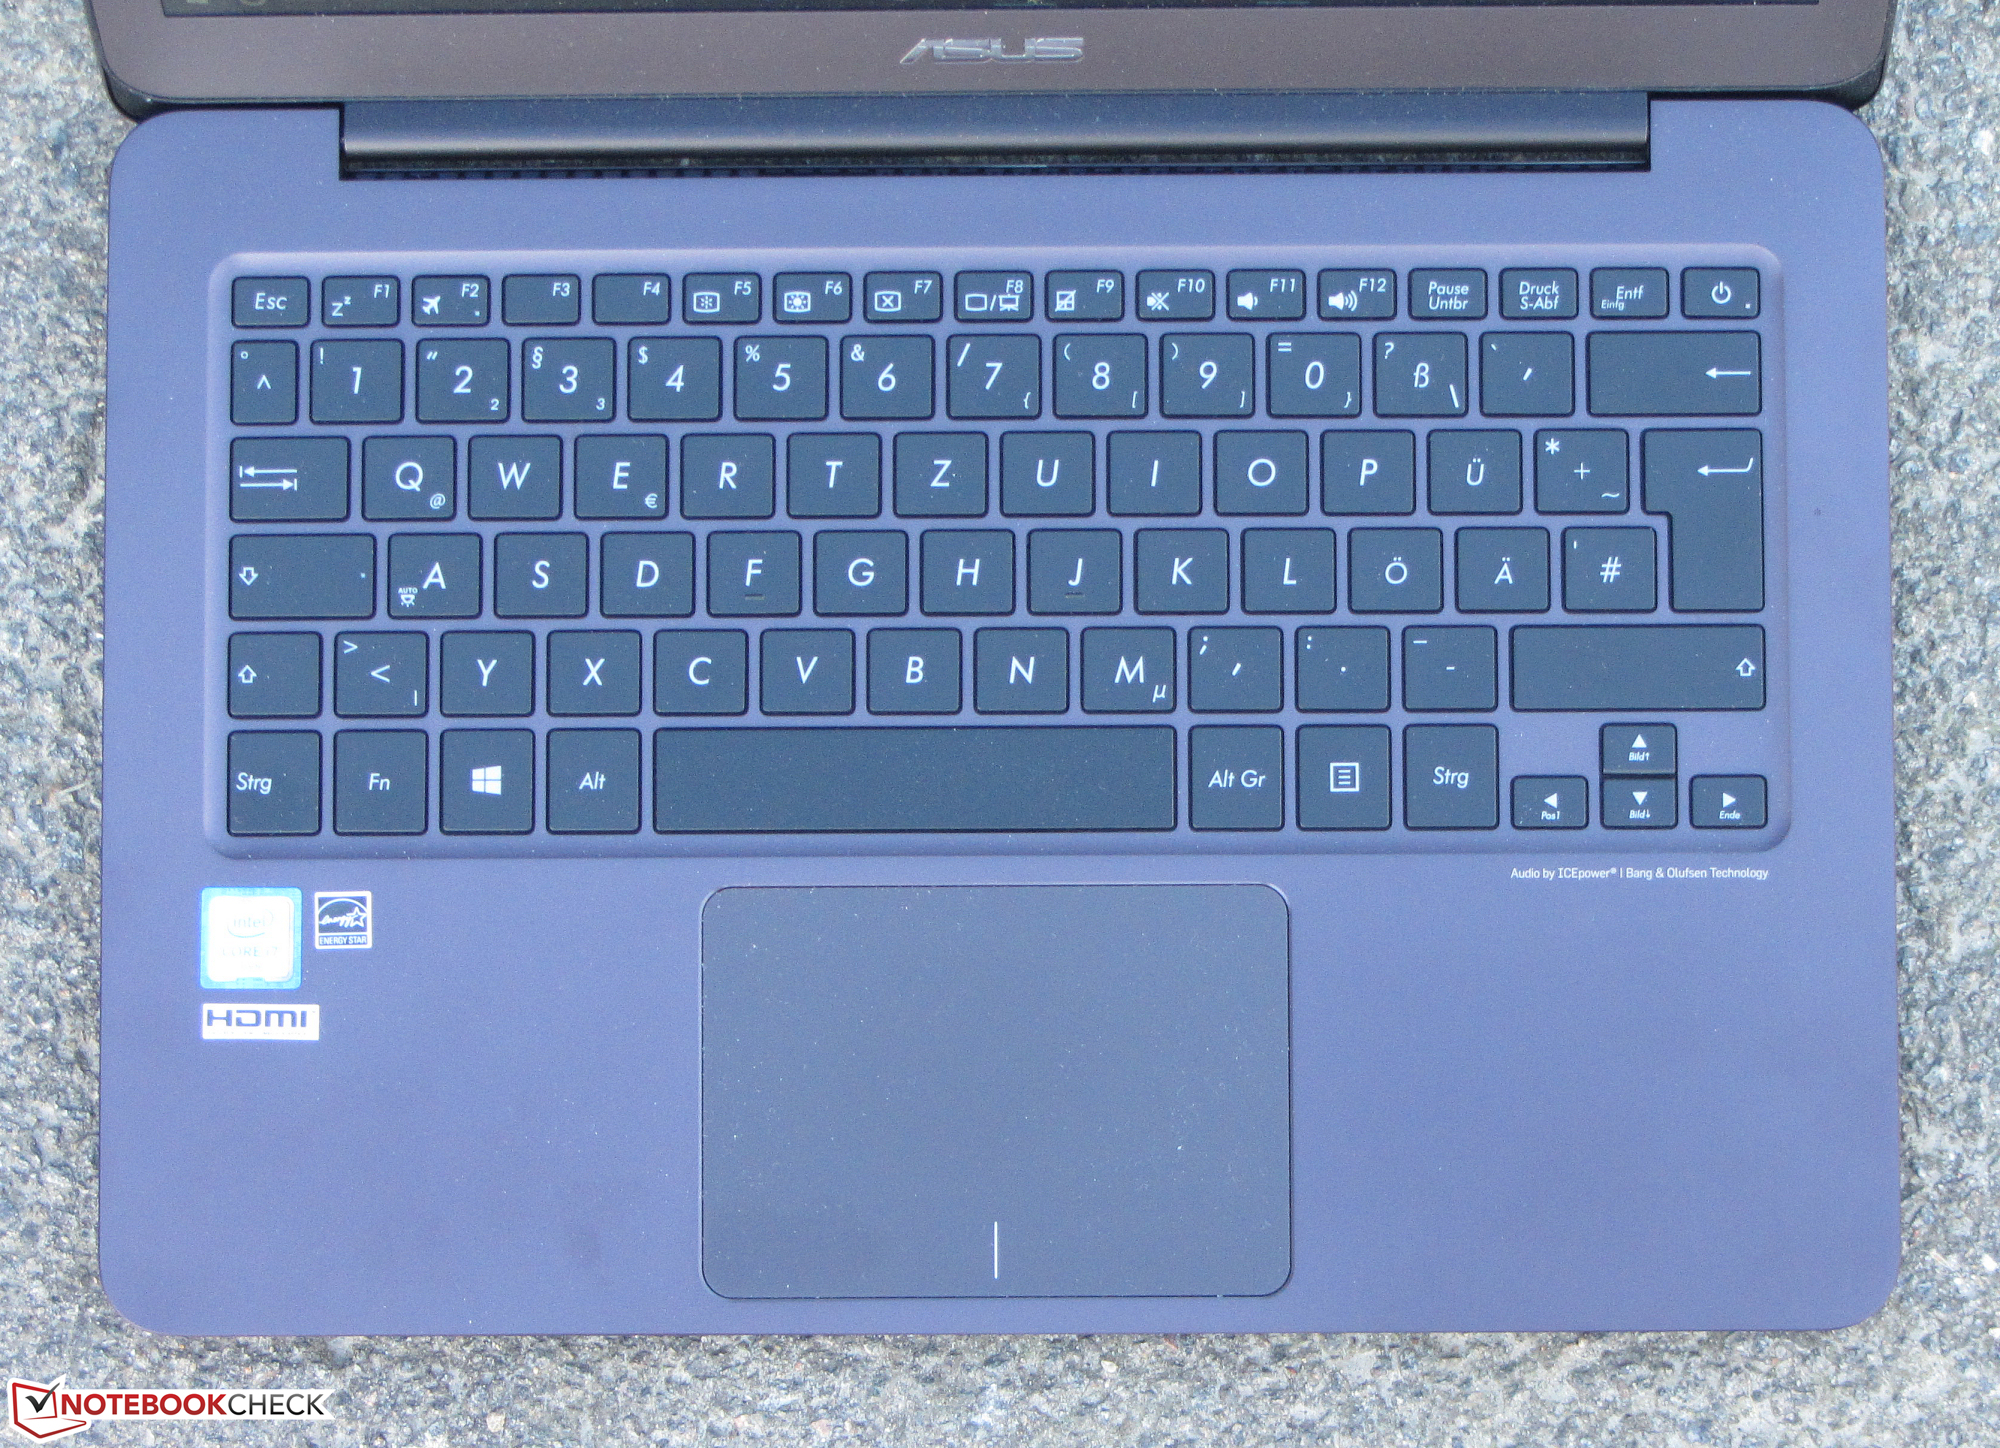
L'Asus Zenbook UX305UA ha una CPU dalle performance elevate e con capacità gaming. Tuttavia, di solito è silenzioso e si scalda poco. Un veloce SSD rende il sistema reattivo. Il computer non manca di spazio di archiviazione. L'SSD ha una capacità di 512 GB. Se necessario, l'SSD può essere sostituito. Mentre lo Zenbook non ha una cover per la manutenzione ed occorre rimuovere il pannello inferiore. In aggiunta, abbiamo apprezzato gli angoli di visuale del display IPS. La luminosità è elevata ed il contrasto è buono. La tastiera è buona come la precedente. E' adatta a chi scrive molto. Tuttavia non abbiamo capito perché Asus non monta una retroilluminazione questa volta. Avrebbe reso il tutto più completo.
In sintesi: lo Skylake Zenbook ha prestazioni superiori senza impatti negativi sull'autonomia.
Asus adotta due approcci nella sua serie Zenbook UX305. I modelli Core i hanno prestazioni CPU supeiori e autonomia maggiore. I modelli Core M non reggono il confronto da questo punto di vista. In cambio sono silenziosi e più economici. Dipende dall'utente quale aspetto sia prevalente. A breve Notebookcheck.com pubblicherà la recensione del nuovo modello Zenbook UX305 con processore Skylake Core M7.
Nota: si tratta di una recensione breve, con alcune sezioni non tradotte, per la versione integrale in inglese guardate qui.
Asus Zenbook UX305UA-FC040T
- 02/26/2016 v5 (old)
Sascha Mölck