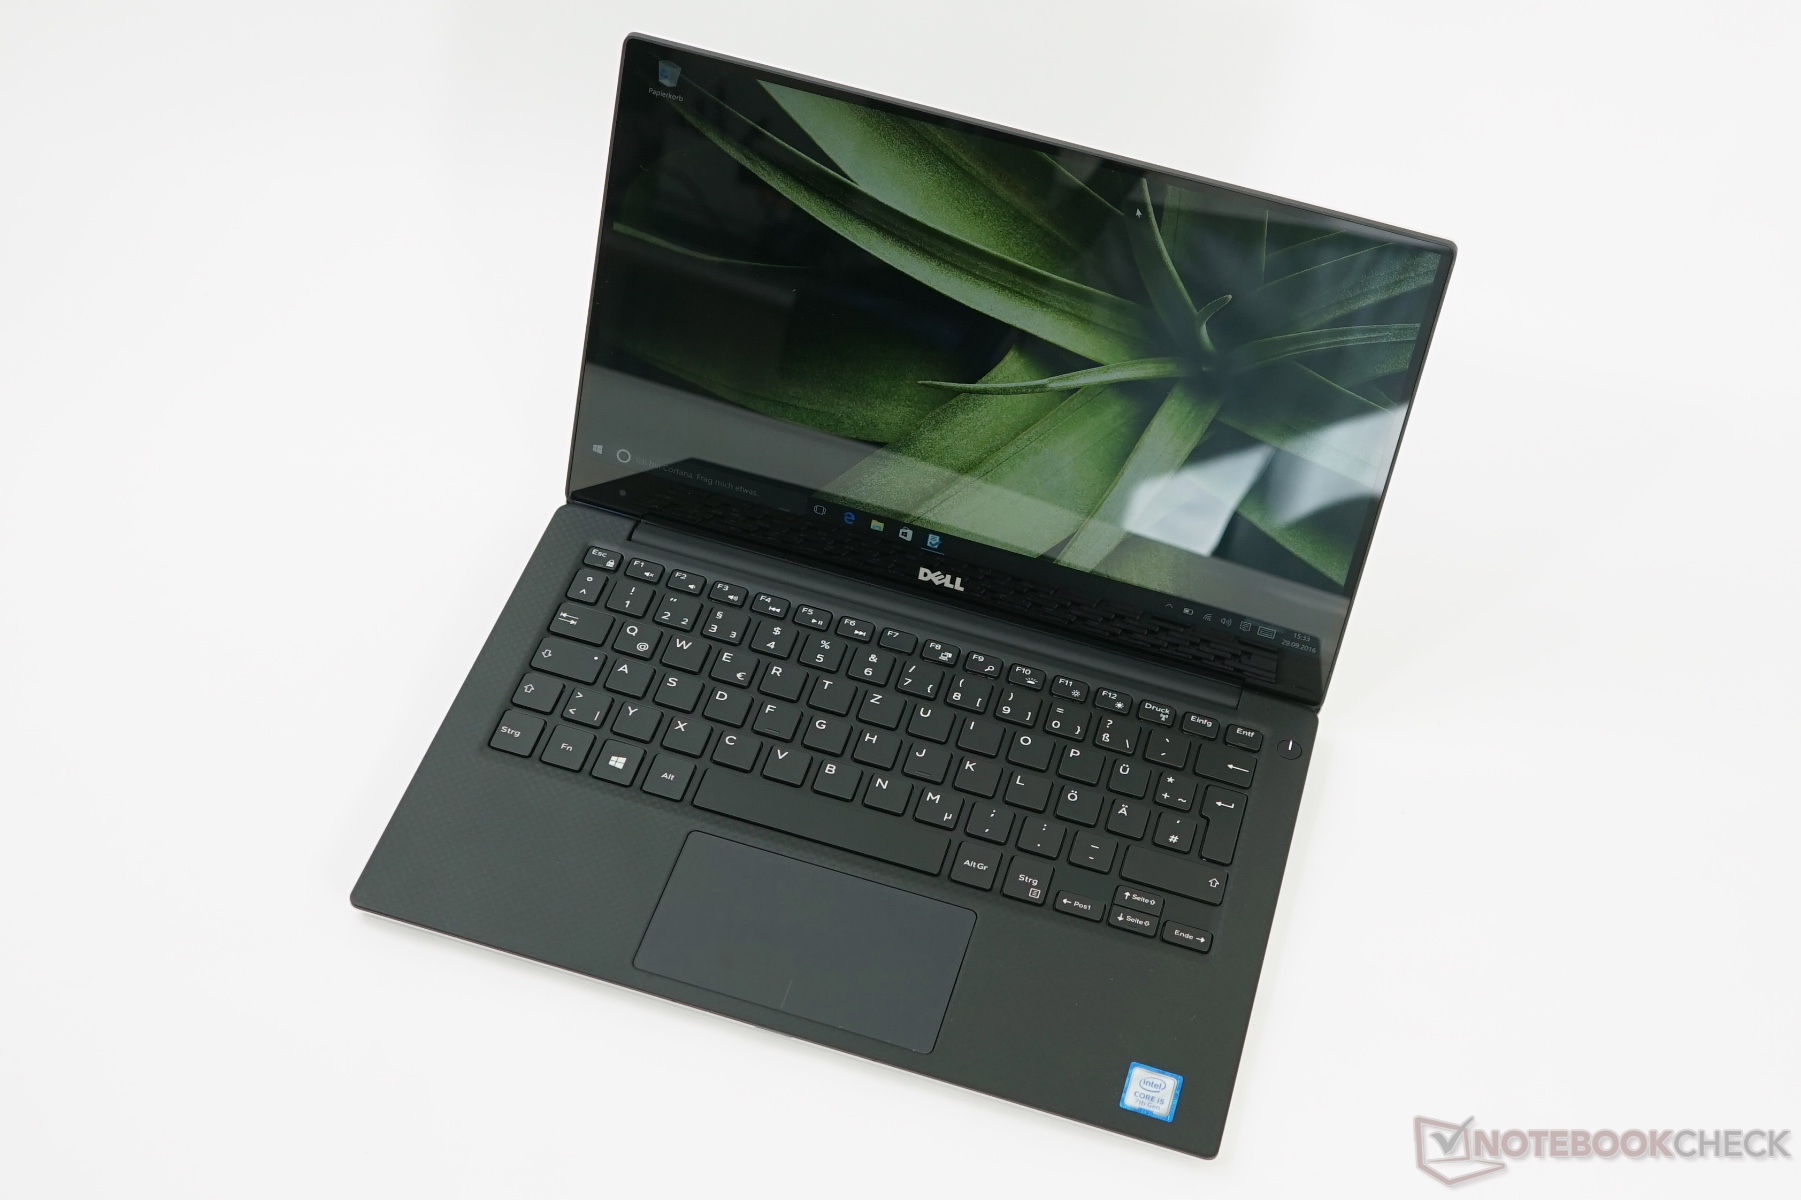
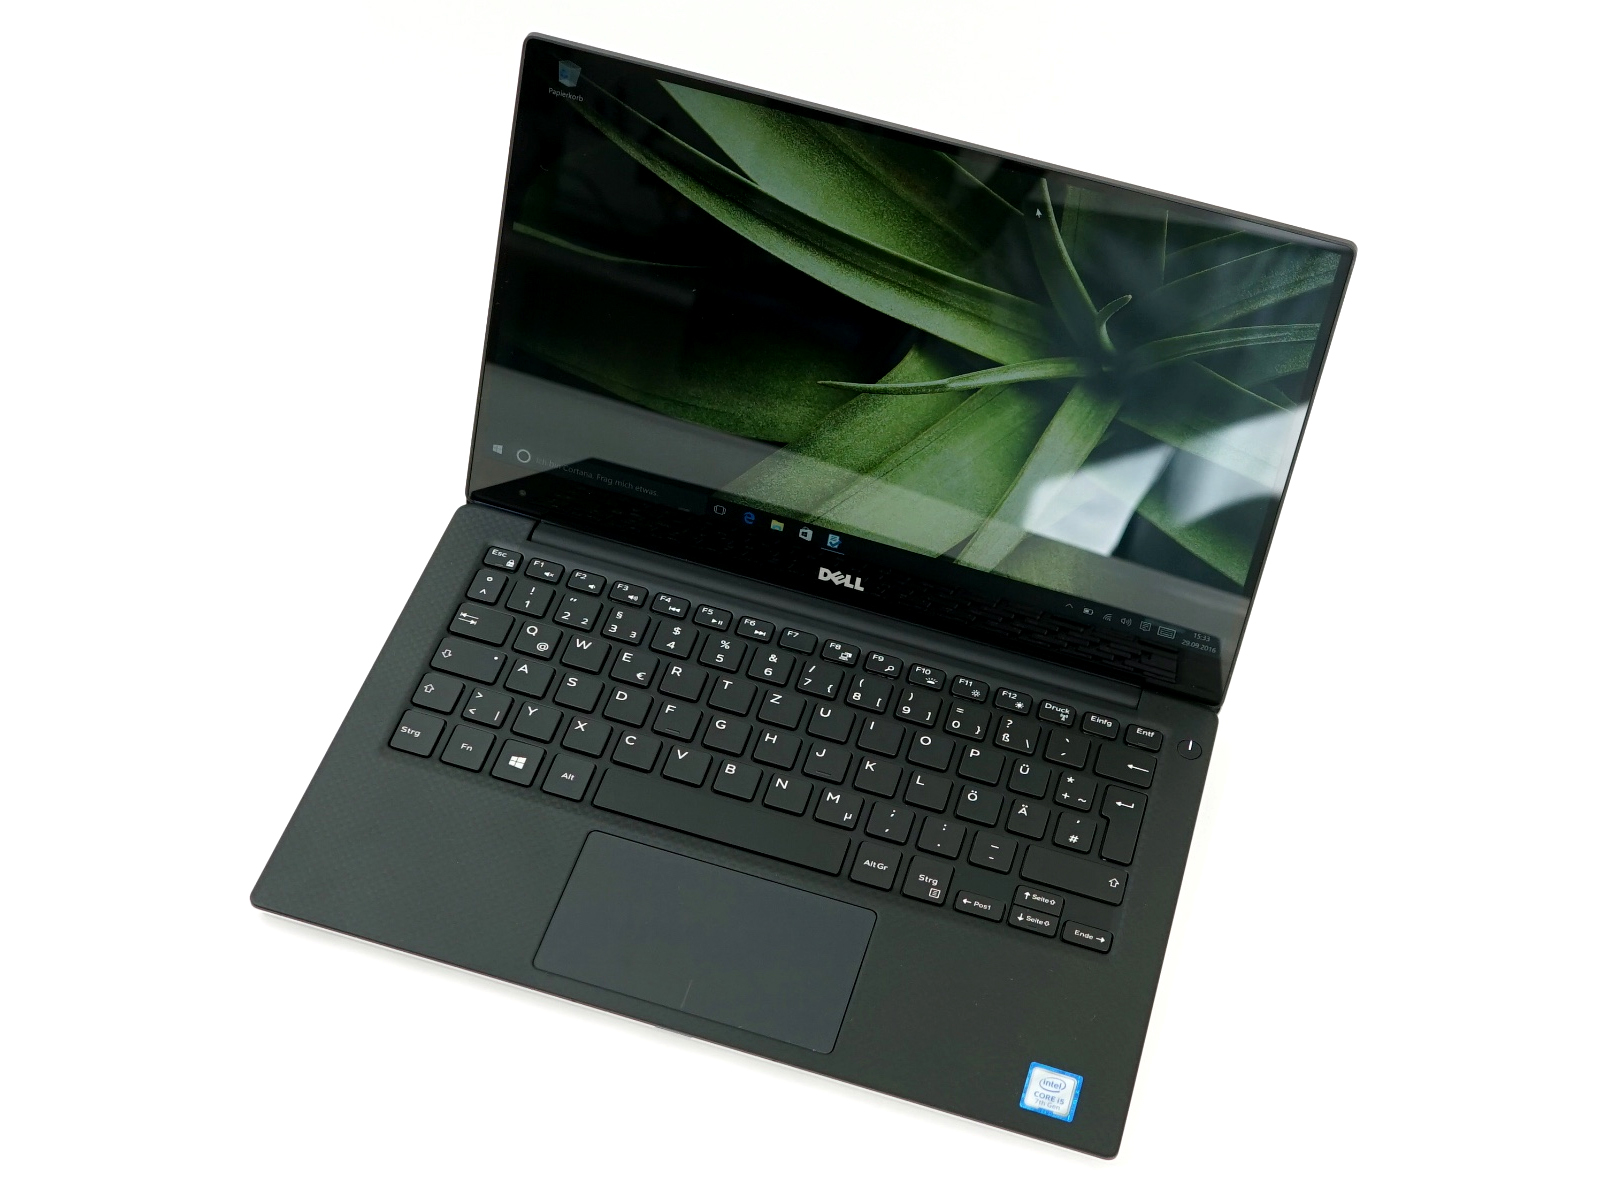
Recensione breve del Portatile Dell XPS 13 9360 (FHD, i7, Iris)
| SD Card Reader | |
| average JPG Copy Test (av. of 3 runs) | |
| Dell XPS 13 9360 FHD i7 Iris | |
| Dell XPS 15 9560 (i7-7700HQ, UHD) | |
| HP Envy 13-ad065nr | |
| maximum AS SSD Seq Read Test (1GB) | |
| Dell XPS 15 9560 (i7-7700HQ, UHD) | |
| Dell XPS 13 9360 FHD i7 Iris | |
| HP Envy 13-ad065nr | |
| Networking | |
| iperf3 transmit AX12 | |
| Huawei MateBook X | |
| Dell XPS 13 9360 FHD i7 Iris | |
| Apple MacBook Pro 13 2017 | |
| HP Envy 13-ad065nr | |
| iperf3 receive AX12 | |
| Apple MacBook Pro 13 2017 | |
| HP Envy 13-ad065nr | |
| Dell XPS 13 9360 FHD i7 Iris | |
| Huawei MateBook X | |
Sfarfallio dello schermo / PWM (Pulse-Width Modulation)
| flickering dello schermo / PWM rilevato | 19530 Hz | ≤ 80 % settaggio luminosita' | 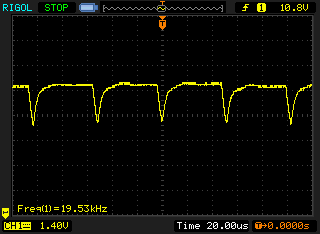 |
Il display sfarfalla a 19530 Hz (Probabilmente a causa dell'uso di PWM) Flickering rilevato ad una luminosita' di 80 % o inferiore. Non dovrebbe verificarsi flickering o PWM sopra questo valore di luminosita'. La frequenza di 19530 Hz è abbastanza alta, quindi la maggioranza degli utenti sensibili al PWM non dovrebbero notare alcun flickering. In confronto: 52 % di tutti i dispositivi testati non utilizza PWM per ridurre la luminosita' del display. Se è rilevato PWM, una media di 7784 (minimo: 5 - massimo: 343500) Hz è stata rilevata. | |||
| |||||||||||||||||||||||||
Distribuzione della luminosità: 85 %
Al centro con la batteria: 461 cd/m²
Contrasto: 2305:1 (Nero: 0.2 cd/m²)
ΔE ColorChecker Calman: 5.4 | ∀{0.5-29.43 Ø4.73}
ΔE Greyscale Calman: 5.4 | ∀{0.09-98 Ø4.97}
76.9% sRGB (Argyll 1.6.3 3D)
48.6% AdobeRGB 1998 (Argyll 1.6.3 3D)
53.3% AdobeRGB 1998 (Argyll 3D)
77.4% sRGB (Argyll 3D)
51.6% Display P3 (Argyll 3D)
Gamma: 2.15
CCT: 7258 K
| Dell XPS 13 9360 FHD i7 Iris SHP1449, , 1920x1080, 13.3" | Dell XPS 13 i7-8550U ID: Sharp SHP144A, Name: LQ133Z1, , 3200x1800, 13.3" | Apple MacBook Pro 13 2017 APPA033, , 2560x1600, 13.3" | Razer Blade Stealth QHD i7-7500U Sharp SHP1493 (LQ133Z1JW26), , 3200x1800, 13.3" | Huawei MateBook X Chi Mei CMN8201 / P130ZDZ-EF1, , 2160x1440, 13.3" | HP Envy 13-ad065nr LG Philips LGD0576, , 1920x1080, 13.3" | |
|---|---|---|---|---|---|---|
| Display | 22% | 61% | 26% | 26% | 17% | |
| Display P3 Coverage (%) | 51.6 | 63.6 23% | 99.2 92% | 65.6 27% | 65.8 28% | 65.5 27% |
| sRGB Coverage (%) | 77.4 | 93 20% | 99.9 29% | 95.5 23% | 96.2 24% | 83.8 8% |
| AdobeRGB 1998 Coverage (%) | 53.3 | 65.4 23% | 87.1 63% | 67.6 27% | 66.8 25% | 61.3 15% |
| Response Times | 12% | 0% | -8% | 20% | 29% | |
| Response Time Grey 50% / Grey 80% * (ms) | 41.2 ? | 35.6 ? 14% | 42.8 ? -4% | 46 ? -12% | 33 ? 20% | 28 ? 32% |
| Response Time Black / White * (ms) | 30 ? | 27.2 ? 9% | 28.8 ? 4% | 31.2 ? -4% | 24 ? 20% | 22.4 ? 25% |
| PWM Frequency (Hz) | 19530 ? | 19690 ? | 19380 ? | 10200 ? | ||
| Screen | -5% | 20% | 3% | 7% | -11% | |
| Brightness middle (cd/m²) | 461 | 386.1 -16% | 588 28% | 406 -12% | 408 -11% | 290 -37% |
| Brightness (cd/m²) | 418 | 357 -15% | 561 34% | 373 -11% | 395 -6% | 270 -35% |
| Brightness Distribution (%) | 85 | 83 -2% | 92 8% | 84 -1% | 88 4% | 78 -8% |
| Black Level * (cd/m²) | 0.2 | 0.33 -65% | 0.45 -125% | 0.25 -25% | 0.45 -125% | 0.32 -60% |
| Contrast (:1) | 2305 | 1170 -49% | 1307 -43% | 1624 -30% | 907 -61% | 906 -61% |
| Colorchecker dE 2000 * | 5.4 | 4.2 22% | 1.7 69% | 4.5 17% | 1.55 71% | 4.8 11% |
| Colorchecker dE 2000 max. * | 12.2 | 7.6 38% | 3.5 71% | 8.2 33% | 2.19 82% | 11.2 8% |
| Greyscale dE 2000 * | 5.4 | 5.7 -6% | 1.9 65% | 5.2 4% | 1.91 65% | 2.8 48% |
| Gamma | 2.15 102% | 2.28 96% | 2.33 94% | 2.11 104% | 2.34 94% | 2.19 100% |
| CCT | 7258 90% | 7336 89% | 6738 96% | 7709 84% | 6491 100% | 6382 102% |
| Color Space (Percent of AdobeRGB 1998) (%) | 48.6 | 59 21% | 77.92 60% | 61.3 26% | 61 26% | 54.9 13% |
| Color Space (Percent of sRGB) (%) | 76.9 | 92.2 20% | 99.94 30% | 95.4 24% | 96 25% | 83.5 9% |
| Media totale (Programma / Settaggio) | 10% /
2% | 27% /
25% | 7% /
6% | 18% /
12% | 12% /
-0% |
* ... Meglio usare valori piccoli
Tempi di risposta del Display
| ↔ Tempi di risposta dal Nero al Bianco | ||
|---|---|---|
| 30 ms ... aumenta ↗ e diminuisce ↘ combinato | ↗ 17.6 ms Incremento | 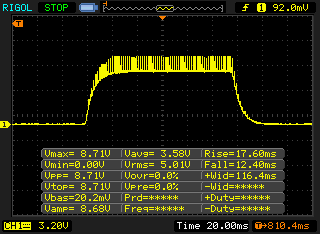 |
| ↘ 12.4 ms Calo | ||
| Lo schermo mostra tempi di risposta lenti nei nostri tests e sarà insoddisfacente per i gamers. In confronto, tutti i dispositivi di test variano da 0.1 (minimo) a 240 (massimo) ms. » 80 % di tutti i dispositivi è migliore. Questo significa che i tempi di risposta rilevati sono peggiori rispetto alla media di tutti i dispositivi testati (19.9 ms). | ||
| ↔ Tempo di risposta dal 50% Grigio all'80% Grigio | ||
| 41.2 ms ... aumenta ↗ e diminuisce ↘ combinato | ↗ 22.8 ms Incremento | 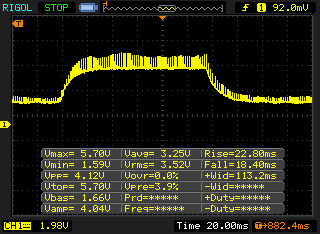 |
| ↘ 18.4 ms Calo | ||
| Lo schermo mostra tempi di risposta lenti nei nostri tests e sarà insoddisfacente per i gamers. In confronto, tutti i dispositivi di test variano da 0.165 (minimo) a 636 (massimo) ms. » 66 % di tutti i dispositivi è migliore. Questo significa che i tempi di risposta rilevati sono peggiori rispetto alla media di tutti i dispositivi testati (31.1 ms). | ||


| PCMark 8 Home Score Accelerated v2 | 3902 punti | |
| PCMark 8 Creative Score Accelerated v2 | 5083 punti | |
| PCMark 8 Work Score Accelerated v2 | 4890 punti | |
Aiuto | ||
| Dell XPS 13 9360 FHD i7 Iris Toshiba XG4 NVMe (THNSN5512GPUK) | Dell XPS 13 i7-8550U Toshiba XG5 KXG50ZNV256G | Huawei MateBook X LITEON CB1-SD256 | Lenovo Yoga 920-13IKB-80Y7 Samsung PM961 MZVLW256HEHP | |
|---|---|---|---|---|
| CrystalDiskMark 5.2 / 6 | -28% | -35% | 28% | |
| Write 4K (MB/s) | 131.9 | 121.5 -8% | 68.1 -48% | 142.1 8% |
| Read 4K (MB/s) | 46.72 | 24.92 -47% | 28.95 -38% | 44.19 -5% |
| Write Seq (MB/s) | 1036 | 345 -67% | 529 -49% | 1112 7% |
| Read Seq (MB/s) | 1352 | 1313 -3% | 711 -47% | 1884 39% |
| Write 4K Q32T1 (MB/s) | 487.7 | 346.1 -29% | 306.4 -37% | 747 53% |
| Read 4K Q32T1 (MB/s) | 443.9 | 389.4 -12% | 501 13% | 446.8 1% |
| Write Seq Q32T1 (MB/s) | 1048 | 334.7 -68% | 496.9 -53% | 1255 20% |
| Read Seq Q32T1 (MB/s) | 1699 | 1840 8% | 1297 -24% | 3400 100% |

| 3DMark 11 Performance | 2275 punti | |
| 3DMark Cloud Gate Standard Score | 7685 punti | |
| 3DMark Fire Strike Score | 1265 punti | |
| 3DMark Fire Strike Extreme Score | 577 punti | |
| 3DMark Time Spy Score | 467 punti | |
Aiuto | ||
| Tomb Raider | |
| 1920x1080 Ultra Preset AA:FX AF:16x | |
| Apple MacBook Pro 13 2017 | |
| Dell XPS 13 9360 FHD i7 Iris | |
| Dell XPS 13 9360 FHD i5 | |
| 1366x768 High Preset AA:FX AF:8x | |
| Apple MacBook Pro 13 2017 | |
| Dell XPS 13 9360 FHD i7 Iris | |
| Dell XPS 13 9360 FHD i5 | |
| 1366x768 Normal Preset AA:FX AF:4x | |
| Apple MacBook Pro 13 2017 | |
| Dell XPS 13 9360 FHD i7 Iris | |
| Dell XPS 13 9360 FHD i5 | |
| 1024x768 Low Preset | |
| Apple MacBook Pro 13 2017 | |
| Dell XPS 13 9360 FHD i7 Iris | |
| Dell XPS 13 9360 FHD i5 | |
| Overwatch | |
| 1920x1080 Epic (Render Scale 100 %) AA:SM AF:16x | |
| Apple MacBook Pro 13 2017 | |
| 1920x1080 High (Render Scale 100 %) AA:SM AF:4x | |
| Apple MacBook Pro 13 2017 | |
| Dell XPS 13 9360 FHD i7 Iris | |
| Dell XPS 13 9360 QHD+ i7 | |
| Dell XPS 13 i7-8550U | |
| Acer Spin 5 SP513-52N-566U | |
| 1366x768 Medium (Render Scale 100 %) AA:FX AF:2x | |
| Apple MacBook Pro 13 2017 | |
| Dell XPS 13 9360 FHD i7 Iris | |
| Dell XPS 13 9360 QHD+ i7 | |
| Dell XPS 13 i7-8550U | |
| Acer Spin 5 SP513-52N-566U | |
| HP Envy 13-ad065nr | |
| 1280x720 Low (Render Scale 100 %) AA:FX AF:1x | |
| Apple MacBook Pro 13 2017 | |
| Dell XPS 13 9360 FHD i7 Iris | |
| Dell XPS 13 9360 QHD+ i7 | |
| Dell XPS 13 i7-8550U | |
| Acer Spin 5 SP513-52N-566U | |
| HP Envy 13-ad065nr | |
| Rocket League | |
| 1920x1080 High Quality AA:High FX | |
| Apple MacBook Pro 13 2017 | |
| Dell XPS 13 9360 FHD i7 Iris | |
| 1920x1080 Quality AA:Medium FX | |
| Apple MacBook Pro 13 2017 | |
| Dell XPS 13 9360 FHD i7 Iris | |
| Acer Spin 5 SP513-52N-566U | |
| 1280x720 Performance | |
| Apple MacBook Pro 13 2017 | |
| Acer Spin 5 SP513-52N-566U | |
| Dell XPS 13 9360 FHD i7 Iris | |
| basso | medio | alto | ultra | |
|---|---|---|---|---|
| Tomb Raider (2013) | 103 | 54.1 | 37 | 17.2 |
| BioShock Infinite (2013) | 61 | 40.2 | 33.5 | 10.7 |
| Battlefield 4 (2013) | 43.1 | 29.7 | 23.2 | 8.2 |
| The Witcher 3 (2015) | 17.5 | |||
| Rainbow Six Siege (2015) | 50.5 | 29 | 16.4 | |
| Overwatch (2016) | 56.1 | 36.5 | 29.9 | |
| Rocket League (2017) | 69.3 | 35.8 | 25.3 | |
| F1 2017 (2017) | 33 | 15 |
Rumorosità
| Idle |
| 29.9 / 29.9 / 30.3 dB(A) |
| Sotto carico |
| 33.9 / 34.9 dB(A) |
 | ||
30 dB silenzioso 40 dB(A) udibile 50 dB(A) rumoroso |
||
min: | ||
(-) La temperatura massima sul lato superiore è di 46.2 °C / 115 F, rispetto alla media di 35.9 °C / 97 F, che varia da 21.4 a 59 °C per questa classe Subnotebook.
(-) Il lato inferiore si riscalda fino ad un massimo di 48.8 °C / 120 F, rispetto alla media di 39.2 °C / 103 F
(+) In idle, la temperatura media del lato superiore è di 26.7 °C / 80 F, rispetto alla media deld ispositivo di 30.8 °C / 87 F.
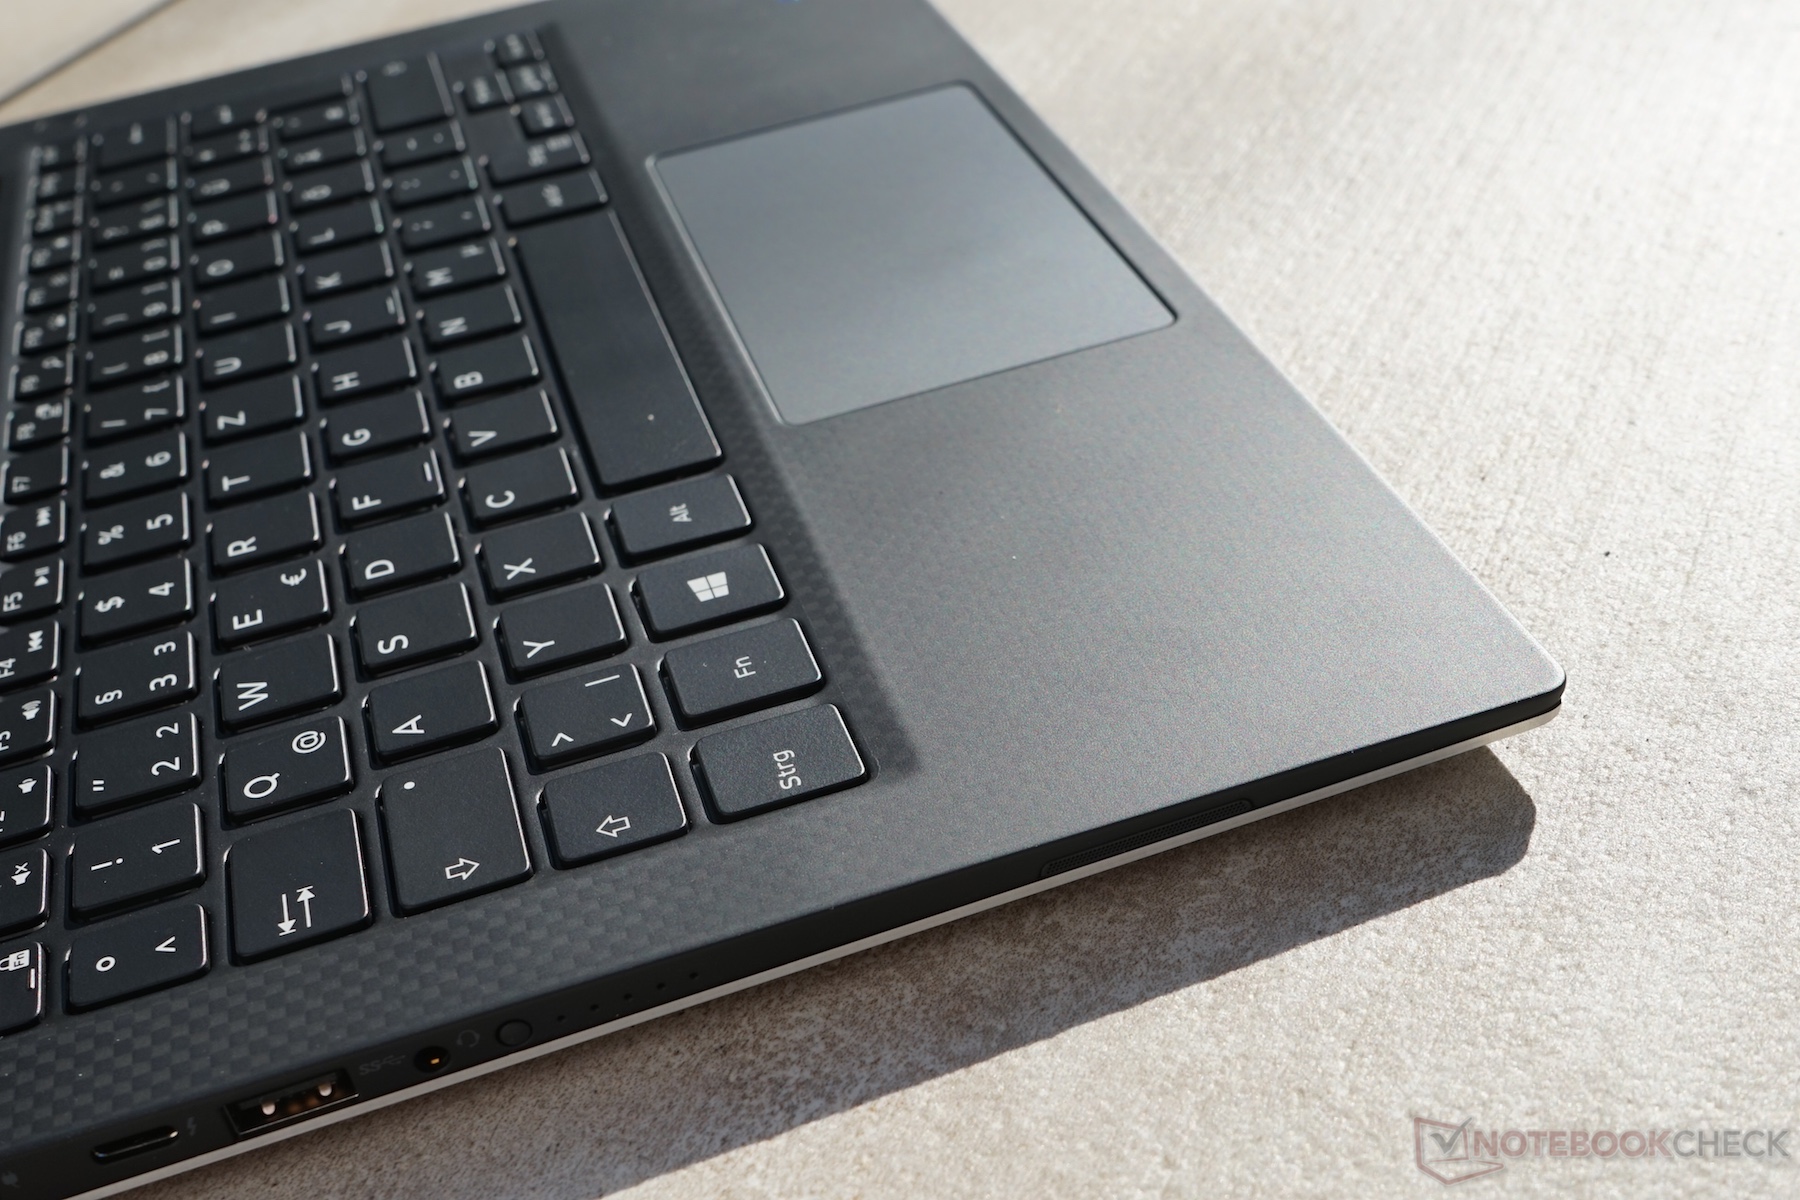
(+) I poggiapolsi e il touchpad raggiungono la temperatura massima della pelle (33.6 °C / 92.5 F) e quindi non sono caldi.
(-) La temperatura media della zona del palmo della mano di dispositivi simili e'stata di 28.2 °C / 82.8 F (-5.4 °C / -9.7 F).
| Off / Standby | |
| Idle | |
| Sotto carico |
|
Leggenda:
min: | |
| Dell XPS 13 9360 FHD i7 Iris i7-7560U, Iris Plus Graphics 640, IPS, 1920x1080, 13.3" | Dell XPS 13 i7-8550U i5-8550U, UHD Graphics 620, IGZO IPS, 3200x1800, 13.3" | Dell XPS 13 9360 FHD i5 i5-7200U, HD Graphics 620, IPS, 1920x1080, 13.3" | Dell XPS 13 9360 QHD+ i7 i7-7500U, HD Graphics 620, IPS, 3200x1800, 13.3" | Huawei MateBook X i5-7200U, HD Graphics 620, , 2160x1440, 13.3" | HP Envy 13-ad065nr i5-7200U, HD Graphics 620, IPS, 1920x1080, 13.3" | Apple MacBook Pro 13 2017 i5-7360U, Iris Plus Graphics 640, IPS, 2560x1600, 13.3" | |
|---|---|---|---|---|---|---|---|
| Power Consumption | -10% | 17% | -17% | -47% | 8% | -14% | |
| Idle Minimum * (Watt) | 3.32 | 4.1 -23% | 4.1 -23% | 6.4 -93% | 4.6 -39% | 2.8 16% | 3.7 -11% |
| Idle Average * (Watt) | 5.27 | 5.8 -10% | 4.2 20% | 6.6 -25% | 11 -109% | 5.8 -10% | 5.2 1% |
| Idle Maximum * (Watt) | 6.32 | 6 5% | 5.1 19% | 6.8 -8% | 12 -90% | 6.4 -1% | 7.6 -20% |
| Load Average * (Watt) | 32 | 42.5 -33% | 22.1 31% | 27.5 14% | 39.5 -23% | 31.3 2% | 41.6 -30% |
| Load Maximum * (Watt) | 45.9 | 41.4 10% | 29.4 36% | 32.4 29% | 34.6 25% | 31.7 31% | 50.5 -10% |
* ... Meglio usare valori piccoli
| Dell XPS 13 9360 FHD i7 Iris i7-7560U, Iris Plus Graphics 640, 60 Wh | Dell XPS 13 i7-8550U i5-8550U, UHD Graphics 620, 60 Wh | Razer Blade Stealth QHD i7-7500U i7-7500U, HD Graphics 620, 53.6 Wh | Huawei MateBook X i5-7200U, HD Graphics 620, 40 Wh | HP Envy 13-ad065nr i5-7200U, HD Graphics 620, 53.6 Wh | Dell XPS 13 9360 FHD i5 i5-7200U, HD Graphics 620, 60 Wh | Dell XPS 13 9360 QHD+ i7 i7-7500U, HD Graphics 620, 60 Wh | Apple MacBook Pro 13 2017 i5-7360U, Iris Plus Graphics 640, 54.5 Wh | |
|---|---|---|---|---|---|---|---|---|
| Autonomia della batteria | -15% | -41% | -37% | -11% | -4% | -22% | -23% | |
| Reader / Idle (h) | 25.4 | 18.5 -27% | 8.5 -67% | 24.8 -2% | 21.6 -15% | 17.6 -31% | ||
| H.264 (h) | 15 | 11.4 -24% | ||||||
| WiFi v1.3 (h) | 10.9 | 9.8 -10% | 6.4 -41% | 5.6 -49% | 9.5 -13% | 11.3 4% | 8.6 -21% | 11.4 5% |
| Load (h) | 2.6 | 2.4 -8% | 2.7 4% | 2.1 -19% | 2.6 0% | 2.2 -15% | 1.3 -50% |
Pro
Contro
I potenziali acquirenti del Dell XPS 13 si trovano di fronte ad una decisione interessante. I nuovi processori Kaby Lake-R forniscono più prestazioni CPU, mentre la GPU Iris unitamente con le "vecchie" CPUs Kaby Lake promettono più prestazioni GPU. Almeno in teoria, in quanto la decisione diventa facile dopo aver letto la recensione.
Il nuovo quad-core ULV è superiore ai vecchi dual-cores se potete usare i cores/threads aggiuntivi. Anche le prestazioni GPU più elevate. Un altro aspetto decisivo è il limite all'utilizzo delle performance dell'i7-7560U nell'XPS 13. Non ci sono particolari differenze di prestazioni a causa del consueto limite di 15 W. Pertanto la nostra raccomandazione è pertanto facile: se pensate di comprare l'XPS 13, prendetelo con uno dei nuovi chips Kaby Lake-R.
La Kaby Lake unitamente alla nuova e più potente GPU Iris non ha molto senso per l'XPS 13, in quanto non potete usare tutto il suo potenziale. La nuova ottava generazione di processori (Kaby Lake-Refresh) è superiore in termini di prestazioni CPU, e nemmeno la GPU non è molto più lenta.
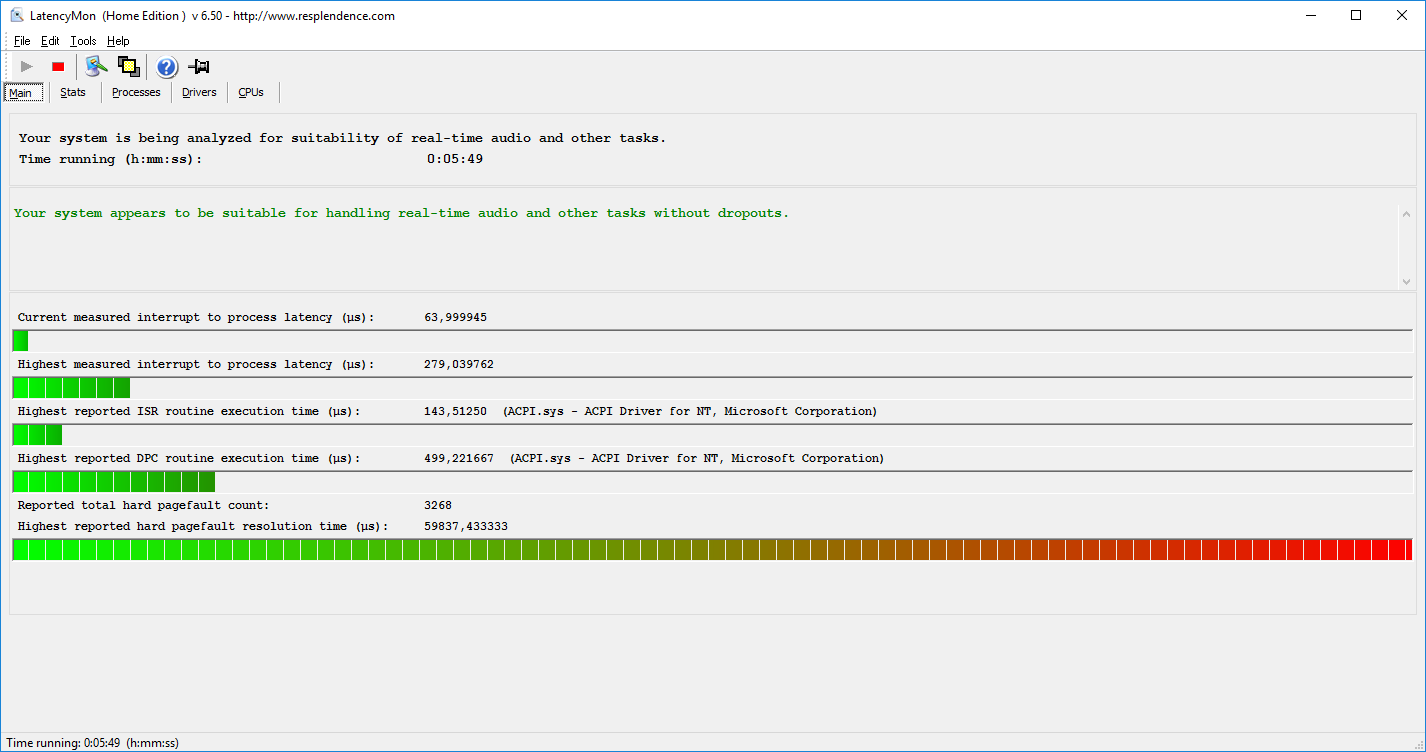
Per il resto, non c'è molto da dire riguardo l'XPS 13. Sfortunatamente, Dell ancora non ha risolto il rumore elettronico, e questo distrae abbastanza.
Nota: si tratta di una recensione breve, con alcune sezioni non tradotte, per la versione integrale in inglese guardate qui.
Dell XPS 13 9360 FHD i7 Iris
- 11/06/2017 v6 (old)
Andreas Osthoff
Price comparison
