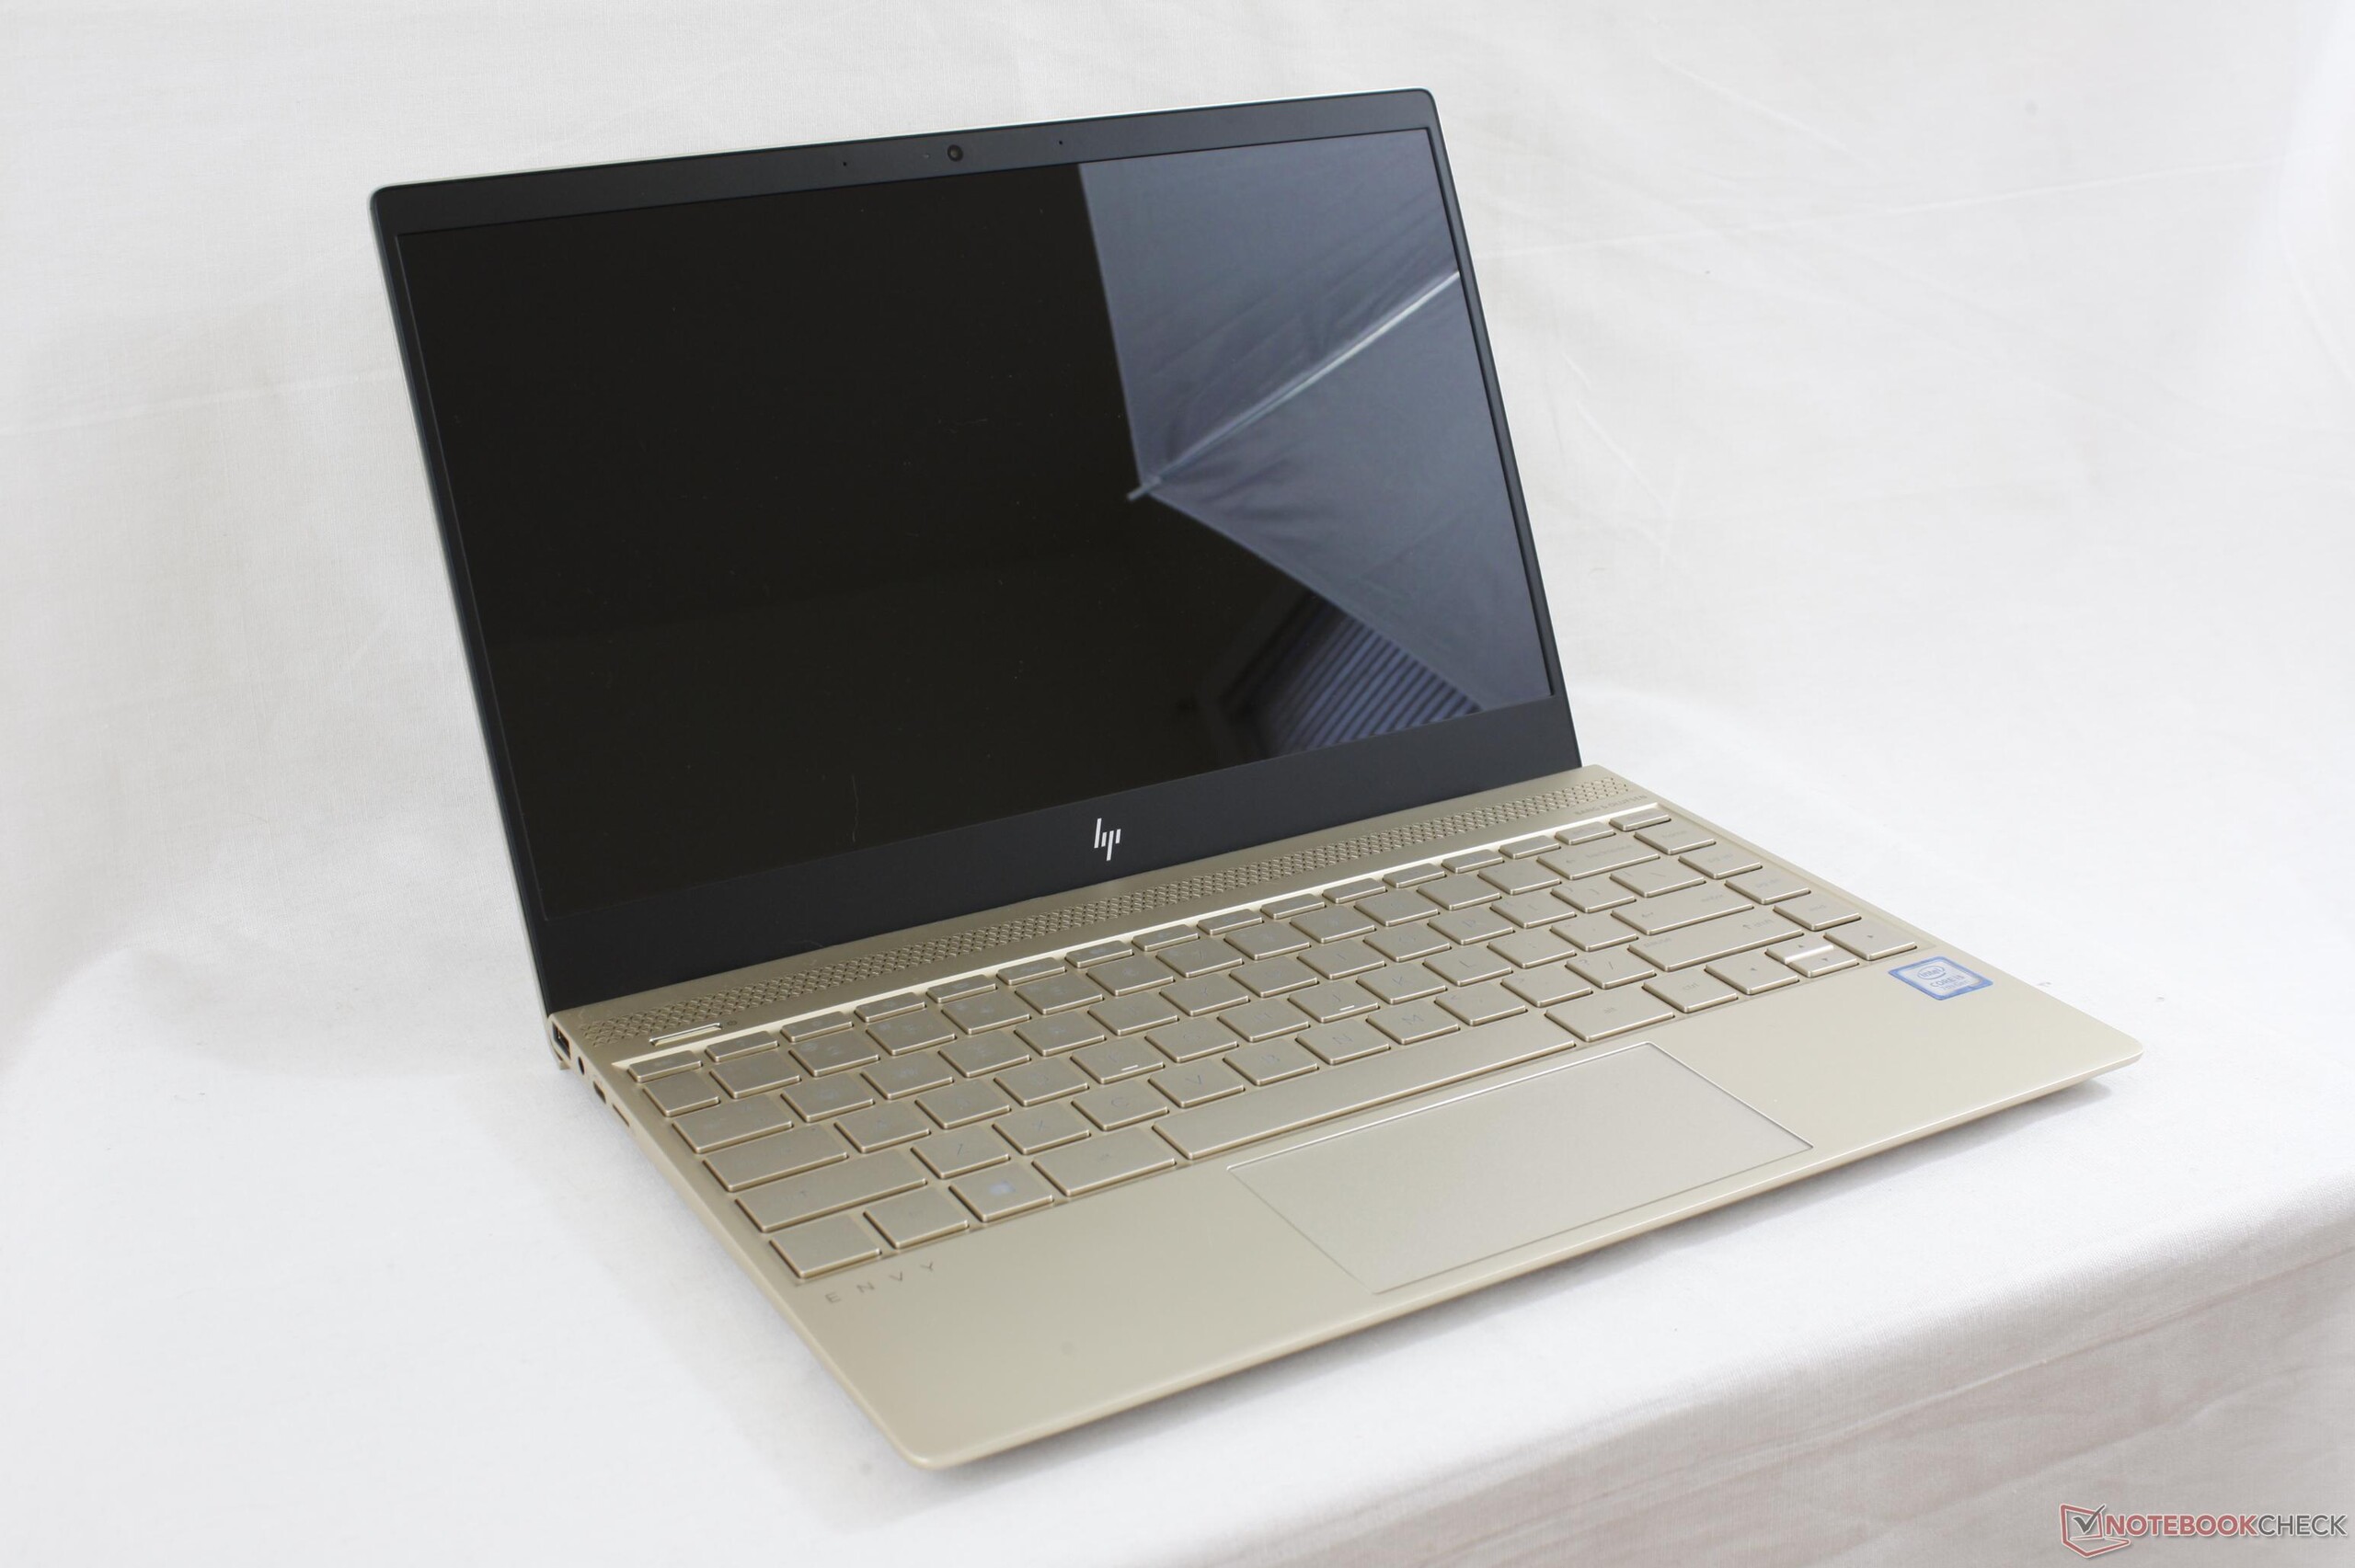
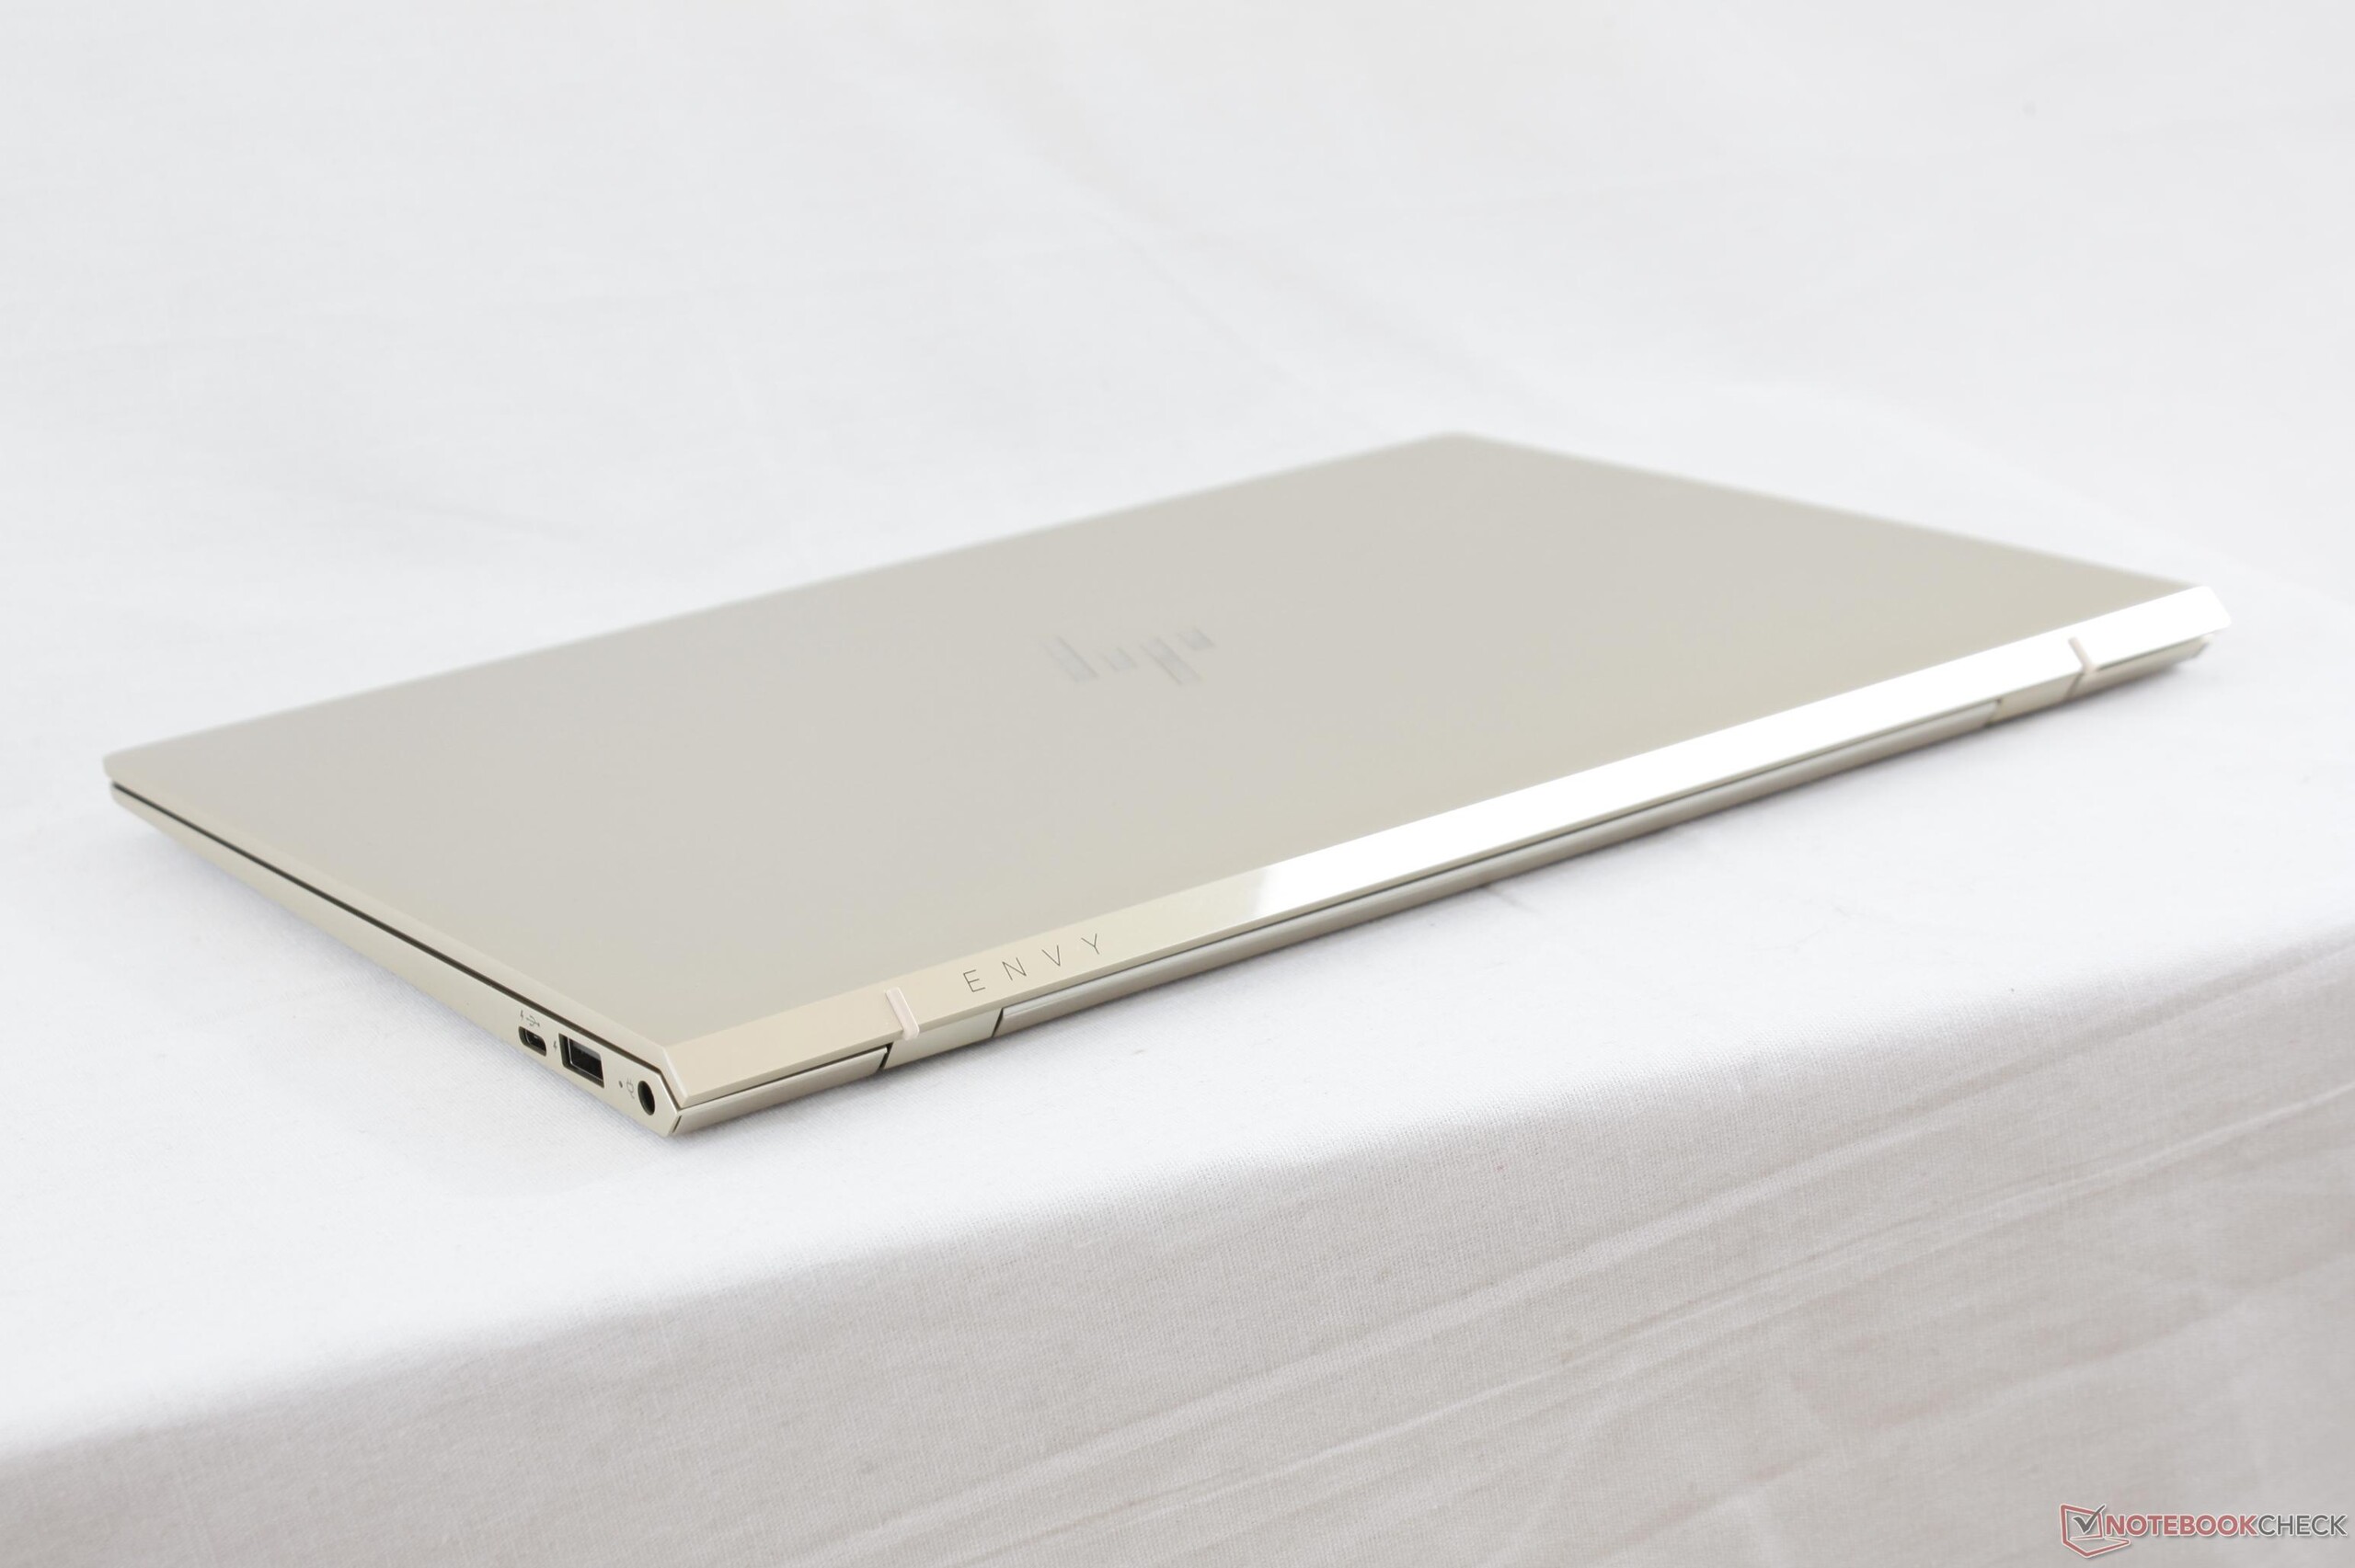
Recensione breve del Portatile HP Envy 13 ad065nr (i5-7200U, FHD)
| SD Card Reader | |
| average JPG Copy Test (av. of 3 runs) | |
| Dell XPS 15 9560 (i7-7700HQ, UHD) | |
| Dell XPS 13 9360 FHD i5 | |
| HP Envy 13-ad065nr | |
| maximum AS SSD Seq Read Test (1GB) | |
| Dell XPS 15 9560 (i7-7700HQ, UHD) | |
| Dell XPS 13 9360 FHD i5 | |
| HP Envy 13-ad065nr | |
| Networking | |
| iperf3 transmit AX12 | |
| HP Spectre 13-v131ng | |
| Dell XPS 13 9360 FHD i5 | |
| HP Envy 13-ad065nr | |
| iperf3 receive AX12 | |
| HP Envy 13-ad065nr | |
| Dell XPS 13 9360 FHD i5 | |
| HP Spectre 13-v131ng | |
| |||||||||||||||||||||||||
Distribuzione della luminosità: 78 %
Al centro con la batteria: 290 cd/m²
Contrasto: 906:1 (Nero: 0.32 cd/m²)
ΔE ColorChecker Calman: 4.8 | ∀{0.5-29.43 Ø4.71}
ΔE Greyscale Calman: 2.8 | ∀{0.09-98 Ø4.96}
83.5% sRGB (Argyll 1.6.3 3D)
54.9% AdobeRGB 1998 (Argyll 1.6.3 3D)
61.3% AdobeRGB 1998 (Argyll 3D)
83.8% sRGB (Argyll 3D)
65.5% Display P3 (Argyll 3D)
Gamma: 2.19
CCT: 6382 K
| HP Envy 13-ad065nr LG Philips LGD0576, IPS, 13.3", 1920x1080 | Dell XPS 13 9360 FHD i5 Sharp SHP1449 LQ133M1, IPS, 13.3", 1920x1080 | HP Spectre 13-v131ng CMN1374, IPS UWVA, 13.3", 1920x1080 | Apple MacBook Pro 13 2017 APPA033, IPS, 13.3", 2560x1600 | HP Envy 13-d020ng AU Optronics AUO272D, IPS, 13.3", 1920x1080 | |
|---|---|---|---|---|---|
| Display | -19% | 4% | 37% | 5% | |
| Display P3 Coverage (%) | 65.5 | 48.94 -25% | 64.6 -1% | 99.2 51% | 63.7 -3% |
| sRGB Coverage (%) | 83.8 | 73.3 -13% | 88.8 6% | 99.9 19% | 93 11% |
| AdobeRGB 1998 Coverage (%) | 61.3 | 50.5 -18% | 64.8 6% | 87.1 42% | 65.1 6% |
| Response Times | -33% | -56% | -41% | -14% | |
| Response Time Grey 50% / Grey 80% * (ms) | 28 ? | 32.8 ? -17% | 46 ? -64% | 42.8 ? -53% | 34 ? -21% |
| Response Time Black / White * (ms) | 22.4 ? | 33.2 ? -48% | 33 ? -47% | 28.8 ? -29% | 24 ? -7% |
| PWM Frequency (Hz) | 10200 ? | 208 ? | |||
| Screen | -0% | 0% | 46% | 7% | |
| Brightness middle (cd/m²) | 290 | 351.2 21% | 404 39% | 588 103% | 345 19% |
| Brightness (cd/m²) | 270 | 325 20% | 382 41% | 561 108% | 335 24% |
| Brightness Distribution (%) | 78 | 89 14% | 91 17% | 92 18% | 95 22% |
| Black Level * (cd/m²) | 0.32 | 0.195 39% | 0.35 -9% | 0.45 -41% | 0.25 22% |
| Contrast (:1) | 906 | 1801 99% | 1154 27% | 1307 44% | 1380 52% |
| Colorchecker dE 2000 * | 4.8 | 7.4 -54% | 5.37 -12% | 1.7 65% | 4.94 -3% |
| Colorchecker dE 2000 max. * | 11.2 | 9.08 19% | 9.46 16% | 3.5 69% | 8.85 21% |
| Greyscale dE 2000 * | 2.8 | 6.71 -140% | 6.44 -130% | 1.9 32% | 5.85 -109% |
| Gamma | 2.19 100% | 2.74 80% | 2.52 87% | 2.33 94% | 2.25 98% |
| CCT | 6382 102% | 7222 90% | 6738 96% | 6738 96% | 7105 91% |
| Color Space (Percent of AdobeRGB 1998) (%) | 54.9 | 50.48 -8% | 58 6% | 77.92 42% | 60 9% |
| Color Space (Percent of sRGB) (%) | 83.5 | 73.31 -12% | 89 7% | 99.94 20% | 93 11% |
| Media totale (Programma / Settaggio) | -17% /
-8% | -17% /
-7% | 14% /
33% | -1% /
4% |
* ... Meglio usare valori piccoli
Tempi di risposta del Display
| ↔ Tempi di risposta dal Nero al Bianco | ||
|---|---|---|
| 22.4 ms ... aumenta ↗ e diminuisce ↘ combinato | ↗ 12.4 ms Incremento | 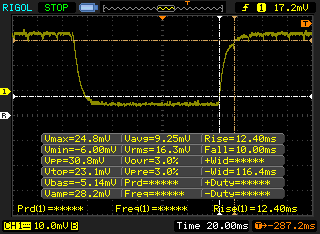 |
| ↘ 10 ms Calo | ||
| Lo schermo mostra buoni tempi di risposta durante i nostri tests, ma potrebbe essere troppo lento per i gamers competitivi. In confronto, tutti i dispositivi di test variano da 0.1 (minimo) a 240 (massimo) ms. » 51 % di tutti i dispositivi è migliore. Questo significa che i tempi di risposta rilevati sono peggiori rispetto alla media di tutti i dispositivi testati (19.8 ms). | ||
| ↔ Tempo di risposta dal 50% Grigio all'80% Grigio | ||
| 28 ms ... aumenta ↗ e diminuisce ↘ combinato | ↗ 14 ms Incremento | 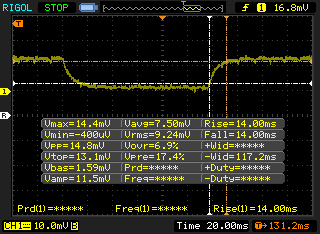 |
| ↘ 14 ms Calo | ||
| Lo schermo mostra tempi di risposta relativamente lenti nei nostri tests e potrebbe essere troppo lento per i gamers. In confronto, tutti i dispositivi di test variano da 0.165 (minimo) a 636 (massimo) ms. » 38 % di tutti i dispositivi è migliore. Questo significa che i tempi di risposta rilevati sono simili alla media di tutti i dispositivi testati (31 ms). | ||
Sfarfallio dello schermo / PWM (Pulse-Width Modulation)
| flickering dello schermo / PWM rilevato | 10200 Hz | ≤ 100 % settaggio luminosita' | 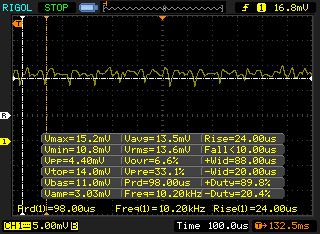 |
Il display sfarfalla a 10200 Hz (Probabilmente a causa dell'uso di PWM) Flickering rilevato ad una luminosita' di 100 % o inferiore. Non dovrebbe verificarsi flickering o PWM sopra questo valore di luminosita'. La frequenza di 10200 Hz è abbastanza alta, quindi la maggioranza degli utenti sensibili al PWM non dovrebbero notare alcun flickering. In confronto: 52 % di tutti i dispositivi testati non utilizza PWM per ridurre la luminosita' del display. Se è rilevato PWM, una media di 7754 (minimo: 5 - massimo: 343500) Hz è stata rilevata. | |||
| Cinebench R10 | |
| Rendering Multiple CPUs 32Bit | |
| Microsoft Surface Pro (2017) i7 | |
| Apple MacBook Pro 13 2017 | |
| Samsung Notebook 9 NP900X5N-X01US | |
| Apple MacBook Pro 13 2017 Touchbar i5 | |
| HP Envy 13-ad065nr | |
| HP ProBook 650 G2-T9X61ET | |
| HP 250 G4 T6P08ES | |
| Lenovo IdeaPad Z40-59422614 | |
| Rendering Single 32Bit | |
| Microsoft Surface Pro (2017) i7 | |
| Apple MacBook Pro 13 2017 | |
| Samsung Notebook 9 NP900X5N-X01US | |
| Apple MacBook Pro 13 2017 Touchbar i5 | |
| HP Envy 13-ad065nr | |
| HP ProBook 650 G2-T9X61ET | |
| HP 250 G4 T6P08ES | |
| Lenovo IdeaPad Z40-59422614 | |
* ... Meglio usare valori piccoli
| PCMark 8 | |
| Home Score Accelerated v2 | |
| Apple MacBook Pro 13 2017 | |
| HP Envy 13-ad065nr | |
| Dell XPS 13 9360 FHD i5 | |
| HP Envy 13-d020ng | |
| Work Score Accelerated v2 | |
| HP Envy 13-ad065nr | |
| Dell XPS 13 9360 FHD i5 | |
| Apple MacBook Pro 13 2017 | |
| HP Envy 13-d020ng | |
| Creative Score Accelerated v2 | |
| Apple MacBook Pro 13 2017 | |
| HP Envy 13-ad065nr | |
| Dell XPS 13 9360 FHD i5 | |
| HP Envy 13-d020ng | |
| PCMark 8 Home Score Accelerated v2 | 3760 punti | |
| PCMark 8 Creative Score Accelerated v2 | 4541 punti | |
| PCMark 8 Work Score Accelerated v2 | 4669 punti | |
| PCMark 10 Score | 3273 punti | |
Aiuto | ||
| HP Envy 13-ad065nr SanDisk X400 SD8SN8U-128G-1006 | Dell XPS 13 9360 FHD i5 Toshiba NVMe THNSN5256GPUK | HP Spectre 13-v131ng Samsung PM961 NVMe MZVLW512HMJP | HP Spectre x360 13-ac033dx Samsung PM961 NVMe MZVLW512HMJP | HP Envy 13-d020ng Samsung MZRPC256HADR-000SO | |
|---|---|---|---|---|---|
| AS SSD | 82% | 275% | 283% | 26% | |
| Copy Game MB/s (MB/s) | 162.9 | 390 139% | 397.9 144% | 1123 589% | 196 20% |
| Copy Program MB/s (MB/s) | 99.3 | 188 89% | 426 329% | 466.7 370% | 122.6 23% |
| Copy ISO MB/s (MB/s) | 247.3 | 283.3 15% | 720 191% | 1672 576% | 252.3 2% |
| Score Total (Points) | 790 | 1607 103% | 3617 358% | 2219 181% | 984 25% |
| Score Write (Points) | 182 | 327 80% | 1115 513% | 832 357% | 325 79% |
| Score Read (Points) | 401 | 870 117% | 1654 312% | 945 136% | 439 9% |
| Access Time Write * (ms) | 0.082 | 0.035 57% | 0.026 68% | 0.031 62% | 0.051 38% |
| Access Time Read * (ms) | 0.149 | 0.055 63% | 0.042 72% | 0.036 76% | 0.145 3% |
| 4K-64 Write (MB/s) | 99.3 | 197.7 99% | 862 768% | 566 470% | 231.6 133% |
| 4K-64 Read (MB/s) | 329.5 | 723 119% | 1465 345% | 641 95% | 364.5 11% |
| 4K Write (MB/s) | 51.5 | 92 79% | 134.4 161% | 118.5 130% | 67.5 31% |
| 4K Read (MB/s) | 26.63 | 29.52 11% | 56.4 112% | 48.18 81% | 24.79 -7% |
| Seq Write (MB/s) | 314.5 | 372.8 19% | 1190 278% | 1476 369% | 258.1 -18% |
| Seq Read (MB/s) | 449.5 | 1179 162% | 1325 195% | 2556 469% | 502 12% |
* ... Meglio usare valori piccoli

| 3DMark 11 Performance | 1613 punti | |
| 3DMark Ice Storm Standard Score | 54450 punti | |
| 3DMark Cloud Gate Standard Score | 5995 punti | |
| 3DMark Fire Strike Score | 858 punti | |
| 3DMark Fire Strike Extreme Score | 394 punti | |
Aiuto | ||
| basso | medio | alto | ultra | |
|---|---|---|---|---|
| BioShock Infinite (2013) | 54.3 | 31 | 26.3 | 8 |
| Rise of the Tomb Raider (2016) | 19.9 | 10.9 | ||
| Overwatch (2016) | 33.3 | 25 |
Rumorosità
| Idle |
| 28.1 / 28.1 / 28.1 dB(A) |
| Sotto carico |
| 33.3 / 40 dB(A) |
 | ||
30 dB silenzioso 40 dB(A) udibile 50 dB(A) rumoroso |
||
min: | ||
| HP Envy 13-ad065nr HD Graphics 620, i5-7200U, SanDisk X400 SD8SN8U-128G-1006 | Dell XPS 13 9360 FHD i5 HD Graphics 620, i5-7200U, Toshiba NVMe THNSN5256GPUK | HP Spectre 13-v131ng HD Graphics 620, i7-7500U, Samsung PM961 NVMe MZVLW512HMJP | Apple MacBook Pro 13 2017 Iris Plus Graphics 640, i5-7360U, Apple SSD AP0128 | Acer Aspire S 13 S5-371-71QZ HD Graphics 520, 6500U, LiteOn CV1-8B512 | HP Envy 13-d020ng HD Graphics 520, 6200U, Samsung MZRPC256HADR-000SO | |
|---|---|---|---|---|---|---|
| Noise | 3% | -9% | -4% | -7% | -9% | |
| off /ambiente * (dB) | 28.1 | 30.4 -8% | 30.2 -7% | 31.2 -11% | ||
| Idle Minimum * (dB) | 28.1 | 28.9 -3% | 30.4 -8% | 30.2 -7% | 31.2 -11% | 32.5 -16% |
| Idle Average * (dB) | 28.1 | 28.9 -3% | 30.4 -8% | 30.2 -7% | 31.2 -11% | 32.5 -16% |
| Idle Maximum * (dB) | 28.1 | 28.9 -3% | 30.4 -8% | 30.2 -7% | 31.5 -12% | 32.4 -15% |
| Load Average * (dB) | 33.3 | 30.9 7% | 40 -20% | 32.9 1% | 35.7 -7% | 36 -8% |
| Load Maximum * (dB) | 40 | 33.5 16% | 40 -0% | 39.3 2% | 35.8 11% | 36.5 9% |
* ... Meglio usare valori piccoli
(-) La temperatura massima sul lato superiore è di 48 °C / 118 F, rispetto alla media di 35.9 °C / 97 F, che varia da 21.4 a 59 °C per questa classe Subnotebook.
(±) Il lato inferiore si riscalda fino ad un massimo di 42 °C / 108 F, rispetto alla media di 39.2 °C / 103 F
(+) In idle, la temperatura media del lato superiore è di 28.1 °C / 83 F, rispetto alla media deld ispositivo di 30.8 °C / 87 F.
(+) I poggiapolsi e il touchpad raggiungono la temperatura massima della pelle (32.2 °C / 90 F) e quindi non sono caldi.
(-) La temperatura media della zona del palmo della mano di dispositivi simili e'stata di 28.2 °C / 82.8 F (-4 °C / -7.2 F).
HP Envy 13-ad065nr analisi audio
(-) | altoparlanti non molto potenti (66 dB)
Bassi 100 - 315 Hz
(-) | quasi nessun basso - in media 20.7% inferiori alla media
(±) | la linearità dei bassi è media (11.1% delta rispetto alla precedente frequenza)
Medi 400 - 2000 Hz
(+) | medi bilanciati - solo only 3.4% rispetto alla media
(+) | medi lineari (6.3% delta rispetto alla precedente frequenza)
Alti 2 - 16 kHz
(+) | Alti bilanciati - appena 1.6% dalla media
(+) | alti lineari (6.9% delta rispetto alla precedente frequenza)
Nel complesso 100 - 16.000 Hz
(±) | la linearità complessiva del suono è media (23.7% di differenza rispetto alla media
Rispetto alla stessa classe
» 81% di tutti i dispositivi testati in questa classe è stato migliore, 4% simile, 15% peggiore
» Il migliore ha avuto un delta di 5%, medio di 18%, peggiore di 53%
Rispetto a tutti i dispositivi testati
» 71% di tutti i dispositivi testati in questa classe è stato migliore, 6% similare, 23% peggiore
» Il migliore ha avuto un delta di 4%, medio di 23%, peggiore di 134%
Apple MacBook 12 (Early 2016) 1.1 GHz analisi audio
(+) | gli altoparlanti sono relativamente potenti (83.6 dB)
Bassi 100 - 315 Hz
(±) | bassi ridotti - in media 11.3% inferiori alla media
(±) | la linearità dei bassi è media (14.2% delta rispetto alla precedente frequenza)
Medi 400 - 2000 Hz
(+) | medi bilanciati - solo only 2.4% rispetto alla media
(+) | medi lineari (5.5% delta rispetto alla precedente frequenza)
Alti 2 - 16 kHz
(+) | Alti bilanciati - appena 2% dalla media
(+) | alti lineari (4.5% delta rispetto alla precedente frequenza)
Nel complesso 100 - 16.000 Hz
(+) | suono nel complesso lineare (10.2% differenza dalla media)
Rispetto alla stessa classe
» 7% di tutti i dispositivi testati in questa classe è stato migliore, 2% simile, 90% peggiore
» Il migliore ha avuto un delta di 5%, medio di 18%, peggiore di 53%
Rispetto a tutti i dispositivi testati
» 5% di tutti i dispositivi testati in questa classe è stato migliore, 1% similare, 94% peggiore
» Il migliore ha avuto un delta di 4%, medio di 23%, peggiore di 134%
| Off / Standby | |
| Idle | |
| Sotto carico |
|
Leggenda:
min: | |
| HP Envy 13-ad065nr i5-7200U, HD Graphics 620, SanDisk X400 SD8SN8U-128G-1006, IPS, 1920x1080, 13.3" | Dell XPS 13 9360 FHD i5 i5-7200U, HD Graphics 620, Toshiba NVMe THNSN5256GPUK, IPS, 1920x1080, 13.3" | HP Spectre 13-v131ng i7-7500U, HD Graphics 620, Samsung PM961 NVMe MZVLW512HMJP, IPS UWVA, 1920x1080, 13.3" | Apple MacBook Pro 13 2017 i5-7360U, Iris Plus Graphics 640, Apple SSD AP0128, IPS, 2560x1600, 13.3" | HP Envy 13-d020ng 6200U, HD Graphics 520, Samsung MZRPC256HADR-000SO, IPS, 1920x1080, 13.3" | |
|---|---|---|---|---|---|
| Power Consumption | 8% | -20% | -27% | -30% | |
| Idle Minimum * (Watt) | 2.8 | 4.1 -46% | 3.6 -29% | 3.7 -32% | 4.2 -50% |
| Idle Average * (Watt) | 5.8 | 4.2 28% | 6.4 -10% | 5.2 10% | 7.4 -28% |
| Idle Maximum * (Watt) | 6.4 | 5.1 20% | 9.2 -44% | 7.6 -19% | 10.1 -58% |
| Load Average * (Watt) | 31.3 | 22.1 29% | 34 -9% | 41.6 -33% | 33.4 -7% |
| Load Maximum * (Watt) | 31.7 | 29.4 7% | 34.4 -9% | 50.5 -59% | 34.7 -9% |
* ... Meglio usare valori piccoli
| HP Envy 13-ad065nr i5-7200U, HD Graphics 620, 53.6 Wh | Dell XPS 13 9360 FHD i5 i5-7200U, HD Graphics 620, 60 Wh | HP Spectre 13-v131ng i7-7500U, HD Graphics 620, 38 Wh | Apple MacBook Pro 13 2017 i5-7360U, Iris Plus Graphics 640, 54.5 Wh | Acer Aspire S 13 S5-371-71QZ 6500U, HD Graphics 520, 45 Wh | HP Envy 13-d020ng 6200U, HD Graphics 520, 45 Wh | |
|---|---|---|---|---|---|---|
| Autonomia della batteria | 10% | -40% | -9% | -22% | -33% | |
| Reader / Idle (h) | 24.8 | 21.6 -13% | 12 -52% | 17.1 -31% | ||
| WiFi v1.3 (h) | 9.5 | 11.3 19% | 6.6 -31% | 11.4 20% | 7.9 -17% | 6.4 -33% |
| Load (h) | 2.1 | 2.6 24% | 1.3 -38% | 1.3 -38% | 1.7 -19% |
Pro
Contro
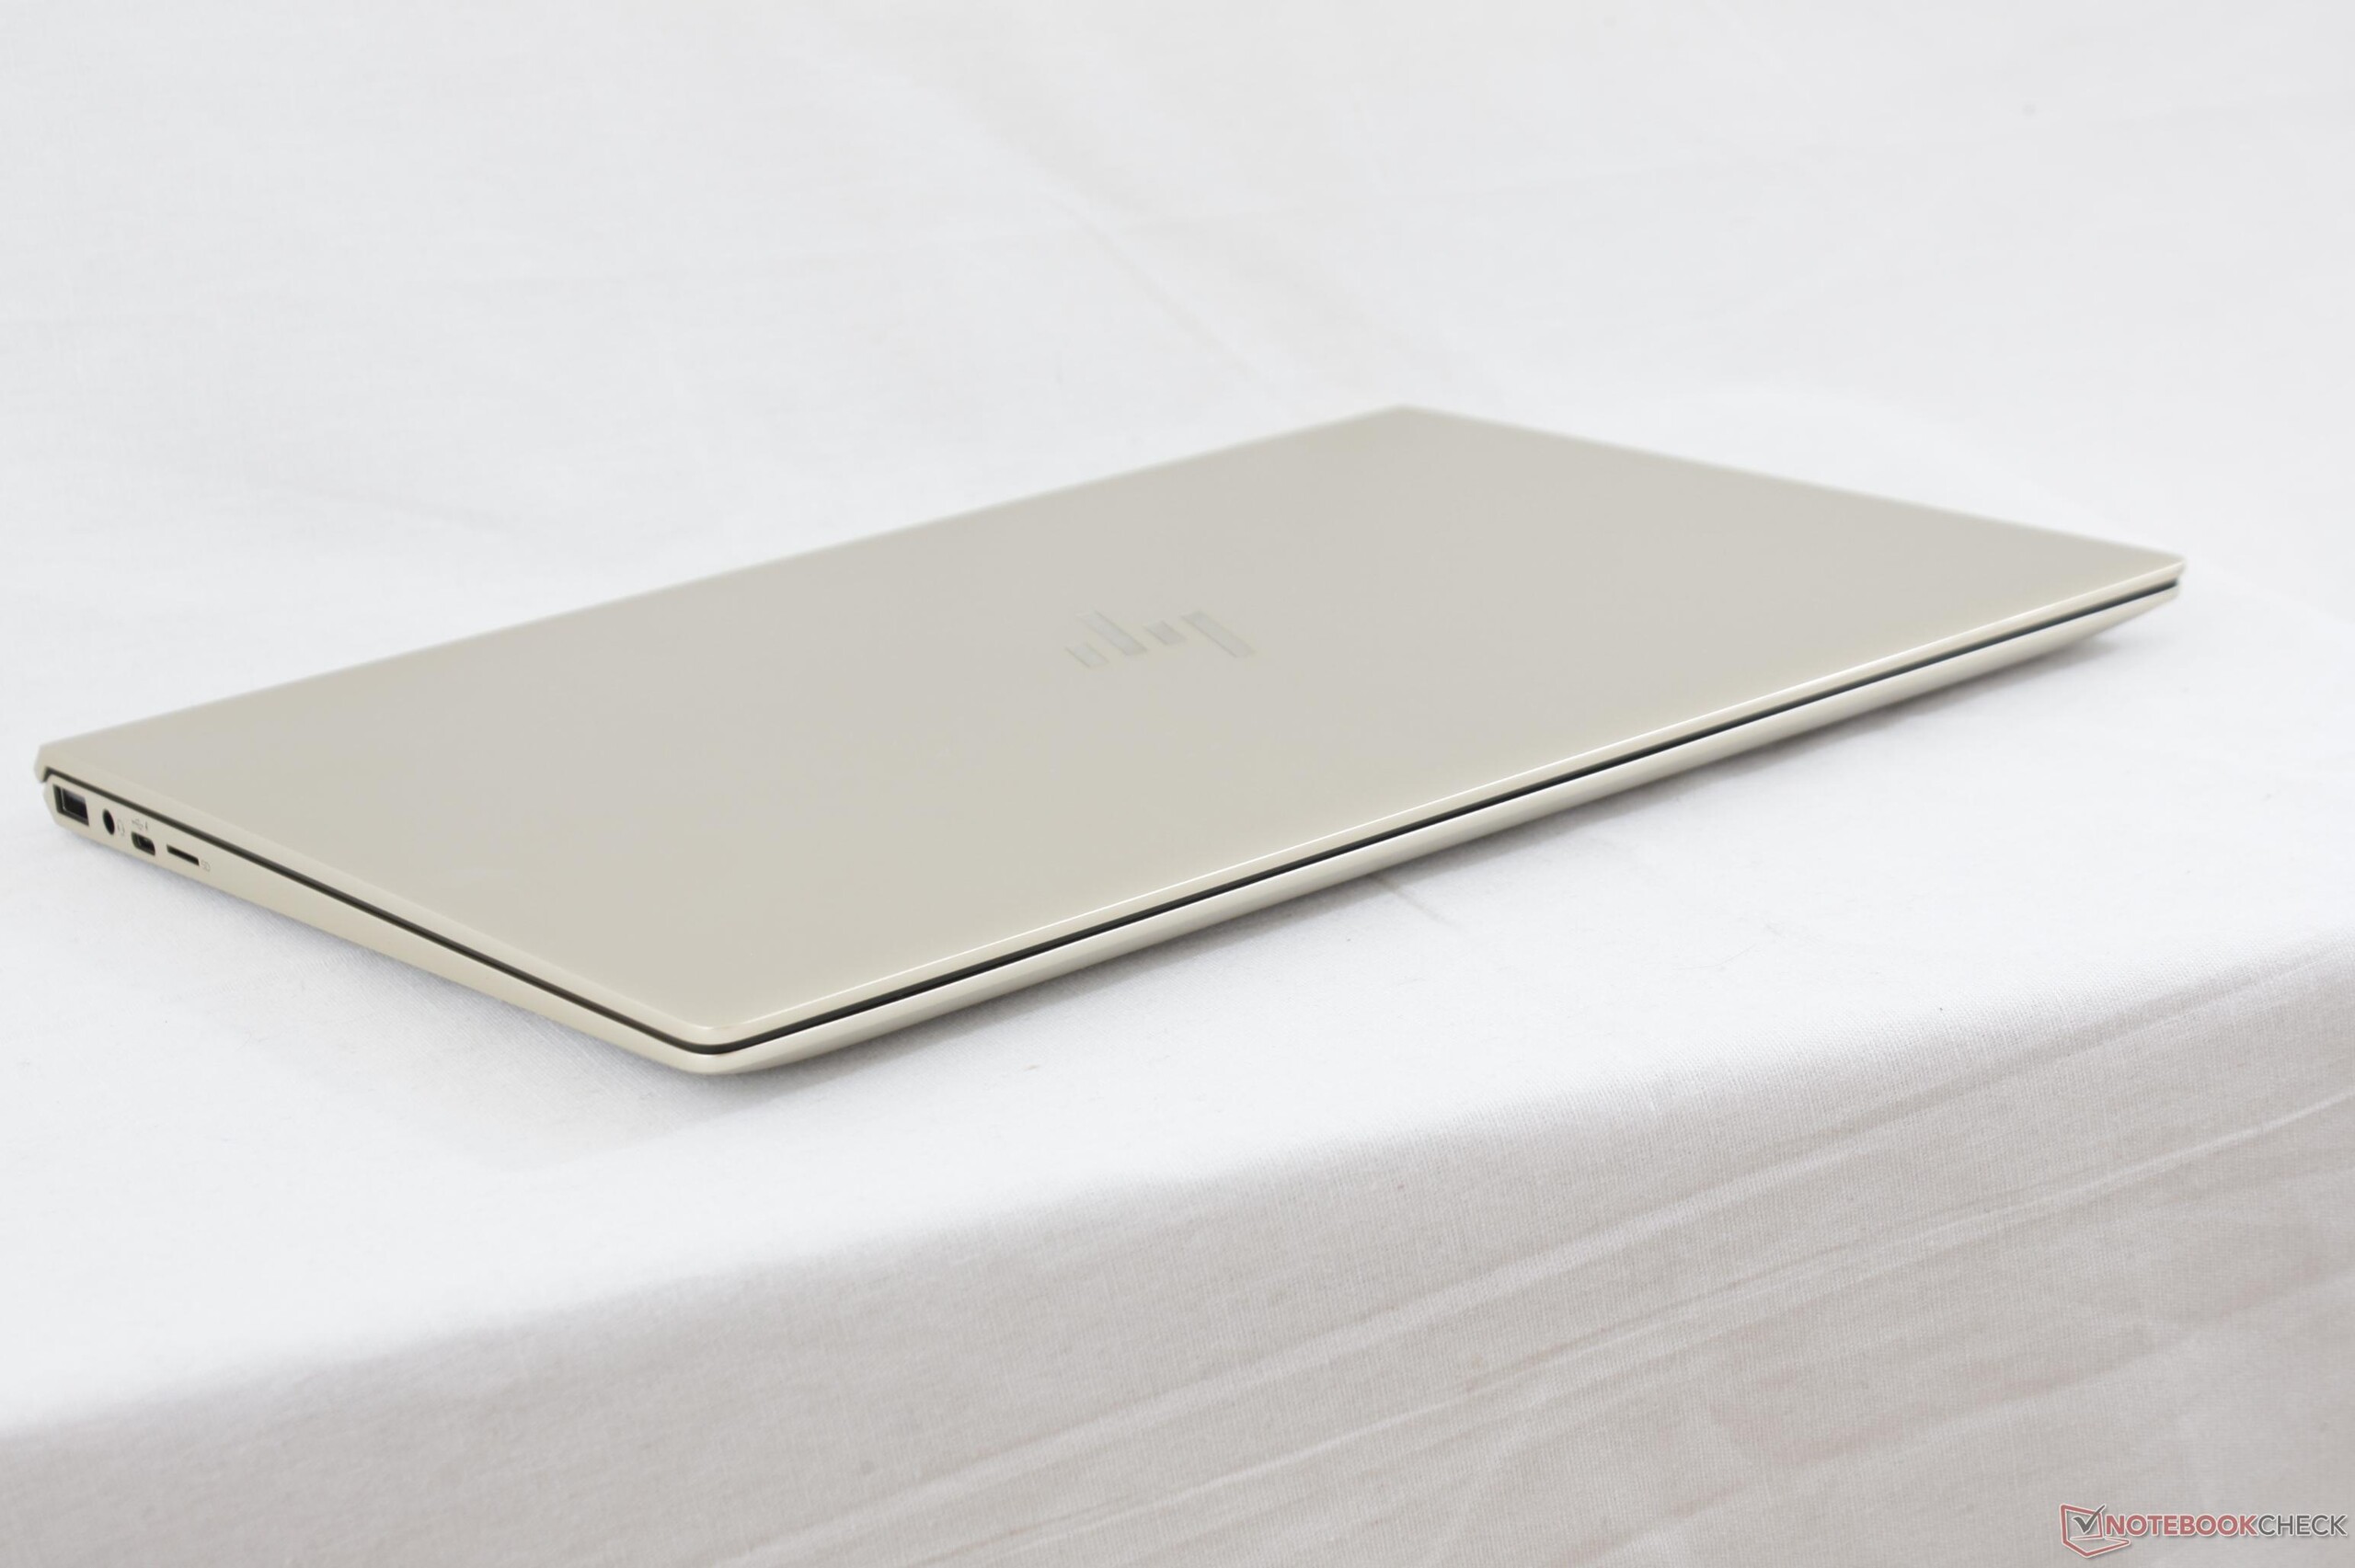
Il principale vantaggio dell'ultimo Envy è il prezzo di appena $840 USD rispetto a dispositivi simili come XPS 13, Yoga 910, o Spectre x360 13 che costano $1000 USD. Se Thunderbolt 3 o features 2-in-1 non sono necessarie, allora l'Envy 13 è raccomandabile. Sembra avere uno Spectre x360 13 ma ad un prezzo infeiore.
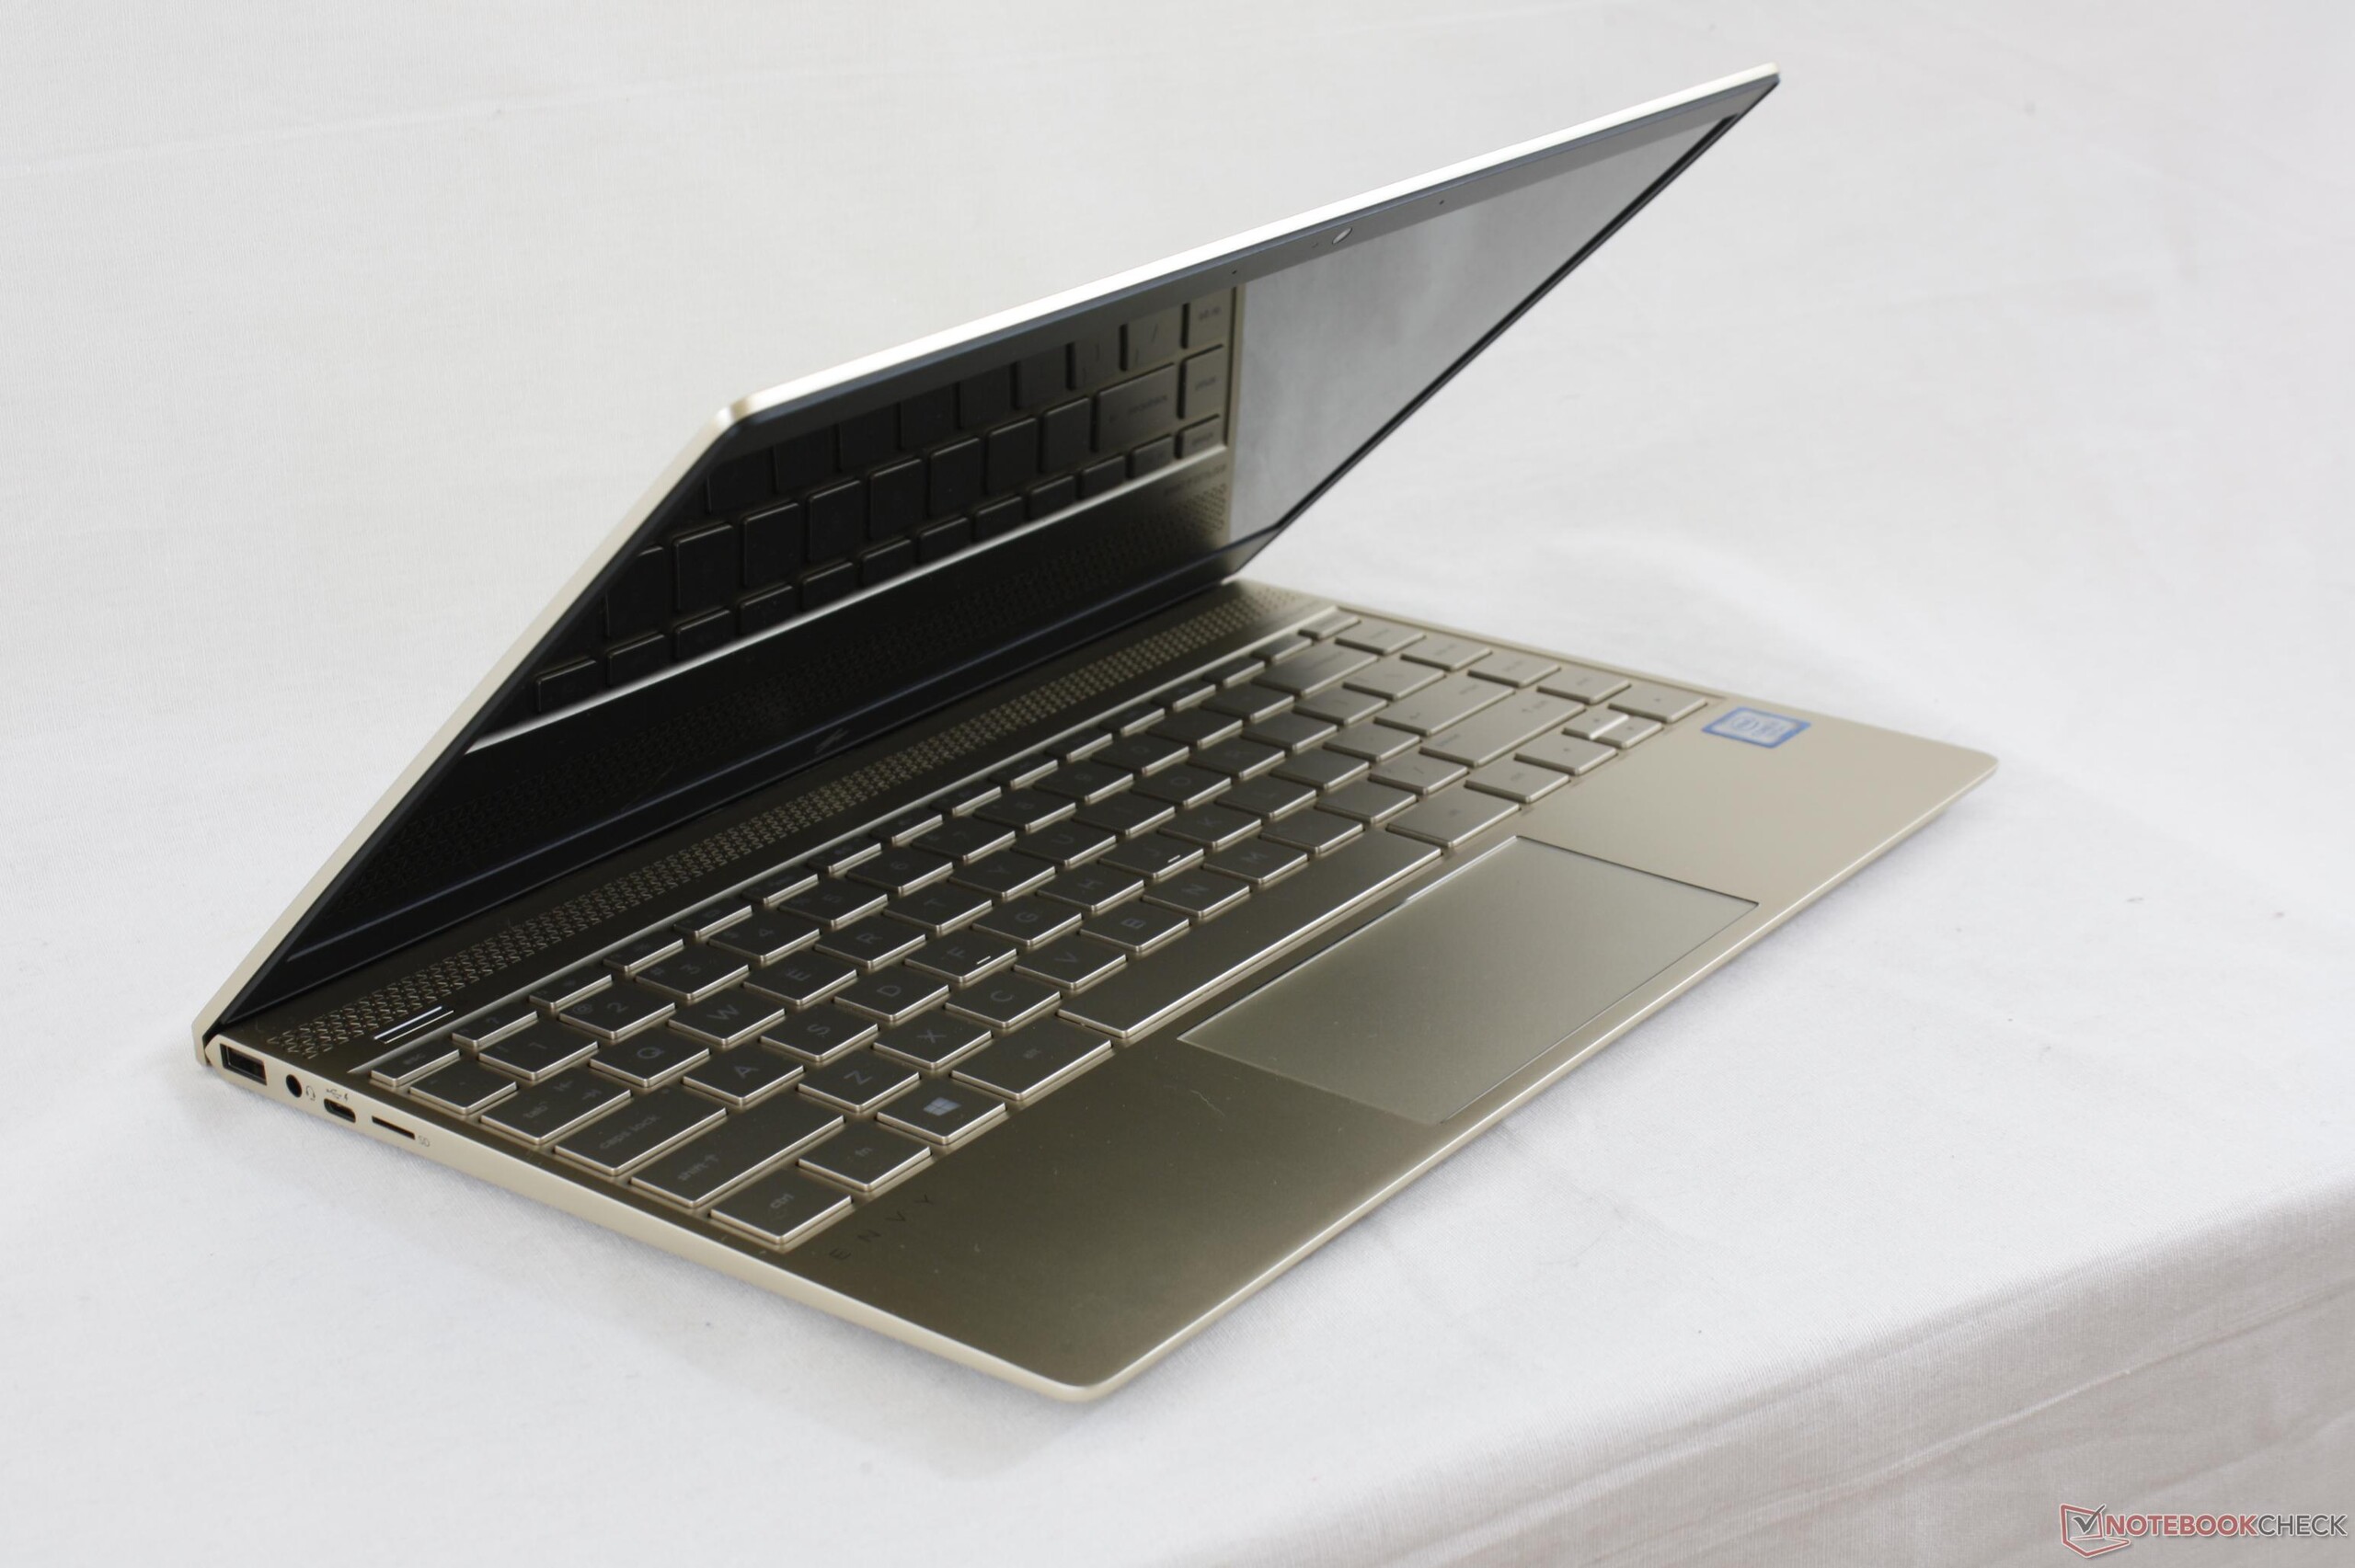
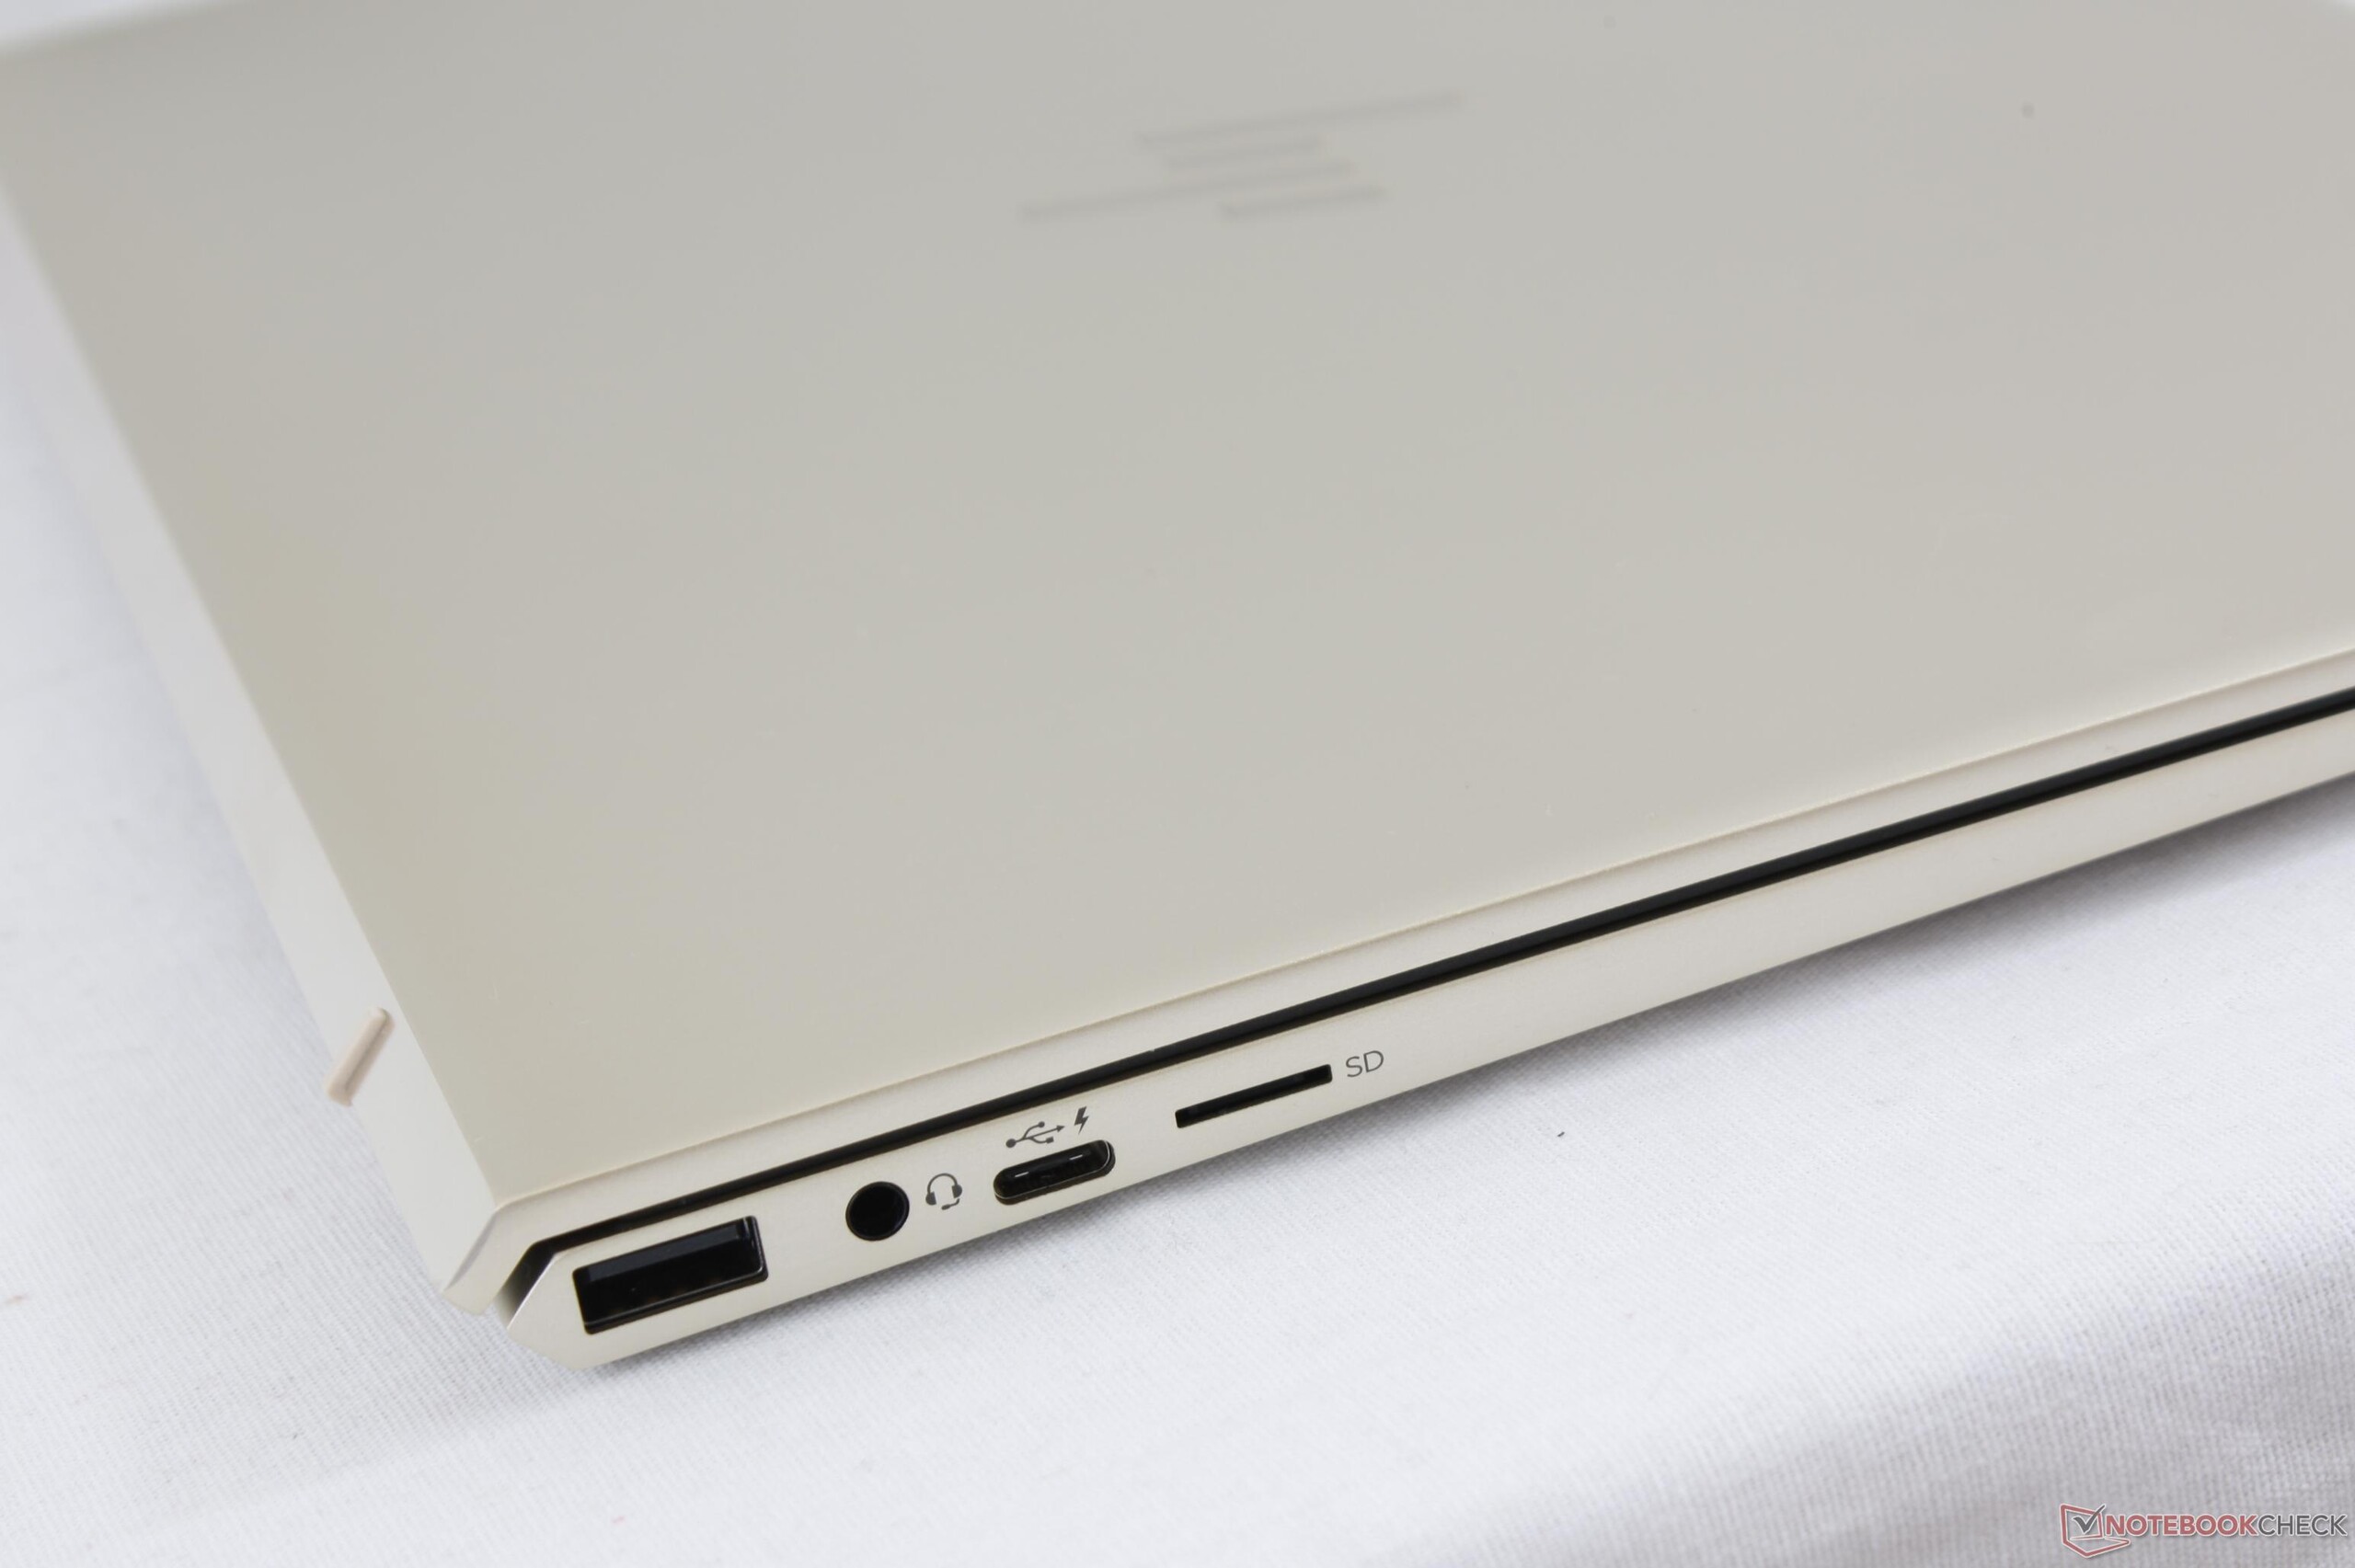
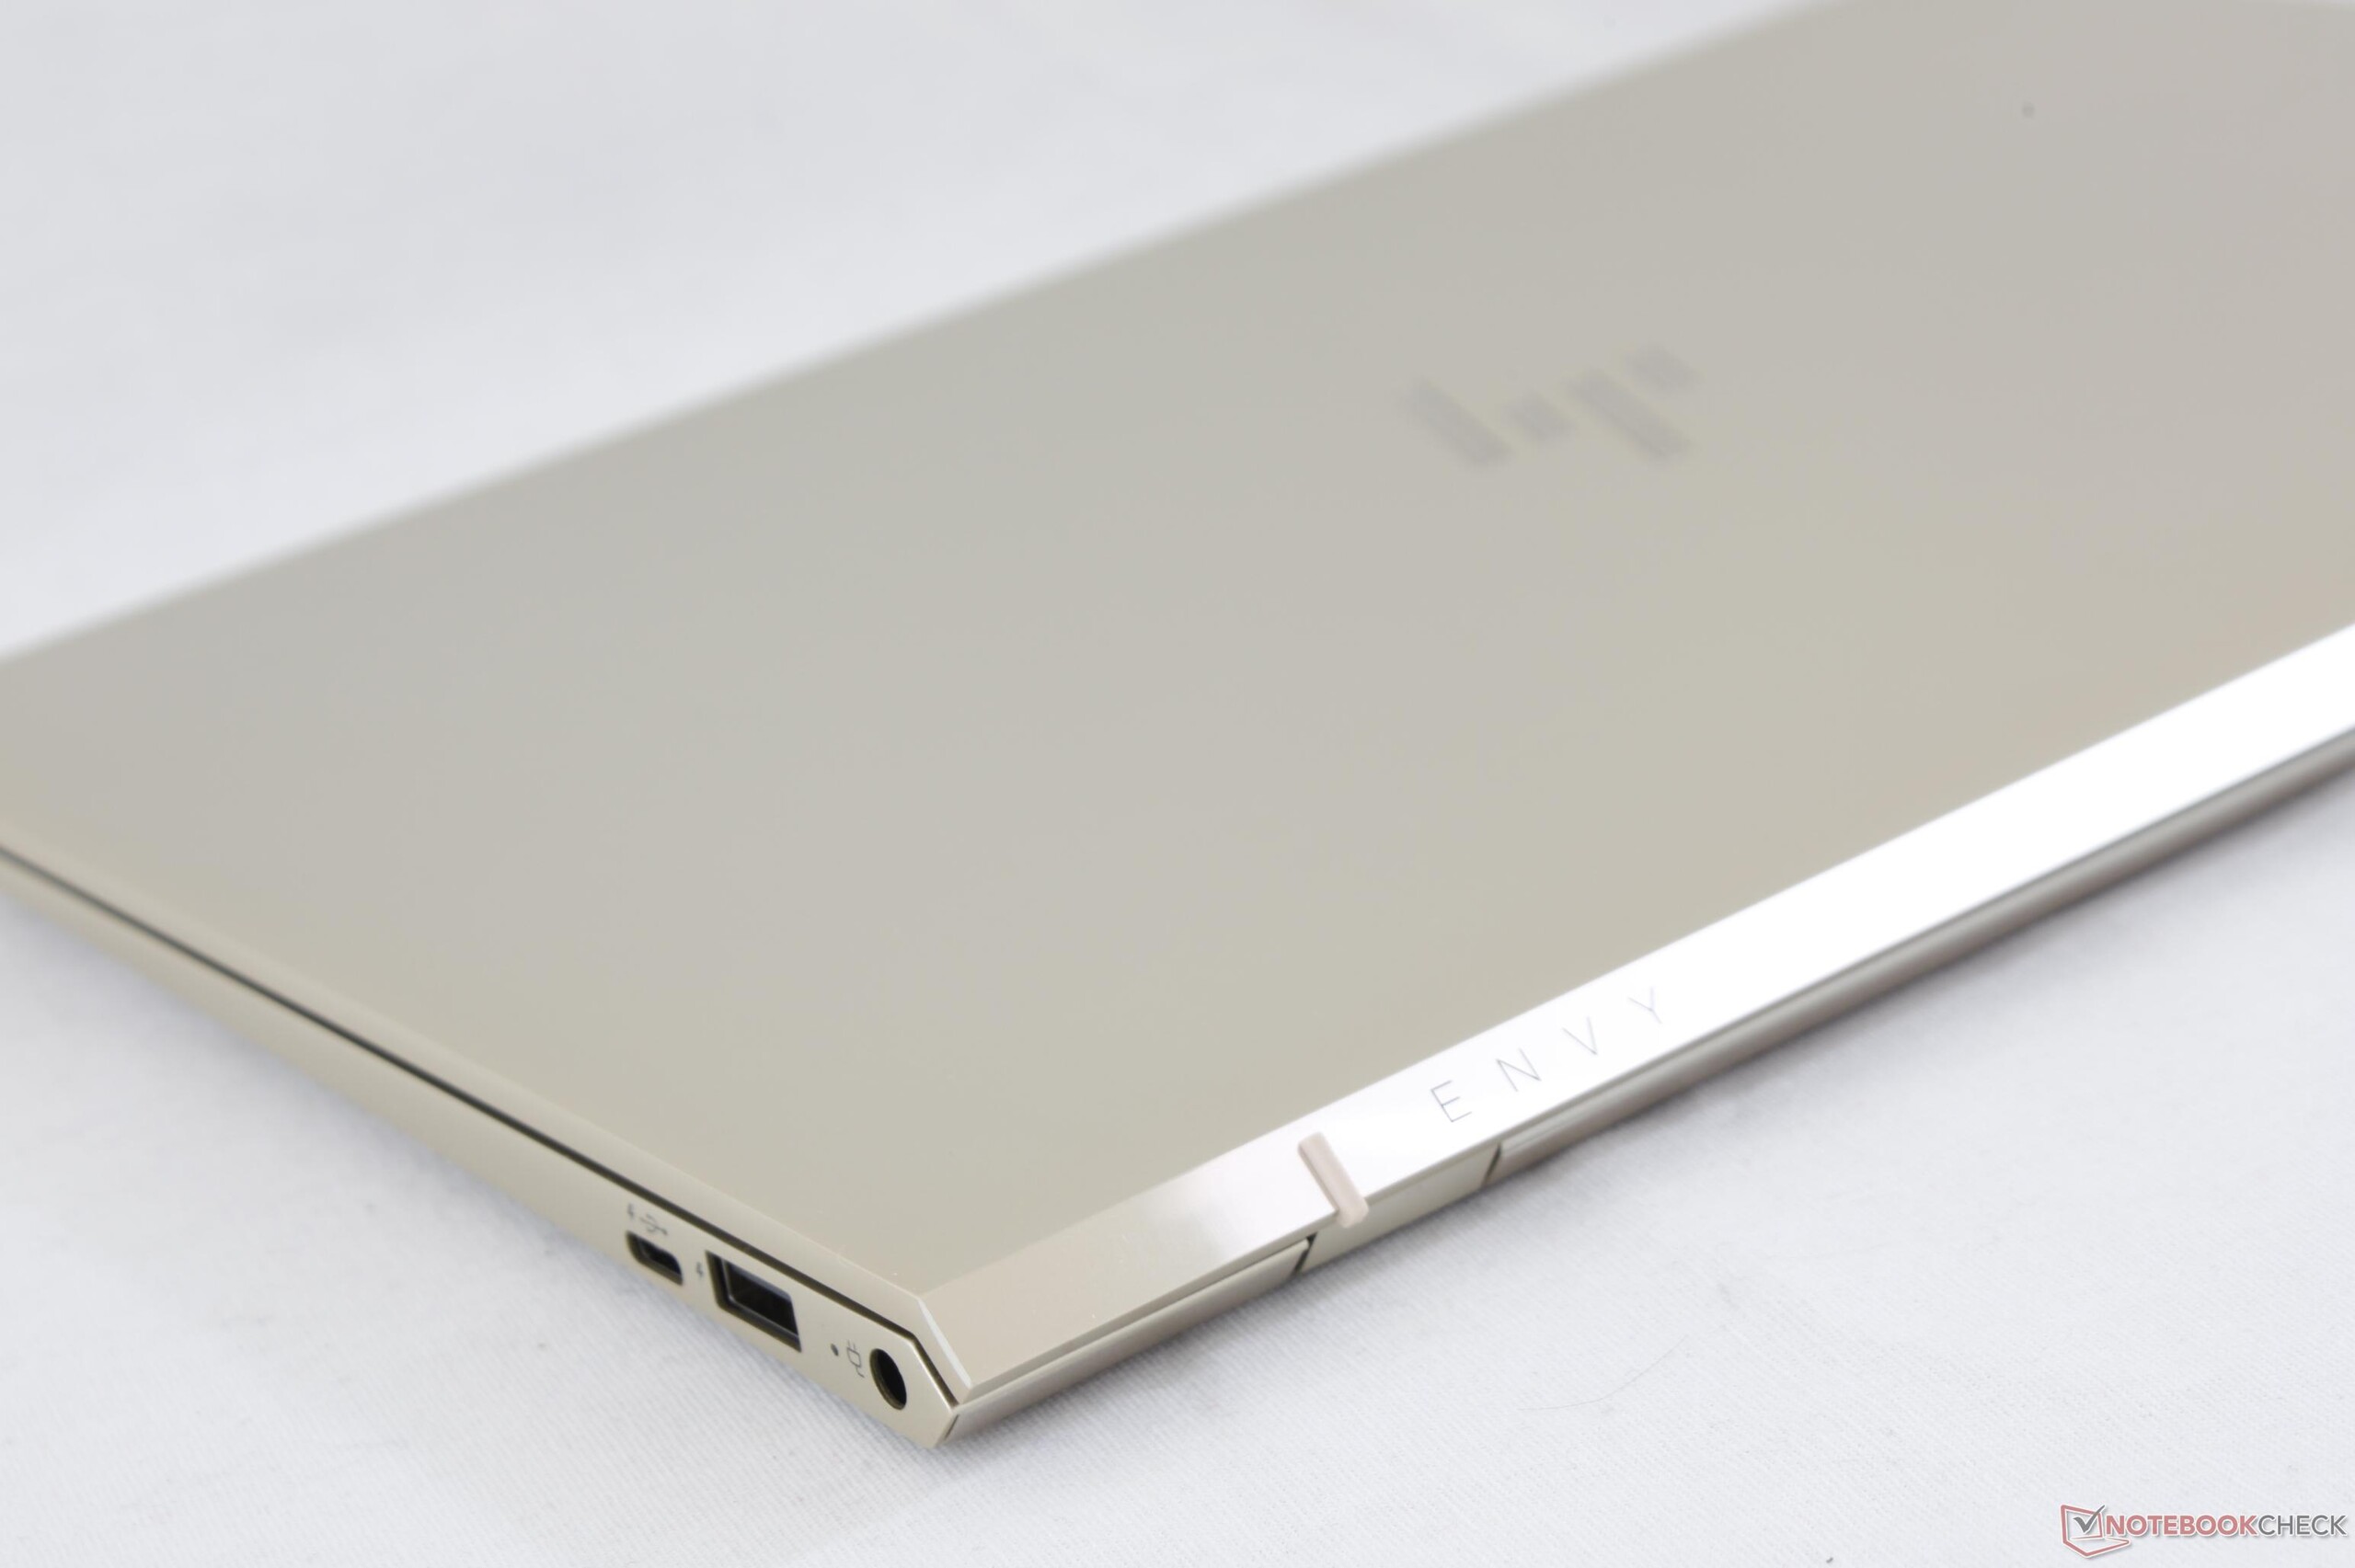
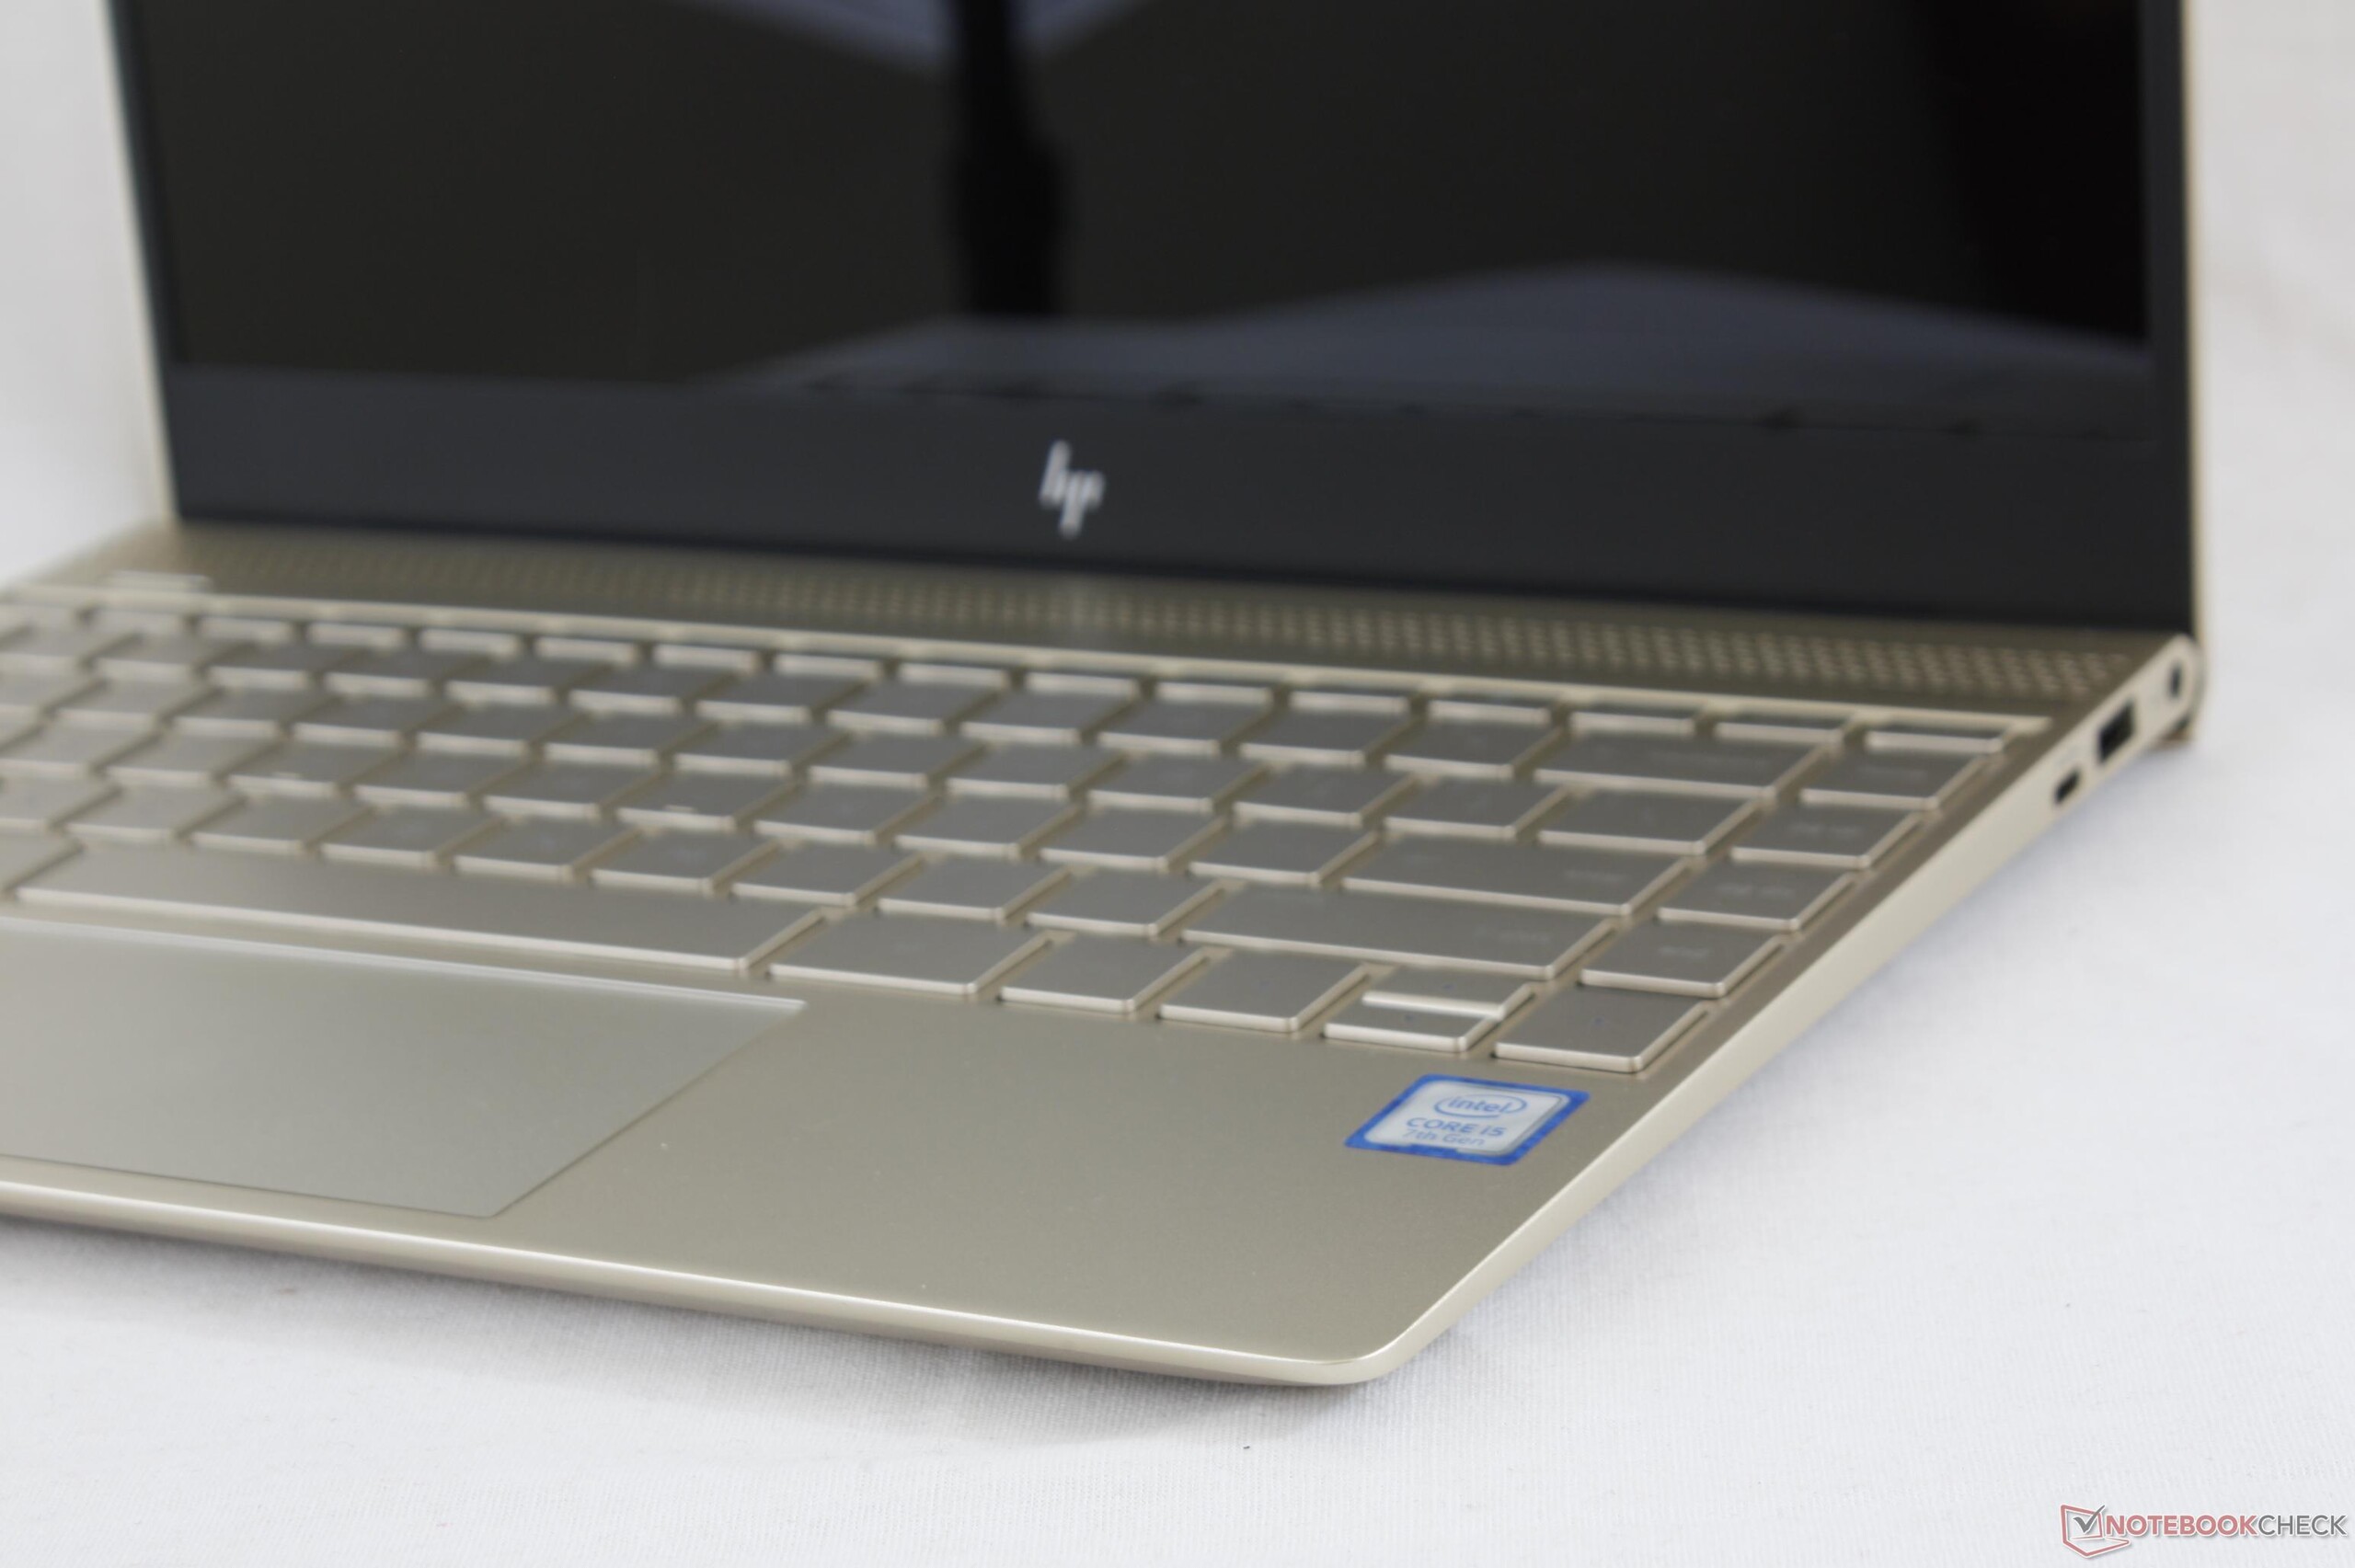
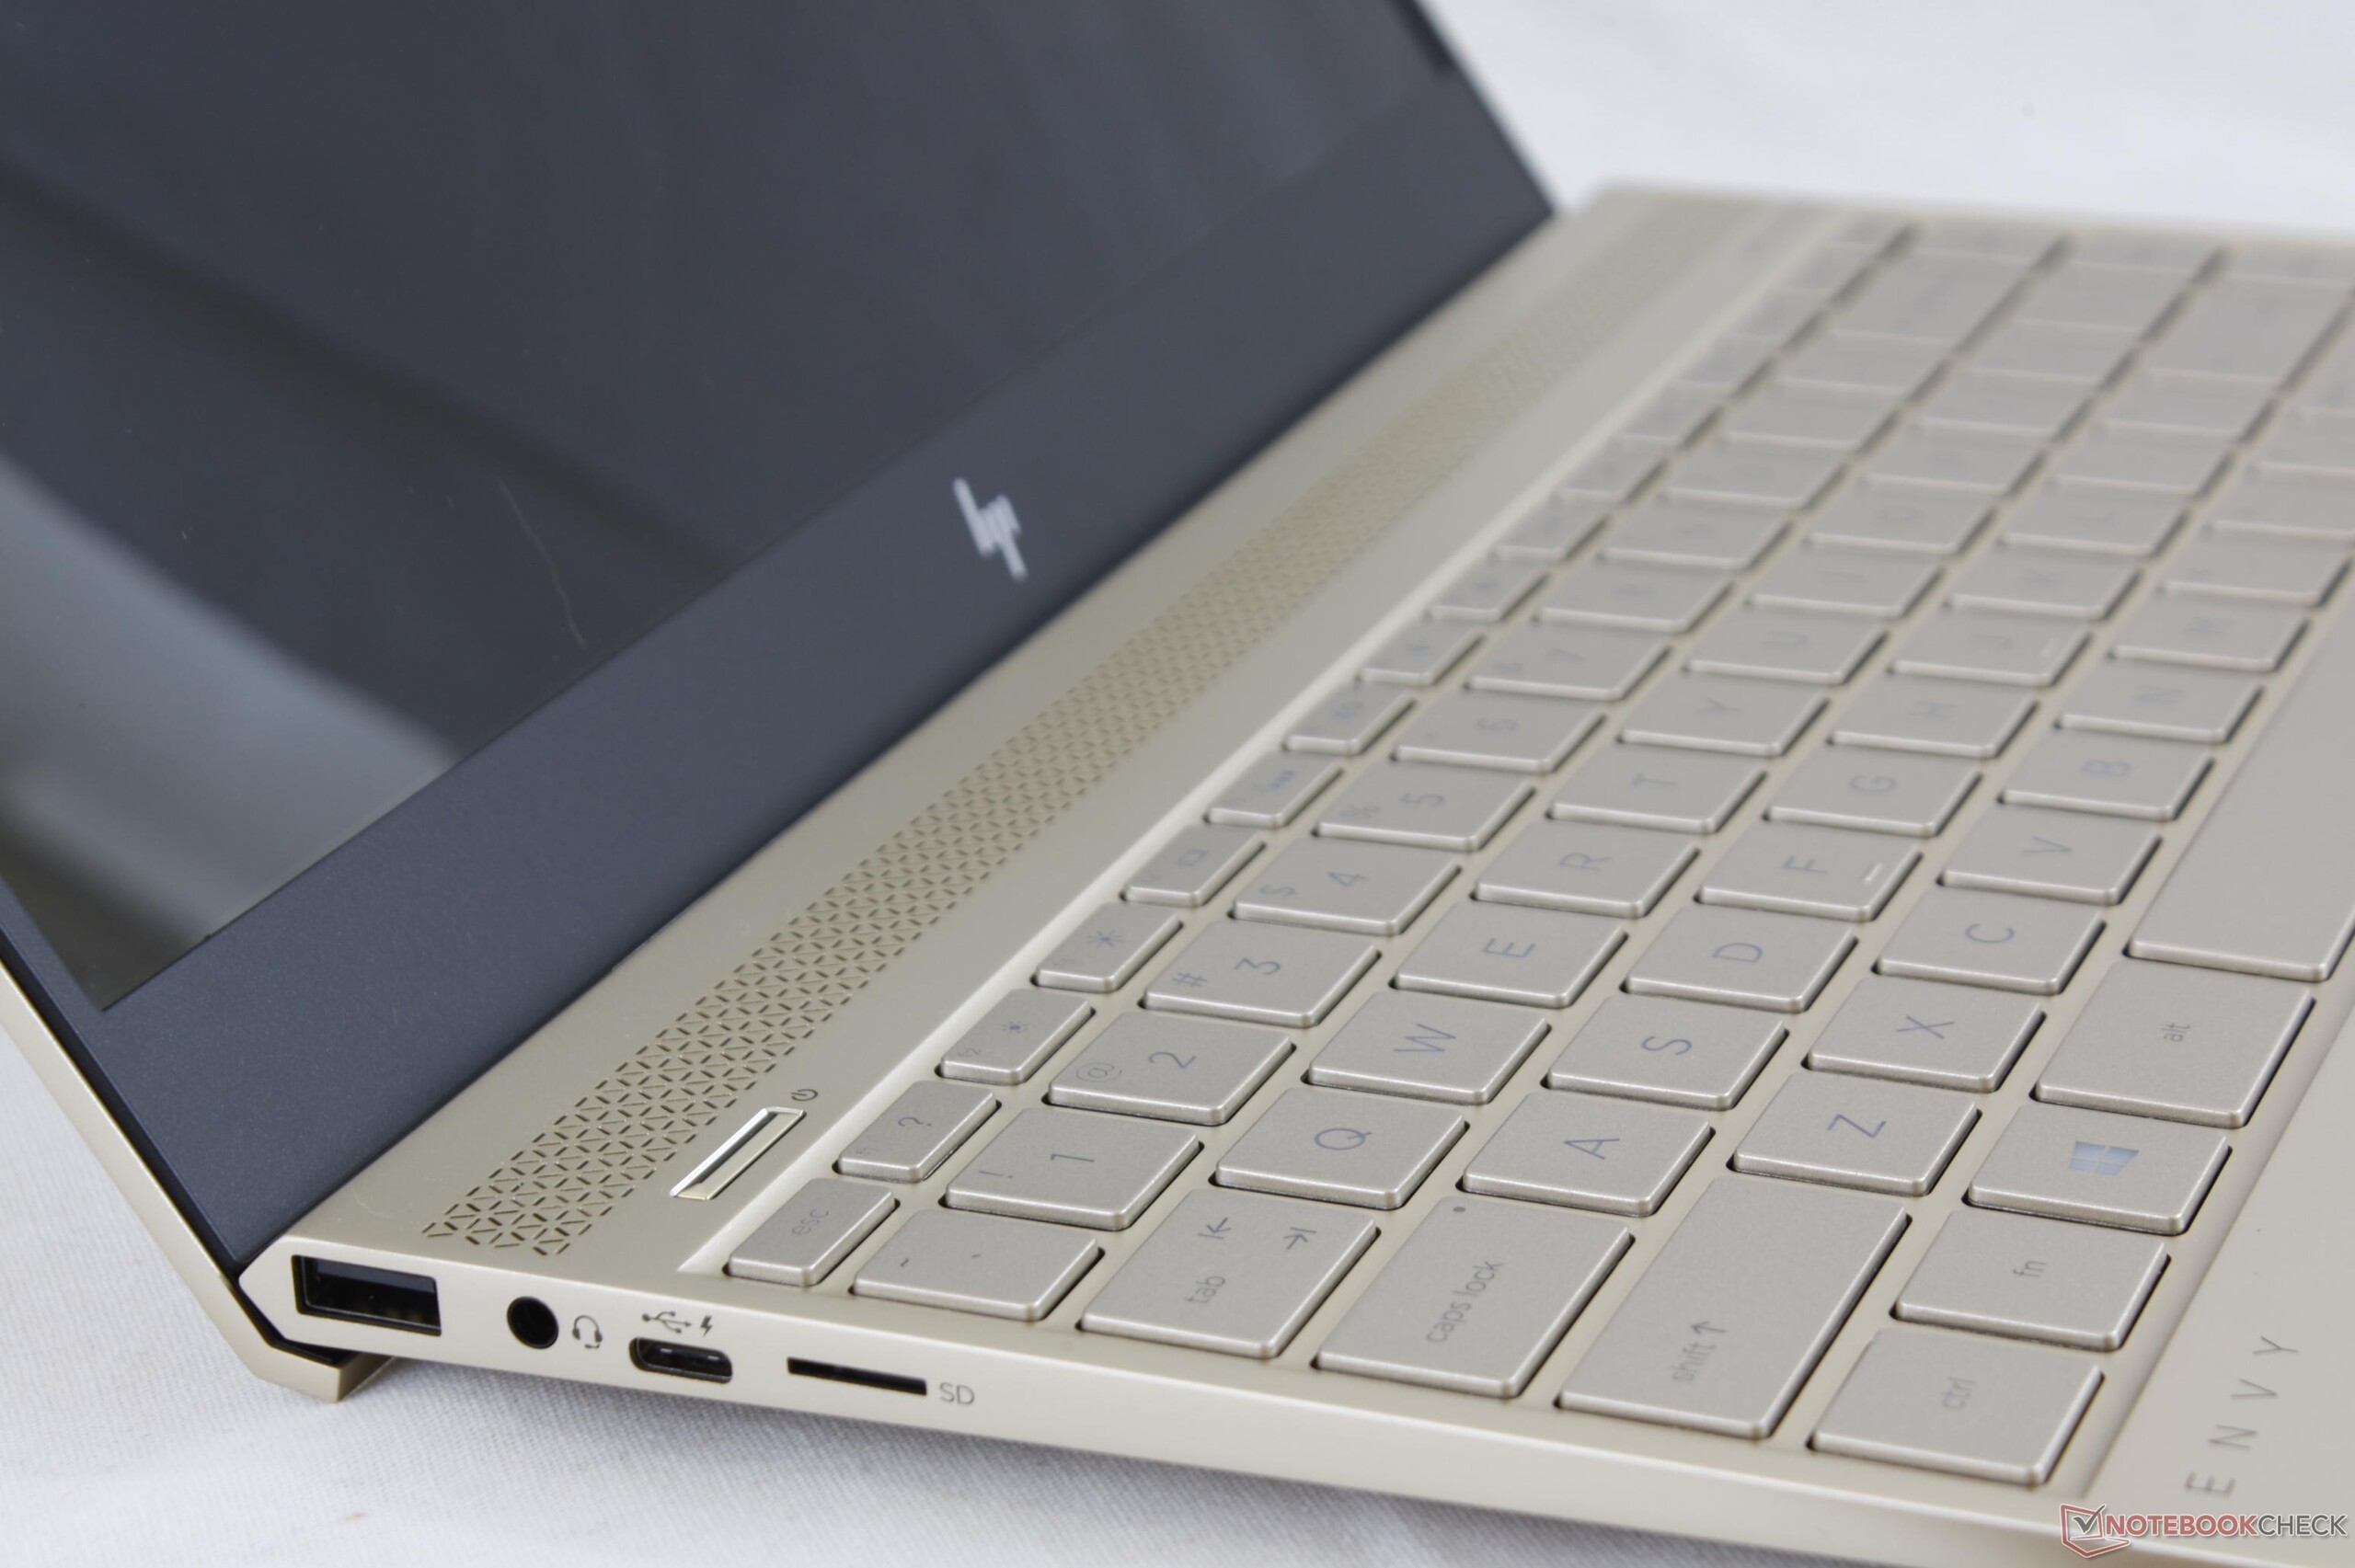
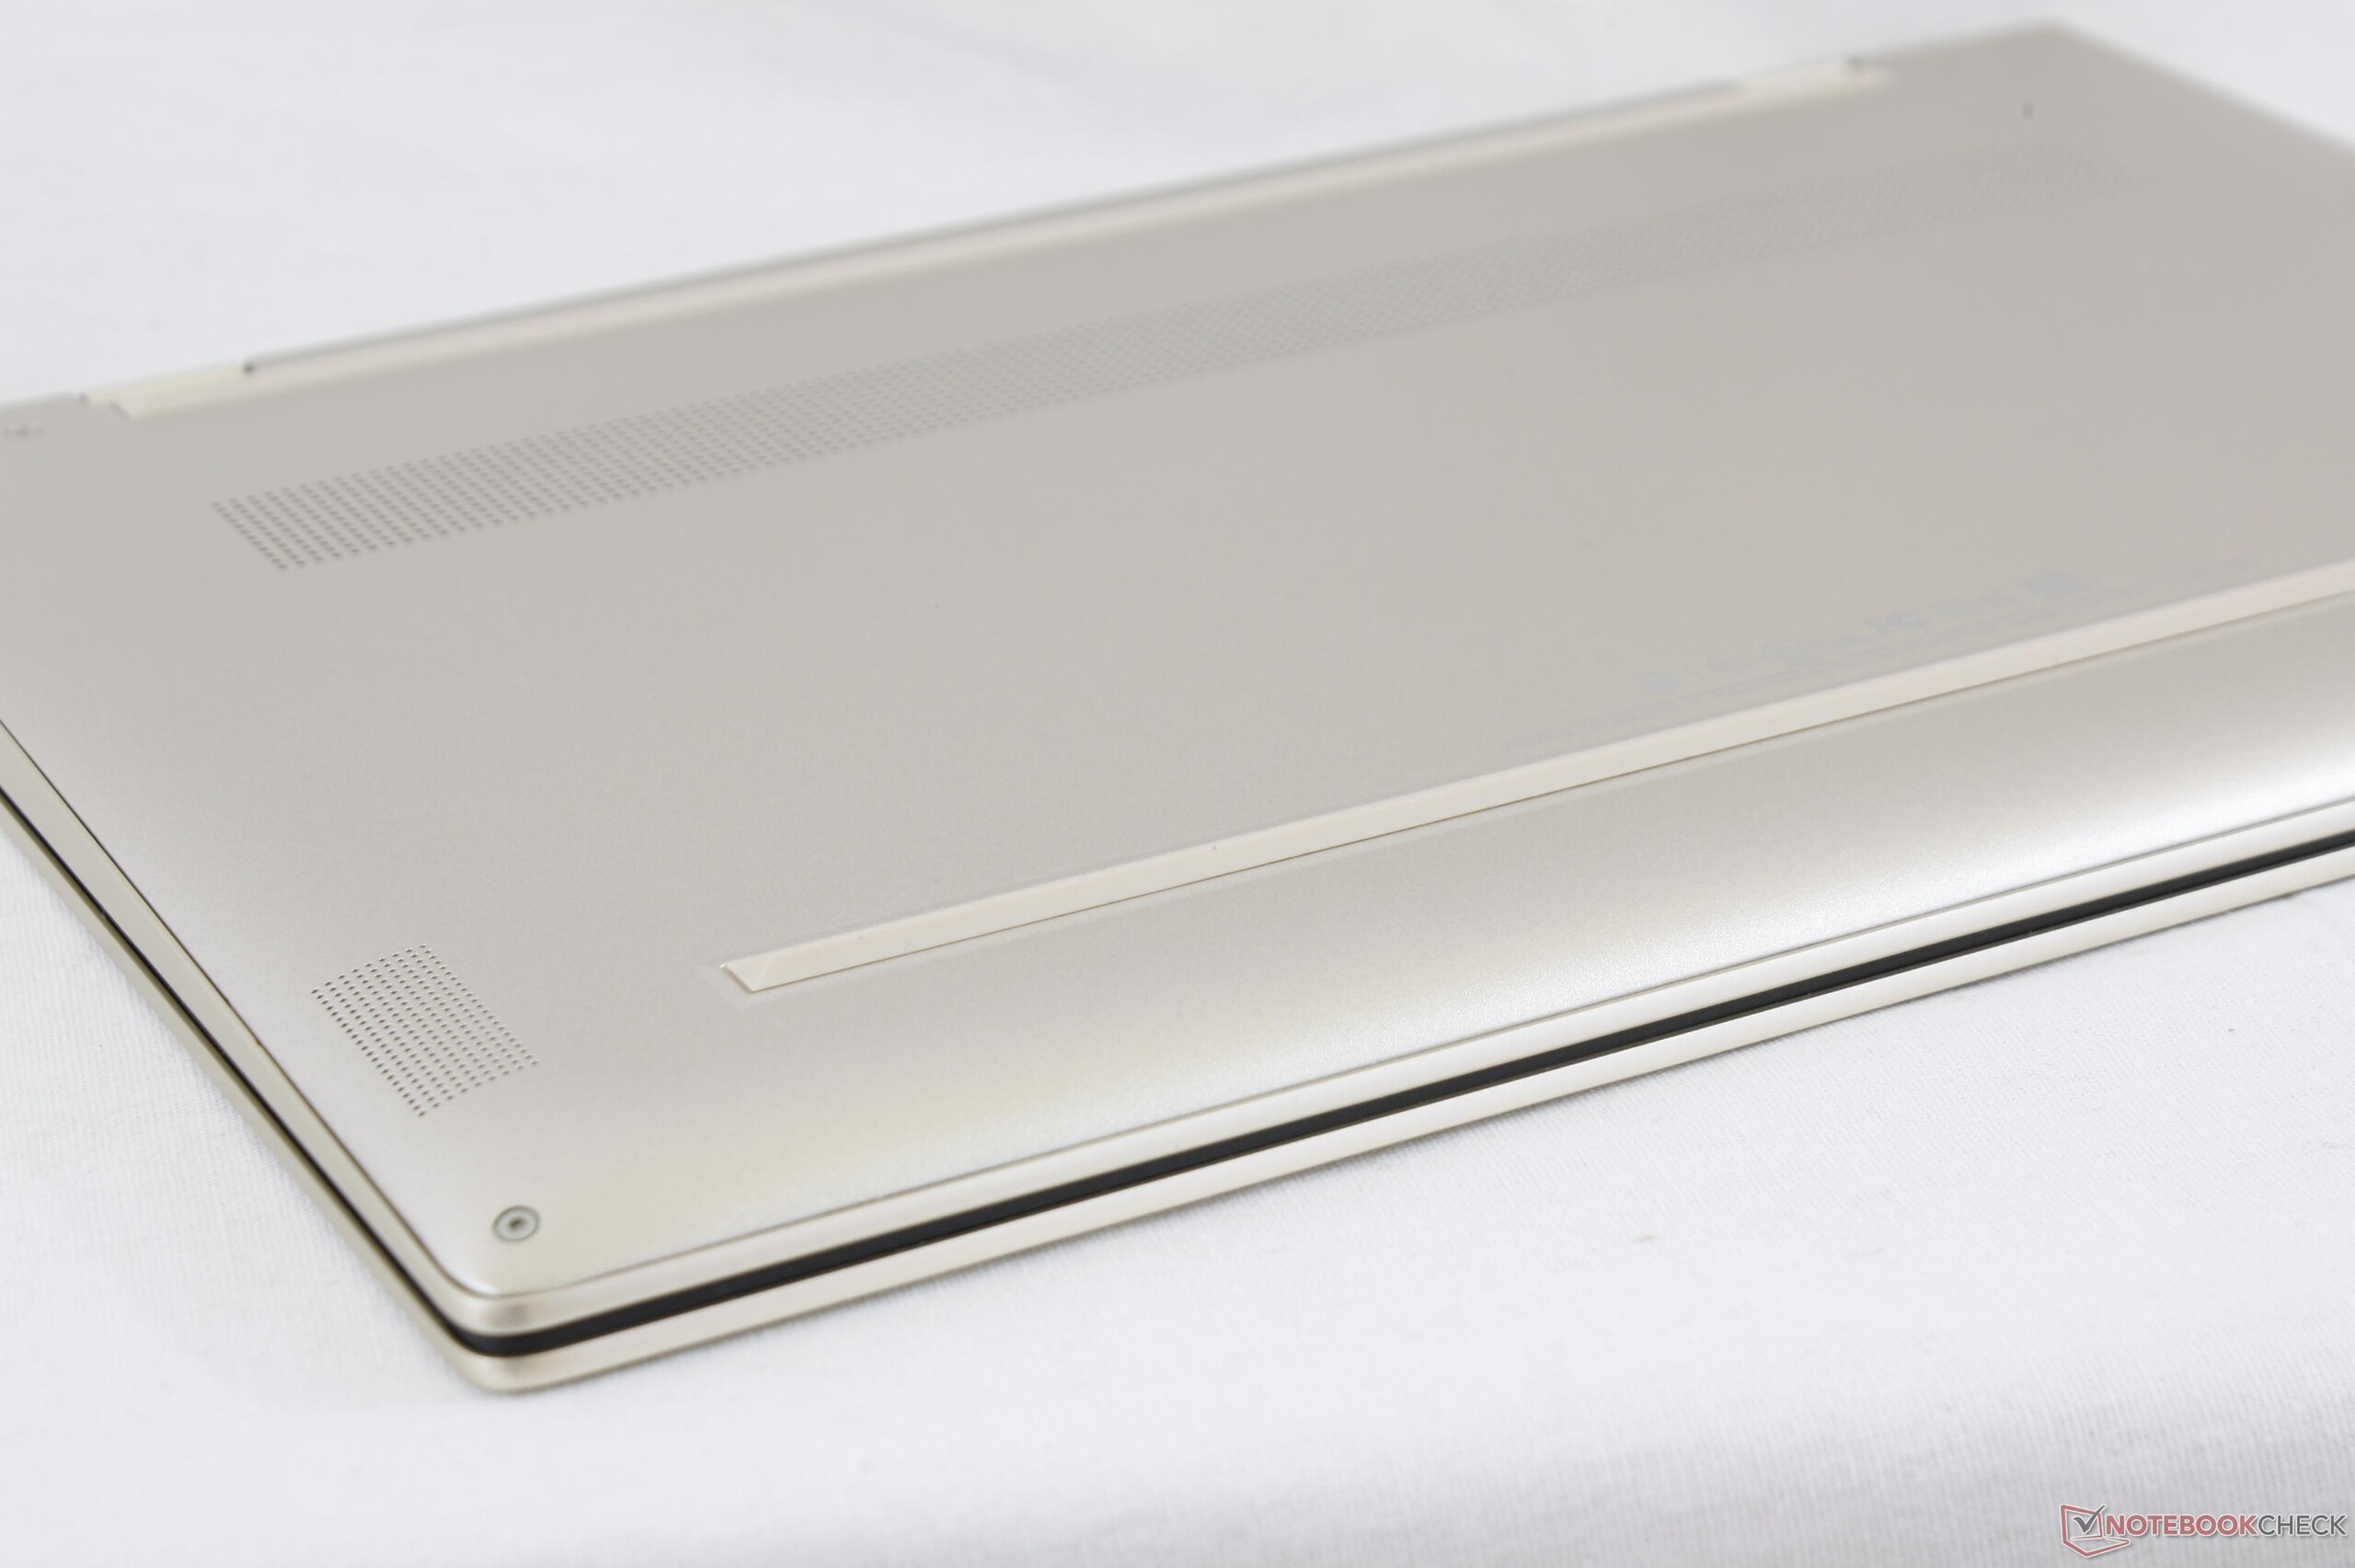
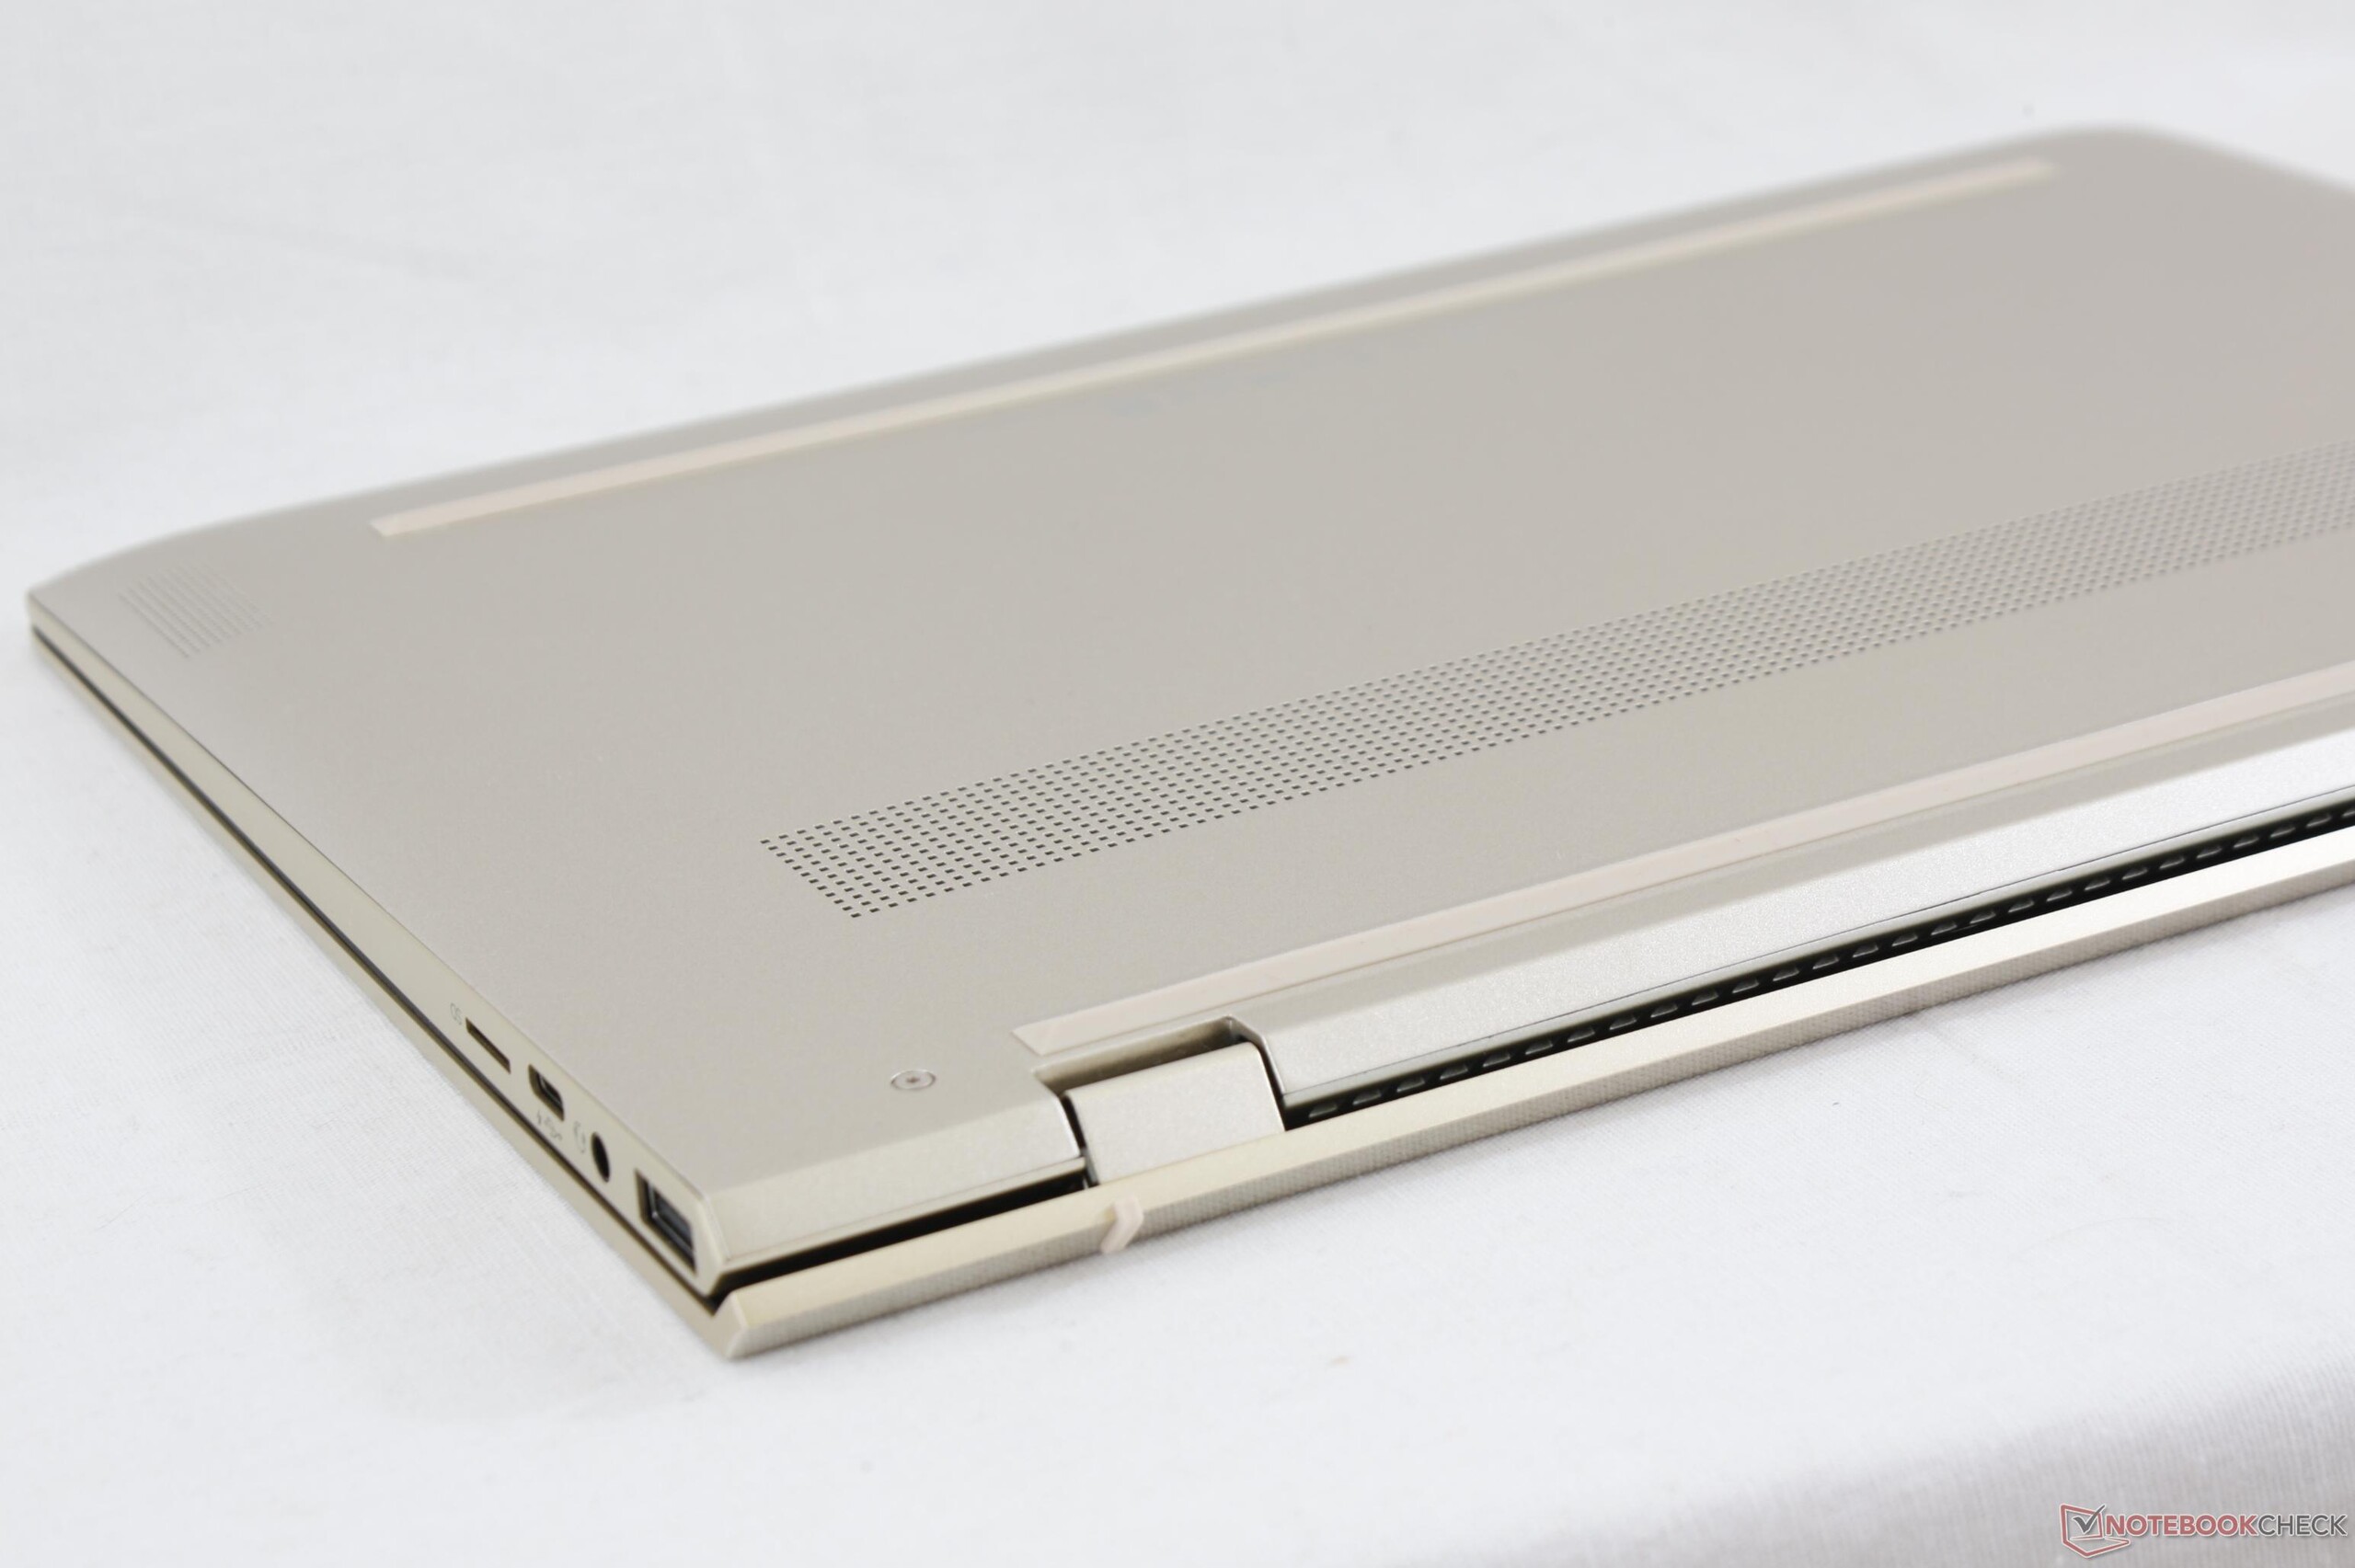
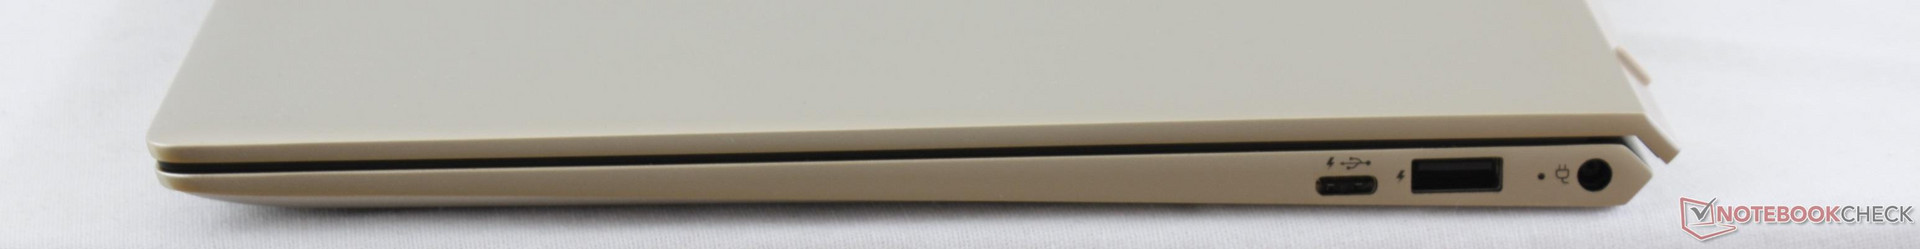
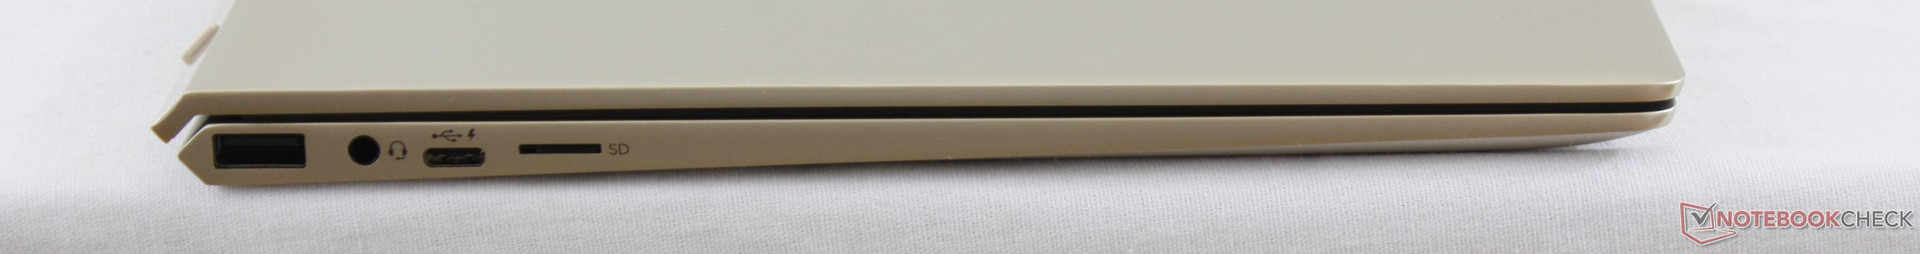
Mentre il nuovo chassis è sicuramente più portatile ed attraente rispetto all'Envy 13 precedente, l'assenza di una porta HDMI e di un lettore SD full-size può irritare qualcuno. Sia la tastiera che il clickpad potrebbero avere un feedback migliore e la ventola, in genere silenziosa, ha dei picchi fastidiosi. Il pannello matto e l'opzione Iris Graphics avrebbero reso l'Envy 13 un Ultrabook più versatile per chi viaggia spesso o chi chiede maggiore potenza grafica. Investire un paio di centinaia di dollari in più per l'XPS 13 o per lo Spectre x360 13 vi consentirà di avere un design più robusto, una tastiera più salda, e una connettività più estesa. Pertanto le SKUs Envy 13 superiori sono più difficili da giustificare in quanto il margine di potenza aggiuntiva è minimo rispetto a rigidità e qualità di XPS 13 o Spectre.
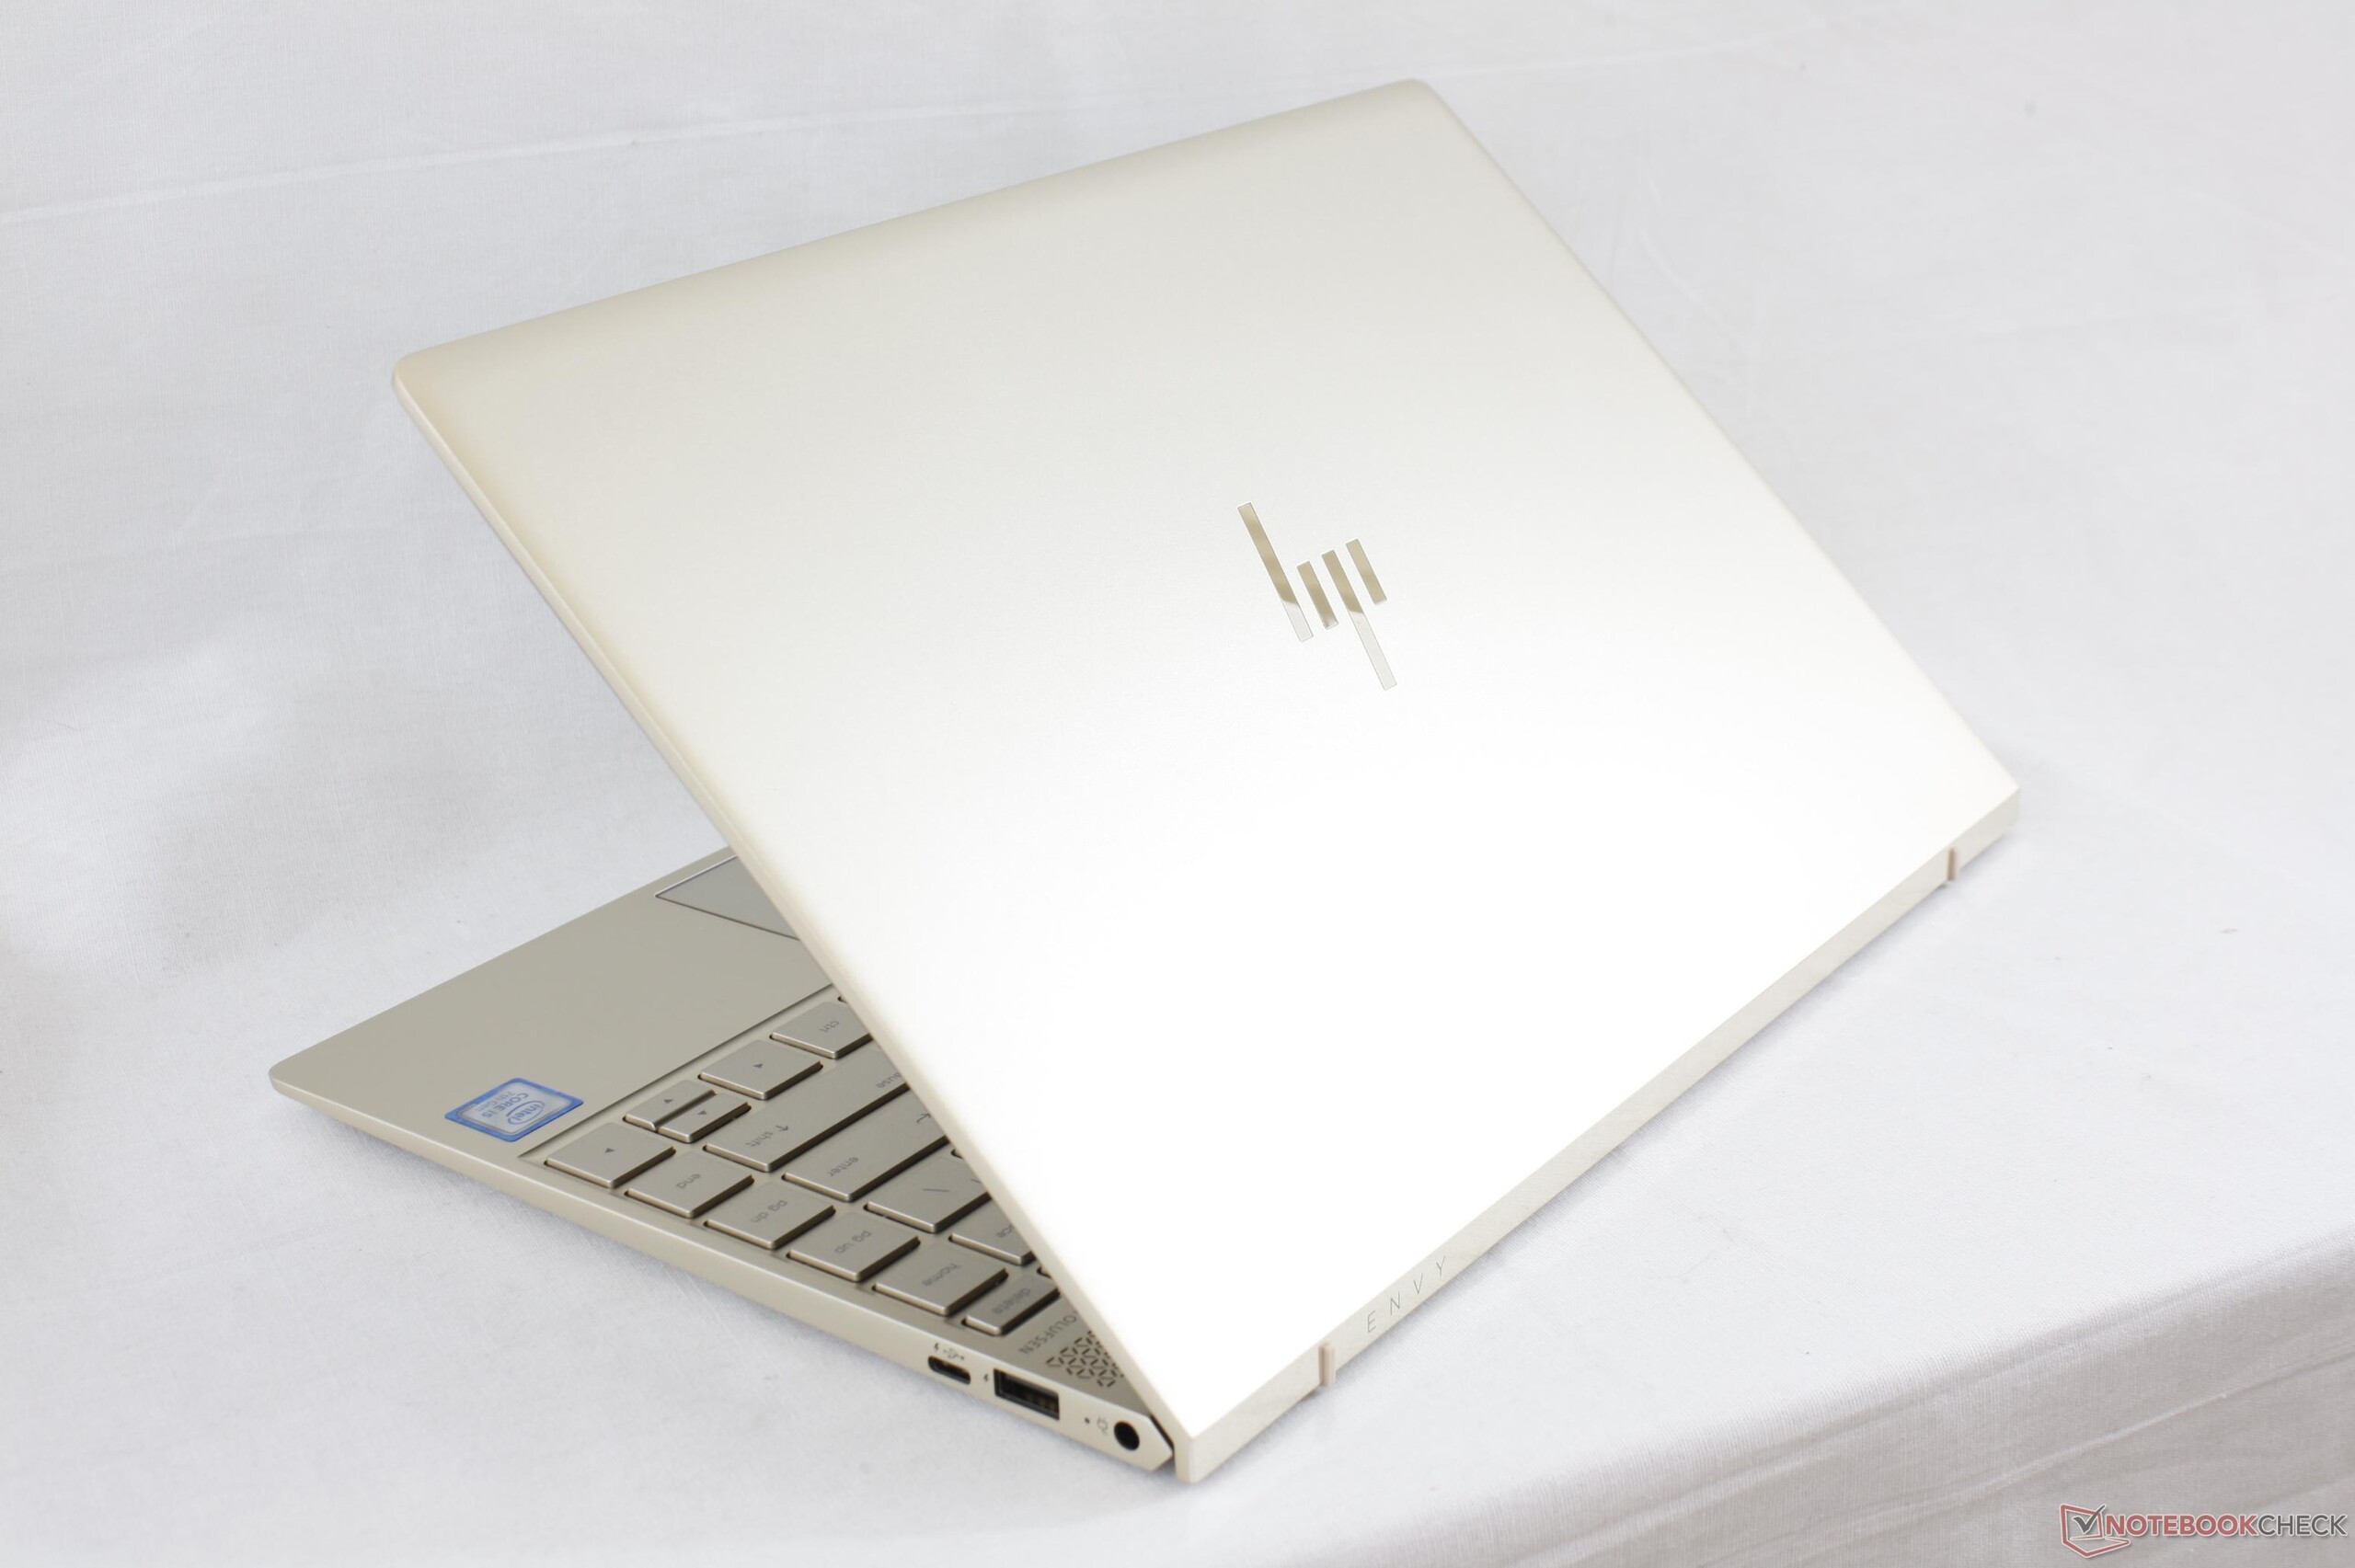
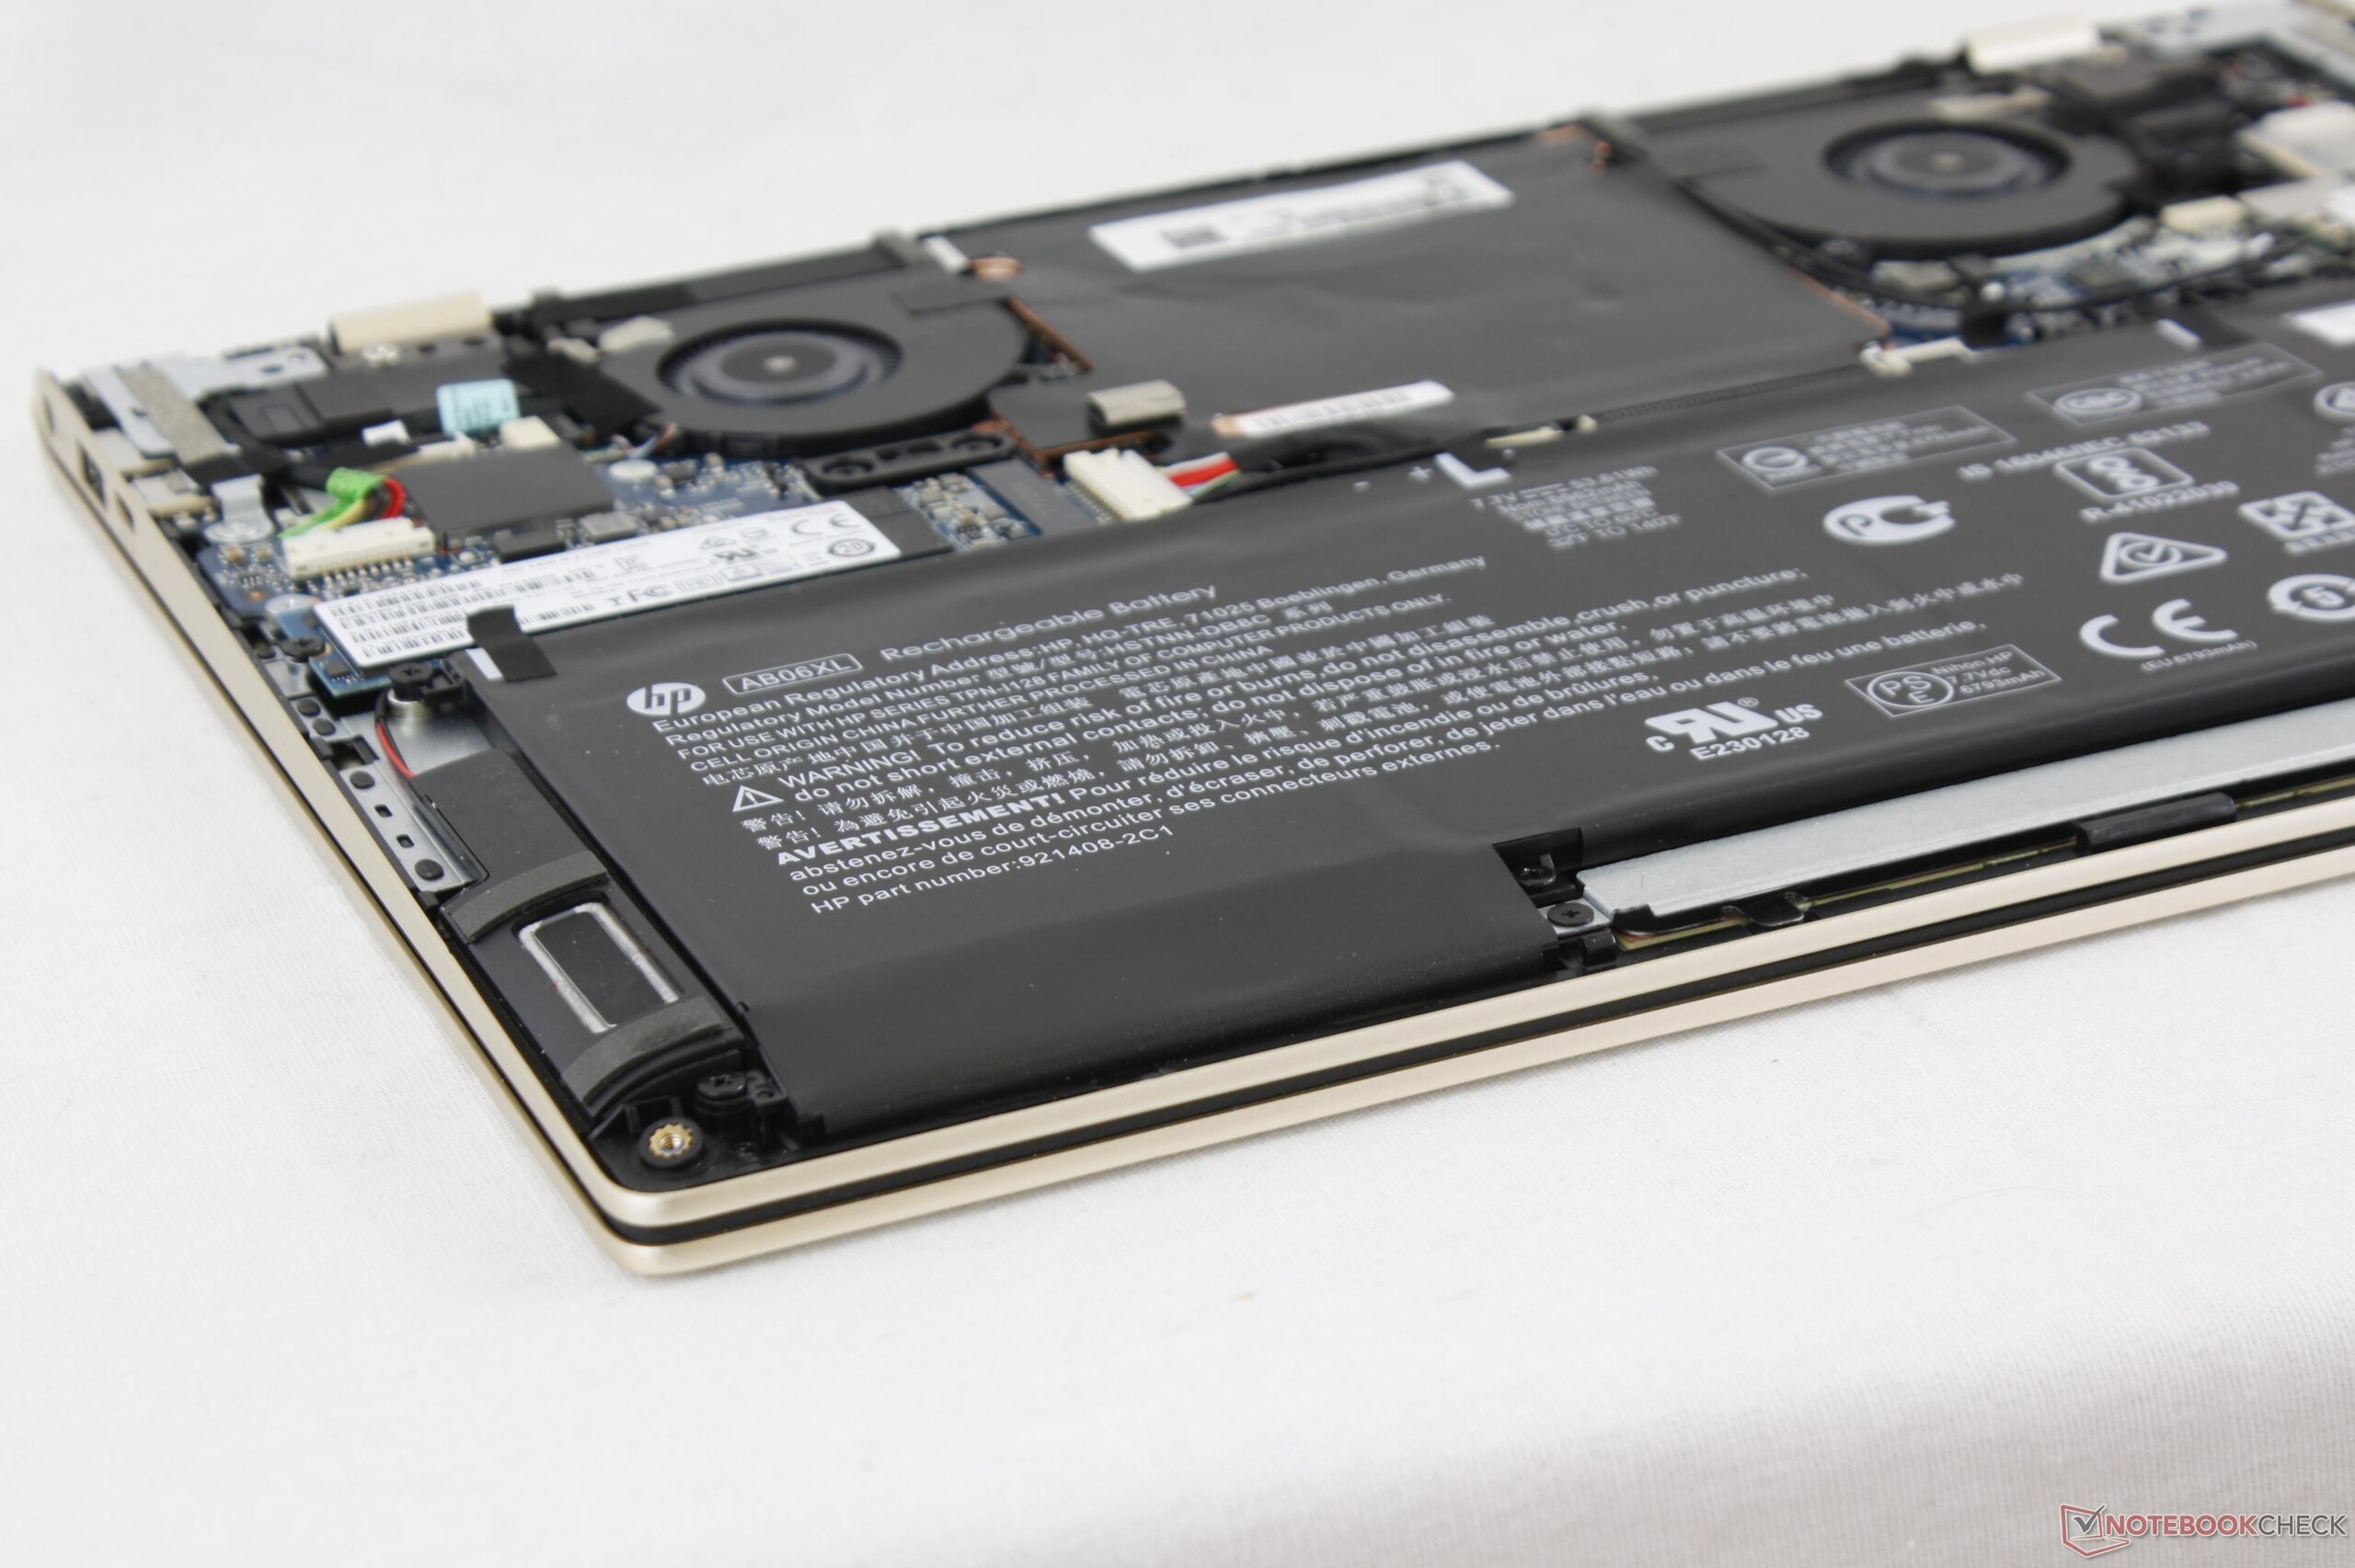
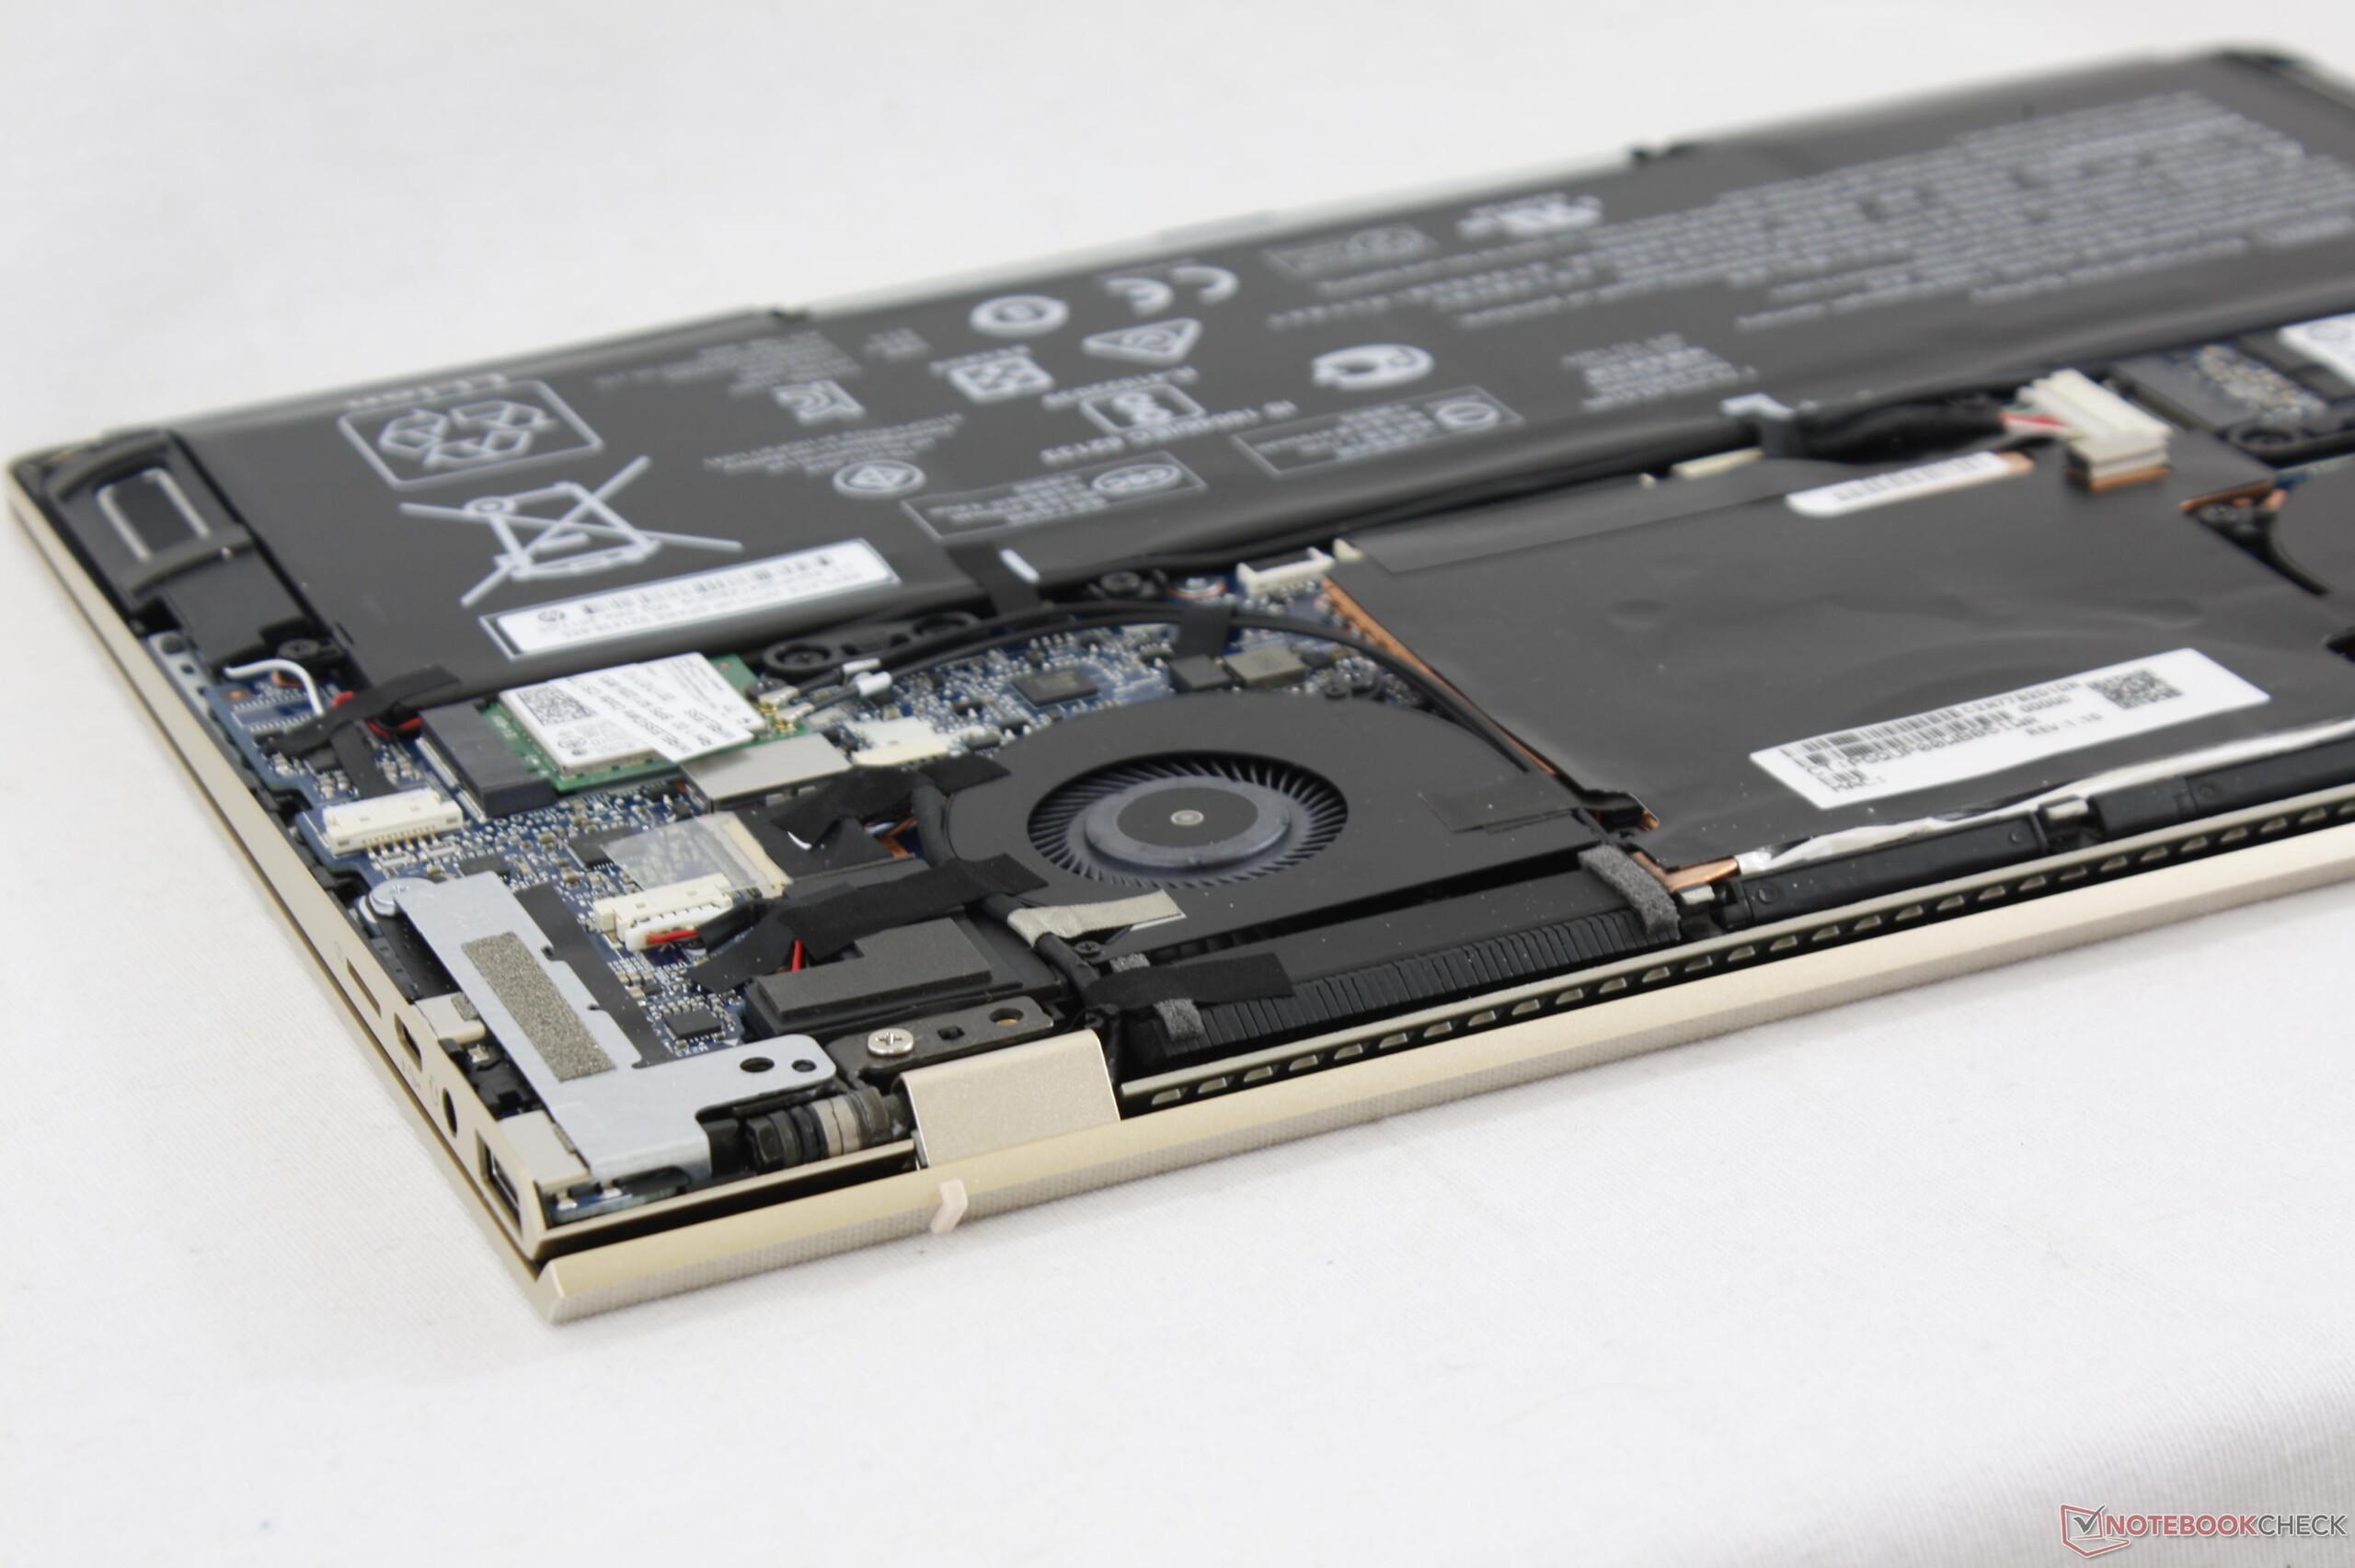
L'Envy 13 2017 rappresenta un miglioramento rispetto al modello 2016 con una batteria più grande, porte USB Type-C integrate, e dimensioni e peso inferiori. Siamo ancora dietro alle ammiraglie delle serie XPS 13 e Spectre, ma le SKU low-end comunque rappresentano una buona alternativa rispetto alle ingombranti alternative di fascia media.
Nota: si tratta di una recensione breve, con alcune sezioni non tradotte, per la versione integrale in inglese guardate qui.
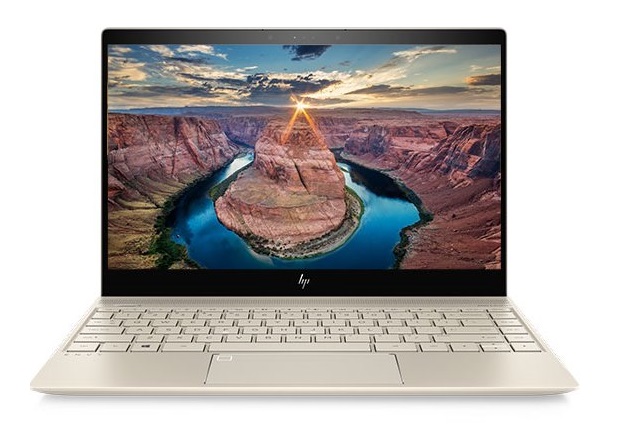
HP Envy 13-ad065nr
- 08/09/2017 v6 (old)
Allen Ngo
Price comparison
