Recensione breve del Portatile Samsung Notebook 9 NP900X5N (7500U, FHD, GeForce 940MX)
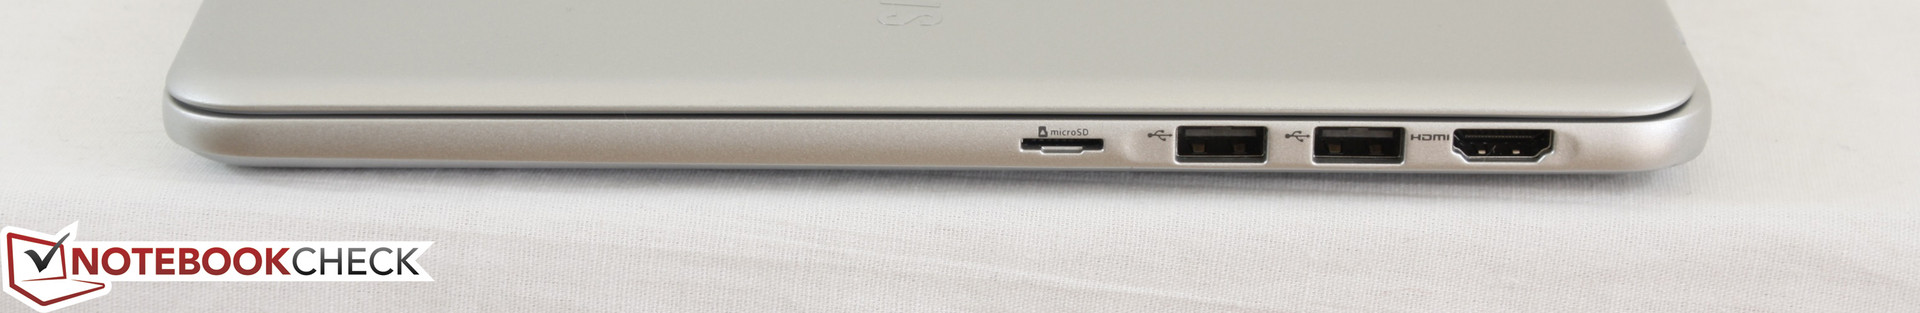
| SD Card Reader | |
| average JPG Copy Test (av. of 3 runs) | |
| Dell XPS 15 9560 (i7-7700HQ, UHD) | |
| Samsung Notebook 9 NP900X5N-X01US | |
| Dell Latitude 12 5285 2-in-1 | |
| maximum AS SSD Seq Read Test (1GB) | |
| Dell XPS 15 9560 (i7-7700HQ, UHD) | |
| Dell Latitude 12 5285 2-in-1 | |
| Samsung Notebook 9 NP900X5N-X01US | |
| Networking | |
| iperf3 transmit AX12 | |
| Dell XPS 15 9560 (i7-7700HQ, UHD) | |
| Samsung Notebook 9 NP900X5N-X01US | |
| Dell XPS 13 9365-4537 2-in-1 | |
| iperf3 receive AX12 | |
| Samsung Notebook 9 NP900X5N-X01US | |
| Dell XPS 15 9560 (i7-7700HQ, UHD) | |
| Dell XPS 13 9365-4537 2-in-1 | |
| |||||||||||||||||||||||||
Distribuzione della luminosità: 88 %
Al centro con la batteria: 565.6 cd/m²
Contrasto: 1154:1 (Nero: 0.49 cd/m²)
ΔE ColorChecker Calman: 2 | ∀{0.5-29.43 Ø4.72}
ΔE Greyscale Calman: 2.5 | ∀{0.09-98 Ø4.97}
97.5% sRGB (Argyll 1.6.3 3D)
61.2% AdobeRGB 1998 (Argyll 1.6.3 3D)
67.2% AdobeRGB 1998 (Argyll 3D)
97.7% sRGB (Argyll 3D)
65.2% Display P3 (Argyll 3D)
Gamma: 2.21
CCT: 6896 K
| Samsung Notebook 9 NP900X5N-X01US ID: BOE06E8, Name: BOE HF NV150FHB-N31, IPS, 15", 1920x1080 | Dell XPS 15 2017 9560 (7300HQ, Full-HD) Sharp SHP1453 LQ156M1, LED IGZO IPS InfinityEdge, 15.6", 1920x1080 | Apple MacBook Pro 15 2016 (2.9 GHz, 460) Apple APPA030, IPS, 15.4", 2880x1800 | HP Spectre x360 15-bl002xx UHD UWVA eDP BrightView WLED-backlit , IPS, 15.6", 3840x2160 | Lenovo ThinkPad T570-20HAS01E00 BOE NV156QUM-N44, IPS, 15.6", 3840x2160 | |
|---|---|---|---|---|---|
| Display | 4% | 28% | -3% | -0% | |
| Display P3 Coverage (%) | 65.2 | 68.9 6% | 99 52% | 67.9 4% | 70 7% |
| sRGB Coverage (%) | 97.7 | 98.9 1% | 100 2% | 88.2 -10% | 91.1 -7% |
| AdobeRGB 1998 Coverage (%) | 67.2 | 70.9 6% | 87.3 30% | 64.4 -4% | 66.7 -1% |
| Response Times | -47% | -43% | -14% | 26% | |
| Response Time Grey 50% / Grey 80% * (ms) | 40.8 ? | 54 ? -32% | 46 ? -13% | 44 ? -8% | 41.6 ? -2% |
| Response Time Black / White * (ms) | 32.4 ? | 52.4 ? -62% | 56 ? -73% | 38.8 ? -20% | 15.2 ? 53% |
| PWM Frequency (Hz) | 208.3 ? | 119000 ? | 1000 ? | 926 ? | |
| Screen | -42% | -3% | -9% | -35% | |
| Brightness middle (cd/m²) | 565.6 | 400 -29% | 420 -26% | 351.5 -38% | 339 -40% |
| Brightness (cd/m²) | 524 | 392 -25% | 401 -23% | 336 -36% | 314 -40% |
| Brightness Distribution (%) | 88 | 89 1% | 90 2% | 83 -6% | 89 1% |
| Black Level * (cd/m²) | 0.49 | 0.26 47% | 0.3 39% | 0.24 51% | 0.36 27% |
| Contrast (:1) | 1154 | 1538 33% | 1400 21% | 1465 27% | 942 -18% |
| Colorchecker dE 2000 * | 2 | 4.9 -145% | 3.33 -67% | 3.3 -65% | 4.2 -110% |
| Colorchecker dE 2000 max. * | 5 | 11 -120% | 5.11 -2% | 7.3 -46% | 7.8 -56% |
| Greyscale dE 2000 * | 2.5 | 7.2 -188% | 2.73 -9% | 1.9 24% | 5.1 -104% |
| Gamma | 2.21 100% | 2.11 104% | 2.48 89% | 2.09 105% | 2.16 102% |
| CCT | 6896 94% | 6911 94% | 6457 101% | 6784 96% | 6569 99% |
| Color Space (Percent of AdobeRGB 1998) (%) | 61.2 | 64.2 5% | 78.09 28% | 64.4 5% | 59.4 -3% |
| Color Space (Percent of sRGB) (%) | 97.5 | 98.9 1% | 99.97 3% | 88.2 -10% | 91 -7% |
| Media totale (Programma / Settaggio) | -28% /
-33% | -6% /
-2% | -9% /
-9% | -3% /
-20% |
* ... Meglio usare valori piccoli
Tempi di risposta del Display
| ↔ Tempi di risposta dal Nero al Bianco | ||
|---|---|---|
| 32.4 ms ... aumenta ↗ e diminuisce ↘ combinato | ↗ 17.6 ms Incremento | 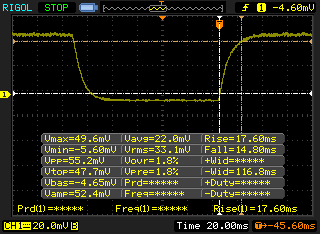 |
| ↘ 14.8 ms Calo | ||
| Lo schermo mostra tempi di risposta lenti nei nostri tests e sarà insoddisfacente per i gamers. In confronto, tutti i dispositivi di test variano da 0.1 (minimo) a 240 (massimo) ms. » 88 % di tutti i dispositivi è migliore. Questo significa che i tempi di risposta rilevati sono peggiori rispetto alla media di tutti i dispositivi testati (19.8 ms). | ||
| ↔ Tempo di risposta dal 50% Grigio all'80% Grigio | ||
| 40.8 ms ... aumenta ↗ e diminuisce ↘ combinato | ↗ 20.4 ms Incremento | 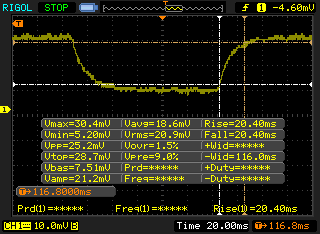 |
| ↘ 20.4 ms Calo | ||
| Lo schermo mostra tempi di risposta lenti nei nostri tests e sarà insoddisfacente per i gamers. In confronto, tutti i dispositivi di test variano da 0.165 (minimo) a 636 (massimo) ms. » 64 % di tutti i dispositivi è migliore. Questo significa che i tempi di risposta rilevati sono peggiori rispetto alla media di tutti i dispositivi testati (31 ms). | ||
Sfarfallio dello schermo / PWM (Pulse-Width Modulation)
| flickering dello schermo / PWM rilevato | 208.3 Hz | ≤ 99 % settaggio luminosita' | 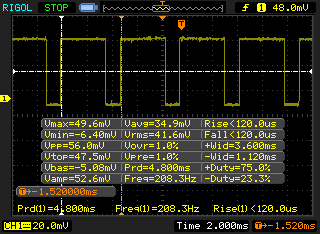 |
Il display sfarfalla a 208.3 Hz (Probabilmente a causa dell'uso di PWM) Flickering rilevato ad una luminosita' di 99 % o inferiore. Non dovrebbe verificarsi flickering o PWM sopra questo valore di luminosita'. La frequenza di 208.3 Hz è relativamente bassa, quindi gli utenti sensibili potrebbero notare il flickering ed accusare stanchezza agli occhi a questo livello di luminosità e a livelli inferiori. In confronto: 52 % di tutti i dispositivi testati non utilizza PWM per ridurre la luminosita' del display. Se è rilevato PWM, una media di 7763 (minimo: 5 - massimo: 343500) Hz è stata rilevata. | |||
| wPrime 2.10 - 1024m | |
| Lenovo Thinkpad 13-20J1001BUS | |
| Acer TravelMate P449-M-7407 | |
| Dell Latitude 5280 | |
| Samsung Notebook 9 NP900X5N-X01US | |
| Apple MacBook Pro 15 2016 (2.7 GHz, 455) | |
* ... Meglio usare valori piccoli
| PCMark 8 | |
| Home Score Accelerated v2 | |
| Apple MacBook Pro 15 2016 (2.9 GHz, 460) | |
| Samsung Notebook 9 NP900X5N-X01US | |
| Dell XPS 15 9560 (i7-7700HQ, UHD) | |
| Work Score Accelerated v2 | |
| Samsung Notebook 9 NP900X5N-X01US | |
| Apple MacBook Pro 15 2016 (2.9 GHz, 460) | |
| Dell XPS 15 9560 (i7-7700HQ, UHD) | |
| Creative Score Accelerated v2 | |
| Dell XPS 15 9560 (i7-7700HQ, UHD) | |
| Apple MacBook Pro 15 2016 (2.9 GHz, 460) | |
| Samsung Notebook 9 NP900X5N-X01US | |
| PCMark 8 Home Score Accelerated v2 | 3852 punti | |
| PCMark 8 Creative Score Accelerated v2 | 4769 punti | |
| PCMark 8 Work Score Accelerated v2 | 4928 punti | |
Aiuto | ||
| Samsung Notebook 9 NP900X5N-X01US Samsung PM961 MZVLW256HEHP | Dell XPS 15 9560 (i7-7700HQ, UHD) Lite-On CX2-8B512-Q11 | Apple MacBook Pro 15 2016 (2.9 GHz, 460) Apple SSD SM1024L | HP Spectre x360 15-bl002xx Toshiba XG4 NVMe (THNSN5512GPUK) | Lenovo ThinkPad T570-20HAS01E00 Samsung PM961 NVMe MZVLW512HMJP | |
|---|---|---|---|---|---|
| CrystalDiskMark 3.0 | 8% | -3% | -6% | 5% | |
| Read Seq (MB/s) | 1447 | 1684 16% | 1458 1% | 1266 -13% | 1210 -16% |
| Write Seq (MB/s) | 1281 | 1106 -14% | 1440 12% | 982 -23% | 1134 -11% |
| Read 512 (MB/s) | 651 | 977 50% | 914 40% | 834 28% | 789 21% |
| Write 512 (MB/s) | 765 | 1119 46% | 1058 38% | 714 -7% | 903 18% |
| Read 4k (MB/s) | 58.3 | 45.14 -23% | 9.786 -83% | 40.72 -30% | 58.4 0% |
| Write 4k (MB/s) | 131.9 | 134.1 2% | 10.9 -92% | 139.4 6% | 144.1 9% |
| Read 4k QD32 (MB/s) | 545 | 509 -7% | 679 25% | 527 -3% | 559 3% |
| Write 4k QD32 (MB/s) | 419.3 | 398.1 -5% | 562 34% | 395.2 -6% | 474.4 13% |

| 3DMark 11 | |
| 1280x720 Performance GPU | |
| Intel Skull Canyon NUC6i7KYK | |
| Apple MacBook Pro 13 2016 (2.9 GHz) | |
| Asus AsusPro P4540UQ-FY0056R | |
| HP Spectre x360 15-bl002xx | |
| Samsung Notebook 9 NP900X5N-X01US | |
| HP 15-ba077ng | |
| Dell Latitude 5280 | |
| Apple MacBook 12 (Early 2016) 1.2 GHz | |
| Toshiba Satellite Pro R50-C-16V | |
| 1280x720 Performance Combined | |
| Intel Skull Canyon NUC6i7KYK | |
| HP Spectre x360 15-bl002xx | |
| Apple MacBook Pro 13 2016 (2.9 GHz) | |
| Asus AsusPro P4540UQ-FY0056R | |
| Samsung Notebook 9 NP900X5N-X01US | |
| HP 15-ba077ng | |
| Apple MacBook 12 (Early 2016) 1.2 GHz | |
| Dell Latitude 5280 | |
| Toshiba Satellite Pro R50-C-16V | |
| 3DMark | |
| 1280x720 Cloud Gate Standard Graphics | |
| Intel Skull Canyon NUC6i7KYK | |
| Apple MacBook Pro 13 2016 (2.9 GHz) | |
| HP Spectre x360 15-bl002xx | |
| Asus AsusPro P4540UQ-FY0056R | |
| Samsung Notebook 9 NP900X5N-X01US | |
| HP 15-ba077ng | |
| Apple MacBook 12 (Early 2016) 1.2 GHz | |
| Dell Latitude 5280 | |
| 1920x1080 Fire Strike Graphics | |
| HP Spectre x360 15-bl002xx | |
| Asus AsusPro P4540UQ-FY0056R | |
| Intel Skull Canyon NUC6i7KYK | |
| Apple MacBook Pro 13 2016 (2.9 GHz) | |
| Samsung Notebook 9 NP900X5N-X01US | |
| HP 15-ba077ng | |
| Apple MacBook 12 (Early 2016) 1.2 GHz | |
| Dell Latitude 5280 | |
| 1920x1080 Ice Storm Extreme Graphics | |
| Intel Skull Canyon NUC6i7KYK | |
| Samsung Notebook 9 NP900X5N-X01US | |
| HP 15-ba077ng | |
| Dell Latitude 5280 | |
| HP Spectre x360 15-bl002xx | |
| 3DMark 11 Performance | 2372 punti | |
| 3DMark Ice Storm Standard Score | 49982 punti | |
| 3DMark Cloud Gate Standard Score | 6800 punti | |
| 3DMark Fire Strike Score | 1408 punti | |
| 3DMark Fire Strike Extreme Score | 722 punti | |
Aiuto | ||
| BioShock Infinite - 1366x768 High Preset | |
| Lenovo ThinkPad T570-20HAS01E00 | |
| Intel Skull Canyon NUC6i7KYK | |
| Apple MacBook Pro 13 2016 (2.9 GHz) | |
| Samsung Notebook 9 NP900X5N-X01US | |
| Dell Latitude 5280 | |
| Toshiba Satellite Pro R50-C-16V | |
| basso | medio | alto | ultra | |
|---|---|---|---|---|
| BioShock Infinite (2013) | 89.8 | 48.7 | 39.3 | 13.5 |
| The Witcher 3 (2015) | 31 | |||
| Dota 2 Reborn (2015) | 95 | 64 | 24 | |
| Rise of the Tomb Raider (2016) | 37.4 | 20.5 | 10.9 | |
| Overwatch (2016) | 65.2 | 44.8 |
Rumorosità
| Idle |
| 28.3 / 28.3 / 28.3 dB(A) |
| Sotto carico |
| 38.3 / 38.3 dB(A) |
 | ||
30 dB silenzioso 40 dB(A) udibile 50 dB(A) rumoroso |
||
min: | ||
| Samsung Notebook 9 NP900X5N-X01US GeForce 940MX, i7-7500U, Samsung PM961 MZVLW256HEHP | Dell XPS 15 9560 (i7-7700HQ, UHD) GeForce GTX 1050 Mobile, i7-7700HQ, Lite-On CX2-8B512-Q11 | Apple MacBook Pro 15 2016 (2.9 GHz, 460) Radeon Pro 460, 6920HQ, Apple SSD SM1024L | HP Spectre x360 15-bl002xx GeForce 940MX, i7-7500U, Toshiba XG4 NVMe (THNSN5512GPUK) | Lenovo ThinkPad T570-20HAS01E00 GeForce 940MX, i7-7500U, Samsung PM961 NVMe MZVLW512HMJP | |
|---|---|---|---|---|---|
| Noise | -11% | -6% | -9% | -4% | |
| off /ambiente * (dB) | 28.3 | 28.4 -0% | 29 -2% | 28.5 -1% | 29.3 -4% |
| Idle Minimum * (dB) | 28.3 | 29 -2% | 30.3 -7% | 28.5 -1% | 29.3 -4% |
| Idle Average * (dB) | 28.3 | 29 -2% | 30.3 -7% | 28.5 -1% | 29.3 -4% |
| Idle Maximum * (dB) | 28.3 | 32.2 -14% | 30.3 -7% | 36.3 -28% | 31.1 -10% |
| Load Average * (dB) | 38.3 | 47.1 -23% | 35.1 8% | 42.7 -11% | 35.2 8% |
| Load Maximum * (dB) | 38.3 | 47.1 -23% | 46 -20% | 42.7 -11% | 41.3 -8% |
| Witcher 3 ultra * (dB) | 52 |
* ... Meglio usare valori piccoli
(±) La temperatura massima sul lato superiore è di 40.4 °C / 105 F, rispetto alla media di 36.8 °C / 98 F, che varia da 21 a 71 °C per questa classe Multimedia.
(±) Il lato inferiore si riscalda fino ad un massimo di 42.4 °C / 108 F, rispetto alla media di 39.1 °C / 102 F
(+) In idle, la temperatura media del lato superiore è di 22 °C / 72 F, rispetto alla media deld ispositivo di 31.3 °C / 88 F.
(+) I poggiapolsi e il touchpad sono piu' freddi della temperatura della pelle con un massimo di 31.6 °C / 88.9 F e sono quindi freddi al tatto.
(-) La temperatura media della zona del palmo della mano di dispositivi simili e'stata di 28.7 °C / 83.7 F (-2.9 °C / -5.2 F).
Samsung Notebook 9 NP900X5N-X01US analisi audio
(-) | altoparlanti non molto potenti (58.2 dB)
Bassi 100 - 315 Hz
(-) | quasi nessun basso - in media 16% inferiori alla media
(±) | la linearità dei bassi è media (13.2% delta rispetto alla precedente frequenza)
Medi 400 - 2000 Hz
(+) | medi bilanciati - solo only 3.8% rispetto alla media
(+) | medi lineari (6.8% delta rispetto alla precedente frequenza)
Alti 2 - 16 kHz
(+) | Alti bilanciati - appena 4.4% dalla media
(±) | la linearità degli alti è media (13.7% delta rispetto alla precedente frequenza)
Nel complesso 100 - 16.000 Hz
(±) | la linearità complessiva del suono è media (29.8% di differenza rispetto alla media
Rispetto alla stessa classe
» 95% di tutti i dispositivi testati in questa classe è stato migliore, 2% simile, 3% peggiore
» Il migliore ha avuto un delta di 5%, medio di 17%, peggiore di 45%
Rispetto a tutti i dispositivi testati
» 88% di tutti i dispositivi testati in questa classe è stato migliore, 3% similare, 10% peggiore
» Il migliore ha avuto un delta di 4%, medio di 24%, peggiore di 134%
Apple MacBook 12 (Early 2016) 1.1 GHz analisi audio
(+) | gli altoparlanti sono relativamente potenti (83.6 dB)
Bassi 100 - 315 Hz
(±) | bassi ridotti - in media 11.3% inferiori alla media
(±) | la linearità dei bassi è media (14.2% delta rispetto alla precedente frequenza)
Medi 400 - 2000 Hz
(+) | medi bilanciati - solo only 2.4% rispetto alla media
(+) | medi lineari (5.5% delta rispetto alla precedente frequenza)
Alti 2 - 16 kHz
(+) | Alti bilanciati - appena 2% dalla media
(+) | alti lineari (4.5% delta rispetto alla precedente frequenza)
Nel complesso 100 - 16.000 Hz
(+) | suono nel complesso lineare (10.2% differenza dalla media)
Rispetto alla stessa classe
» 7% di tutti i dispositivi testati in questa classe è stato migliore, 2% simile, 91% peggiore
» Il migliore ha avuto un delta di 5%, medio di 18%, peggiore di 53%
Rispetto a tutti i dispositivi testati
» 5% di tutti i dispositivi testati in questa classe è stato migliore, 1% similare, 94% peggiore
» Il migliore ha avuto un delta di 4%, medio di 24%, peggiore di 134%
| Off / Standby | |
| Idle | |
| Sotto carico |
|
Leggenda:
min: | |
| Samsung Notebook 9 NP900X5N-X01US i7-7500U, GeForce 940MX, Samsung PM961 MZVLW256HEHP, IPS, 1920x1080, 15" | Dell XPS 15 9560 (i7-7700HQ, UHD) i7-7700HQ, GeForce GTX 1050 Mobile, Lite-On CX2-8B512-Q11, IGZO IPS, 3840x2160, 15.6" | Apple MacBook Pro 15 2016 (2.9 GHz, 460) 6920HQ, Radeon Pro 460, Apple SSD SM1024L, IPS, 2880x1800, 15.4" | HP Spectre x360 15-bl002xx i7-7500U, GeForce 940MX, Toshiba XG4 NVMe (THNSN5512GPUK), IPS, 3840x2160, 15.6" | Asus VivoBook S15 S510UA i5-7200U, HD Graphics 620, Toshiba HG6 THNSNJ128G8NY, IPS, 1920x1080, 15.6" | |
|---|---|---|---|---|---|
| Power Consumption | -91% | -12% | -18% | 28% | |
| Idle Minimum * (Watt) | 5 | 11.9 -138% | 3 40% | 8.14 -63% | 4.6 8% |
| Idle Average * (Watt) | 11.6 | 17.1 -47% | 9.9 15% | 10.91 6% | 7.6 34% |
| Idle Maximum * (Watt) | 12.2 | 17.3 -42% | 12.5 -2% | 12.26 -0% | 7.7 37% |
| Load Average * (Watt) | 47.8 | 94.7 -98% | 70.6 -48% | 45.67 4% | 35.1 27% |
| Witcher 3 ultra * (Watt) | 51.9 | 104.8 -102% | |||
| Load Maximum * (Watt) | 55.7 | 122 -119% | 90.8 -63% | 74.94 -35% | 36.2 35% |
* ... Meglio usare valori piccoli
| Samsung Notebook 9 NP900X5N-X01US i7-7500U, GeForce 940MX, 66 Wh | Dell XPS 15 9560 (i7-7700HQ, UHD) i7-7700HQ, GeForce GTX 1050 Mobile, 97 Wh | Apple MacBook Pro 15 2016 (2.9 GHz, 460) 6920HQ, Radeon Pro 460, 76 Wh | HP Spectre x360 15-bl002xx i7-7500U, GeForce 940MX, 79.2 Wh | Asus VivoBook S15 S510UA i5-7200U, HD Graphics 620, 42 Wh | Apple MacBook 13" T7200, Graphics Media Accelerator (GMA) 950, Wh | |
|---|---|---|---|---|---|---|
| Autonomia della batteria | -30% | -26% | -9% | -52% | -36% | |
| Reader / Idle (h) | 27.4 | 13.9 -49% | 14.4 -47% | 10.2 -63% | 6.5 -76% | |
| WiFi v1.3 (h) | 10.1 | 7.2 -29% | 10.3 2% | 8.9 -12% | 4.3 -57% | |
| Load (h) | 1.9 | 1.7 -11% | 0.9 -53% | 2.5 32% | 1.2 -37% | 2 5% |
Pro
Contro
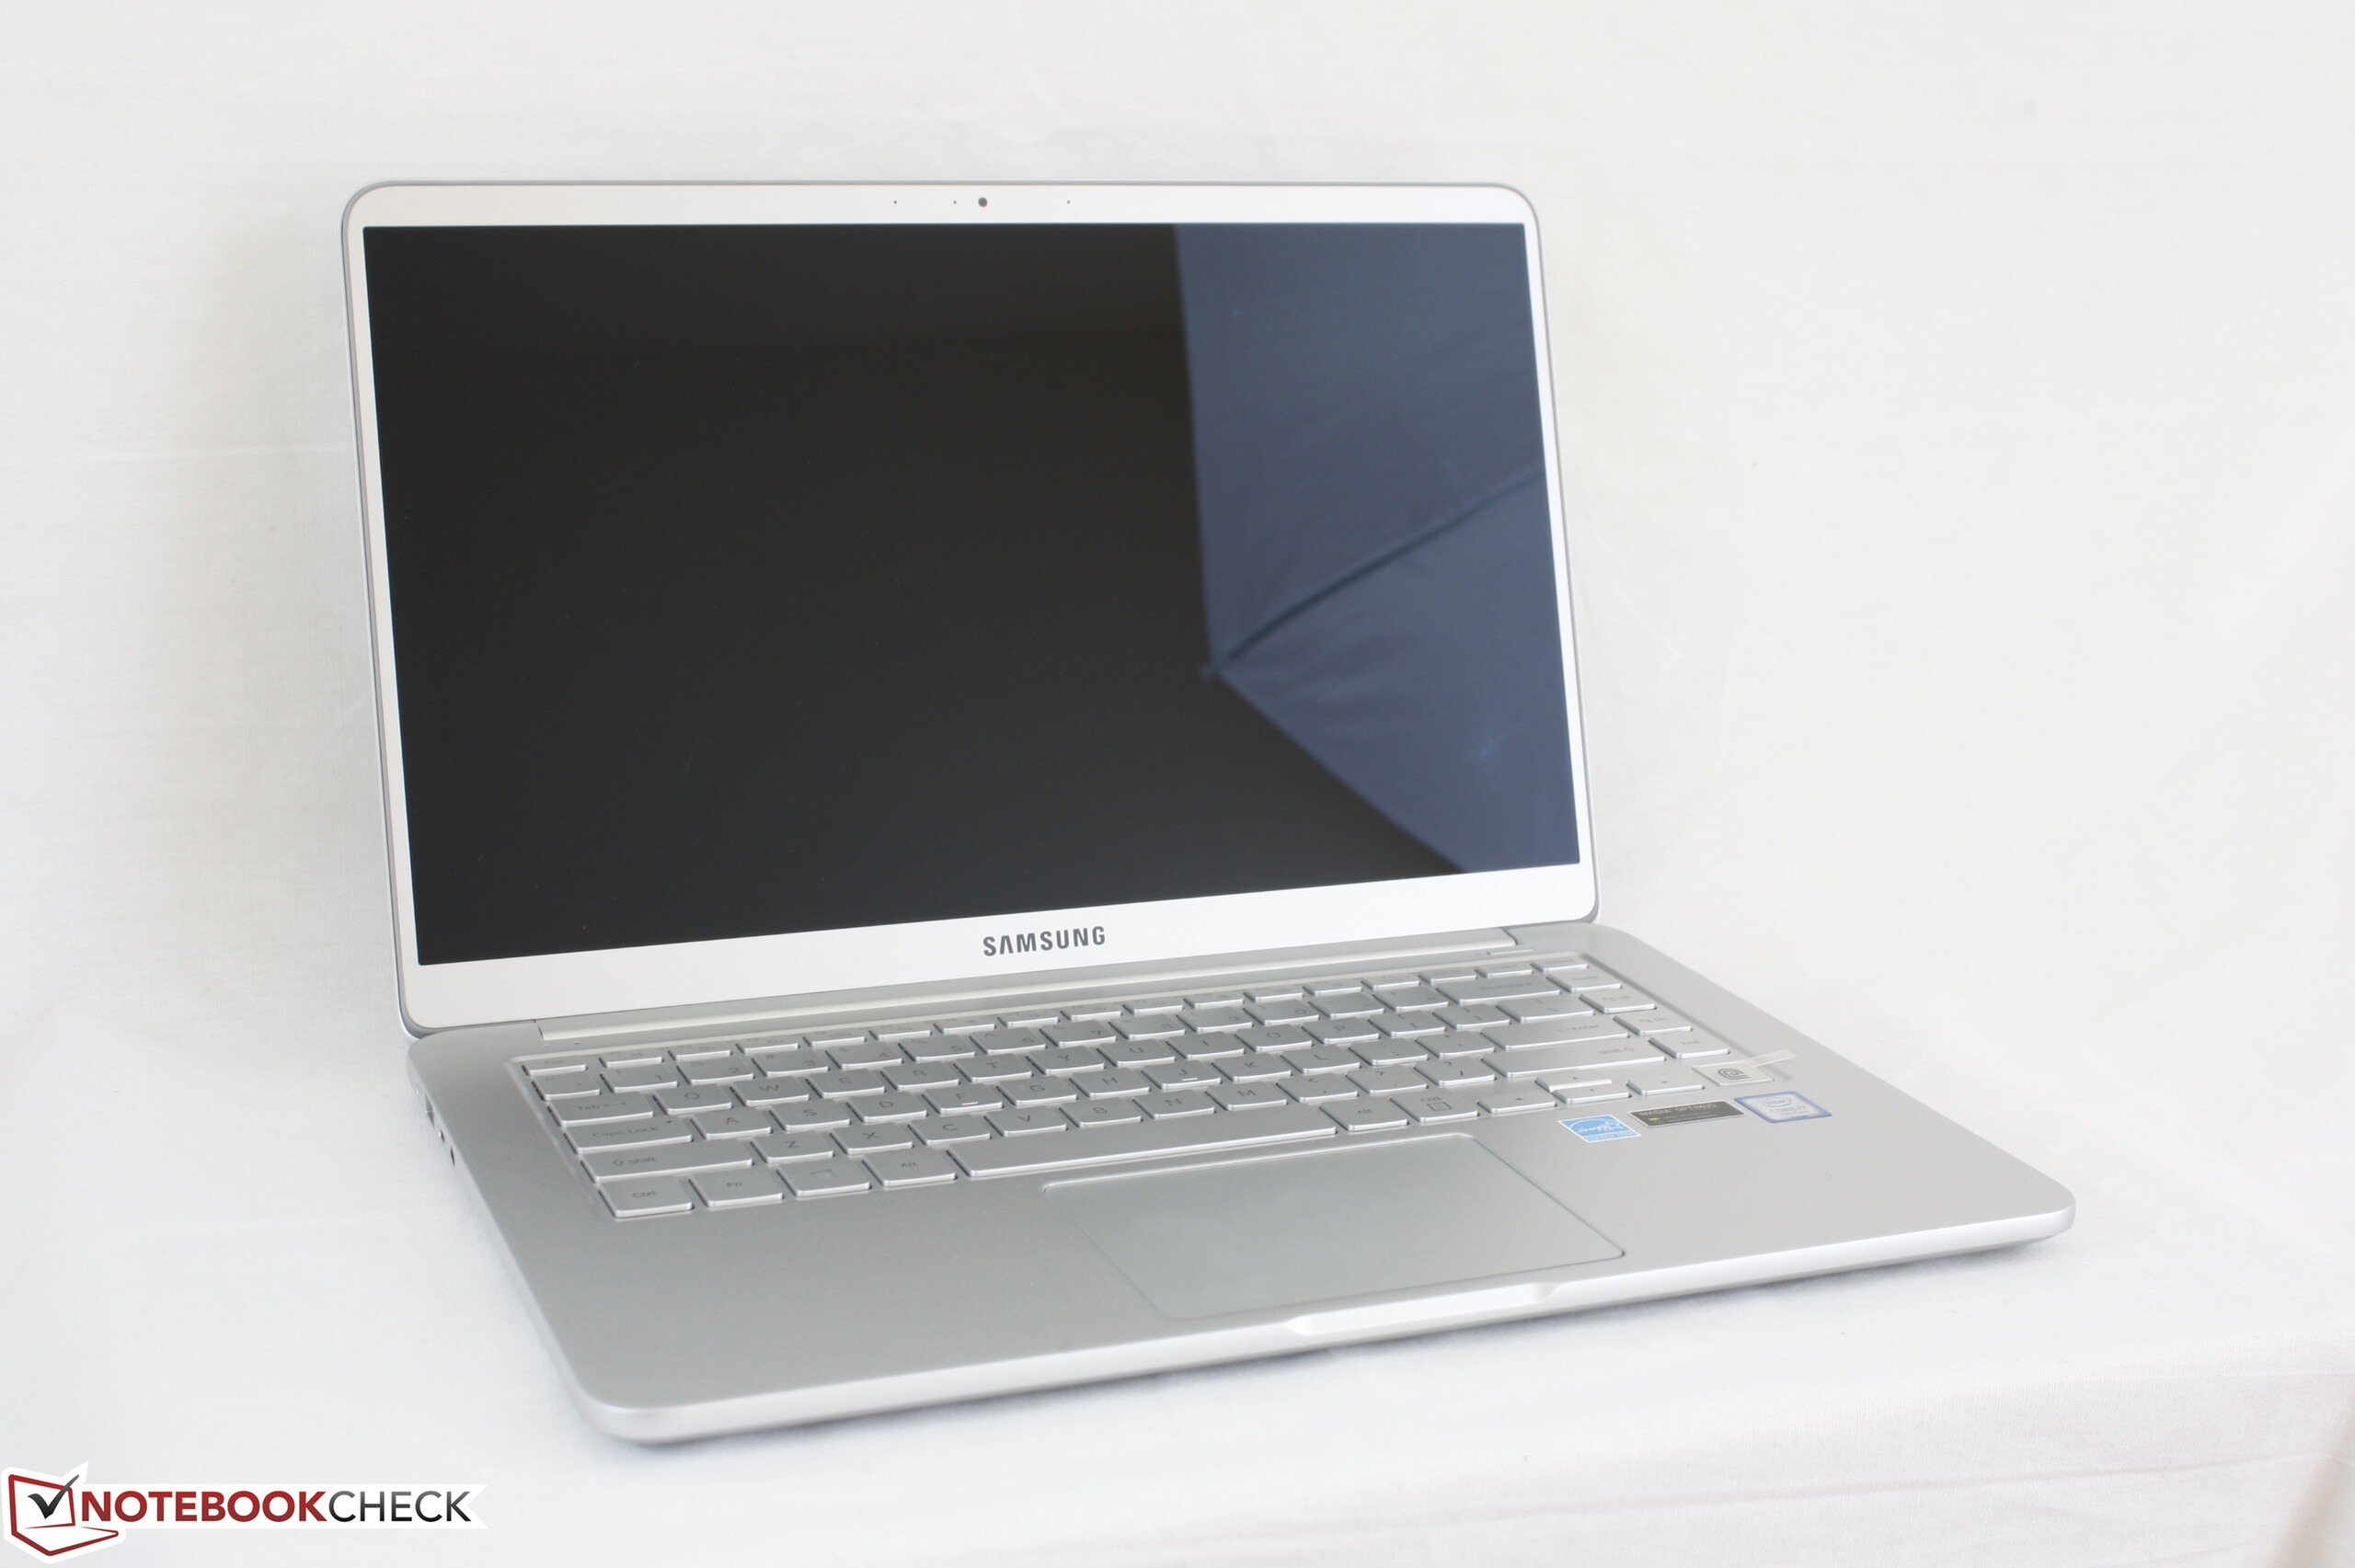
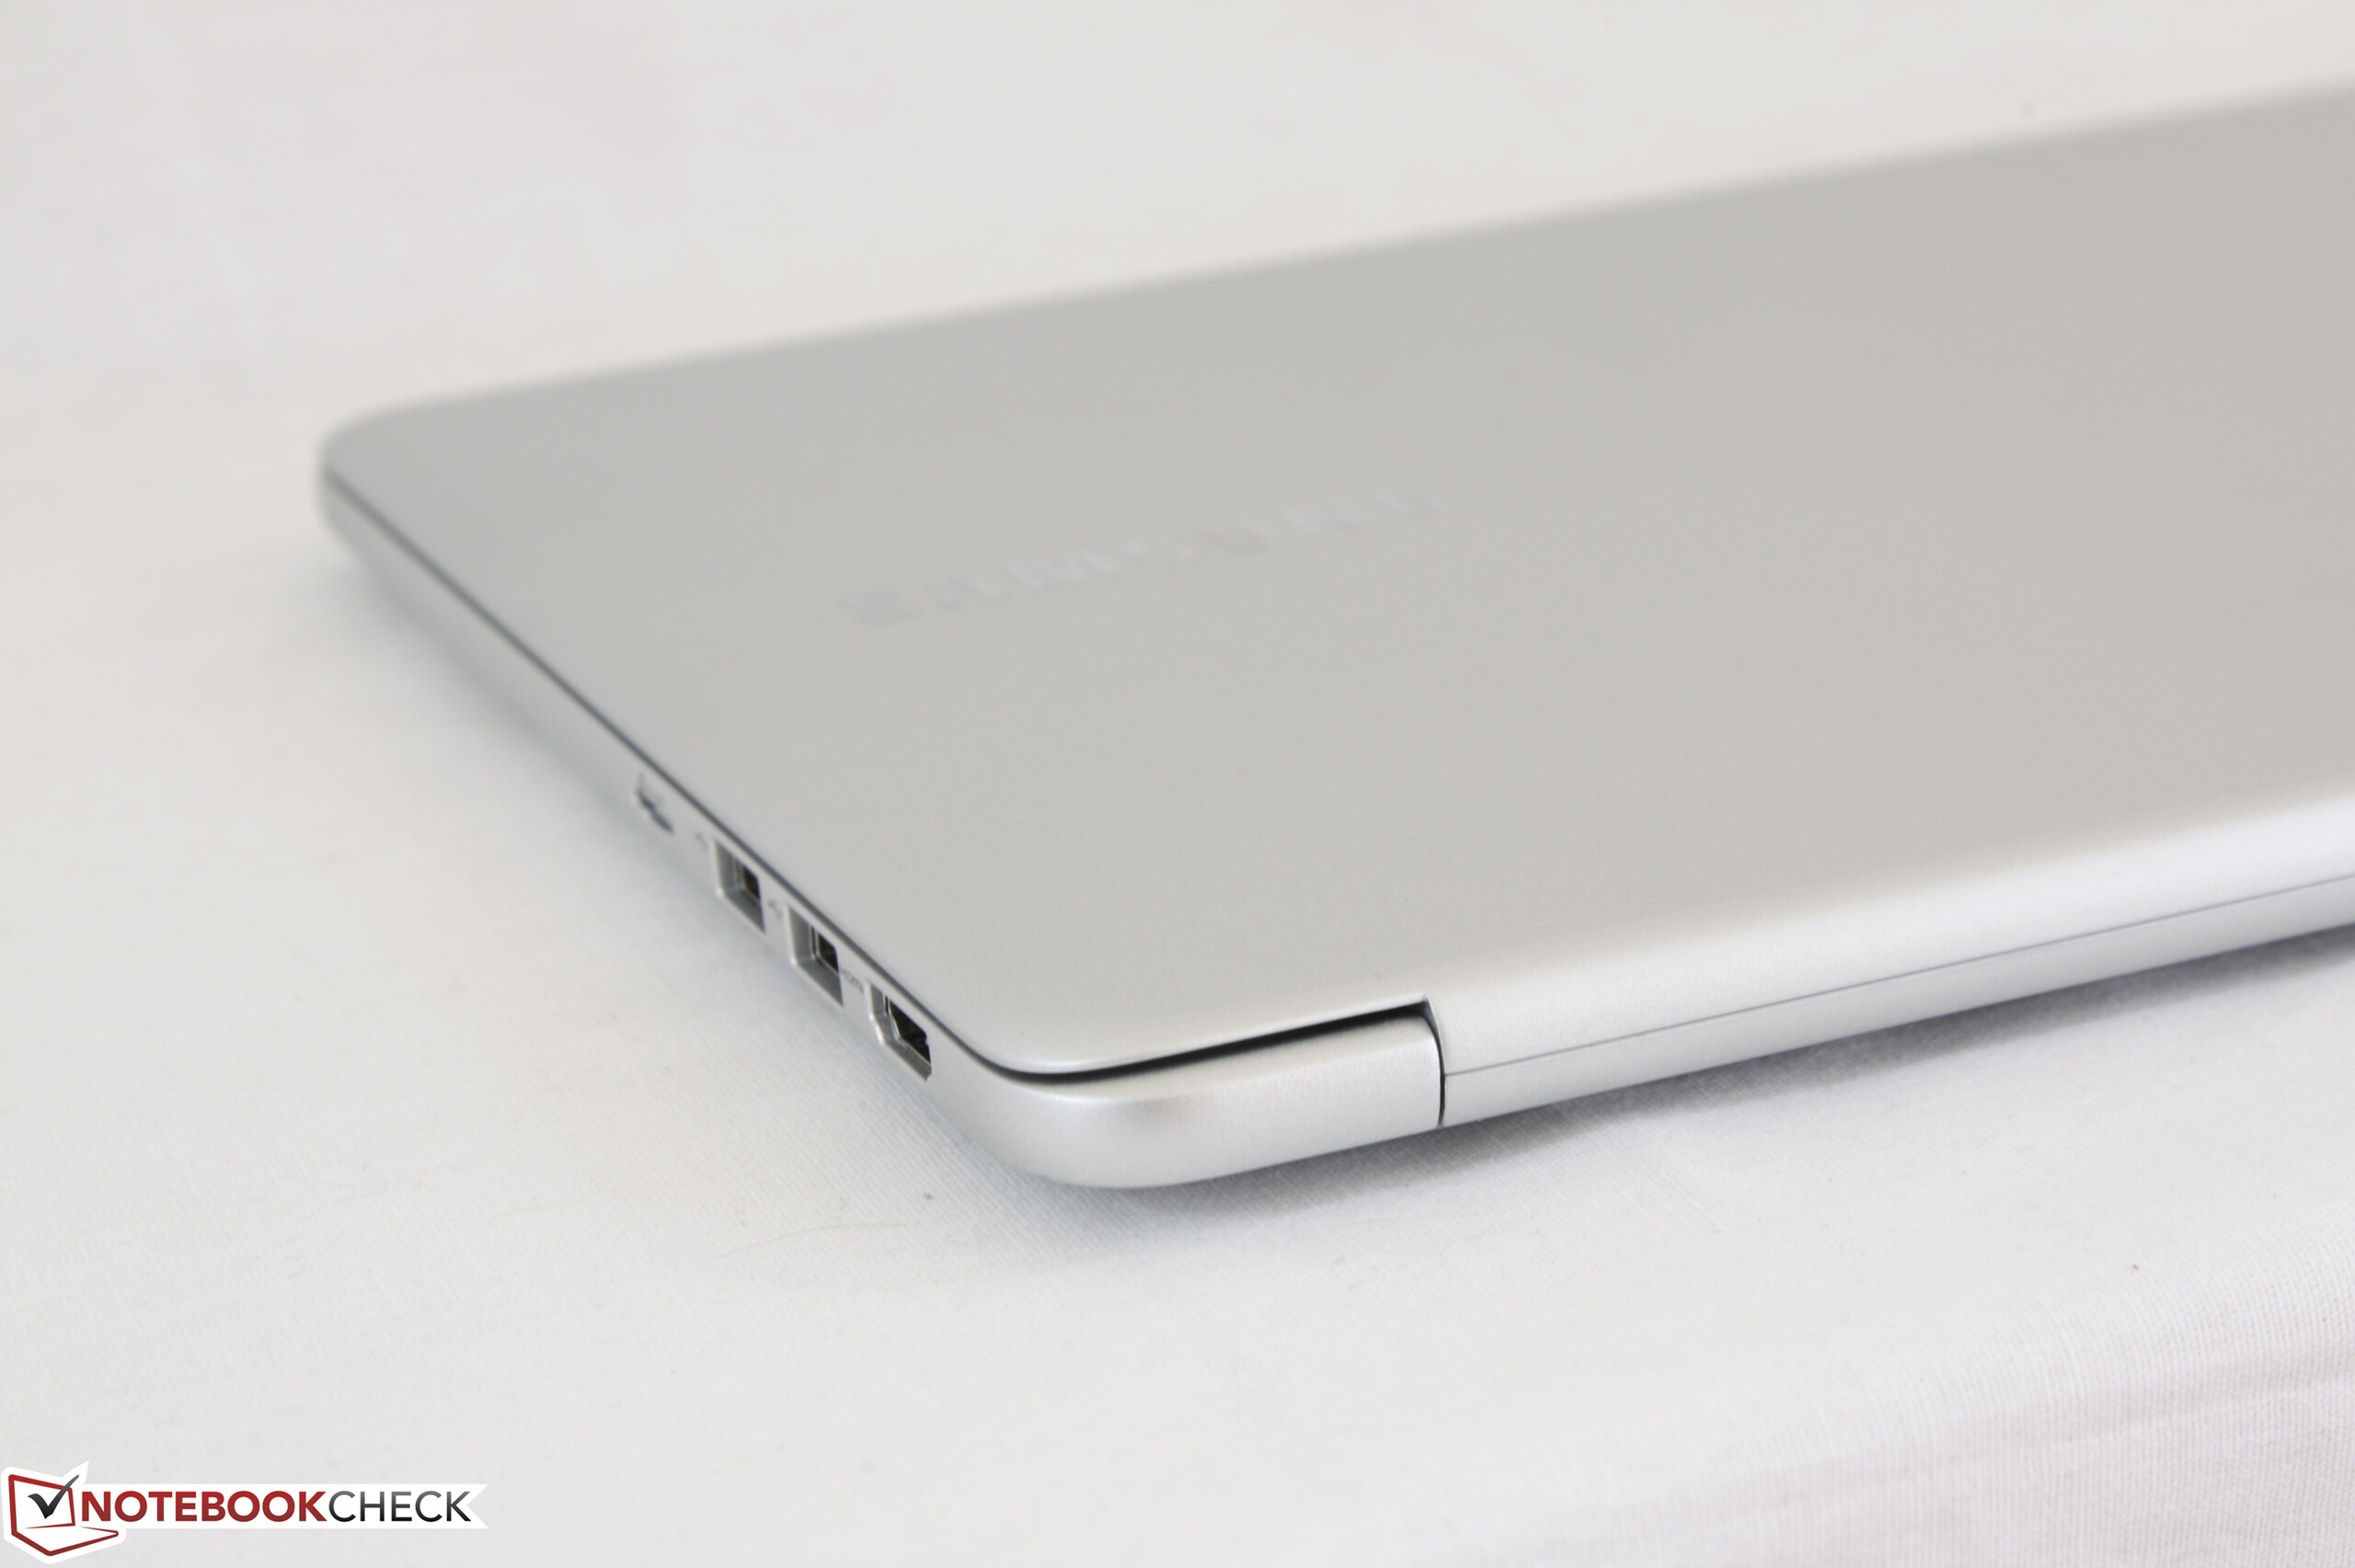
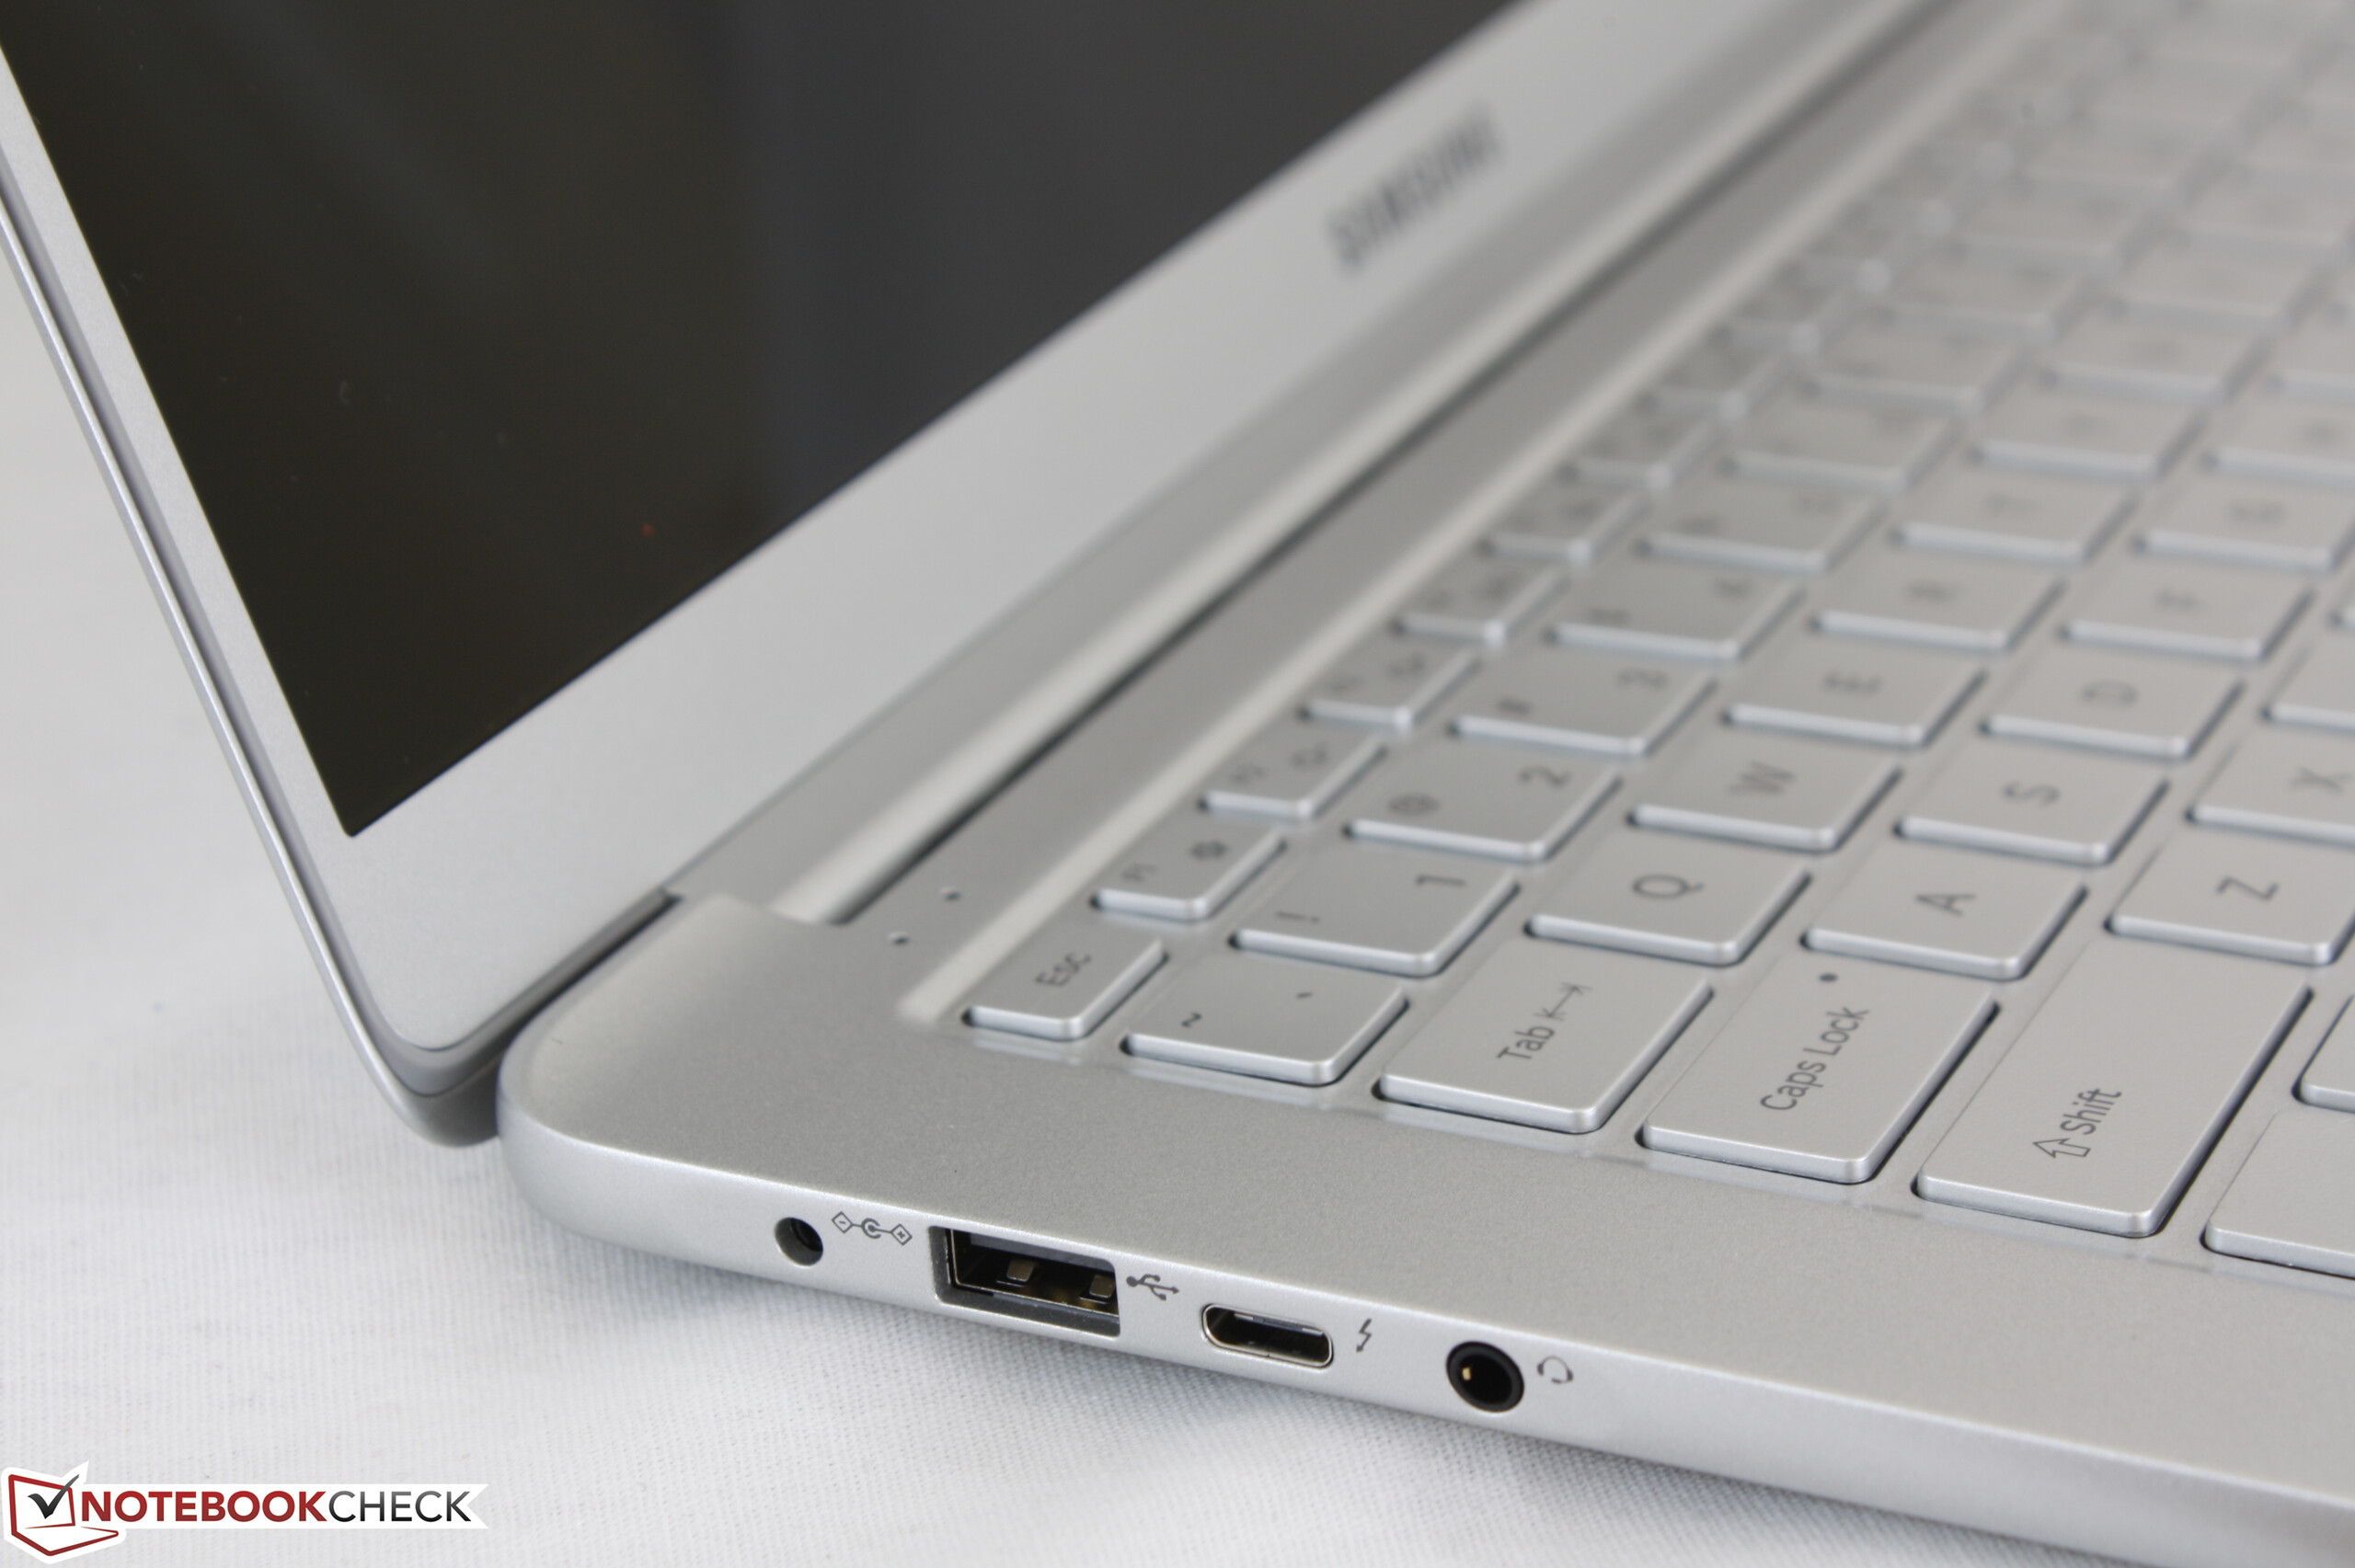
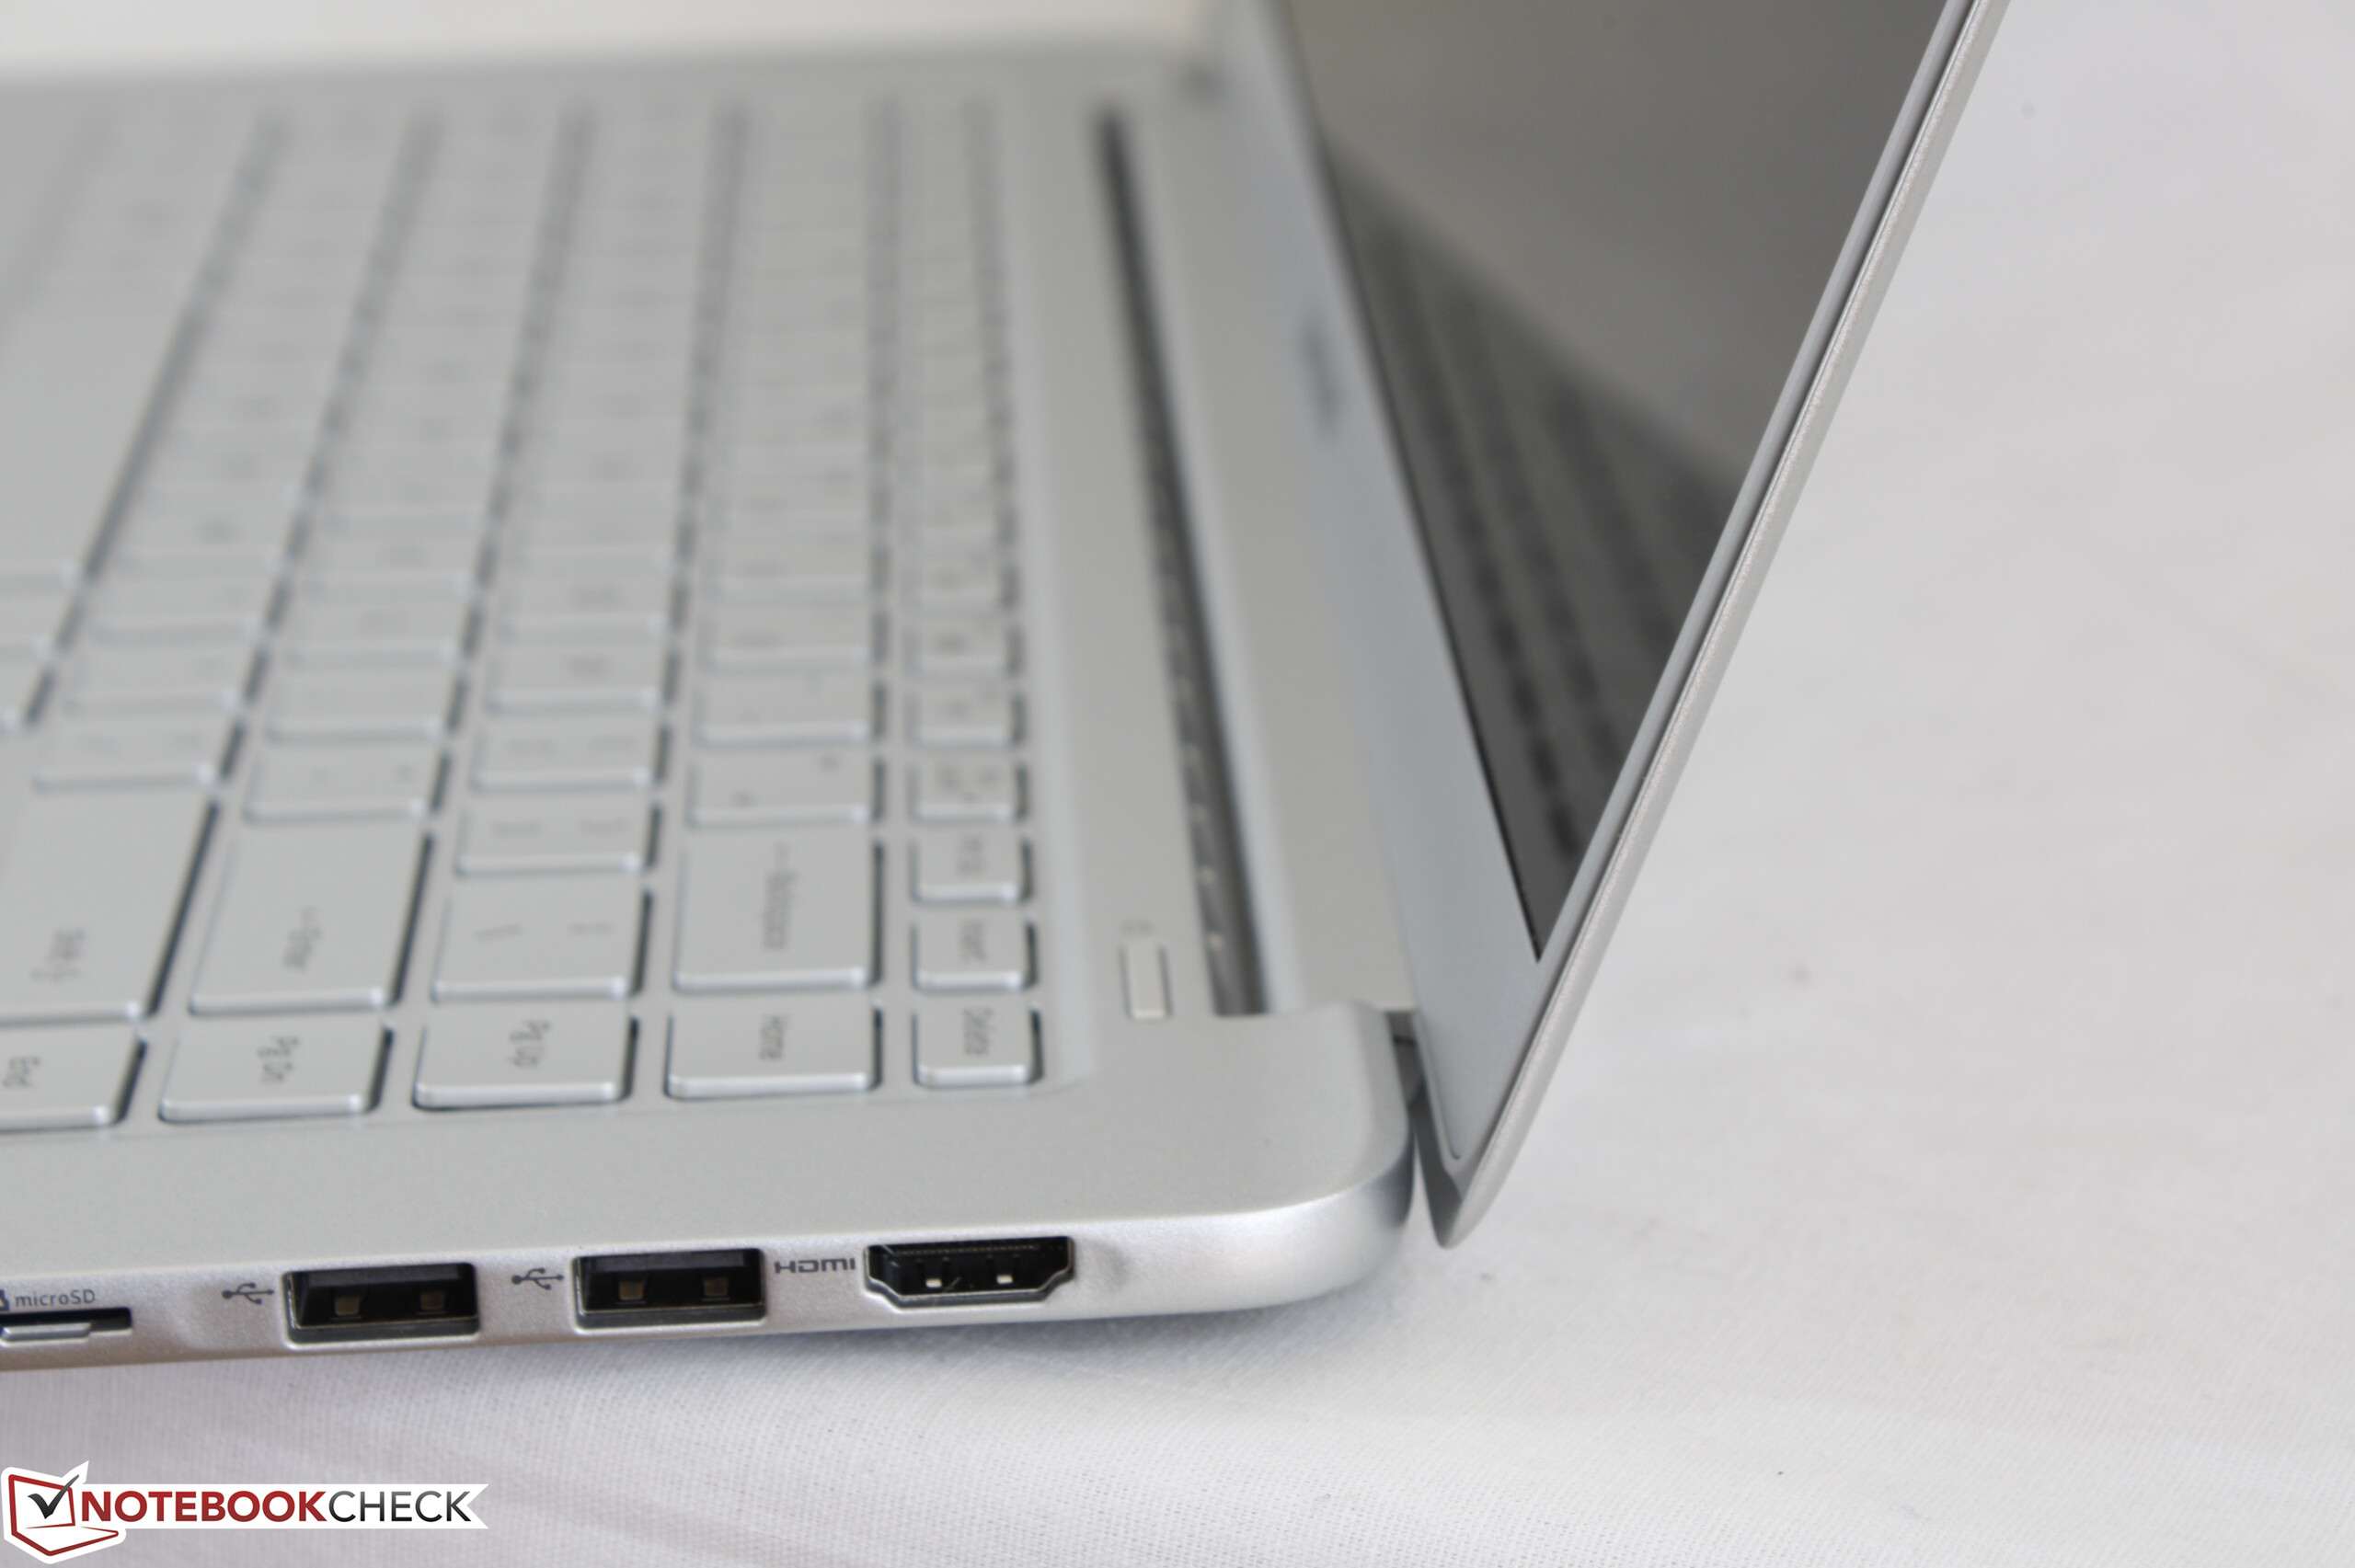
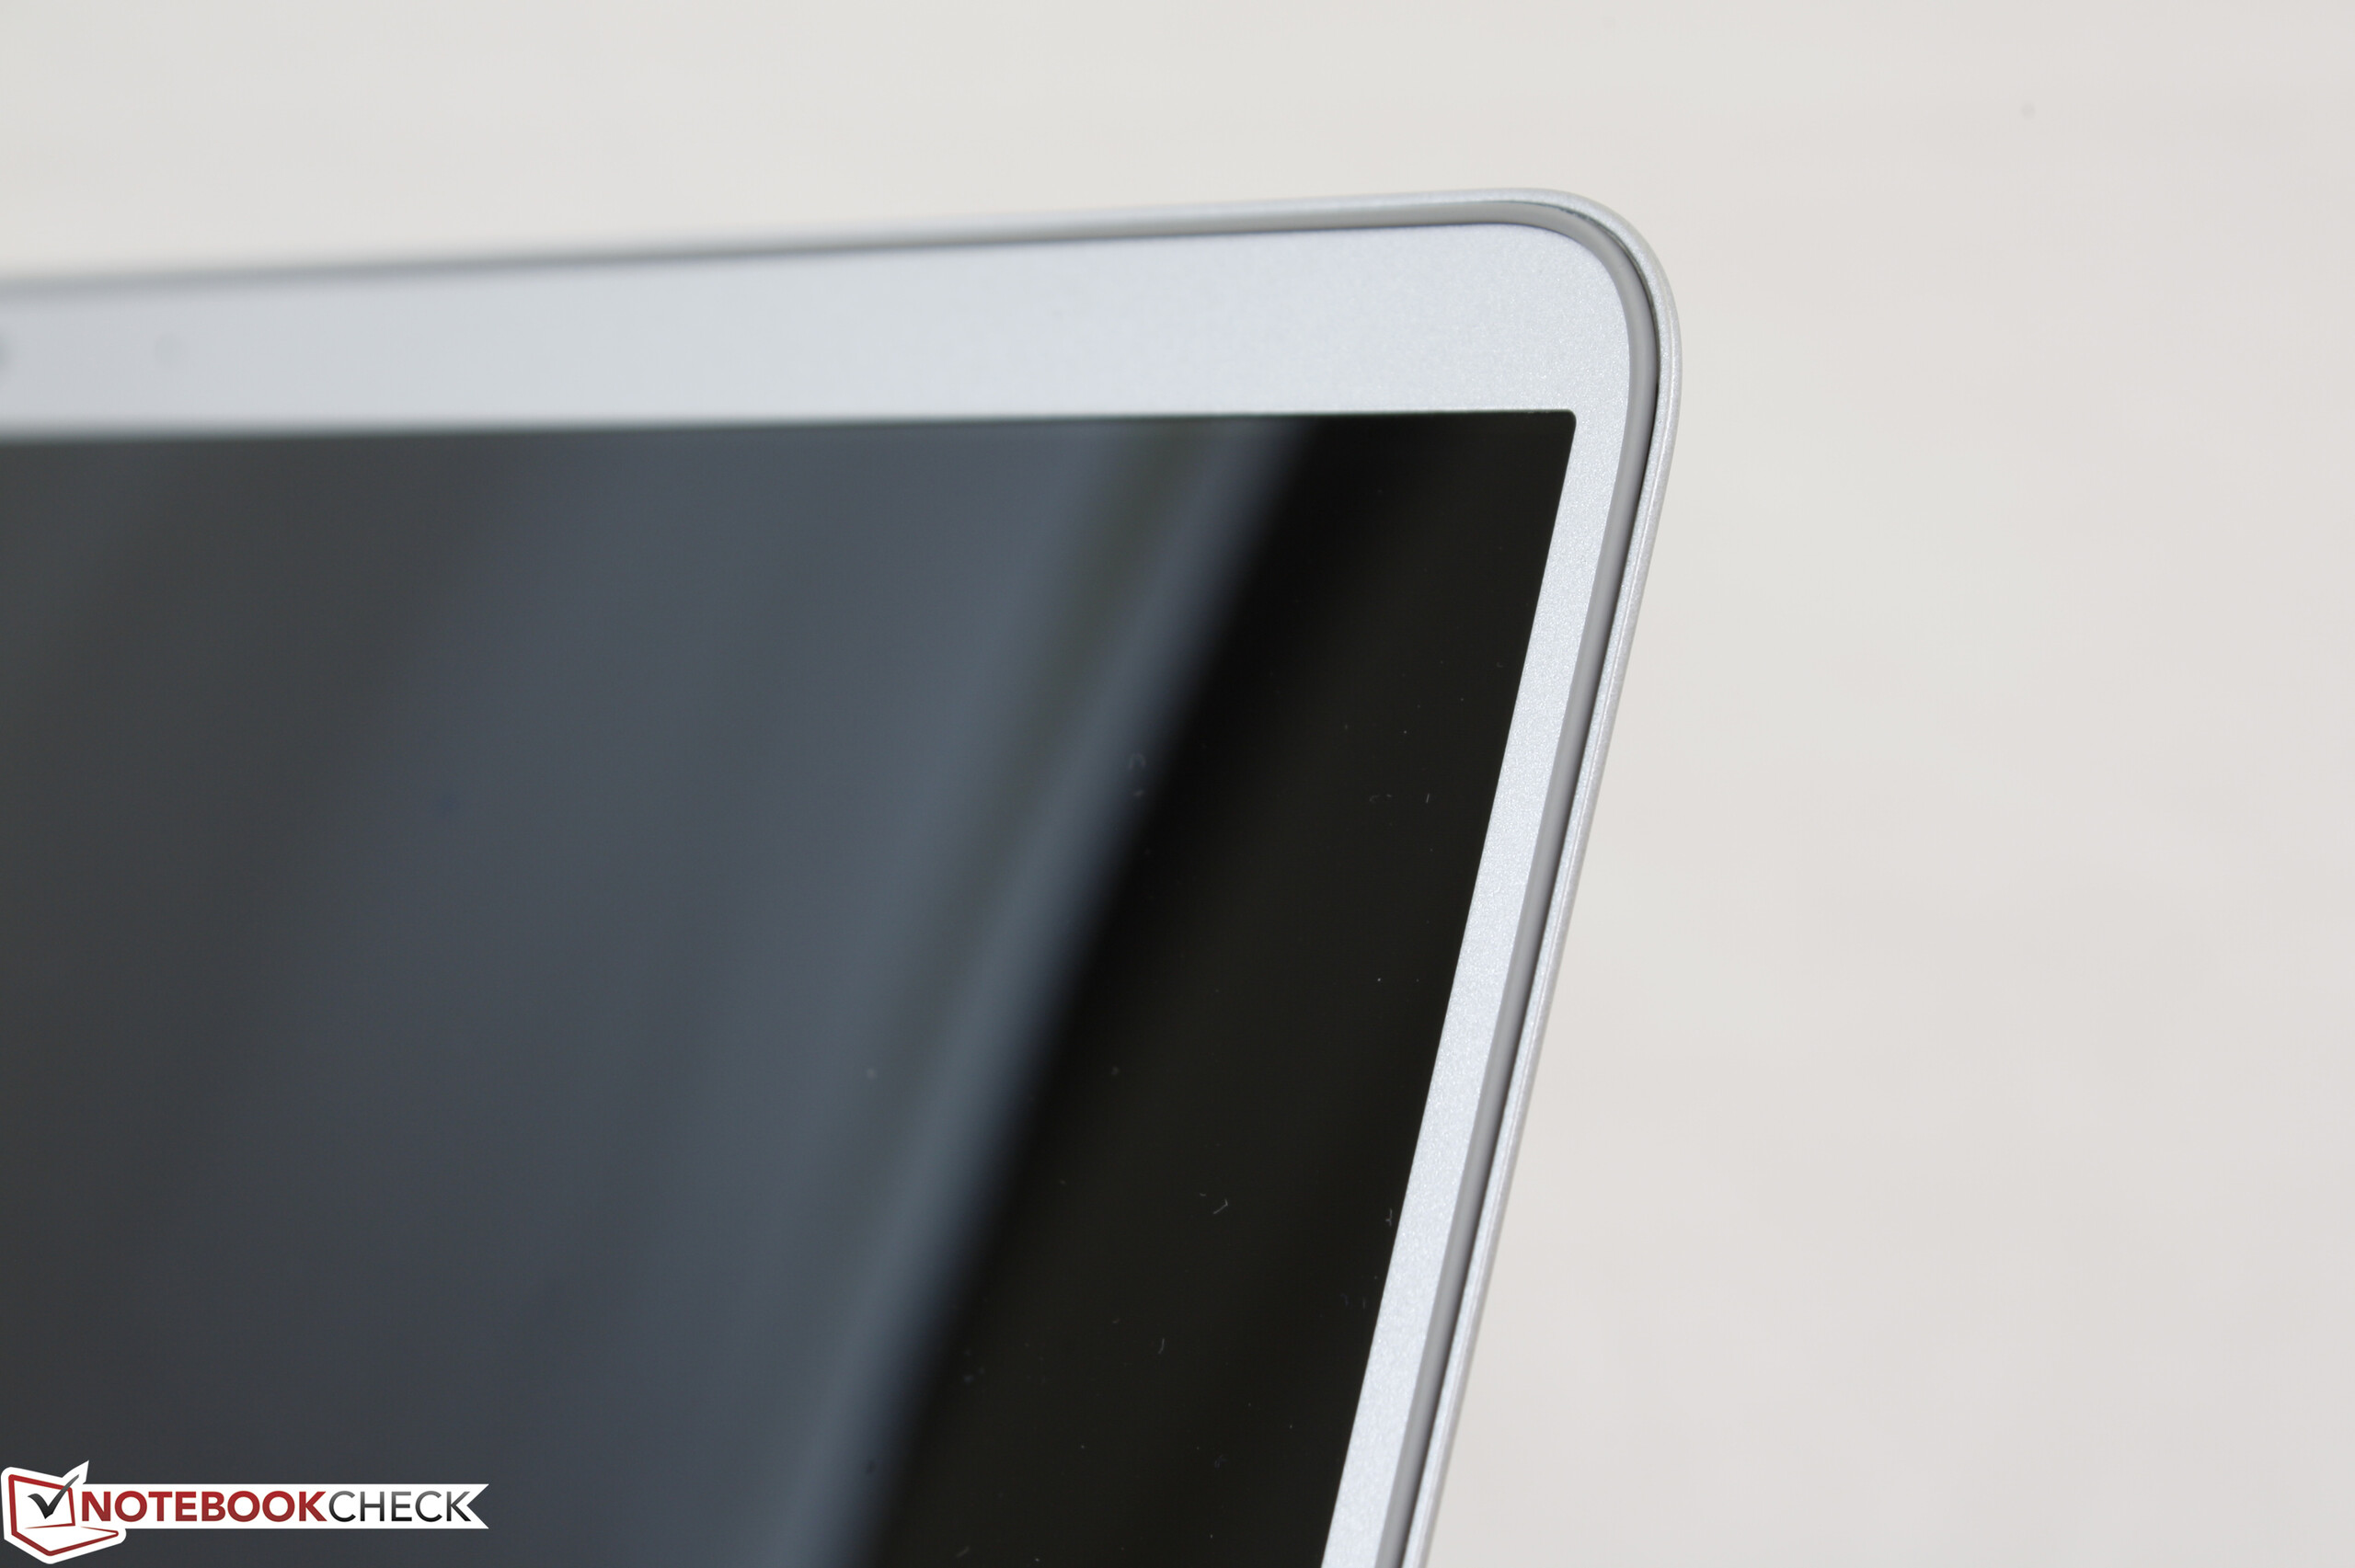
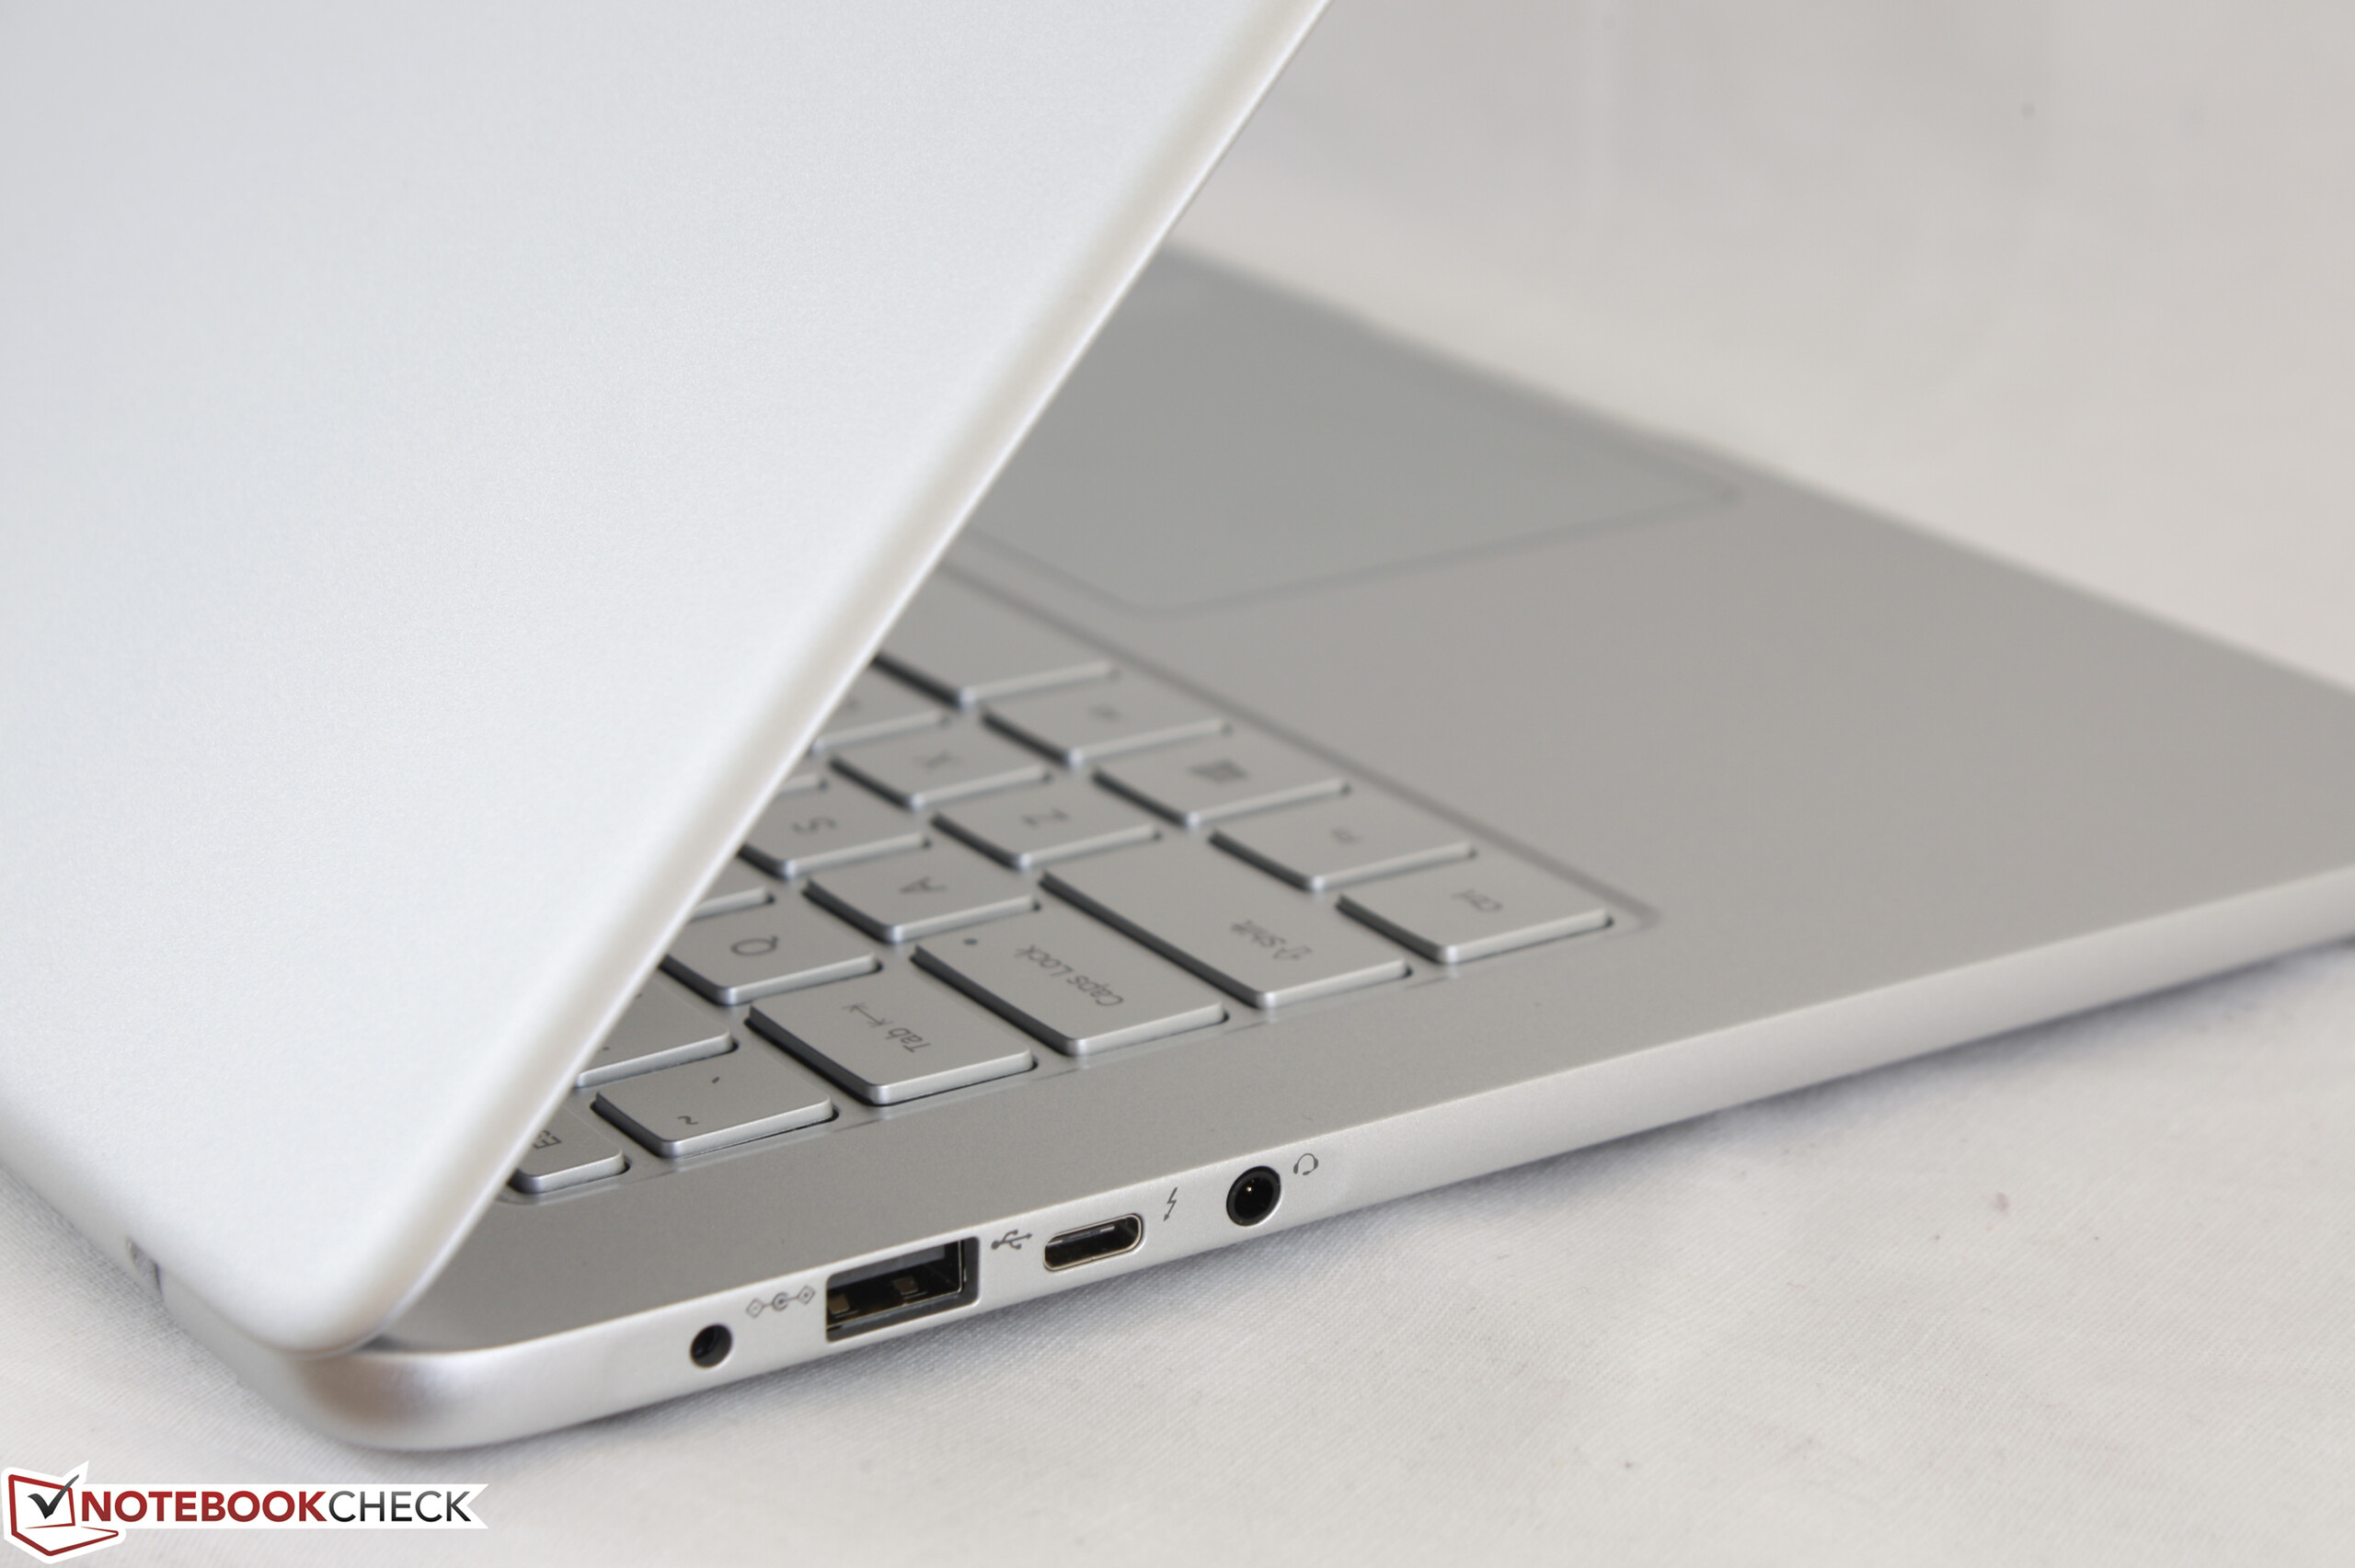
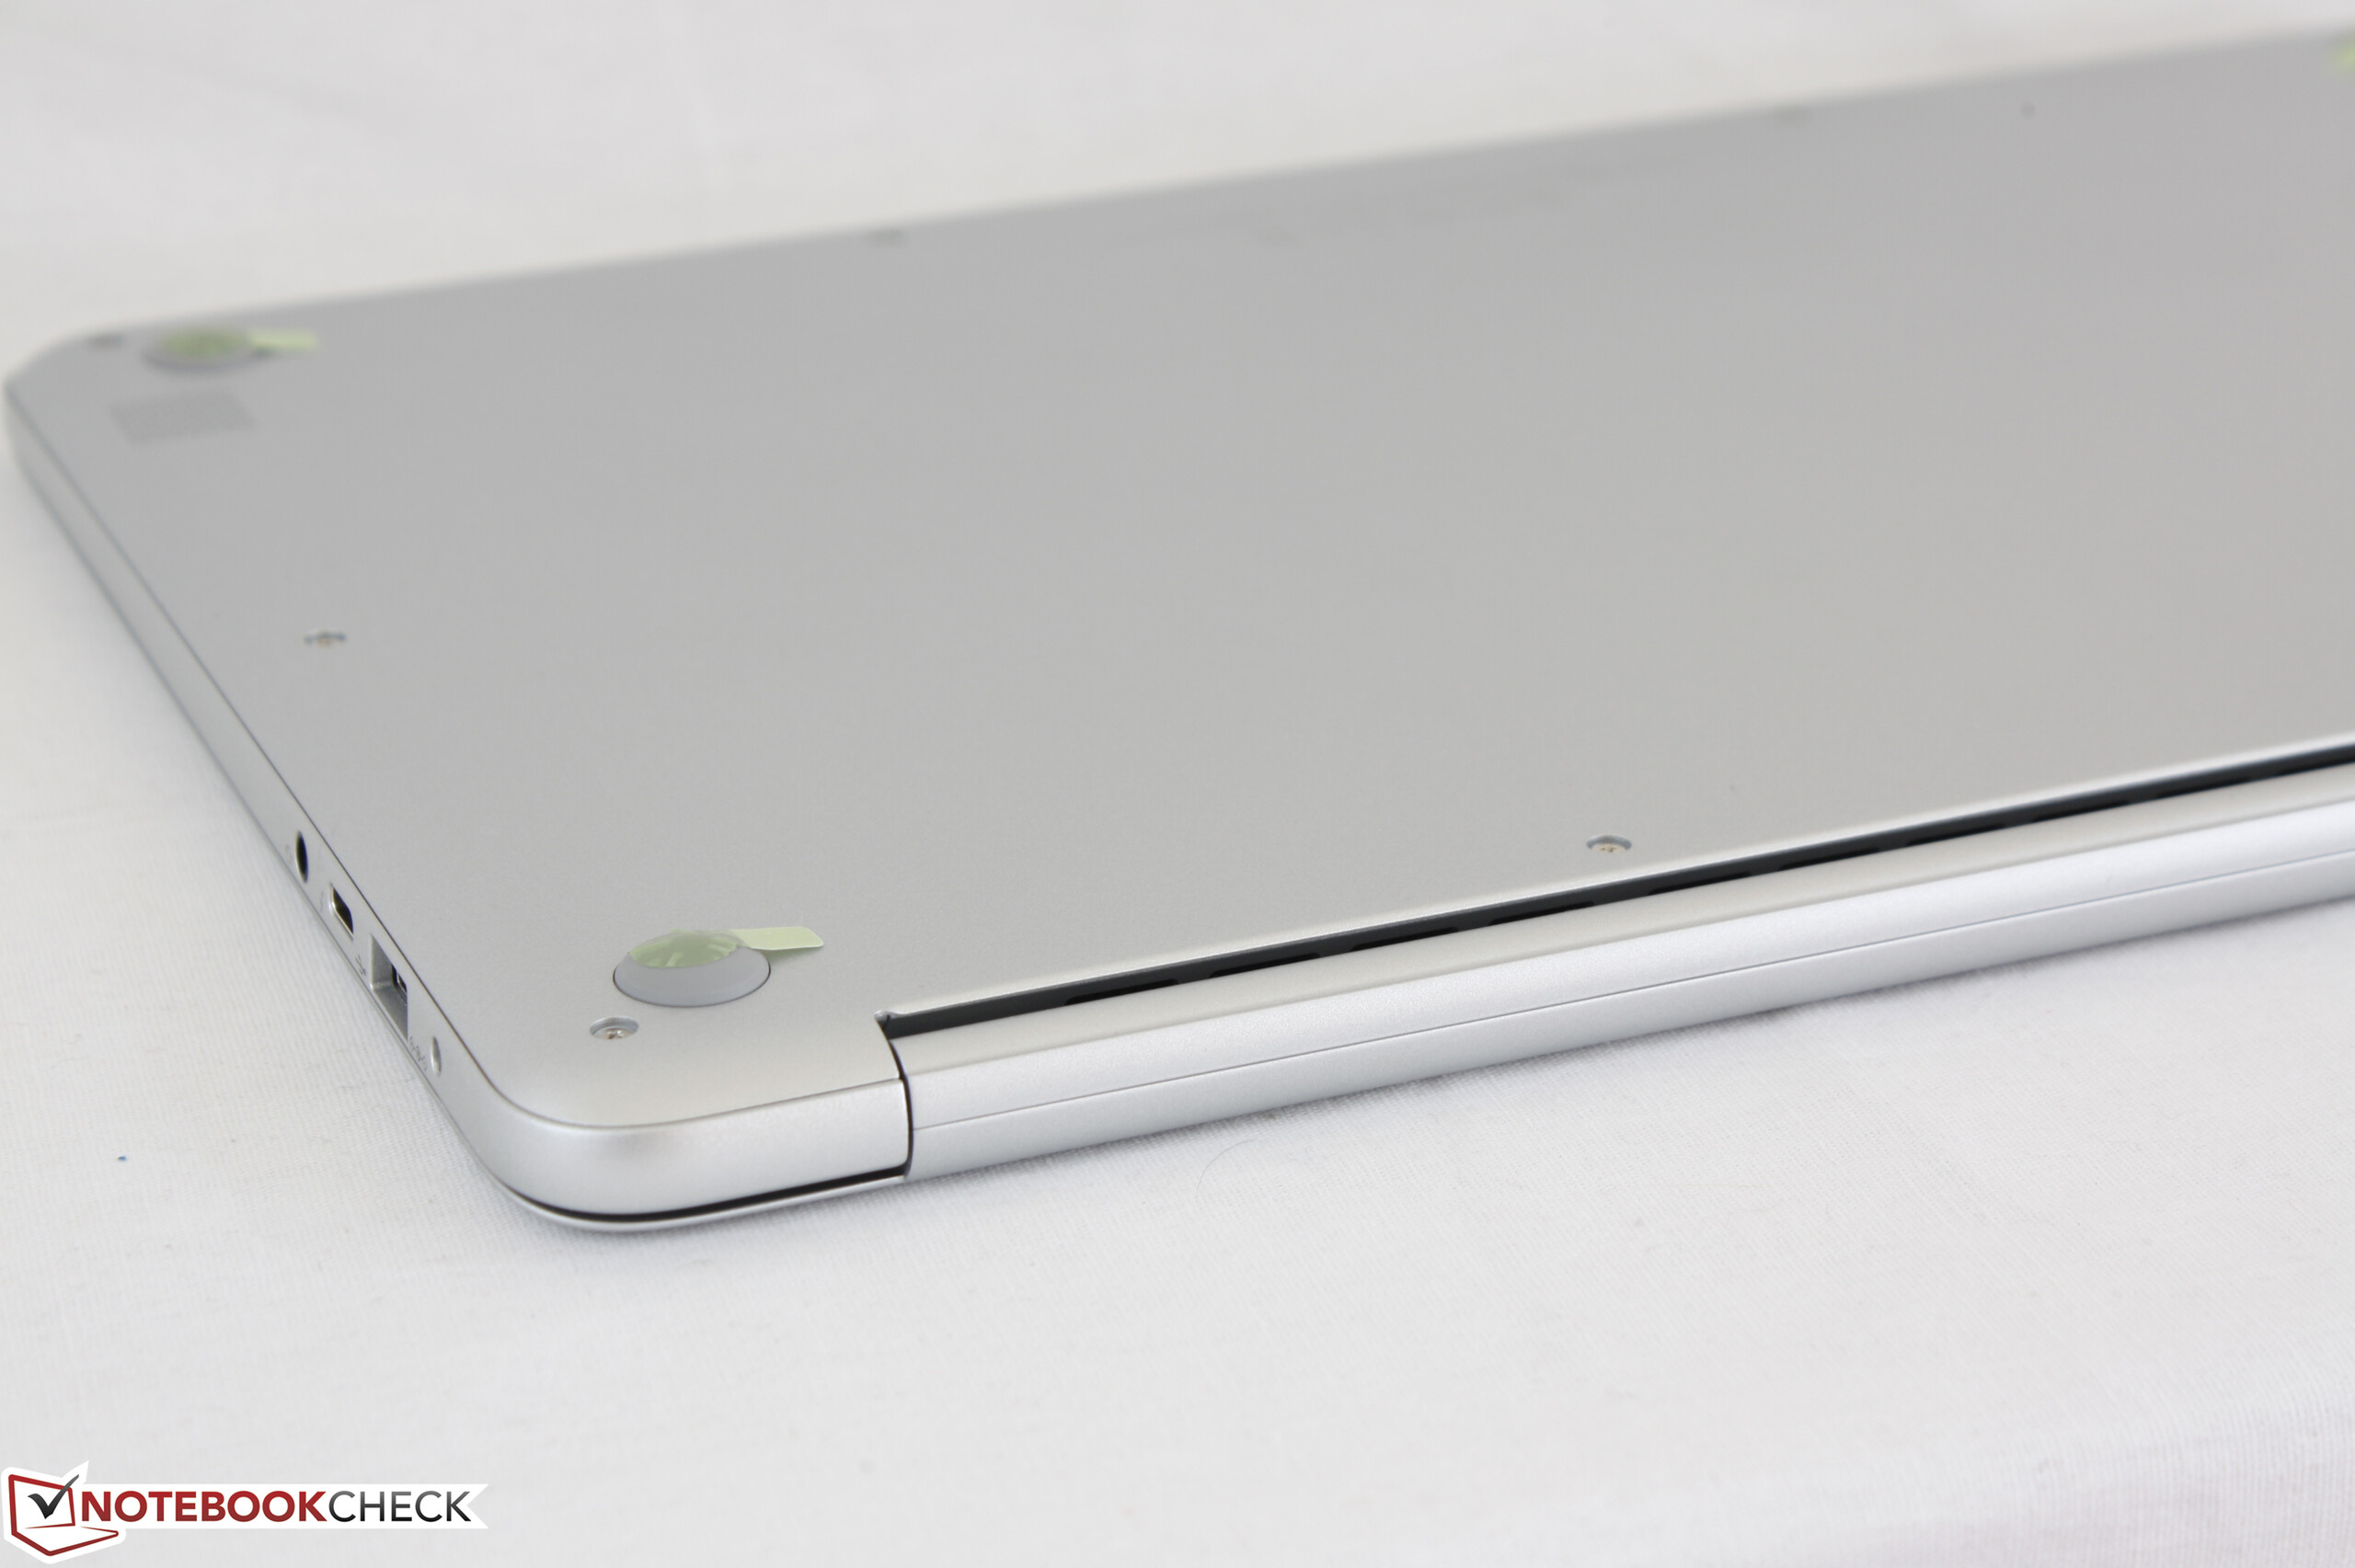
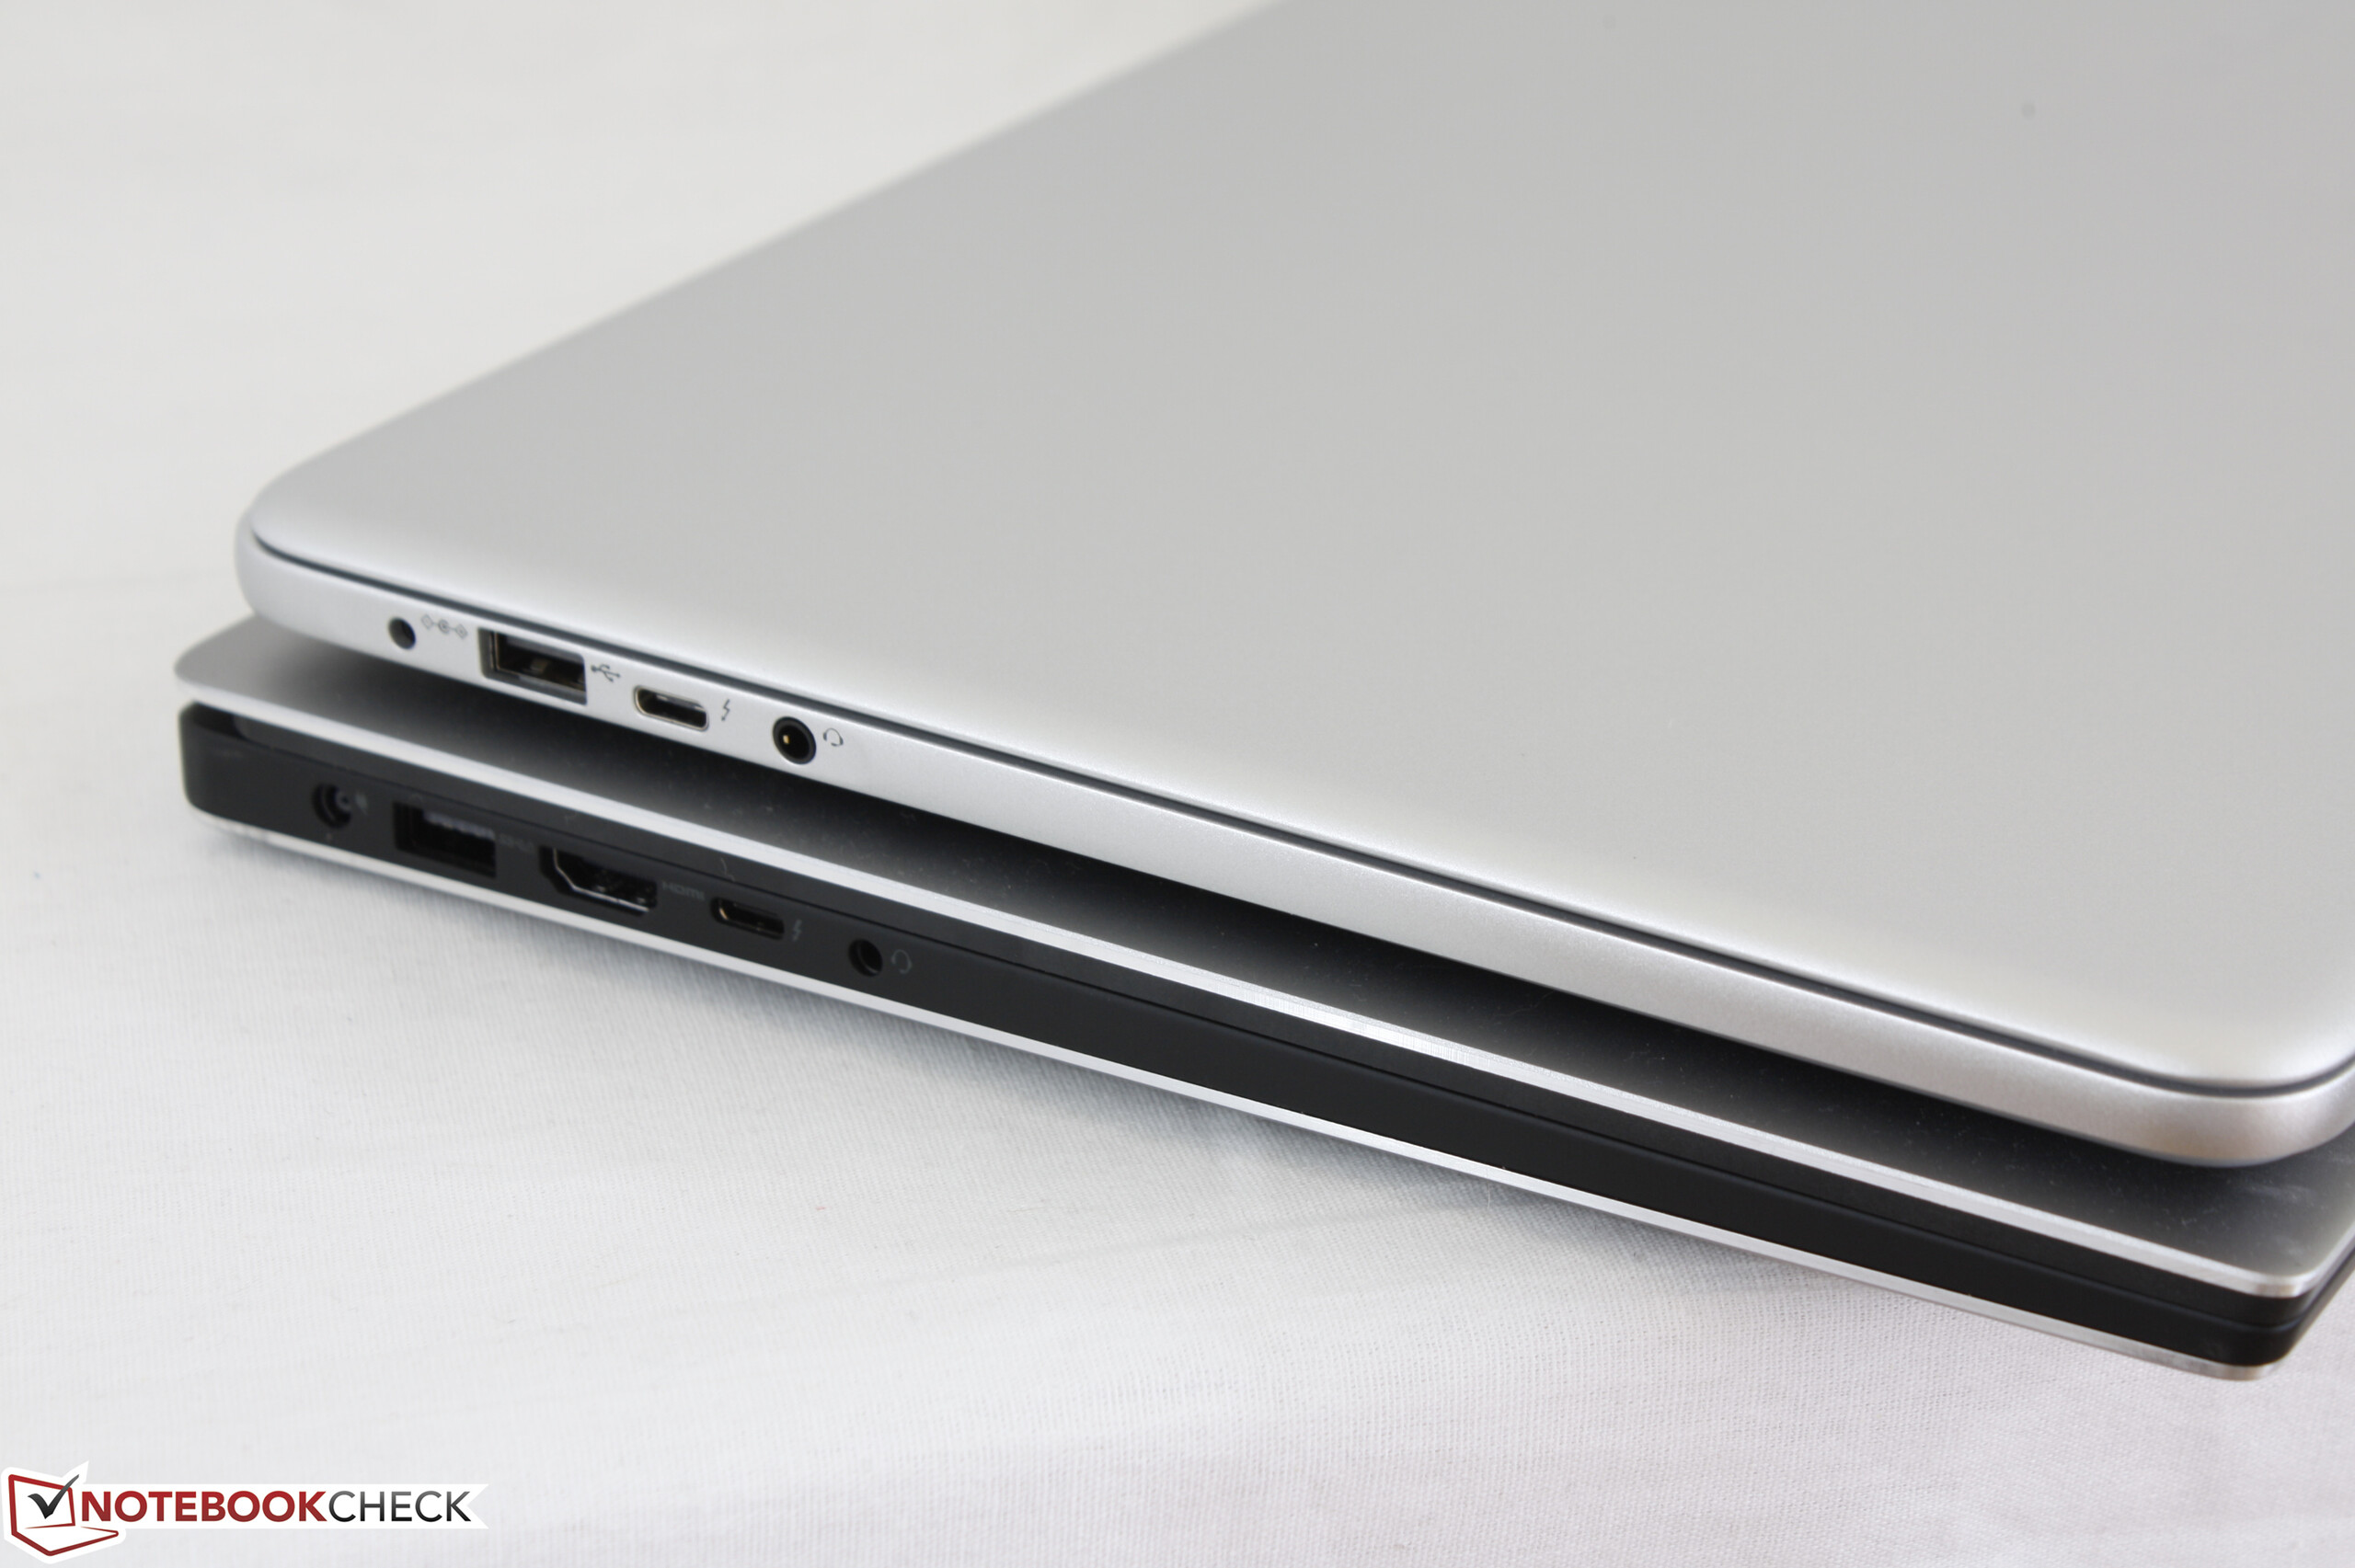
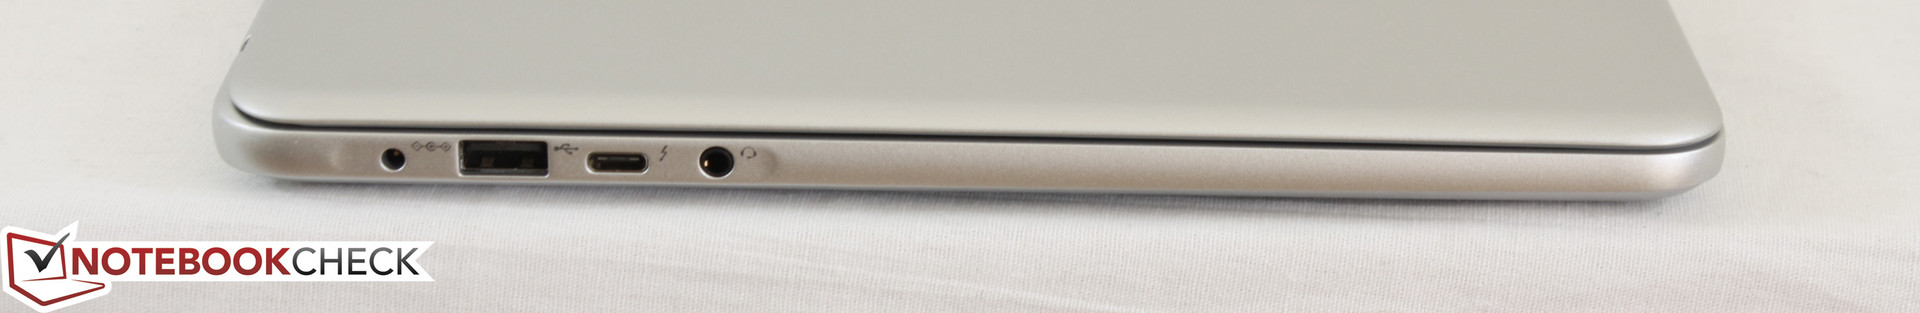
Il Notebook 9 NP900X5N eccelle in molte aree ma in altre lascia a desiderare. Lodiamo il produttore per aver offerto un display 1080p molto luminoso su un sistema estremamente leggero ed anche per le discrete opzioni grafiche. Se luminosità, portabilità, longevità, connettività Thunderbolt, e scheda grafica GeForce sono una priorità, allora il Notebook 9 è assolutamente da raccomandare specialmente gli utenti trovano frivole le opzioni touchscreen o se le alternative 14" risultano troppo piccole per una buona produttività.
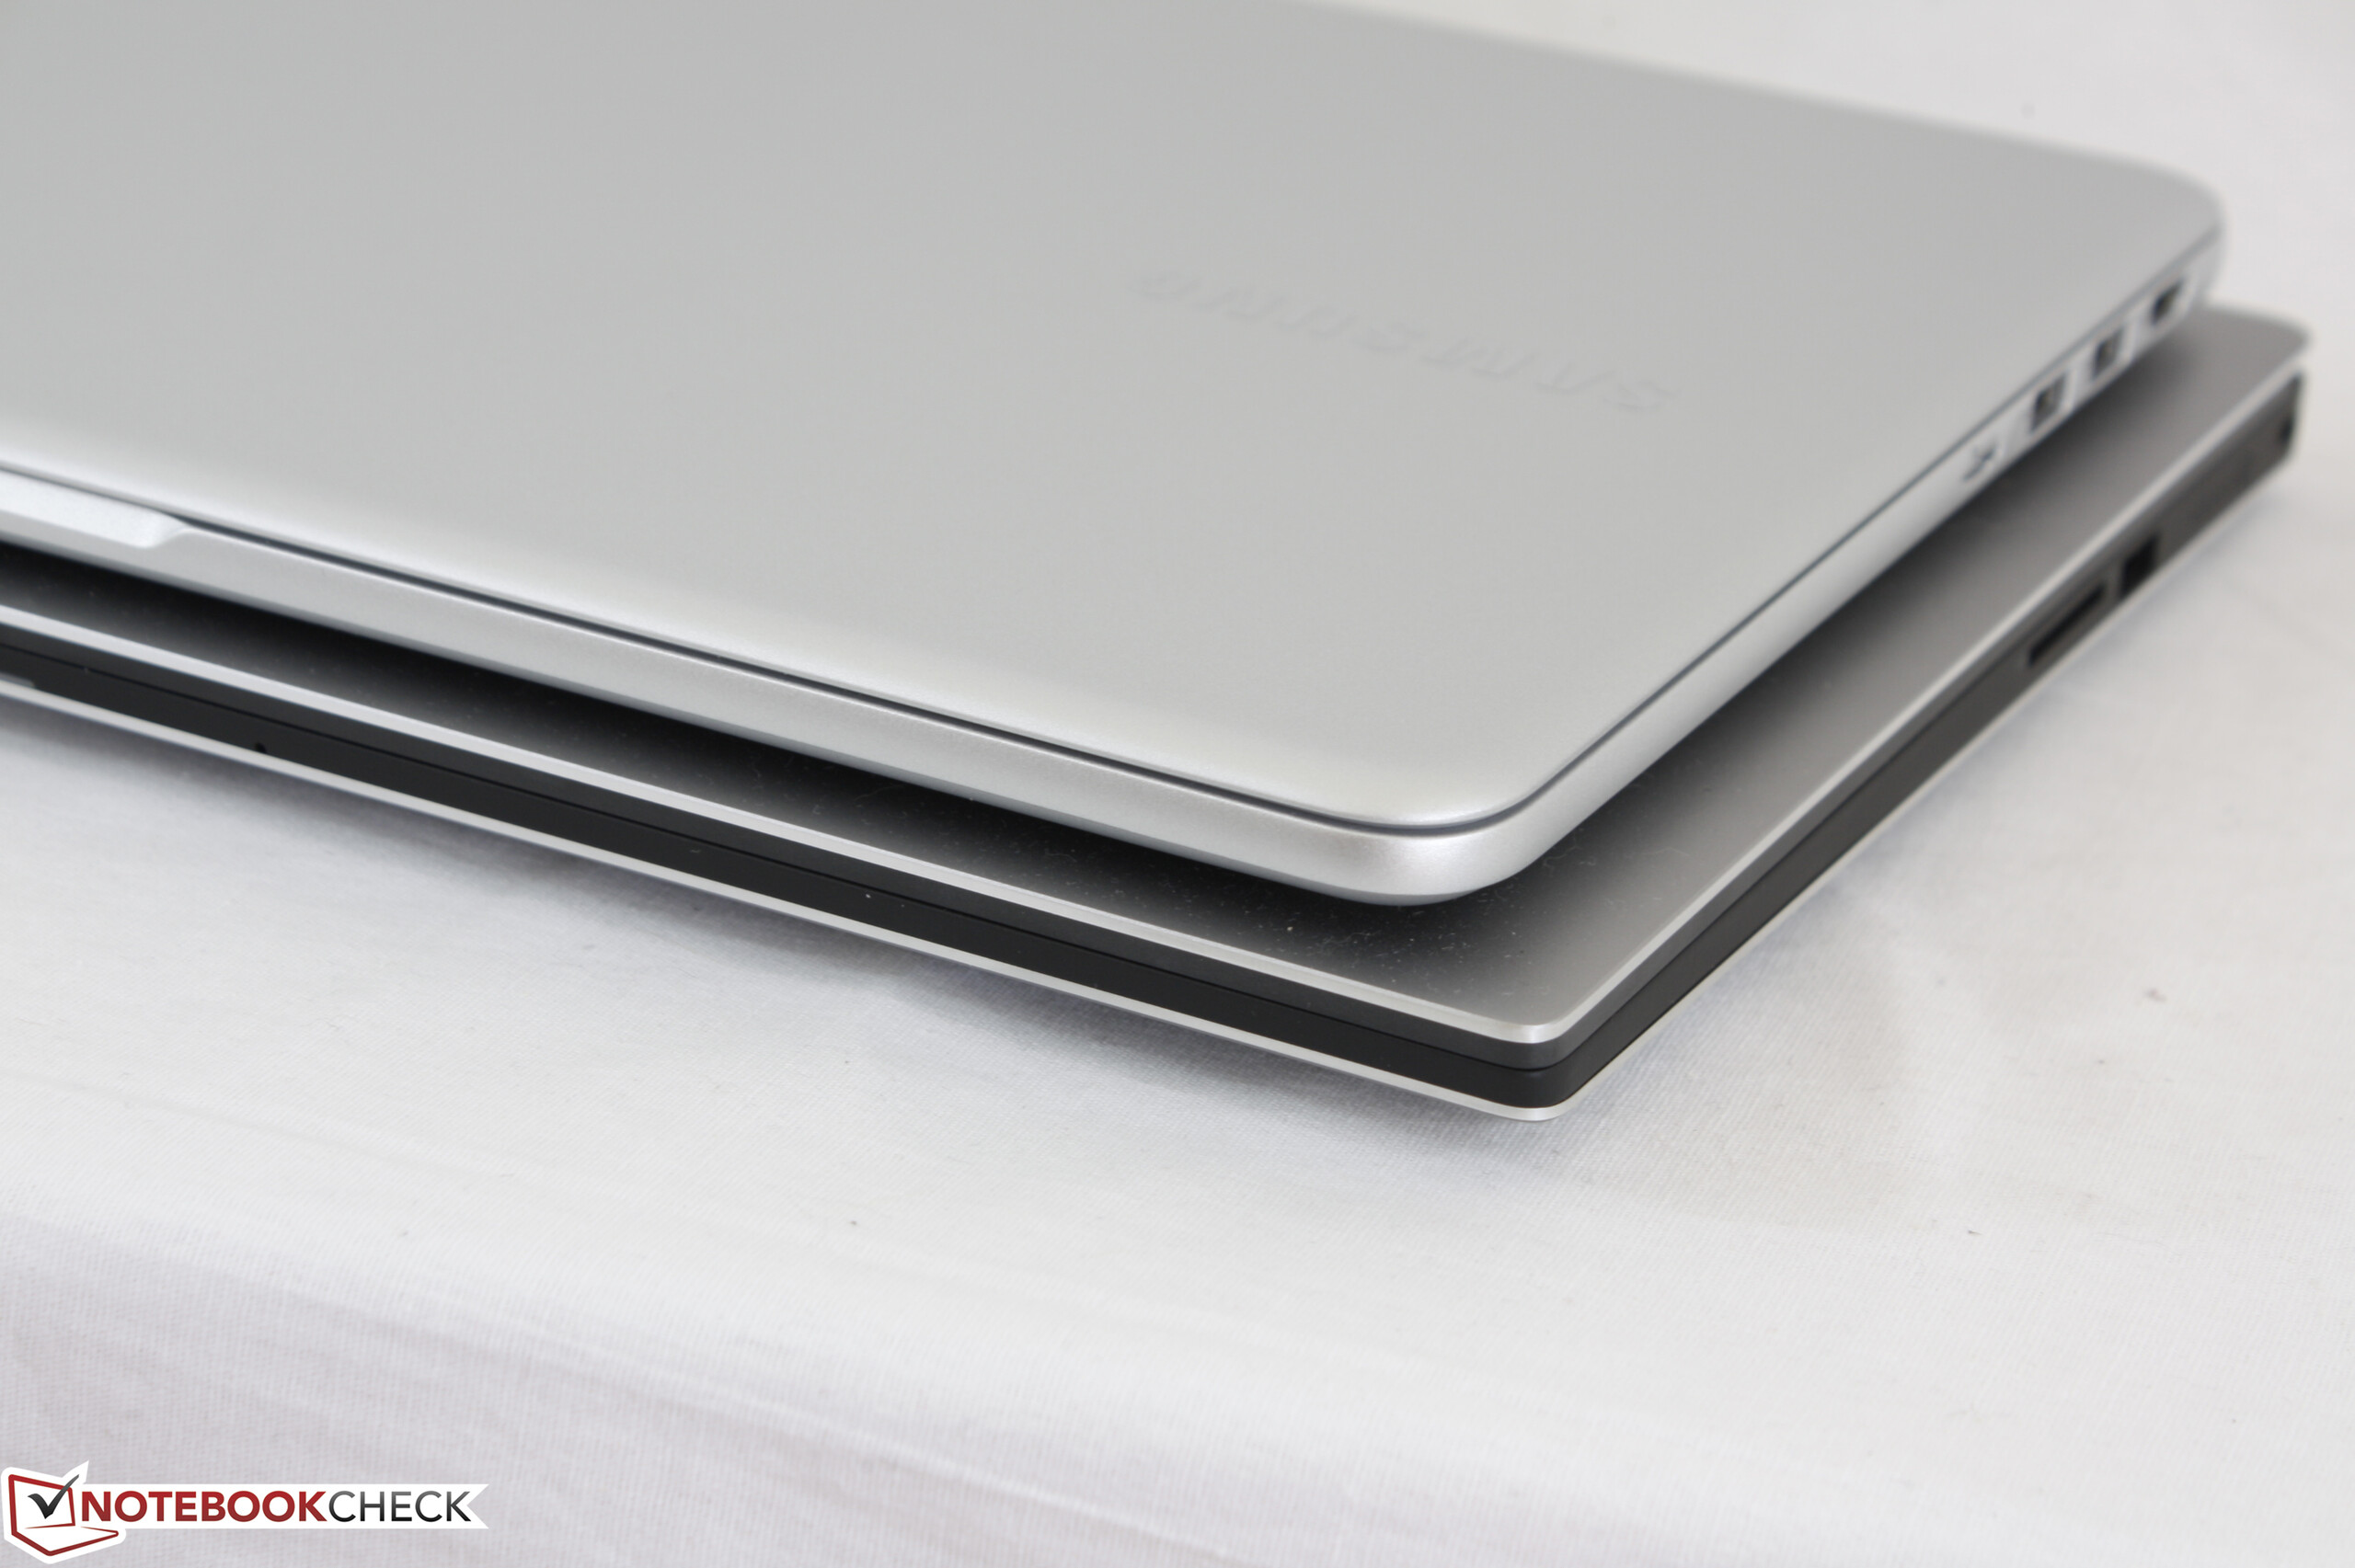
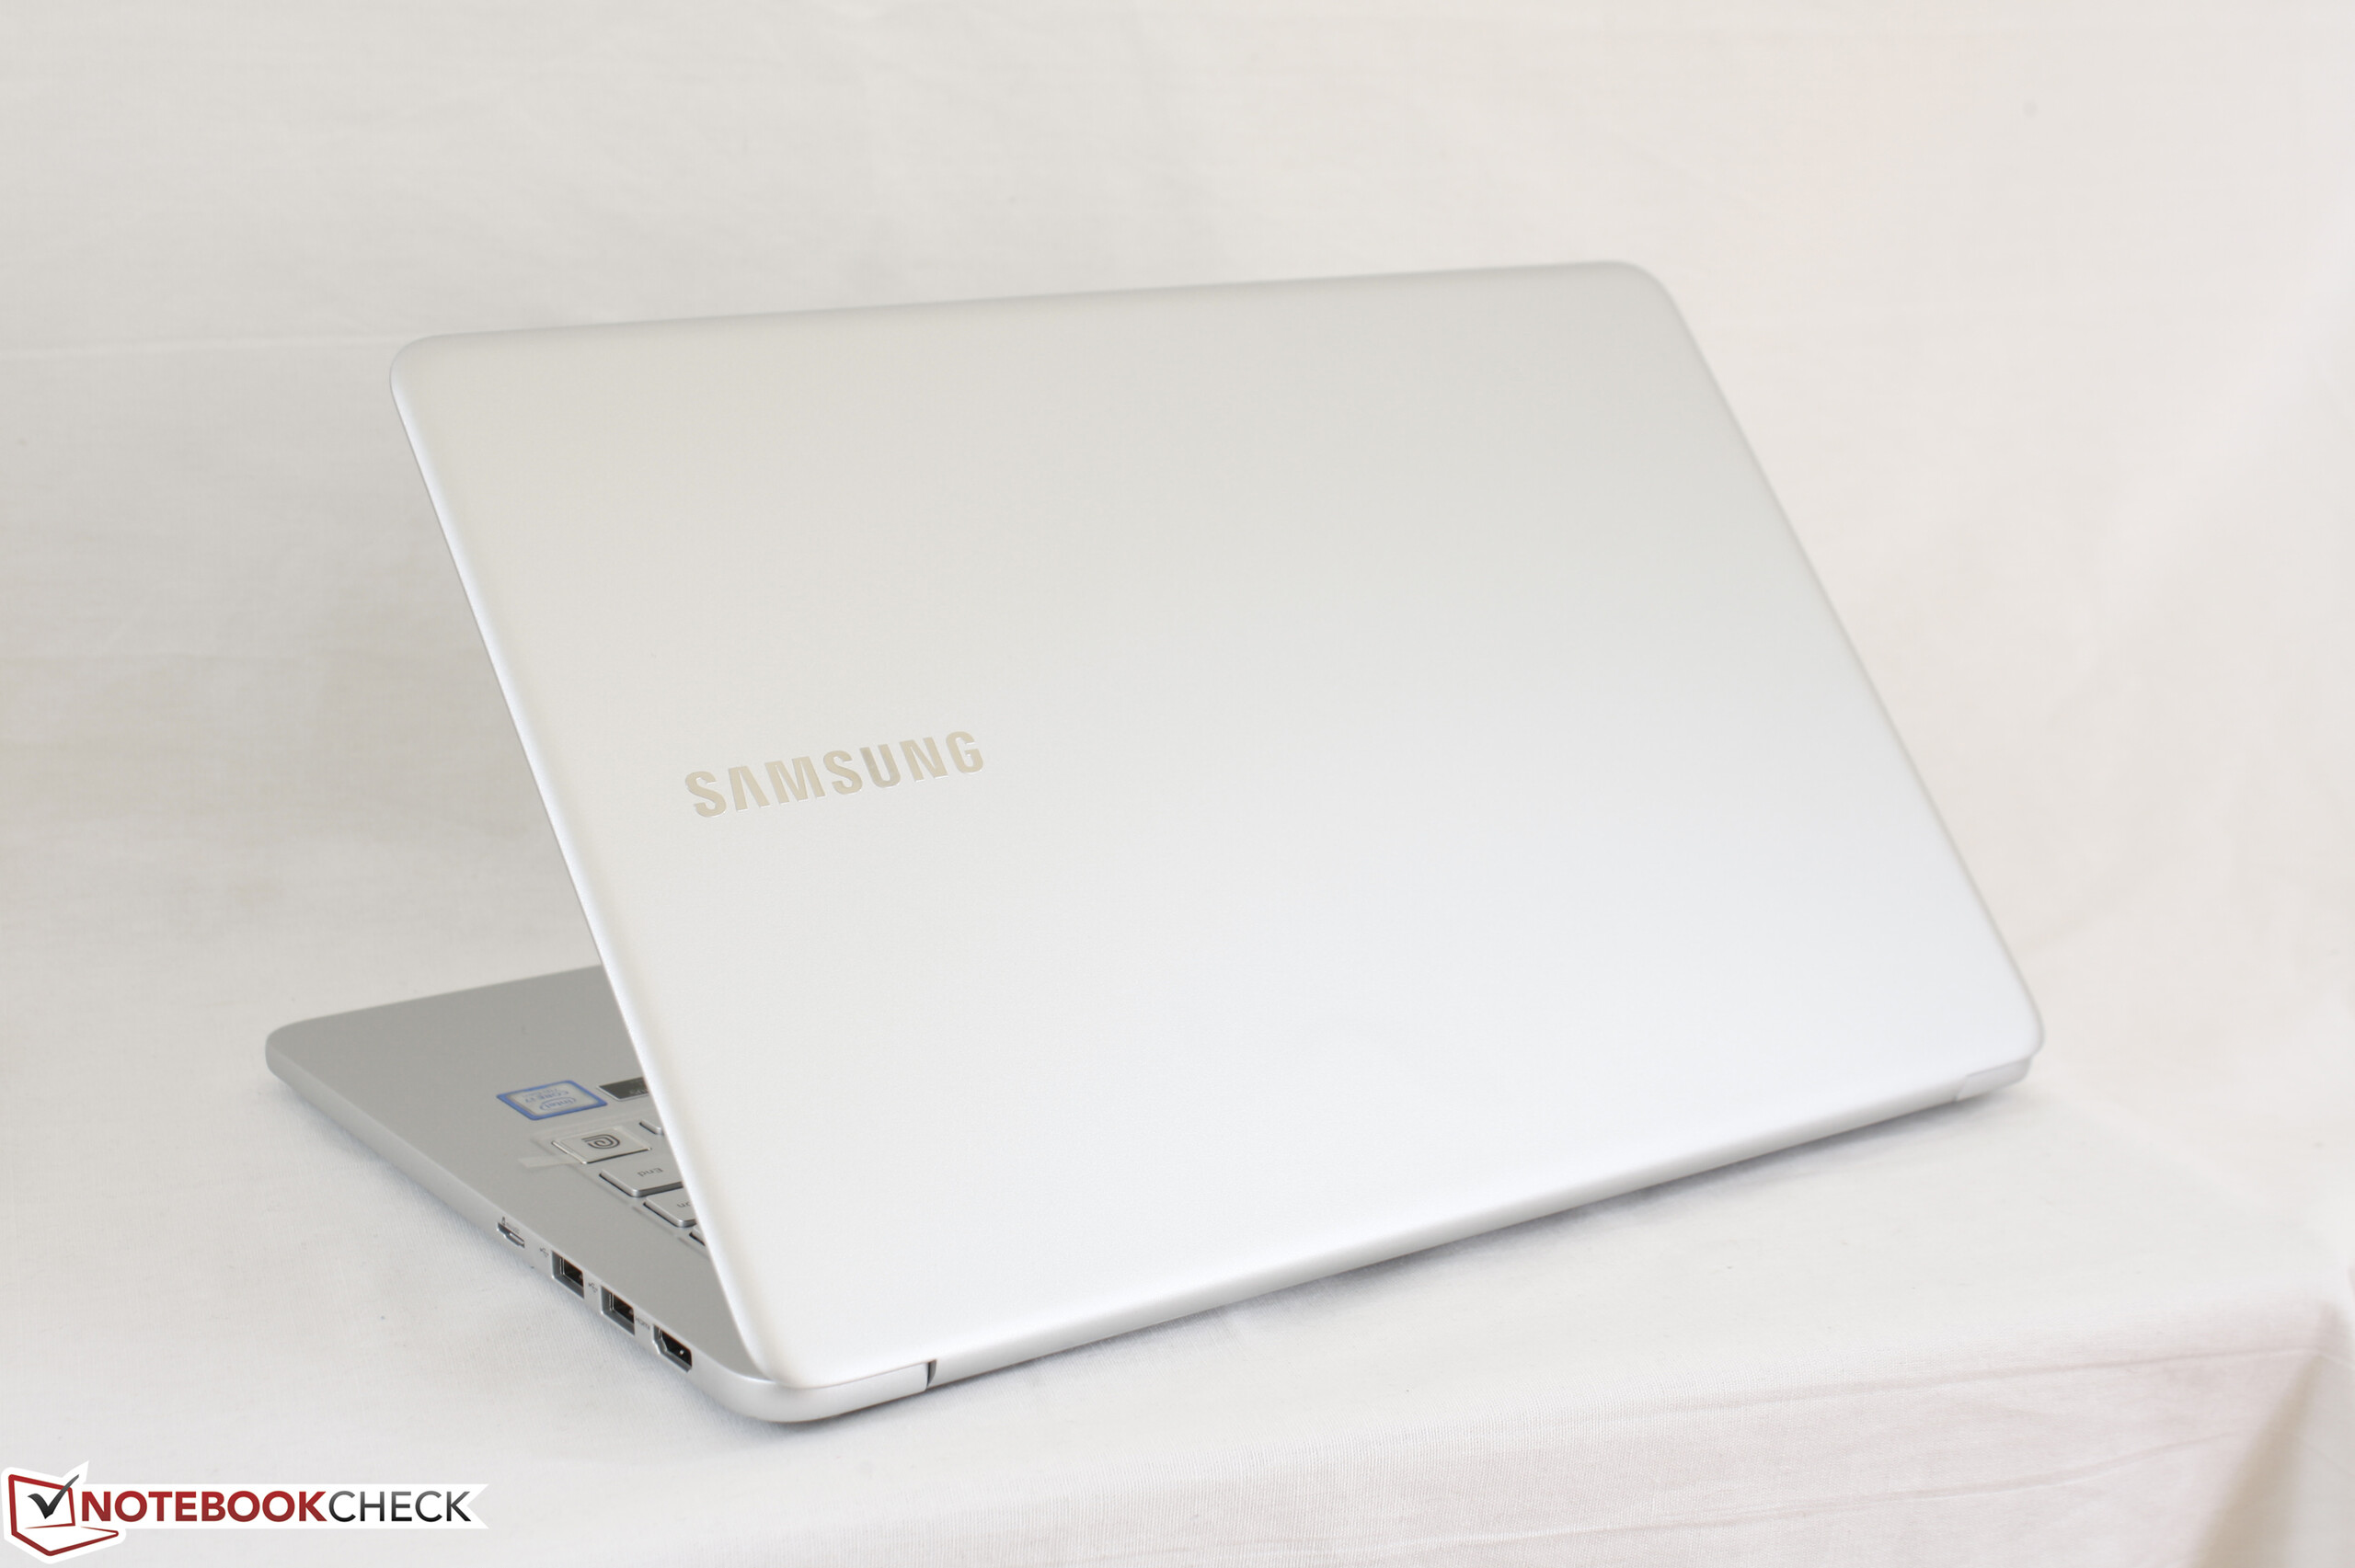
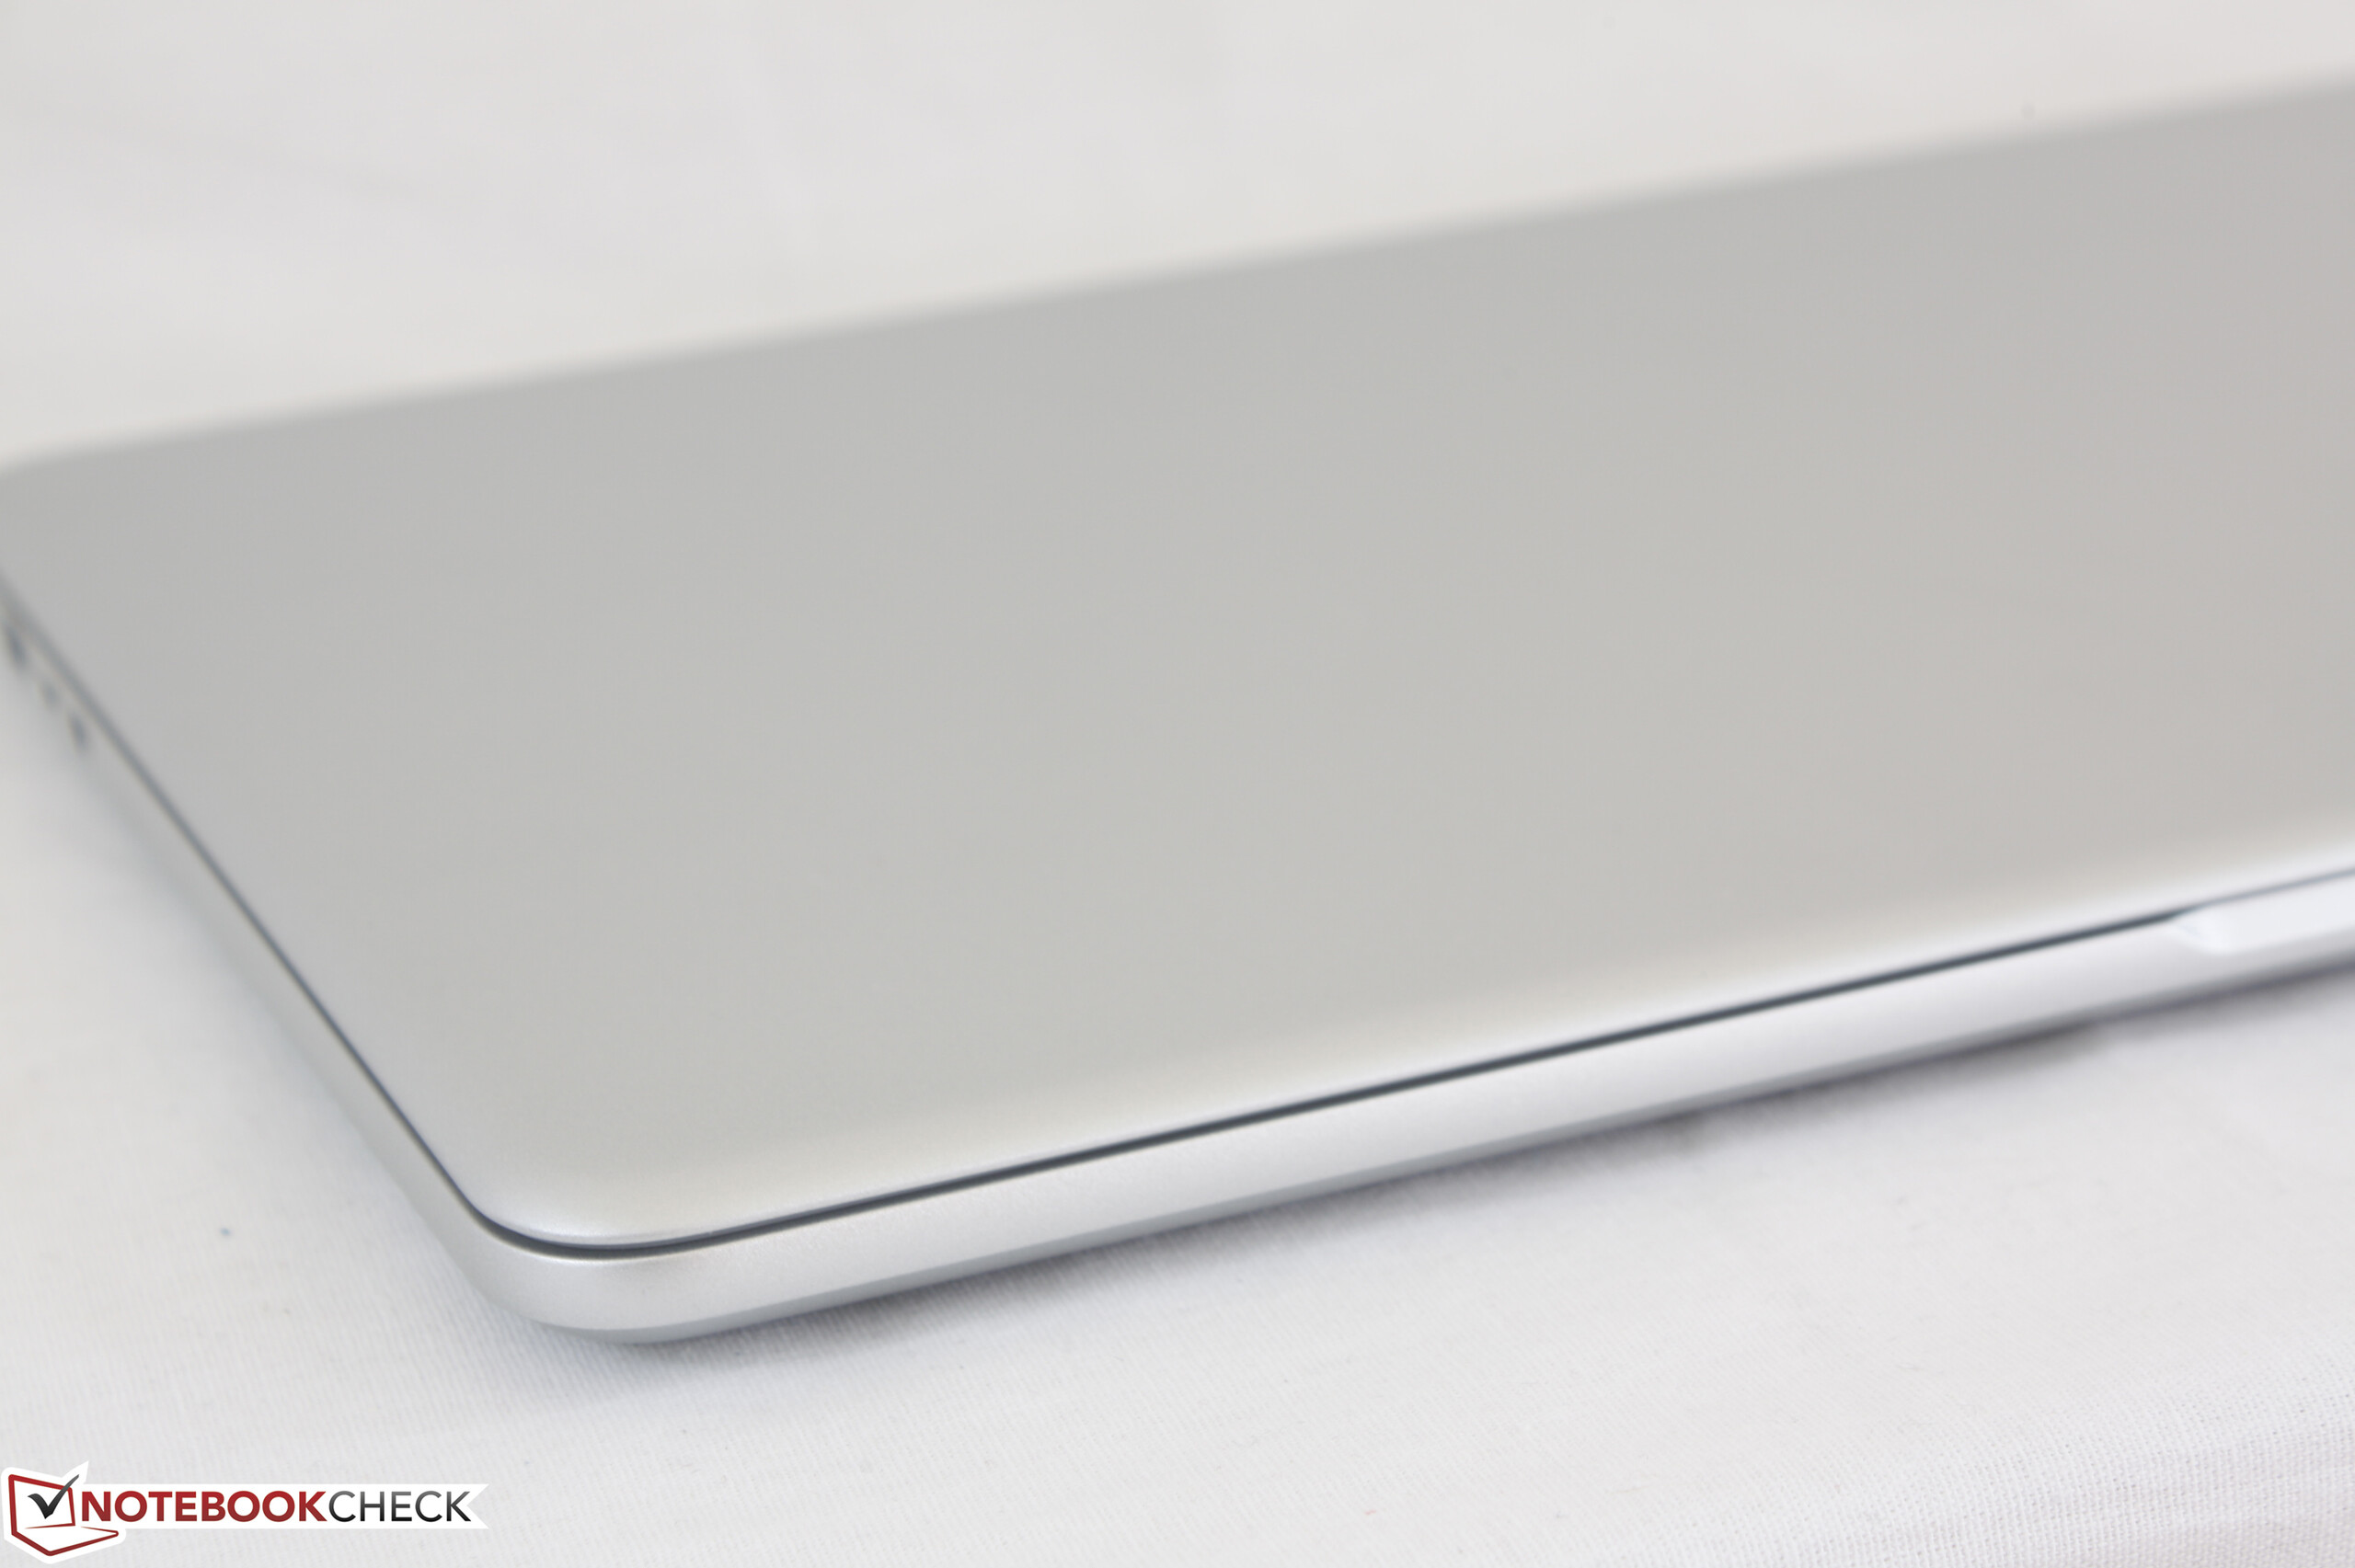
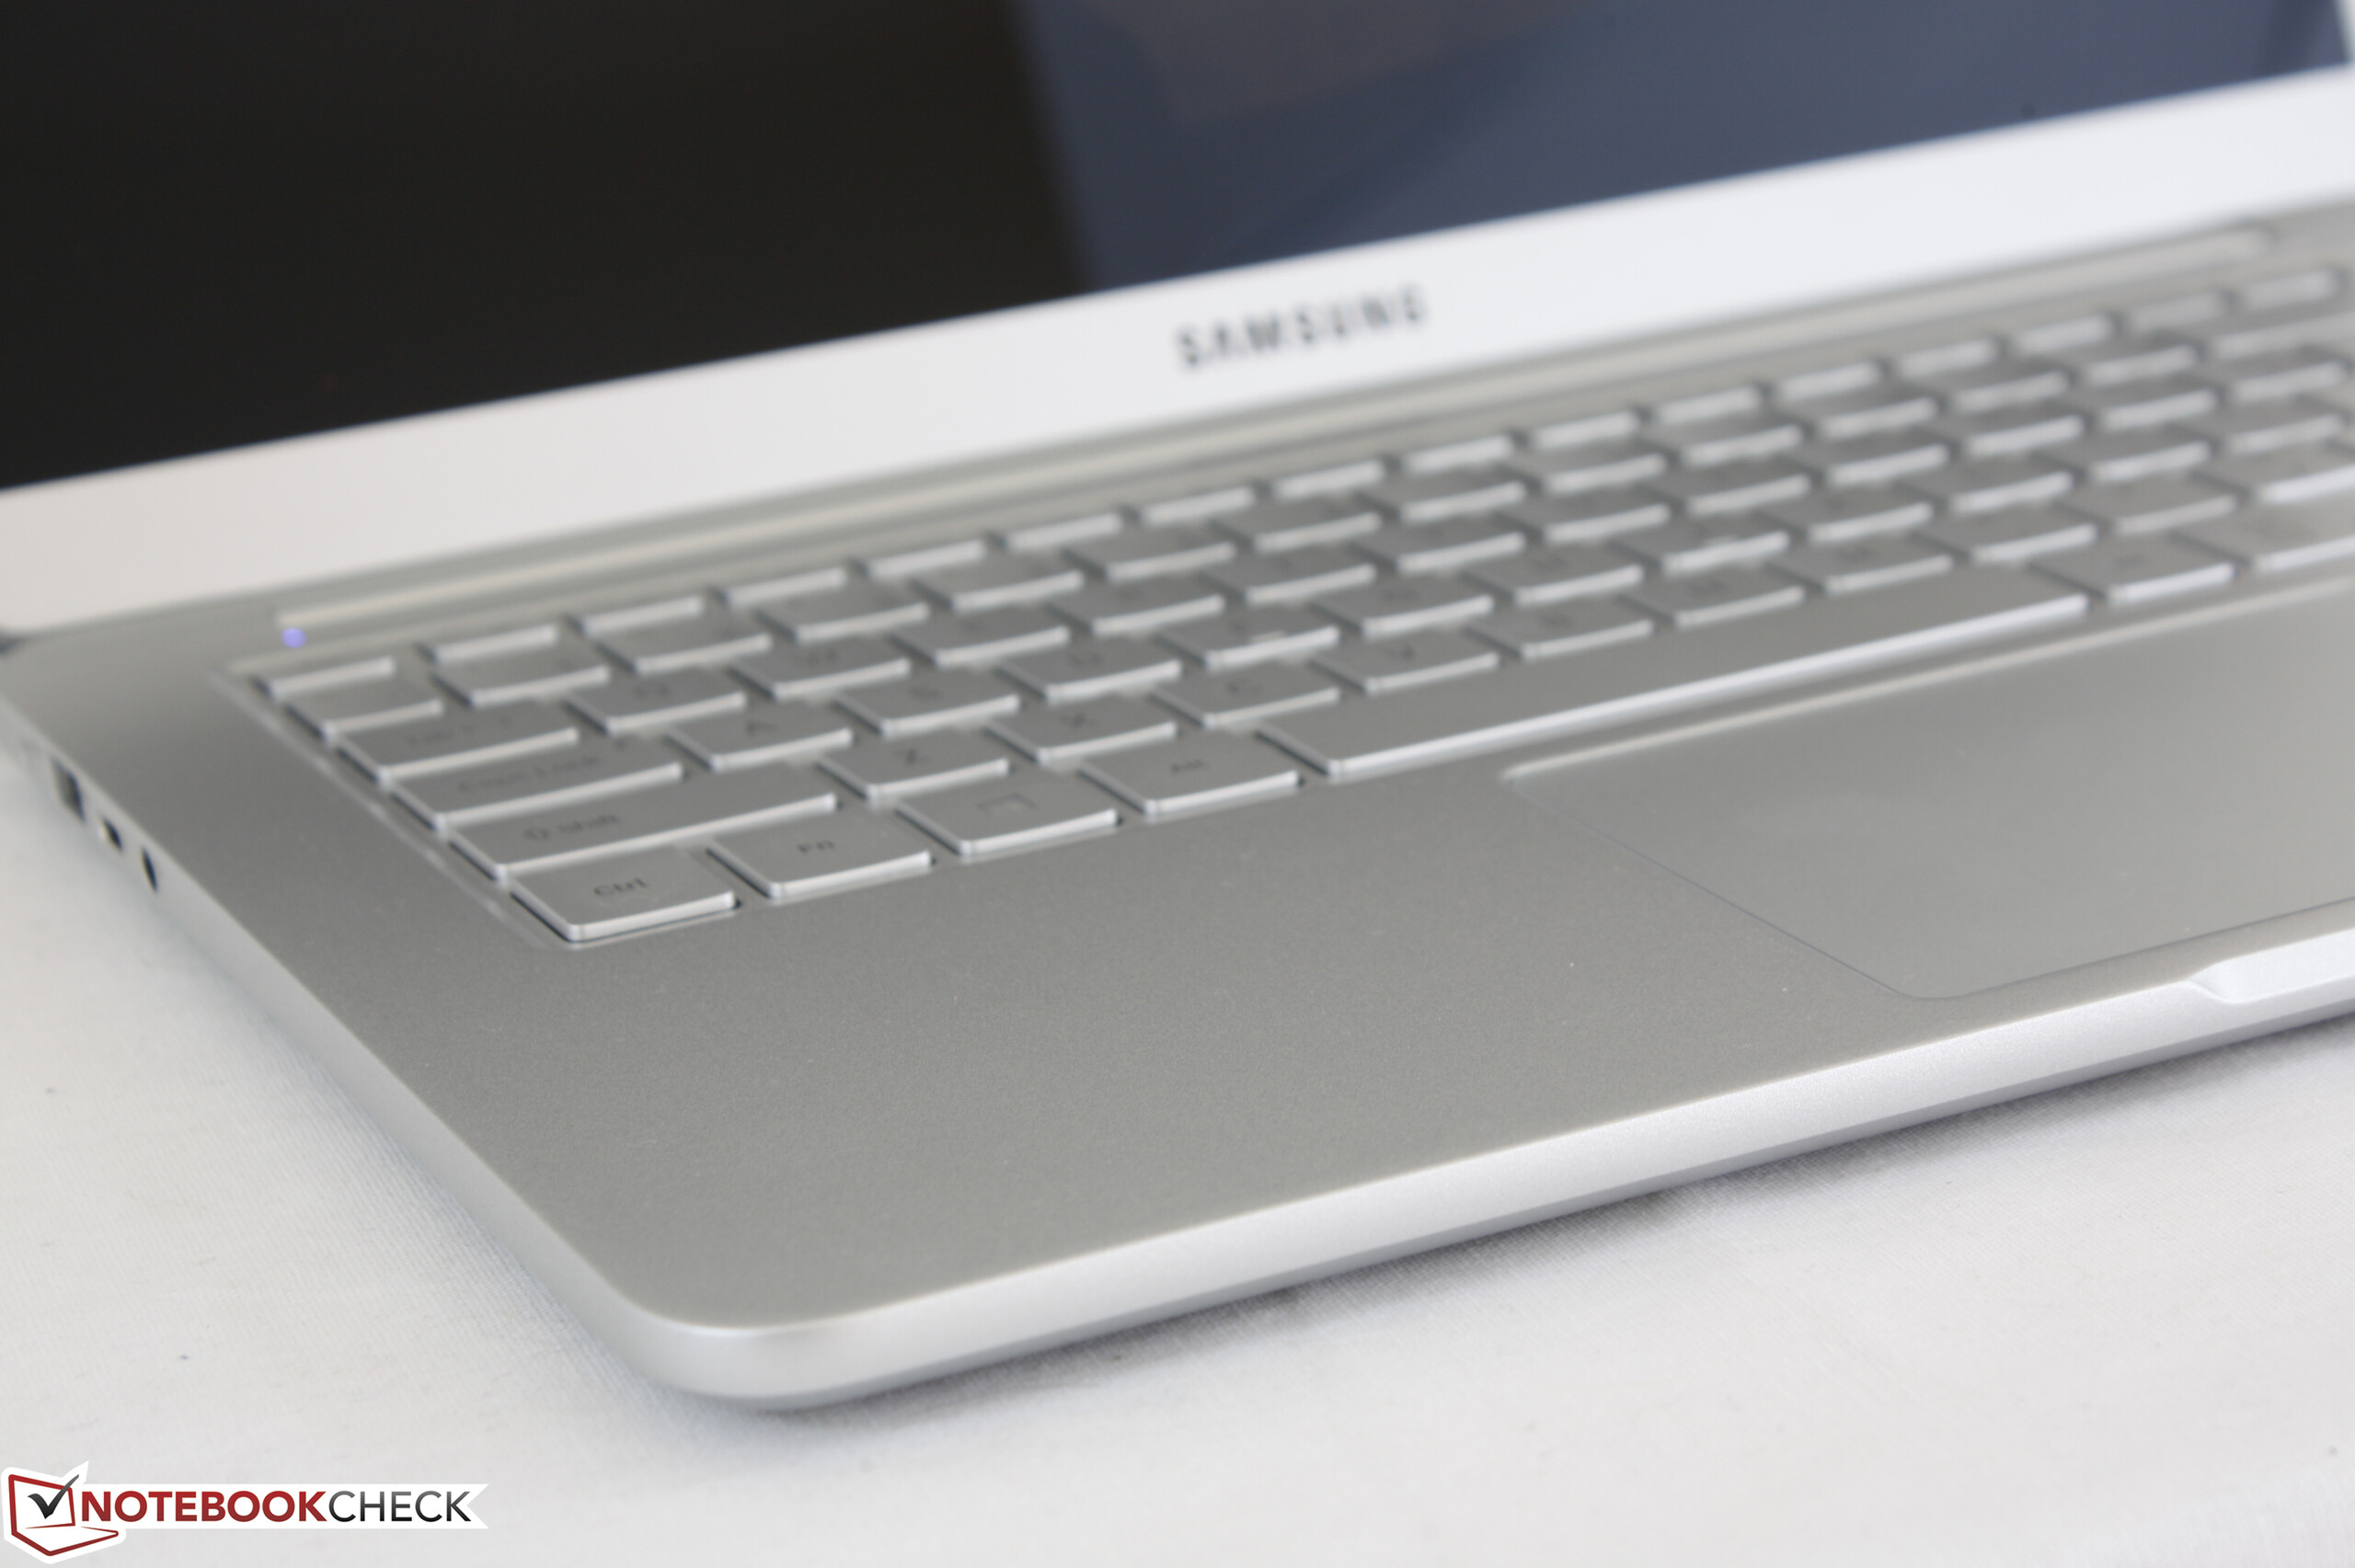
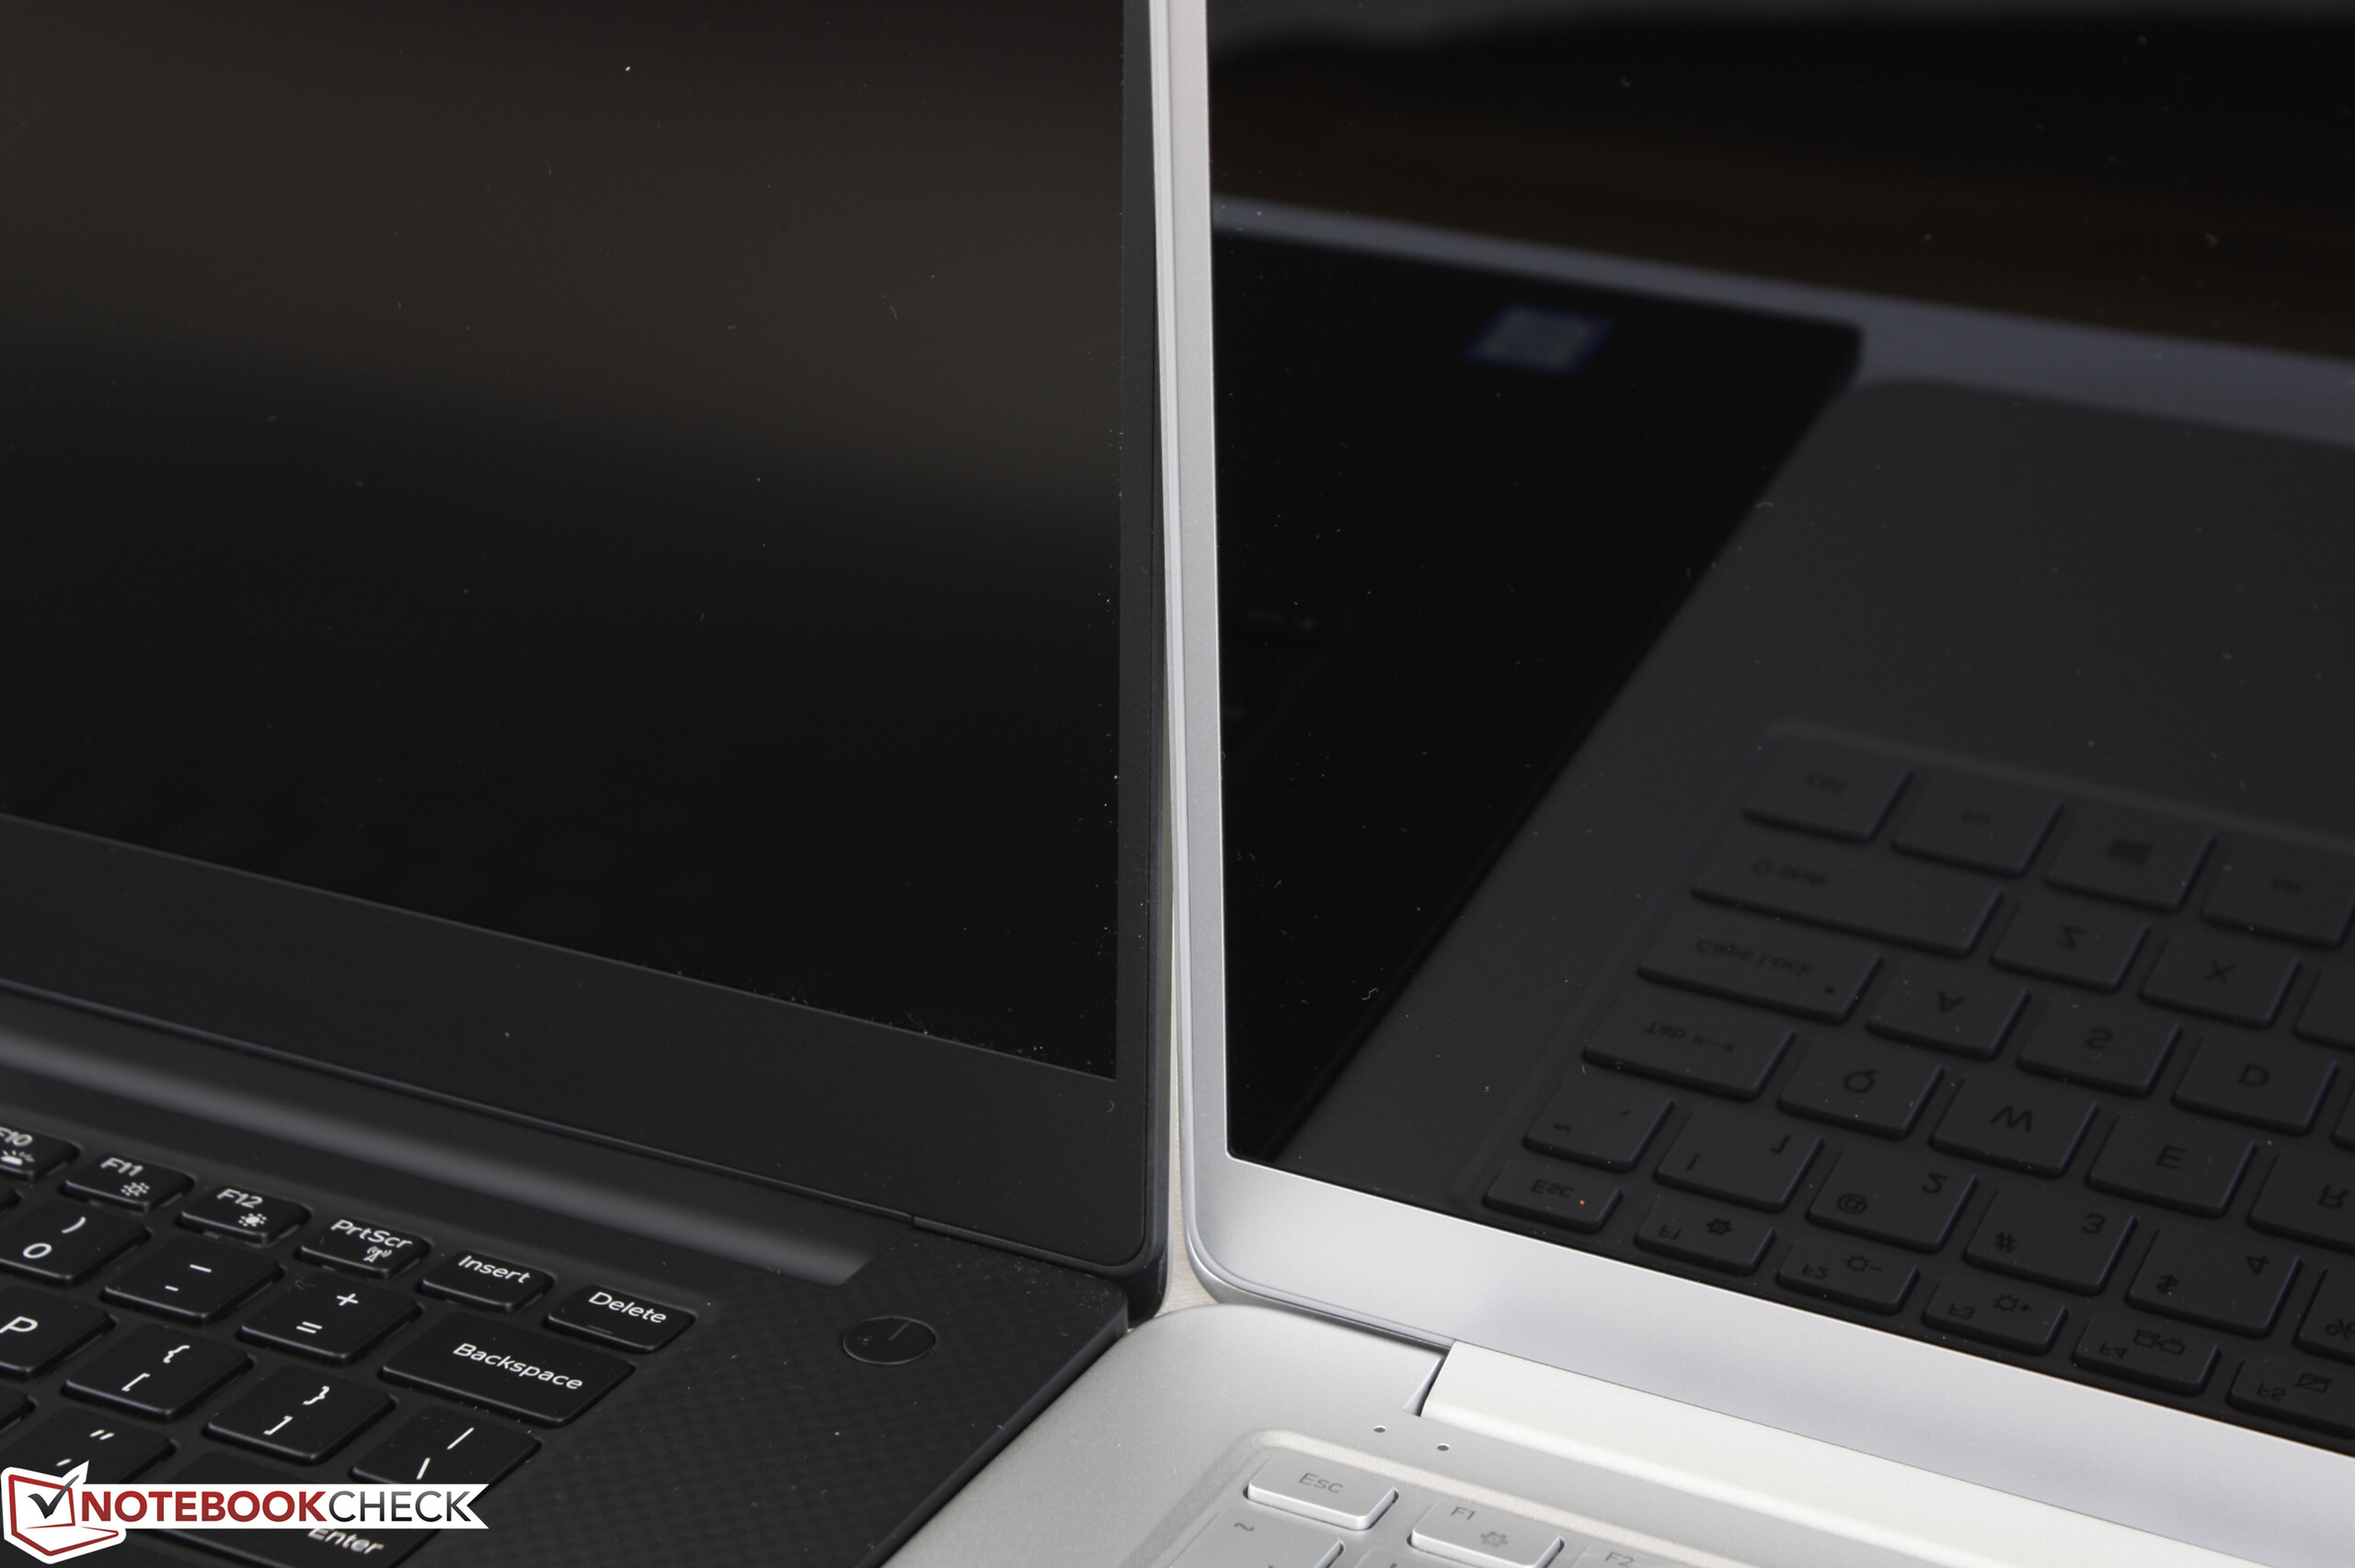
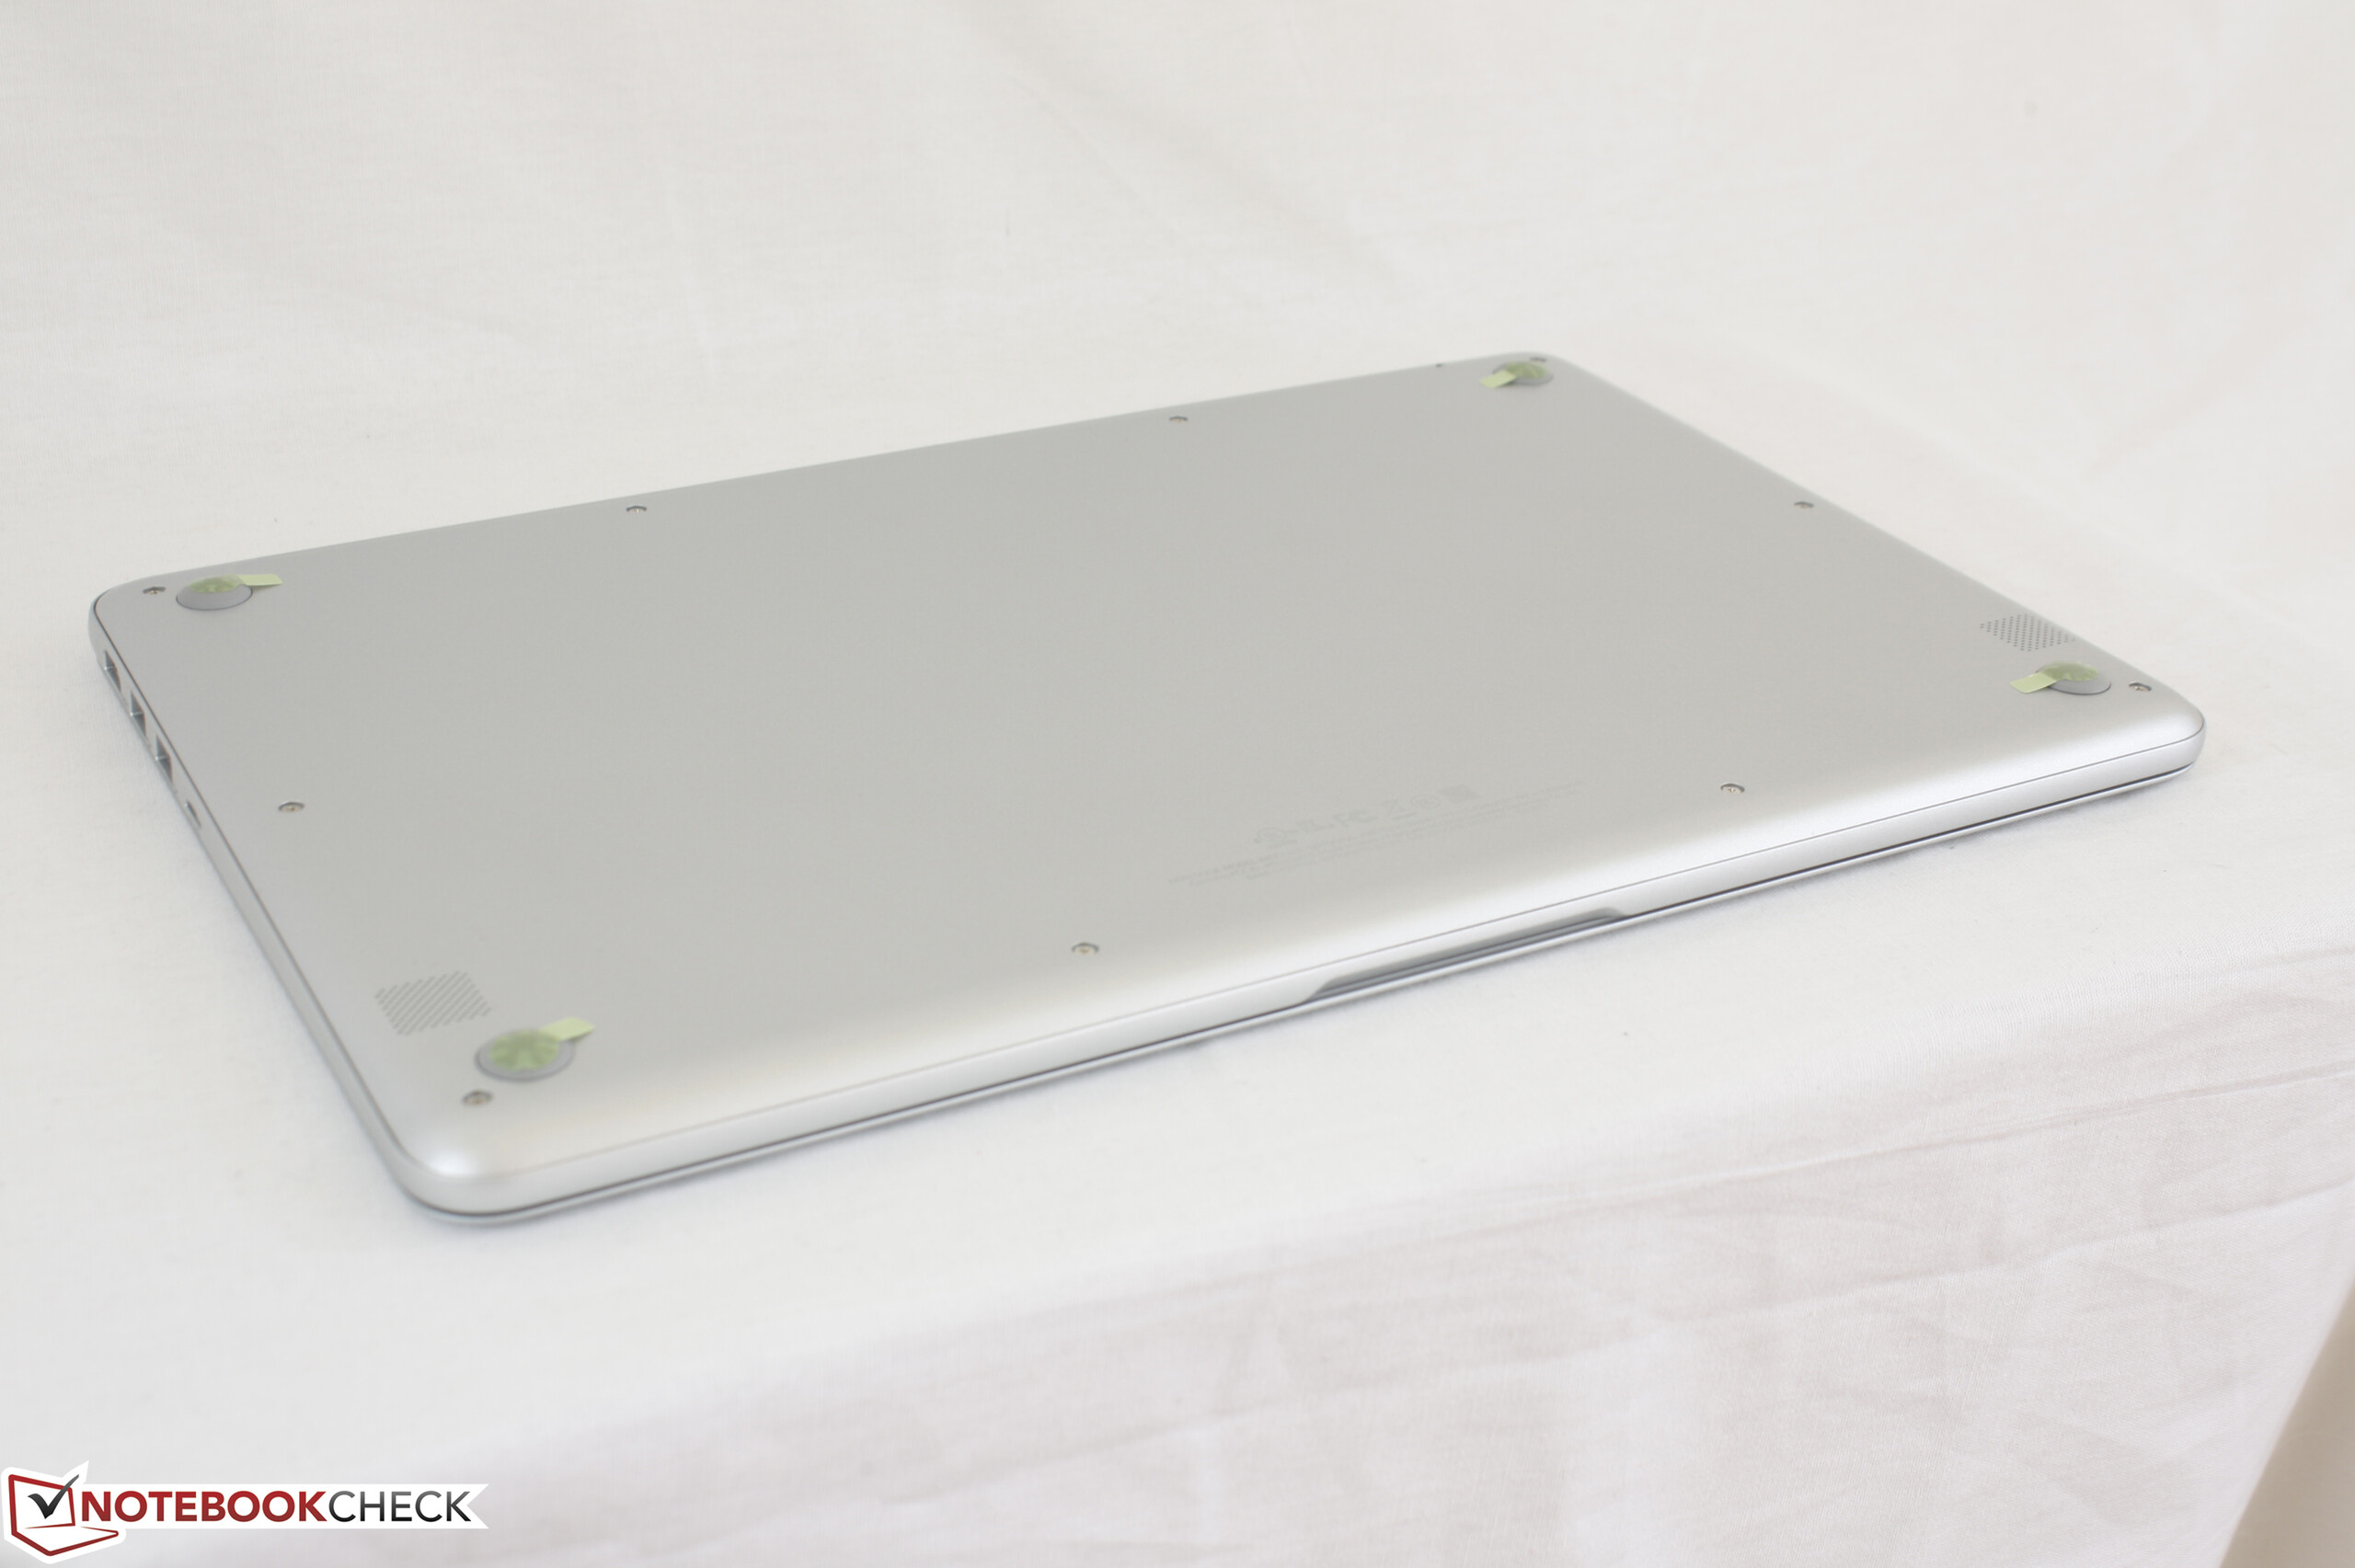
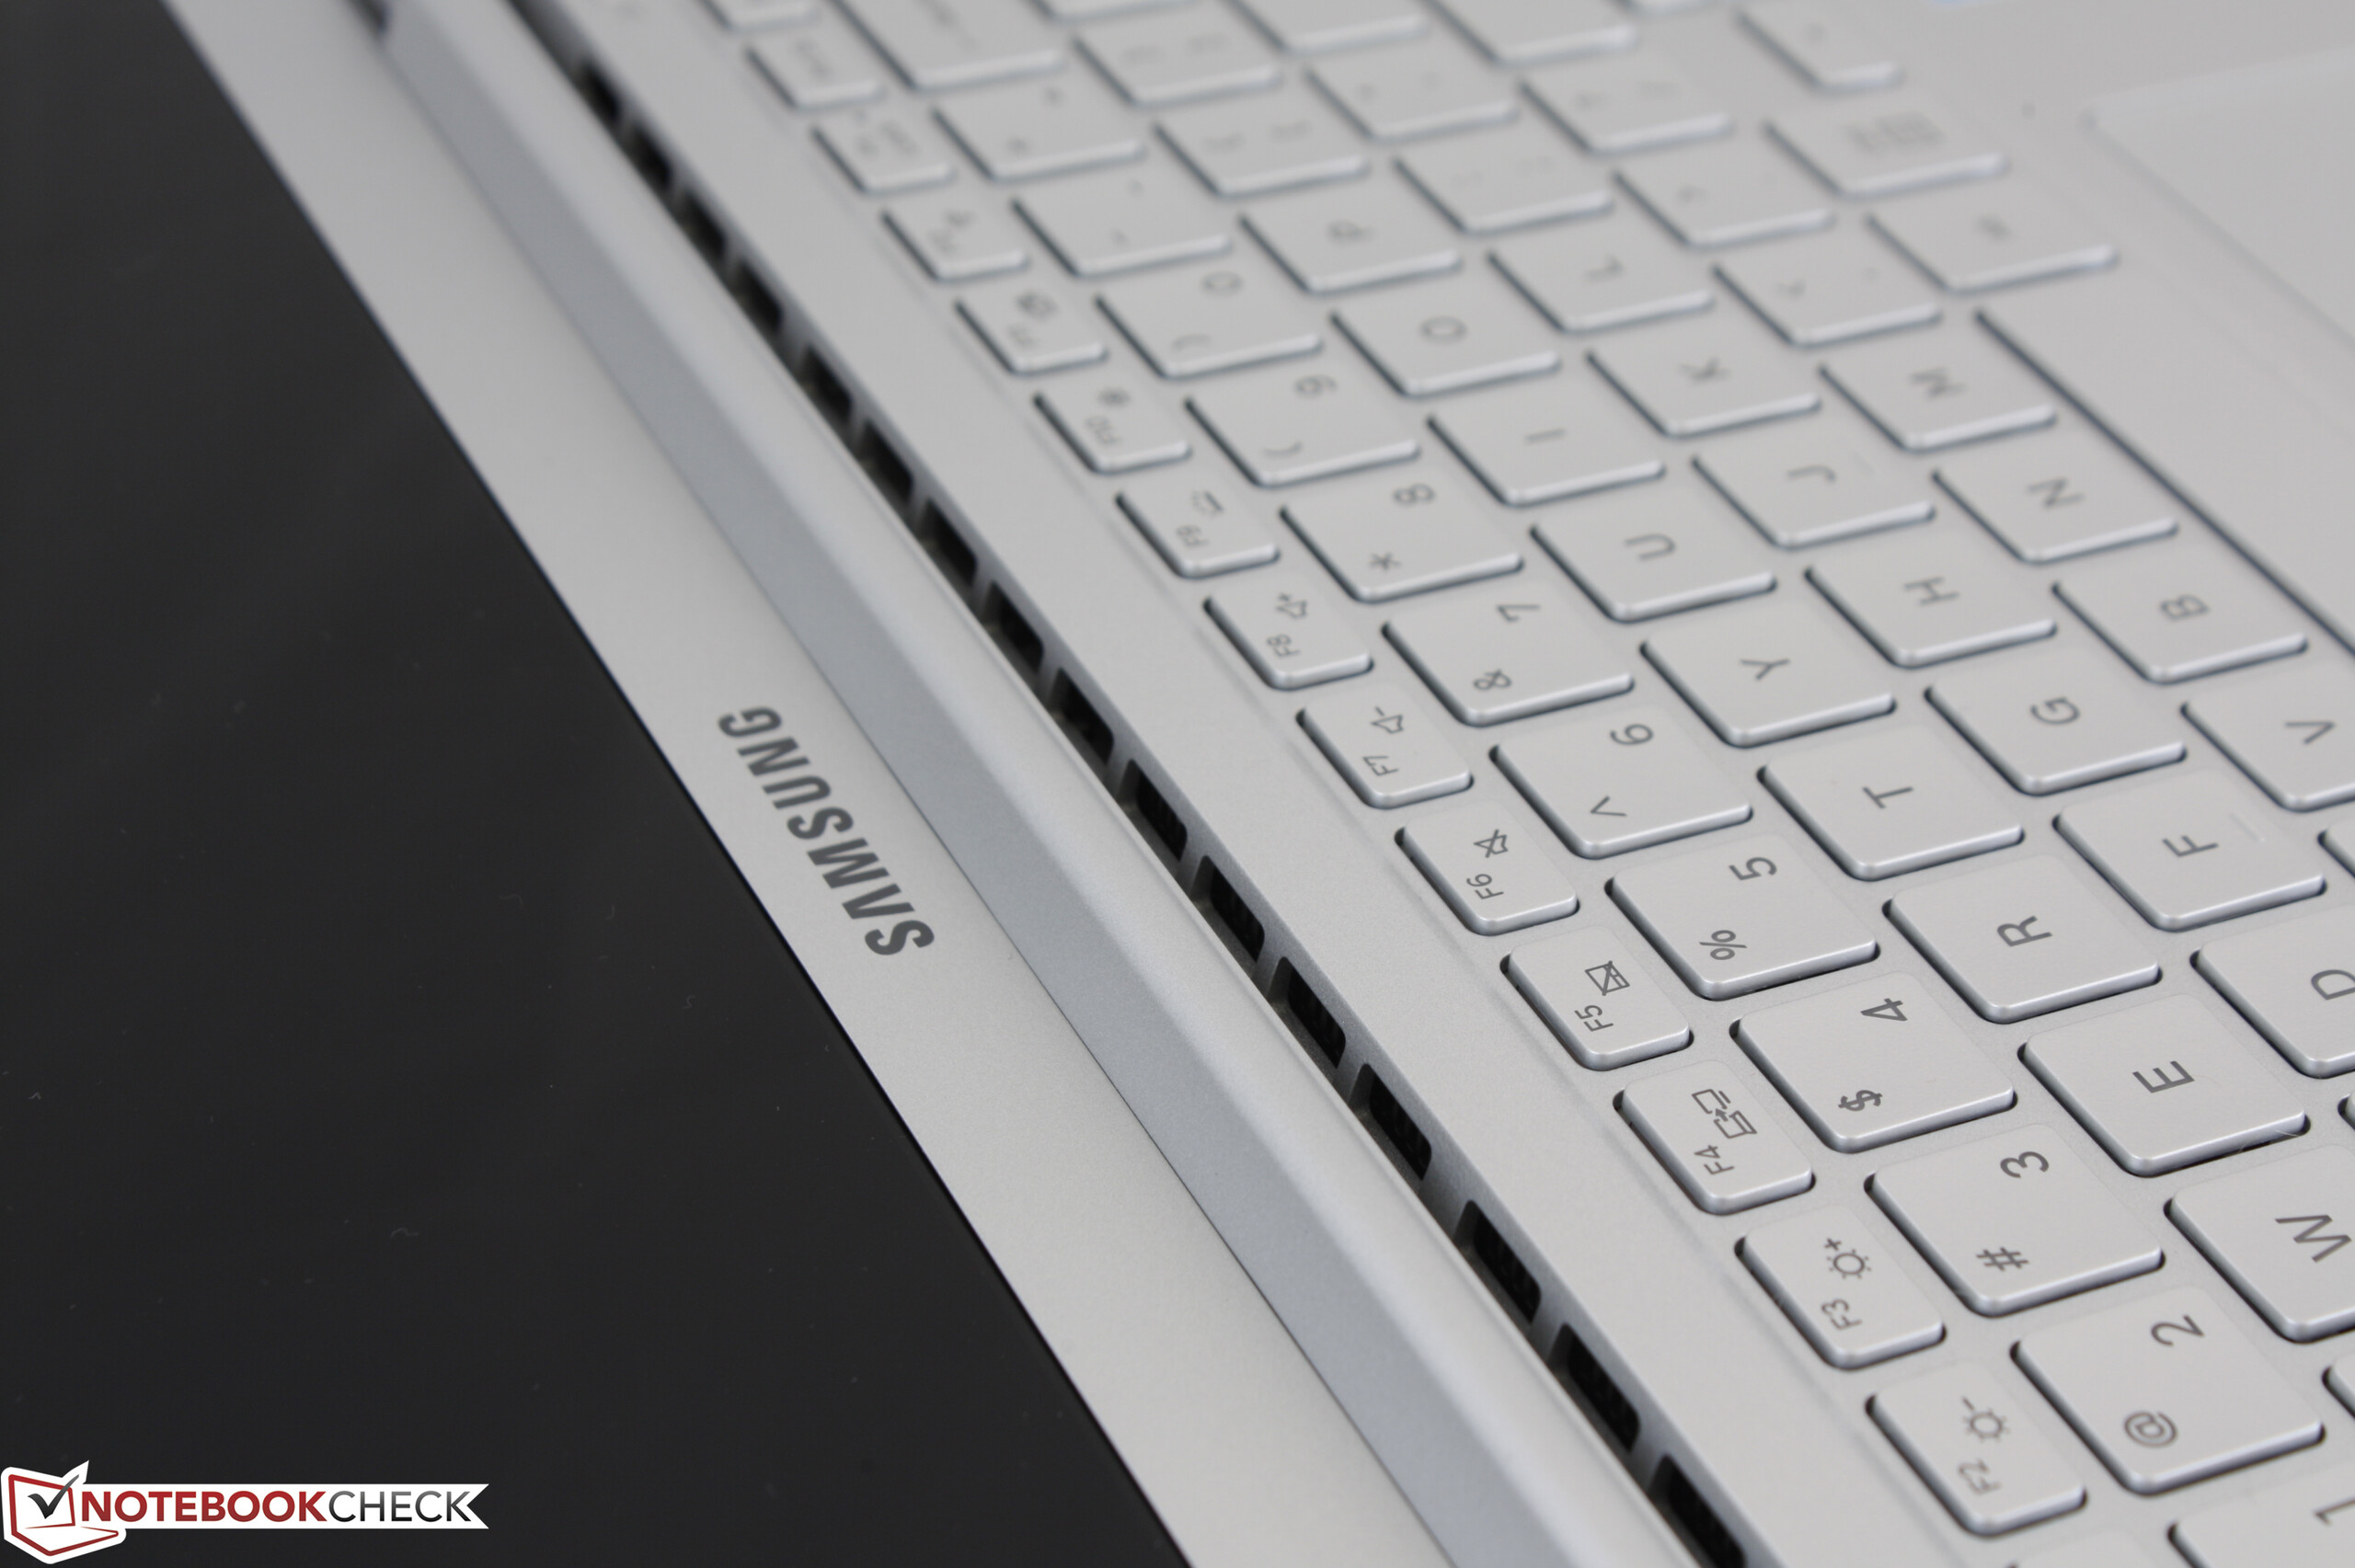
Il Samsung non è perfetto ed ha uno chassis mediamente rigido con qualche strana opzione di display. Per quanto bello il display con base sottile, è molto più flessibile rispetto ai concorrenti. E' strano che il pannello lucido sia obbligatorio sebbene di solito ci siano protezione Gorilla Glass o opzioni touchscreen. La presenza di PWM su quasi tutti i livelli di luminosità è un altro fattore che alcuni utenti dovrebbero tenere presente in fase d acquisto.
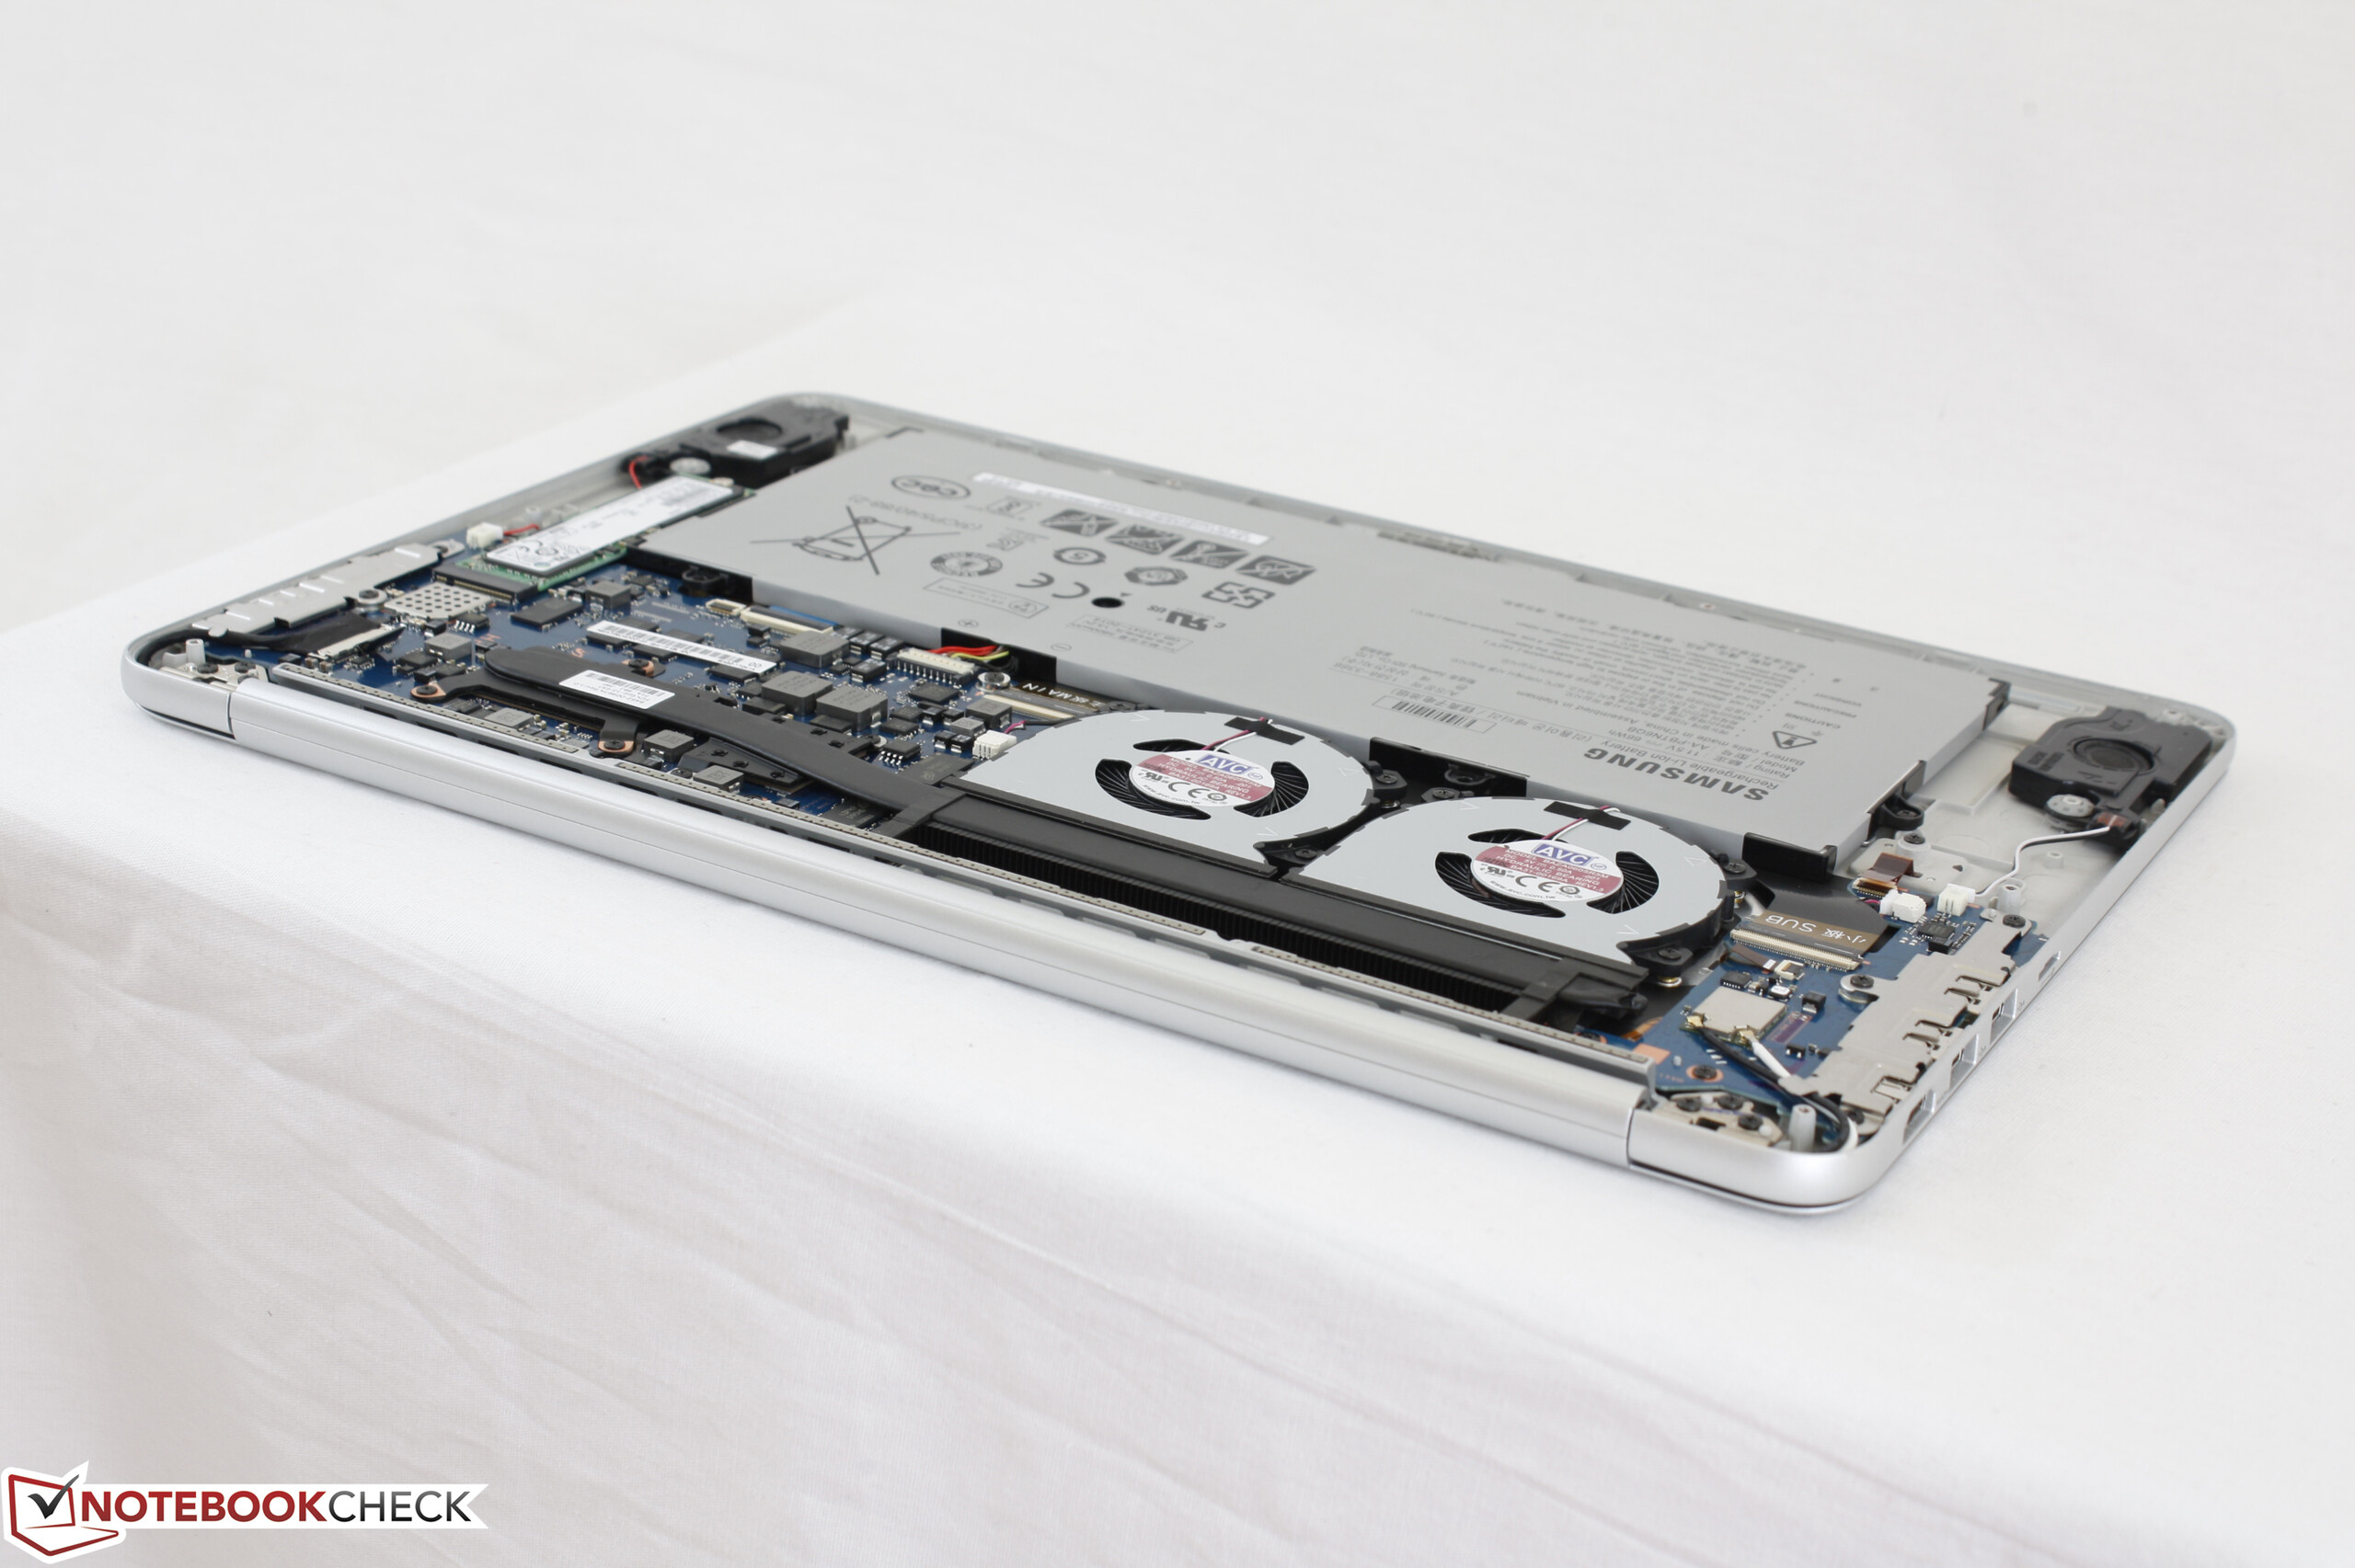
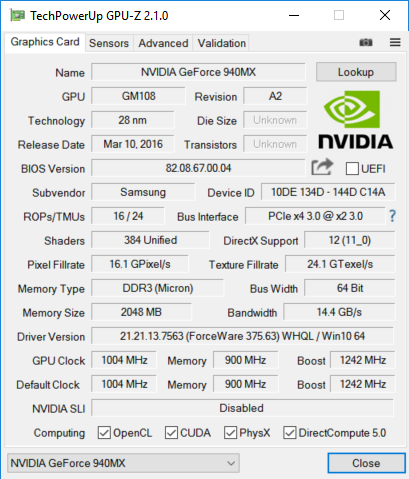
Inoltre, siamo stati delusi dal vedere solo la versione DDR3 GeForce 940MX invece della superiore versione GDDR5 specialmente in quanto questa GPU in particolare invecchia rapidamente. Nvidia lancerà presto la GeForce MX150 per portatili sottili e leggeri che di fatto renderà obsoleta la serie 940MX.
Infine, il sistema è abbastanza caro con un prezzo di $1400 USD per la nostra configurazione. I punti di forza superano quelli deboli se gli utenti riescono ad evitare colpi alla fragile cover.
Il nuovo Notebook 9 è unico grazie al suo schermo da 15" che si colloca tra i portatili da 14" e 15,6". E' sorprendentemente portatile e comodo da usare specialmente per chi viaggia molto, ma lo chassis dovrebbe essere rinforzato.
Nota: si tratta di una recensione breve, con alcune sezioni non tradotte, per la versione integrale in inglese guardate qui.
Samsung Notebook 9 NP900X5N-X01US
- 06/15/2017 v6 (old)
Allen Ngo
Price comparison
