Recensione breve del Portatile Lenovo ThinkPad 13 (Core i3-7100U, Full HD)
| SD Card Reader | |
| average JPG Copy Test (av. of 3 runs) | |
| Lenovo ThinkPad E560 20EV000MGE | |
| Lenovo Thinkpad 13-20J1001BUS | |
| Lenovo ThinkPad 13-20GKS01100 | |
| Dell Latitude 14 3470 | |
| maximum AS SSD Seq Read Test (1GB) | |
| Lenovo Thinkpad 13-20J1001BUS | |
| Lenovo ThinkPad 13-20GKS01100 | |
| Dell Latitude 14 3470 | |
| Networking | |
| iperf3 transmit AX12 | |
| Lenovo Thinkpad 13-20J1001BUS | |
| Lenovo ThinkPad 13-20J2S00G00 | |
| iperf3 receive AX12 | |
| Lenovo Thinkpad 13-20J1001BUS | |
| Lenovo ThinkPad 13-20J2S00G00 | |
| |||||||||||||||||||||||||
Distribuzione della luminosità: 88 %
Al centro con la batteria: 266.4 cd/m²
Contrasto: 859:1 (Nero: 0.31 cd/m²)
ΔE ColorChecker Calman: 5.3 | ∀{0.5-29.43 Ø4.72}
ΔE Greyscale Calman: 3.3 | ∀{0.09-98 Ø4.97}
60% sRGB (Argyll 1.6.3 3D)
38% AdobeRGB 1998 (Argyll 1.6.3 3D)
41.92% AdobeRGB 1998 (Argyll 3D)
60.7% sRGB (Argyll 3D)
40.57% Display P3 (Argyll 3D)
Gamma: 2.36
CCT: 6843 K
| Lenovo Thinkpad 13-20J1001BUS Lenovo LEN4094, IPS, 13.3", 1920x1080 | Lenovo ThinkPad 13-20GKS01100 LP133WF2-SPL1, , 13.3", 1920x1080 | Lenovo ThinkPad E560 20EV000MGE Lenovo N156B6-L07, TN LED, 15.6", 1366x768 | Dell Latitude 14 3470 Innolux N140BGE, TN LED, 14", 1366x768 | |
|---|---|---|---|---|
| Display | -5% | -7% | -1% | |
| Display P3 Coverage (%) | 40.57 | 38.35 -5% | 37.63 -7% | 40.21 -1% |
| sRGB Coverage (%) | 60.7 | 57.4 -5% | 56.7 -7% | 60.5 0% |
| AdobeRGB 1998 Coverage (%) | 41.92 | 39.66 -5% | 38.88 -7% | 41.55 -1% |
| Response Times | -5% | -10% | -10% | |
| Response Time Grey 50% / Grey 80% * (ms) | 32.8 ? | 43.2 ? -32% | 50 ? -52% | 47 ? -43% |
| Response Time Black / White * (ms) | 34.4 ? | 26.8 ? 22% | 23 ? 33% | 26 ? 24% |
| PWM Frequency (Hz) | ||||
| Screen | 3% | -56% | -50% | |
| Brightness middle (cd/m²) | 266.4 | 233 -13% | 241 -10% | 206 -23% |
| Brightness (cd/m²) | 250 | 227 -9% | 226 -10% | 193 -23% |
| Brightness Distribution (%) | 88 | 86 -2% | 89 1% | 87 -1% |
| Black Level * (cd/m²) | 0.31 | 0.22 29% | 0.48 -55% | 0.48 -55% |
| Contrast (:1) | 859 | 1059 23% | 502 -42% | 429 -50% |
| Colorchecker dE 2000 * | 5.3 | 5.41 -2% | 12.43 -135% | 11 -108% |
| Colorchecker dE 2000 max. * | 21 | 13.61 35% | 21.03 -0% | 19.57 7% |
| Greyscale dE 2000 * | 3.3 | 4.15 -26% | 13.24 -301% | 11.51 -249% |
| Gamma | 2.36 93% | 2.45 90% | 2.61 84% | 2.23 99% |
| CCT | 6843 95% | 6773 96% | 15733 41% | 13671 48% |
| Color Space (Percent of AdobeRGB 1998) (%) | 38 | 36.52 -4% | 36 -5% | 38.46 1% |
| Color Space (Percent of sRGB) (%) | 60 | 57.16 -5% | 57 -5% | 60.61 1% |
| Media totale (Programma / Settaggio) | -2% /
0% | -24% /
-40% | -20% /
-35% |
* ... Meglio usare valori piccoli
Tempi di risposta del Display
| ↔ Tempi di risposta dal Nero al Bianco | ||
|---|---|---|
| 34.4 ms ... aumenta ↗ e diminuisce ↘ combinato | ↗ 21.2 ms Incremento | 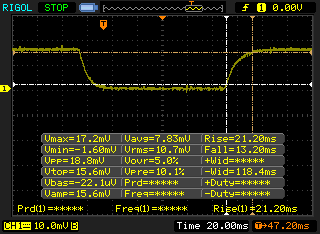 |
| ↘ 13.2 ms Calo | ||
| Lo schermo mostra tempi di risposta lenti nei nostri tests e sarà insoddisfacente per i gamers. In confronto, tutti i dispositivi di test variano da 0.1 (minimo) a 240 (massimo) ms. » 92 % di tutti i dispositivi è migliore. Questo significa che i tempi di risposta rilevati sono peggiori rispetto alla media di tutti i dispositivi testati (19.8 ms). | ||
| ↔ Tempo di risposta dal 50% Grigio all'80% Grigio | ||
| 32.8 ms ... aumenta ↗ e diminuisce ↘ combinato | ↗ 18 ms Incremento | 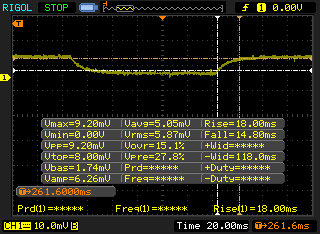 |
| ↘ 14.8 ms Calo | ||
| Lo schermo mostra tempi di risposta lenti nei nostri tests e sarà insoddisfacente per i gamers. In confronto, tutti i dispositivi di test variano da 0.165 (minimo) a 636 (massimo) ms. » 44 % di tutti i dispositivi è migliore. Questo significa che i tempi di risposta rilevati sono simili alla media di tutti i dispositivi testati (31 ms). | ||
Sfarfallio dello schermo / PWM (Pulse-Width Modulation)
| flickering dello schermo / PWM non rilevato | 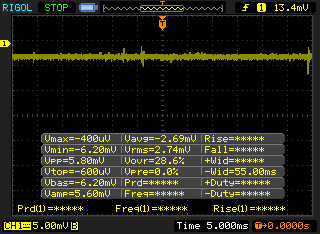 | ||
In confronto: 52 % di tutti i dispositivi testati non utilizza PWM per ridurre la luminosita' del display. Se è rilevato PWM, una media di 7781 (minimo: 5 - massimo: 343500) Hz è stata rilevata. | |||
| Cinebench R15 | |
| CPU Single 64Bit | |
| Lenovo ThinkPad 13-20GKS01100 | |
| Lenovo ThinkPad E560 20EV000MGE | |
| Dell Latitude 14 3470 | |
| Lenovo Thinkpad 13-20J1001BUS | |
| CPU Multi 64Bit | |
| Lenovo ThinkPad 13-20GKS01100 | |
| Lenovo Thinkpad 13-20J1001BUS | |
| Lenovo ThinkPad E560 20EV000MGE | |
| Dell Latitude 14 3470 | |
| Cinebench R11.5 | |
| CPU Single 64Bit | |
| Lenovo ThinkPad E560 20EV000MGE | |
| Dell Latitude 14 3470 | |
| Lenovo Thinkpad 13-20J1001BUS | |
| CPU Multi 64Bit | |
| Lenovo Thinkpad 13-20J1001BUS | |
| Lenovo ThinkPad E560 20EV000MGE | |
| Dell Latitude 14 3470 | |
| Cinebench R10 | |
| Rendering Multiple CPUs 32Bit | |
| Lenovo Thinkpad 13-20J1001BUS | |
| Lenovo ThinkPad E560 20EV000MGE | |
| Rendering Single 32Bit | |
| Lenovo Thinkpad 13-20J1001BUS | |
| Lenovo ThinkPad E560 20EV000MGE | |
| wPrime 2.10 - 1024m | |
| Lenovo Thinkpad 13-20J1001BUS | |
* ... Meglio usare valori piccoli
| PCMark 8 | |
| Home Score Accelerated v2 | |
| Lenovo Thinkpad 13-20J1001BUS | |
| Dell Latitude 14 3470 | |
| Lenovo ThinkPad 13-20GKS01100 | |
| Lenovo ThinkPad E560 20EV000MGE | |
| Work Score Accelerated v2 | |
| Lenovo Thinkpad 13-20J1001BUS | |
| Lenovo ThinkPad 13-20GKS01100 | |
| Dell Latitude 14 3470 | |
| Lenovo ThinkPad E560 20EV000MGE | |
| Creative Score Accelerated v2 | |
| Lenovo Thinkpad 13-20J1001BUS | |
| Lenovo ThinkPad 13-20GKS01100 | |
| Lenovo ThinkPad E560 20EV000MGE | |
| PCMark 7 Score | 3294 punti | |
| PCMark 8 Home Score Accelerated v2 | 3163 punti | |
| PCMark 8 Creative Score Accelerated v2 | 3886 punti | |
| PCMark 8 Work Score Accelerated v2 | 4139 punti | |
Aiuto | ||
| Lenovo Thinkpad 13-20J1001BUS | Lenovo ThinkPad 13-20GKS01100 Samsung SSD PM871 MZNLN256HCHP | Lenovo ThinkPad E560 20EV000MGE Western Digital WD Black Mobile 500GB (WD5000LPLX) | Dell Latitude 14 3470 Toshiba MQ01ACF050 | HP ProBook 440 G4 Z2Y47ES Samsung CM871a MZNTY256HDHP | |
|---|---|---|---|---|---|
| CrystalDiskMark 3.0 | 16% | -87% | -90% | 25% | |
| Read Seq (MB/s) | 447.3 | 461.7 3% | 120.4 -73% | 108.9 -76% | 524 17% |
| Write Seq (MB/s) | 331.3 | 297.8 -10% | 123.1 -63% | 103.2 -69% | 466.9 41% |
| Read 512 (MB/s) | 315.7 | 351.6 11% | 34.31 -89% | 404 28% | |
| Write 512 (MB/s) | 247.2 | 298.4 21% | 66.8 -73% | 292.5 18% | |
| Read 4k (MB/s) | 34.46 | 31.85 -8% | 0.373 -99% | 0.362 -99% | 33.08 -4% |
| Write 4k (MB/s) | 76.1 | 68.5 -10% | 1.29 -98% | 0.946 -99% | 80.2 5% |
| Read 4k QD32 (MB/s) | 235.3 | 360.9 53% | 0.976 -100% | 0.721 -100% | 379.4 61% |
| Write 4k QD32 (MB/s) | 162.2 | 276.2 70% | 1.285 -99% | 0.901 -99% | 216.2 33% |

| 3DMark | |
| 1280x720 Cloud Gate Standard Graphics | |
| Lenovo ThinkPad 13-20GKS01100 | |
| Lenovo Thinkpad 13-20J1001BUS | |
| Lenovo ThinkPad E560 20EV000MGE | |
| Dell Latitude 14 3470 | |
| 1920x1080 Ice Storm Extreme Graphics | |
| Lenovo Thinkpad 13-20J1001BUS | |
| 3DMark Ice Storm Standard Score | 34539 punti | |
| 3DMark Cloud Gate Standard Score | 4409 punti | |
Aiuto | ||
| BioShock Infinite | |
| 1920x1080 Ultra Preset, DX11 (DDOF) (ordina per valore) | |
| Lenovo Thinkpad 13-20J1001BUS | |
| 1366x768 High Preset (ordina per valore) | |
| Lenovo ThinkPad 13-20GKS01100 | |
| Lenovo ThinkPad E560 20EV000MGE | |
| 1366x768 Medium Preset (ordina per valore) | |
| Lenovo Thinkpad 13-20J1001BUS | |
| Lenovo ThinkPad 13-20GKS01100 | |
| Lenovo ThinkPad E560 20EV000MGE | |
| 1280x720 Very Low Preset (ordina per valore) | |
| Lenovo Thinkpad 13-20J1001BUS | |
| Lenovo ThinkPad 13-20GKS01100 | |
| Lenovo ThinkPad E560 20EV000MGE | |
| Ashes of the Singularity - 1280x768 low (ordina per valore) | |
| Lenovo Thinkpad 13-20J1001BUS | |
| basso | medio | alto | ultra | |
|---|---|---|---|---|
| BioShock Infinite (2013) | 35 | 22 | 11 | |
| Ashes of the Singularity (2016) | 8.9 |
Rumorosità
| Idle |
| 28.7 / 28.7 / 28.7 dB(A) |
| Sotto carico |
| 31.2 / 35.9 dB(A) |
 | ||
30 dB silenzioso 40 dB(A) udibile 50 dB(A) rumoroso |
||
min: | ||
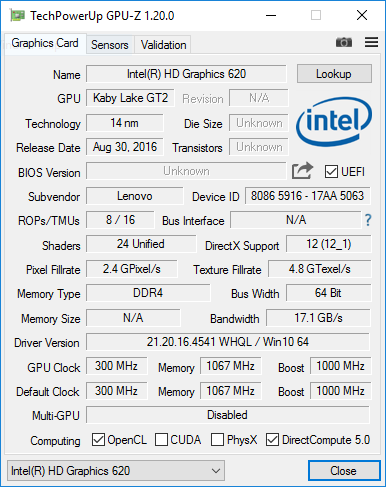
| Lenovo Thinkpad 13-20J1001BUS HD Graphics 620, i3-7100U | Lenovo ThinkPad 13-20GKS01100 HD Graphics 520, 6200U, Samsung SSD PM871 MZNLN256HCHP | Lenovo ThinkPad E560 20EV000MGE HD Graphics 520, 6100U, Western Digital WD Black Mobile 500GB (WD5000LPLX) | Dell Latitude 14 3470 HD Graphics 520, 6100U, Toshiba MQ01ACF050 | HP ProBook 440 G4 Z2Y47ES HD Graphics 620, i3-7100U, Samsung CM871a MZNTY256HDHP | Acer Spin 5 SP513-51 HD Graphics 520, 6100U, Hynix HFS128G39TND | |
|---|---|---|---|---|---|---|
| Noise | 0% | -12% | -7% | -10% | -5% | |
| off /ambiente * (dB) | 28.7 | 29.1 -1% | 31.2 -9% | 29.2 -2% | 30.9 -8% | 30.5 -6% |
| Idle Minimum * (dB) | 28.7 | 29.1 -1% | 32.3 -13% | 32.3 -13% | 30 -5% | 30.5 -6% |
| Idle Average * (dB) | 28.7 | 29.1 -1% | 32.3 -13% | 32.3 -13% | 31.8 -11% | 30.5 -6% |
| Idle Maximum * (dB) | 28.7 | 29.1 -1% | 32.5 -13% | 32.3 -13% | 33.5 -17% | 30.6 -7% |
| Load Average * (dB) | 31.2 | 31.5 -1% | 36 -15% | 33.3 -7% | 35.7 -14% | 31 1% |
| Load Maximum * (dB) | 35.9 | 33.5 7% | 38.8 -8% | 33.4 7% | 38.5 -7% | 36.8 -3% |
* ... Meglio usare valori piccoli
(±) La temperatura massima sul lato superiore è di 44.4 °C / 112 F, rispetto alla media di 34.3 °C / 94 F, che varia da 21.2 a 62.5 °C per questa classe Office.
(-) Il lato inferiore si riscalda fino ad un massimo di 55.4 °C / 132 F, rispetto alla media di 36.8 °C / 98 F
(+) In idle, la temperatura media del lato superiore è di 25.8 °C / 78 F, rispetto alla media deld ispositivo di 29.5 °C / 85 F.
(+) I poggiapolsi e il touchpad sono piu' freddi della temperatura della pelle con un massimo di 26.2 °C / 79.2 F e sono quindi freddi al tatto.
(±) La temperatura media della zona del palmo della mano di dispositivi simili e'stata di 27.5 °C / 81.5 F (+1.3 °C / 2.3 F).
Lenovo Thinkpad 13-20J1001BUS analisi audio
(±) | potenza degli altiparlanti media ma buona (75.1 dB)
Bassi 100 - 315 Hz
(-) | quasi nessun basso - in media 16.8% inferiori alla media
(±) | la linearità dei bassi è media (14.7% delta rispetto alla precedente frequenza)
Medi 400 - 2000 Hz
(+) | medi bilanciati - solo only 2.1% rispetto alla media
(+) | medi lineari (6.3% delta rispetto alla precedente frequenza)
Alti 2 - 16 kHz
(+) | Alti bilanciati - appena 2.5% dalla media
(±) | la linearità degli alti è media (8.4% delta rispetto alla precedente frequenza)
Nel complesso 100 - 16.000 Hz
(±) | la linearità complessiva del suono è media (18.4% di differenza rispetto alla media
Rispetto alla stessa classe
» 33% di tutti i dispositivi testati in questa classe è stato migliore, 7% simile, 60% peggiore
» Il migliore ha avuto un delta di 7%, medio di 21%, peggiore di 53%
Rispetto a tutti i dispositivi testati
» 41% di tutti i dispositivi testati in questa classe è stato migliore, 8% similare, 52% peggiore
» Il migliore ha avuto un delta di 4%, medio di 24%, peggiore di 134%
Lenovo ThinkPad 13-20GKS01100 analisi audio
(±) | potenza degli altiparlanti media ma buona (78.4 dB)
Bassi 100 - 315 Hz
(±) | bassi ridotti - in media 11.8% inferiori alla media
(-) | bassi non lineari (15.4% delta rispetto alla precedente frequenza)
Medi 400 - 2000 Hz
(±) | medi elevati - circa 6.8% superiore alla media
(+) | medi lineari (4.5% delta rispetto alla precedente frequenza)
Alti 2 - 16 kHz
(+) | Alti bilanciati - appena 2.7% dalla media
(+) | alti lineari (6.6% delta rispetto alla precedente frequenza)
Nel complesso 100 - 16.000 Hz
(±) | la linearità complessiva del suono è media (19.6% di differenza rispetto alla media
Rispetto alla stessa classe
» 40% di tutti i dispositivi testati in questa classe è stato migliore, 8% simile, 52% peggiore
» Il migliore ha avuto un delta di 7%, medio di 21%, peggiore di 53%
Rispetto a tutti i dispositivi testati
» 49% di tutti i dispositivi testati in questa classe è stato migliore, 7% similare, 44% peggiore
» Il migliore ha avuto un delta di 4%, medio di 24%, peggiore di 134%
| Off / Standby | |
| Idle | |
| Sotto carico |
|
Leggenda:
min: | |
| Lenovo Thinkpad 13-20J1001BUS i3-7100U, HD Graphics 620, , IPS, 1920x1080, 13.3" | Lenovo ThinkPad 13-20GKS01100 6200U, HD Graphics 520, Samsung SSD PM871 MZNLN256HCHP, , 1920x1080, 13.3" | Lenovo ThinkPad E560 20EV000MGE 6100U, HD Graphics 520, Western Digital WD Black Mobile 500GB (WD5000LPLX), TN LED, 1366x768, 15.6" | Dell Latitude 14 3470 6100U, HD Graphics 520, Toshiba MQ01ACF050, TN LED, 1366x768, 14" | HP ProBook 440 G4 Z2Y47ES i3-7100U, HD Graphics 620, Samsung CM871a MZNTY256HDHP, TN, 1920x1080, 14" | Acer Spin 5 SP513-51 6100U, HD Graphics 520, Hynix HFS128G39TND, IPS LED, 1920x1080, 13.3" | |
|---|---|---|---|---|---|---|
| Power Consumption | -1% | -19% | -25% | -20% | -8% | |
| Idle Minimum * (Watt) | 3.5 | 3.1 11% | 5.2 -49% | 5 -43% | 5.7 -63% | 4.1 -17% |
| Idle Average * (Watt) | 5.7 | 5.5 4% | 7.25 -27% | 6.8 -19% | 6.8 -19% | 6.8 -19% |
| Idle Maximum * (Watt) | 6.2 | 6 3% | 7.9 -27% | 8.9 -44% | 7.8 -26% | 7.9 -27% |
| Load Average * (Watt) | 24.1 | 25.8 -7% | 25.1 -4% | 26.2 -9% | 20.2 16% | 20.4 15% |
| Load Maximum * (Watt) | 28.5 | 33.6 -18% | 25.1 12% | 31.8 -12% | 30.6 -7% | 26.8 6% |
* ... Meglio usare valori piccoli
| Lenovo Thinkpad 13-20J1001BUS i3-7100U, HD Graphics 620, 42 Wh | Lenovo ThinkPad 13-20GKS01100 6200U, HD Graphics 520, 42 Wh | Lenovo ThinkPad E560 20EV000MGE 6100U, HD Graphics 520, 48 Wh | Dell Latitude 14 3470 6100U, HD Graphics 520, 41 Wh | HP ProBook 440 G4 Z2Y47ES i3-7100U, HD Graphics 620, 48 Wh | Acer Spin 5 SP513-51 6100U, HD Graphics 520, 45 Wh | |
|---|---|---|---|---|---|---|
| Autonomia della batteria | -8% | 8% | -22% | 22% | -10% | |
| Reader / Idle (h) | 16.5 | 15.7 -5% | 14.8 -10% | 11.1 -33% | 20.2 22% | 12.5 -24% |
| WiFi v1.3 (h) | 9.7 | 6.2 -36% | 9.4 -3% | 4.6 -53% | 7.7 -21% | |
| Load (h) | 1.9 | 2.2 16% | 2.6 37% | 2.3 21% | 2.2 16% | |
| WiFi (h) | 10.1 |
Pro
Contro
Il ThinkPad 13 si piazza bene. Il set di feature ha molto punti sorprendenti rispetto ai più maturi fratelli ThinkPad serie T ed X. La tastiera è tra le migliori a disposizione, l'autonomia è abbastanza buona per una giornata di lavoro, e le prestazioni sono adeguate, o leggermente deludenti. Tuttavia, ci sono alcuni elementi che sono stati eliminati per abbassare il prezzo. La tastiera non è illuminata e manca una porta Thunderbolt 3 il che limita la connettività.
Forse il principale problema qui è il prezzo. Per un sistema che cosa oltre $1000, il nostro ThinkPad 13 offre specifiche poco esaltanti. Anche il modello base del ThinkPad 13 monta una Intel Celeron 3865U (1.8 GHz, 2 MB Cache) e un display TN 1366x768 e costa $700 al momento della recensione. Molti dispositivi con interni migliori sono disponibili a prezzi inferiori. Tuttavia non li inseriamo nel confronto, sia l'Asus Zenbook UX305UA che il Dell XPS 13 (2016) possono essere configurati con doppia RAM e archiviazione oltre a CPU Core i5 ULV per quasi lo stesso prezzo del nostro modello (e qualcosa in meno).
Nel complesso, il ThinkPad 13 è un buon pacchetto per utenti business che vogliono qualcosa che sia tra la serie Lenovo Y da 12.5" e la serie T da 14". L'ampia autonomia e i dispositivi di input eccezionali bilanciano i compromessi che dovrete accettare. Tuttavia il passaggio alla Kaby Lake non vale il prezzo. Suggeriamo di aspettare un calo dei prezzi o cercare un modello 2016 ThinkPad 13 con processore Skylake.
Nota: si tratta di una recensione breve, con alcune sezioni non tradotte, per la versione integrale in inglese guardate qui.
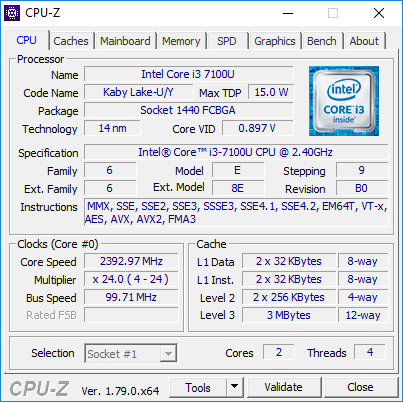
Lenovo Thinkpad 13-20J1001BUS
- 04/28/2017 v6 (old)
Sam Medley
Price comparison
