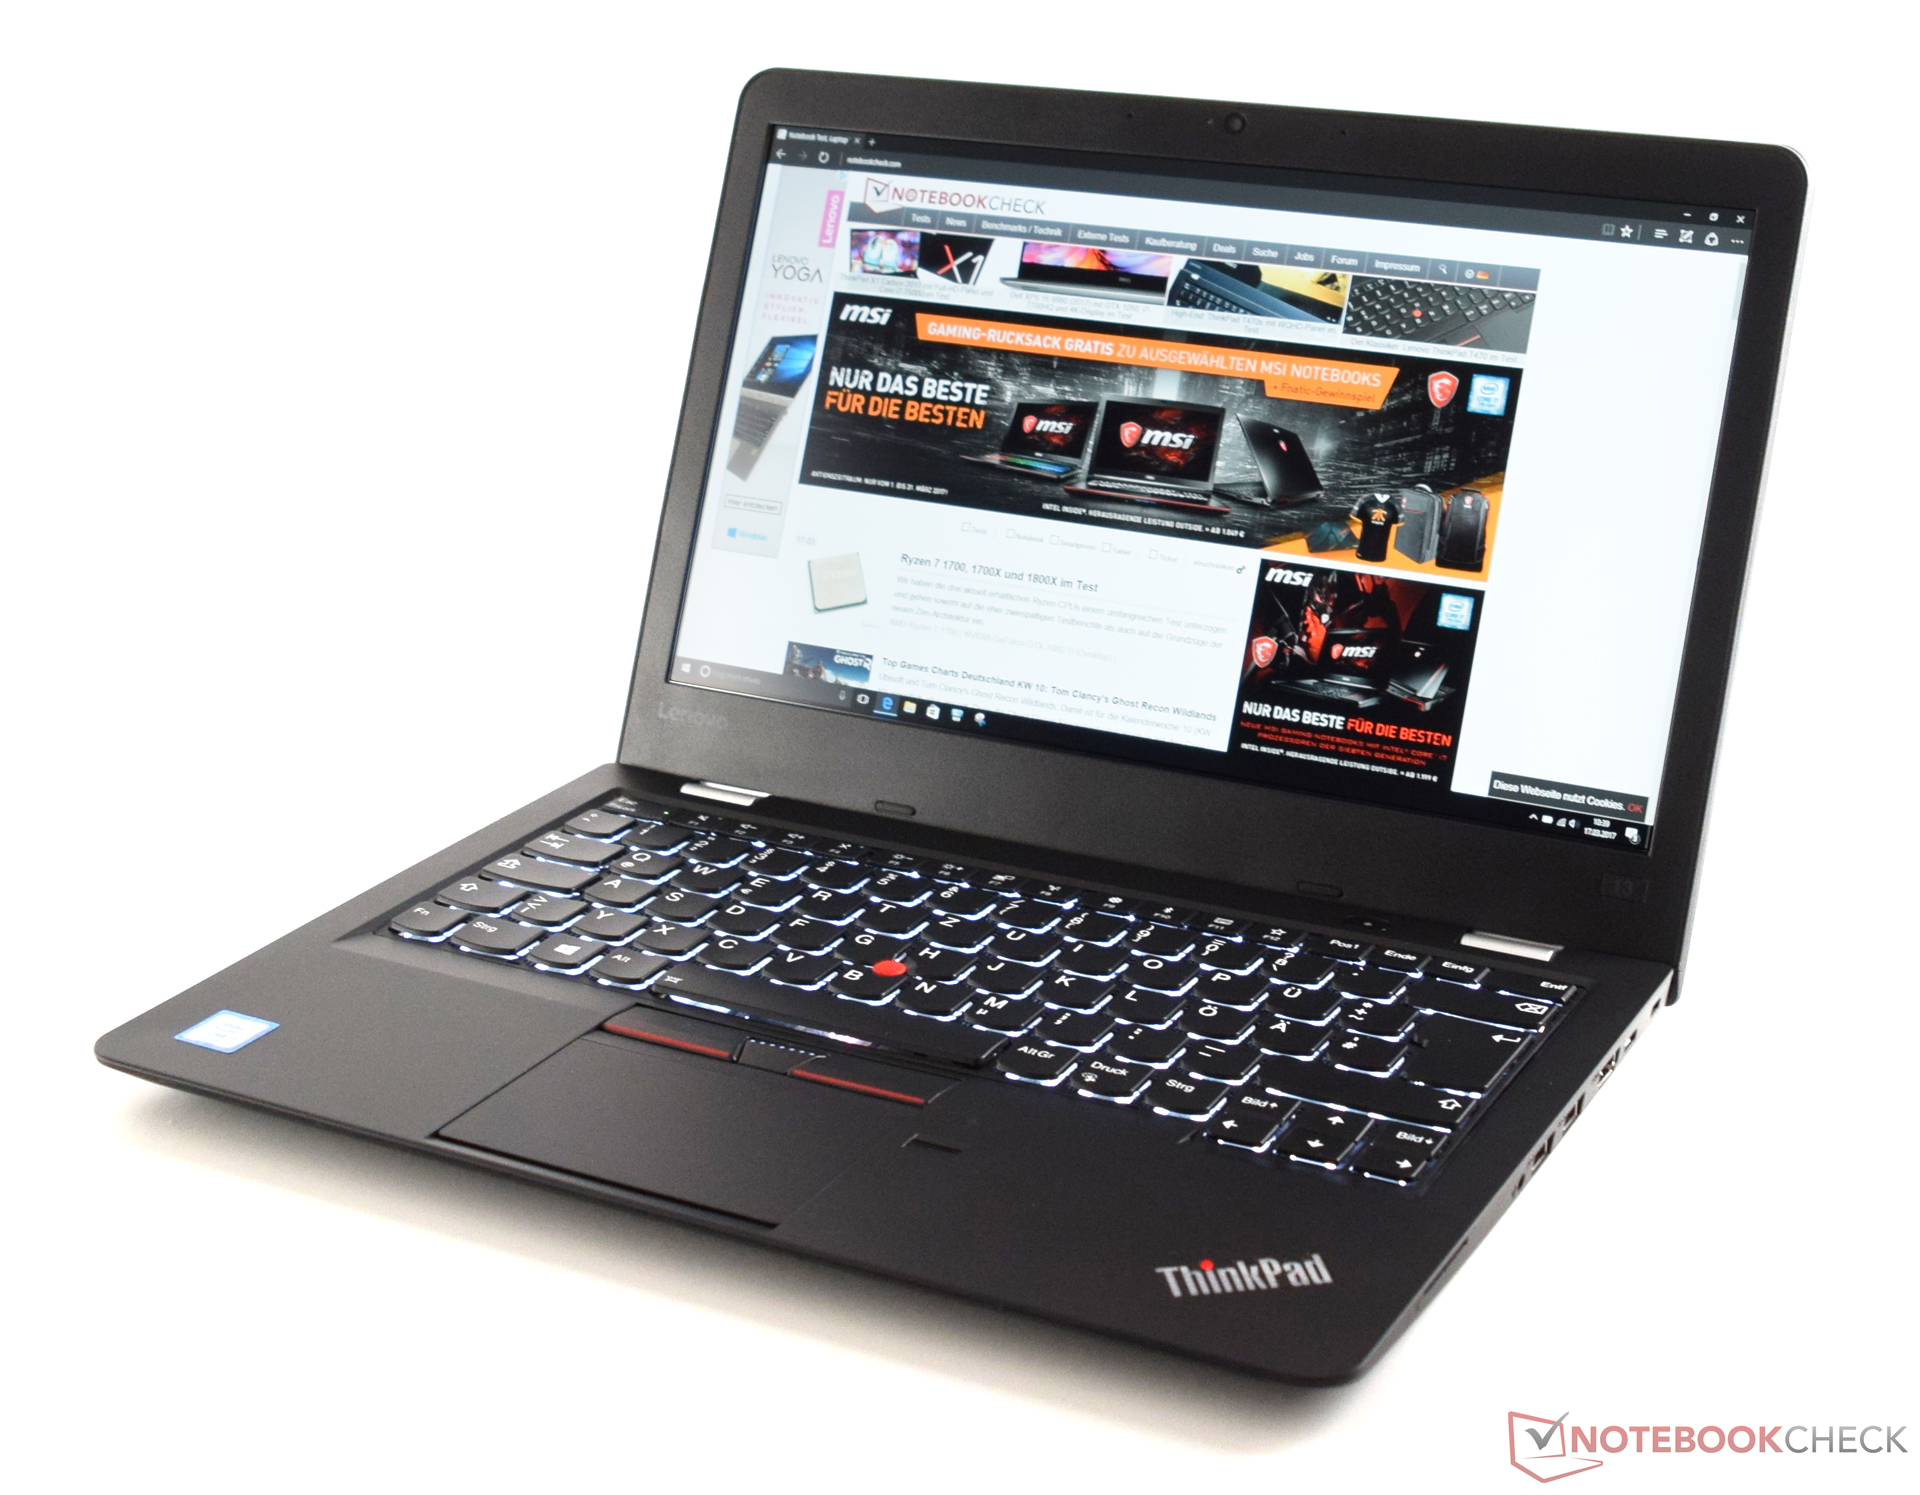
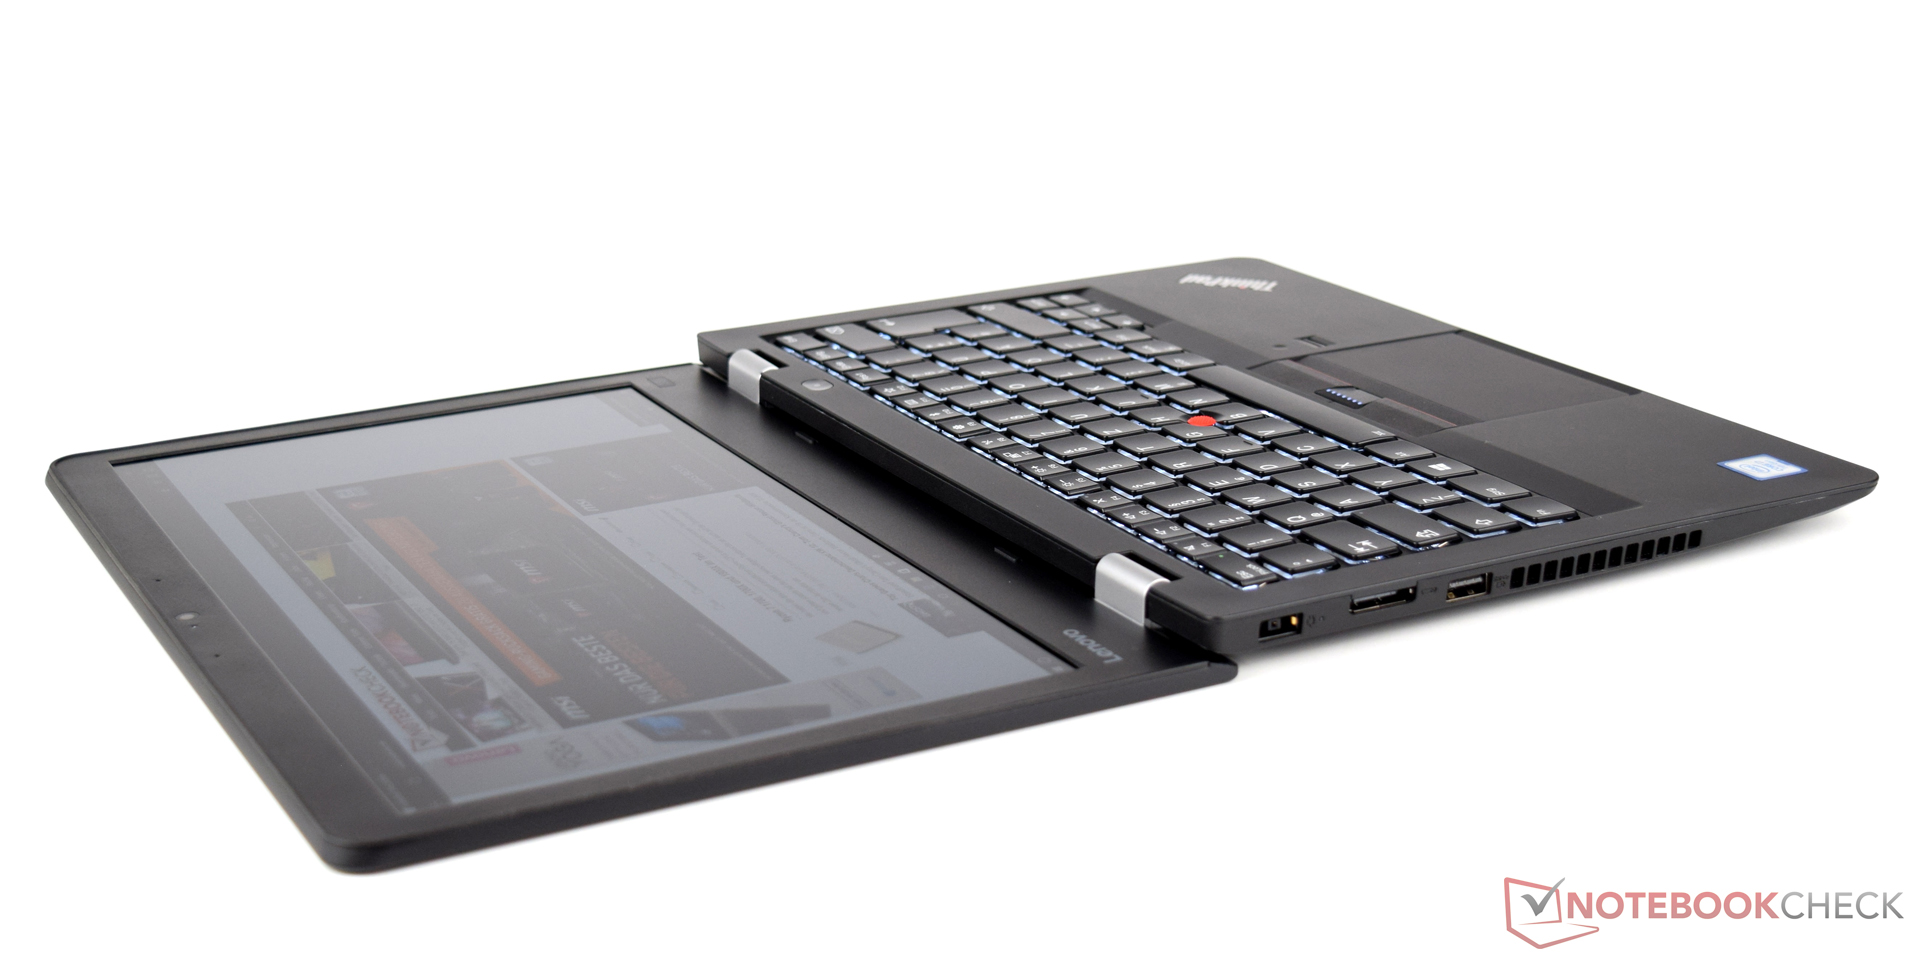
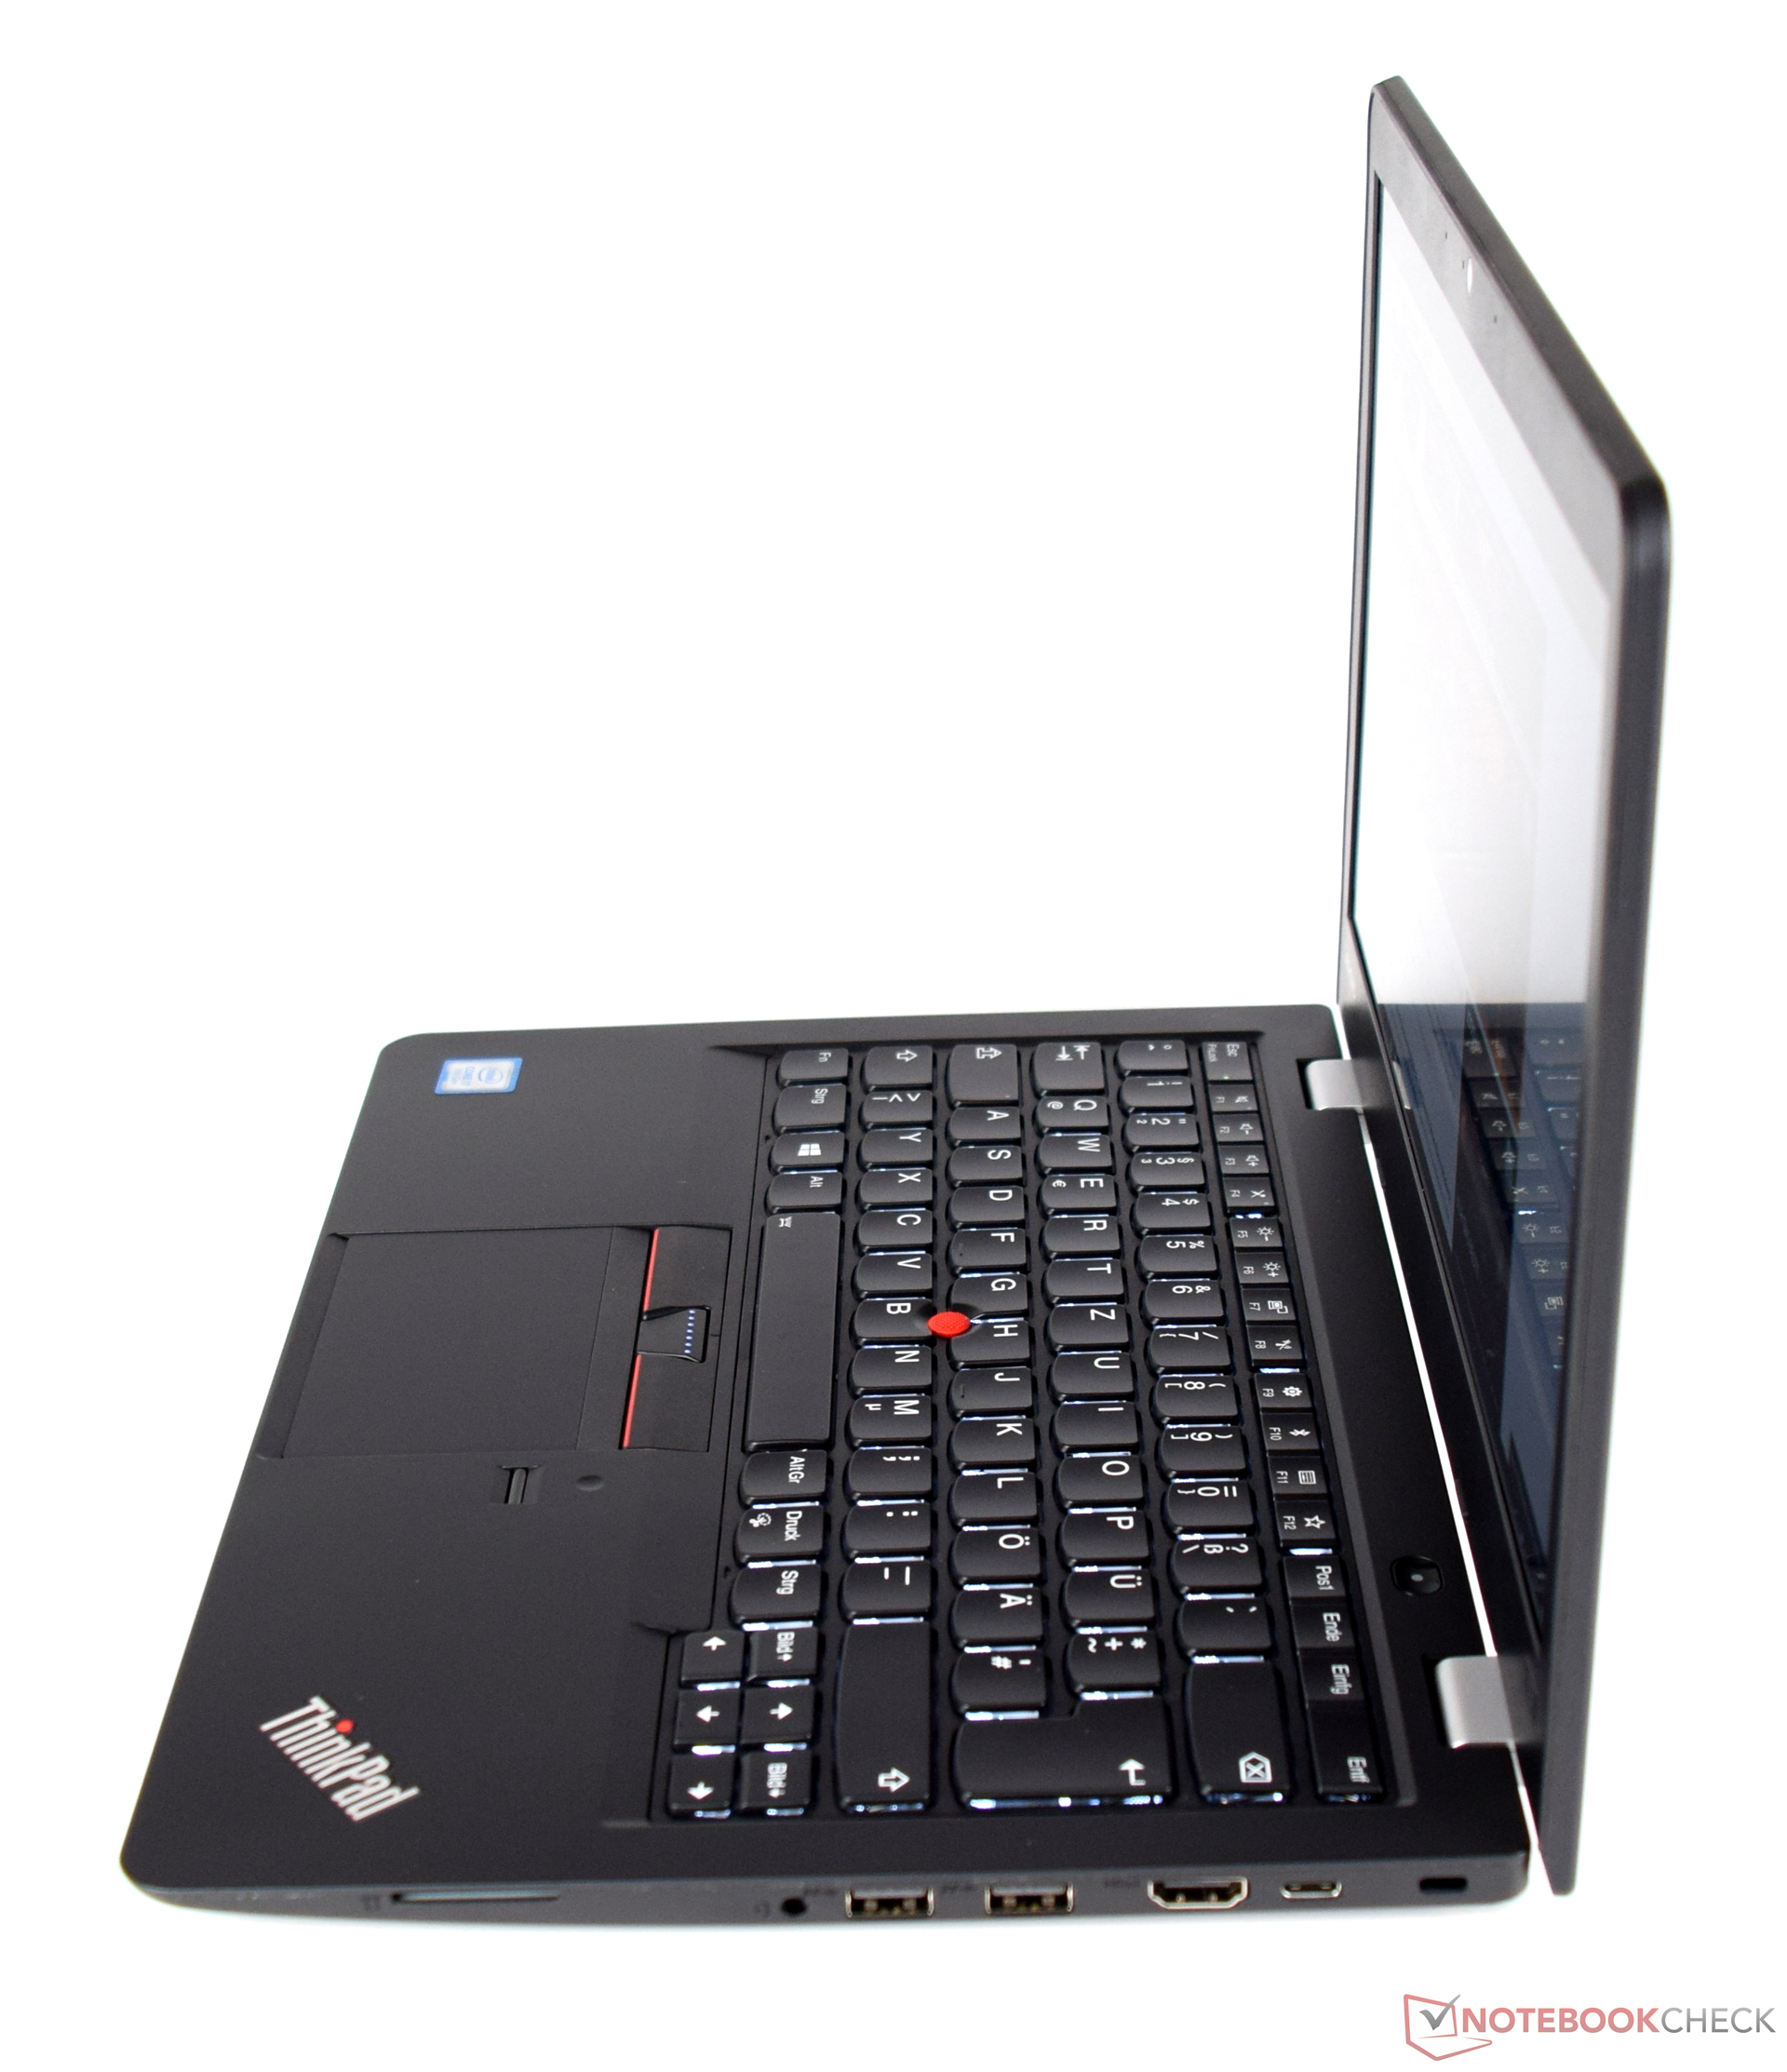
Recensione breve del Portatile Lenovo ThinkPad 13 2017 (Core i7, Full-HD)
| SD Card Reader | |
| average JPG Copy Test (av. of 3 runs) | |
| Dell XPS 13 9360 FHD i5 | |
| HP ProBook 430 G4-Y8B47EA | |
| Asus Zenbook UX310UA-FC347T iGP | |
| Lenovo ThinkPad 13-20GKS01100 | |
| Lenovo ThinkPad 13-20J2S00G00 | |
| maximum AS SSD Seq Read Test (1GB) | |
| Dell XPS 13 9360 FHD i5 | |
| HP ProBook 430 G4-Y8B47EA | |
| Asus Zenbook UX310UA-FC347T iGP | |
| Lenovo ThinkPad 13-20GKS01100 | |
| Lenovo ThinkPad 13-20J2S00G00 | |
| Networking | |
| iperf3 transmit AX12 | |
| Asus Zenbook UX310UA-FC347T iGP (jseb) | |
| Dell XPS 13 9360 FHD i5 | |
| Lenovo ThinkPad 13-20J2S00G00 | |
| iperf3 receive AX12 | |
| Lenovo ThinkPad 13-20J2S00G00 | |
| Dell XPS 13 9360 FHD i5 | |
| Asus Zenbook UX310UA-FC347T iGP (jseb) | |
| |||||||||||||||||||||||||
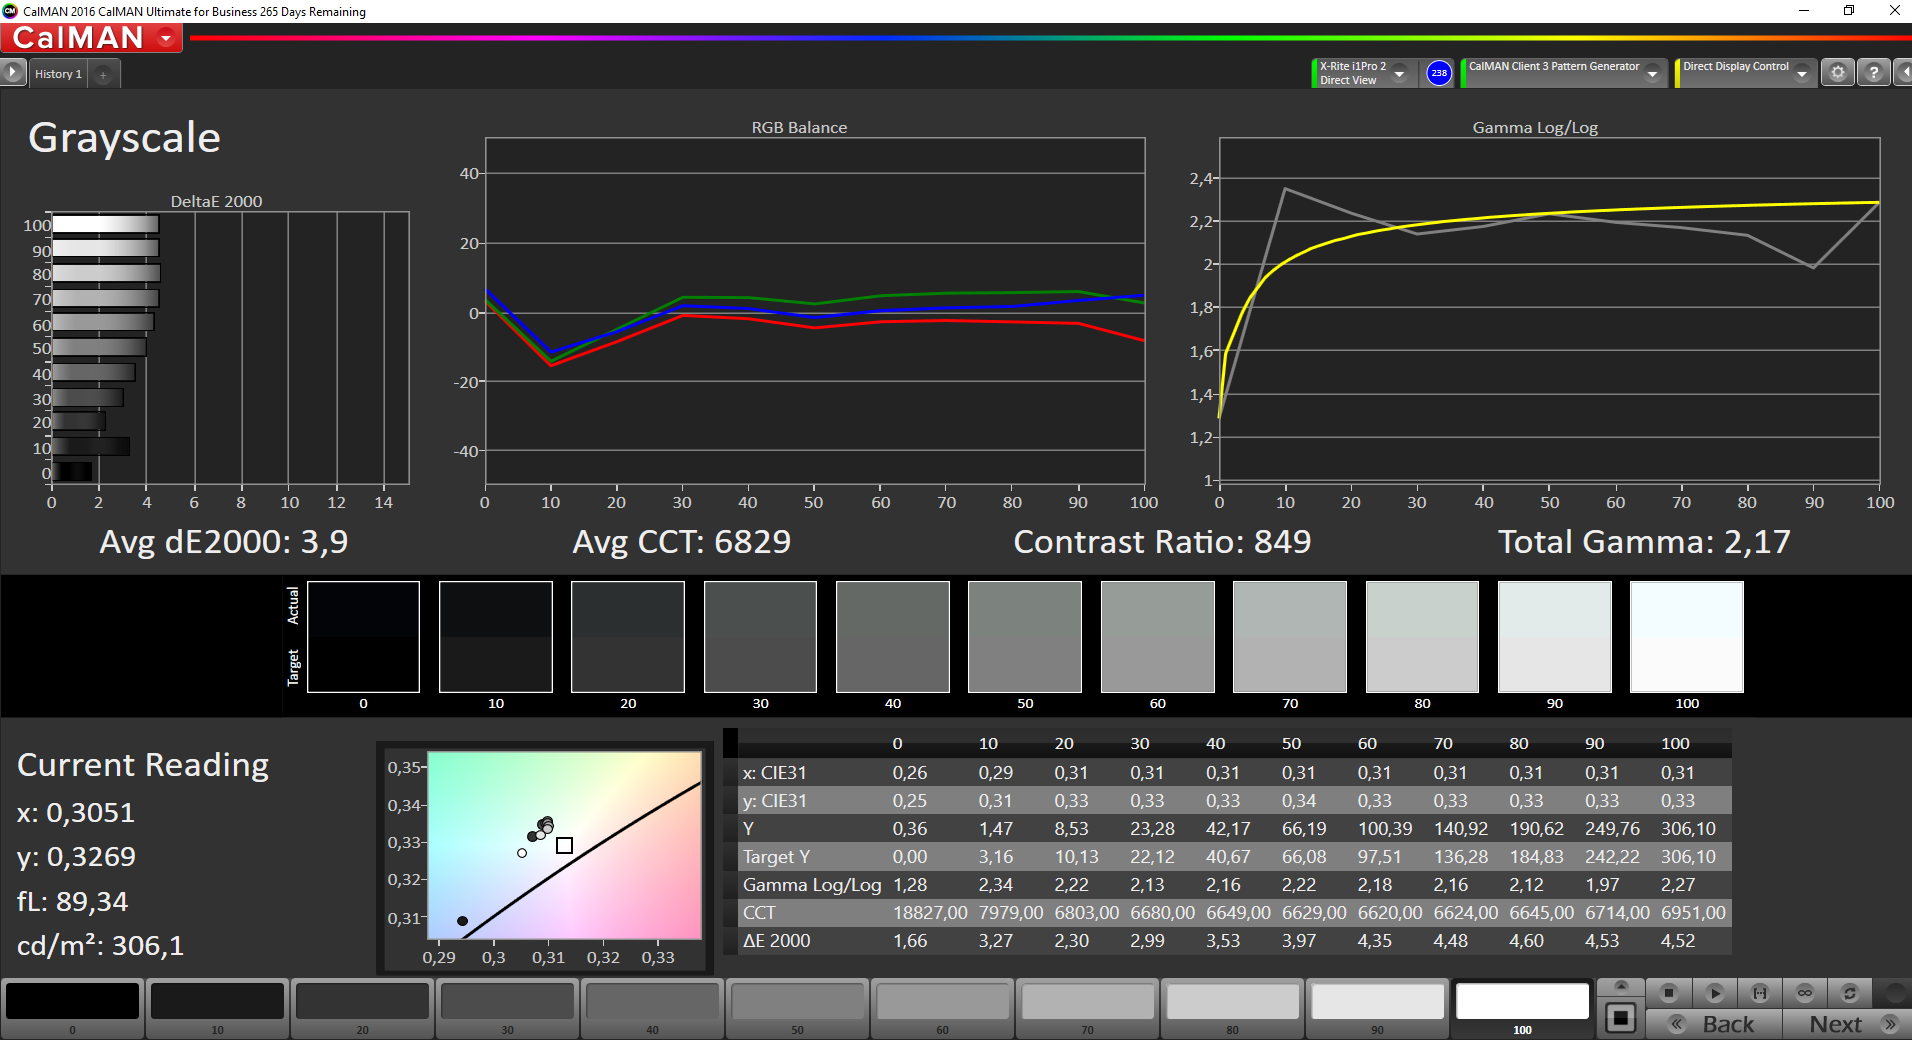
Distribuzione della luminosità: 89 %
Al centro con la batteria: 306 cd/m²
Contrasto: 850:1 (Nero: 0.36 cd/m²)
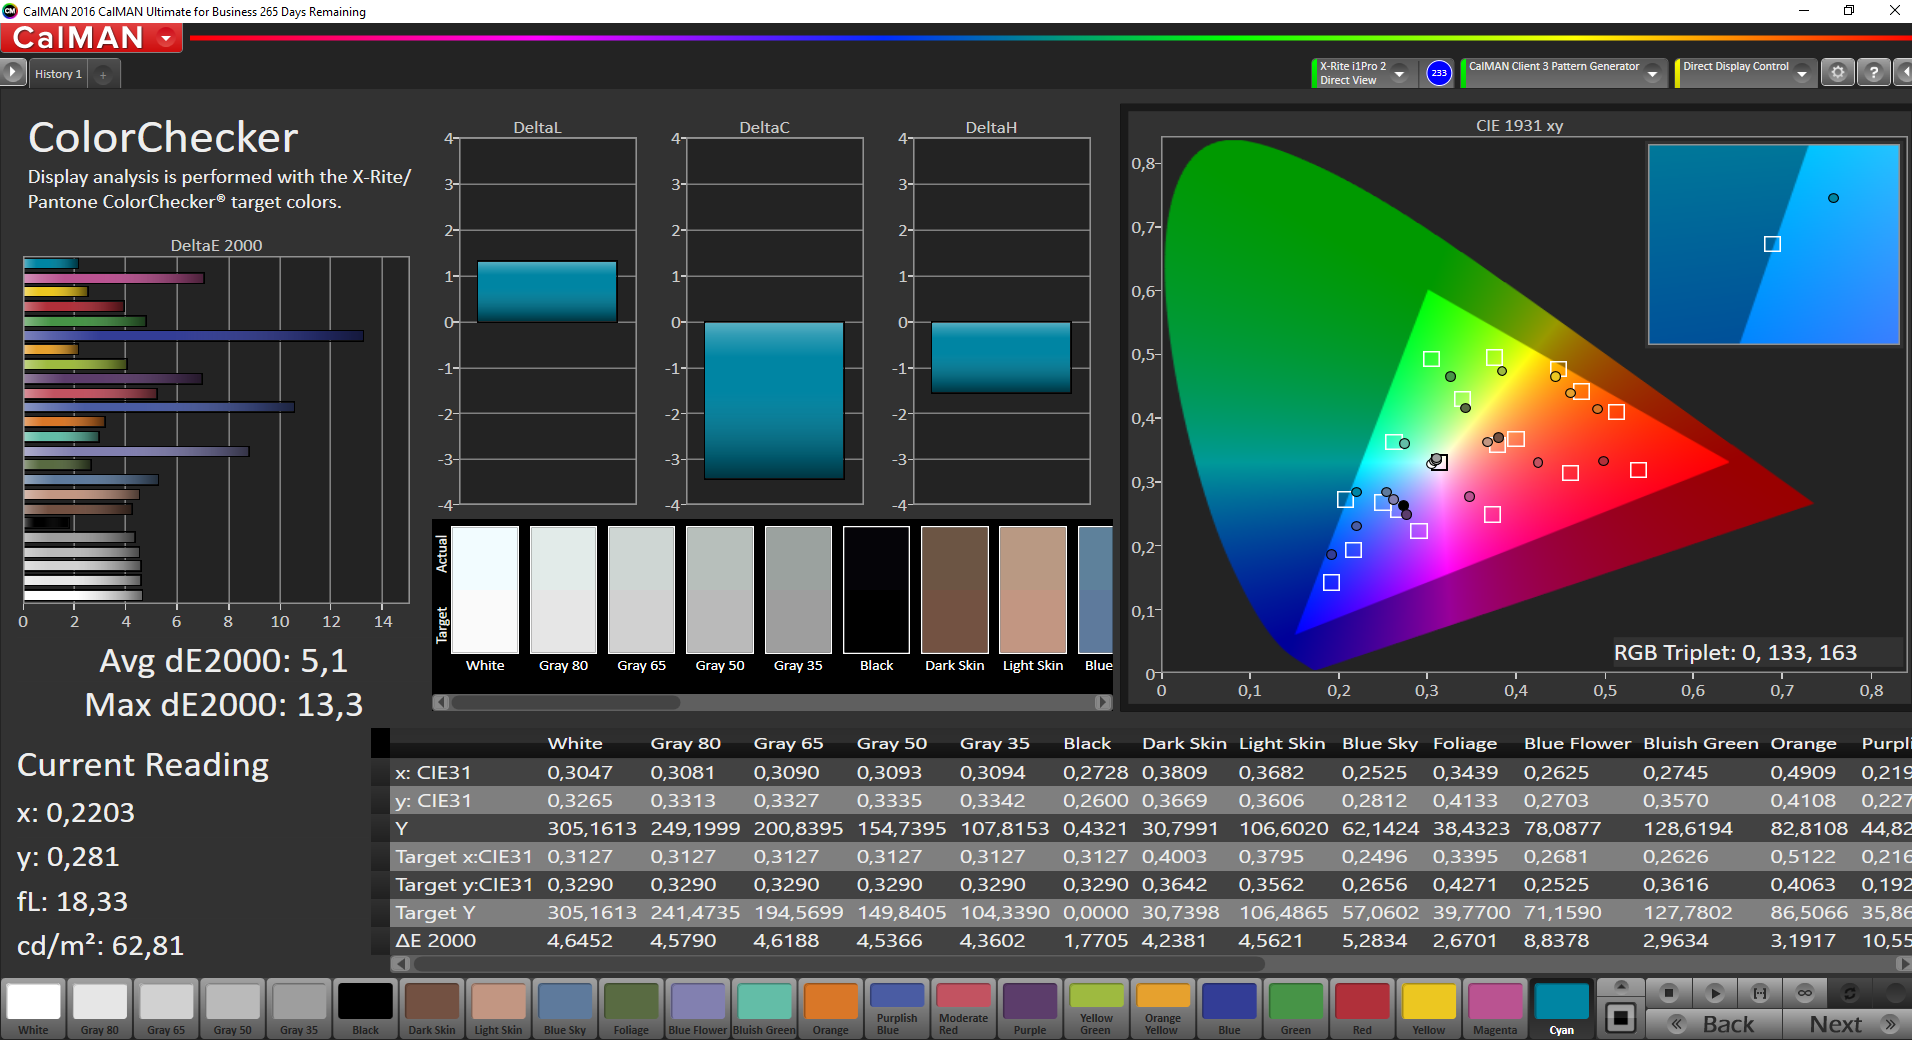
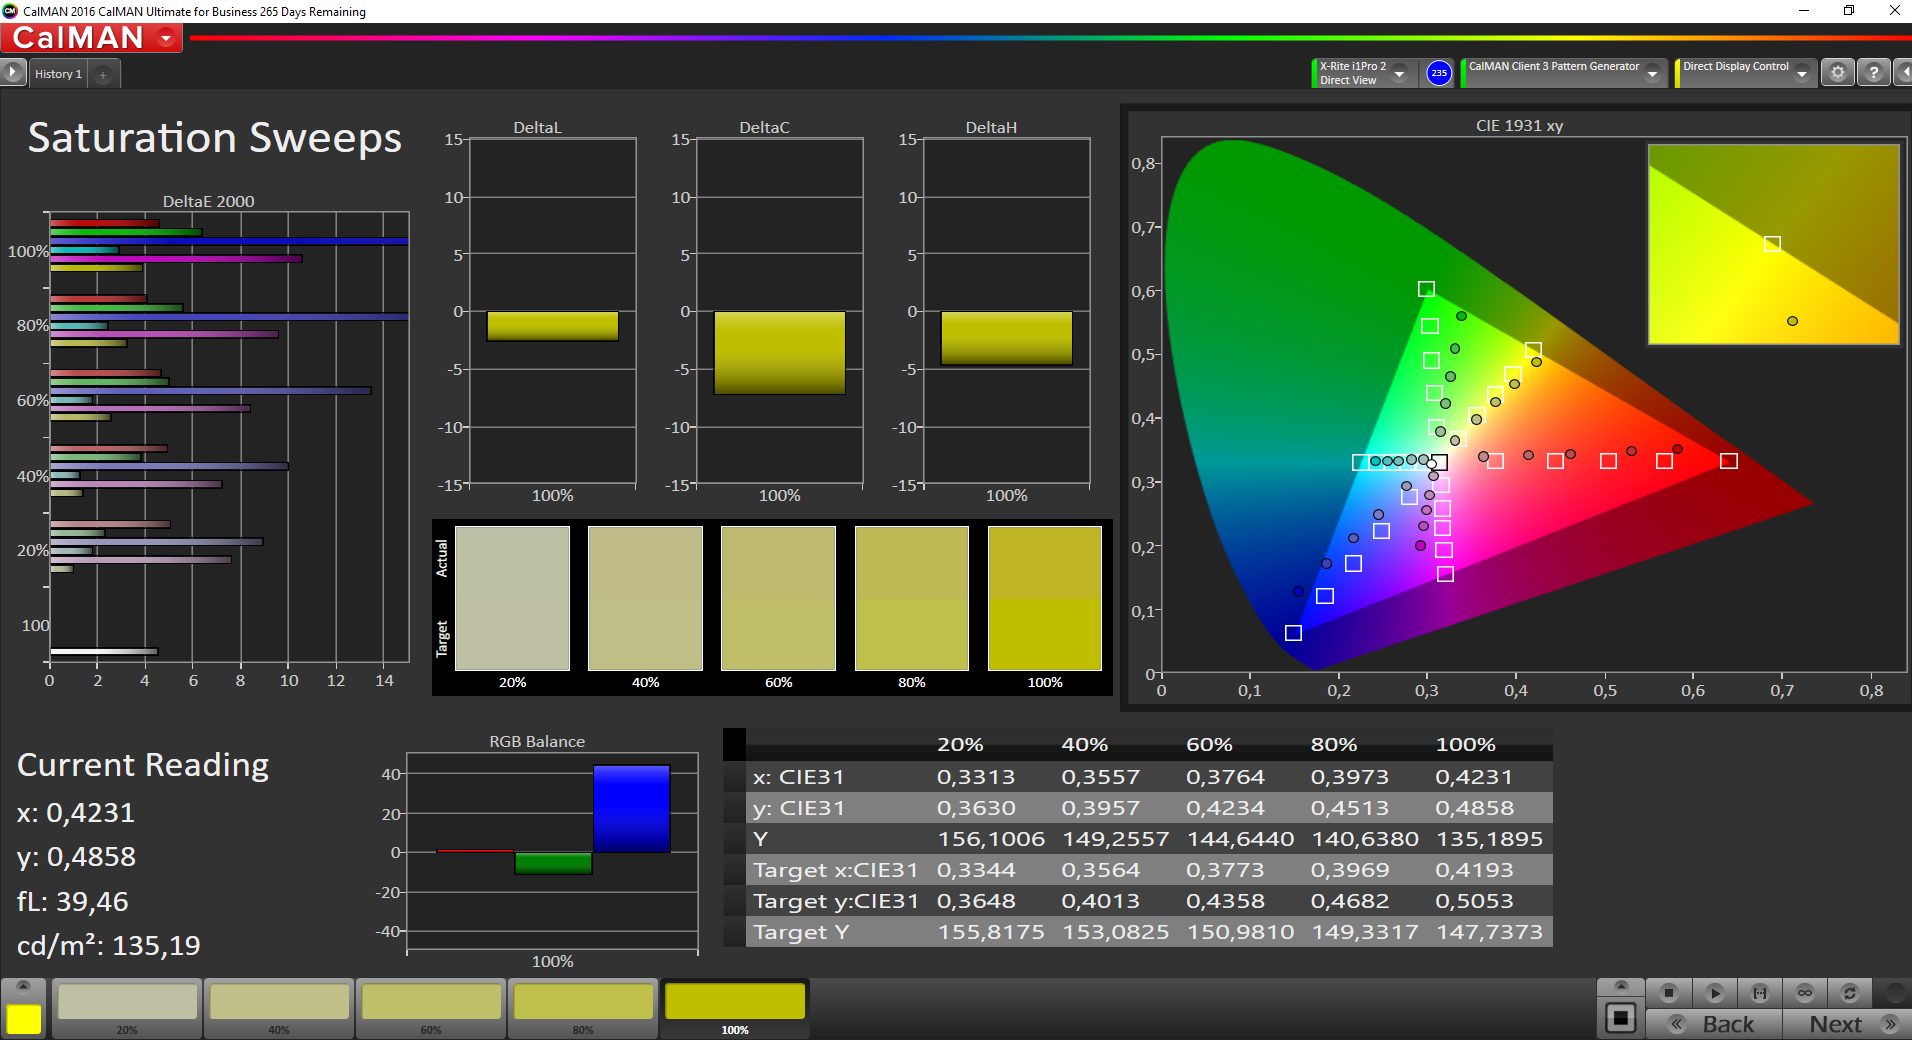
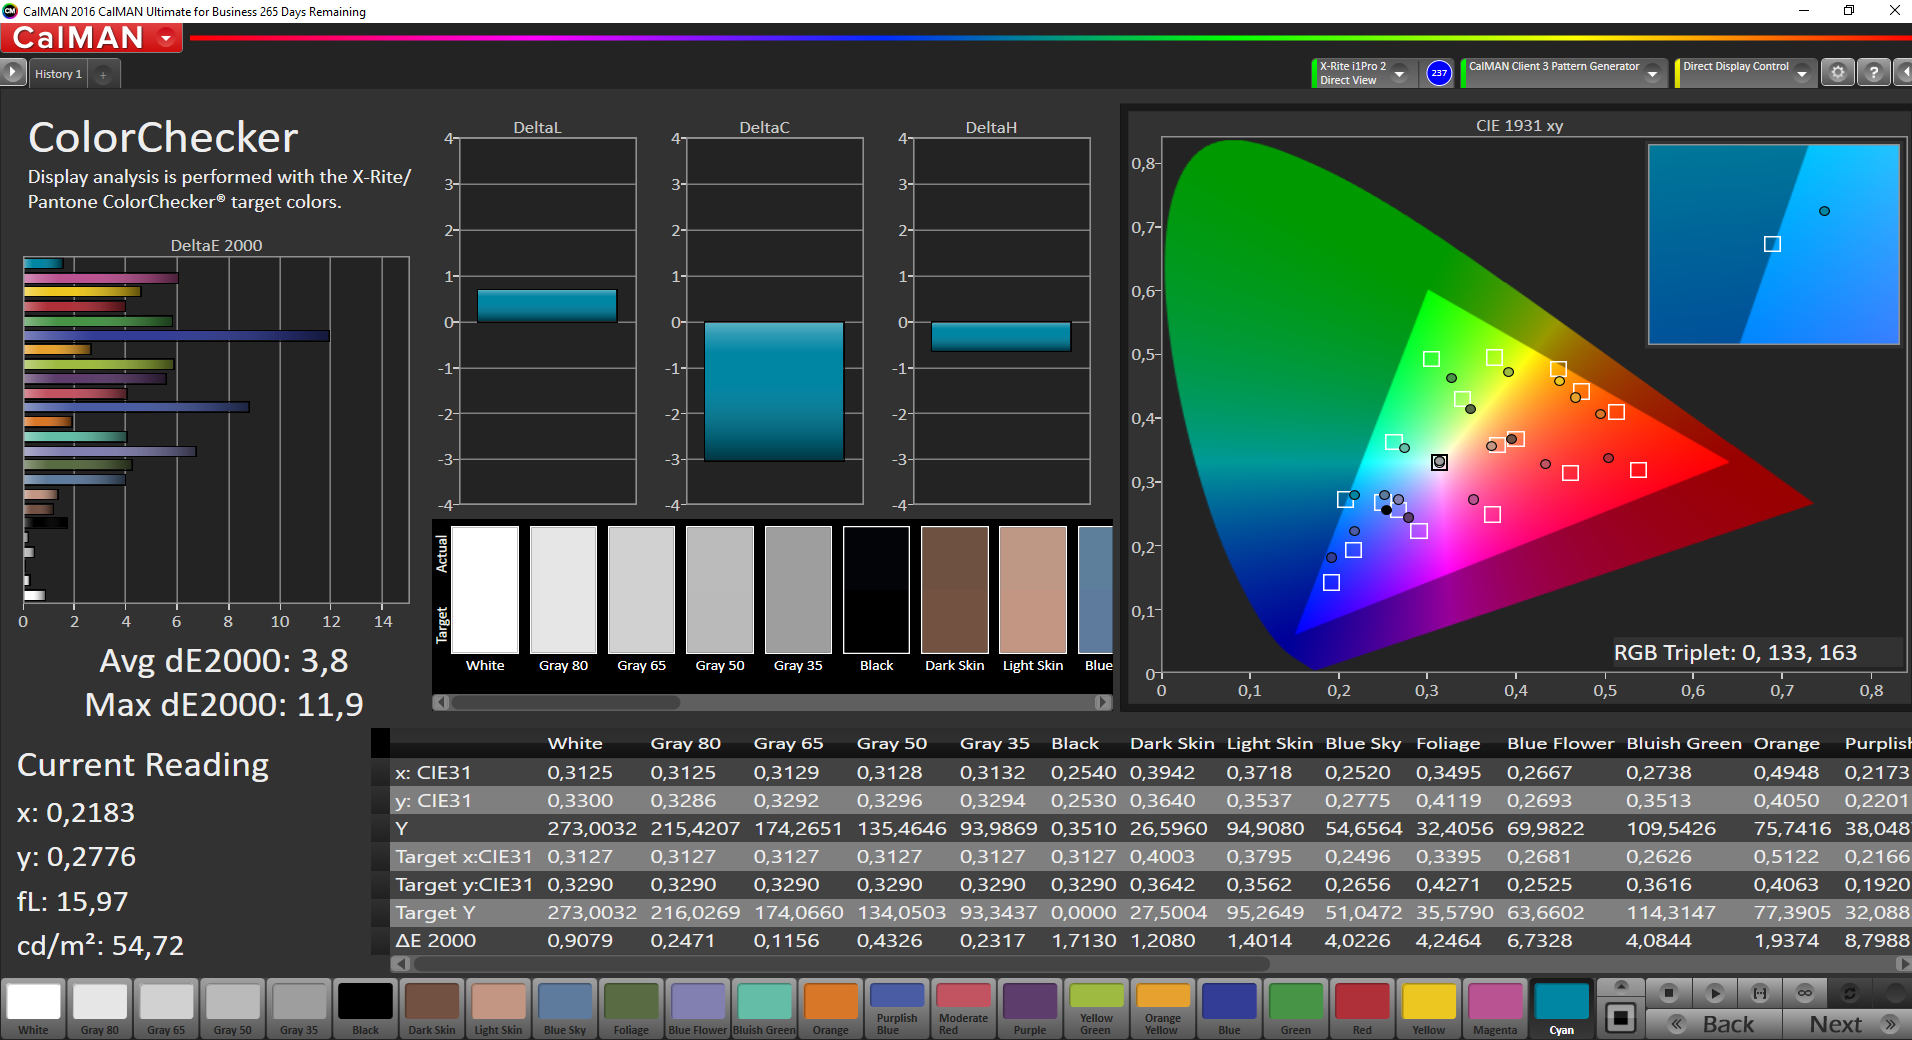
ΔE ColorChecker Calman: 5.1 | ∀{0.5-29.43 Ø4.71}
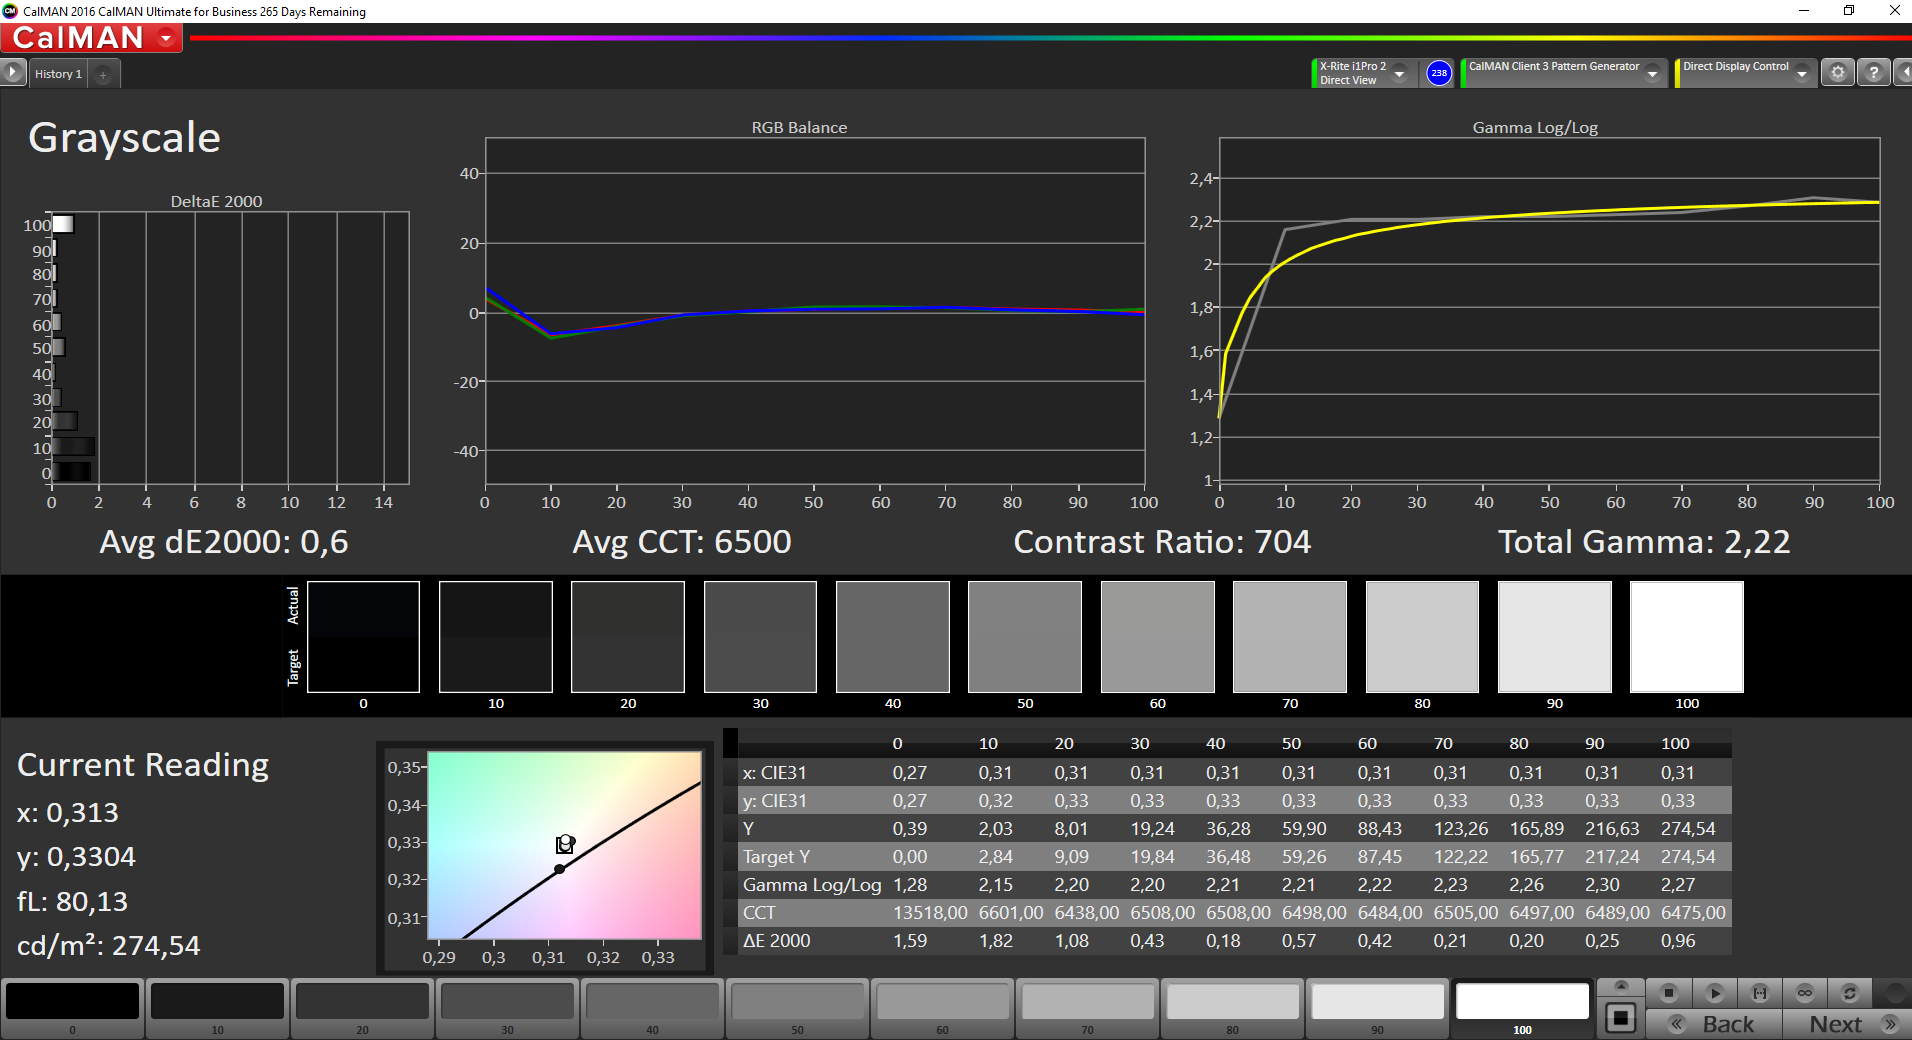
ΔE Greyscale Calman: 3.9 | ∀{0.09-98 Ø4.96}
59.75% sRGB (Argyll 1.6.3 3D)
38.24% AdobeRGB 1998 (Argyll 1.6.3 3D)
41.54% AdobeRGB 1998 (Argyll 3D)
60% sRGB (Argyll 3D)
40.16% Display P3 (Argyll 3D)
Gamma: 2.17
CCT: 6829 K
| Lenovo ThinkPad 13-20J2S00G00 LP133WF2-SPL78, , 1920x1080, 13.3" | Lenovo ThinkPad 13-20GKS01100 LP133WF2-SPL1, , 1920x1080, 13.3" | HP ProBook 430 G4-Y8B47EA LGD052D, , 1920x1080, 13.3" | Asus Zenbook UX310UA-FC347T iGP AU Optronics AUO272D, , 1920x1080, 13.3" | Dell XPS 13 9360 FHD i5 Sharp SHP1449 LQ133M1, , 1920x1080, 13.3" | |
|---|---|---|---|---|---|
| Display | -5% | -4% | 42% | 22% | |
| Display P3 Coverage (%) | 40.16 | 38.35 -5% | 38.55 -4% | 64.2 60% | 48.94 22% |
| sRGB Coverage (%) | 60 | 57.4 -4% | 57.8 -4% | 65.3 9% | 73.3 22% |
| AdobeRGB 1998 Coverage (%) | 41.54 | 39.66 -5% | 39.85 -4% | 65.3 57% | 50.5 22% |
| Response Times | -3% | -1% | 11% | -4% | |
| Response Time Grey 50% / Grey 80% * (ms) | 43.6 ? | 43.2 ? 1% | 42.4 ? 3% | 40 ? 8% | 32.8 ? 25% |
| Response Time Black / White * (ms) | 25.2 ? | 26.8 ? -6% | 26.4 ? -5% | 22 ? 13% | 33.2 ? -32% |
| PWM Frequency (Hz) | 30860 ? | 200 ? | |||
| Screen | -1% | -4% | 18% | 15% | |
| Brightness middle (cd/m²) | 306 | 233 -24% | 253 -17% | 358 17% | 351.2 15% |
| Brightness (cd/m²) | 307 | 227 -26% | 249 -19% | 347 13% | 325 6% |
| Brightness Distribution (%) | 89 | 86 -3% | 92 3% | 87 -2% | 89 0% |
| Black Level * (cd/m²) | 0.36 | 0.22 39% | 0.32 11% | 0.26 28% | 0.195 46% |
| Contrast (:1) | 850 | 1059 25% | 791 -7% | 1377 62% | 1801 112% |
| Colorchecker dE 2000 * | 5.1 | 5.41 -6% | 5.28 -4% | 5.22 -2% | 7.4 -45% |
| Colorchecker dE 2000 max. * | 13.3 | 13.61 -2% | 13.66 -3% | 9.19 31% | 9.08 32% |
| Greyscale dE 2000 * | 3.9 | 4.15 -6% | 3.8 3% | 6.69 -72% | 6.71 -72% |
| Gamma | 2.17 101% | 2.45 90% | 2.3 96% | 2.35 94% | 2.74 80% |
| CCT | 6829 95% | 6773 96% | 6646 98% | 6745 96% | 7222 90% |
| Color Space (Percent of AdobeRGB 1998) (%) | 38.24 | 36.52 -4% | 36.7 -4% | 59 54% | 50.48 32% |
| Color Space (Percent of sRGB) (%) | 59.75 | 57.16 -4% | 57.6 -4% | 91 52% | 73.31 23% |
| Media totale (Programma / Settaggio) | -3% /
-2% | -3% /
-4% | 24% /
22% | 11% /
14% |
* ... Meglio usare valori piccoli

Tempi di risposta del Display
| ↔ Tempi di risposta dal Nero al Bianco | ||
|---|---|---|
| 25.2 ms ... aumenta ↗ e diminuisce ↘ combinato | ↗ 12.8 ms Incremento | 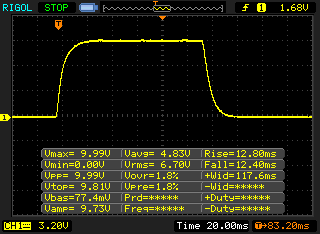 |
| ↘ 12.4 ms Calo | ||
| Lo schermo mostra tempi di risposta relativamente lenti nei nostri tests e potrebbe essere troppo lento per i gamers. In confronto, tutti i dispositivi di test variano da 0.1 (minimo) a 240 (massimo) ms. » 61 % di tutti i dispositivi è migliore. Questo significa che i tempi di risposta rilevati sono peggiori rispetto alla media di tutti i dispositivi testati (19.8 ms). | ||
| ↔ Tempo di risposta dal 50% Grigio all'80% Grigio | ||
| 43.6 ms ... aumenta ↗ e diminuisce ↘ combinato | ↗ 20.8 ms Incremento | 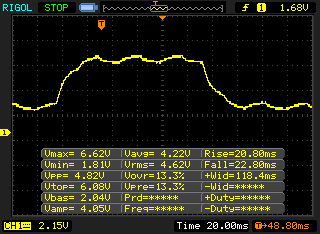 |
| ↘ 22.8 ms Calo | ||
| Lo schermo mostra tempi di risposta lenti nei nostri tests e sarà insoddisfacente per i gamers. In confronto, tutti i dispositivi di test variano da 0.165 (minimo) a 636 (massimo) ms. » 73 % di tutti i dispositivi è migliore. Questo significa che i tempi di risposta rilevati sono peggiori rispetto alla media di tutti i dispositivi testati (31 ms). | ||
Sfarfallio dello schermo / PWM (Pulse-Width Modulation)
| flickering dello schermo / PWM rilevato | 30860 Hz | ≤ 90 % settaggio luminosita' | 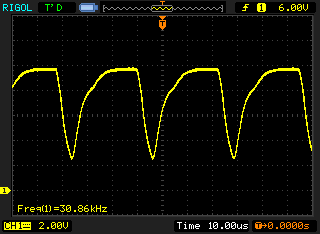 |
Il display sfarfalla a 30860 Hz (Probabilmente a causa dell'uso di PWM) Flickering rilevato ad una luminosita' di 90 % o inferiore. Non dovrebbe verificarsi flickering o PWM sopra questo valore di luminosita'. La frequenza di 30860 Hz è abbastanza alta, quindi la maggioranza degli utenti sensibili al PWM non dovrebbero notare alcun flickering. In confronto: 52 % di tutti i dispositivi testati non utilizza PWM per ridurre la luminosita' del display. Se è rilevato PWM, una media di 7757 (minimo: 5 - massimo: 343500) Hz è stata rilevata. | |||
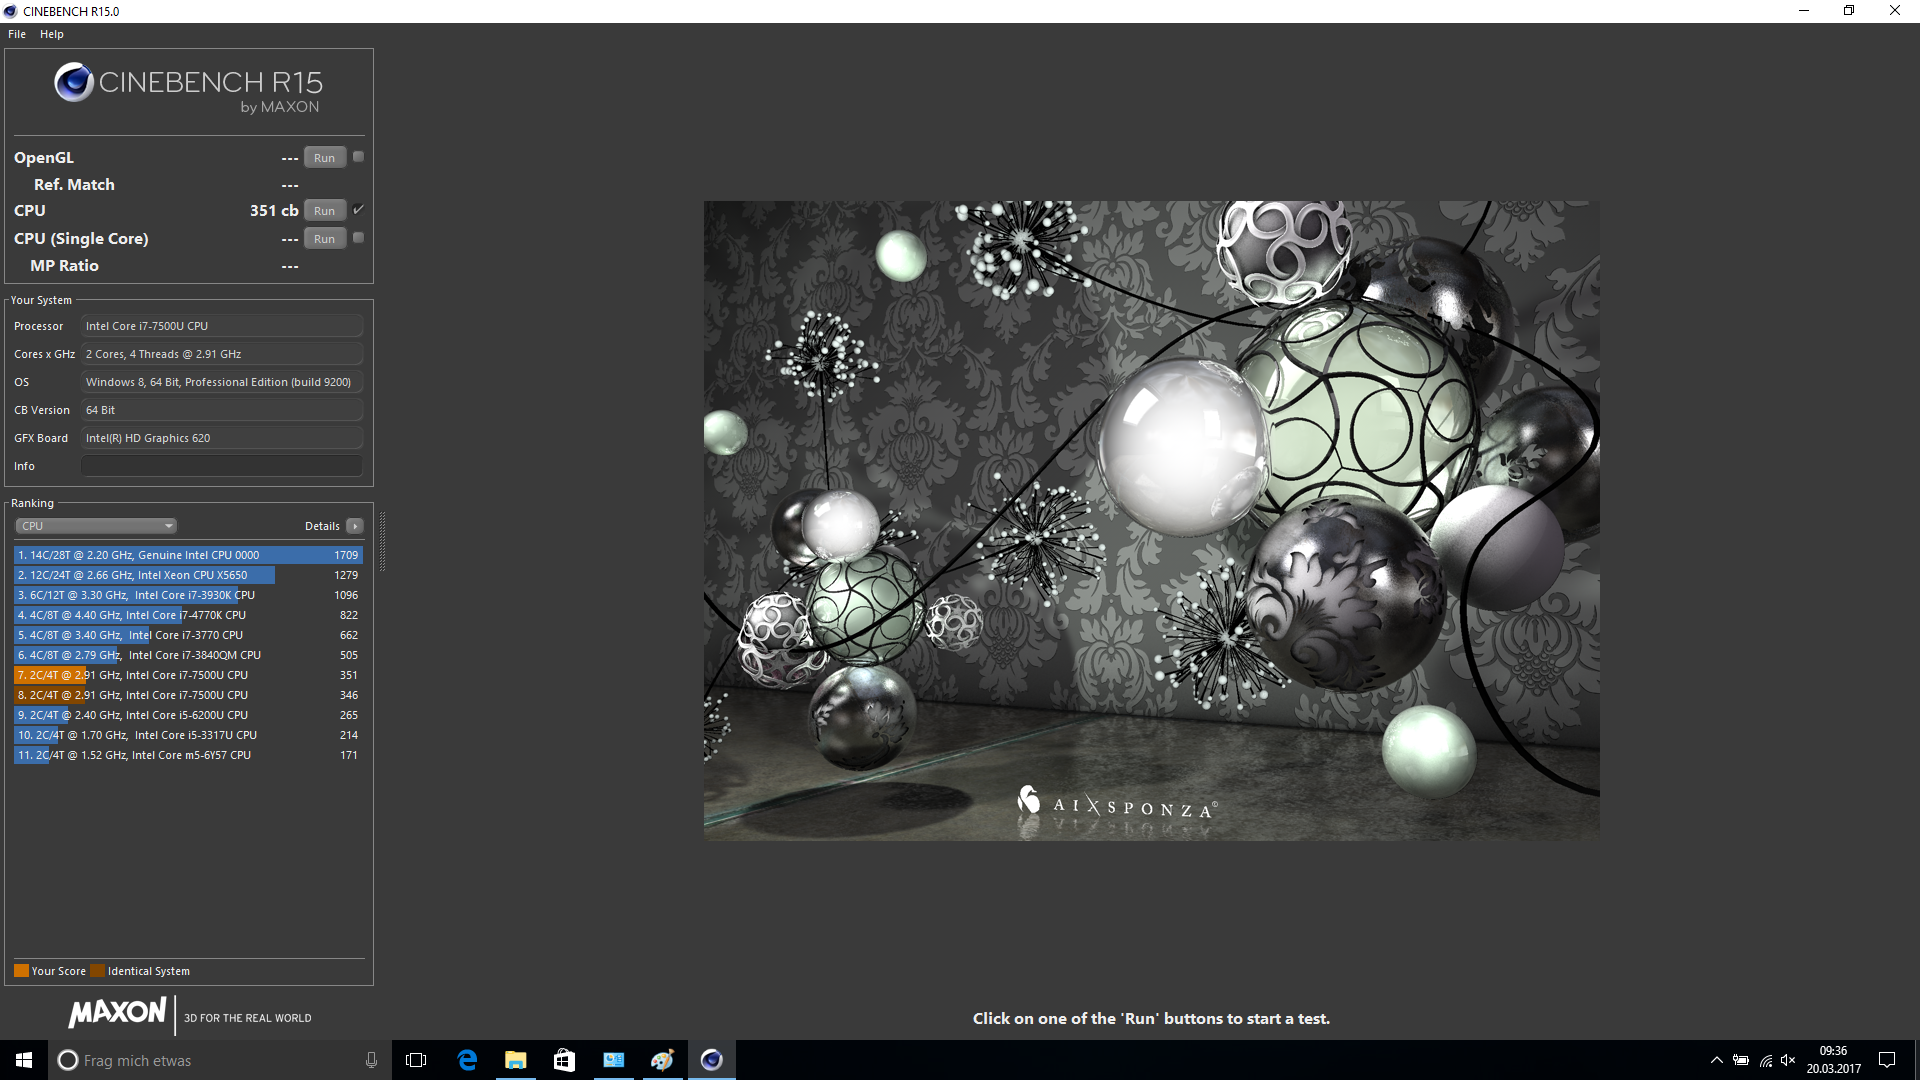
| Cinebench R11.5 | |
| CPU Single 64Bit | |
| Lenovo ThinkPad 13-20J2S00G00 | |
| Asus Zenbook UX310UA-FC347T iGP | |
| Dell XPS 13 9360 FHD i5 | |
| CPU Multi 64Bit | |
| Lenovo ThinkPad 13-20J2S00G00 | |
| Asus Zenbook UX310UA-FC347T iGP | |
| Dell XPS 13 9360 FHD i5 | |
| Cinebench R10 | |
| Rendering Single CPUs 64Bit | |
| Asus Zenbook UX310UA-FC347T iGP | |
| Lenovo ThinkPad 13-20J2S00G00 | |
| Rendering Multiple CPUs 64Bit | |
| Asus Zenbook UX310UA-FC347T iGP | |
| Lenovo ThinkPad 13-20J2S00G00 | |
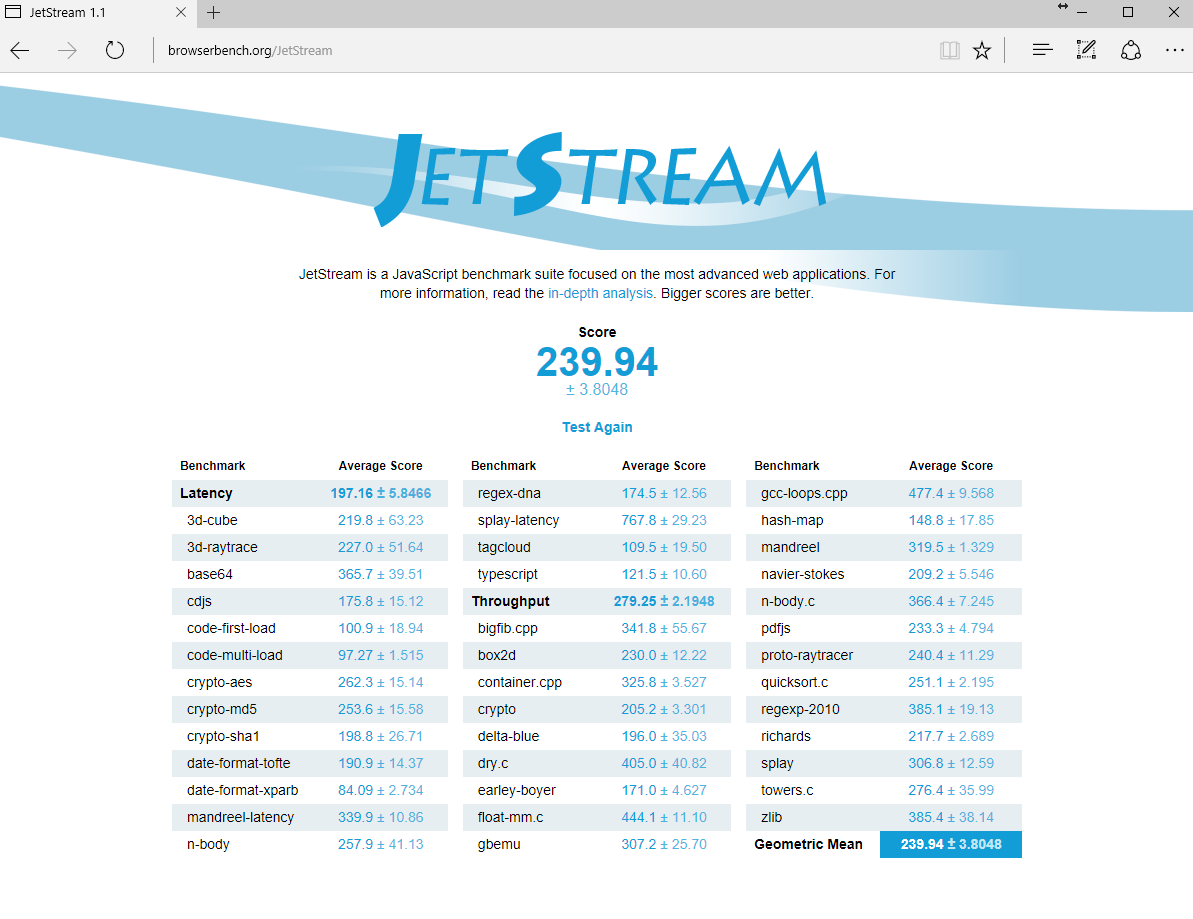
| JetStream 1.1 - 1.1 Total | |
| Lenovo ThinkPad 13-20J2S00G00 | |
| Asus Zenbook UX310UA-FC347T iGP | |
| HP ProBook 430 G4-Y8B47EA | |
| Lenovo ThinkPad 13-20GKS01100 | |
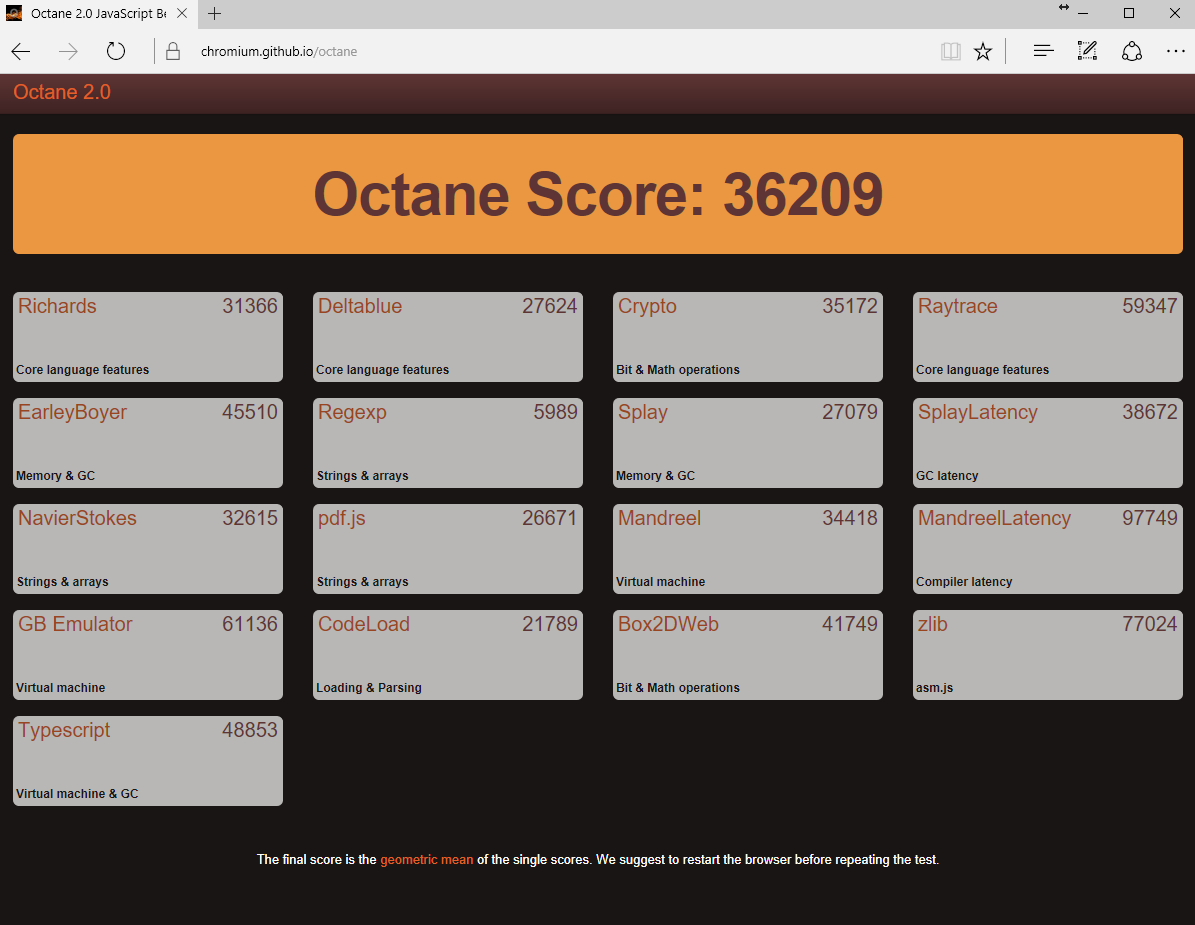
| Octane V2 - Total Score | |
| Lenovo ThinkPad 13-20J2S00G00 | |
| HP ProBook 430 G4-Y8B47EA | |
| Asus Zenbook UX310UA-FC347T iGP | |
| Dell XPS 13 9360 FHD i5 | |
| Lenovo ThinkPad 13-20GKS01100 | |
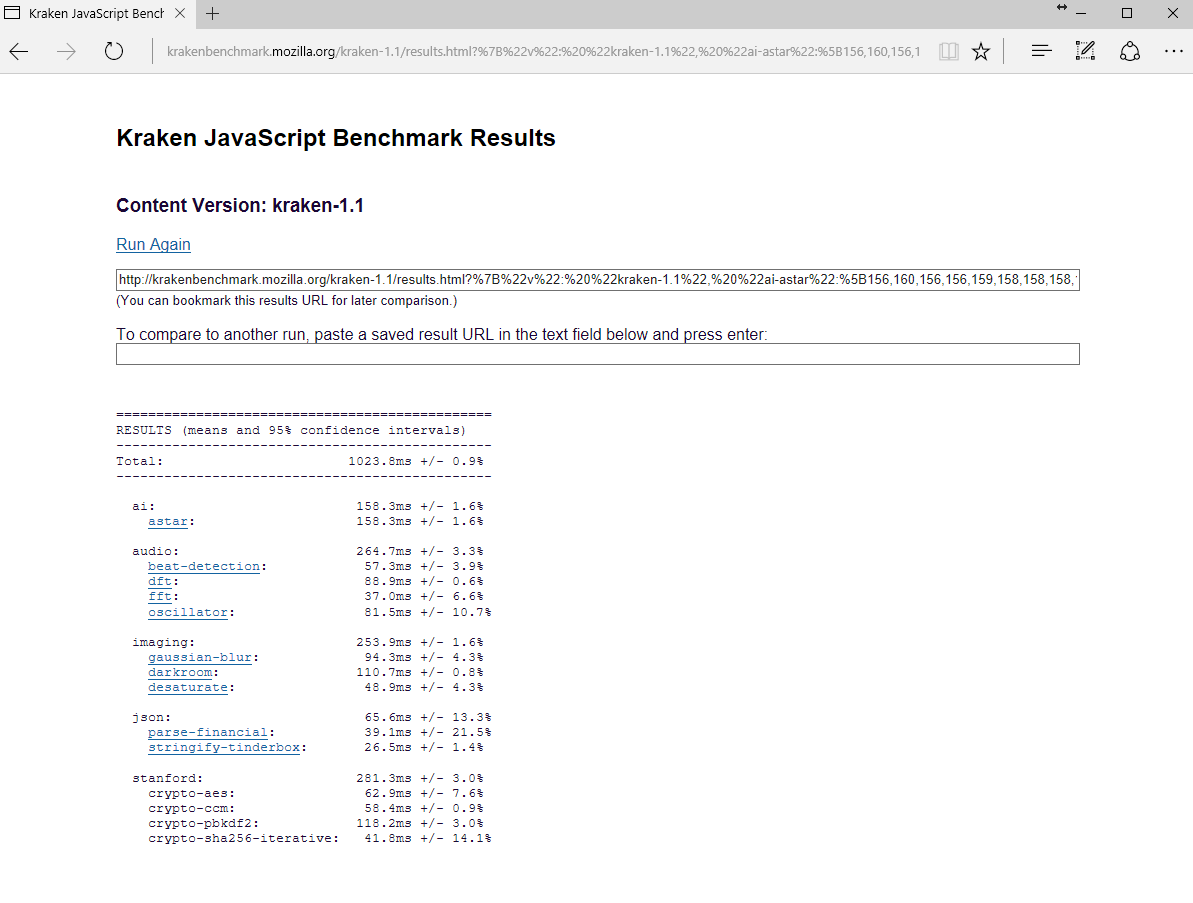
| Mozilla Kraken 1.1 - Total | |
| Lenovo ThinkPad 13-20GKS01100 | |
| Asus Zenbook UX310UA-FC347T iGP | |
| Lenovo ThinkPad 13-20J2S00G00 | |
| HP ProBook 430 G4-Y8B47EA | |
* ... Meglio usare valori piccoli
| PCMark 7 - Score | |
| Asus Zenbook UX310UA-FC347T iGP | |
| HP ProBook 430 G4-Y8B47EA | |
| Lenovo ThinkPad 13-20J2S00G00 | |
| PCMark Vantage Result | 16210 punti | |
| PCMark 7 Score | 5189 punti | |
| PCMark 8 Home Score Accelerated v2 | 3705 punti | |
| PCMark 8 Creative Score Accelerated v2 | 4583 punti | |
| PCMark 8 Work Score Accelerated v2 | 4838 punti | |
Aiuto | ||
| Lenovo ThinkPad 13-20J2S00G00 Toshiba NVMe THNSF5512GPUK | Lenovo ThinkPad 13-20GKS01100 Samsung SSD PM871 MZNLN256HCHP | HP ProBook 430 G4-Y8B47EA SanDisk SD8SNAT256G1002 | Asus Zenbook UX310UA-FC347T iGP Micron SSD 1100 (MTFDDAV256TBN) | Dell XPS 13 9360 FHD i5 Toshiba NVMe THNSN5256GPUK | |
|---|---|---|---|---|---|
| CrystalDiskMark 3.0 | -41% | -49% | -39% | -3% | |
| Read Seq (MB/s) | 1143 | 461.7 -60% | 505 -56% | 489.4 -57% | 1233 8% |
| Write Seq (MB/s) | 653 | 297.8 -54% | 328.9 -50% | 431.6 -34% | 733 12% |
| Read 512 (MB/s) | 629 | 351.6 -44% | 313.6 -50% | 356.7 -43% | 1036 65% |
| Write 512 (MB/s) | 518 | 298.4 -42% | 301 -42% | 389.1 -25% | 439.9 -15% |
| Read 4k (MB/s) | 31.96 | 31.85 0% | 21.69 -32% | 26.68 -17% | 29.31 -8% |
| Write 4k (MB/s) | 138.5 | 68.5 -51% | 80.4 -42% | 88.7 -36% | 116.9 -16% |
| Read 4k QD32 (MB/s) | 578 | 360.9 -38% | 132.2 -77% | 246.3 -57% | 479.2 -17% |
| Write 4k QD32 (MB/s) | 443.1 | 276.2 -38% | 258.8 -42% | 251.5 -43% | 218.3 -51% |

| 3DMark 11 - 1280x720 Performance GPU | |
| Asus Zenbook UX310UA-FC347T iGP | |
| Dell XPS 13 9360 FHD i5 | |
| Lenovo ThinkPad 13-20J2S00G00 | |
| HP ProBook 430 G4-Y8B47EA | |
| Lenovo ThinkPad 13-20GKS01100 | |
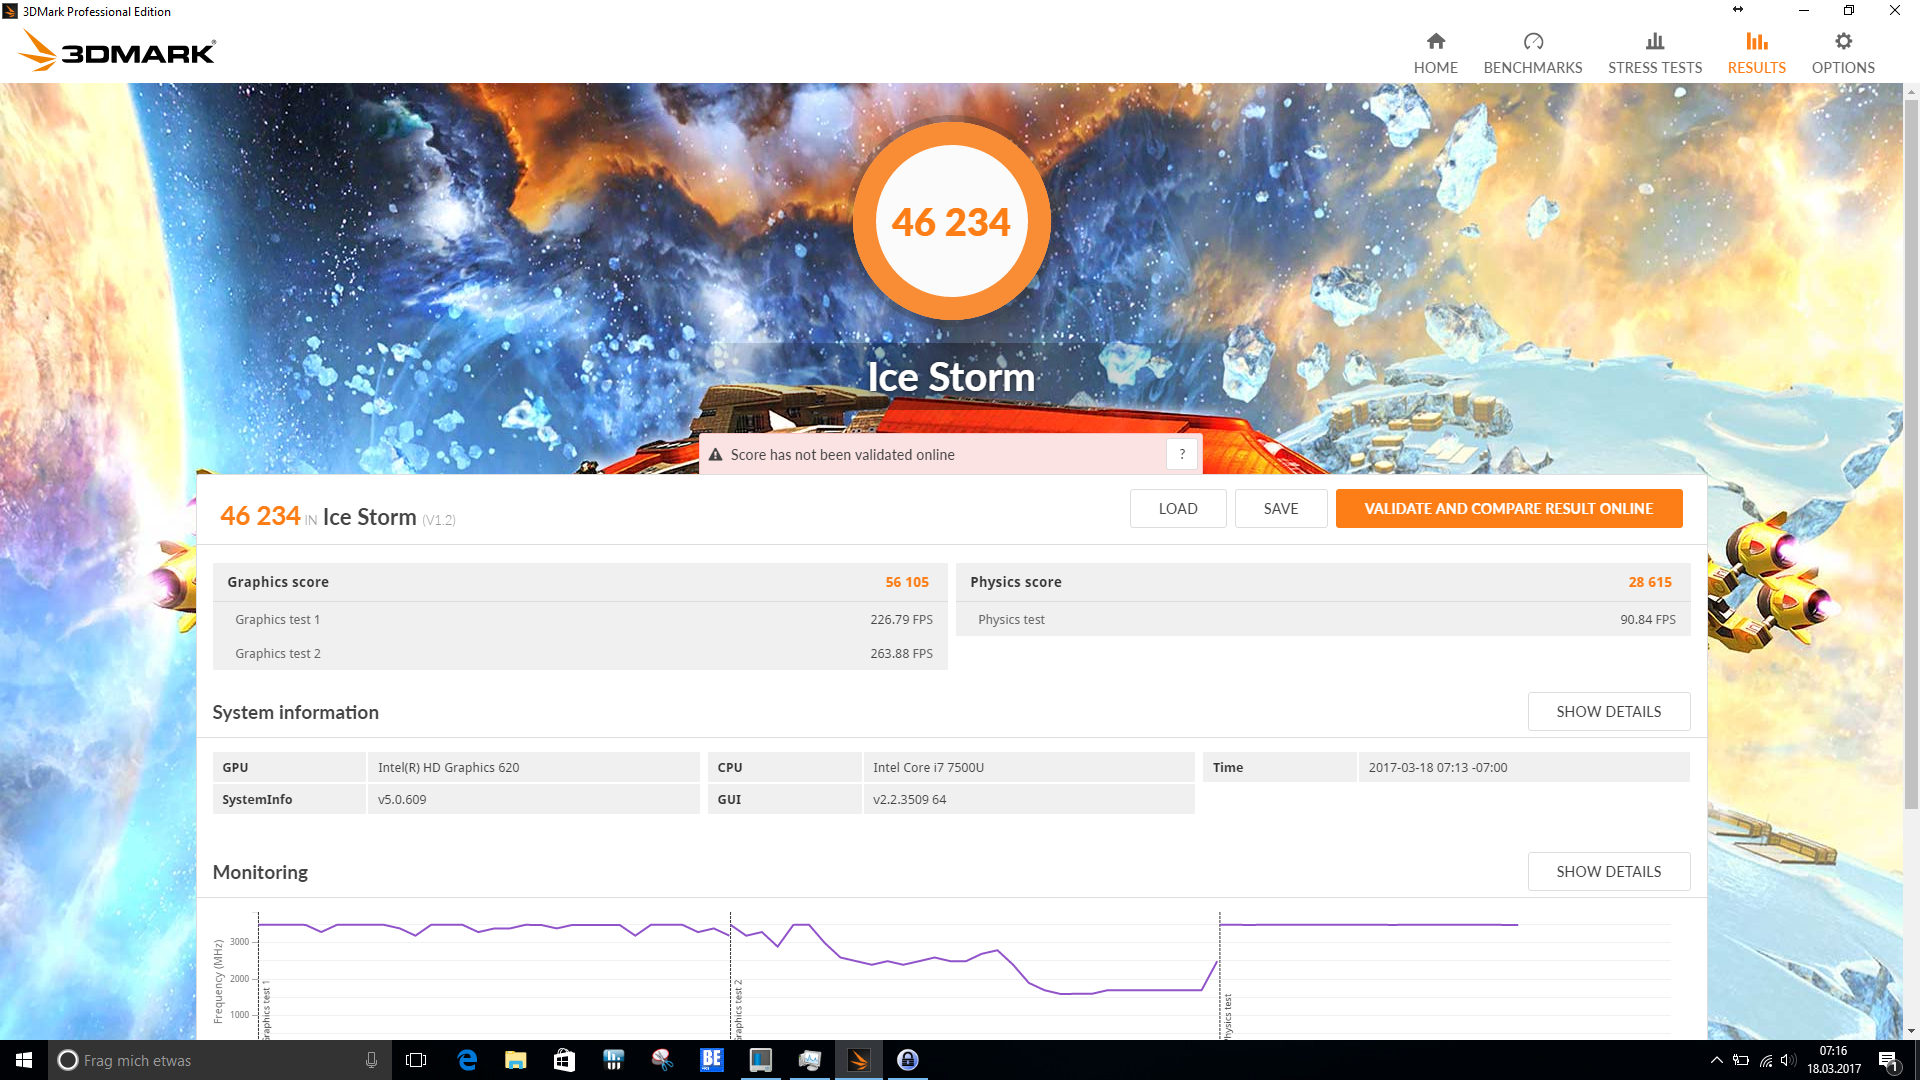
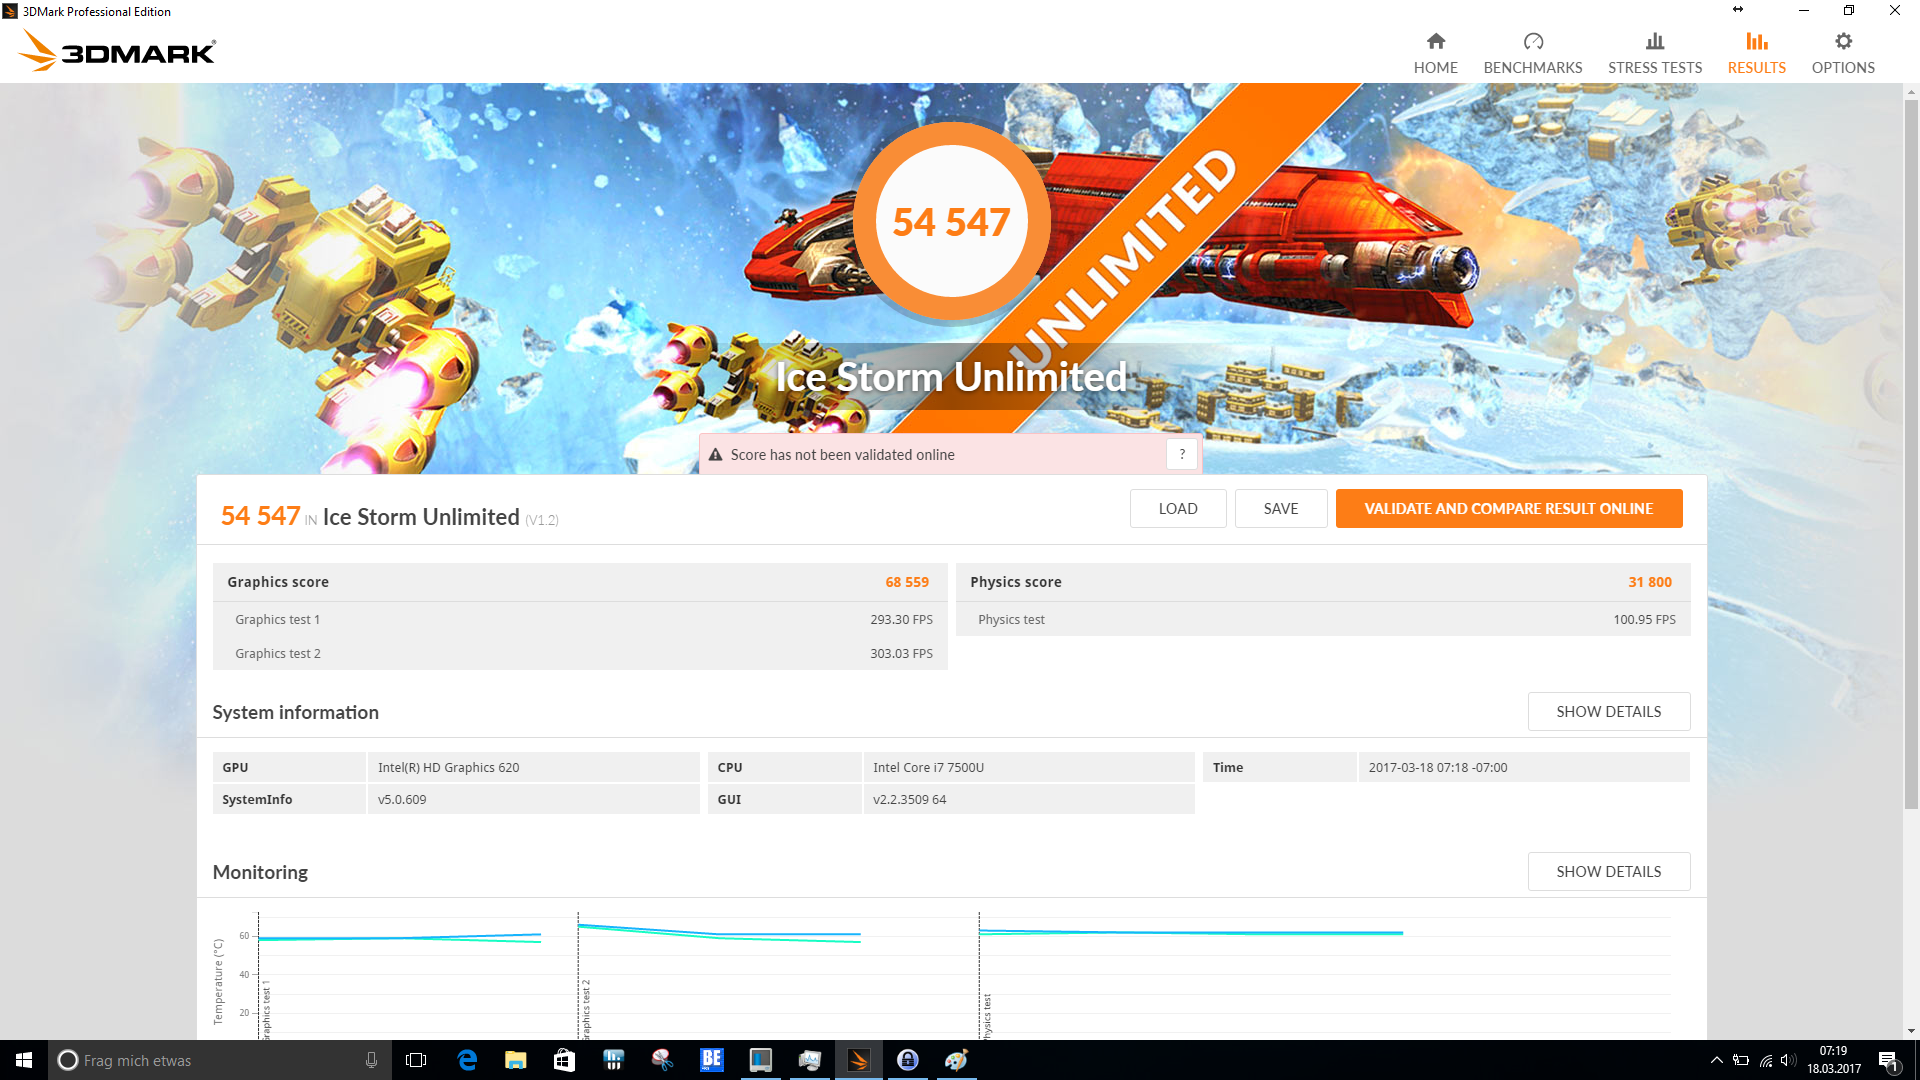
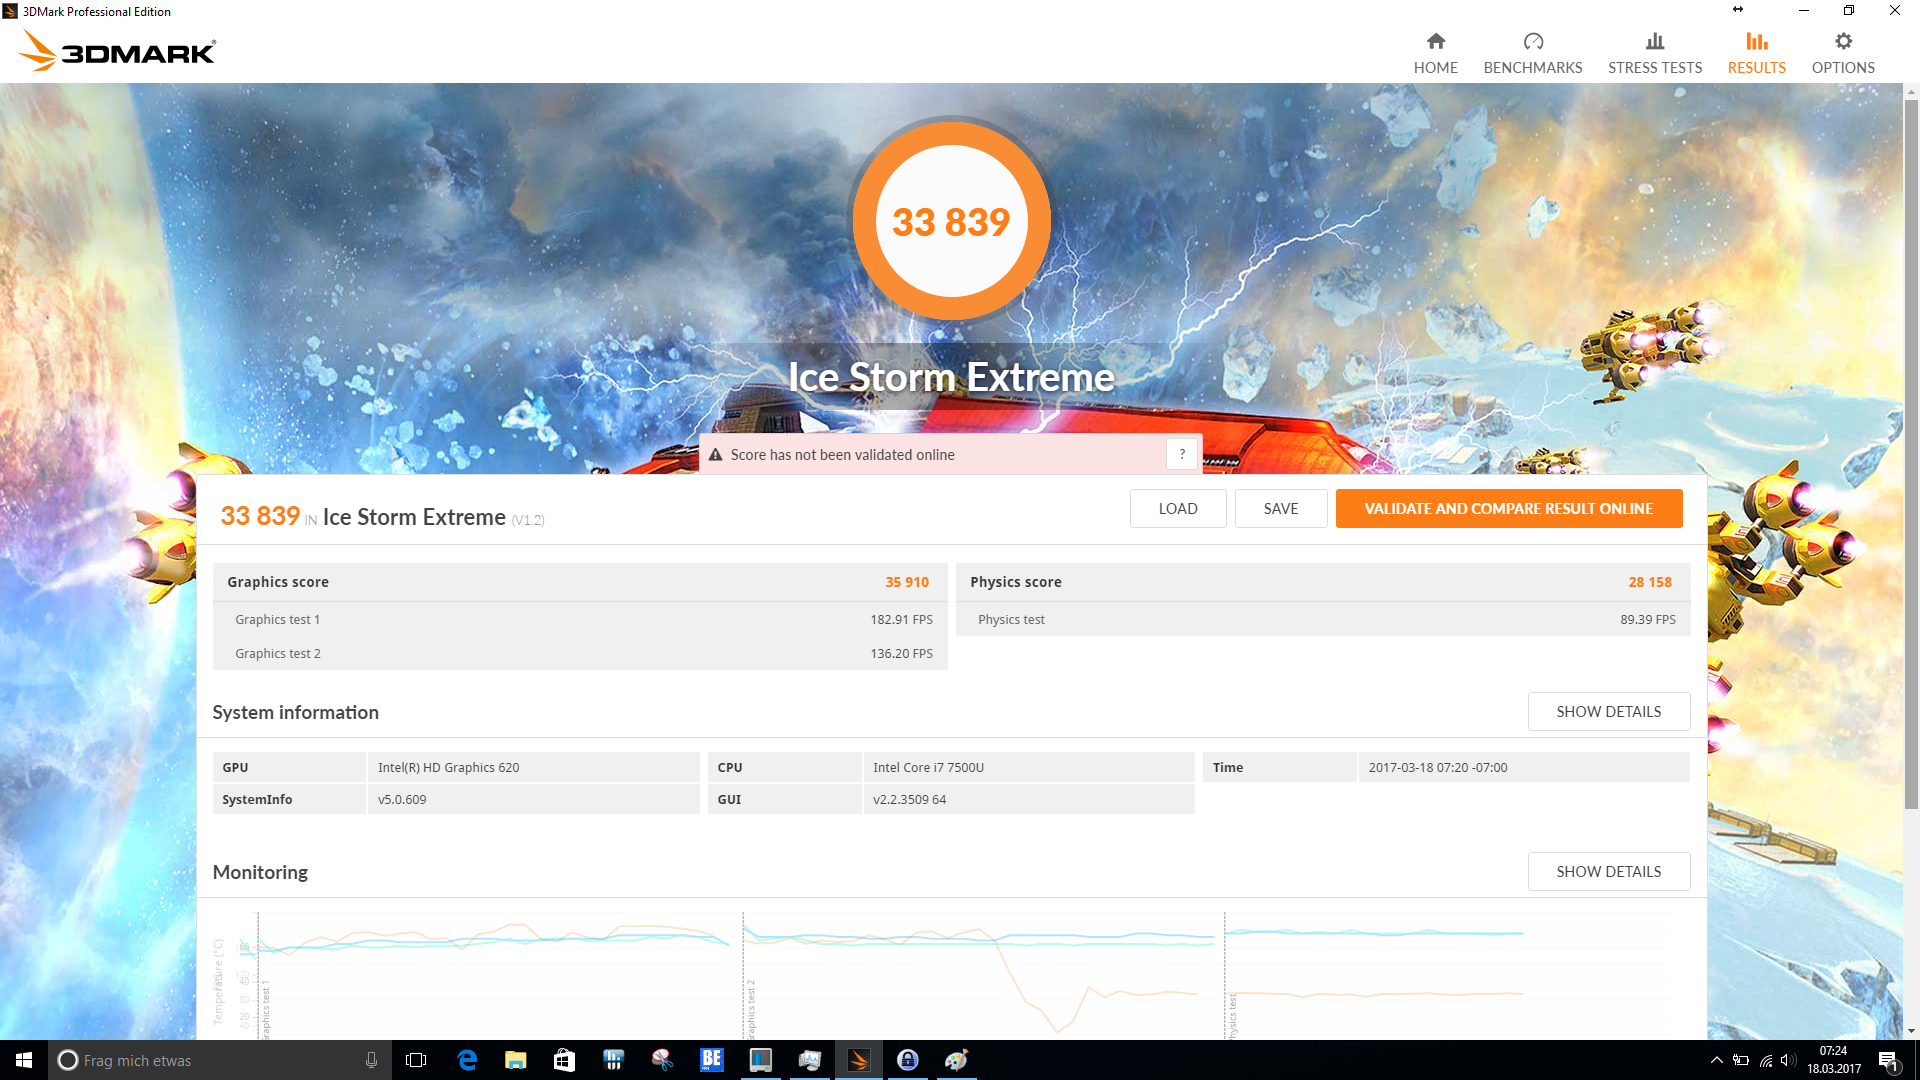
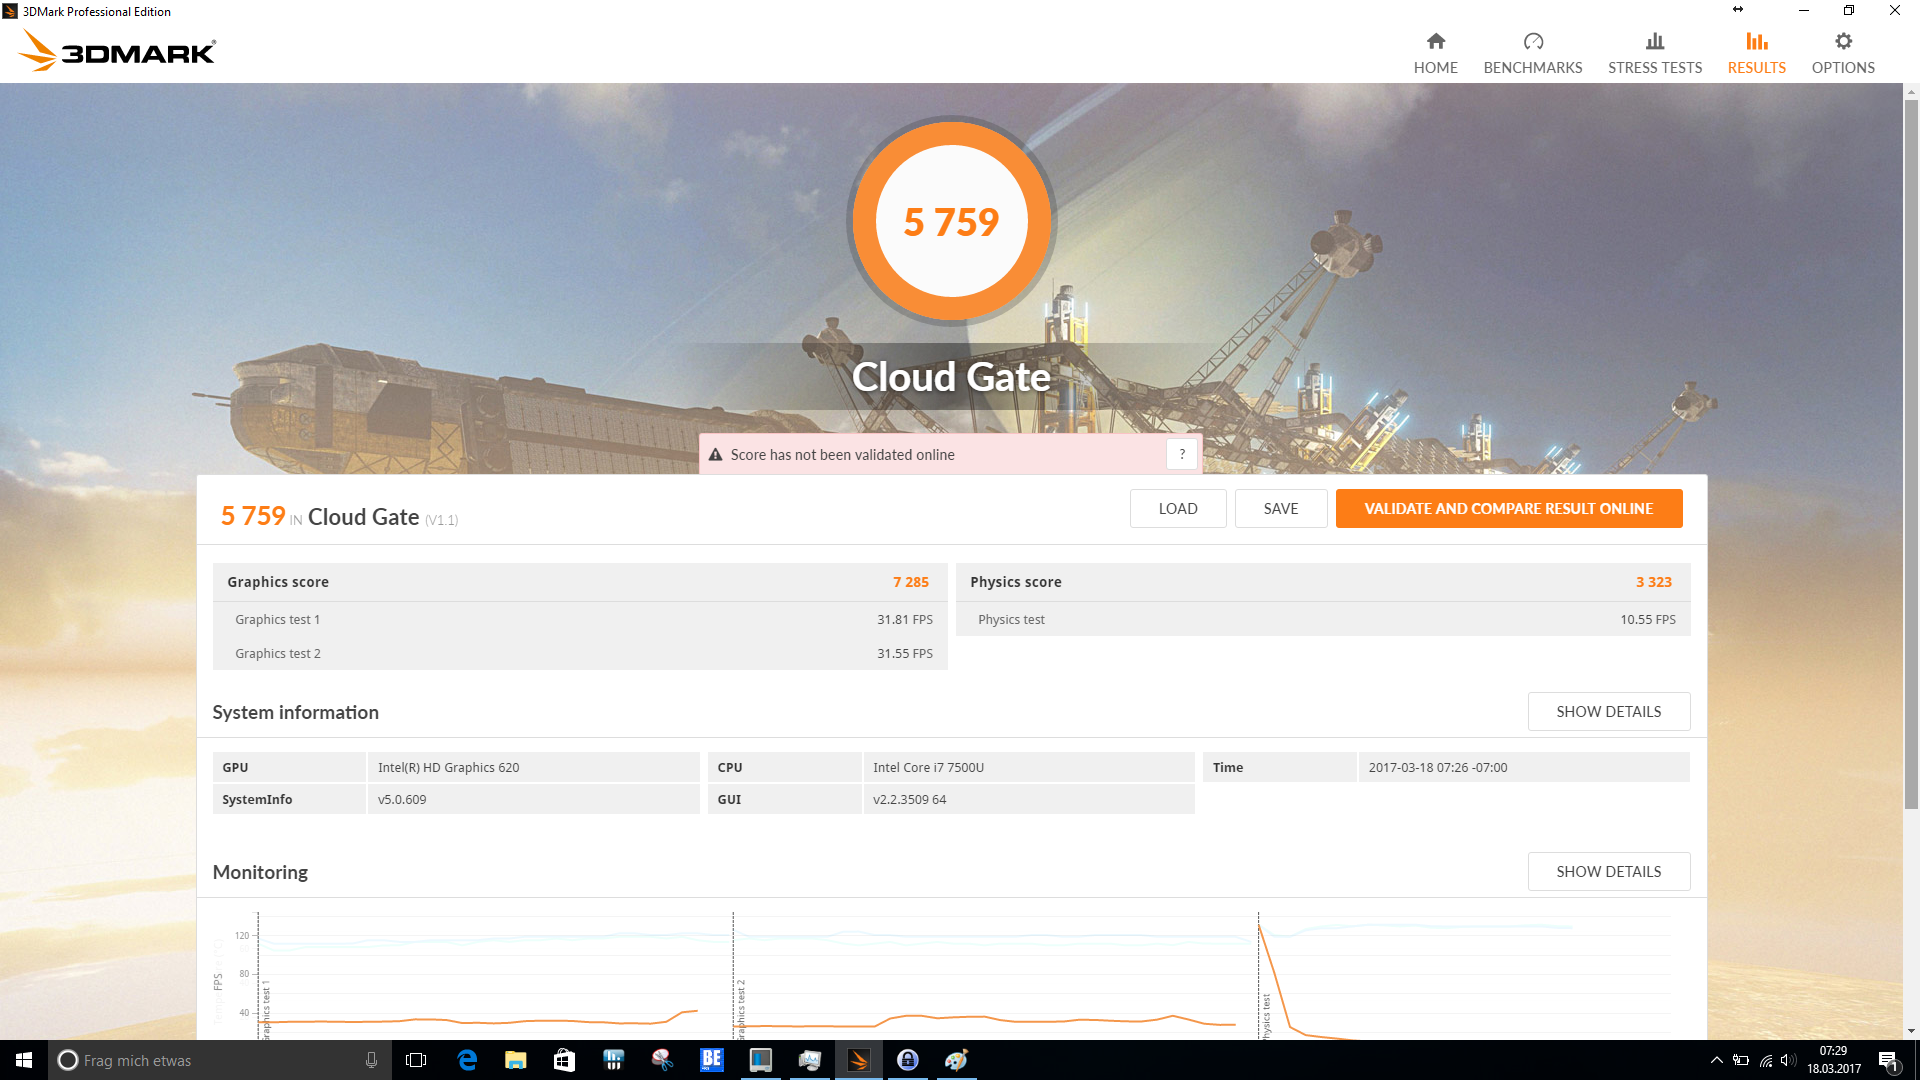
| 3DMark | |
| 1280x720 Cloud Gate Standard Graphics | |
| Asus Zenbook UX310UA-FC347T iGP | |
| Dell XPS 13 9360 FHD i5 | |
| HP ProBook 430 G4-Y8B47EA | |
| Lenovo ThinkPad 13-20GKS01100 | |
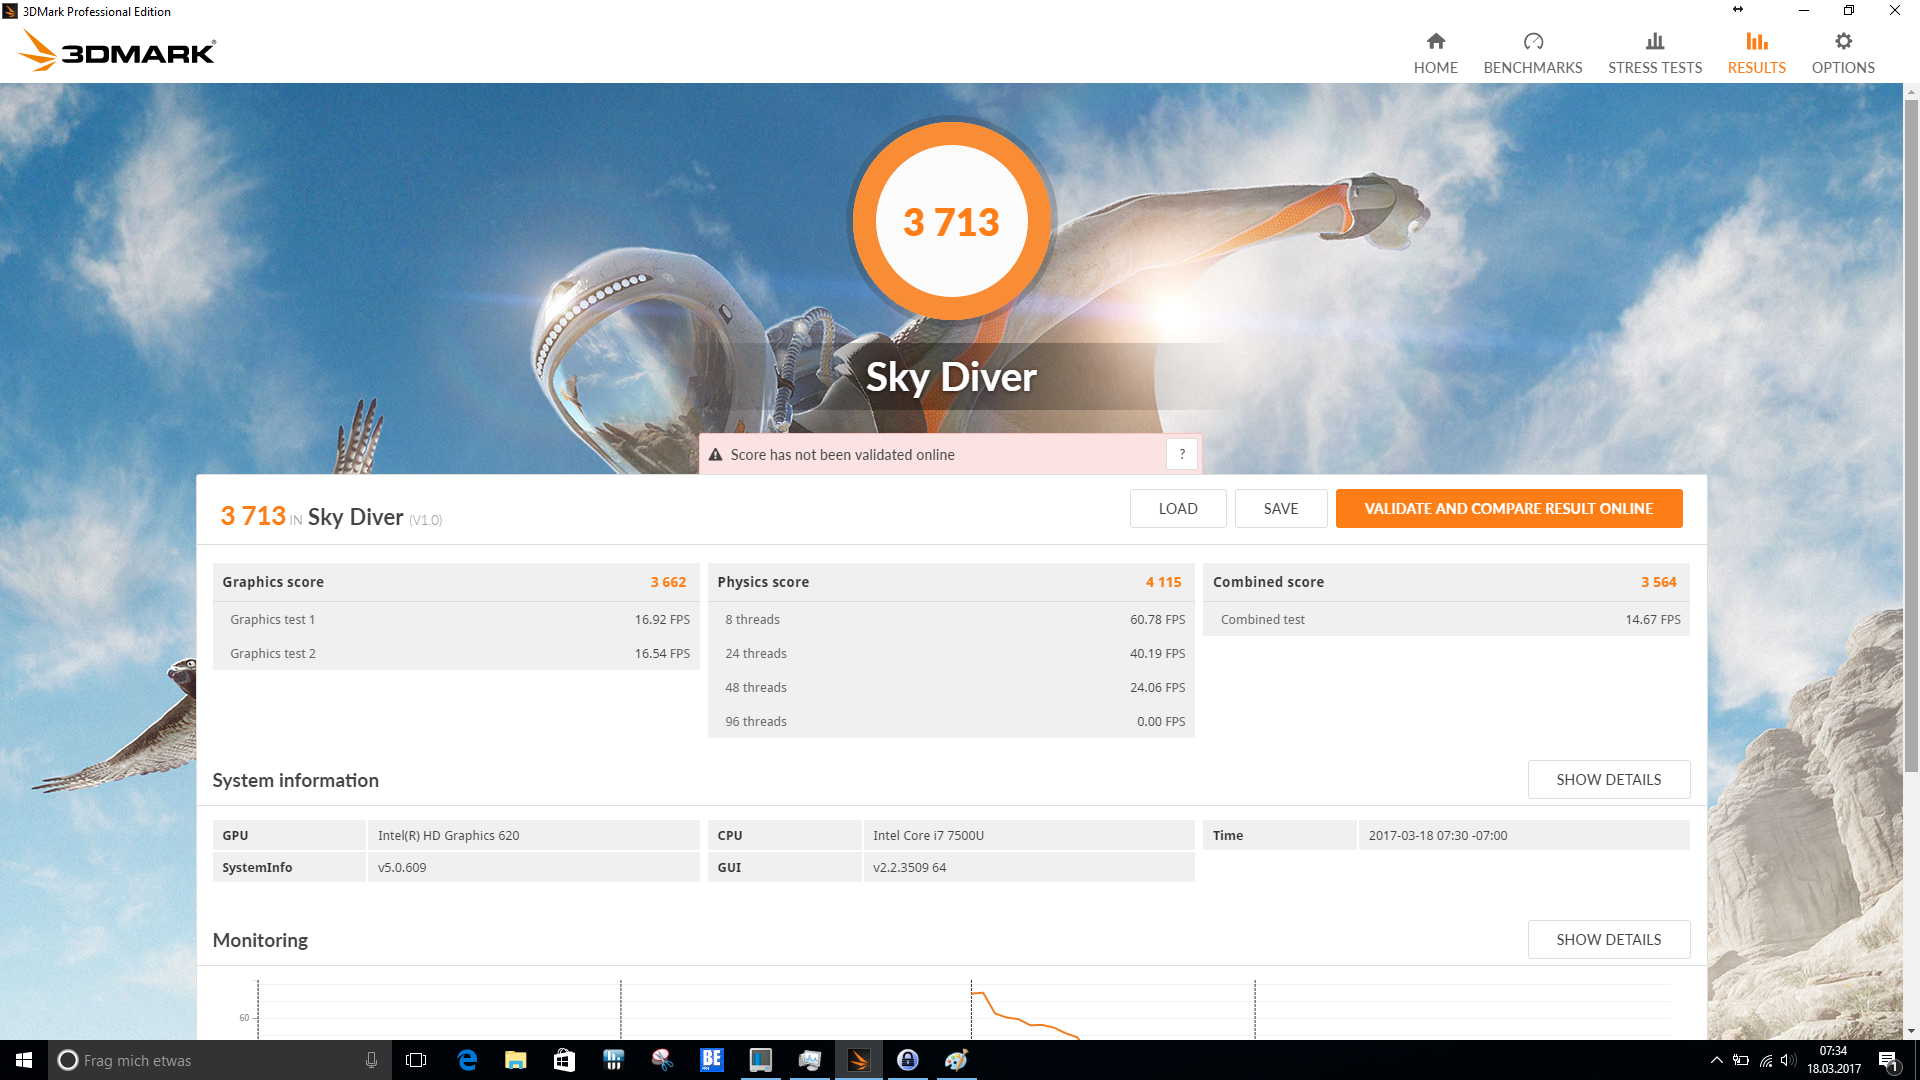
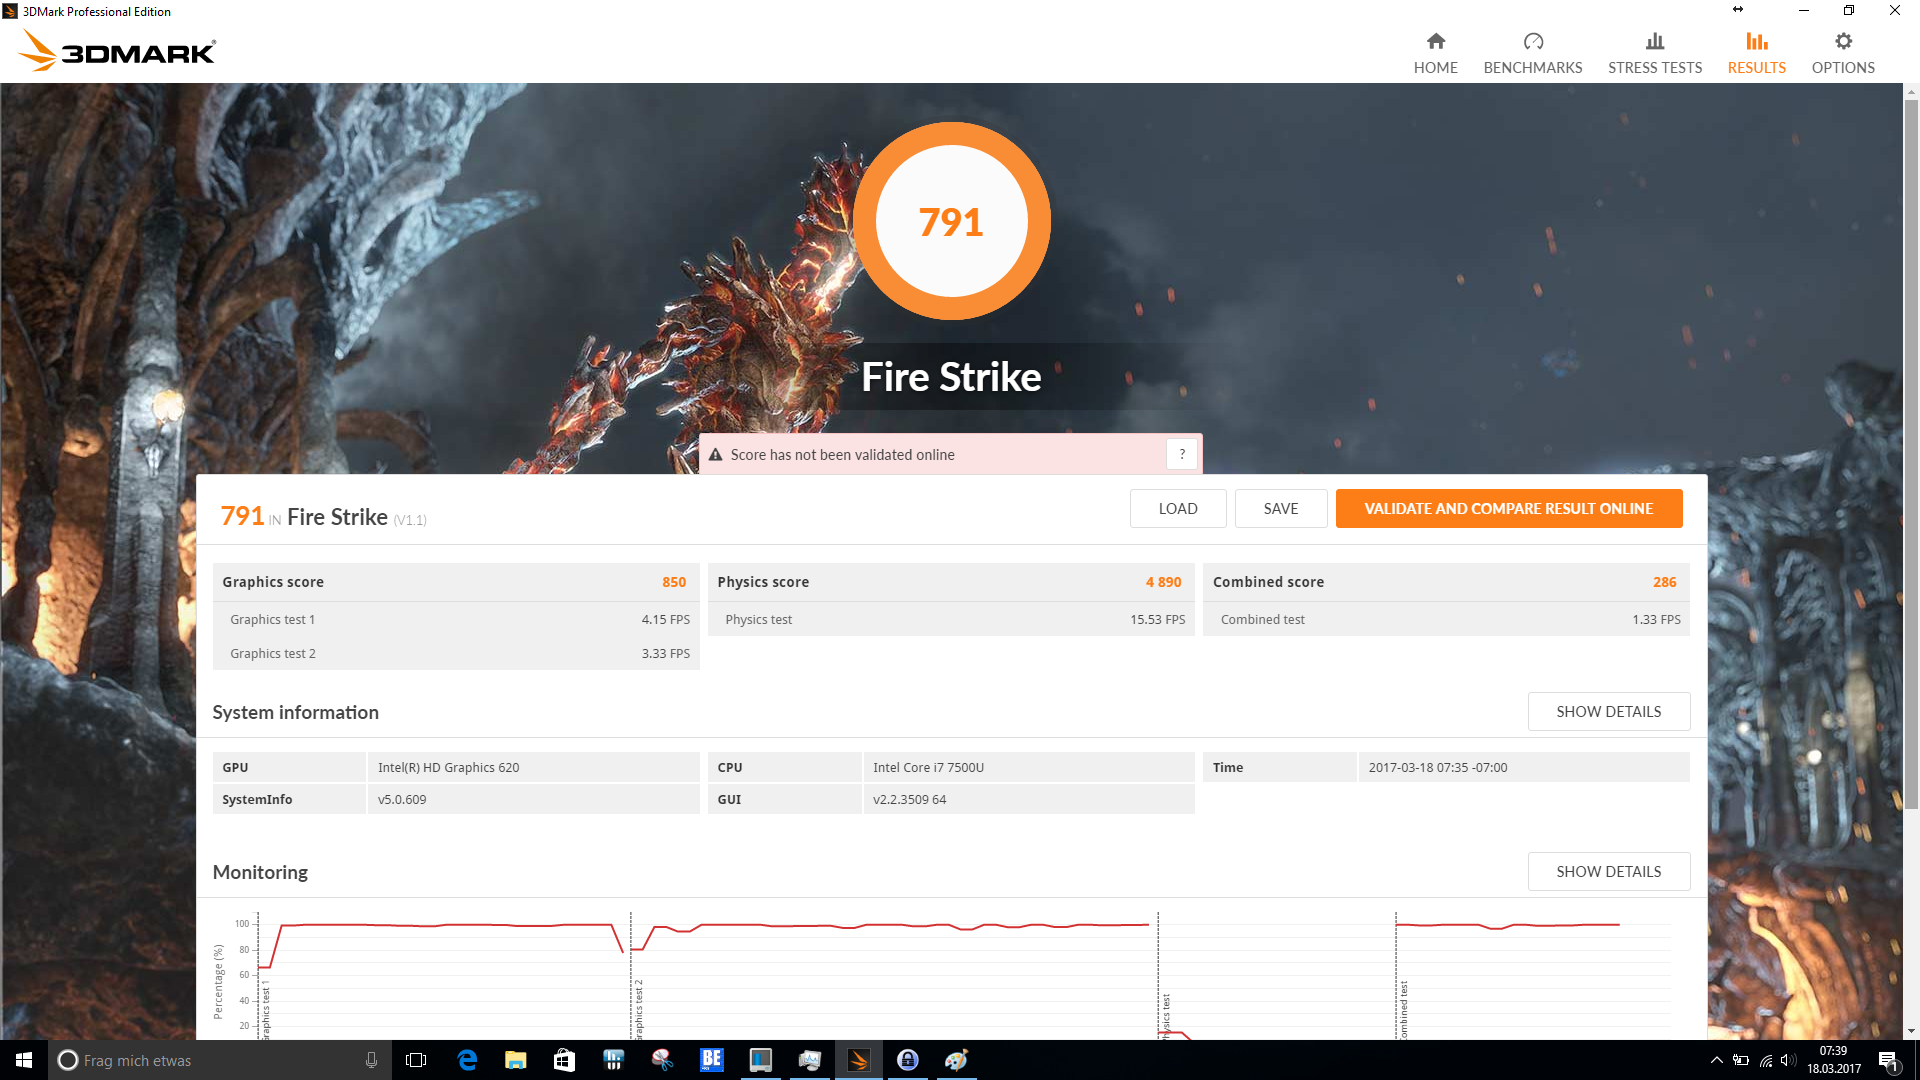
| 1920x1080 Fire Strike Graphics | |
| Asus Zenbook UX310UA-FC347T iGP | |
| Dell XPS 13 9360 FHD i5 | |
| HP ProBook 430 G4-Y8B47EA | |
| Lenovo ThinkPad 13-20GKS01100 | |
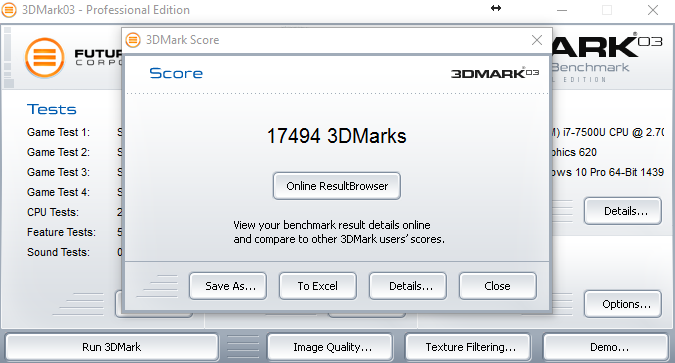
| 3DMark 03 Standard | 17494 punti | |
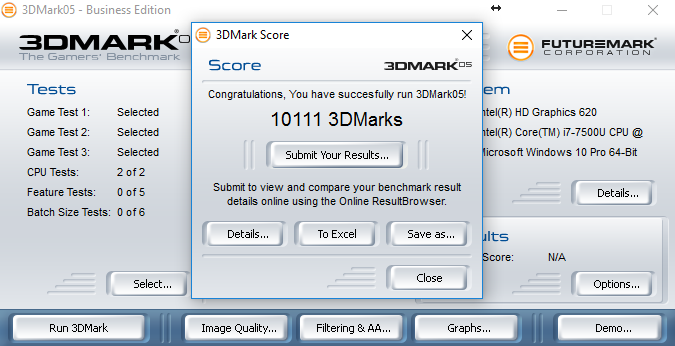
| 3DMark 05 Standard | 10111 punti | |
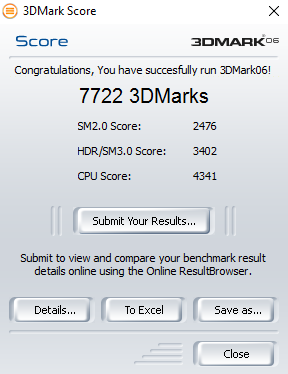
| 3DMark 06 Standard Score | 7722 punti | |
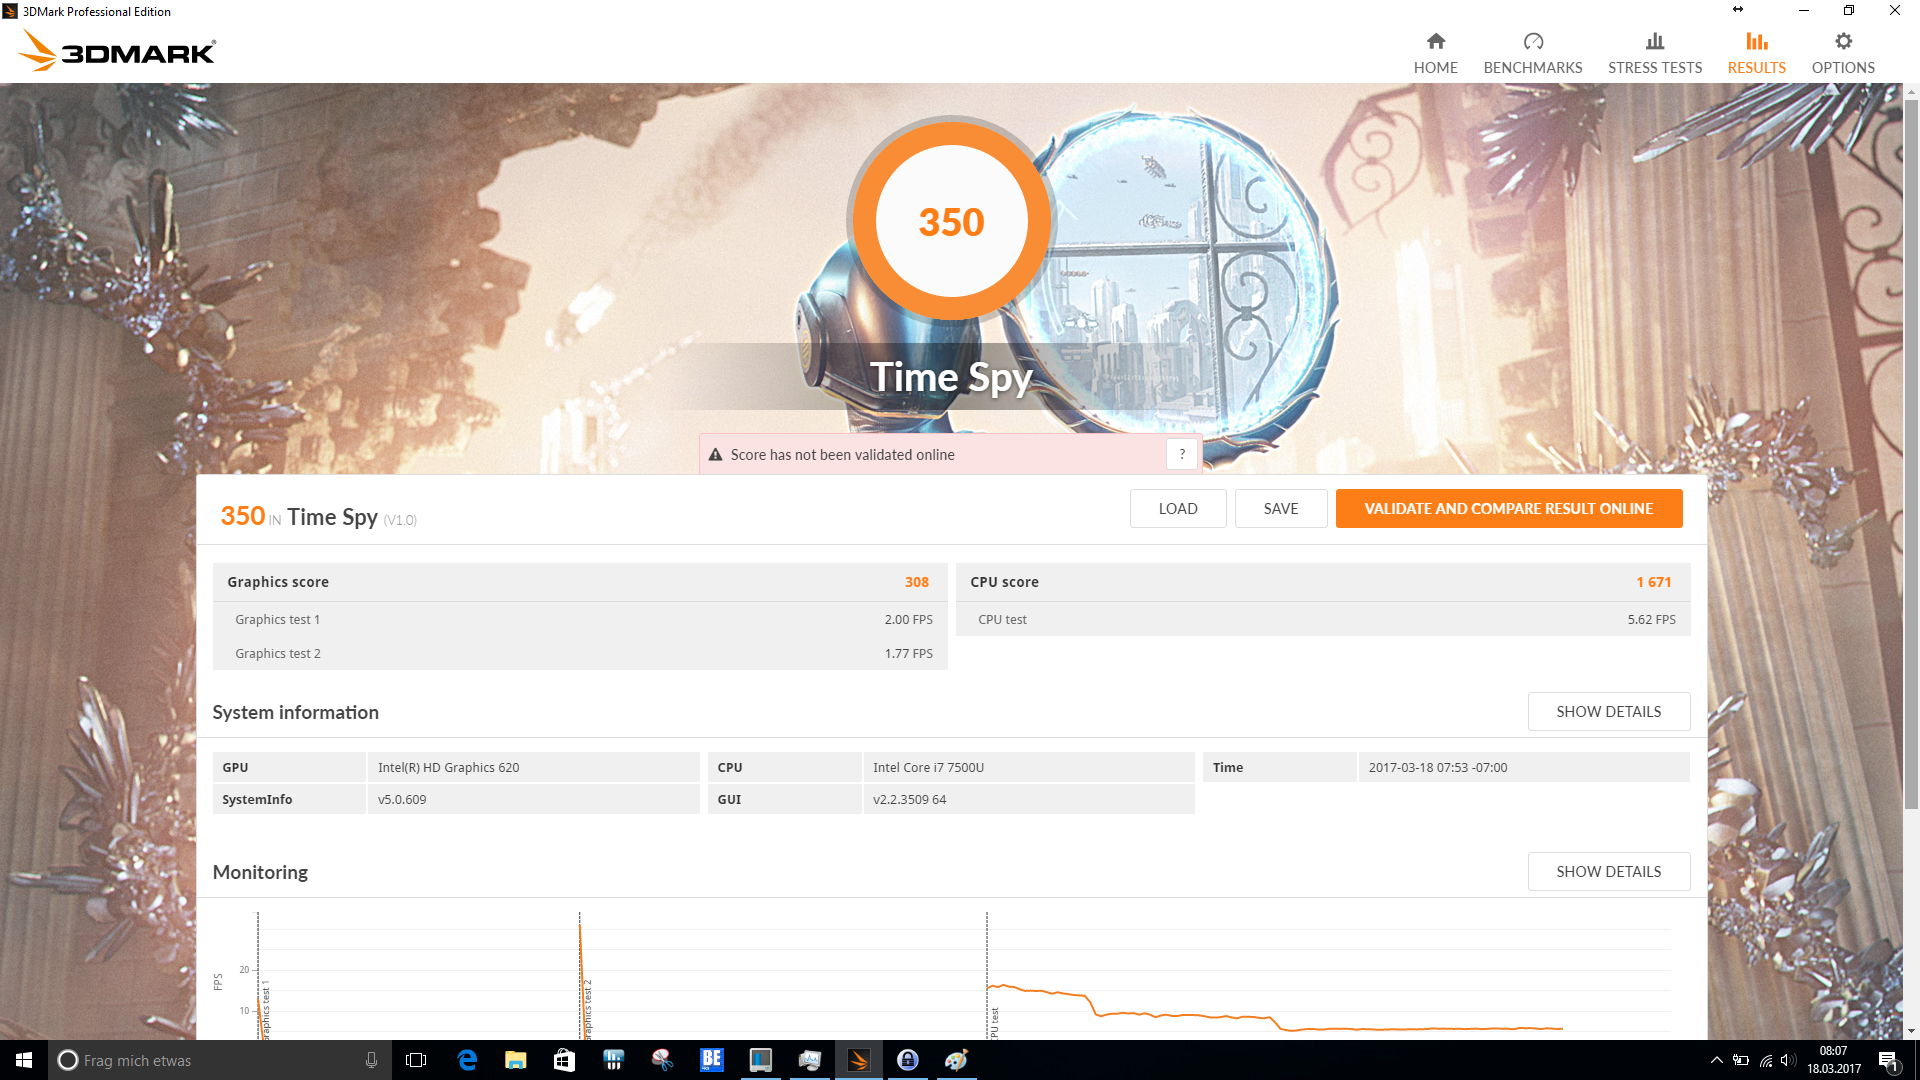
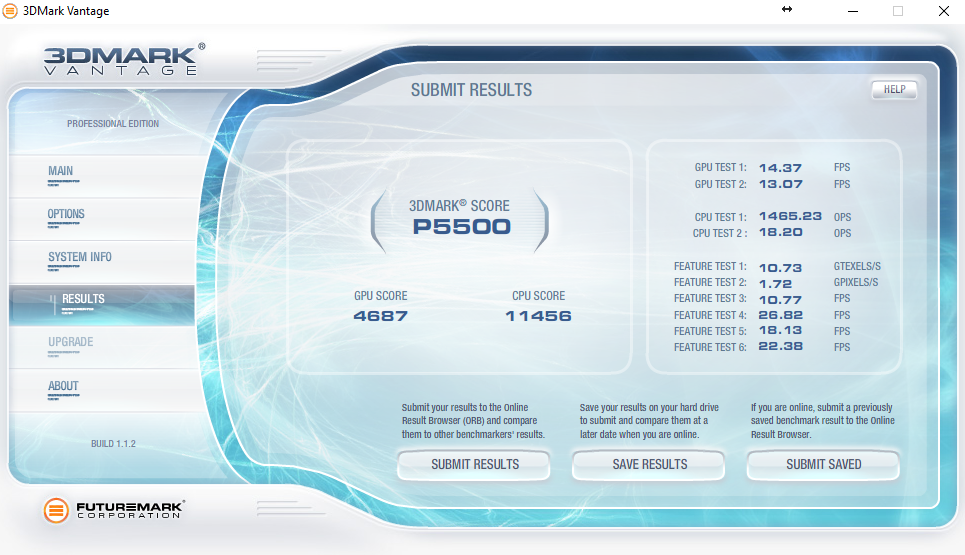
| 3DMark Vantage P Result | 5500 punti | |
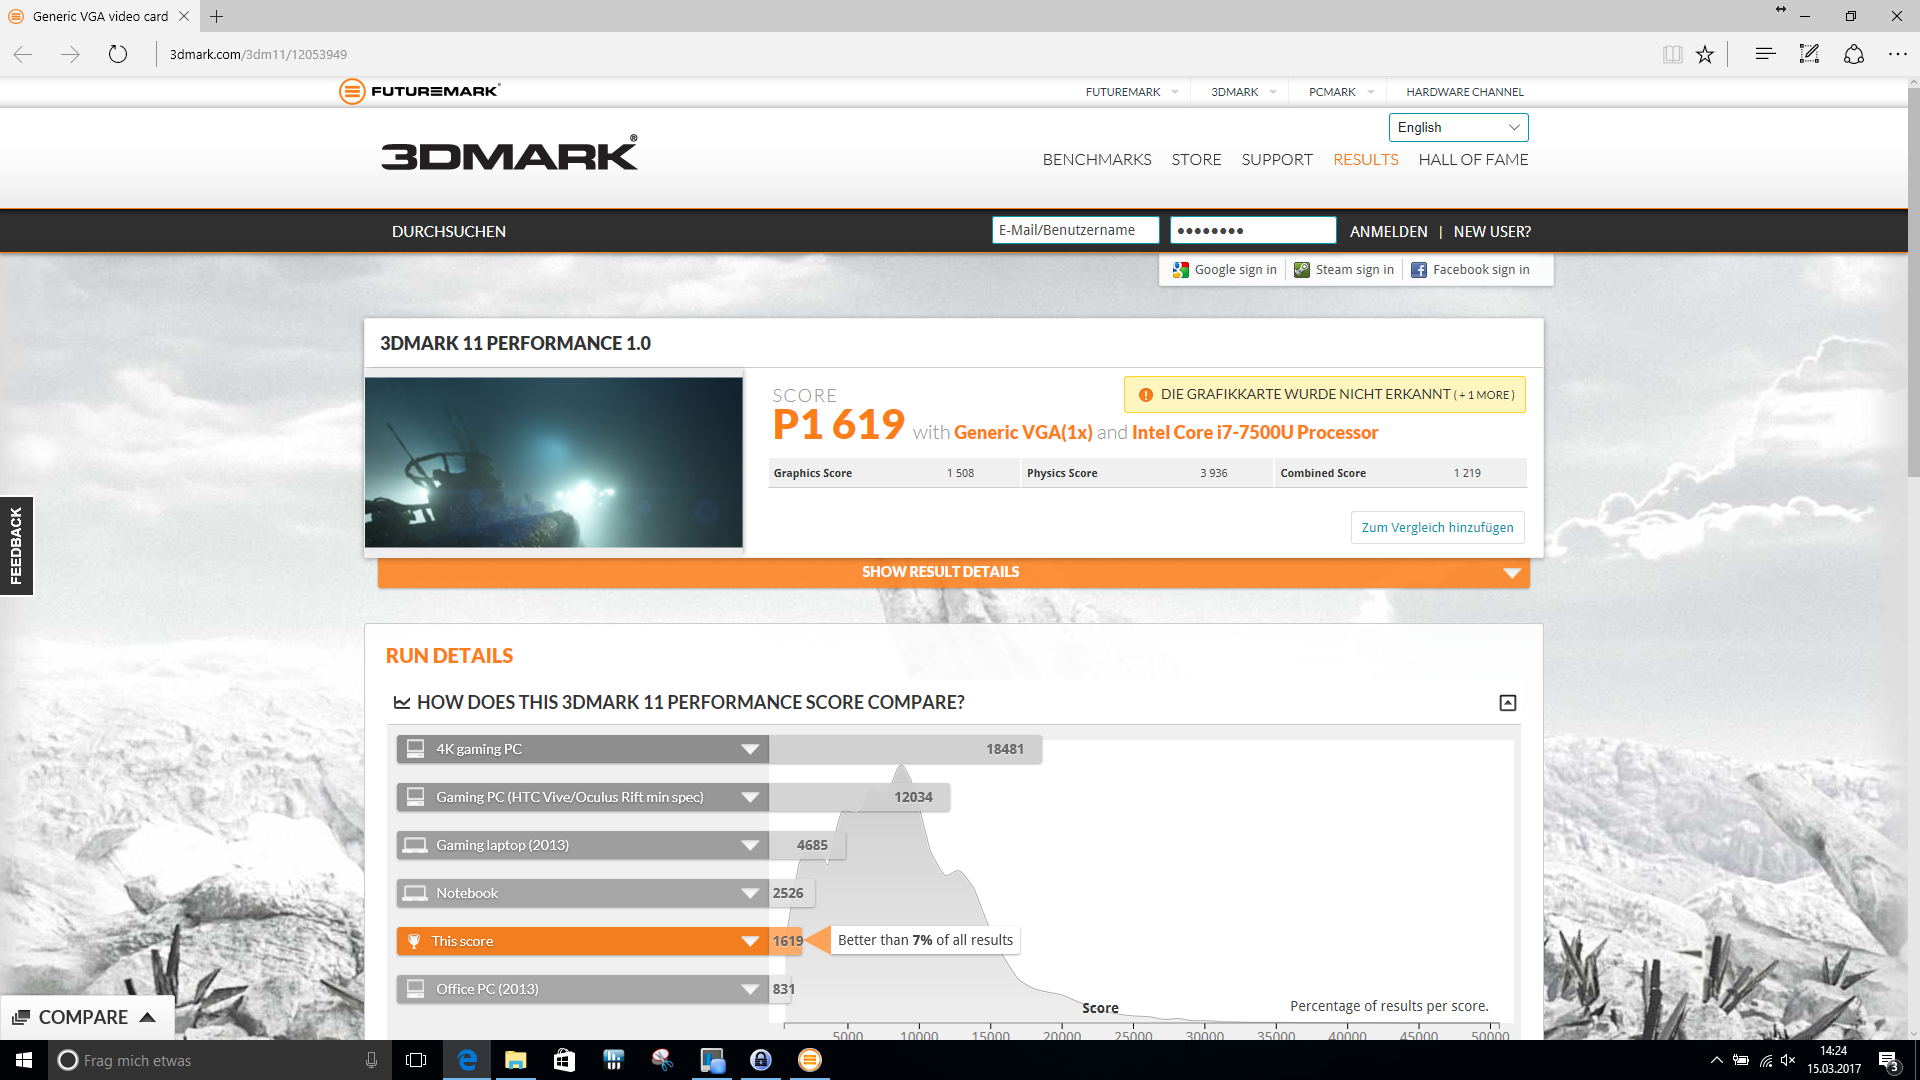
| 3DMark 11 Performance | 1619 punti | |
Aiuto | ||
| basso | medio | alto | ultra | |
|---|---|---|---|---|
| BioShock Infinite (2013) | 44 | 25 | 21 | 6 |
| Battlefield 4 (2013) | 33 | 26 | 17 | 6 |
| The Witcher 3 (2015) | 13 | 10 | 5 | |
| Rise of the Tomb Raider (2016) | 15 | 9 | 6 |
Rumorosità
| Idle |
| 29.1 / 29.1 / 29.1 dB(A) |
| Sotto carico |
| 31.9 / 31.9 dB(A) |
 | ||
30 dB silenzioso 40 dB(A) udibile 50 dB(A) rumoroso |
||
min: | ||
| Lenovo ThinkPad 13-20J2S00G00 i7-7500U, HD Graphics 620 | Lenovo ThinkPad 13-20GKS01100 6200U, HD Graphics 520 | HP ProBook 430 G4-Y8B47EA i7-7500U, HD Graphics 620 | Asus Zenbook UX310UA-FC347T iGP i7-7500U, HD Graphics 620 | Dell XPS 13 9360 FHD i5 i5-7200U, HD Graphics 620 | |
|---|---|---|---|---|---|
| Noise | -1% | -3% | -7% | 0% | |
| off /ambiente * (dB) | 29.1 | 29.1 -0% | 29.1 -0% | 30.7 -5% | |
| Idle Minimum * (dB) | 29.1 | 29.1 -0% | 29.1 -0% | 30.9 -6% | 28.9 1% |
| Idle Average * (dB) | 29.1 | 29.1 -0% | 29.1 -0% | 30.9 -6% | 28.9 1% |
| Idle Maximum * (dB) | 29.1 | 29.1 -0% | 29.1 -0% | 30.9 -6% | 28.9 1% |
| Load Average * (dB) | 31.9 | 31.5 1% | 33.4 -5% | 35.6 -12% | 30.9 3% |
| Load Maximum * (dB) | 31.9 | 33.5 -5% | 36 -13% | 34.1 -7% | 33.5 -5% |
* ... Meglio usare valori piccoli
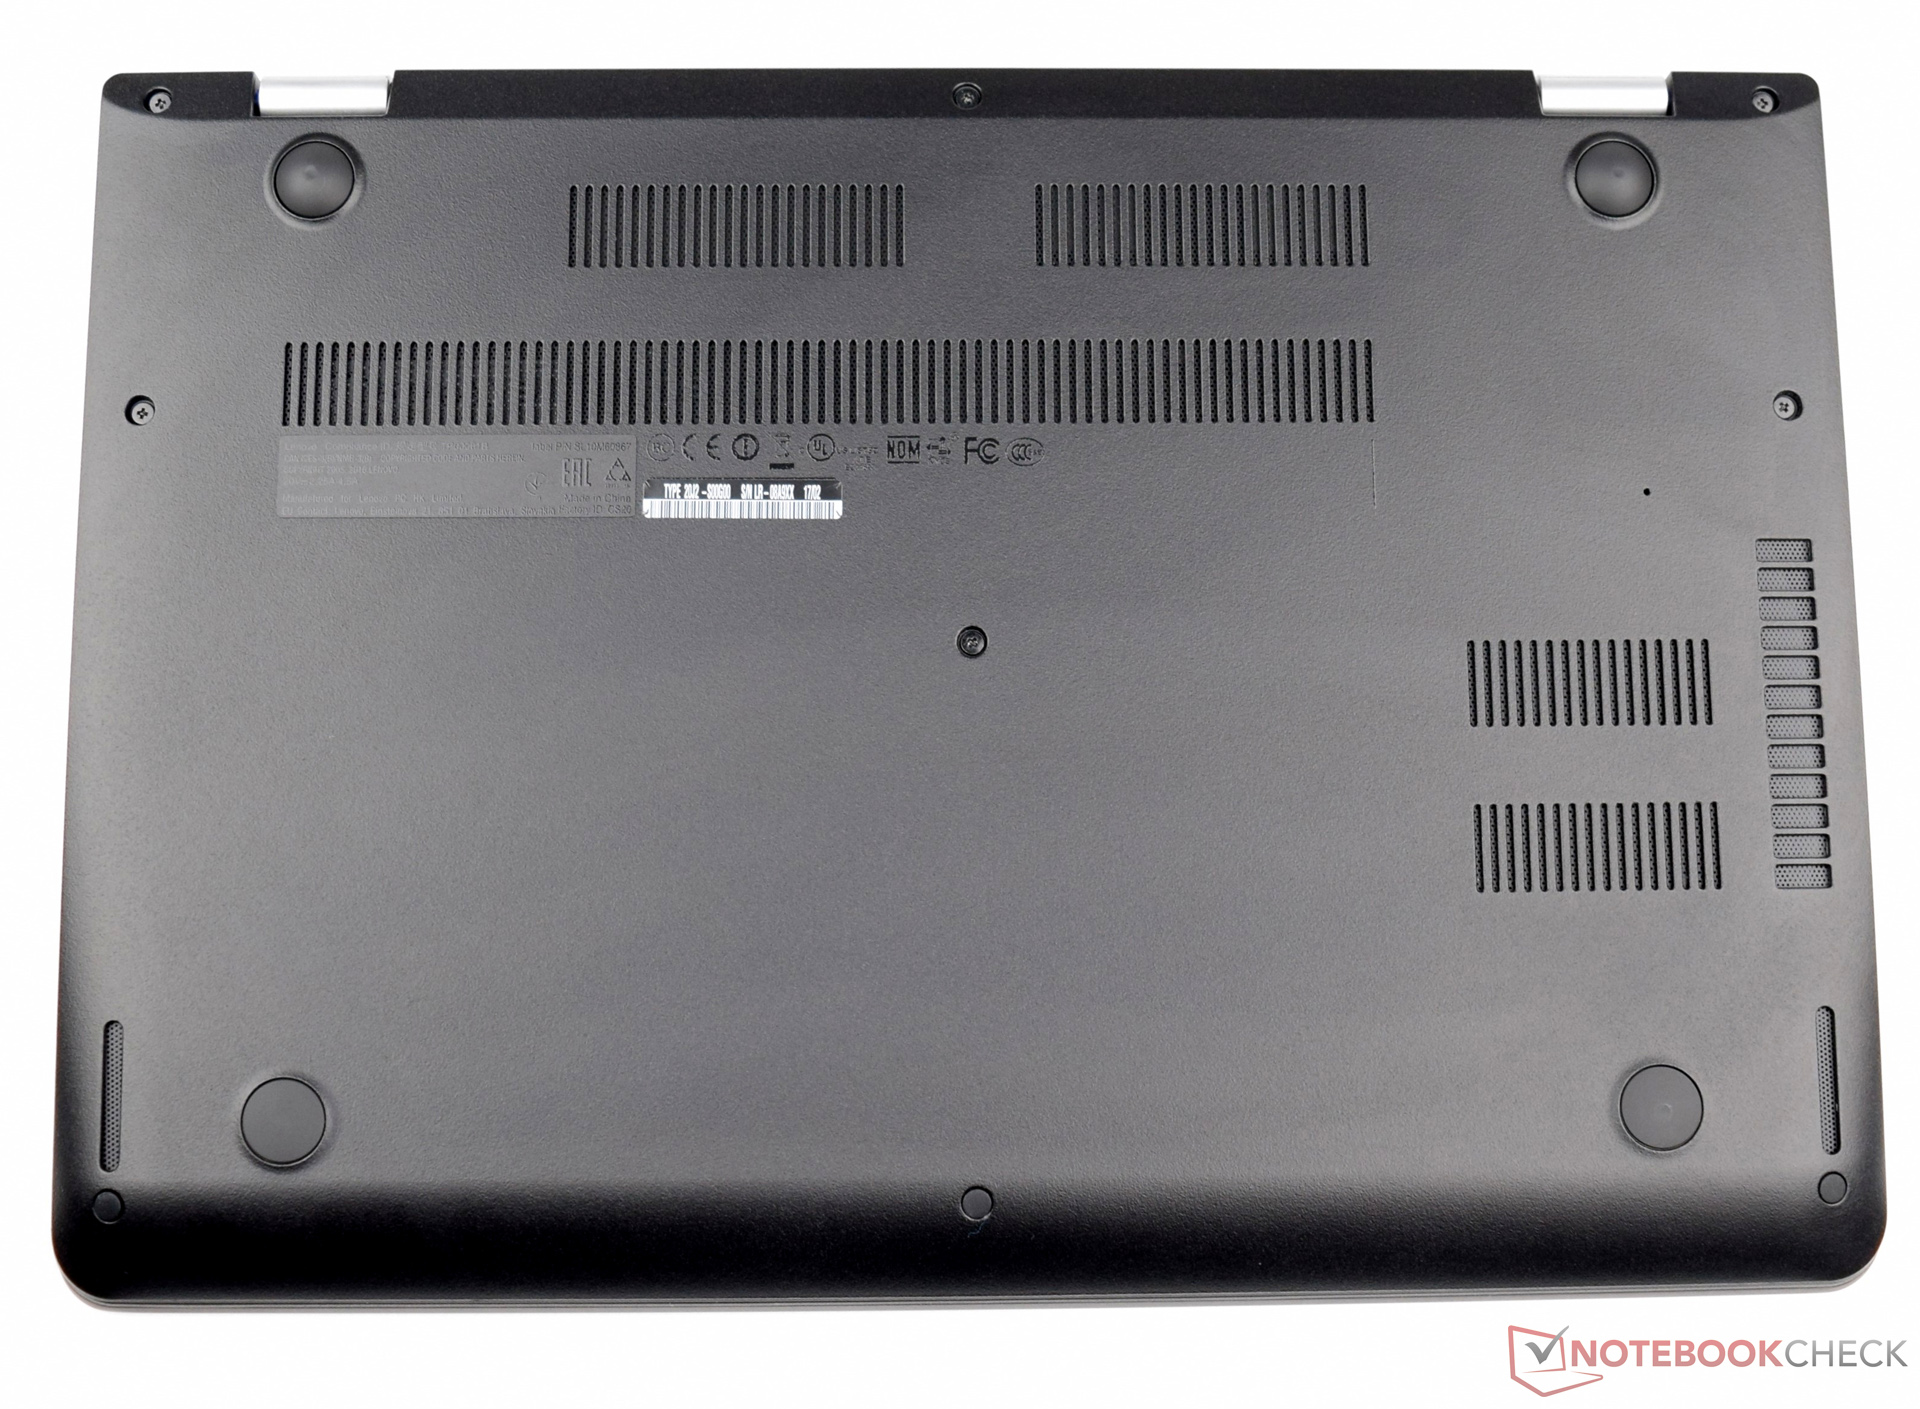
(±) La temperatura massima sul lato superiore è di 44.7 °C / 112 F, rispetto alla media di 34.3 °C / 94 F, che varia da 21.2 a 62.5 °C per questa classe Office.
(-) Il lato inferiore si riscalda fino ad un massimo di 54.7 °C / 130 F, rispetto alla media di 36.8 °C / 98 F
(+) In idle, la temperatura media del lato superiore è di 23.5 °C / 74 F, rispetto alla media deld ispositivo di 29.5 °C / 85 F.
(±) I poggiapolsi e il touchpad possono diventare molto caldi al tatto con un massimo di 39.8 °C / 103.6 F.
(-) La temperatura media della zona del palmo della mano di dispositivi simili e'stata di 27.5 °C / 81.5 F (-12.3 °C / -22.1 F).
| Lenovo ThinkPad 13-20J2S00G00 i7-7500U, HD Graphics 620 | Lenovo ThinkPad 13-20GKS01100 6200U, HD Graphics 520 | HP ProBook 430 G4-Y8B47EA i7-7500U, HD Graphics 620 | Asus Zenbook UX310UA-FC347T iGP i7-7500U, HD Graphics 620 | Dell XPS 13 9360 FHD i5 i5-7200U, HD Graphics 620 | |
|---|---|---|---|---|---|
| Heat | -9% | -0% | 16% | 0% | |
| Maximum Upper Side * (°C) | 44.7 | 43.7 2% | 38.7 13% | 33.7 25% | 43.4 3% |
| Maximum Bottom * (°C) | 54.7 | 44.2 19% | 39.4 28% | 34.1 38% | 49.2 10% |
| Idle Upper Side * (°C) | 24.2 | 31.4 -30% | 29.5 -22% | 25.2 -4% | 26.4 -9% |
| Idle Bottom * (°C) | 25.6 | 32.1 -25% | 30.6 -20% | 24.1 6% | 26.4 -3% |
* ... Meglio usare valori piccoli
Lenovo ThinkPad 13-20J2S00G00 analisi audio
(±) | potenza degli altiparlanti media ma buona (74.1 dB)
Bassi 100 - 315 Hz
(-) | quasi nessun basso - in media 16.3% inferiori alla media
(±) | la linearità dei bassi è media (11.1% delta rispetto alla precedente frequenza)
Medi 400 - 2000 Hz
(±) | medi elevati - circa 6.2% superiore alla media
(±) | linearità dei medi adeguata (8.8% delta rispetto alla precedente frequenza)
Alti 2 - 16 kHz
(+) | Alti bilanciati - appena 2% dalla media
(+) | alti lineari (6.9% delta rispetto alla precedente frequenza)
Nel complesso 100 - 16.000 Hz
(±) | la linearità complessiva del suono è media (21.3% di differenza rispetto alla media
Rispetto alla stessa classe
» 52% di tutti i dispositivi testati in questa classe è stato migliore, 9% simile, 39% peggiore
» Il migliore ha avuto un delta di 7%, medio di 21%, peggiore di 53%
Rispetto a tutti i dispositivi testati
» 59% di tutti i dispositivi testati in questa classe è stato migliore, 7% similare, 33% peggiore
» Il migliore ha avuto un delta di 4%, medio di 23%, peggiore di 134%
HP ProBook 430 G4-Y8B47EA analisi audio
(+) | gli altoparlanti sono relativamente potenti (84.6 dB)
Bassi 100 - 315 Hz
(-) | quasi nessun basso - in media 19.7% inferiori alla media
(±) | la linearità dei bassi è media (13.1% delta rispetto alla precedente frequenza)
Medi 400 - 2000 Hz
(+) | medi bilanciati - solo only 3.8% rispetto alla media
(+) | medi lineari (6.8% delta rispetto alla precedente frequenza)
Alti 2 - 16 kHz
(±) | alti elevati - circa 5.7% superiori alla media
(+) | alti lineari (5.4% delta rispetto alla precedente frequenza)
Nel complesso 100 - 16.000 Hz
(±) | la linearità complessiva del suono è media (18.9% di differenza rispetto alla media
Rispetto alla stessa classe
» 36% di tutti i dispositivi testati in questa classe è stato migliore, 7% simile, 57% peggiore
» Il migliore ha avuto un delta di 7%, medio di 21%, peggiore di 53%
Rispetto a tutti i dispositivi testati
» 44% di tutti i dispositivi testati in questa classe è stato migliore, 8% similare, 48% peggiore
» Il migliore ha avuto un delta di 4%, medio di 23%, peggiore di 134%
| Off / Standby | |
| Idle | |
| Sotto carico |
|
Leggenda:
min: | |
| Lenovo ThinkPad 13-20J2S00G00 i7-7500U, HD Graphics 620 | Lenovo ThinkPad 13-20GKS01100 6200U, HD Graphics 520 | HP ProBook 430 G4-Y8B47EA i7-7500U, HD Graphics 620 | Asus Zenbook UX310UA-FC347T iGP i7-7500U, HD Graphics 620 | Dell XPS 13 9360 FHD i5 i5-7200U, HD Graphics 620 | |
|---|---|---|---|---|---|
| Power Consumption | 8% | -14% | -12% | 13% | |
| Idle Minimum * (Watt) | 3.16 | 3.1 2% | 4.2 -33% | 3.5 -11% | 4.1 -30% |
| Idle Average * (Watt) | 5.9 | 5.5 7% | 6.5 -10% | 6.6 -12% | 4.2 29% |
| Idle Maximum * (Watt) | 6.5 | 6 8% | 7.2 -11% | 7.5 -15% | 5.1 22% |
| Load Average * (Watt) | 30.6 | 25.8 16% | 28.7 6% | 34.7 -13% | 22.1 28% |
| Load Maximum * (Watt) | 35.8 | 33.6 6% | 43.5 -22% | 39.6 -11% | 29.4 18% |
* ... Meglio usare valori piccoli
| Lenovo ThinkPad 13-20J2S00G00 i7-7500U, HD Graphics 620, 42 Wh | Lenovo ThinkPad 13-20GKS01100 6200U, HD Graphics 520, 42 Wh | HP ProBook 430 G4-Y8B47EA i7-7500U, HD Graphics 620, 48 Wh | Asus Zenbook UX310UA-FC347T iGP i7-7500U, HD Graphics 620, 48 Wh | Dell XPS 13 9360 FHD i5 i5-7200U, HD Graphics 620, 60 Wh | |
|---|---|---|---|---|---|
| Autonomia della batteria | 22% | 41% | 25% | 57% | |
| Reader / Idle (h) | 15.1 | 15.7 4% | 15.9 5% | 16.1 7% | 21.6 43% |
| H.264 (h) | 5.2 | 7.8 50% | 8.7 67% | 6.9 33% | |
| WiFi v1.3 (h) | 7.9 | 6.2 -22% | 7.2 -9% | 9.6 22% | 11.3 43% |
| Load (h) | 1.4 | 2.2 57% | 2.8 100% | 1.9 36% | 2.6 86% |
Pro
Contro

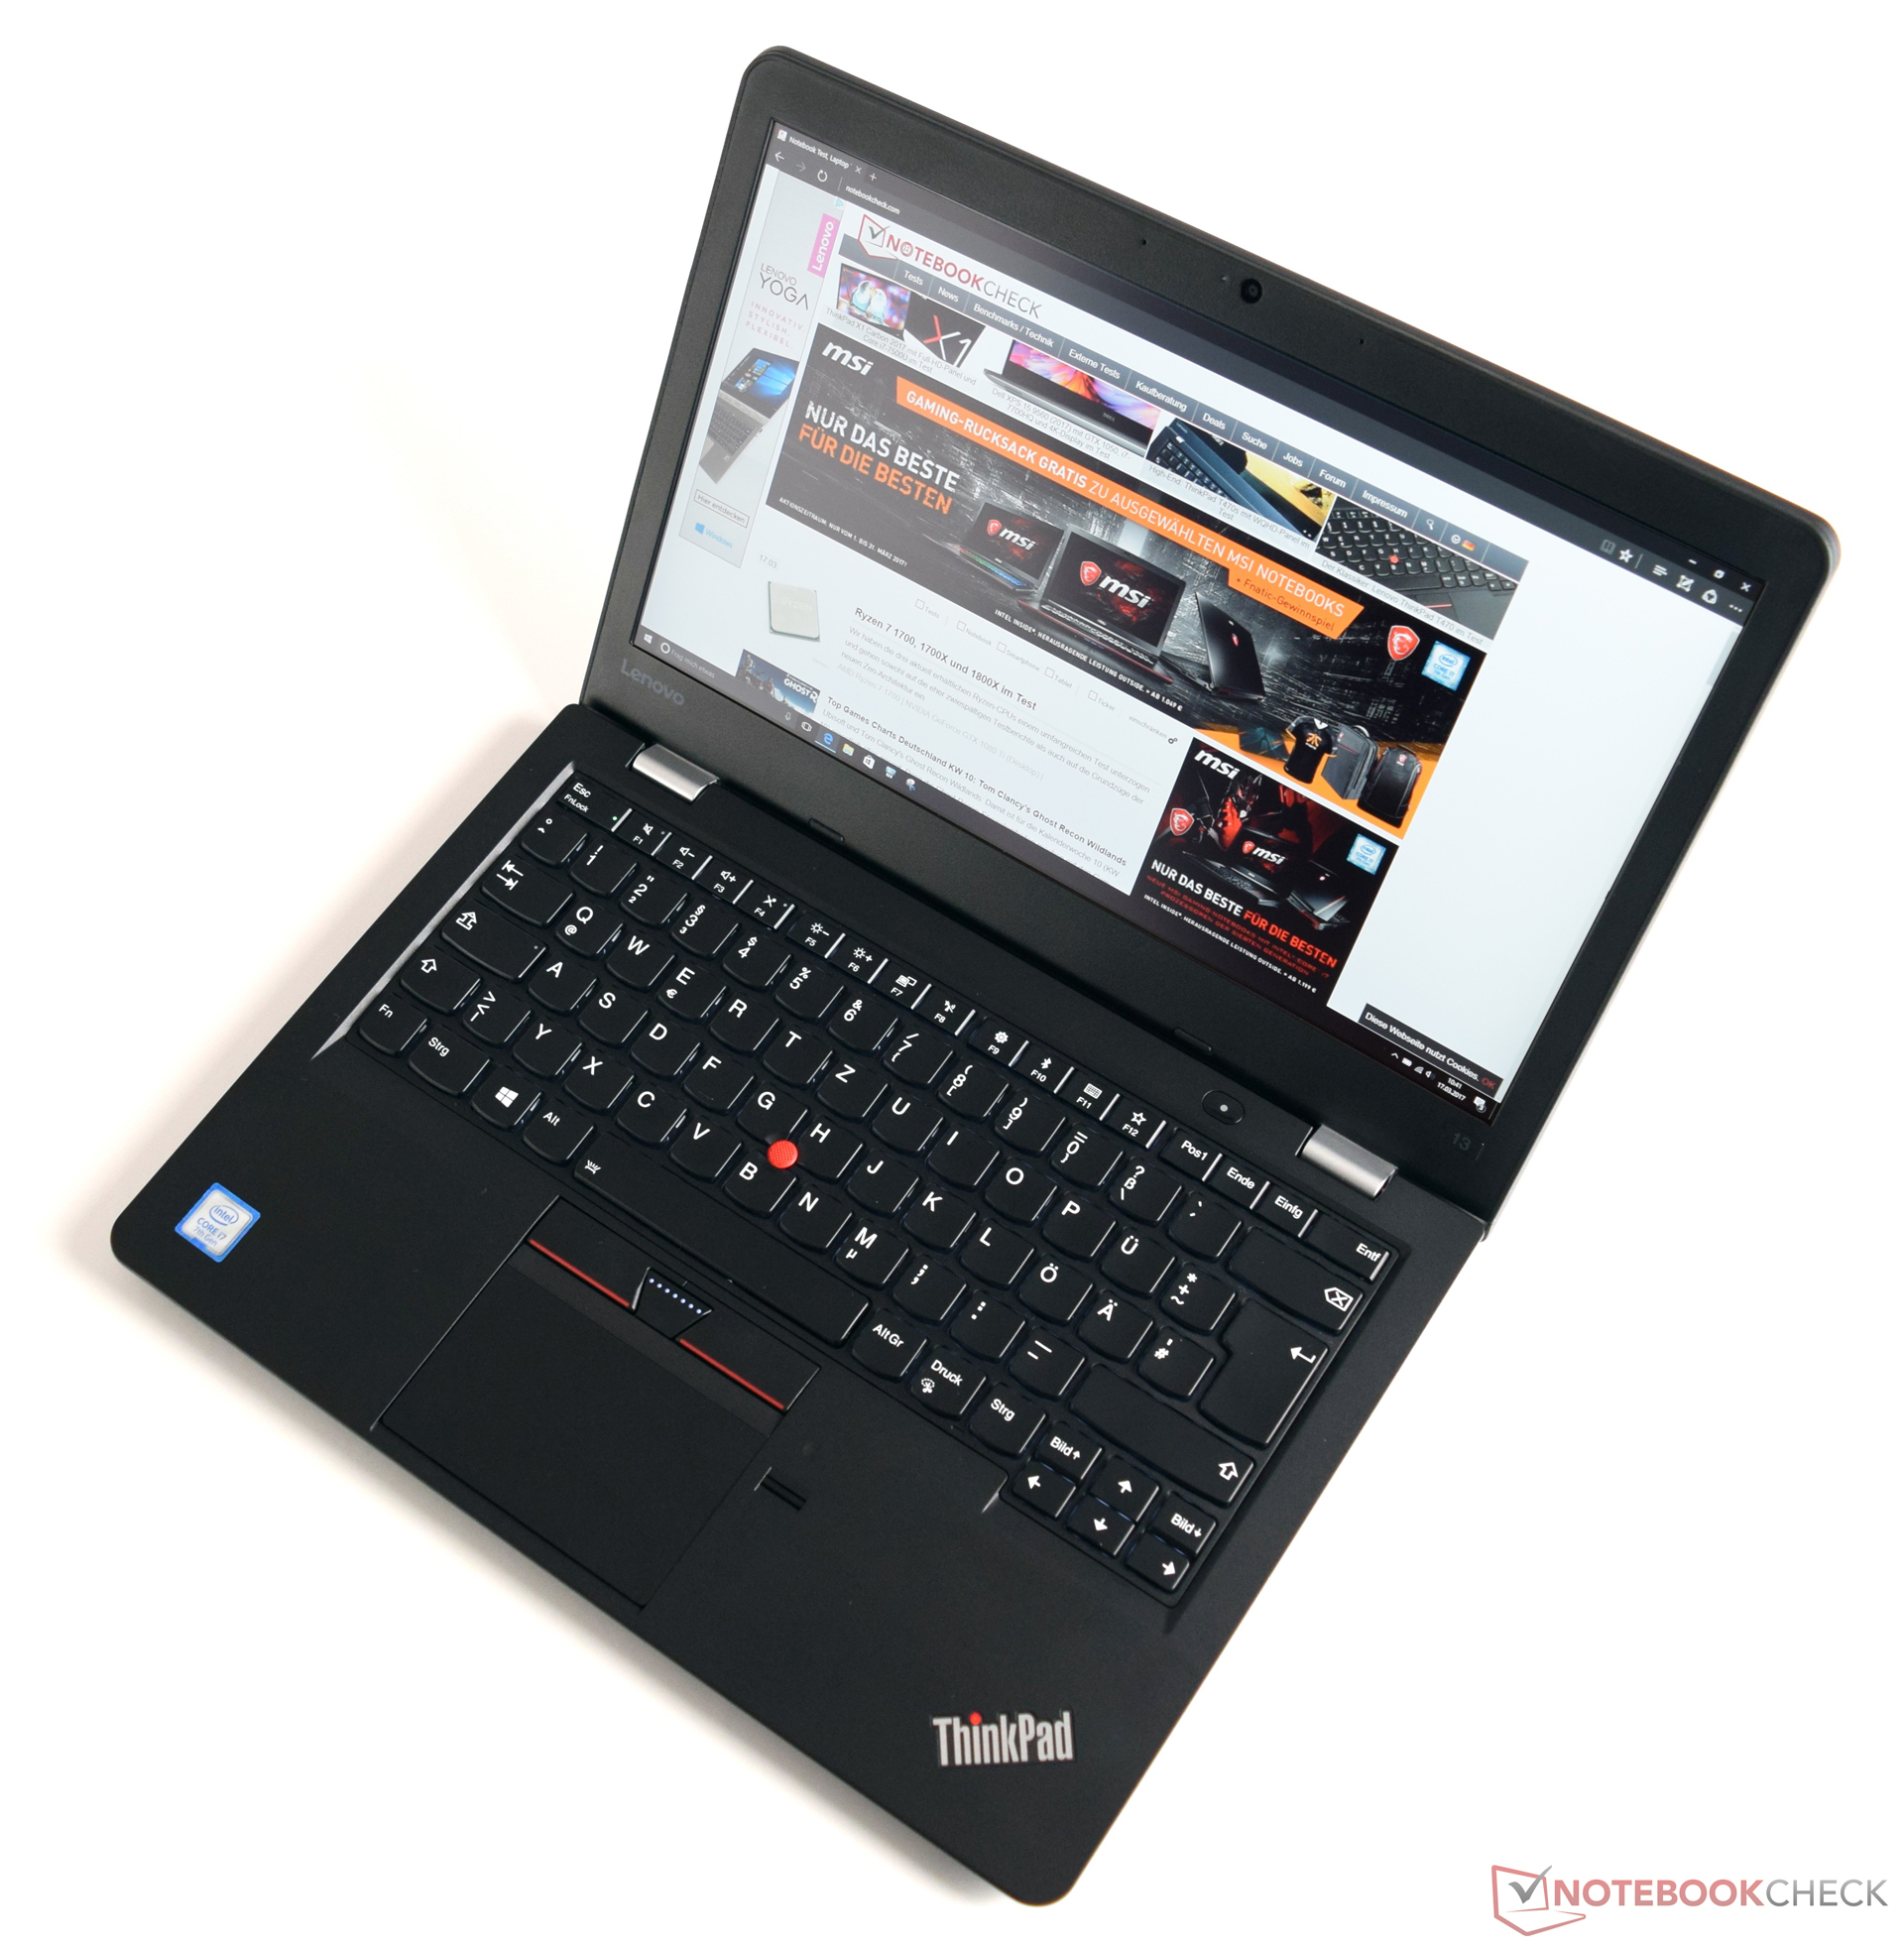
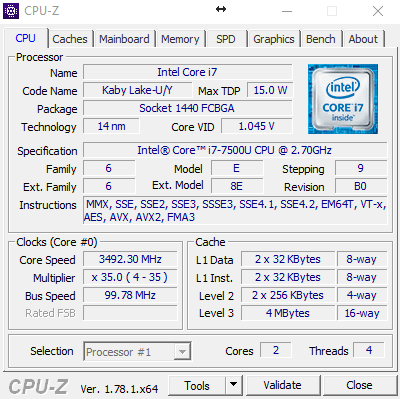
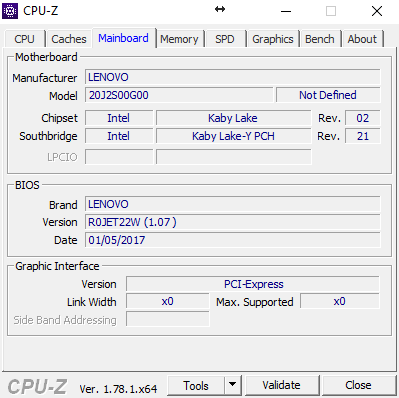
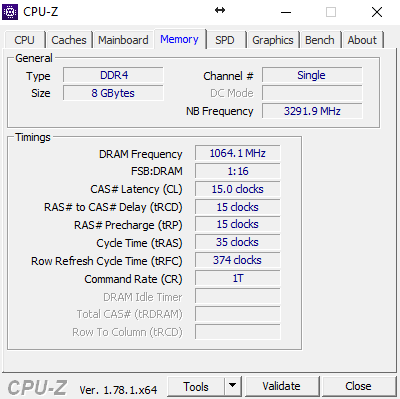
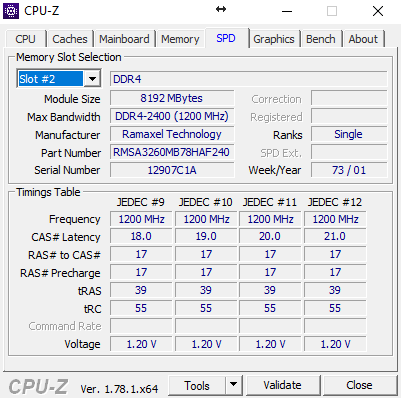
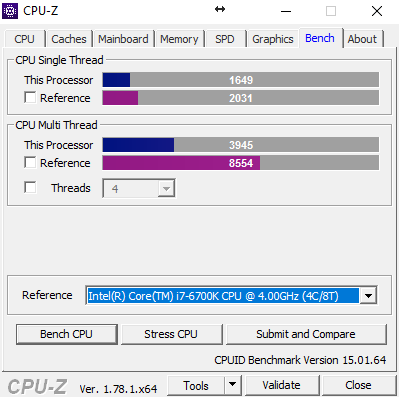
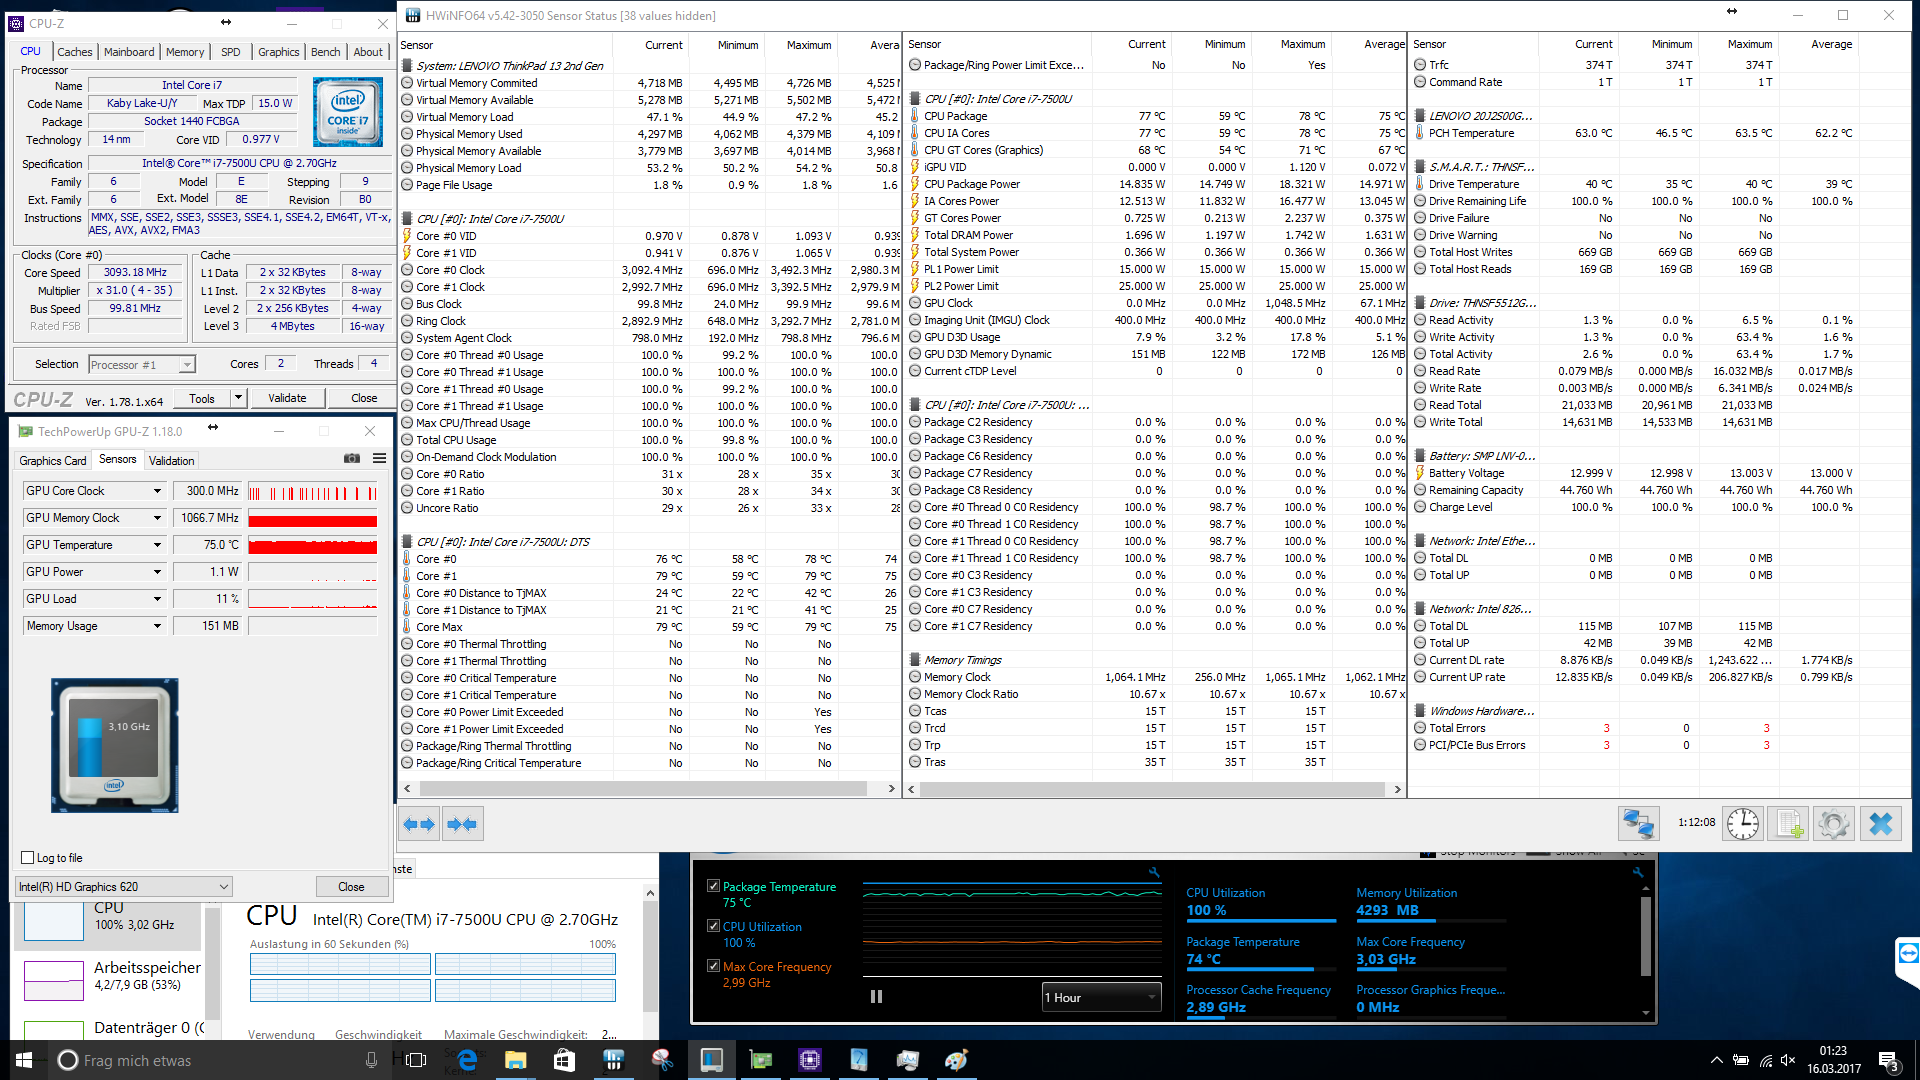
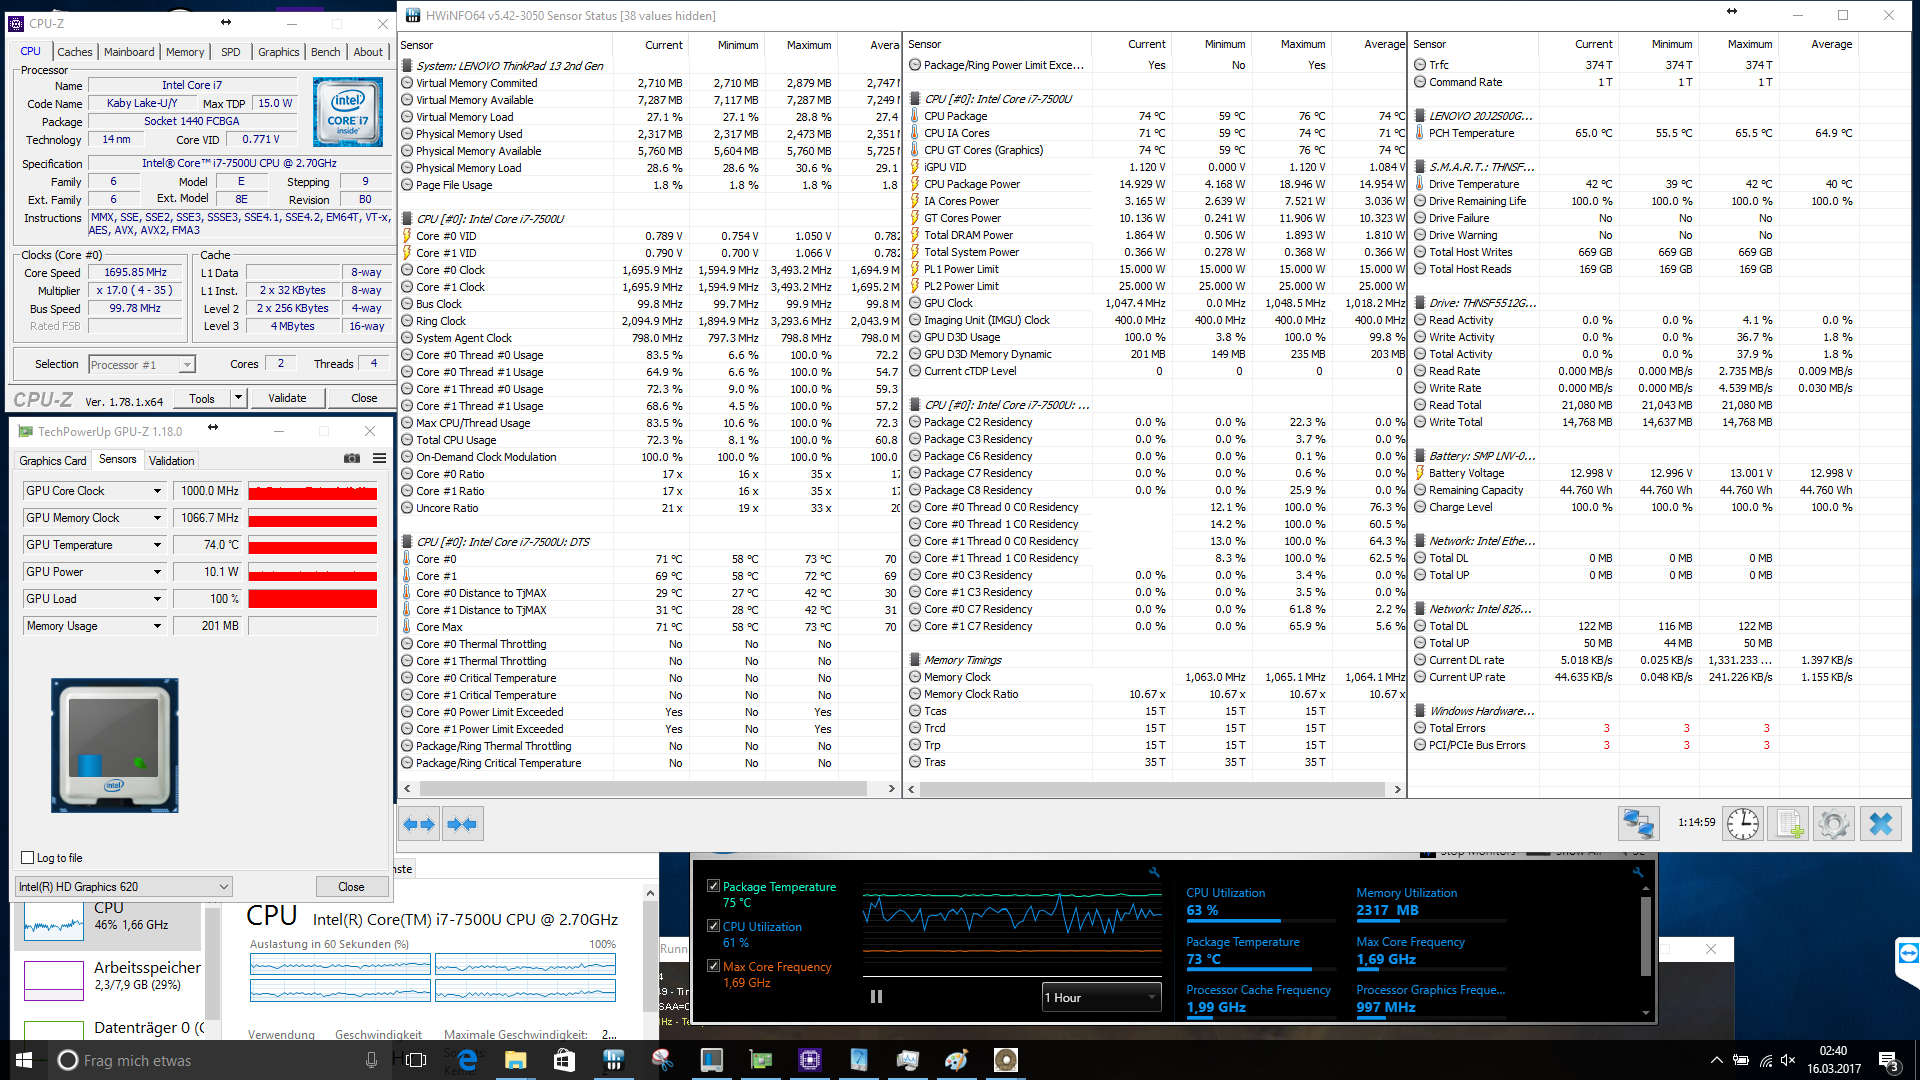
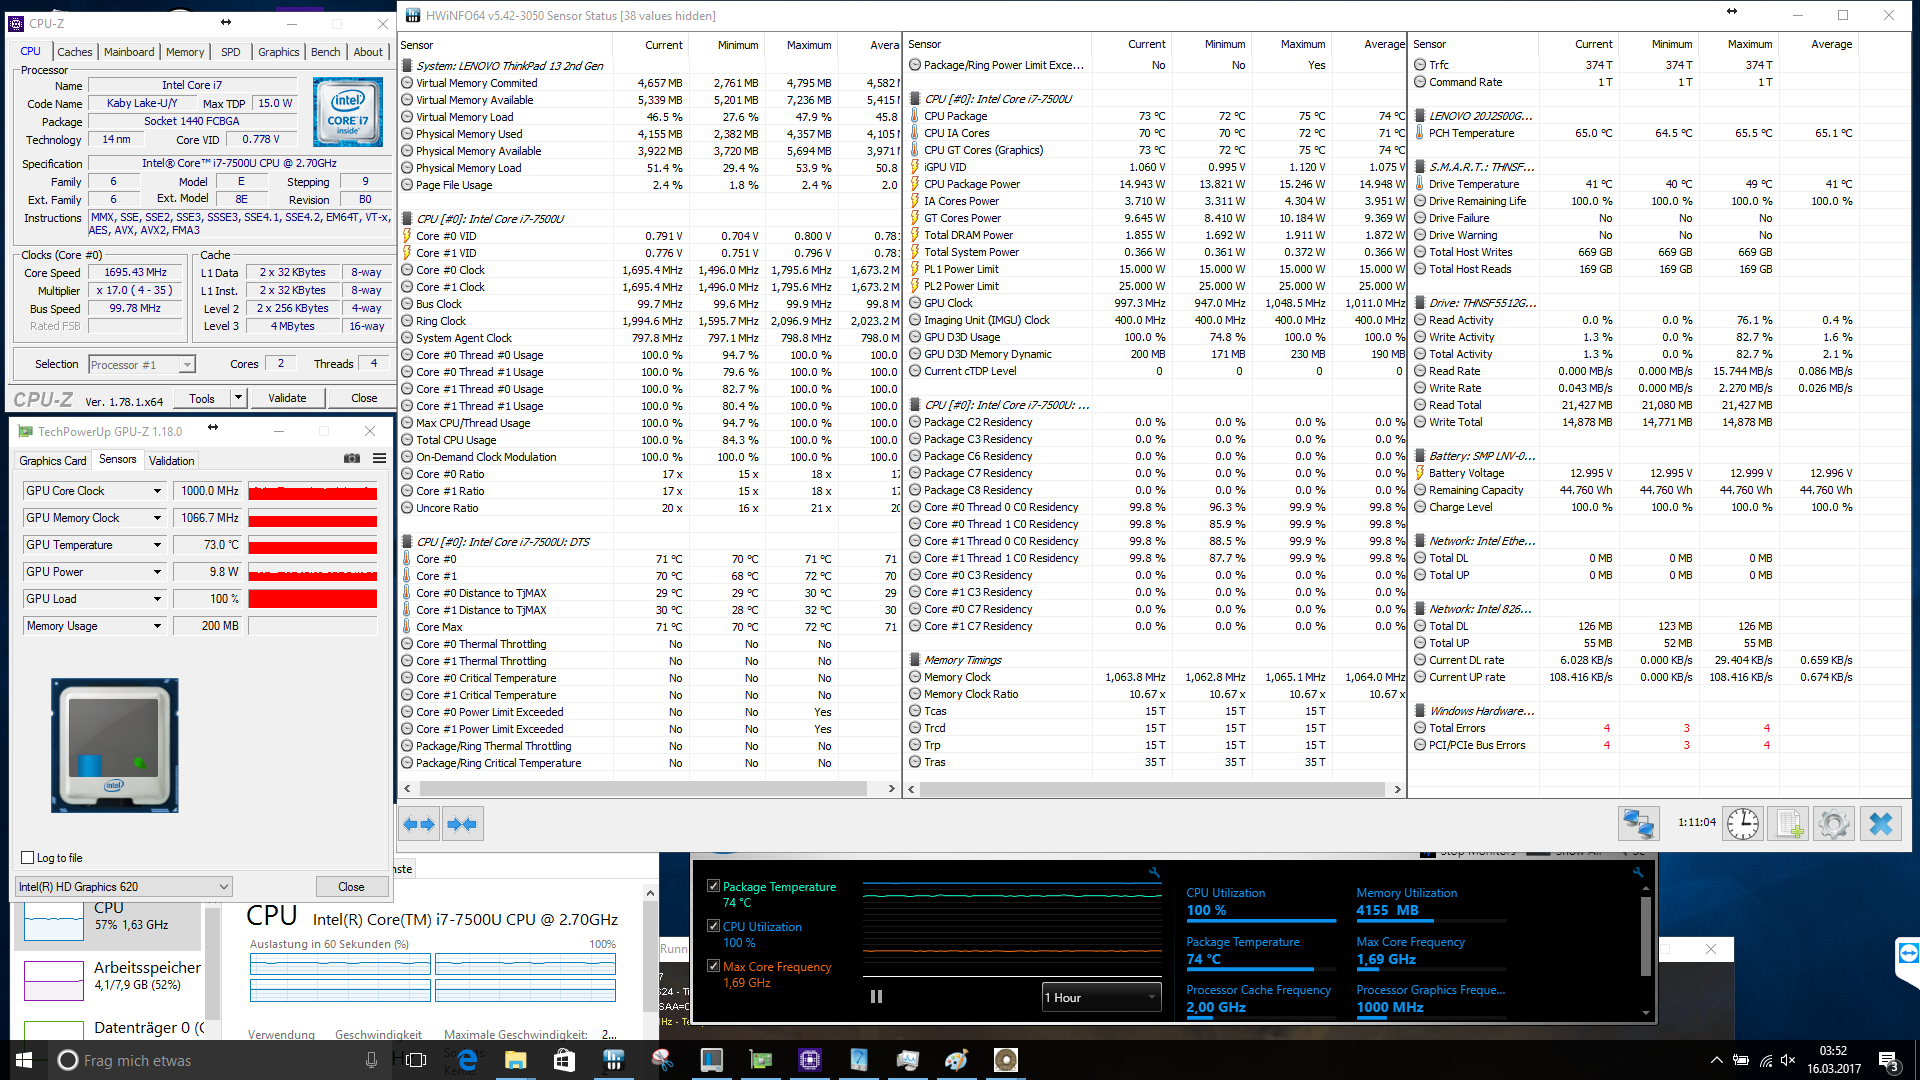
Il Lenovo ThinkPad 13 (2017) è un solido business notebook entry-level. Le perfomance che il laptop presenta giustificano il suo prezzo di acquisto di 1230 euro. Gli acquirenti avranno un veloce processore Intel Core i7-7500U che può sviluppare una grande parte del suo potenziale, anche sotto sforzo (senza throttling termico). L'SSD da 512 GB funziona velocemente ed è ora aggiornato grazie all'interfaccia PCIe. Gli 8 GB di memoria di lavoro DDR4 sono sufficienti per la maggior parte delle applicazioni d'ufficio e può essere espansa quando richiesta tramite un secondo modulo da 512-GB SSD.
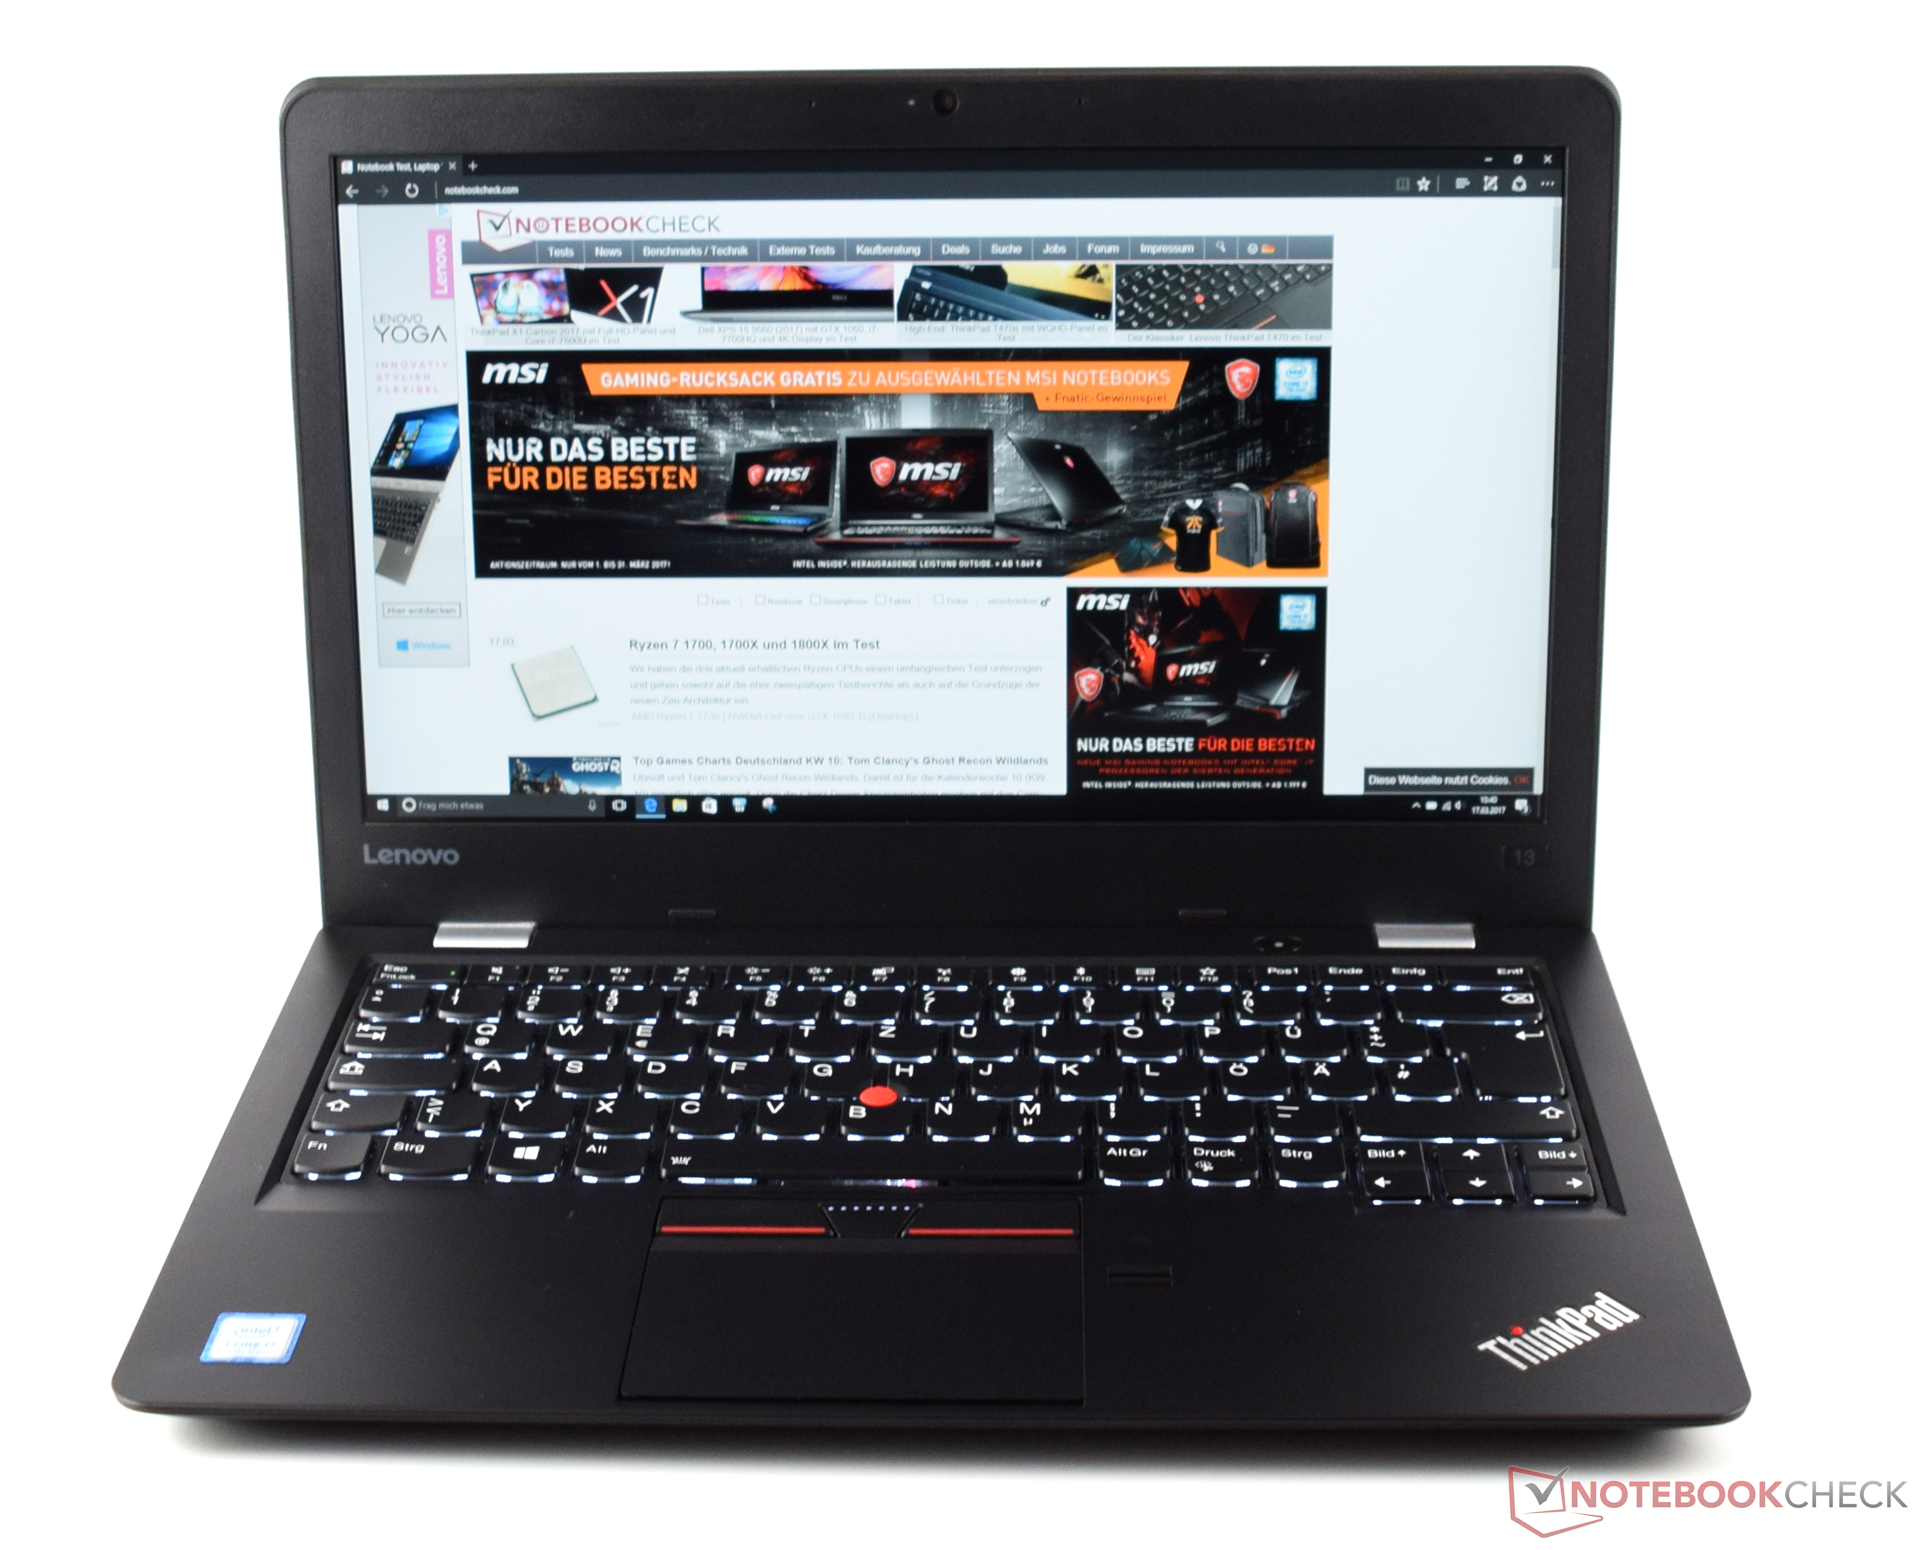
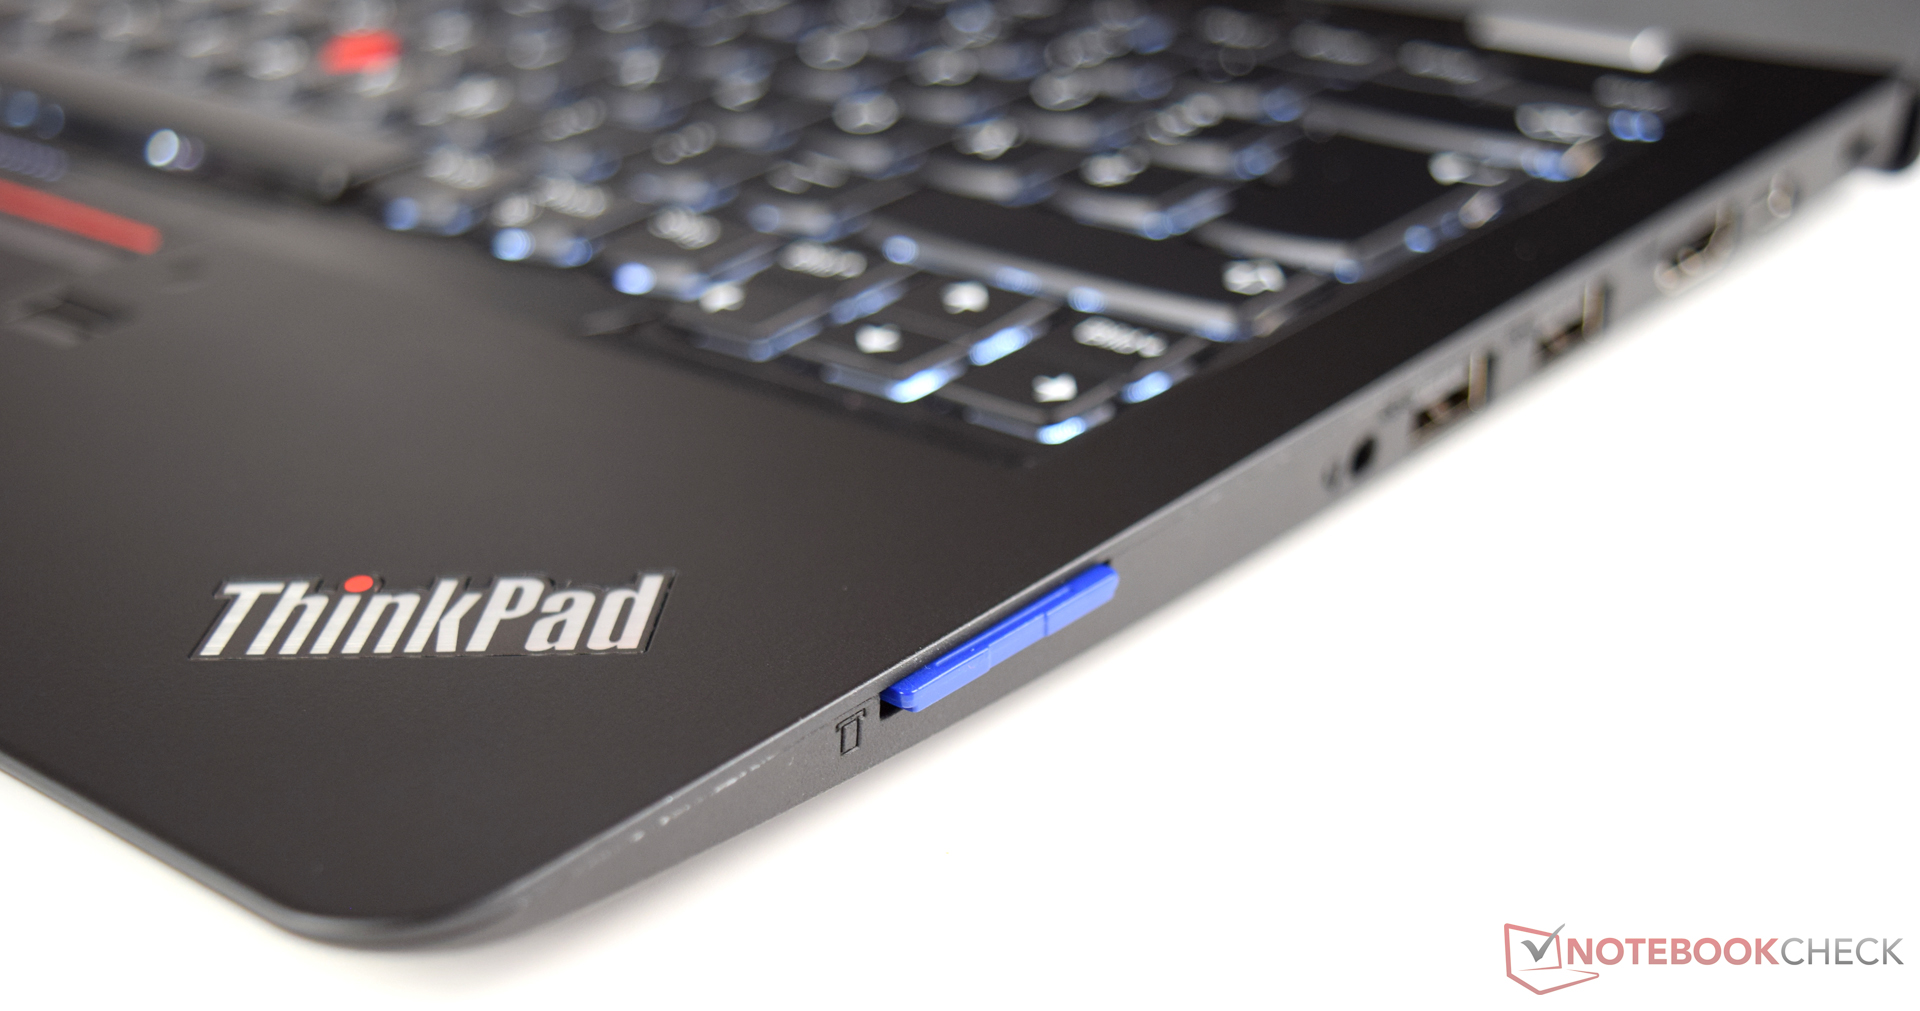
Lenovo ThinkPad 13 (2017) cattura l'attenzione nella categoria bussines soprattutto con il suo buon rapporto prezzo-perfomance. Gli utenti che non puntano su un lettore di SmartCard e sono in grado di accettare la garanzia di 12 mesi dovrebbero dare un'occhiata più da vicino alla linea ThinkPad 13.
Come già detto, la mancanza di un lettore di SmartCard che non è un optional disponibile potrebbe condurre gli acquirenti a dispositivi che offrono questa feature. Complessivamente, ci piace molto di Lenovo ThinkPad 13 (2017). Soprattutto per i suoi dispositivi di input buoni e le buone perfomance generali. Lo schermo è un misto in quanto offre buoni tassi di luminosità da un lato, ma dall'altro ha una bassa copertura della gamma di colore. Tuttavia, questi punti di critica non dovrebbero svolgere un ruolo importante per la decisione di acquisto se il dispositivo deve essere utilizzato come sostituto del desktop con una docking station opzionale.
Nota: si tratta di una recensione breve, con alcune sezioni non tradotte, per la versione integrale in inglese guardate qui.
Lenovo ThinkPad 13-20J2S00G00
- 03/20/2017 v6 (old)
Sebastian Bade