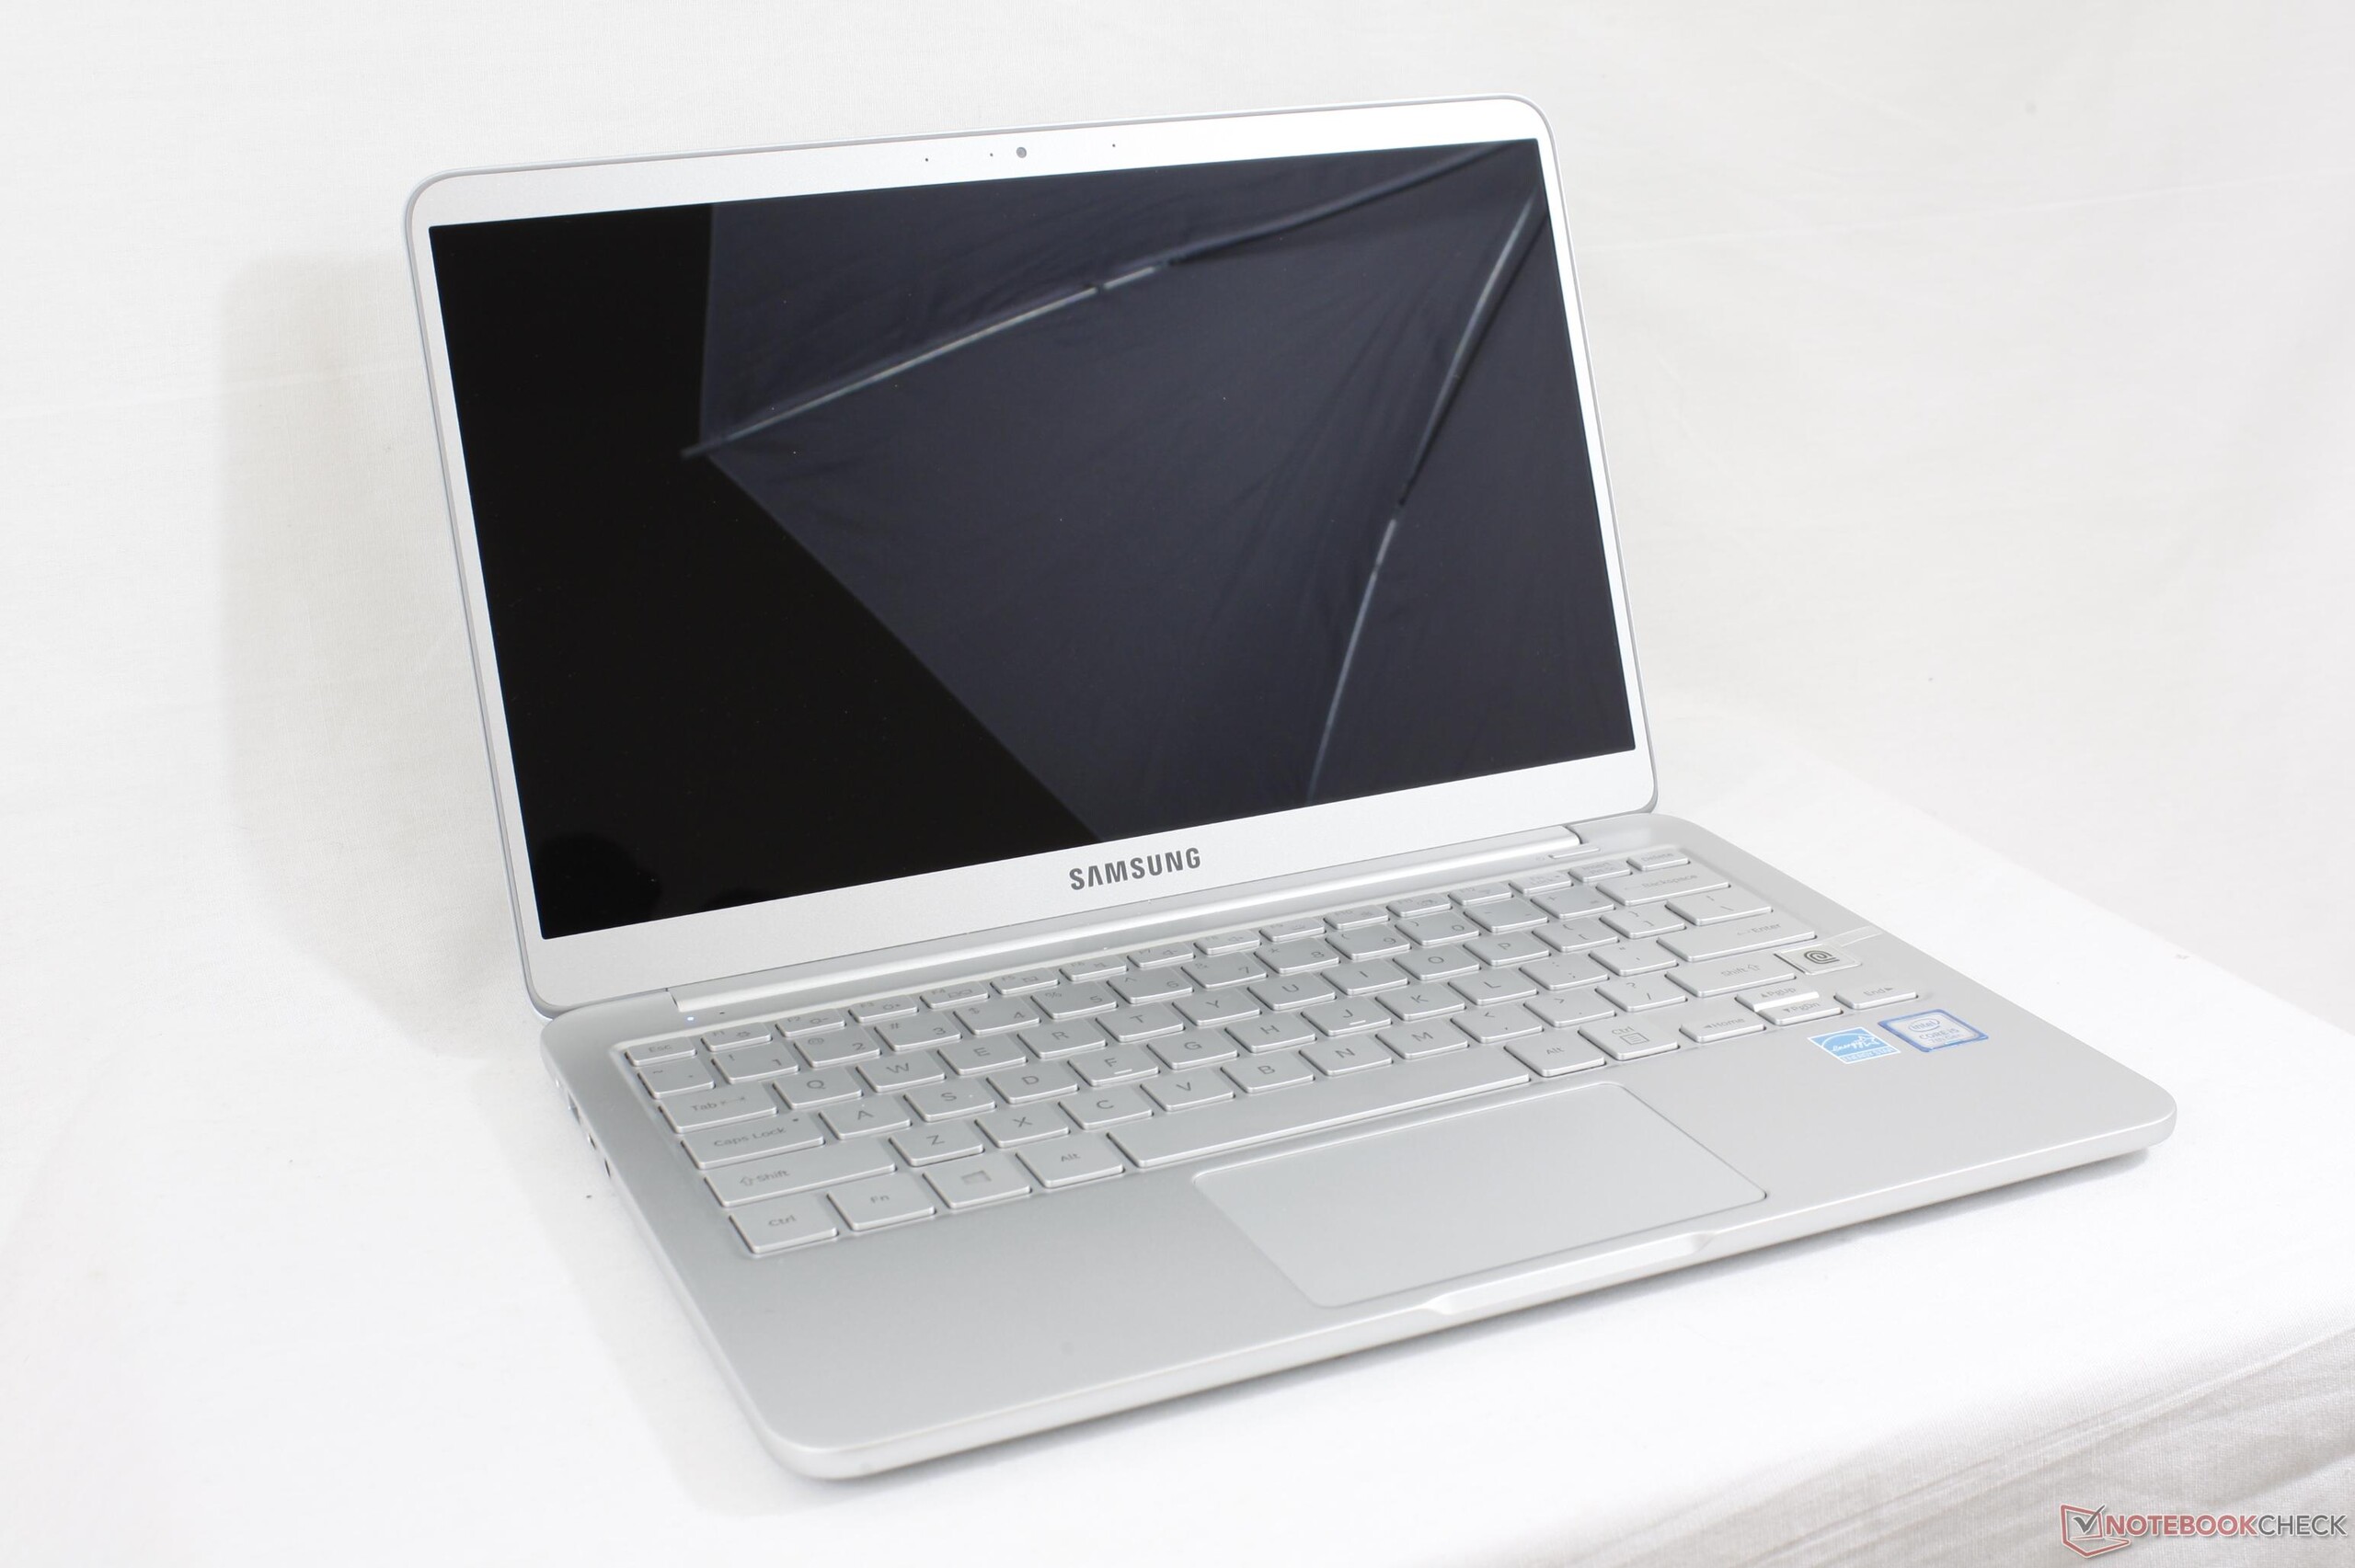
Recensione breve del Portatile Samsung Notebook 9 NP900X3N (i5-7200U, FHD)

| SD Card Reader | |
| average JPG Copy Test (av. of 3 runs) | |
| Dell XPS 13 9360 FHD i5 | |
| Samsung Notebook 9 NP900X5N-X01US | |
| Samsung Notebook 9 NP900X3N-K01US | |
| maximum AS SSD Seq Read Test (1GB) | |
| Dell XPS 13 9360 FHD i5 | |
| Samsung Notebook 9 NP900X3N-K01US | |
| Samsung Notebook 9 NP900X5N-X01US | |
| Networking | |
| iperf3 transmit AX12 | |
| HP Spectre 13-v131ng | |
| Dell XPS 13 9360 FHD i5 | |
| Samsung Notebook 9 NP900X3N-K01US | |
| iperf3 receive AX12 | |
| Samsung Notebook 9 NP900X3N-K01US | |
| Dell XPS 13 9360 FHD i5 | |
| HP Spectre 13-v131ng | |
| |||||||||||||||||||||||||
Distribuzione della luminosità: 90 %
Al centro con la batteria: 510.7 cd/m²
Contrasto: 774:1 (Nero: 0.66 cd/m²)
ΔE ColorChecker Calman: 2.4 | ∀{0.5-29.43 Ø4.71}
ΔE Greyscale Calman: 2.4 | ∀{0.09-98 Ø4.96}
88.1% sRGB (Argyll 1.6.3 3D)
57% AdobeRGB 1998 (Argyll 1.6.3 3D)
64% AdobeRGB 1998 (Argyll 3D)
88.6% sRGB (Argyll 3D)
63.4% Display P3 (Argyll 3D)
Gamma: 2.23
CCT: 6747 K
| Samsung Notebook 9 NP900X3N-K01US ID: BOE06E1, Name: NV133FHB-N31, IPS, 13.3", 1920x1080 | HP Spectre 13-v131ng CMN1374, IPS UWVA, 13.3", 1920x1080 | Dell XPS 13 9360 FHD i5 Sharp SHP1449 LQ133M1, IPS, 13.3", 1920x1080 | Apple MacBook Pro 13 2017 APPA033, IPS, 13.3", 2560x1600 | Lenovo Yoga 910-13IKB-80VF004CGE AU Optronics AUO323D / B139HAN03.2, IPS, 13.9", 3840x2160 | |
|---|---|---|---|---|---|
| Display | 1% | -20% | 35% | -0% | |
| Display P3 Coverage (%) | 63.4 | 64.6 2% | 48.94 -23% | 99.2 56% | 62.2 -2% |
| sRGB Coverage (%) | 88.6 | 88.8 0% | 73.3 -17% | 99.9 13% | 90.1 2% |
| AdobeRGB 1998 Coverage (%) | 64 | 64.8 1% | 50.5 -21% | 87.1 36% | 63.5 -1% |
| Response Times | -4% | 12% | 6% | 9% | |
| Response Time Grey 50% / Grey 80% * (ms) | 41.6 ? | 46 ? -11% | 32.8 ? 21% | 42.8 ? -3% | 46 ? -11% |
| Response Time Black / White * (ms) | 34 ? | 33 ? 3% | 33.2 ? 2% | 28.8 ? 15% | 24 ? 29% |
| PWM Frequency (Hz) | 210.1 ? | ||||
| Screen | -26% | -30% | 29% | -49% | |
| Brightness middle (cd/m²) | 510.7 | 404 -21% | 351.2 -31% | 588 15% | 348 -32% |
| Brightness (cd/m²) | 481 | 382 -21% | 325 -32% | 561 17% | 310 -36% |
| Brightness Distribution (%) | 90 | 91 1% | 89 -1% | 92 2% | 80 -11% |
| Black Level * (cd/m²) | 0.66 | 0.35 47% | 0.195 70% | 0.45 32% | 0.25 62% |
| Contrast (:1) | 774 | 1154 49% | 1801 133% | 1307 69% | 1392 80% |
| Colorchecker dE 2000 * | 2.4 | 5.37 -124% | 7.4 -208% | 1.7 29% | 7.86 -228% |
| Colorchecker dE 2000 max. * | 7.3 | 9.46 -30% | 9.08 -24% | 3.5 52% | 13.43 -84% |
| Greyscale dE 2000 * | 2.4 | 6.44 -168% | 6.71 -180% | 1.9 21% | 8.25 -244% |
| Gamma | 2.23 99% | 2.52 87% | 2.74 80% | 2.33 94% | 2.05 107% |
| CCT | 6747 96% | 6738 96% | 7222 90% | 6738 96% | 6834 95% |
| Color Space (Percent of AdobeRGB 1998) (%) | 57 | 58 2% | 50.48 -11% | 77.92 37% | 58 2% |
| Color Space (Percent of sRGB) (%) | 88.1 | 89 1% | 73.31 -17% | 99.94 13% | 90 2% |
| Media totale (Programma / Settaggio) | -10% /
-18% | -13% /
-23% | 23% /
27% | -13% /
-31% |
* ... Meglio usare valori piccoli
Tempi di risposta del Display
| ↔ Tempi di risposta dal Nero al Bianco | ||
|---|---|---|
| 34 ms ... aumenta ↗ e diminuisce ↘ combinato | ↗ 20 ms Incremento | 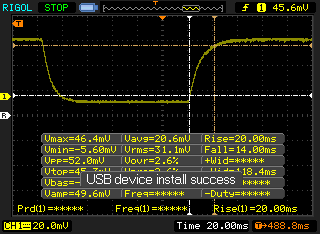 |
| ↘ 14 ms Calo | ||
| Lo schermo mostra tempi di risposta lenti nei nostri tests e sarà insoddisfacente per i gamers. In confronto, tutti i dispositivi di test variano da 0.1 (minimo) a 240 (massimo) ms. » 91 % di tutti i dispositivi è migliore. Questo significa che i tempi di risposta rilevati sono peggiori rispetto alla media di tutti i dispositivi testati (19.8 ms). | ||
| ↔ Tempo di risposta dal 50% Grigio all'80% Grigio | ||
| 41.6 ms ... aumenta ↗ e diminuisce ↘ combinato | ↗ 22.8 ms Incremento | 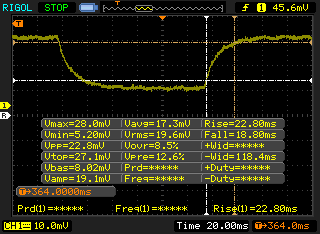 |
| ↘ 18.8 ms Calo | ||
| Lo schermo mostra tempi di risposta lenti nei nostri tests e sarà insoddisfacente per i gamers. In confronto, tutti i dispositivi di test variano da 0.165 (minimo) a 636 (massimo) ms. » 67 % di tutti i dispositivi è migliore. Questo significa che i tempi di risposta rilevati sono peggiori rispetto alla media di tutti i dispositivi testati (30.9 ms). | ||
Sfarfallio dello schermo / PWM (Pulse-Width Modulation)
| flickering dello schermo / PWM rilevato | 210.1 Hz | ≤ 99 % settaggio luminosita' | 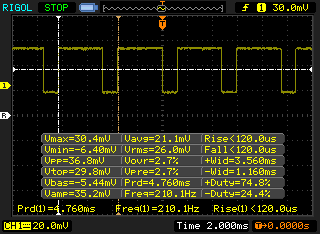 |
Il display sfarfalla a 210.1 Hz (Probabilmente a causa dell'uso di PWM) Flickering rilevato ad una luminosita' di 99 % o inferiore. Non dovrebbe verificarsi flickering o PWM sopra questo valore di luminosita'. La frequenza di 210.1 Hz è relativamente bassa, quindi gli utenti sensibili potrebbero notare il flickering ed accusare stanchezza agli occhi a questo livello di luminosità e a livelli inferiori. In confronto: 52 % di tutti i dispositivi testati non utilizza PWM per ridurre la luminosita' del display. Se è rilevato PWM, una media di 7744 (minimo: 5 - massimo: 343500) Hz è stata rilevata. | |||
| wPrime 2.10 - 1024m | |
| Toshiba Tecra A50-C1510W10 | |
| Apple MacBook Pro 13 2017 Touchbar i5 | |
| Samsung Notebook 9 NP900X3N-K01US | |
| HP Envy 13-ad065nr | |
| Samsung Notebook 9 NP900X5N-X01US | |
* ... Meglio usare valori piccoli
| PCMark 8 | |
| Home Score Accelerated v2 | |
| Samsung Notebook 9 NP900X5N-X01US | |
| HP Spectre 13-v131ng | |
| Samsung Notebook 9 NP900X3N-K01US | |
| Dell XPS 13 9360 FHD i5 | |
| Work Score Accelerated v2 | |
| HP Spectre 13-v131ng | |
| Samsung Notebook 9 NP900X5N-X01US | |
| Samsung Notebook 9 NP900X3N-K01US | |
| Dell XPS 13 9360 FHD i5 | |
| Creative Score Accelerated v2 | |
| Samsung Notebook 9 NP900X5N-X01US | |
| HP Spectre 13-v131ng | |
| Samsung Notebook 9 NP900X3N-K01US | |
| Dell XPS 13 9360 FHD i5 | |
| PCMark 8 Home Score Accelerated v2 | 3728 punti | |
| PCMark 8 Creative Score Accelerated v2 | 4577 punti | |
| PCMark 8 Work Score Accelerated v2 | 4786 punti | |
| PCMark 10 Score | 3449 punti | |
Aiuto | ||
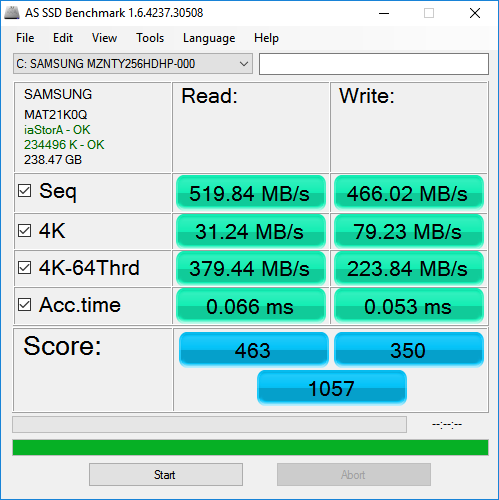
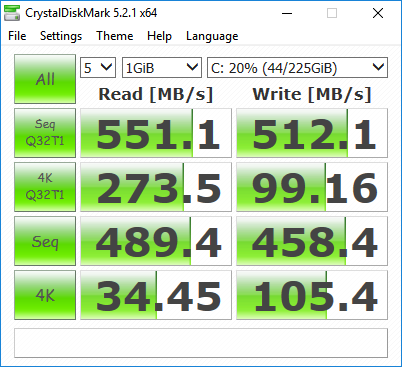
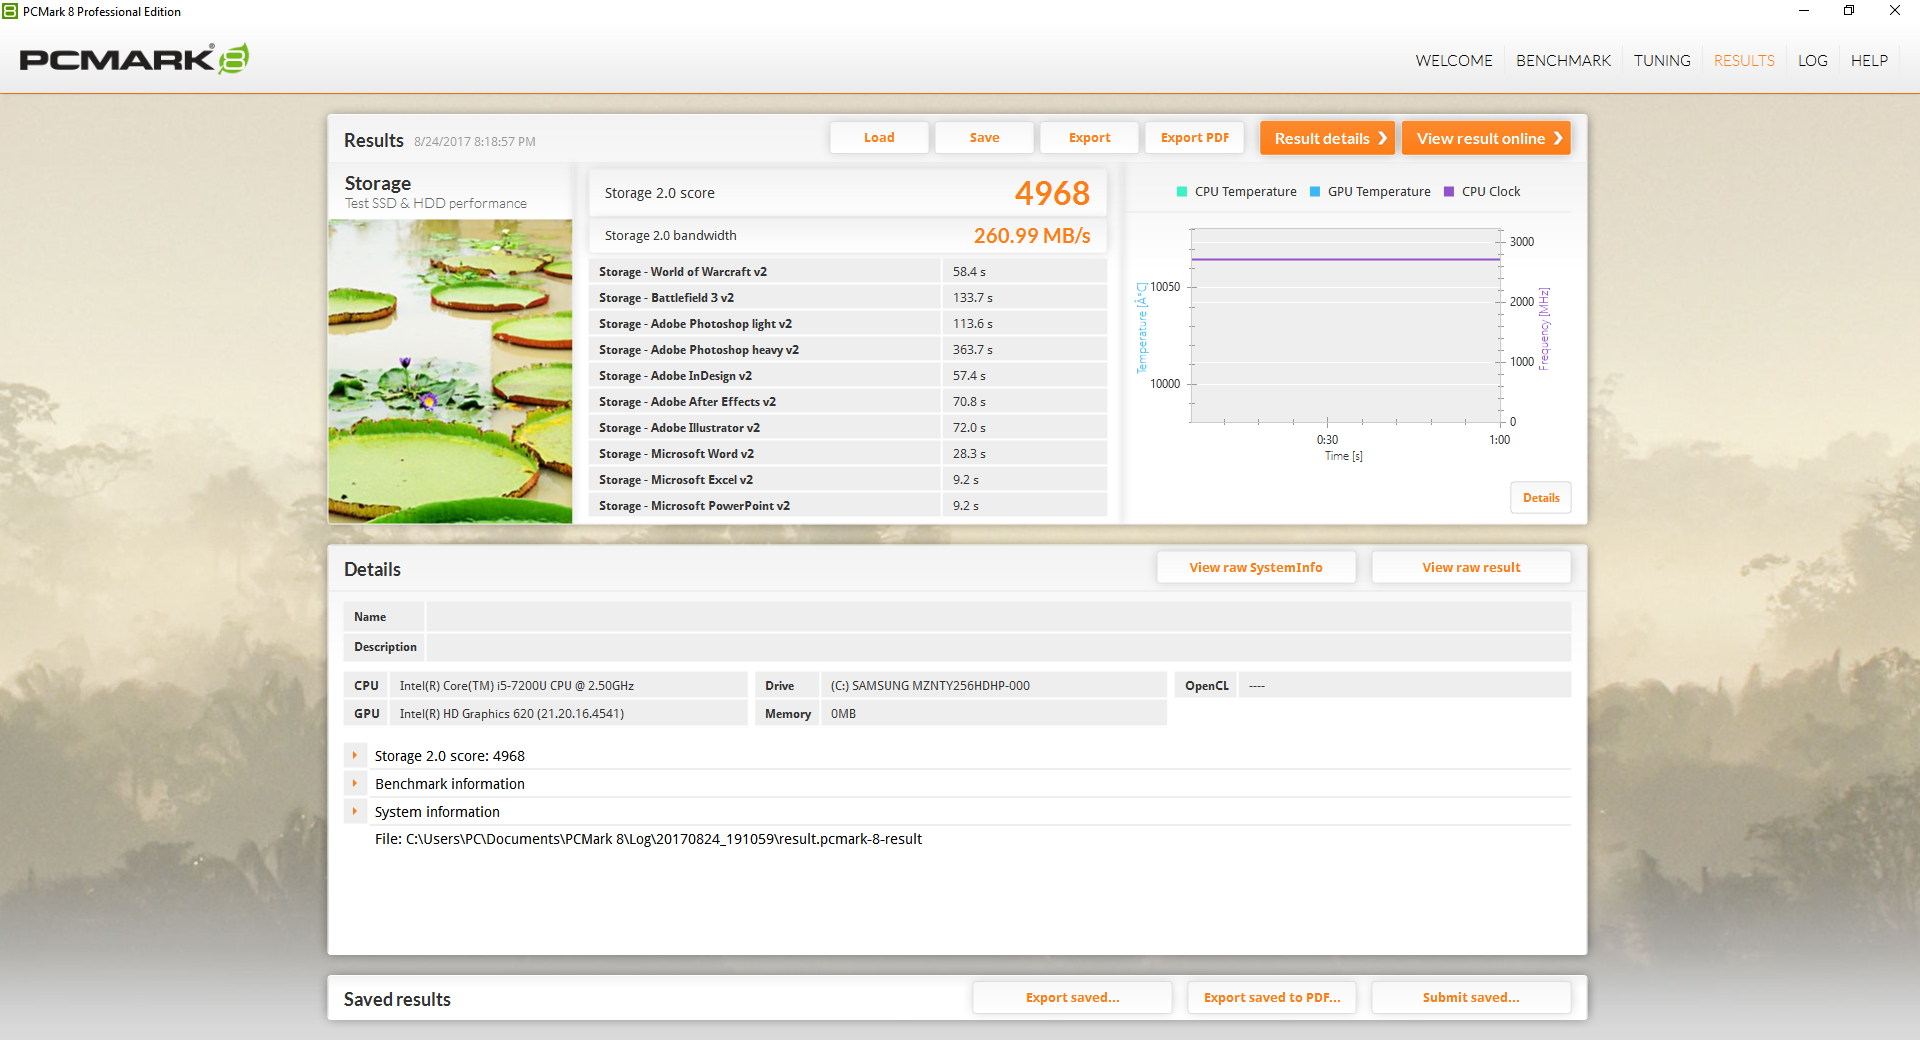
| Samsung Notebook 9 NP900X3N-K01US Samsung CM871a MZNTY256HDHP | HP Spectre 13-v131ng Samsung PM961 NVMe MZVLW512HMJP | Dell XPS 13 9360 FHD i5 Toshiba NVMe THNSN5256GPUK | Lenovo Yoga 910-13IKB-80VF004CGE Samsung PM951 NVMe MZVLV512 | Asus Zenbook 3 UX390UA-GS041T SK Hynix Canvas SC300 512GB M.2 (HFS512G39MND) | |
|---|---|---|---|---|---|
| AS SSD | 155% | 33% | 71% | -12% | |
| Copy Game MB/s (MB/s) | 186.8 | 397.9 113% | 390 109% | 189.4 1% | |
| Copy Program MB/s (MB/s) | 213 | 426 100% | 188 -12% | 204.3 -4% | |
| Copy ISO MB/s (MB/s) | 335.9 | 720 114% | 283.3 -16% | 293.5 -13% | |
| Score Total (Points) | 1057 | 3617 242% | 1607 52% | 1865 76% | 1056 0% |
| Score Write (Points) | 350 | 1115 219% | 327 -7% | 611 75% | 374 7% |
| Score Read (Points) | 463 | 1654 257% | 870 88% | 850 84% | 448 -3% |
| Access Time Write * (ms) | 0.053 | 0.026 51% | 0.035 34% | 0.028 47% | 0.11 -108% |
| Access Time Read * (ms) | 0.066 | 0.042 36% | 0.055 17% | 0.034 48% | 0.076 -15% |
| 4K-64 Write (MB/s) | 223.8 | 862 285% | 197.7 -12% | 422.2 89% | 271.4 21% |
| 4K-64 Read (MB/s) | 379.4 | 1465 286% | 723 91% | 671 77% | 370.3 -2% |
| 4K Write (MB/s) | 79.2 | 134.4 70% | 92 16% | 132.9 68% | 56.8 -28% |
| 4K Read (MB/s) | 31.24 | 56.4 81% | 29.52 -6% | 39.92 28% | 25.89 -17% |
| Seq Write (MB/s) | 466 | 1190 155% | 372.8 -20% | 560 20% | 463.4 -1% |
| Seq Read (MB/s) | 520 | 1325 155% | 1179 127% | 1389 167% | 514 -1% |
* ... Meglio usare valori piccoli

| 3DMark 11 Performance | 1695 punti | |
| 3DMark Ice Storm Standard Score | 64405 punti | |
| 3DMark Cloud Gate Standard Score | 6418 punti | |
| 3DMark Fire Strike Score | 892 punti | |
| 3DMark Fire Strike Extreme Score | 411 punti | |
Aiuto | ||
| basso | medio | alto | ultra | |
|---|---|---|---|---|
| BioShock Infinite (2013) | 42.6 | 26 | 24.7 | 7.6 |
| Rise of the Tomb Raider (2016) | 20 |
| CPU Clock (GHz) | GPU Clock (MHz) | Average CPU Temperature (°C) | |
| Prime95 Stress | 2.3 - 3.0 | -- | 78 - 95 |
| FurMark Stress | -- | 500 - 900 | 72 - 85 |
| Prime95 + FurMark Stress | 0.9 - 1.4 | 500 - 900 | 71 - 84 |
Emissions

Rumorosità
| Idle |
| 28.4 / 28.4 / 28.4 dB(A) |
| Sotto carico |
| 33.2 / 35.2 dB(A) |
 | ||
30 dB silenzioso 40 dB(A) udibile 50 dB(A) rumoroso |
||
min: | ||
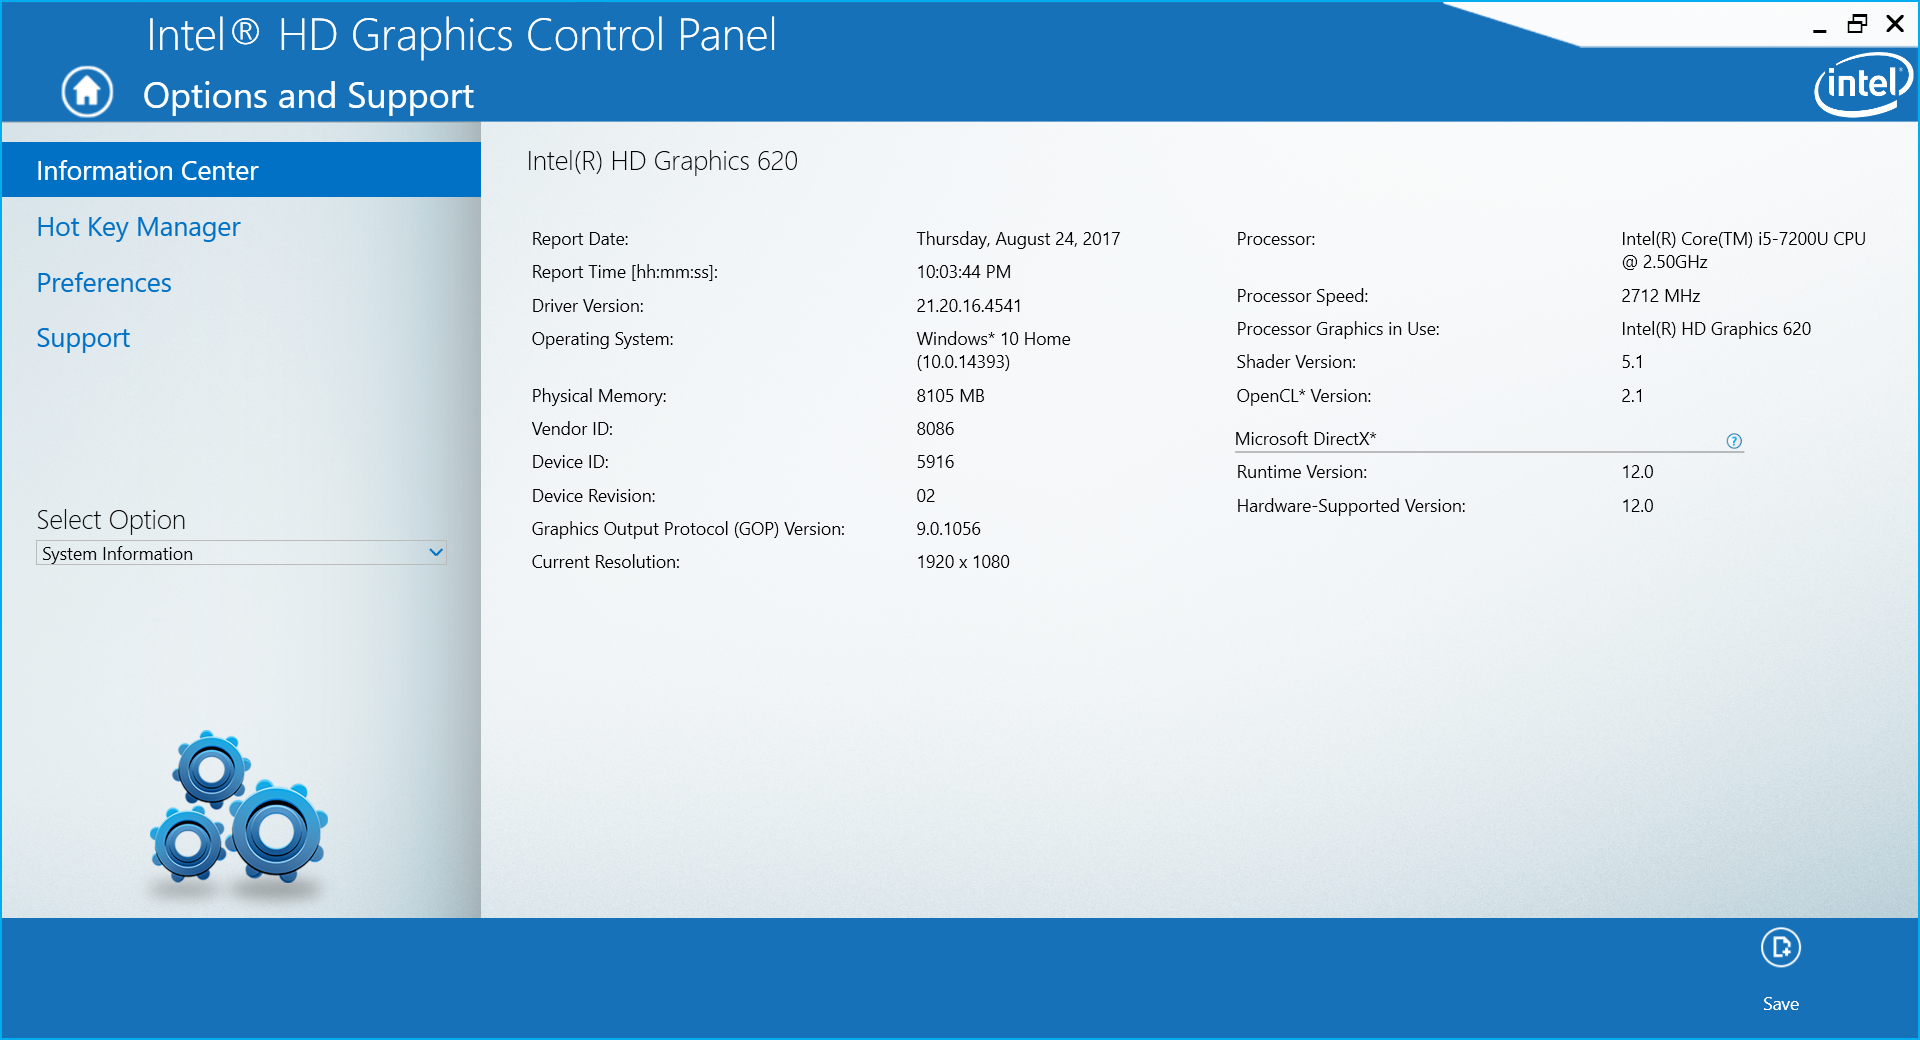
| Samsung Notebook 9 NP900X3N-K01US HD Graphics 620, i5-7200U, Samsung CM871a MZNTY256HDHP | HP Spectre 13-v131ng HD Graphics 620, i7-7500U, Samsung PM961 NVMe MZVLW512HMJP | Dell XPS 13 9360 FHD i5 HD Graphics 620, i5-7200U, Toshiba NVMe THNSN5256GPUK | Lenovo Yoga 910-13IKB-80VF004CGE HD Graphics 620, i7-7500U, Samsung PM951 NVMe MZVLV512 | Apple MacBook Pro 13 2017 Iris Plus Graphics 640, i5-7360U, Apple SSD AP0128 | Asus Zenbook 3 UX390UA-GS041T HD Graphics 620, i5-7200U, SK Hynix Canvas SC300 512GB M.2 (HFS512G39MND) | |
|---|---|---|---|---|---|---|
| Noise | -10% | 1% | -11% | -6% | -10% | |
| off /ambiente * (dB) | 28.4 | 30.4 -7% | 31.7 -12% | 30.2 -6% | 30.7 -8% | |
| Idle Minimum * (dB) | 28.4 | 30.4 -7% | 28.9 -2% | 31.7 -12% | 30.2 -6% | 30.7 -8% |
| Idle Average * (dB) | 28.4 | 30.4 -7% | 28.9 -2% | 31.7 -12% | 30.2 -6% | 30.7 -8% |
| Idle Maximum * (dB) | 28.4 | 30.4 -7% | 28.9 -2% | 31.7 -12% | 30.2 -6% | 30.9 -9% |
| Load Average * (dB) | 33.2 | 40 -20% | 30.9 7% | 38.4 -16% | 32.9 1% | 38.7 -17% |
| Load Maximum * (dB) | 35.2 | 40 -14% | 33.5 5% | 34.7 1% | 39.3 -12% | 38.9 -11% |
* ... Meglio usare valori piccoli
(+) La temperatura massima sul lato superiore è di 39.8 °C / 104 F, rispetto alla media di 35.9 °C / 97 F, che varia da 21.4 a 59 °C per questa classe Subnotebook.
(+) Il lato inferiore si riscalda fino ad un massimo di 38.8 °C / 102 F, rispetto alla media di 39.2 °C / 103 F
(+) In idle, la temperatura media del lato superiore è di 24.2 °C / 76 F, rispetto alla media deld ispositivo di 30.8 °C / 87 F.
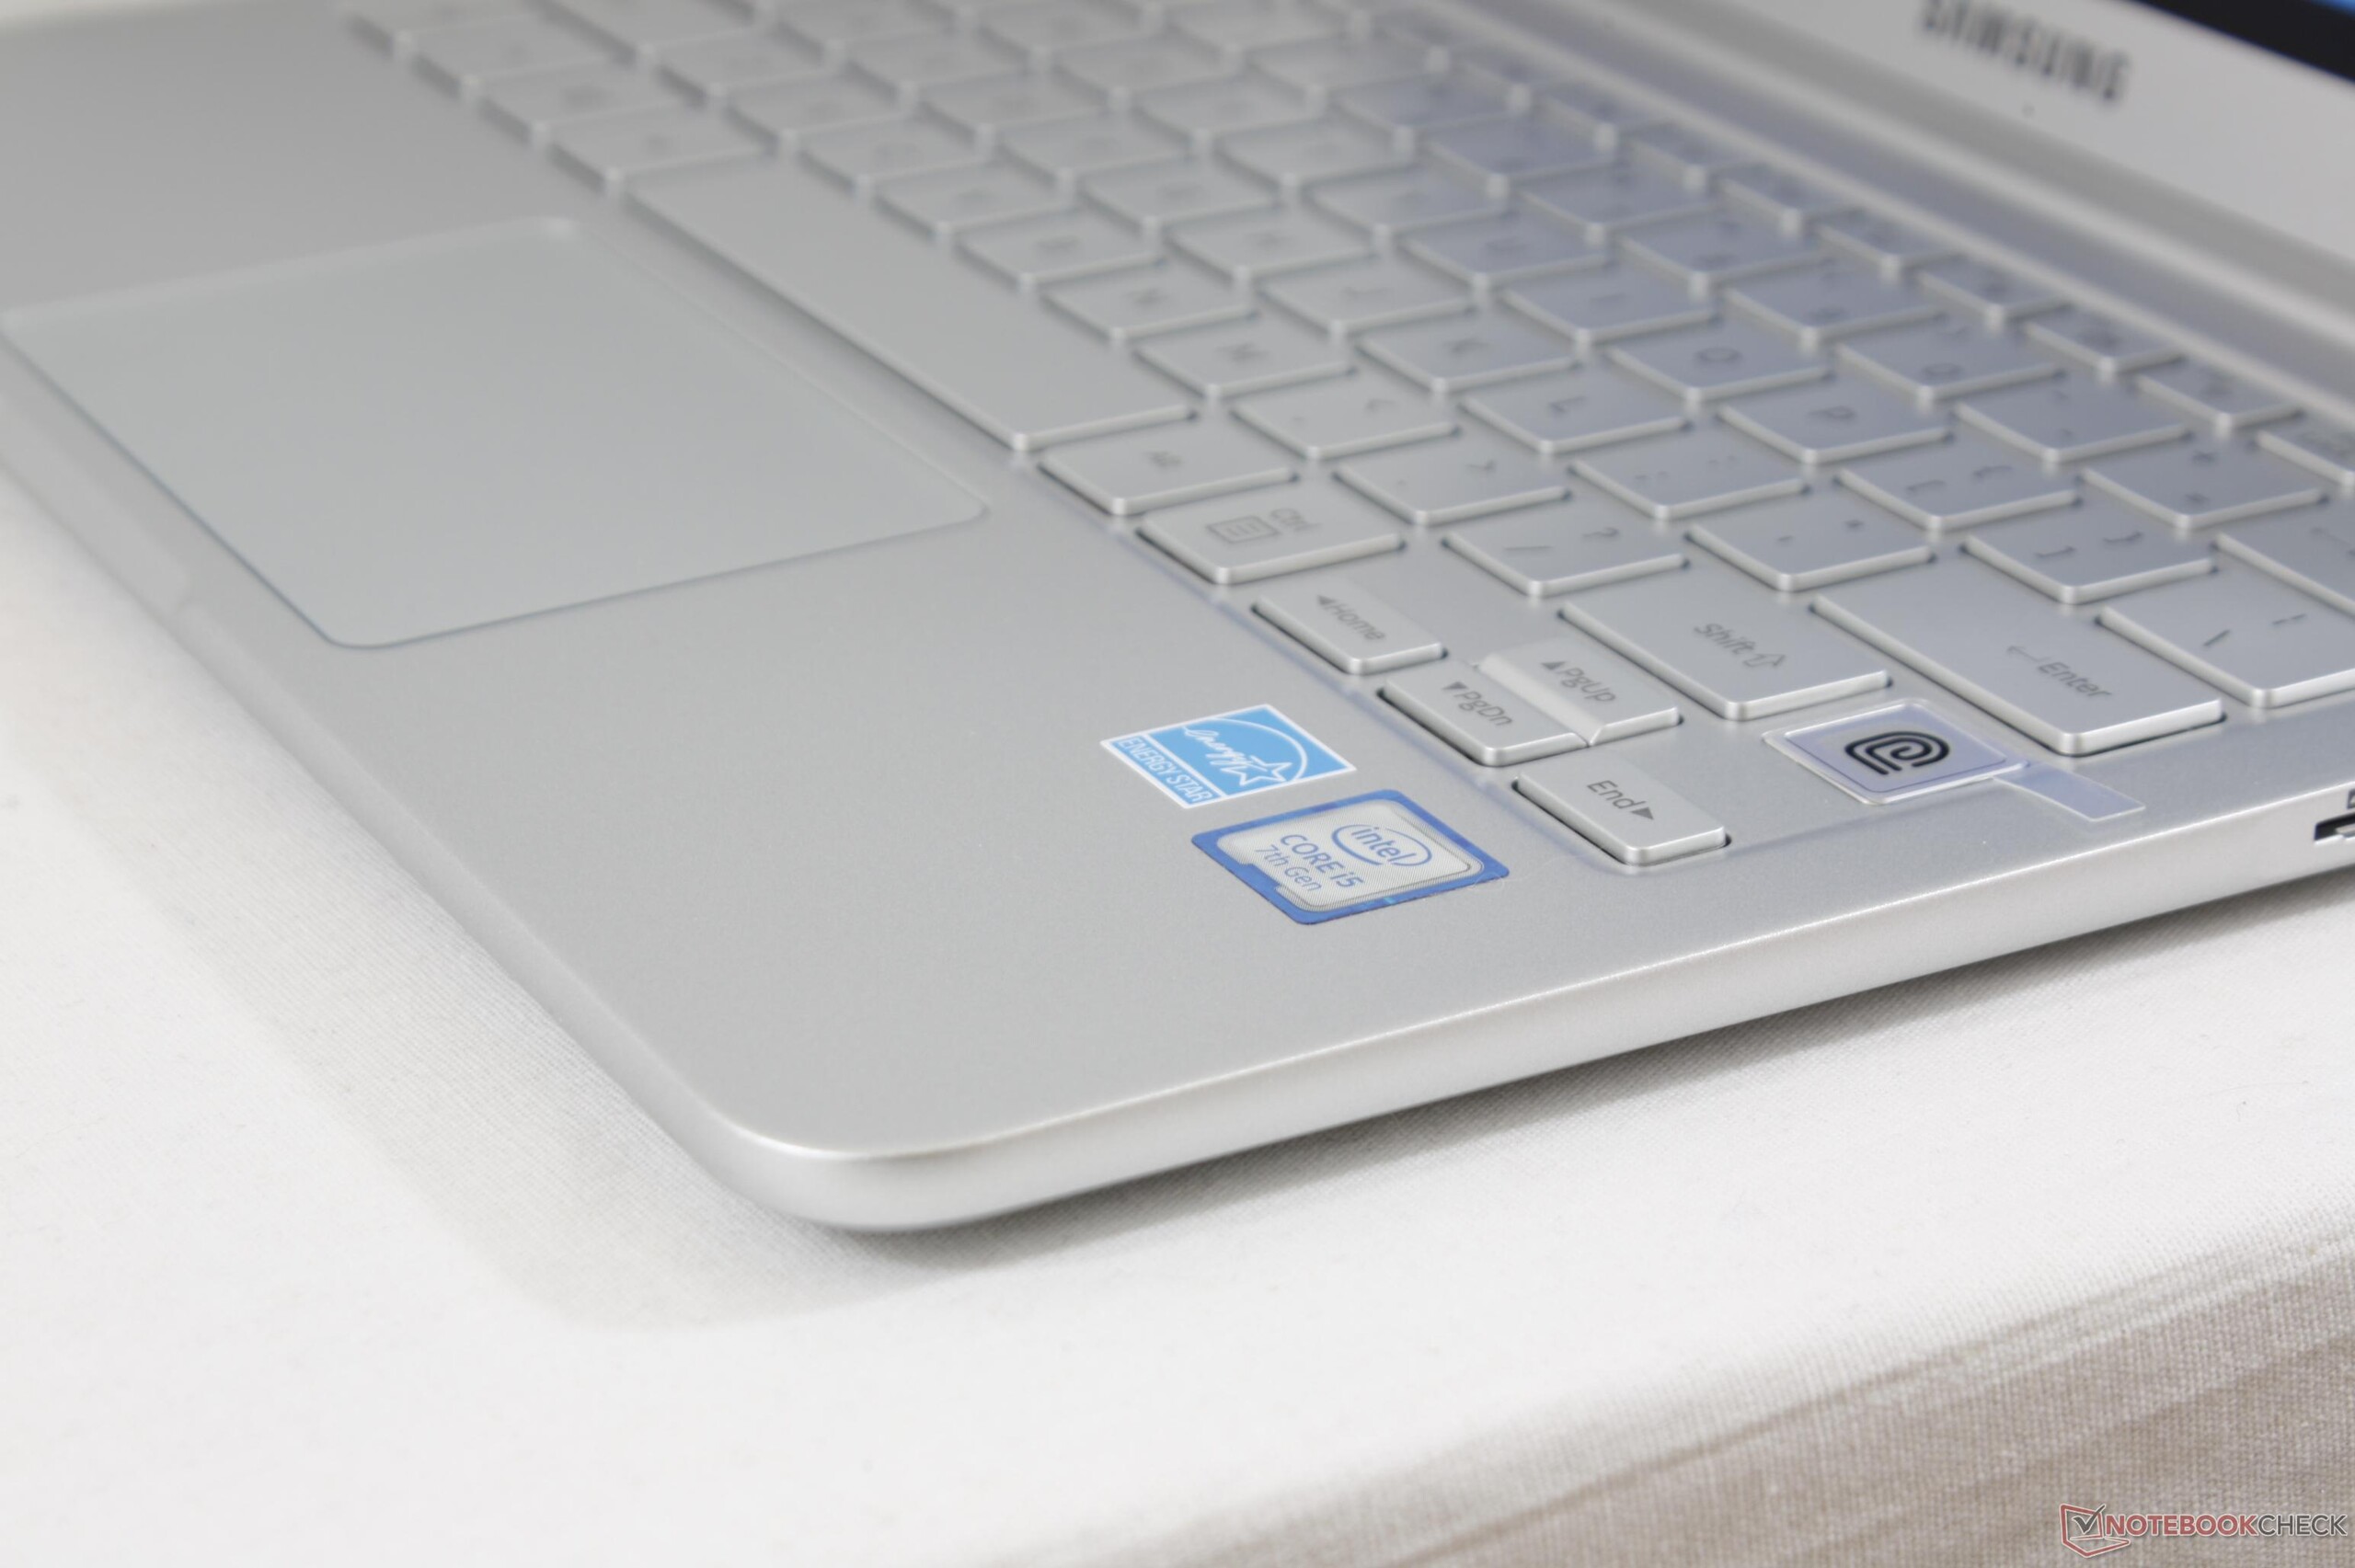
(+) I poggiapolsi e il touchpad sono piu' freddi della temperatura della pelle con un massimo di 25.2 °C / 77.4 F e sono quindi freddi al tatto.
(+) La temperatura media della zona del palmo della mano di dispositivi simili e'stata di 28.2 °C / 82.8 F (+3 °C / 5.4 F).
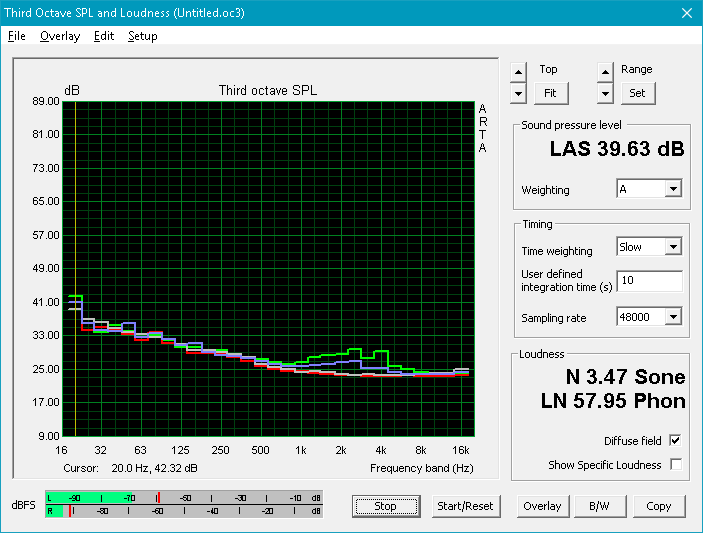
Samsung Notebook 9 NP900X3N-K01US analisi audio
(-) | altoparlanti non molto potenti (61.9 dB)
Bassi 100 - 315 Hz
(-) | quasi nessun basso - in media 19.4% inferiori alla media
(±) | la linearità dei bassi è media (12.6% delta rispetto alla precedente frequenza)
Medi 400 - 2000 Hz
(+) | medi bilanciati - solo only 3.5% rispetto alla media
(±) | linearità dei medi adeguata (11.7% delta rispetto alla precedente frequenza)
Alti 2 - 16 kHz
(+) | Alti bilanciati - appena 2.7% dalla media
(±) | la linearità degli alti è media (9% delta rispetto alla precedente frequenza)
Nel complesso 100 - 16.000 Hz
(±) | la linearità complessiva del suono è media (27.4% di differenza rispetto alla media
Rispetto alla stessa classe
» 89% di tutti i dispositivi testati in questa classe è stato migliore, 3% simile, 8% peggiore
» Il migliore ha avuto un delta di 5%, medio di 18%, peggiore di 53%
Rispetto a tutti i dispositivi testati
» 83% di tutti i dispositivi testati in questa classe è stato migliore, 4% similare, 13% peggiore
» Il migliore ha avuto un delta di 4%, medio di 23%, peggiore di 134%
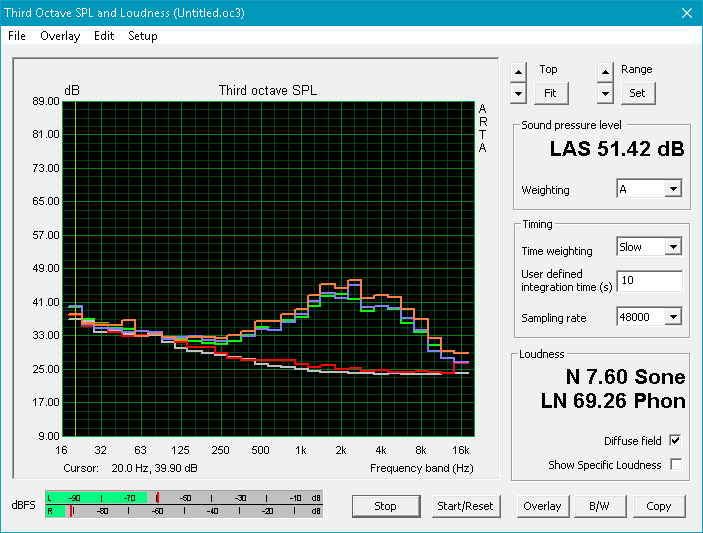
Apple MacBook 12 (Early 2016) 1.1 GHz analisi audio
(+) | gli altoparlanti sono relativamente potenti (83.6 dB)
Bassi 100 - 315 Hz
(±) | bassi ridotti - in media 11.3% inferiori alla media
(±) | la linearità dei bassi è media (14.2% delta rispetto alla precedente frequenza)
Medi 400 - 2000 Hz
(+) | medi bilanciati - solo only 2.4% rispetto alla media
(+) | medi lineari (5.5% delta rispetto alla precedente frequenza)
Alti 2 - 16 kHz
(+) | Alti bilanciati - appena 2% dalla media
(+) | alti lineari (4.5% delta rispetto alla precedente frequenza)
Nel complesso 100 - 16.000 Hz
(+) | suono nel complesso lineare (10.2% differenza dalla media)
Rispetto alla stessa classe
» 7% di tutti i dispositivi testati in questa classe è stato migliore, 2% simile, 90% peggiore
» Il migliore ha avuto un delta di 5%, medio di 18%, peggiore di 53%
Rispetto a tutti i dispositivi testati
» 5% di tutti i dispositivi testati in questa classe è stato migliore, 1% similare, 94% peggiore
» Il migliore ha avuto un delta di 4%, medio di 23%, peggiore di 134%
Frequency Comparison (Checkbox selectable!)
Graph 1: Pink Noise 100% Vol.; Graph 2: Audio off
Energy Management
| Off / Standby | |
| Idle | |
| Sotto carico |
|
Leggenda:
min: | |
| Samsung Notebook 9 NP900X3N-K01US i5-7200U, HD Graphics 620, Samsung CM871a MZNTY256HDHP, IPS, 1920x1080, 13.3" | HP Spectre 13-v131ng i7-7500U, HD Graphics 620, Samsung PM961 NVMe MZVLW512HMJP, IPS UWVA, 1920x1080, 13.3" | Dell XPS 13 9360 FHD i5 i5-7200U, HD Graphics 620, Toshiba NVMe THNSN5256GPUK, IPS, 1920x1080, 13.3" | Lenovo Yoga 910-13IKB-80VF004CGE i7-7500U, HD Graphics 620, Samsung PM951 NVMe MZVLV512, IPS, 3840x2160, 13.9" | Apple MacBook Pro 13 2017 i5-7360U, Iris Plus Graphics 640, Apple SSD AP0128, IPS, 2560x1600, 13.3" | Asus Zenbook 3 UX390UA-GS041T i5-7200U, HD Graphics 620, SK Hynix Canvas SC300 512GB M.2 (HFS512G39MND), IPS, 1920x1080, 12.5" | |
|---|---|---|---|---|---|---|
| Power Consumption | 16% | 34% | 16% | 7% | 23% | |
| Idle Minimum * (Watt) | 3.8 | 3.6 5% | 4.1 -8% | 4.3 -13% | 3.7 3% | 3.3 13% |
| Idle Average * (Watt) | 11 | 6.4 42% | 4.2 62% | 6.3 43% | 5.2 53% | 6.2 44% |
| Idle Maximum * (Watt) | 11.3 | 9.2 19% | 5.1 55% | 9 20% | 7.6 33% | 10.4 8% |
| Load Average * (Watt) | 35.6 | 34 4% | 22.1 38% | 32.7 8% | 41.6 -17% | 28 21% |
| Load Maximum * (Watt) | 37.2 | 34.4 8% | 29.4 21% | 28.8 23% | 50.5 -36% | 25.7 31% |
* ... Meglio usare valori piccoli
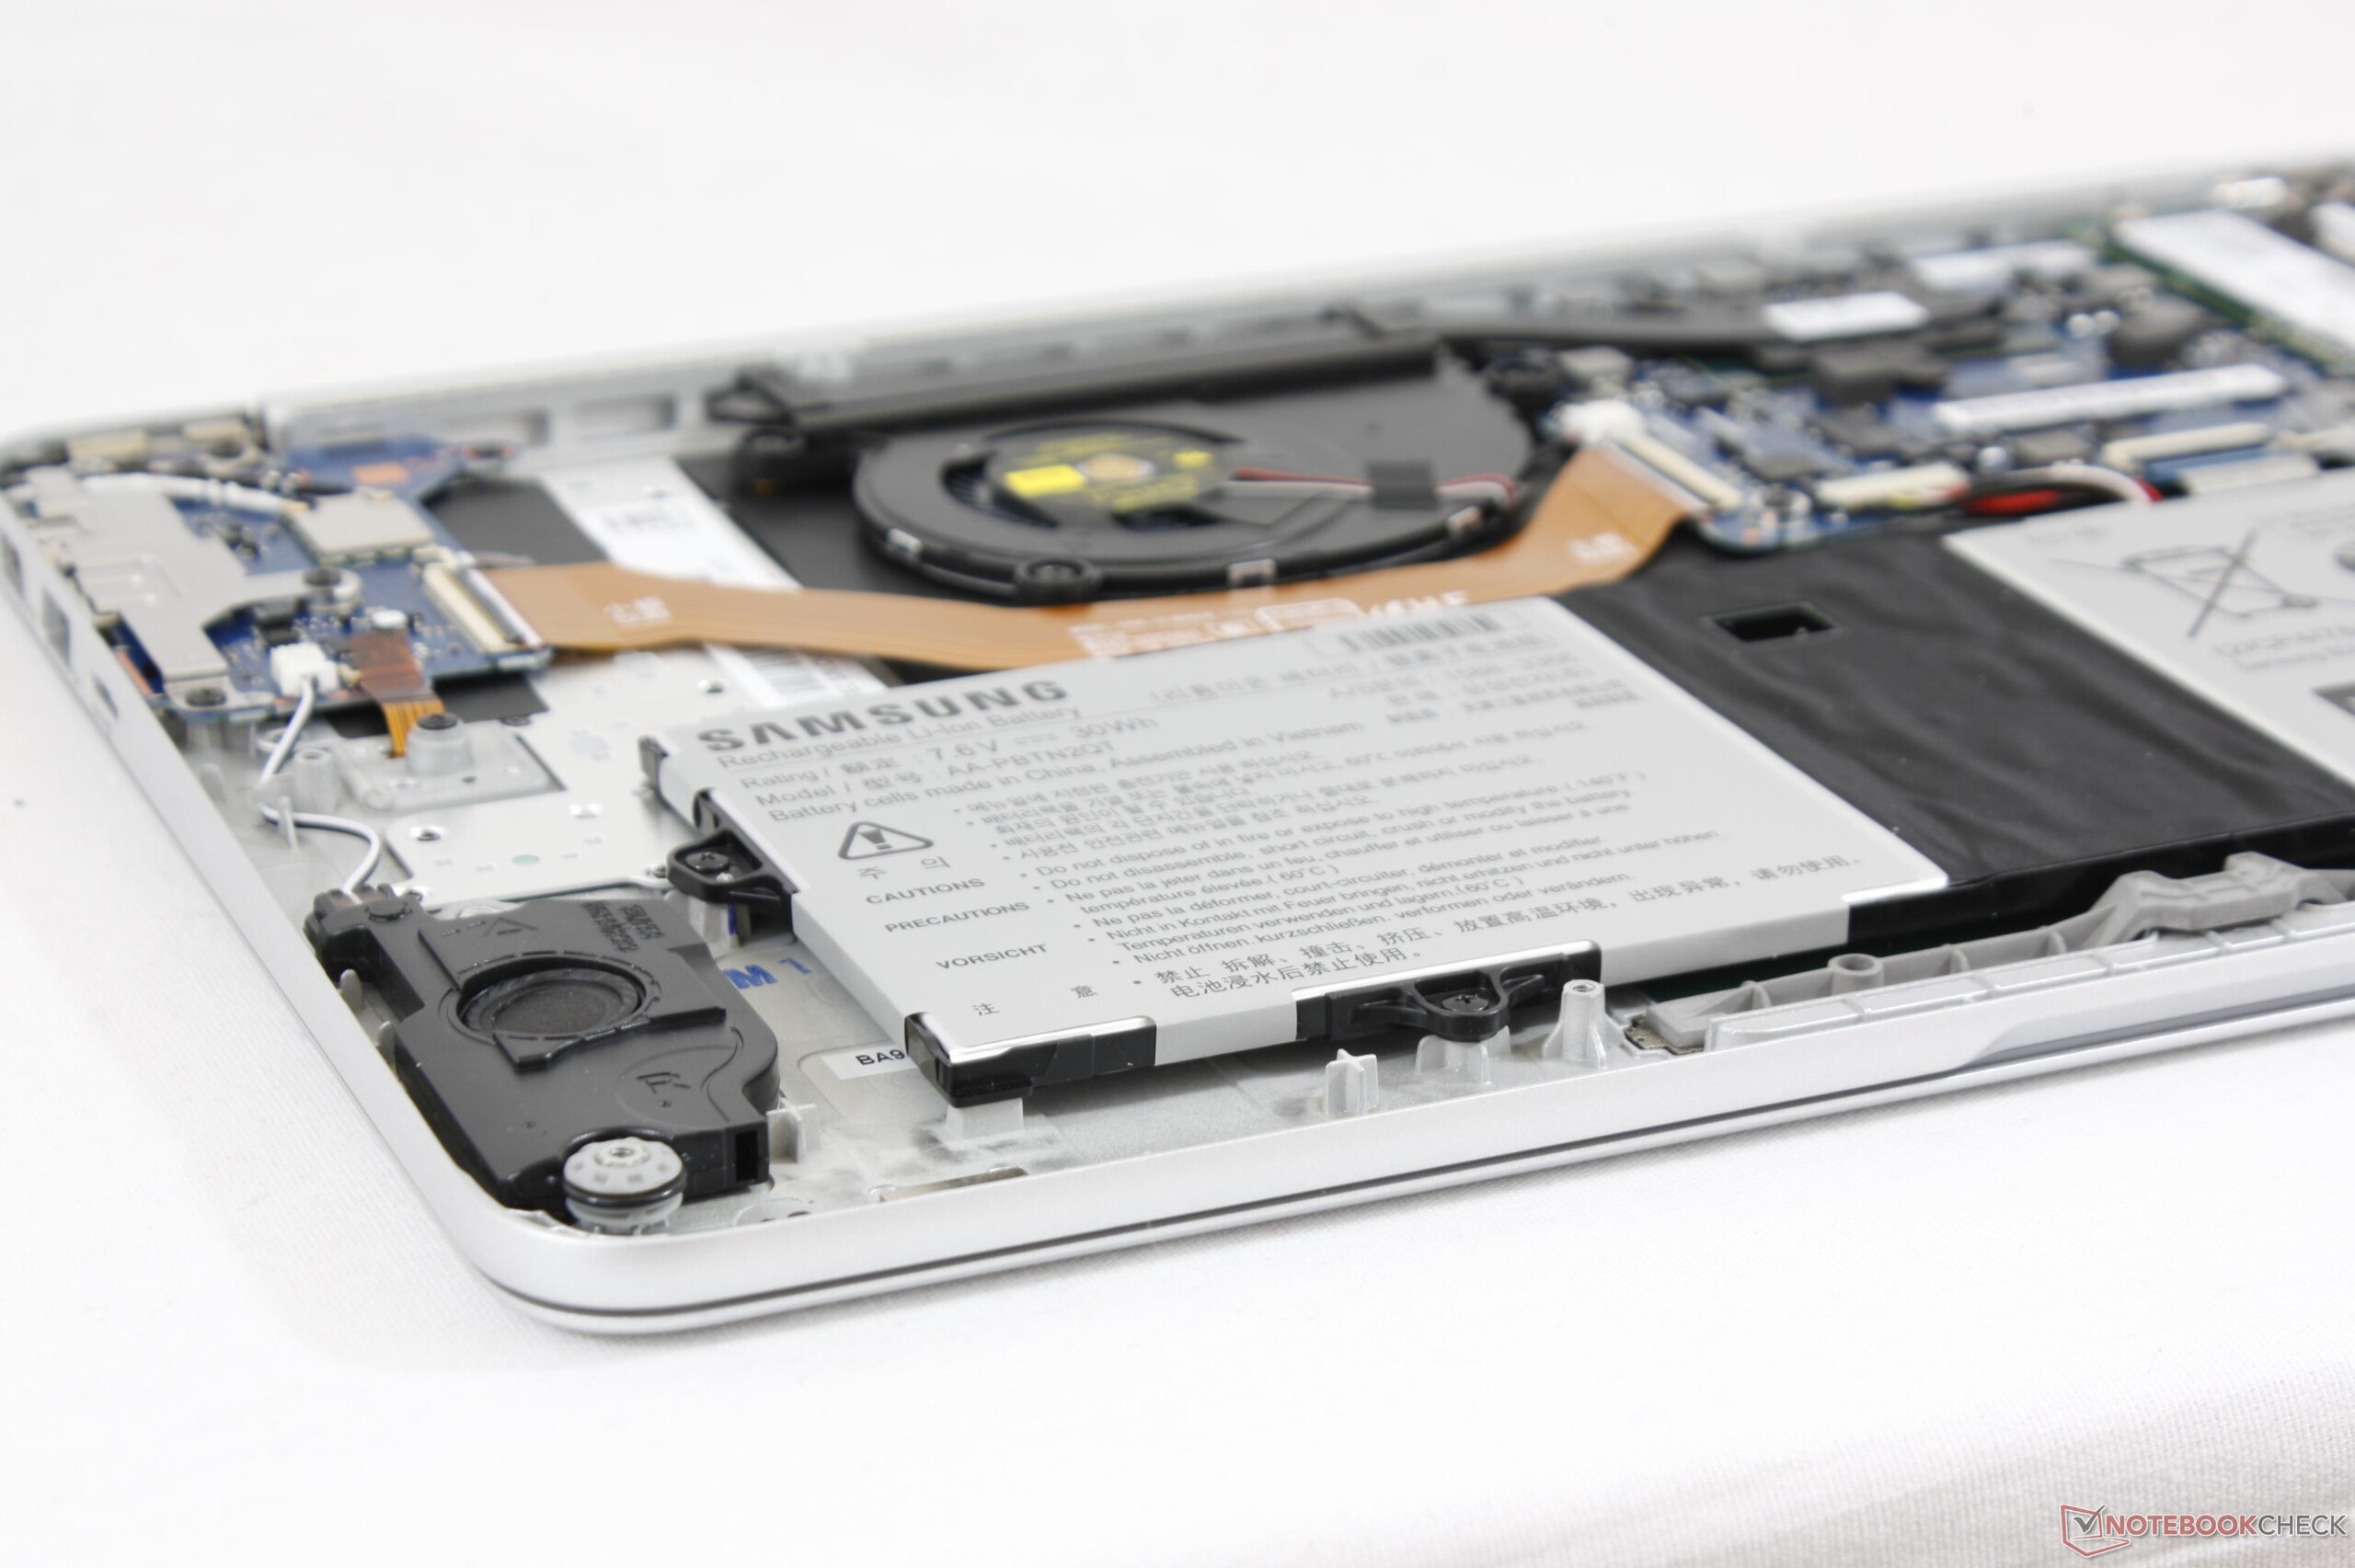
| Samsung Notebook 9 NP900X3N-K01US i5-7200U, HD Graphics 620, 30 Wh | HP Spectre 13-v131ng i7-7500U, HD Graphics 620, 38 Wh | Dell XPS 13 9360 FHD i5 i5-7200U, HD Graphics 620, 60 Wh | Lenovo Yoga 910-13IKB-80VF004CGE i7-7500U, HD Graphics 620, 78 Wh | Apple MacBook Pro 13 2017 i5-7360U, Iris Plus Graphics 640, 54.5 Wh | Asus Zenbook 3 UX390UA-GS041T i5-7200U, HD Graphics 620, 40 Wh | |
|---|---|---|---|---|---|---|
| Autonomia della batteria | 24% | 129% | 124% | 87% | 47% | |
| Reader / Idle (h) | 11.6 | 12 3% | 21.6 86% | 17.8 53% | 14.1 22% | |
| WiFi v1.3 (h) | 4.7 | 6.6 40% | 11.3 140% | 10.7 128% | 11.4 143% | 6.6 40% |
| Load (h) | 1 | 1.3 30% | 2.6 160% | 2.9 190% | 1.3 30% | 1.8 80% |
Pro
Contro
Giudizio Complessivo
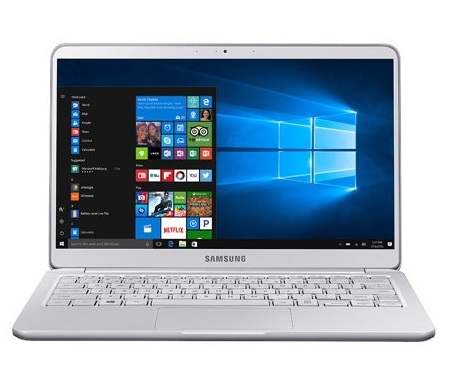
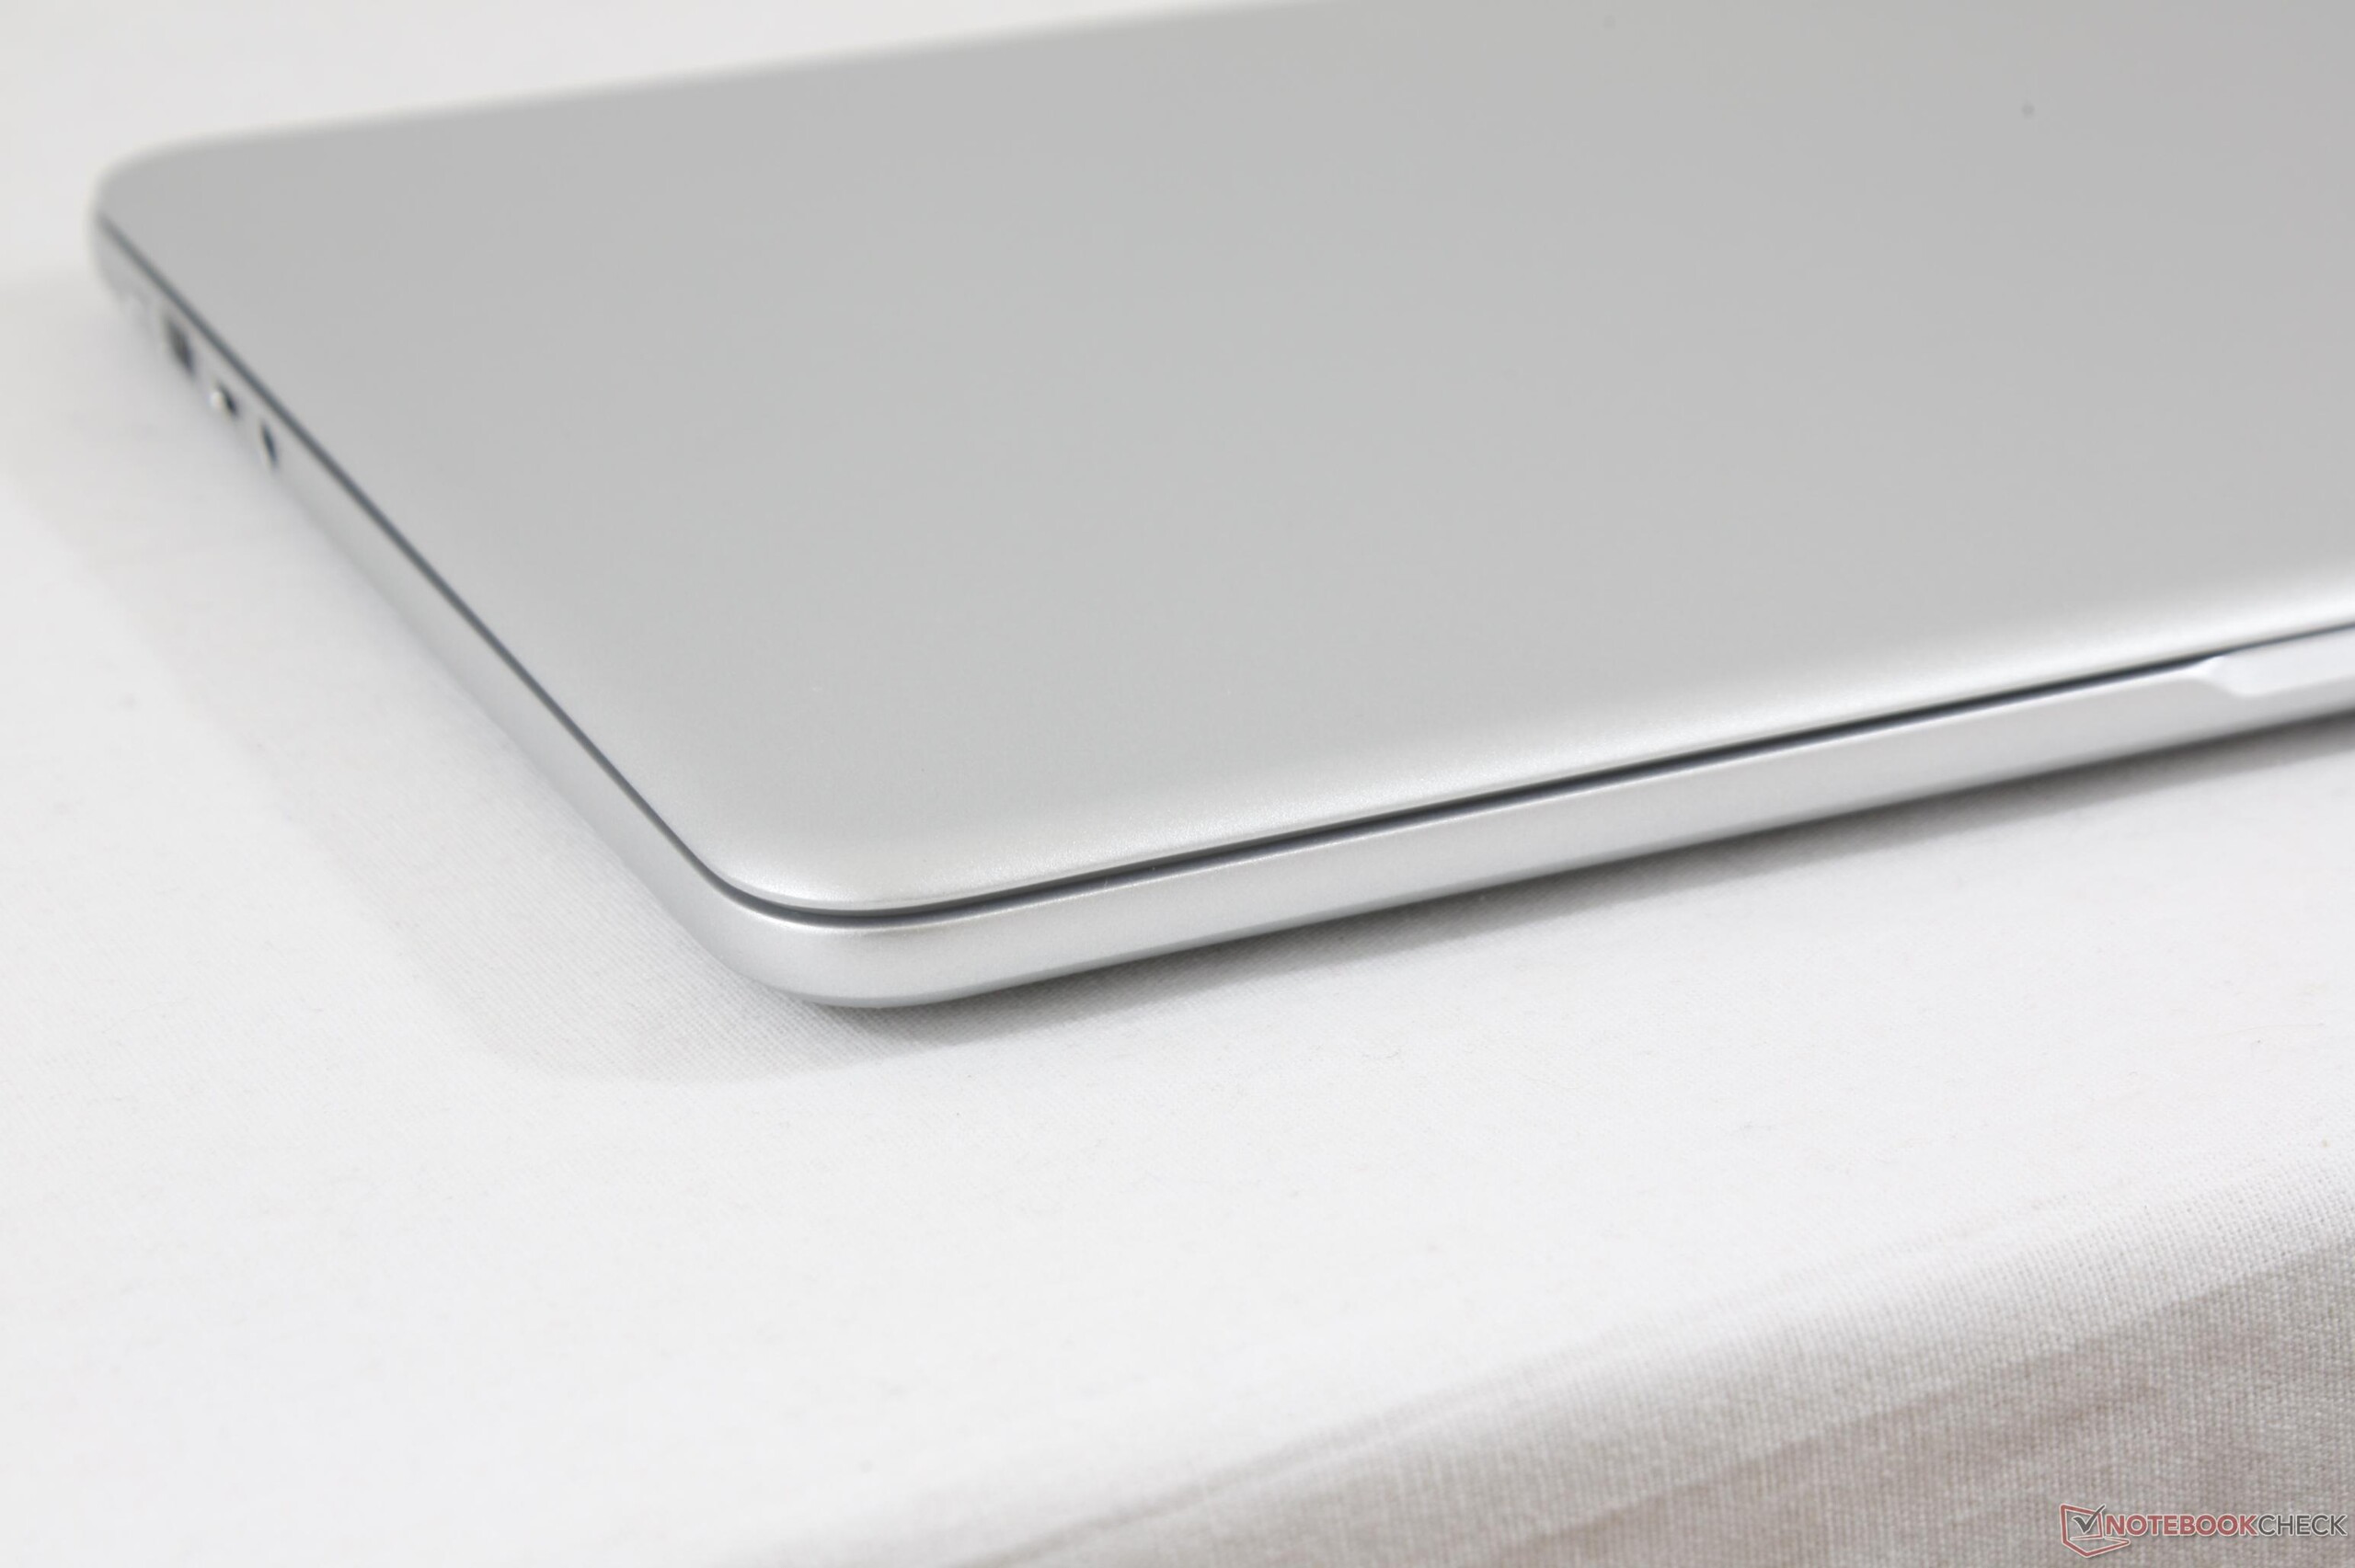
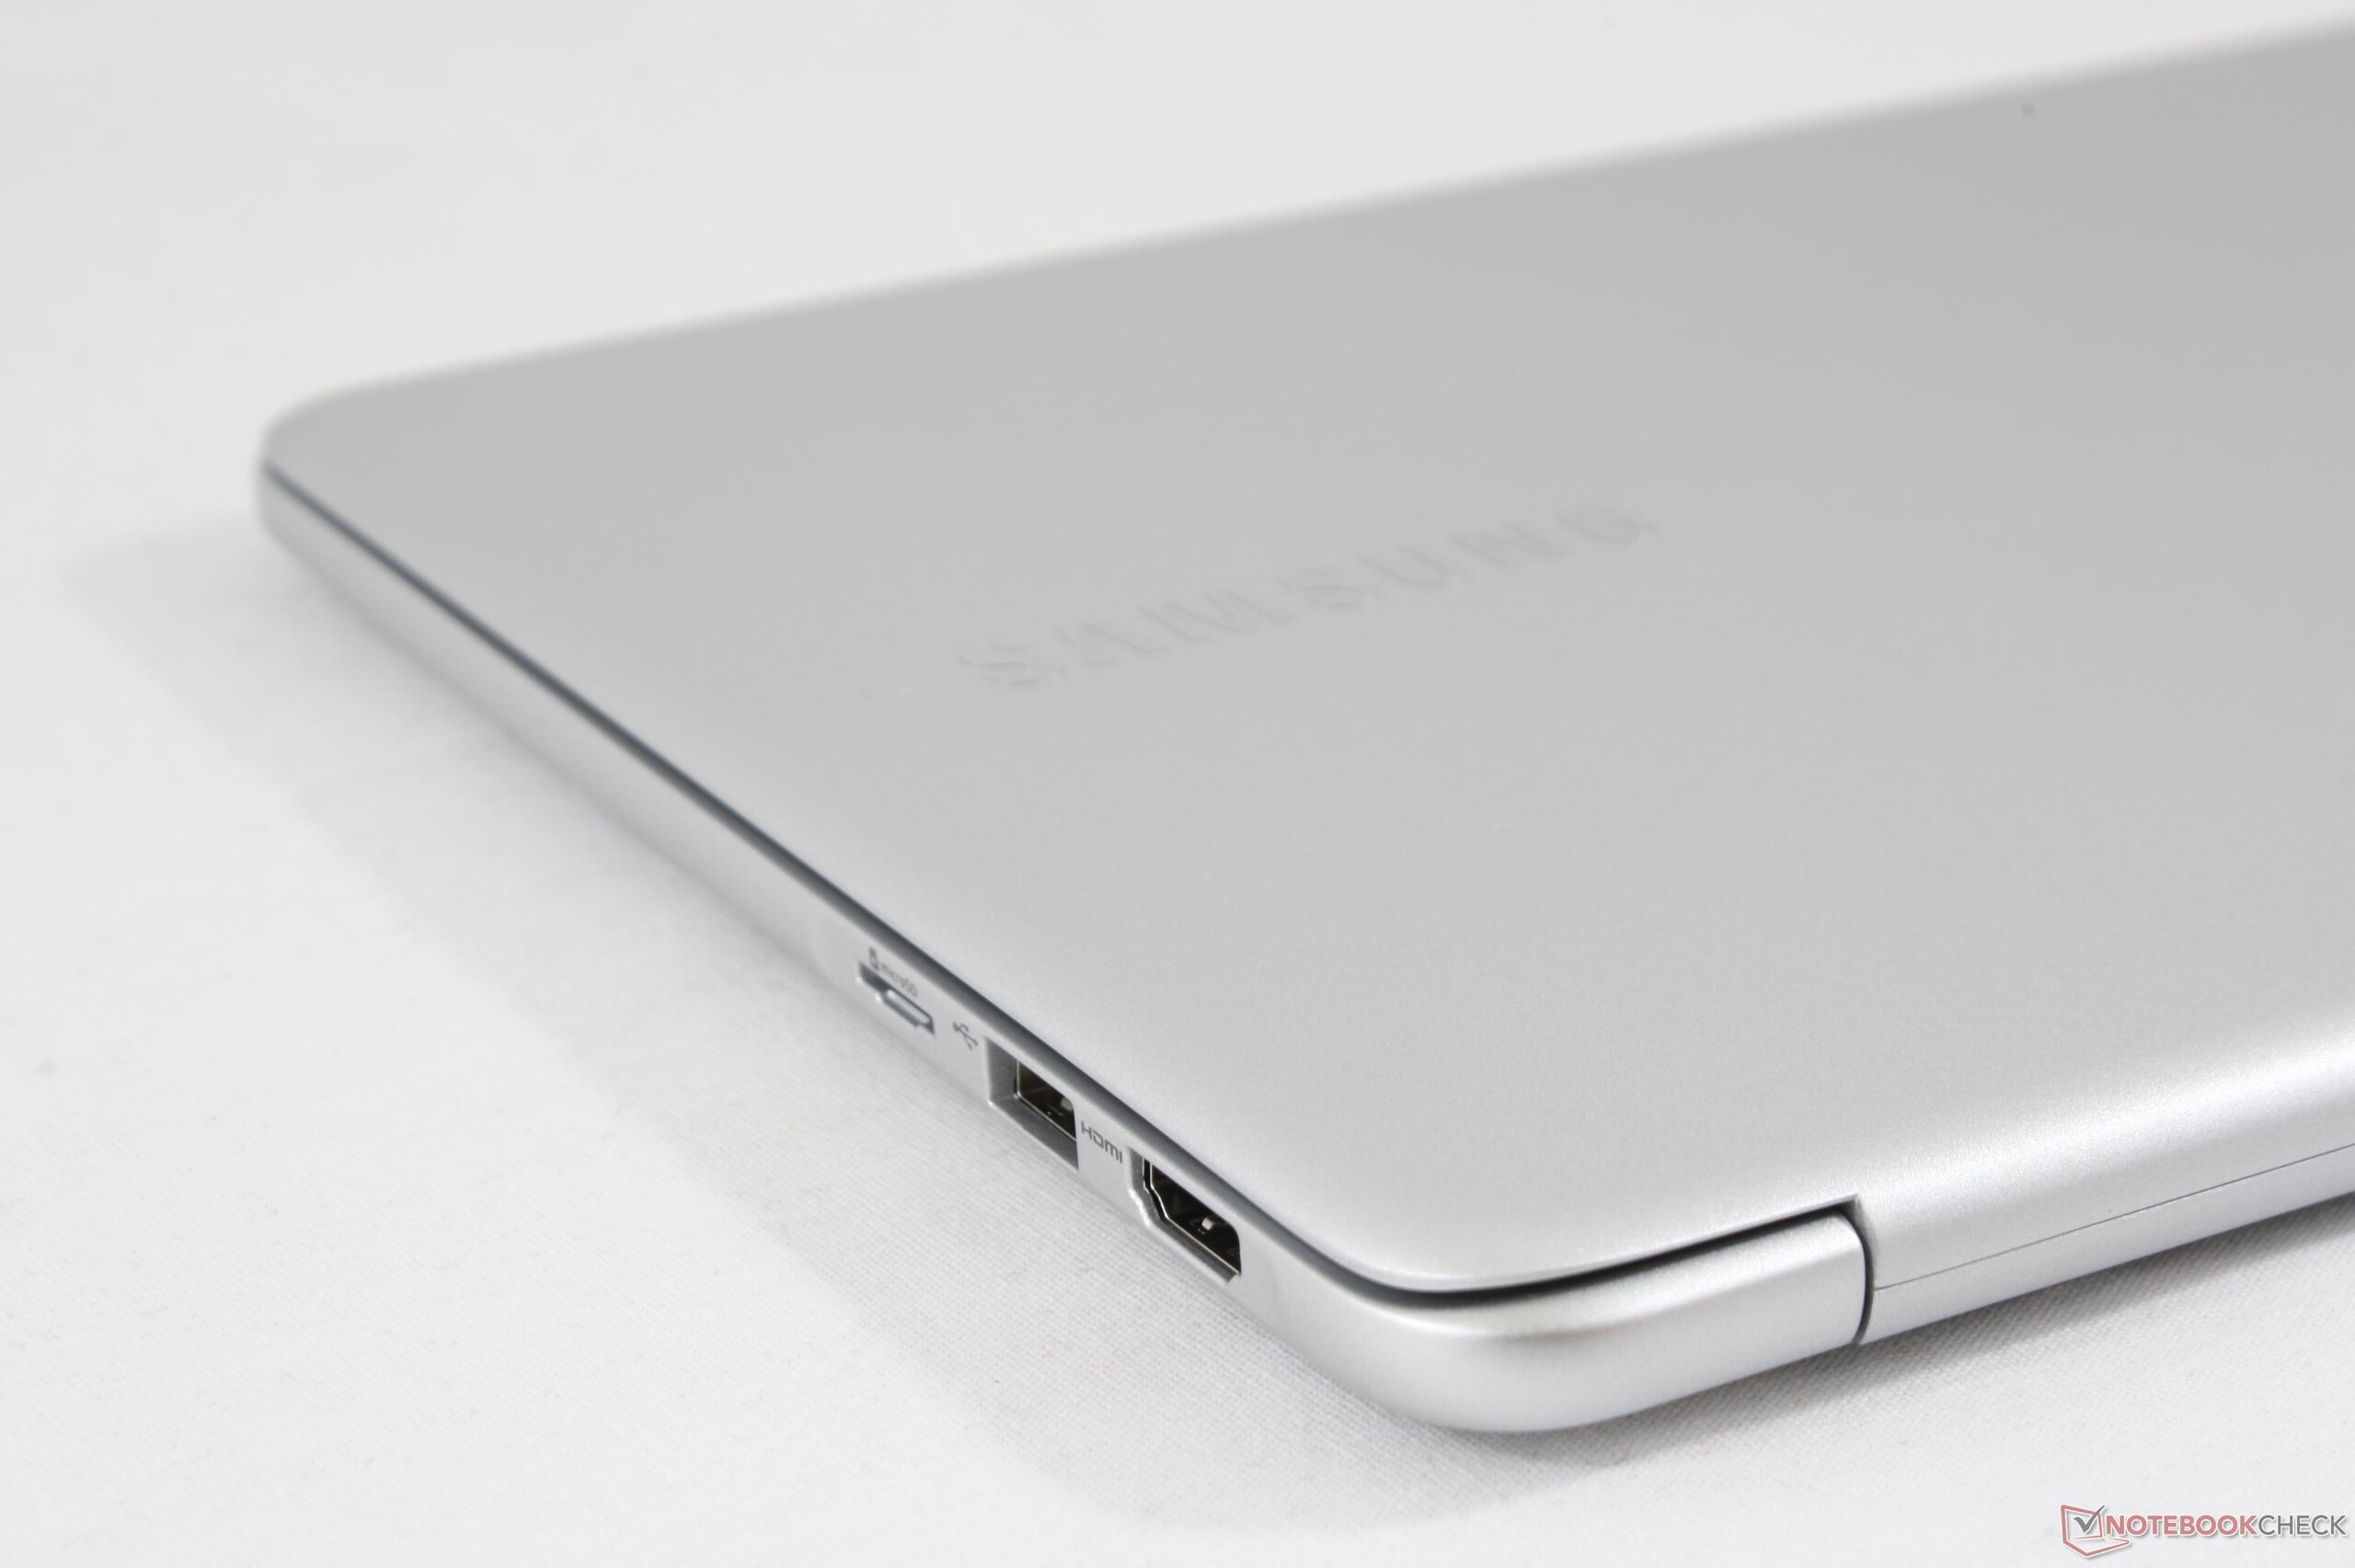
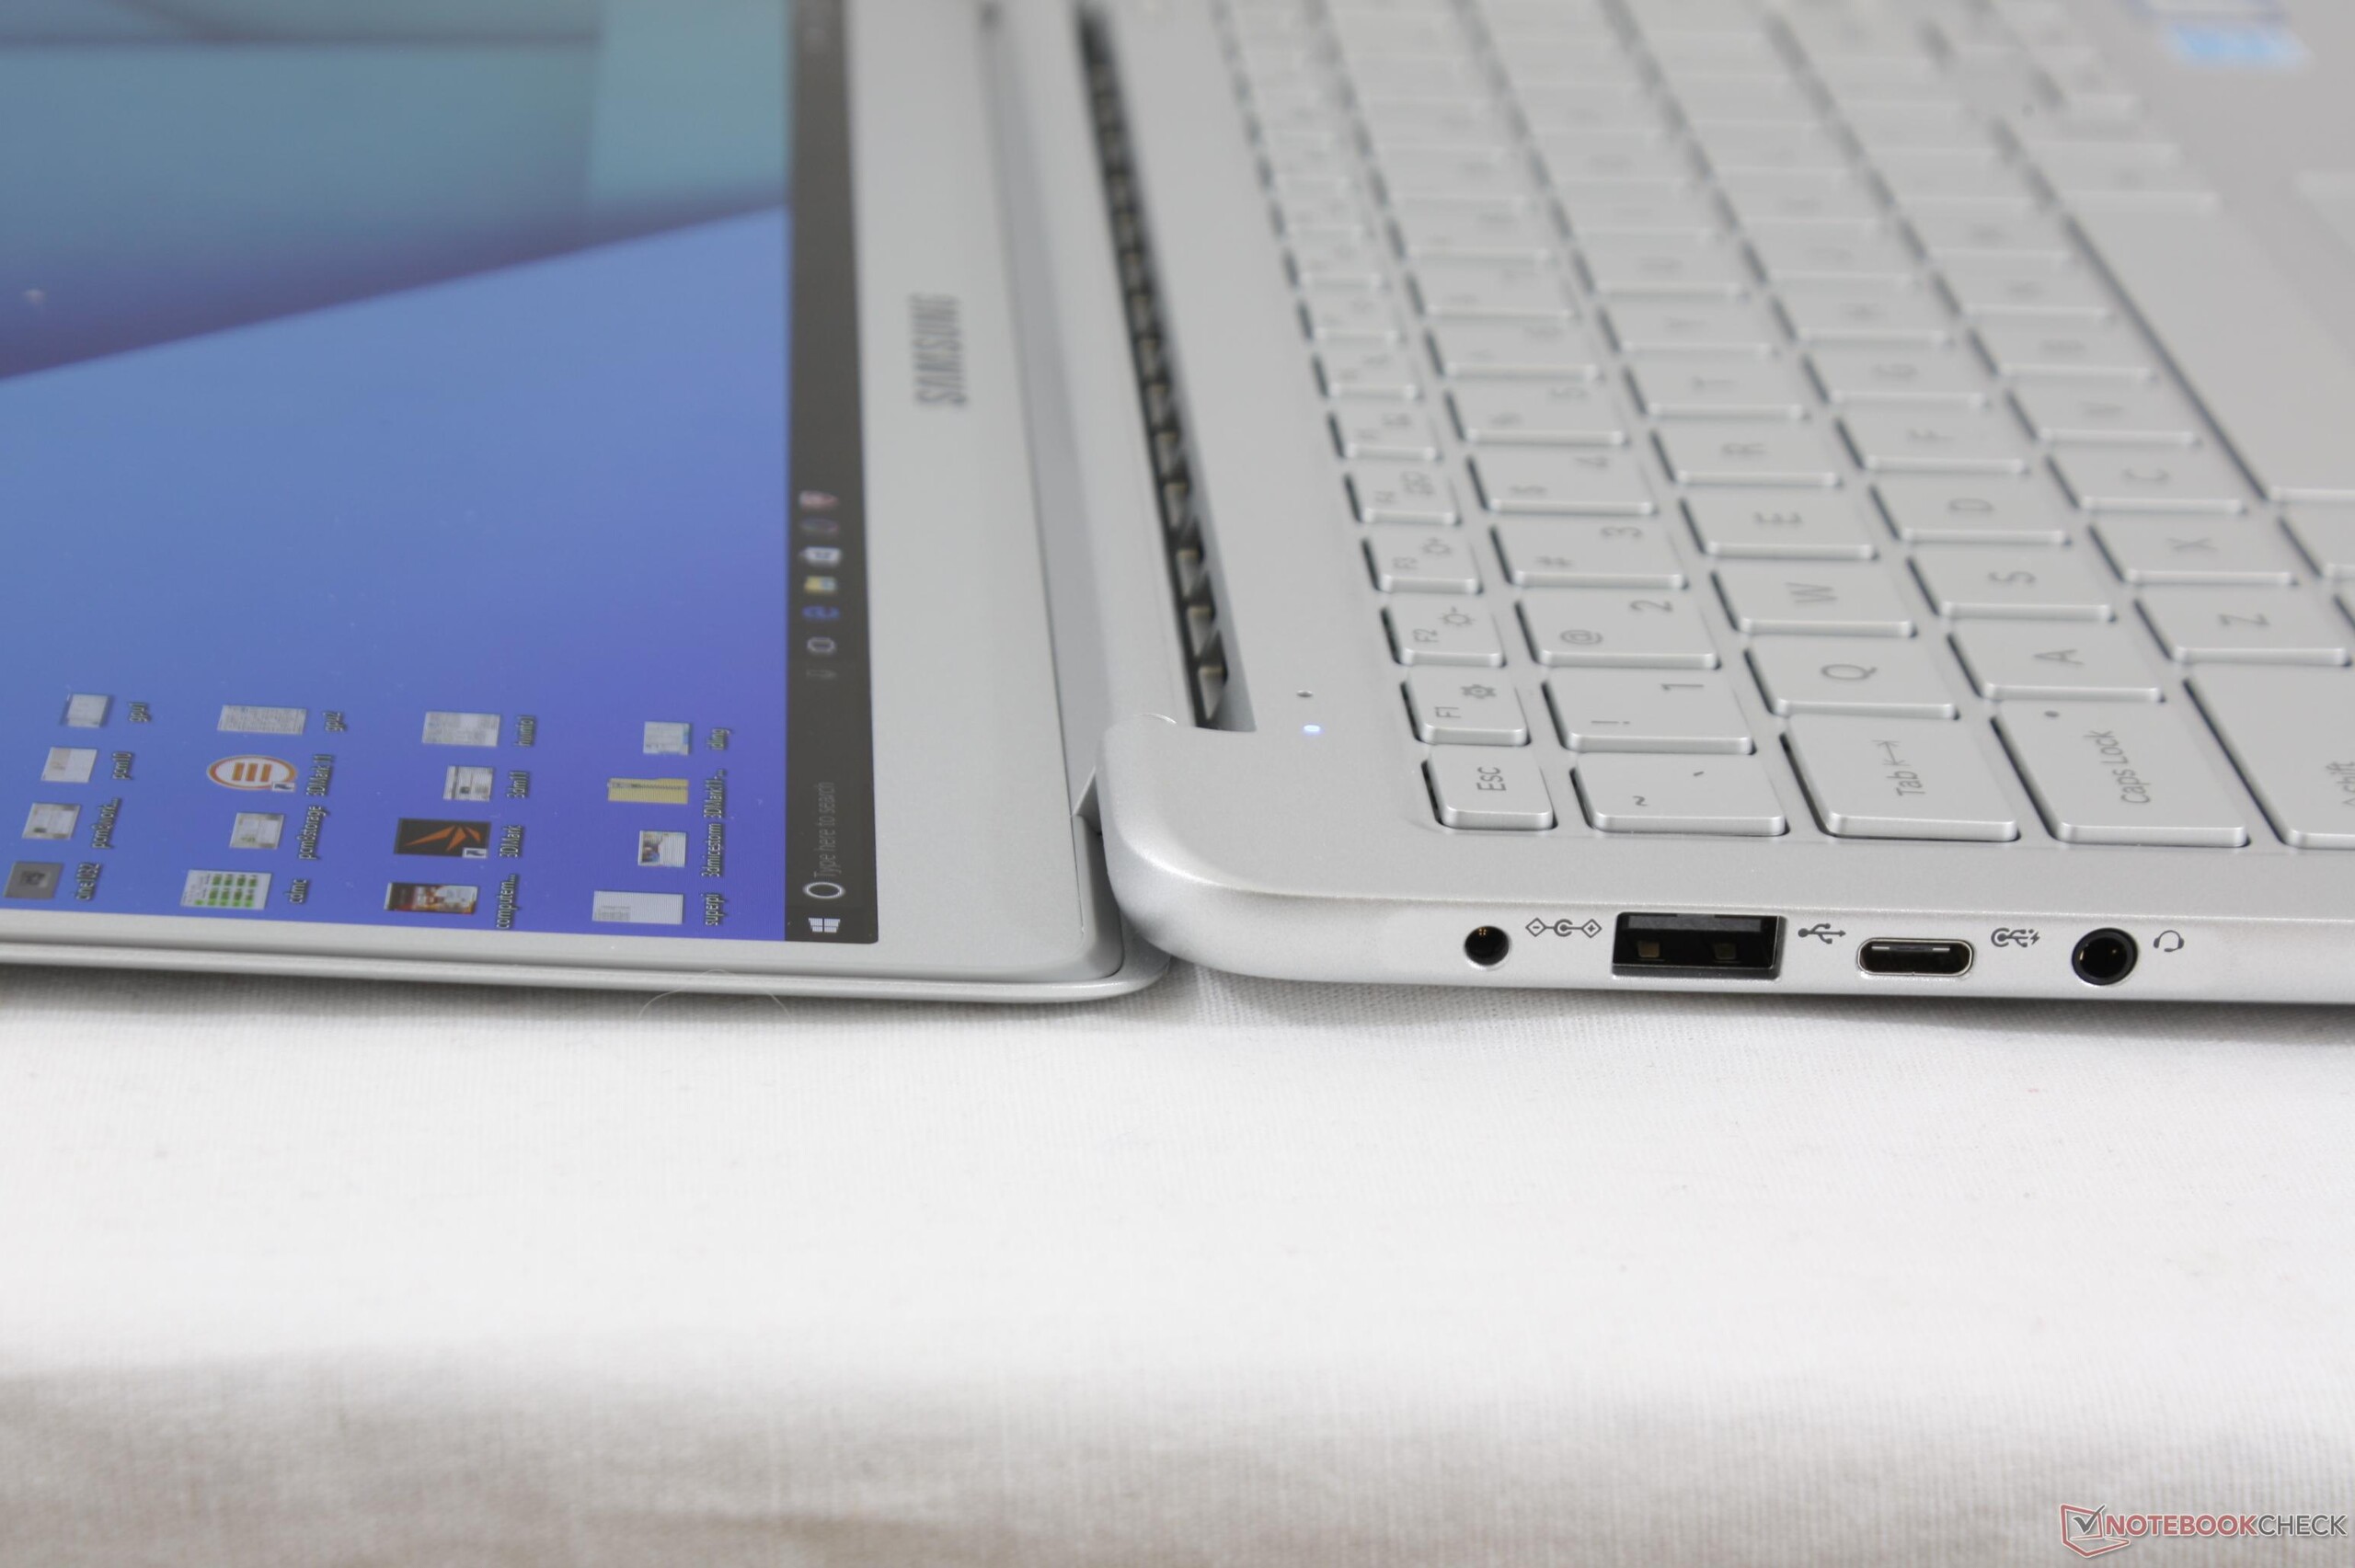
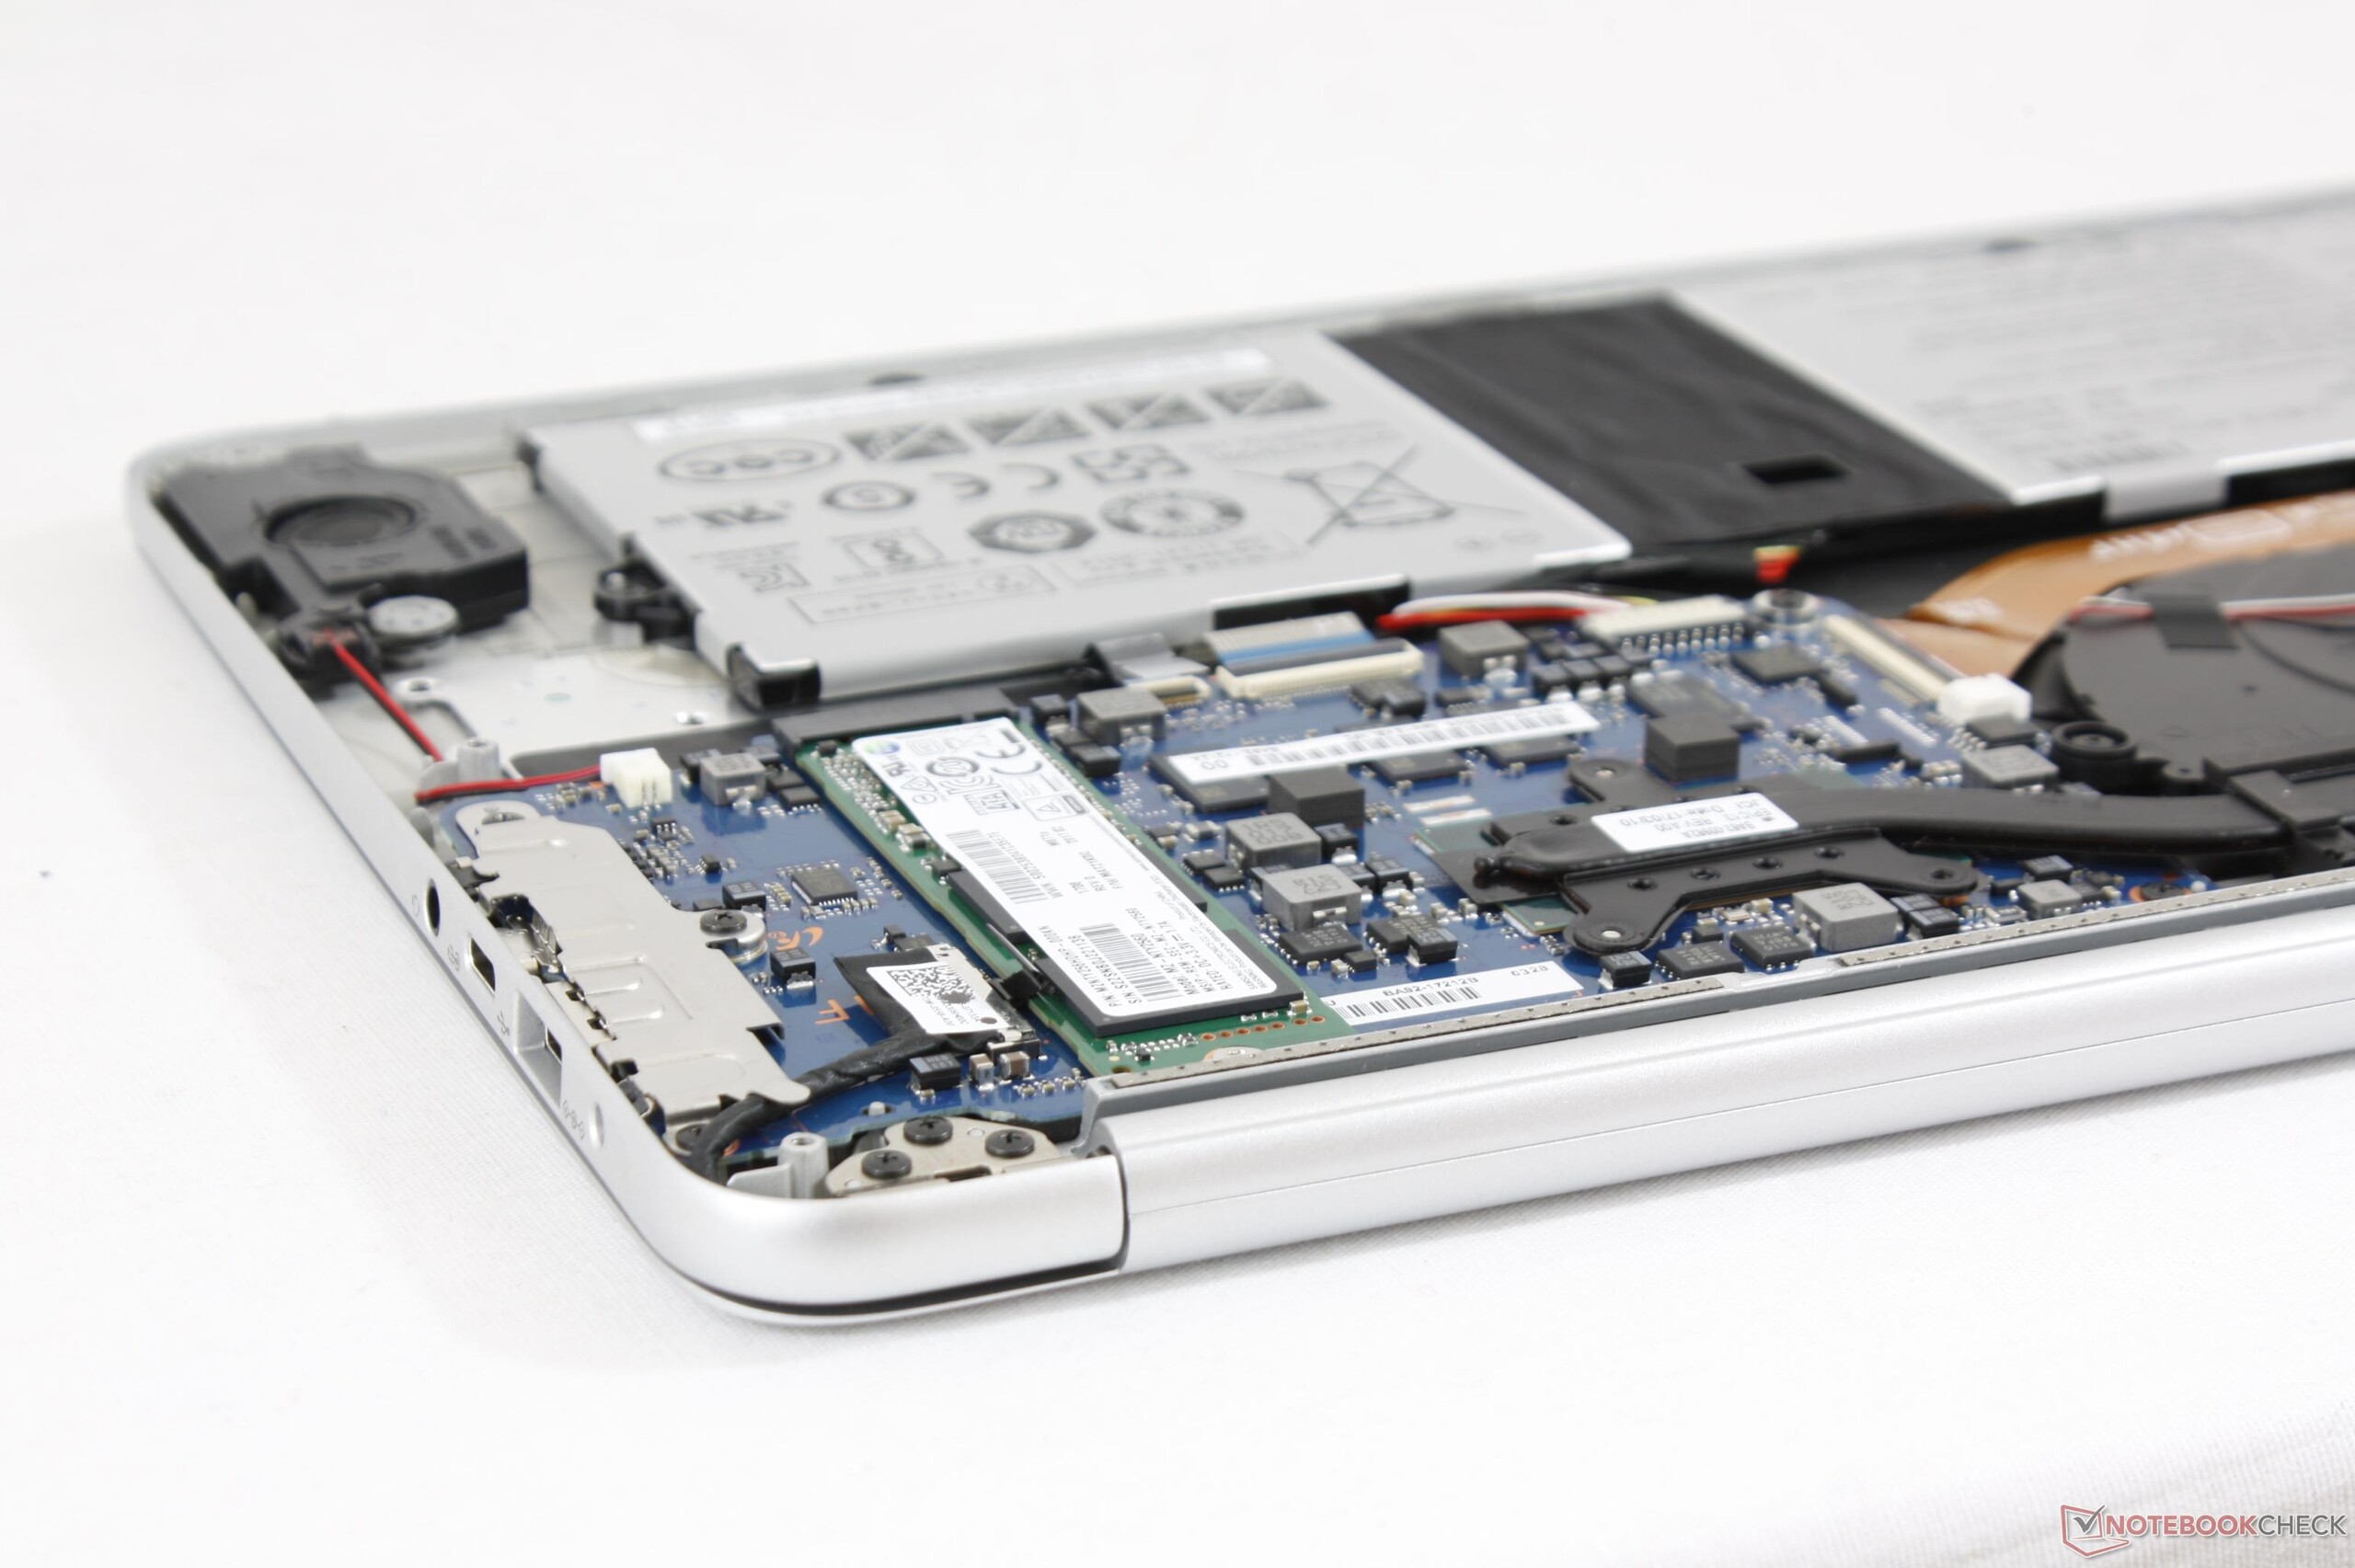
IL 13" Notebook 9 era stato creato con uno scopo in mente - essere l'Ultrabook più leggero e luminoso della sua classe. Samsung con l'NP900X3N ha fatto ancora di meglio. Unendo ventola silenziosa, porte full-size USB, e tastiera decente, rendendo questo ultrabook da 13" il migliore dispositivo da viaggio e per ambienti aperti.
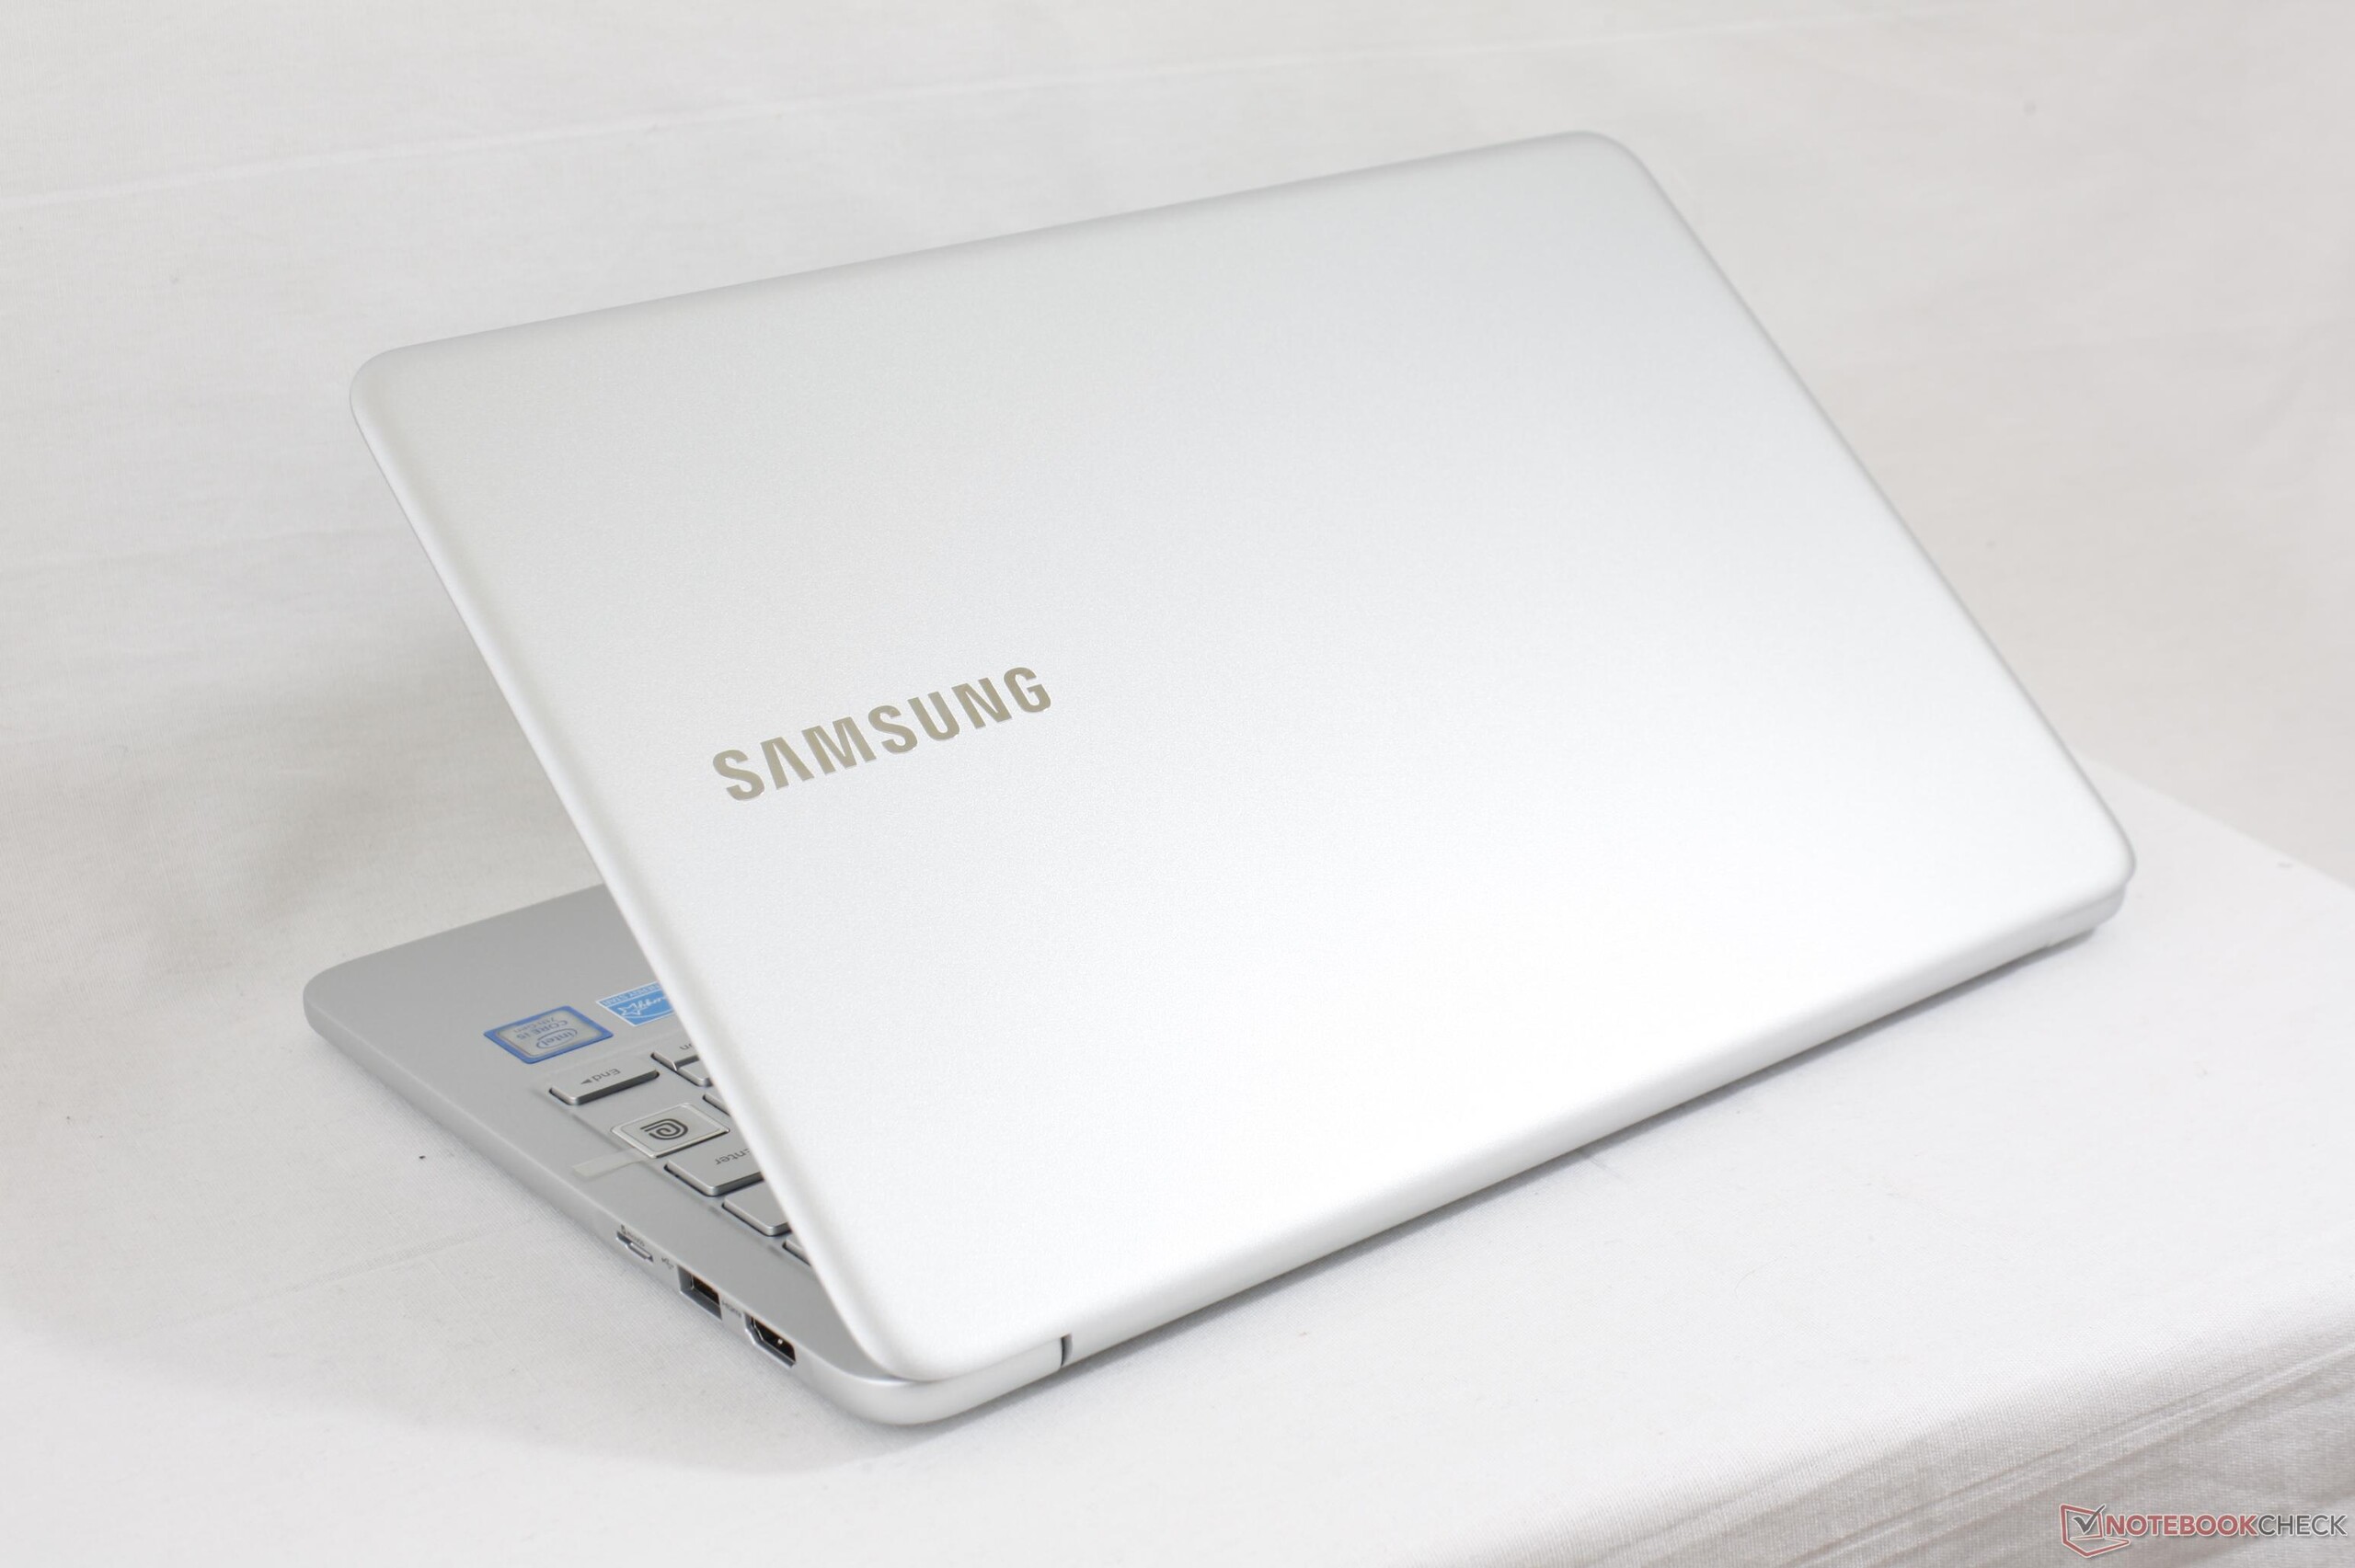
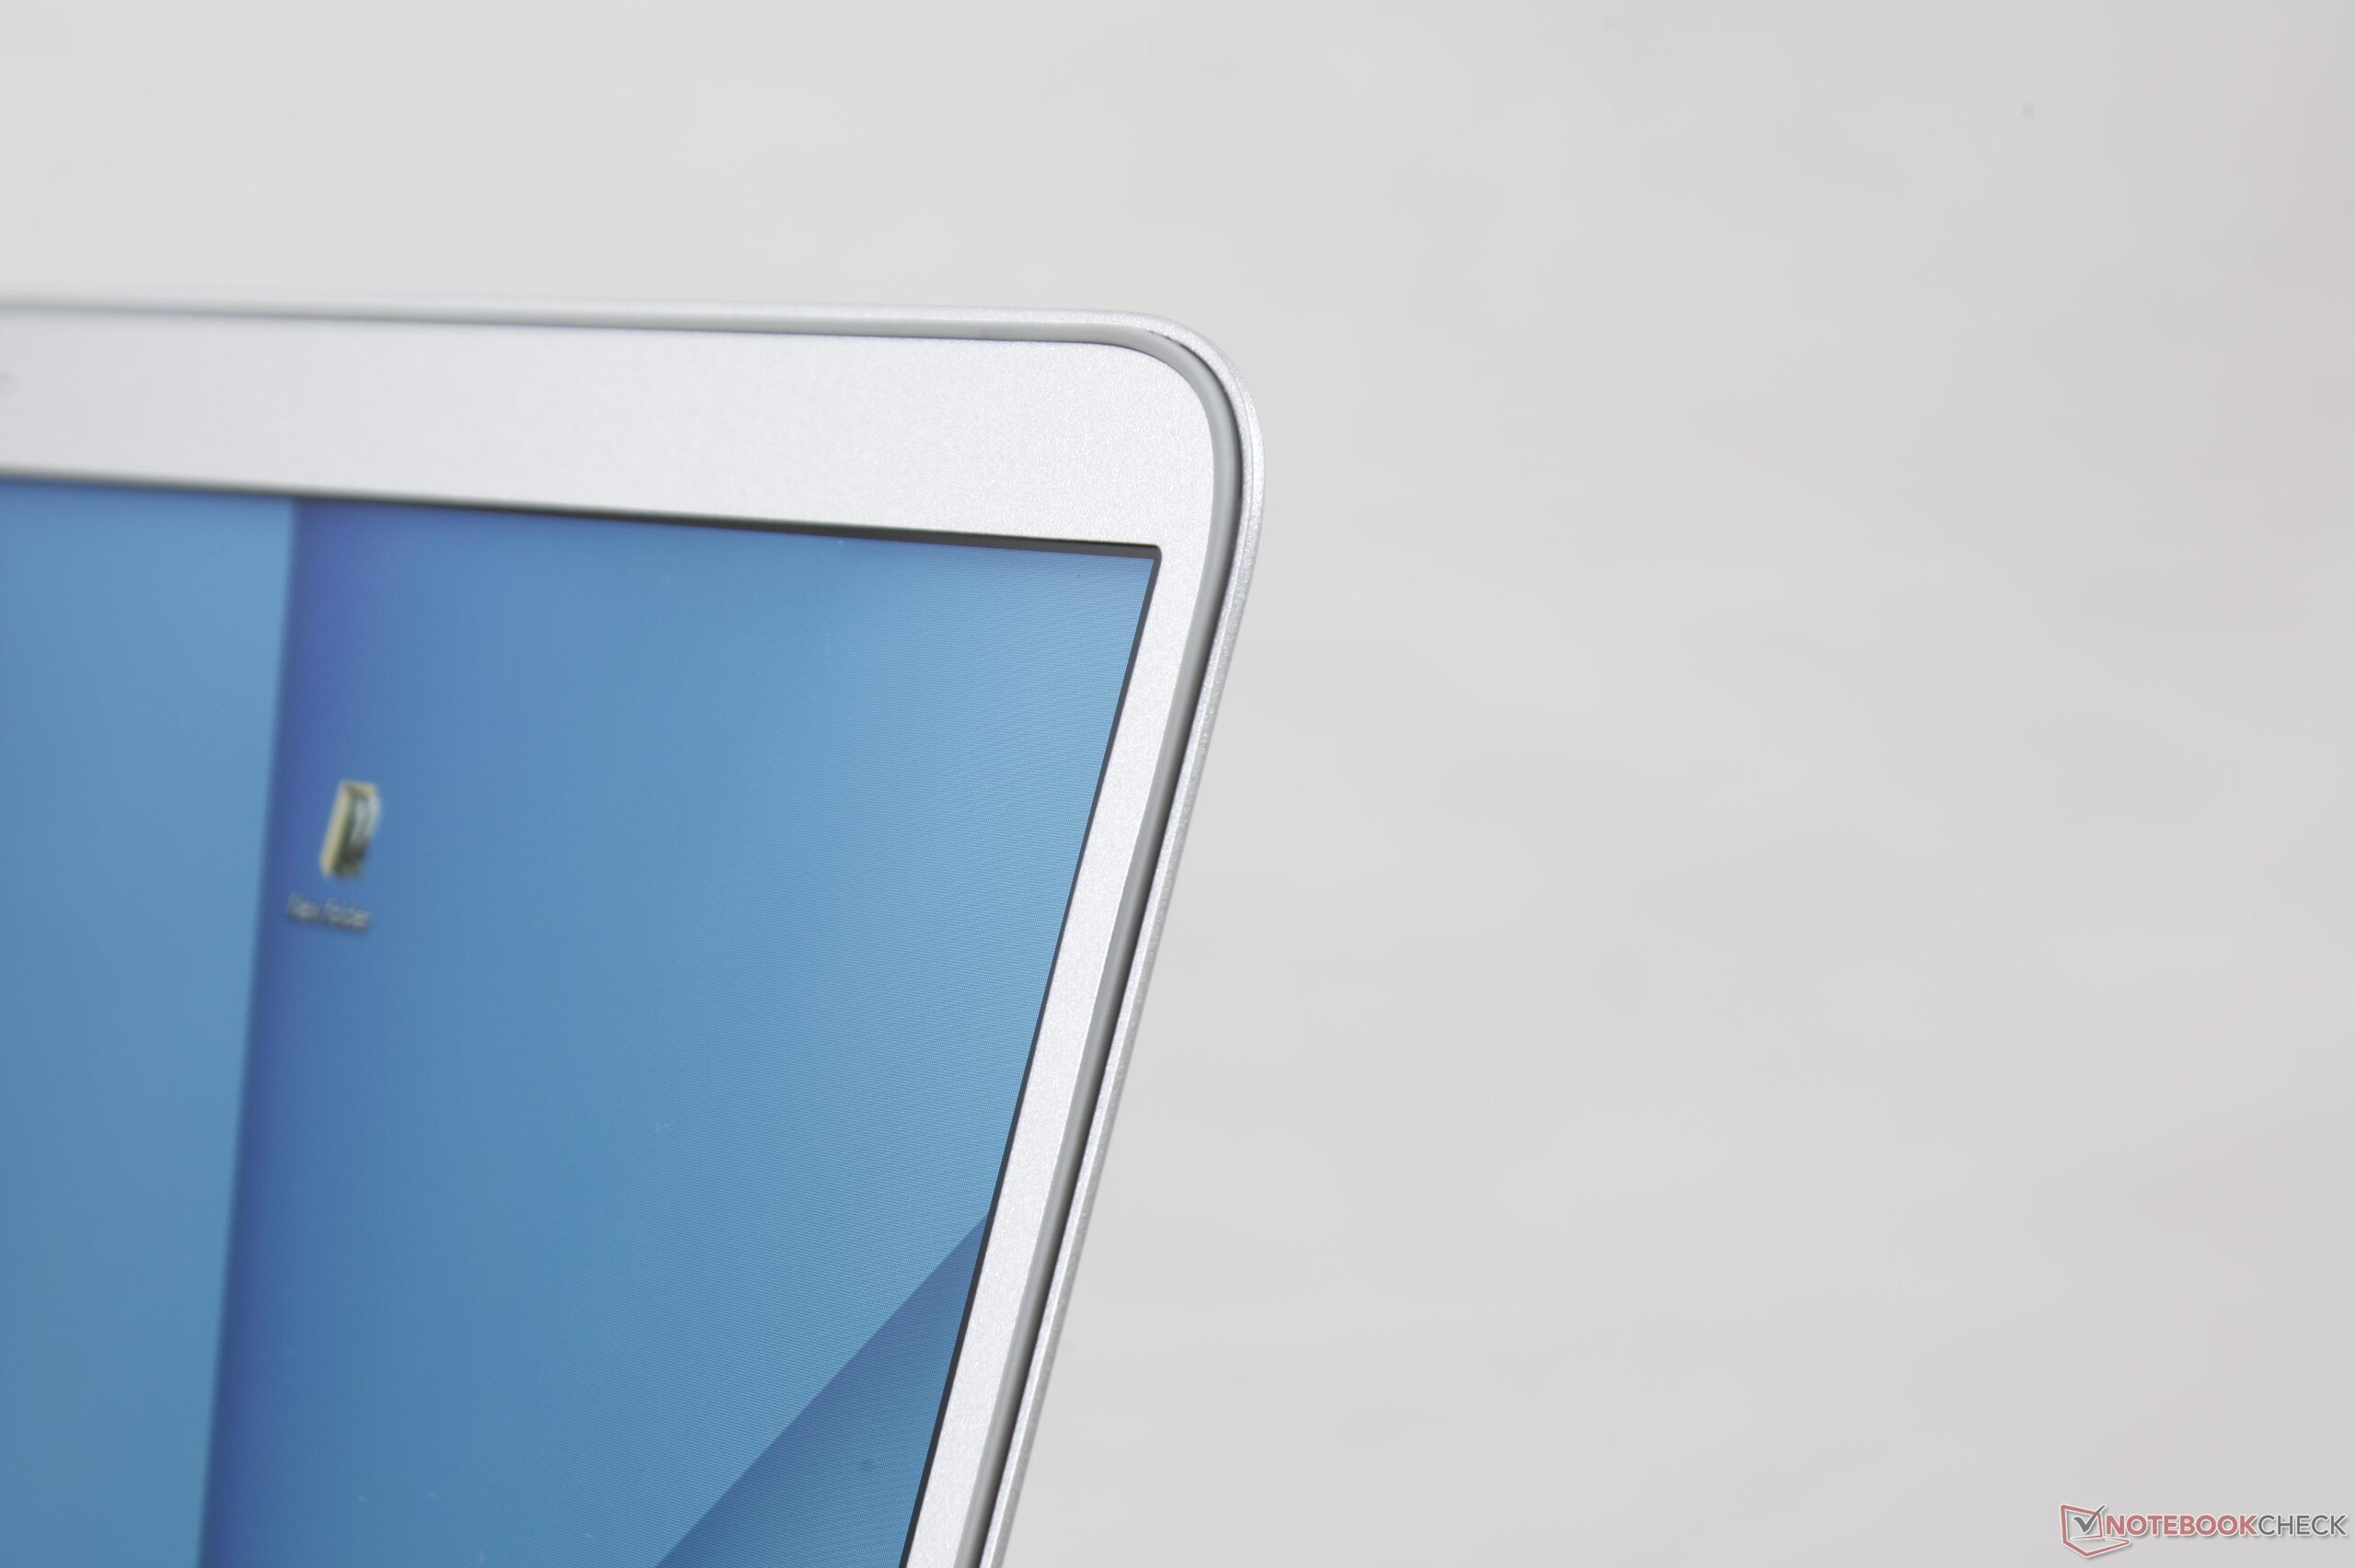
La determinazione Samsung a realizzare l'Ultrabook più leggero ha comportato dei sacrifici. Per tenere basso il peso, manca un touchscreen e le opzioni Gorilla Glass inoltre sistema di raffreddamento e capacità della batteria sono limitati. Quest'ultima comporta una autonomia sotto la media per in portatile che per il resto è eccellente da usare quando siete in giro. La rigidità dello chassis, non è male, ma nemmeno al livello di XPS 13 o MacBook Pro 13.
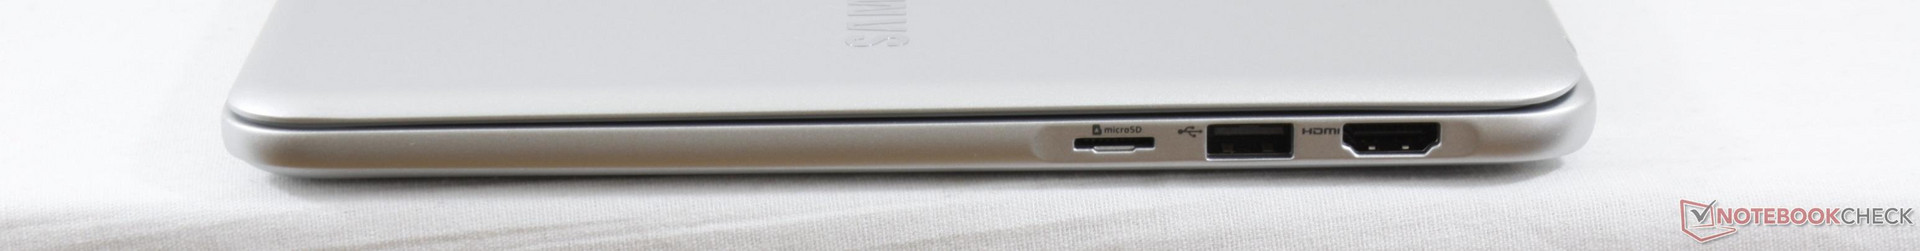
Speriamo che future revisioni aggiungeranno Thunderbolt 3, compatibilità SIM, e pannello matto come opzione in modo da rendere ancora migliore come compagni di viaggio il Notebook 9. Sino ad allora, coloro che vogliono qualcosa più di leggero e luminoso rispetto all'XPS 13 senza sacrificare USB full-size o porte HDMI come su Zenbook 3, Matebook X, Yoga 910, o Spectre 13 non saranno delusi da questo Samsung.
Il display extra luminoso e la leggerezza rendono questo 13" Notebook 9 un ottimo acquisto per chi è sempre in giro. Se l'autonomia e le possibilità docking Thunderbolt 3 sono più importanti, tuttavia, ci sono molte opzioni migliori.
Nota: si tratta di una recensione breve, con alcune sezioni non tradotte, per la versione integrale in inglese guardate qui.
Samsung Notebook 9 NP900X3N-K01US
- 08/29/2017 v6 (old)
Allen Ngo
Price comparison
