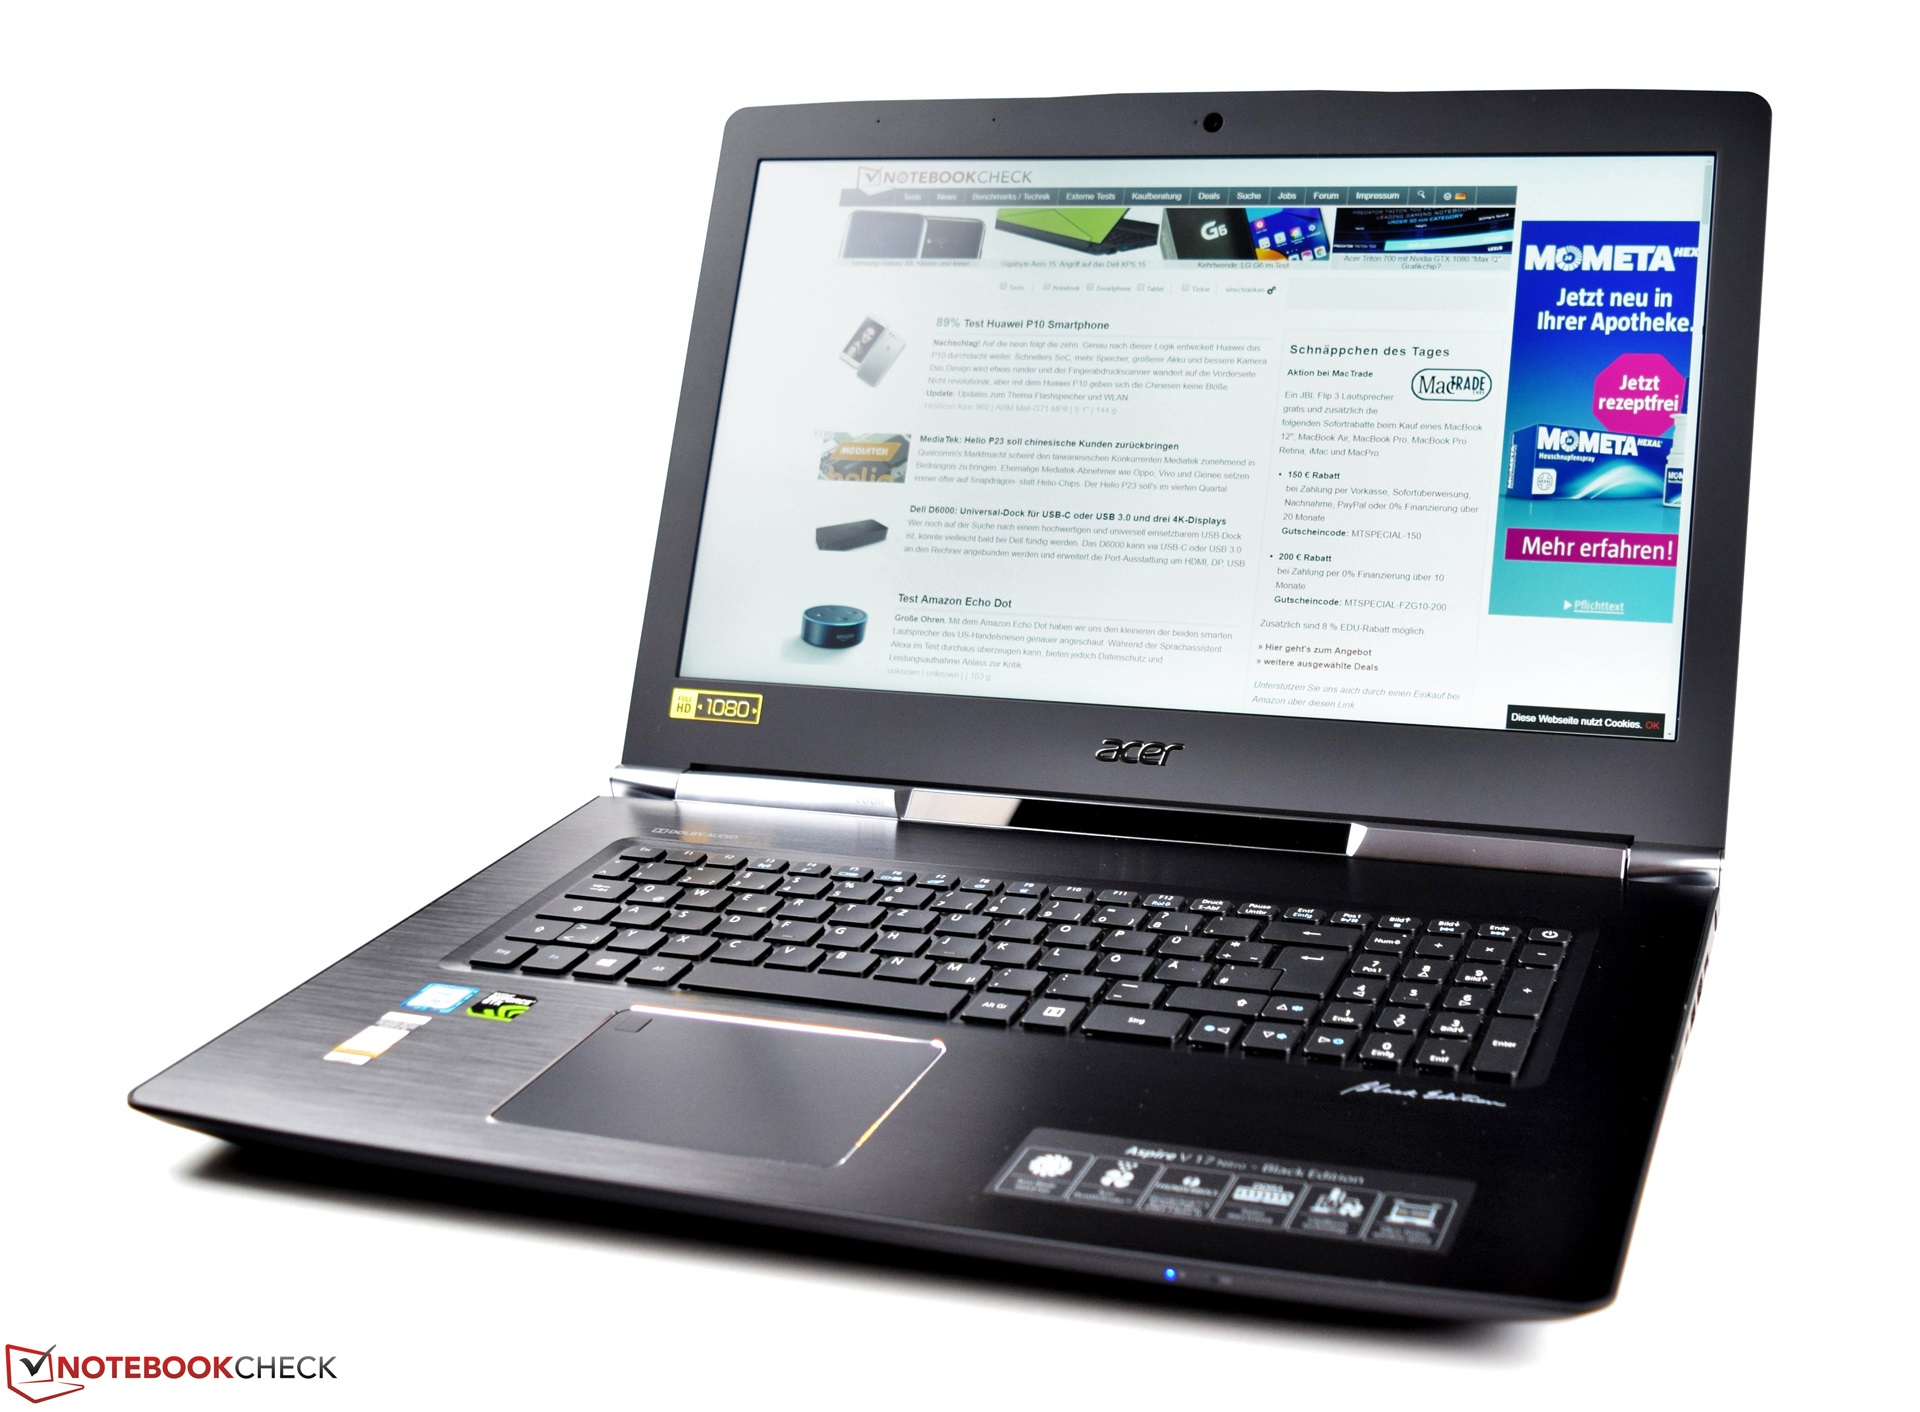
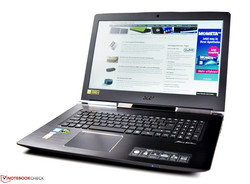
Recensione breve del Portatile Acer Aspire V17 Nitro BE VN7-793G (7300HQ, GTX 1060, FHD, Eye-Tracking)

| SD Card Reader | |
| average JPG Copy Test (av. of 3 runs) | |
| MSI GT72VR 7RE-433 | |
| Gigabyte P57X v7 | |
| Asus Strix GL753VD-GC045T | |
| HP Omen 17-w100ng | |
| HP Pavilion 17t-ab200 | |
| Acer Aspire V17 Nitro BE VN7-793G-52XN | |
| maximum AS SSD Seq Read Test (1GB) | |
| MSI GT72VR 7RE-433 | |
| HP Pavilion 17t-ab200 | |
| Gigabyte P57X v7 | |
| HP Omen 17-w100ng | |
| Asus Strix GL753VD-GC045T | |
| Acer Aspire V17 Nitro BE VN7-793G-52XN | |
| |||||||||||||||||||||||||
Distribuzione della luminosità: 84 %
Al centro con la batteria: 346 cd/m²
Contrasto: 1331:1 (Nero: 0.26 cd/m²)
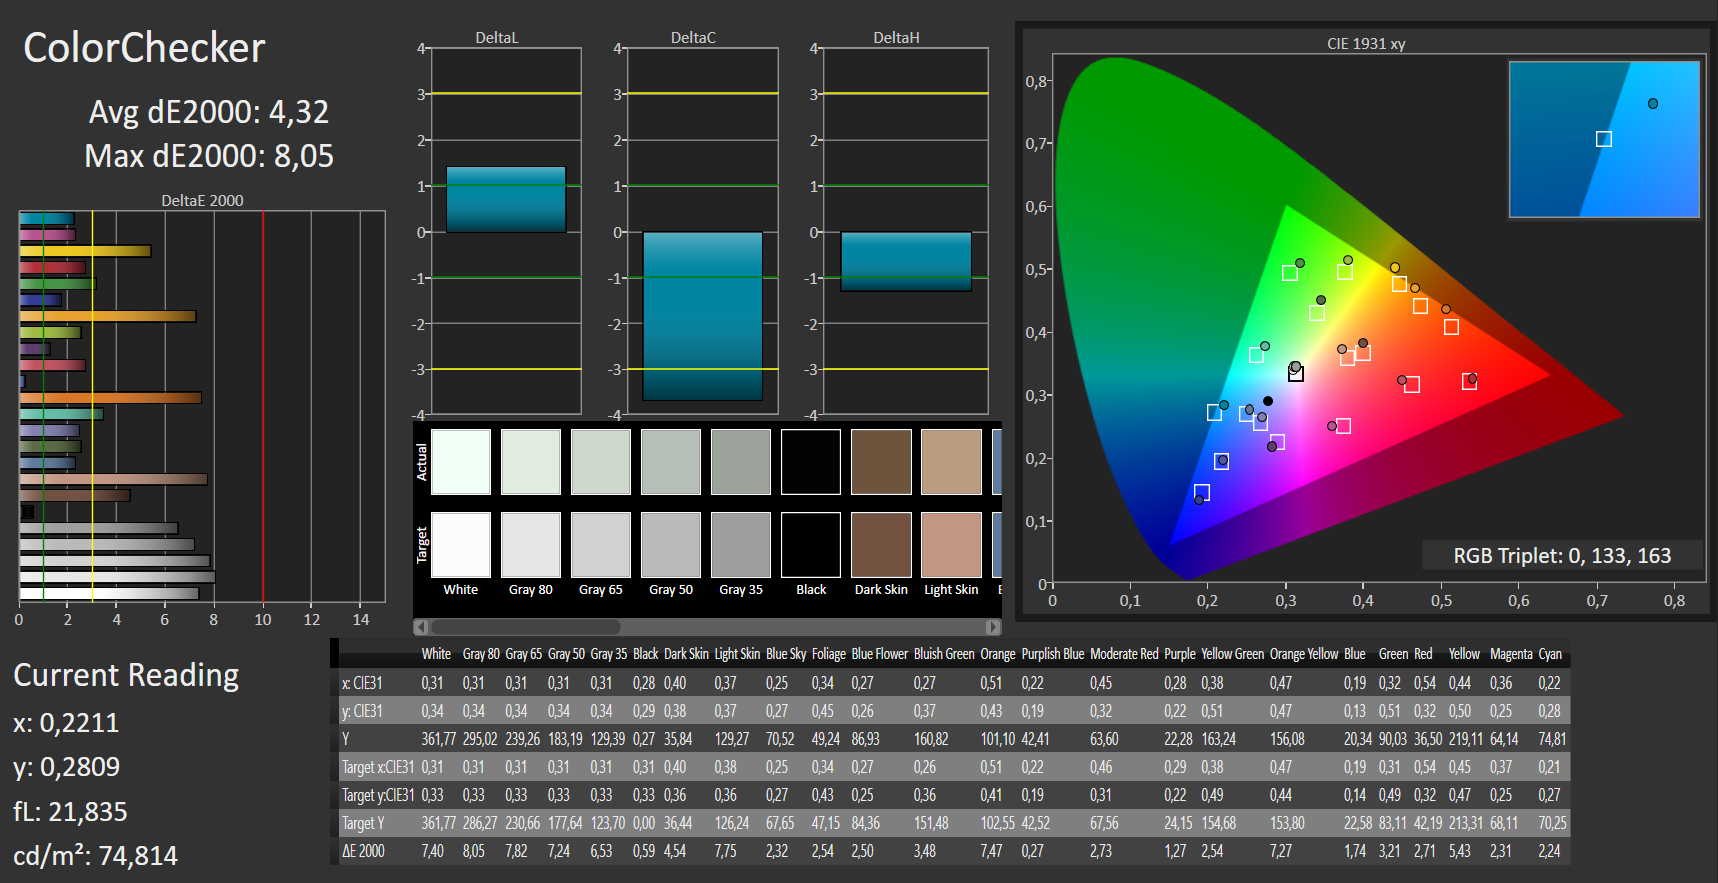
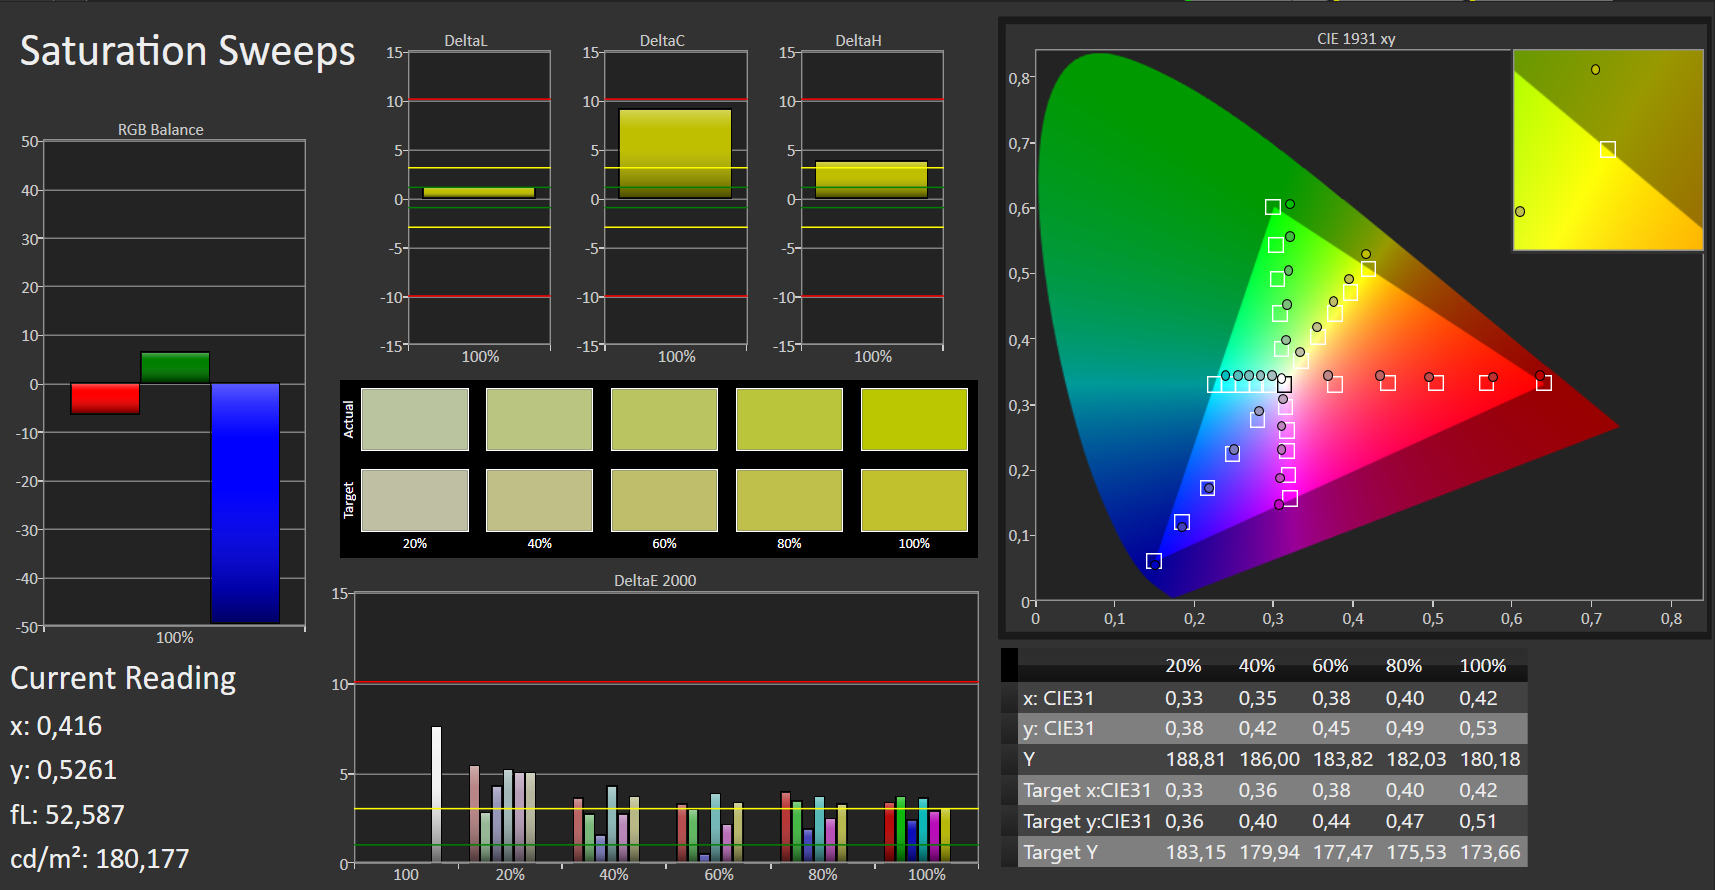
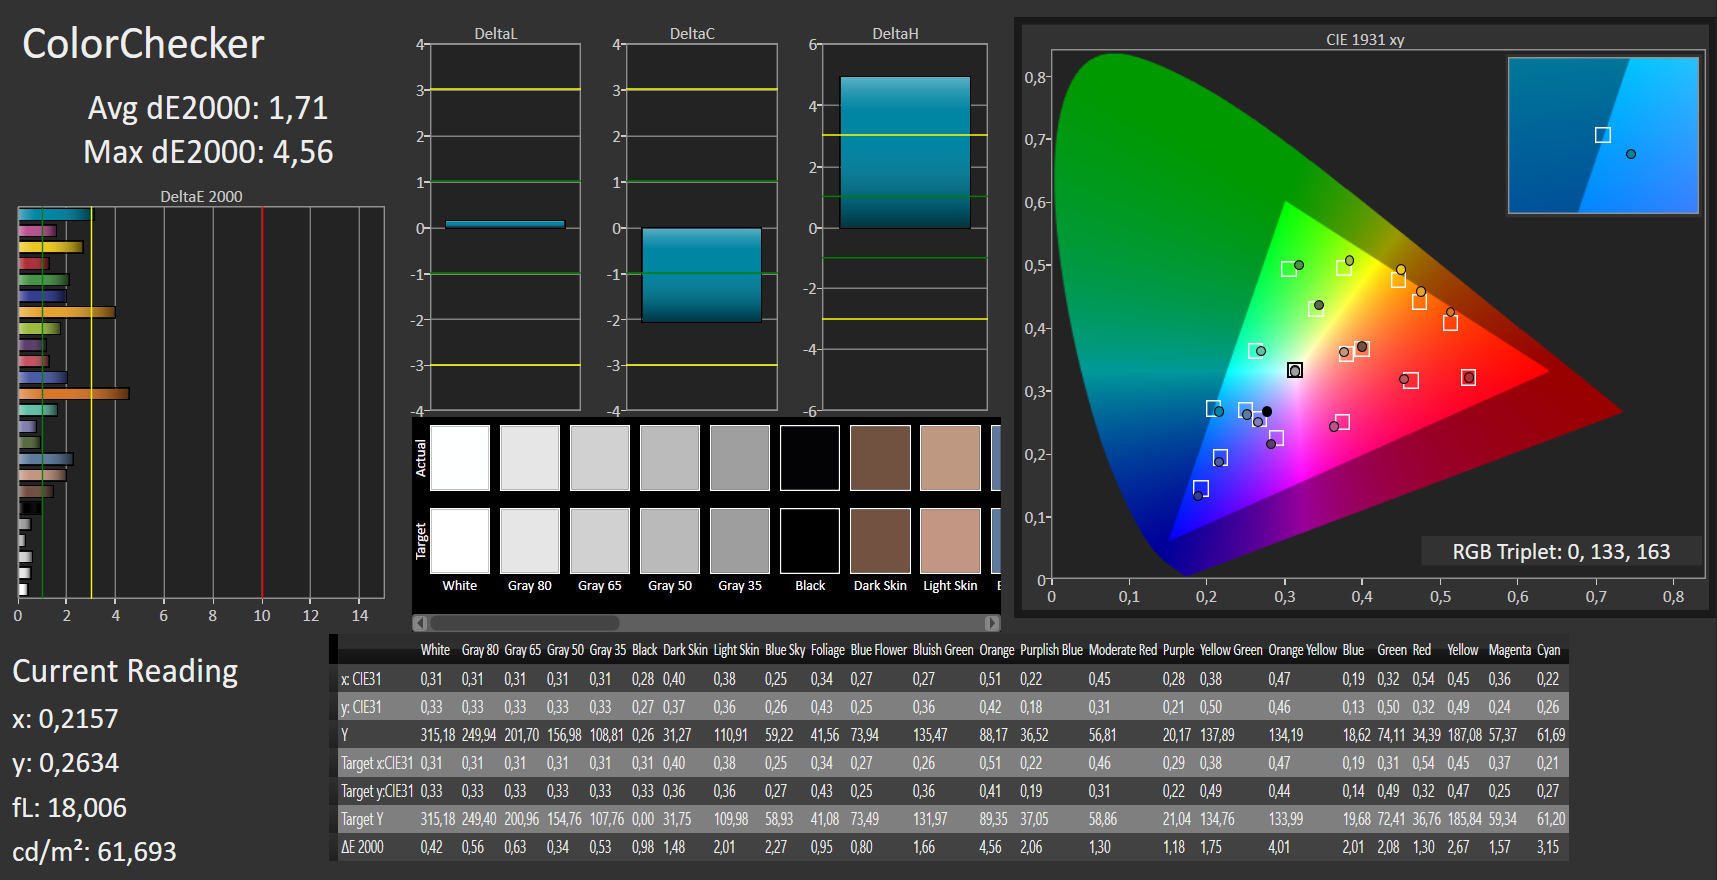
ΔE ColorChecker Calman: 4.32 | ∀{0.5-29.43 Ø4.71}
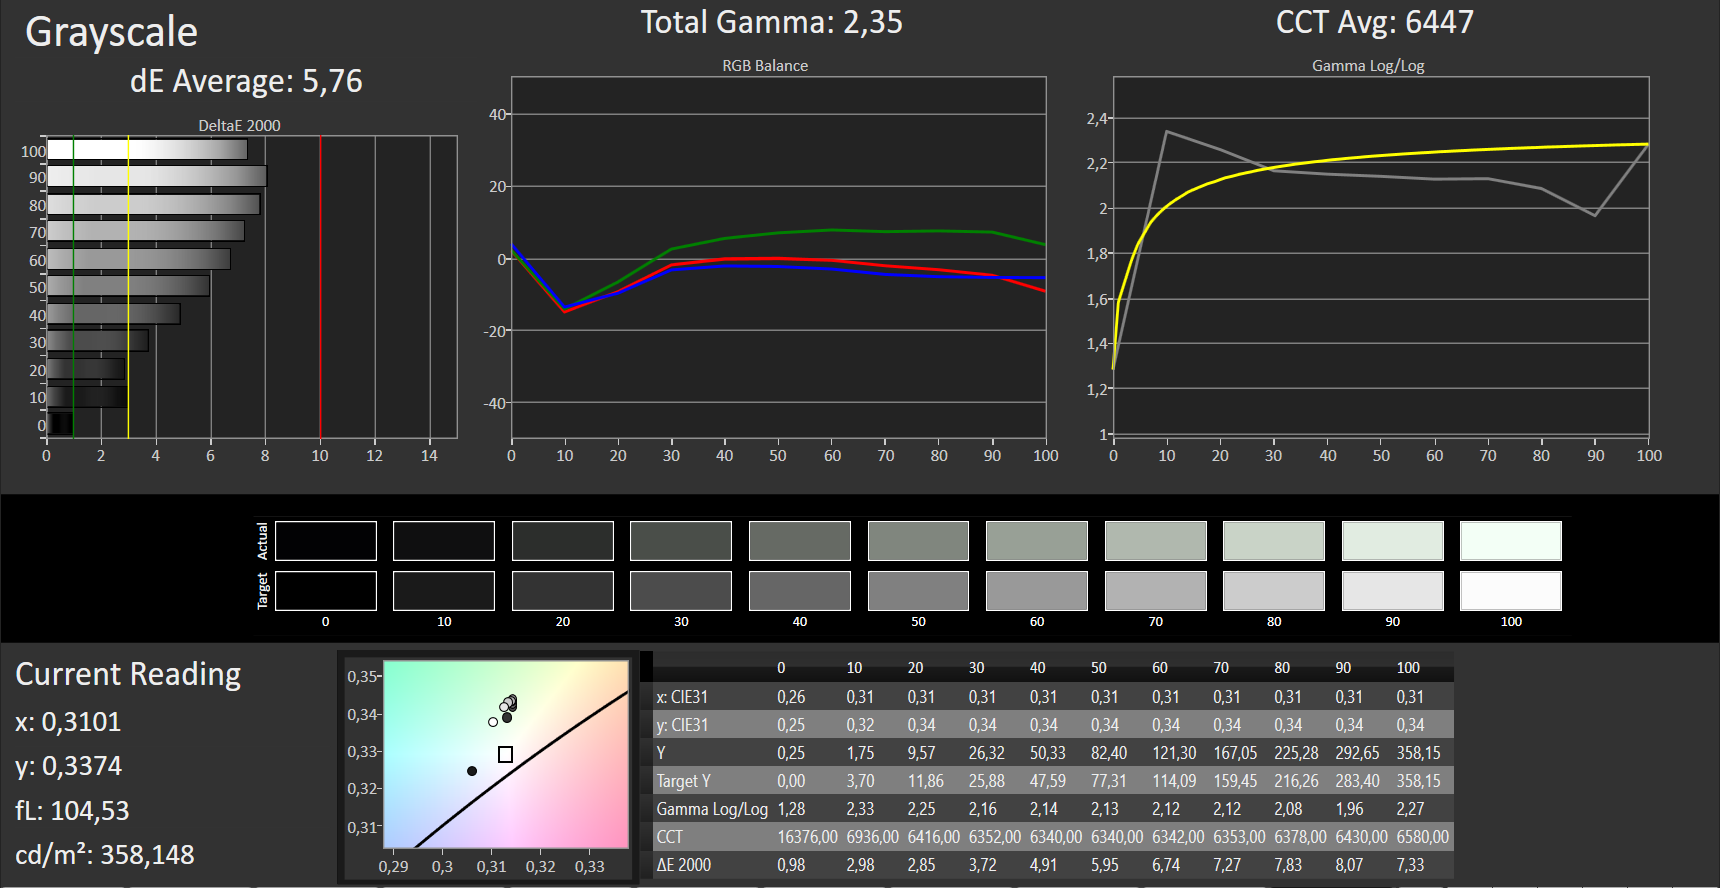
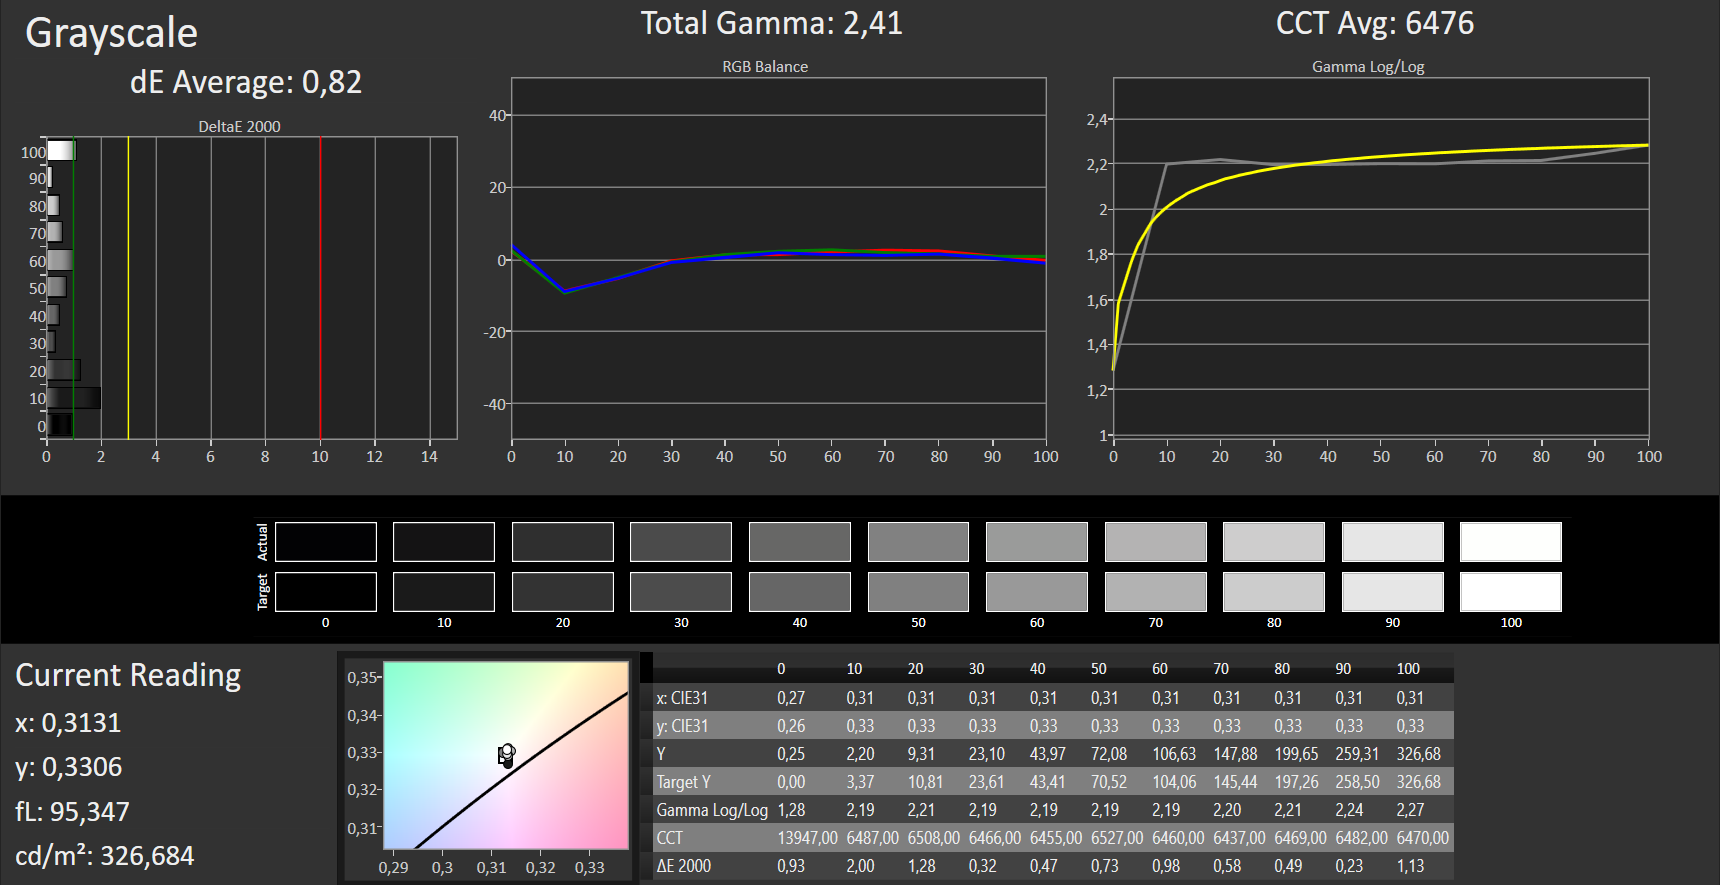
ΔE Greyscale Calman: 5.76 | ∀{0.09-98 Ø4.96}
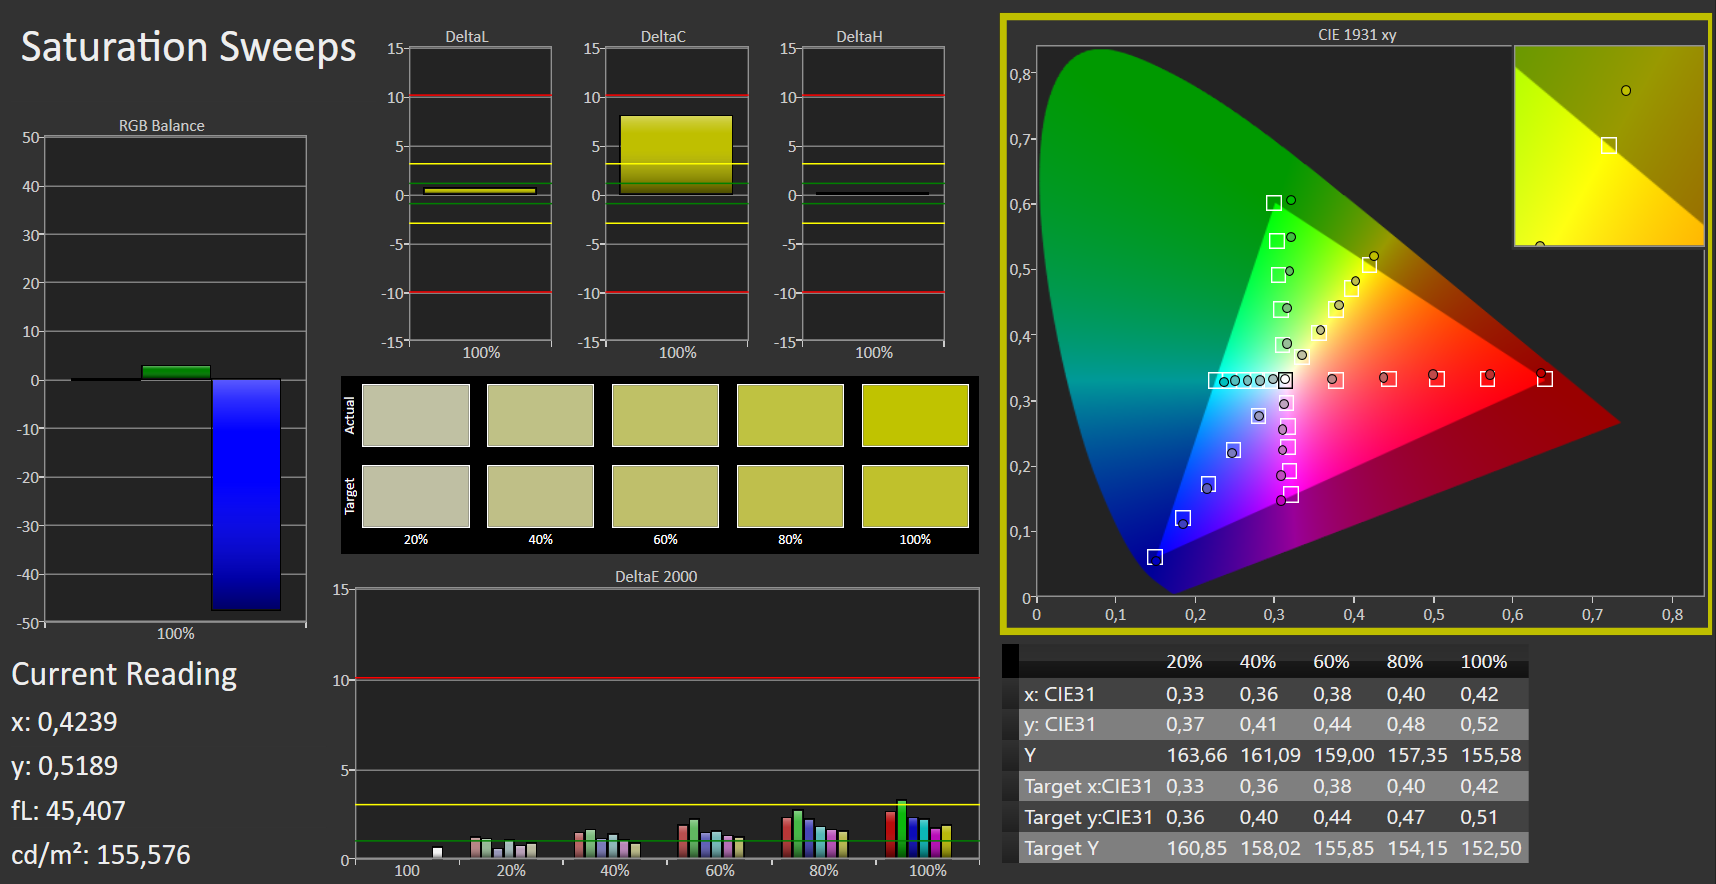
90% sRGB (Argyll 1.6.3 3D)
59% AdobeRGB 1998 (Argyll 1.6.3 3D)
65.4% AdobeRGB 1998 (Argyll 3D)
90.2% sRGB (Argyll 3D)
64% Display P3 (Argyll 3D)
Gamma: 2.35
CCT: 6447 K
| Acer Aspire V17 Nitro BE VN7-793G-52XN a-Si TFT-LCD, WLED, 1920x1080, 17.3" | Asus Strix GL753VD-GC045T LED IPS, 1920x1080, 17.3" | MSI GT72VR 7RE-433 TN LED, 1920x1080, 17.3" | Gigabyte P57X v7 IPS, 3840x2160, 17.3" | HP Pavilion 17t-ab200 IPS, 1920x1080, 17.3" | HP Omen 17-w100ng IPS, 1920x1080, 17.3" | |
|---|---|---|---|---|---|---|
| Display | -2% | 0% | 33% | -1% | -1% | |
| Display P3 Coverage (%) | 64 | 67.1 5% | 68.3 7% | 87.8 37% | 65.2 2% | 67.2 5% |
| sRGB Coverage (%) | 90.2 | 84.8 -6% | 86.7 -4% | 100 11% | 87.6 -3% | 86.6 -4% |
| AdobeRGB 1998 Coverage (%) | 65.4 | 62 -5% | 63.4 -3% | 98.9 51% | 64.1 -2% | 63.3 -3% |
| Response Times | -2% | 46% | -67% | -5% | 4% | |
| Response Time Grey 50% / Grey 80% * (ms) | 36 ? | 33.2 ? 8% | 29 ? 19% | 55.6 ? -54% | 36.8 -2% | 35 ? 3% |
| Response Time Black / White * (ms) | 26 ? | 28.8 ? -11% | 7 ? 73% | 46.8 ? -80% | 28 -8% | 25 ? 4% |
| PWM Frequency (Hz) | 1000 ? | |||||
| Screen | -17% | -29% | 1% | -17% | -2% | |
| Brightness middle (cd/m²) | 346 | 349 1% | 299 -14% | 441.3 28% | 278.8 -19% | 342 -1% |
| Brightness (cd/m²) | 307 | 337 10% | 277 -10% | 408 33% | 265 -14% | 331 8% |
| Brightness Distribution (%) | 84 | 91 8% | 87 4% | 86 2% | 91 8% | 84 0% |
| Black Level * (cd/m²) | 0.26 | 0.58 -123% | 0.27 -4% | 0.44 -69% | 0.28 -8% | 0.32 -23% |
| Contrast (:1) | 1331 | 602 -55% | 1107 -17% | 1003 -25% | 996 -25% | 1069 -20% |
| Colorchecker dE 2000 * | 4.32 | 4.5 -4% | 9.65 -123% | 5.1 -18% | 5.8 -34% | 4.35 -1% |
| Colorchecker dE 2000 max. * | 8.05 | 10.2 -27% | 15.43 -92% | 9.8 -22% | 10.6 -32% | 9.24 -15% |
| Greyscale dE 2000 * | 5.76 | 3.3 43% | 9.68 -68% | 4.3 25% | 8.3 -44% | 3.73 35% |
| Gamma | 2.35 94% | 2.15 102% | 1.89 116% | 2.08 106% | 2.1 105% | 2.23 99% |
| CCT | 6447 101% | 6103 107% | 11652 56% | 7345 88% | 5723 114% | 6801 96% |
| Color Space (Percent of AdobeRGB 1998) (%) | 59 | 55.7 -6% | 75 27% | 87 47% | 57 -3% | 57 -3% |
| Color Space (Percent of sRGB) (%) | 90 | 75.7 -16% | 100 11% | 100 11% | 87 -3% | 86 -4% |
| Media totale (Programma / Settaggio) | -7% /
-12% | 6% /
-13% | -11% /
-2% | -8% /
-12% | 0% /
-1% |
* ... Meglio usare valori piccoli
Tempi di risposta del Display
| ↔ Tempi di risposta dal Nero al Bianco | ||
|---|---|---|
| 26 ms ... aumenta ↗ e diminuisce ↘ combinato | ↗ 15 ms Incremento | 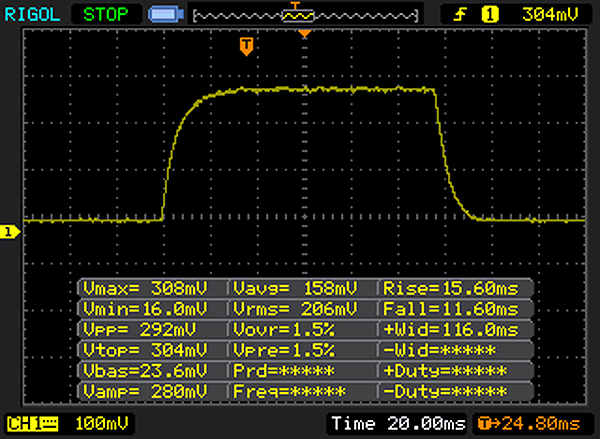 |
| ↘ 11 ms Calo | ||
| Lo schermo mostra tempi di risposta relativamente lenti nei nostri tests e potrebbe essere troppo lento per i gamers. In confronto, tutti i dispositivi di test variano da 0.1 (minimo) a 240 (massimo) ms. » 63 % di tutti i dispositivi è migliore. Questo significa che i tempi di risposta rilevati sono peggiori rispetto alla media di tutti i dispositivi testati (19.8 ms). | ||
| ↔ Tempo di risposta dal 50% Grigio all'80% Grigio | ||
| 36 ms ... aumenta ↗ e diminuisce ↘ combinato | ↗ 20 ms Incremento | 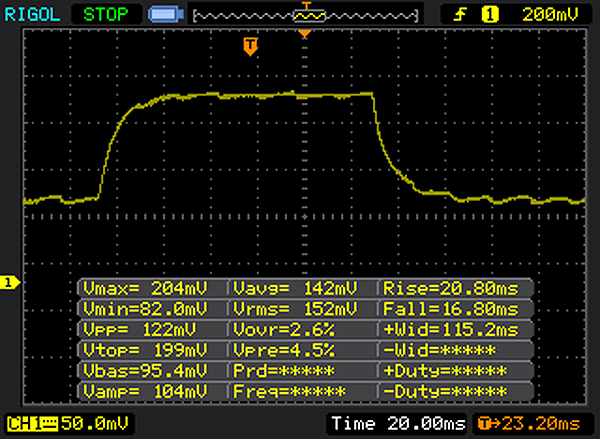 |
| ↘ 16 ms Calo | ||
| Lo schermo mostra tempi di risposta lenti nei nostri tests e sarà insoddisfacente per i gamers. In confronto, tutti i dispositivi di test variano da 0.165 (minimo) a 636 (massimo) ms. » 51 % di tutti i dispositivi è migliore. Questo significa che i tempi di risposta rilevati sono peggiori rispetto alla media di tutti i dispositivi testati (31 ms). | ||
Sfarfallio dello schermo / PWM (Pulse-Width Modulation)
| flickering dello schermo / PWM non rilevato | ||
In confronto: 52 % di tutti i dispositivi testati non utilizza PWM per ridurre la luminosita' del display. Se è rilevato PWM, una media di 7754 (minimo: 5 - massimo: 343500) Hz è stata rilevata. | ||
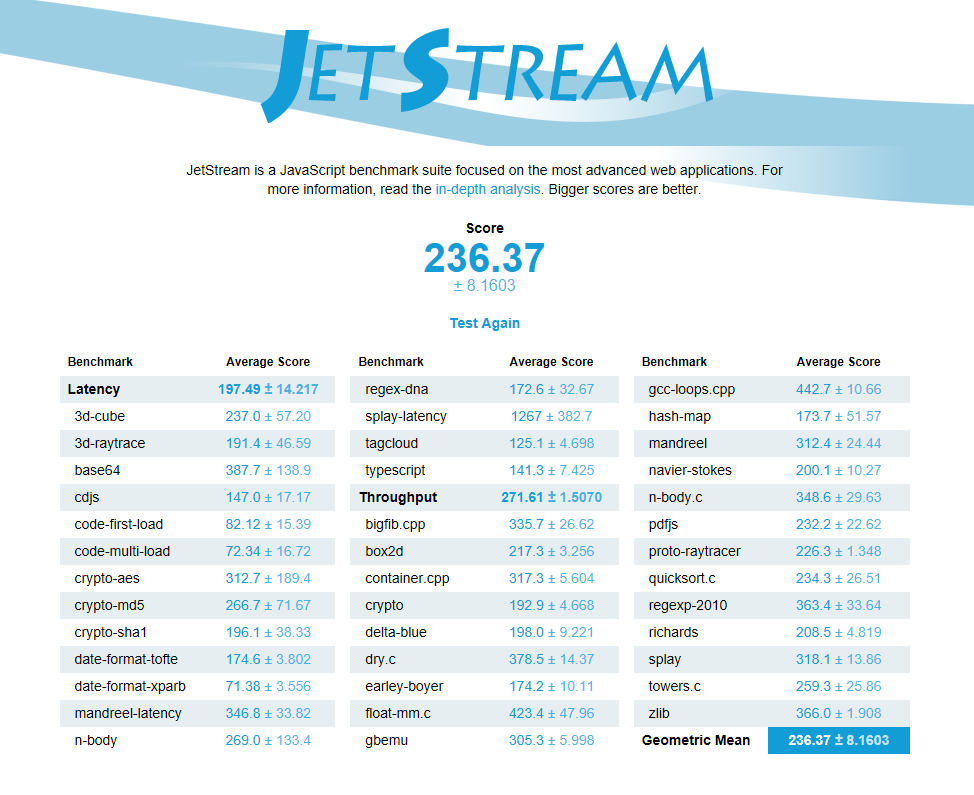
| JetStream 1.1 - 1.1 Total | |
| HP Pavilion 17t-ab200 | |
| MSI GT72VR 7RE-433 | |
| Acer Aspire V17 Nitro BE VN7-793G-52XN | |
| HP Omen 17-w100ng | |
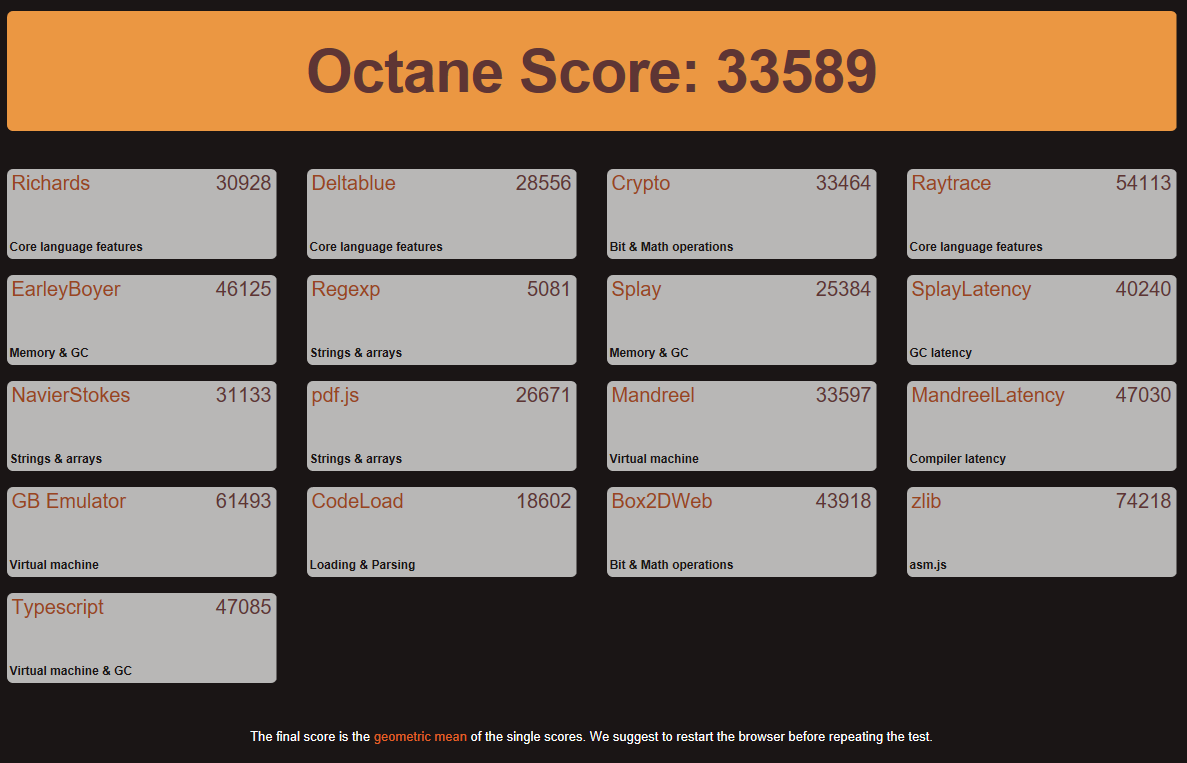
| Octane V2 - Total Score | |
| HP Pavilion 17t-ab200 | |
| MSI GT72VR 7RE-433 | |
| Acer Aspire V17 Nitro BE VN7-793G-52XN | |
| HP Omen 17-w100ng | |
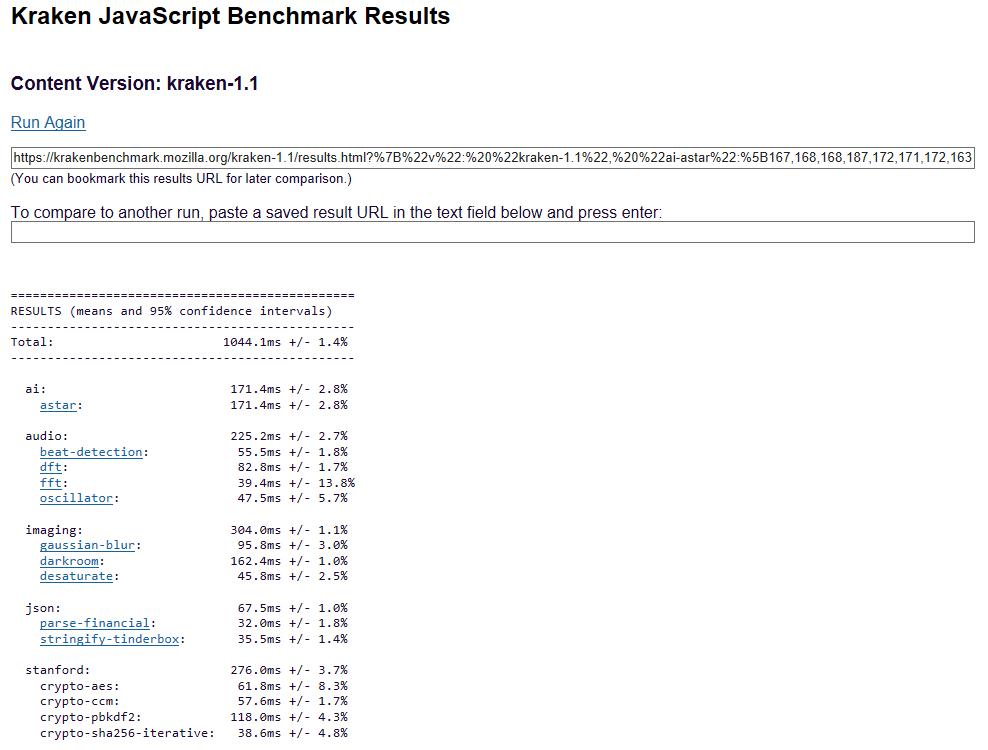
| Mozilla Kraken 1.1 - Total | |
| HP Omen 17-w100ng | |
| Acer Aspire V17 Nitro BE VN7-793G-52XN | |
| MSI GT72VR 7RE-433 | |
| HP Pavilion 17t-ab200 | |
* ... Meglio usare valori piccoli
| PCMark 8 | |
| Home Score Accelerated v2 | |
| MSI GT72VR 7RE-433 | |
| HP Omen 17-w100ng | |
| HP Pavilion 17t-ab200 | |
| Asus Strix GL753VD-GC045T | |
| Acer Aspire V17 Nitro BE VN7-793G-52XN | |
| Gigabyte P57X v7 | |
| Work Score Accelerated v2 | |
| MSI GT72VR 7RE-433 | |
| HP Omen 17-w100ng | |
| HP Pavilion 17t-ab200 | |
| Acer Aspire V17 Nitro BE VN7-793G-52XN | |
| Gigabyte P57X v7 | |
| Creative Score Accelerated v2 | |
| MSI GT72VR 7RE-433 | |
| HP Omen 17-w100ng | |
| HP Pavilion 17t-ab200 | |
| Gigabyte P57X v7 | |
| Acer Aspire V17 Nitro BE VN7-793G-52XN | |
| PCMark 7 | |
| Productivity | |
| MSI GT72VR 7RE-433 | |
| Acer Aspire V17 Nitro BE VN7-793G-52XN | |
| HP Omen 17-w100ng | |
| Score | |
| MSI GT72VR 7RE-433 | |
| HP Omen 17-w100ng | |
| Acer Aspire V17 Nitro BE VN7-793G-52XN | |
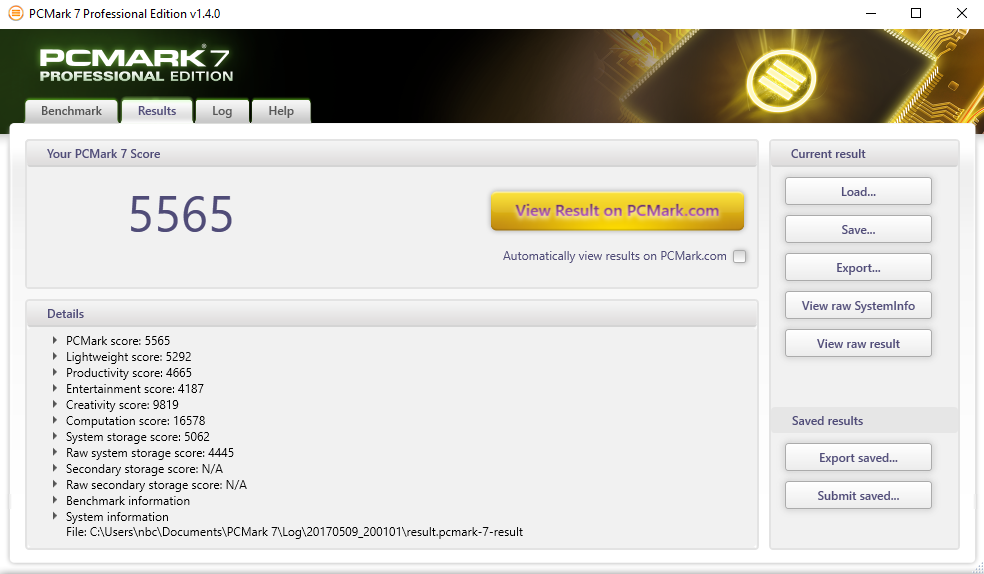
| PCMark 7 Score | 5565 punti | |
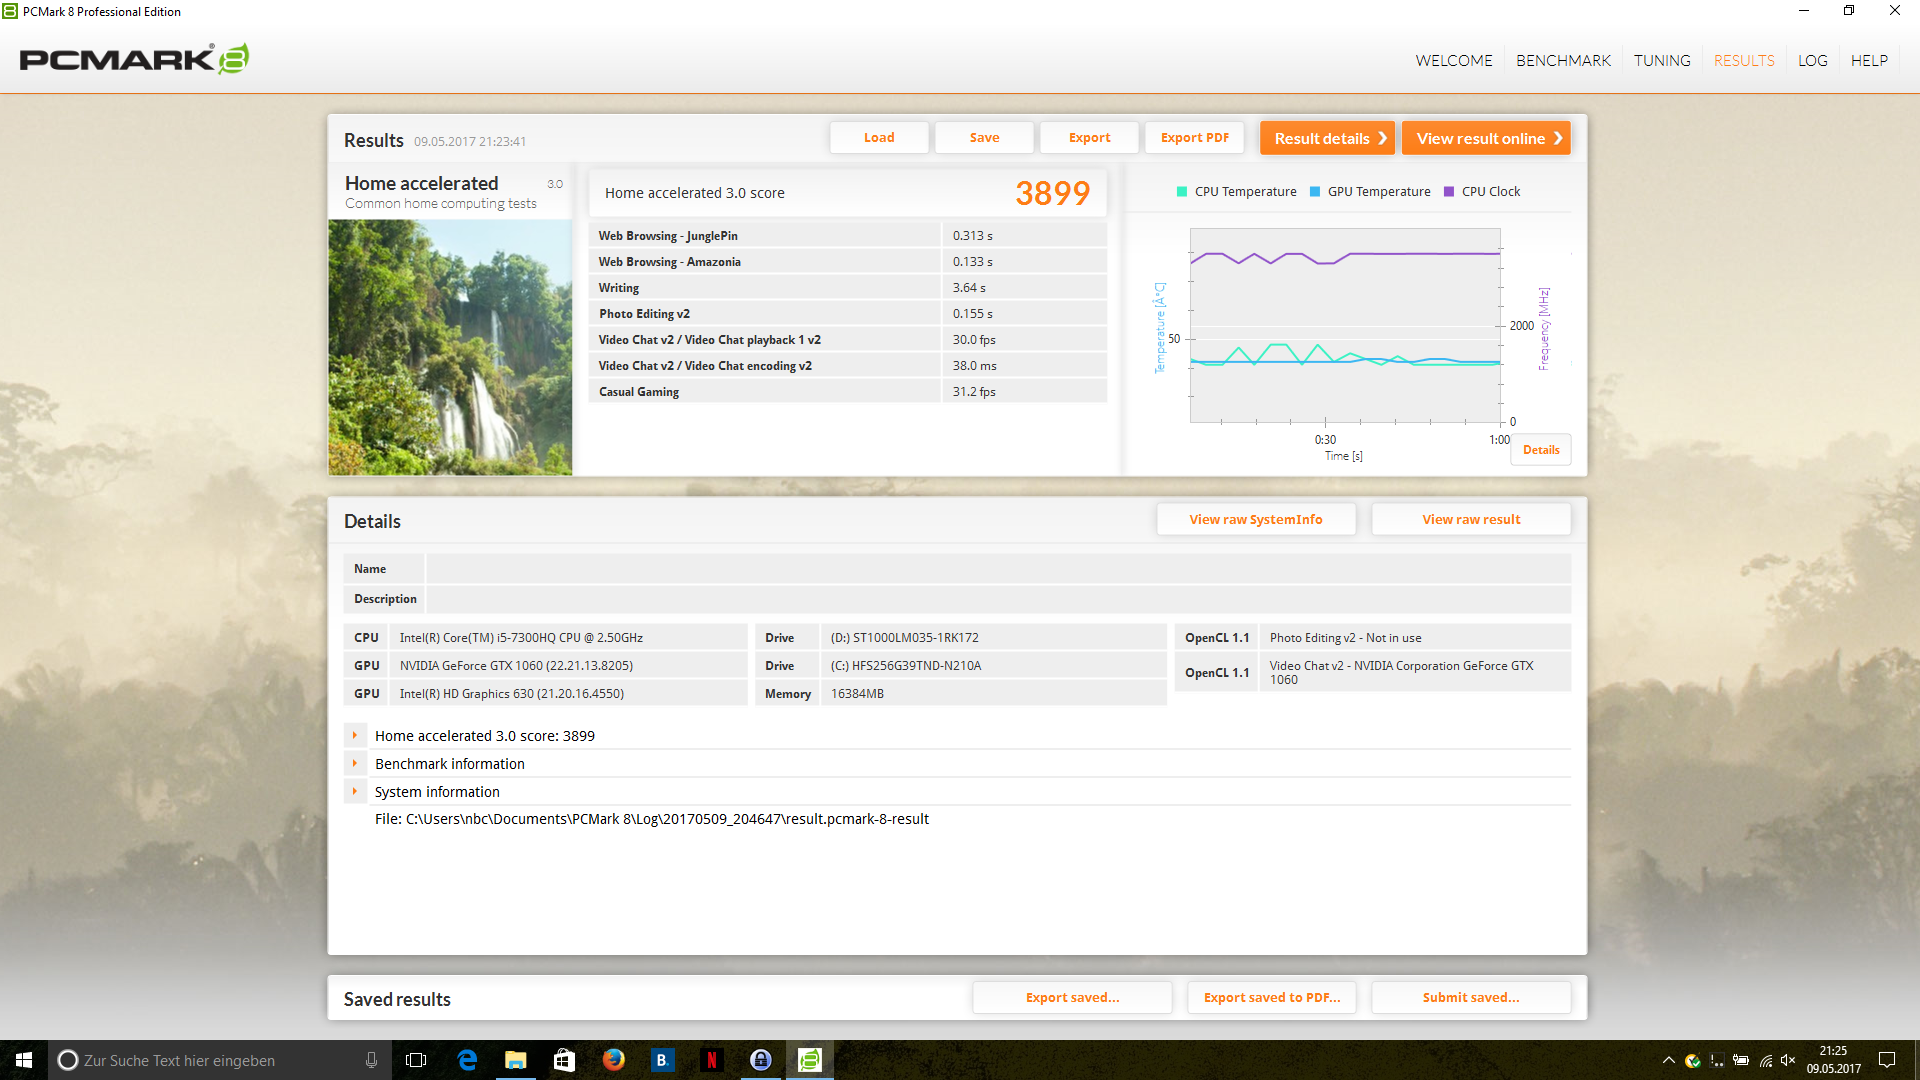
| PCMark 8 Home Score Accelerated v2 | 3899 punti | |
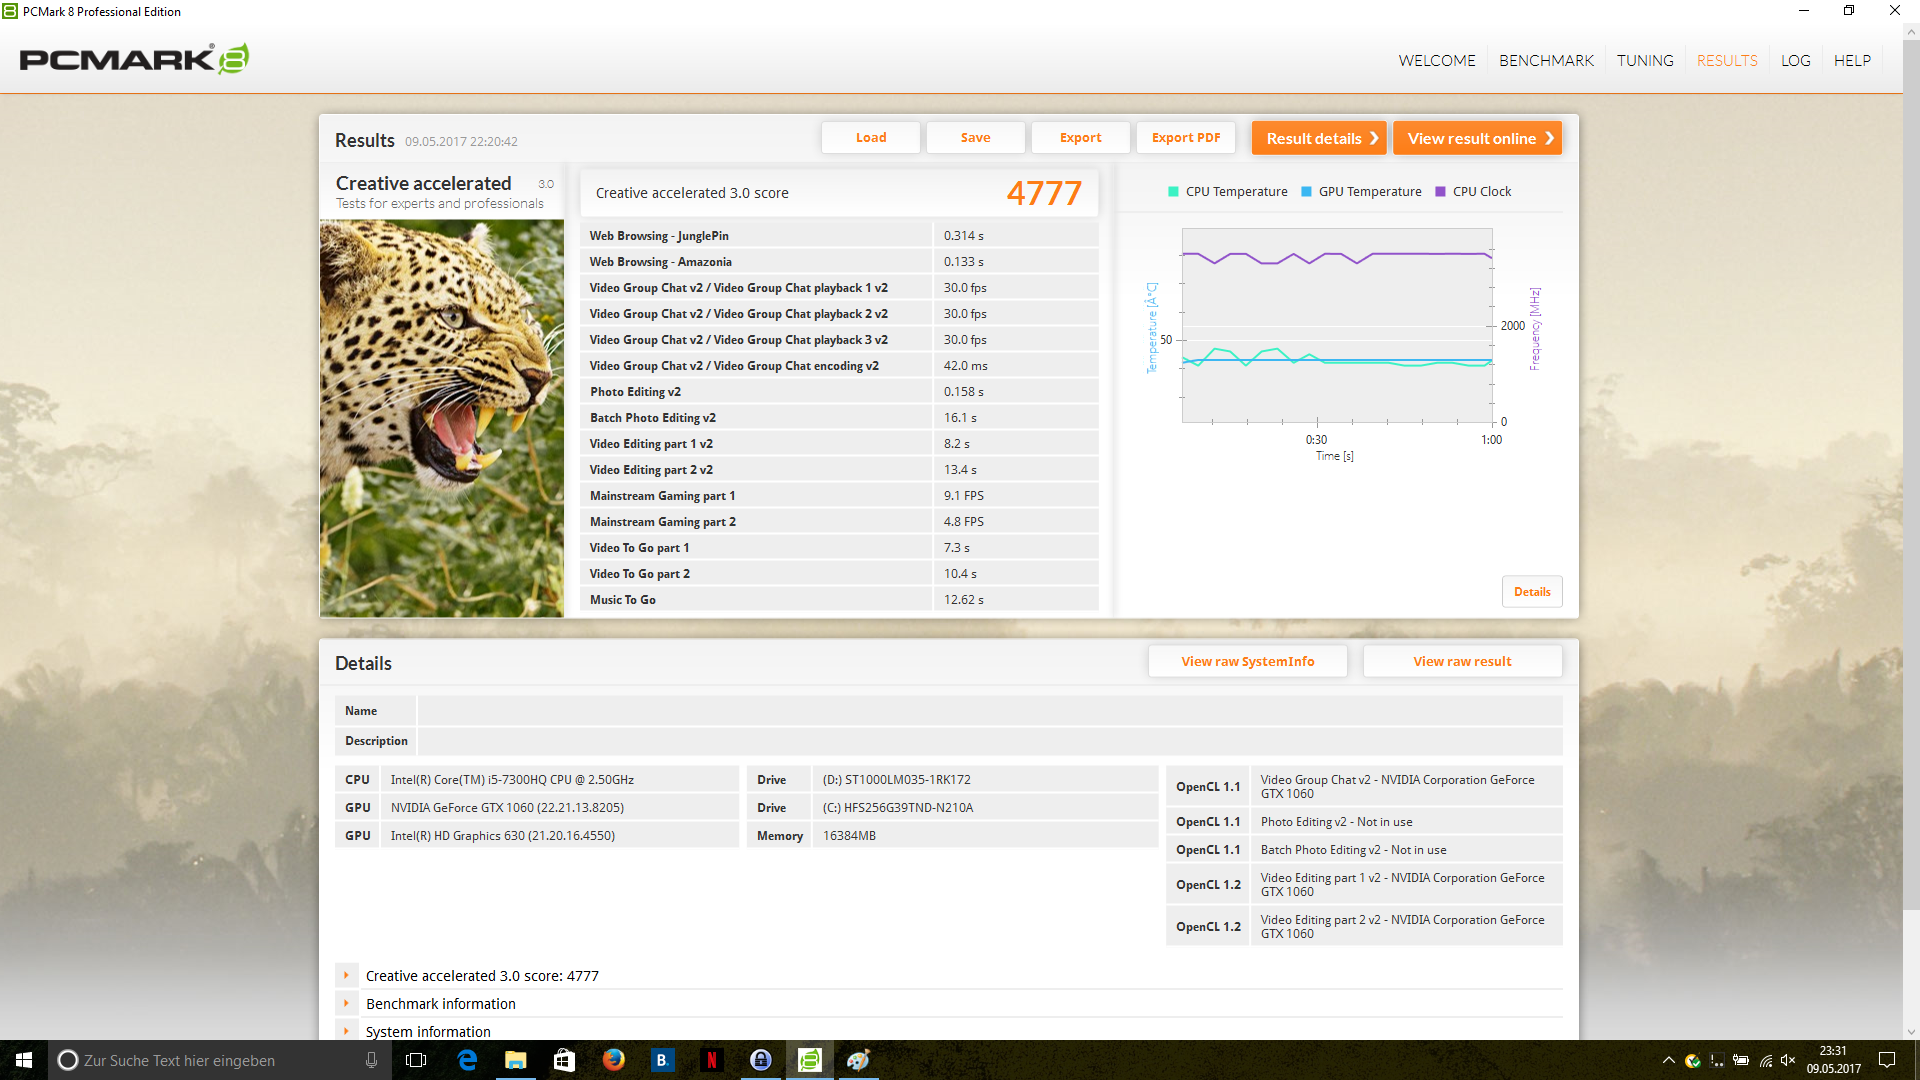
| PCMark 8 Creative Score Accelerated v2 | 4777 punti | |
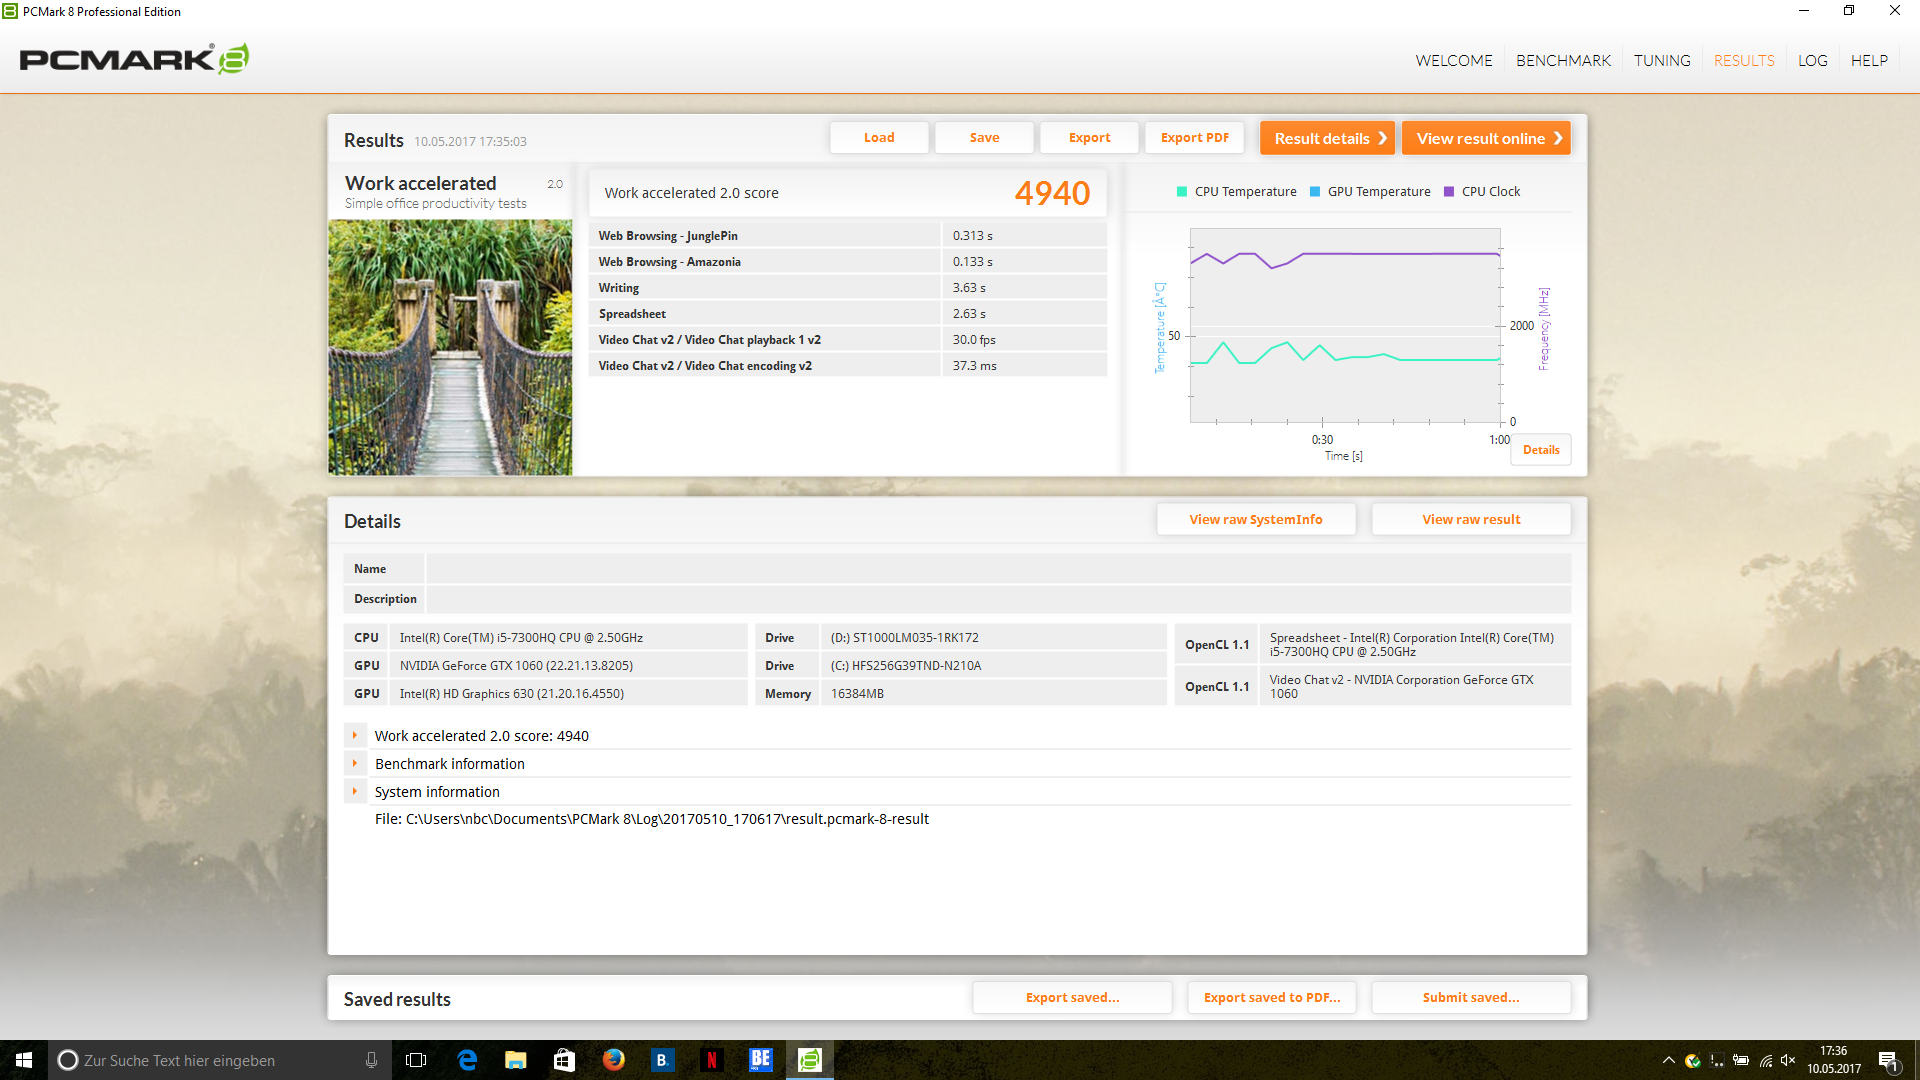
| PCMark 8 Work Score Accelerated v2 | 4940 punti | |
Aiuto | ||
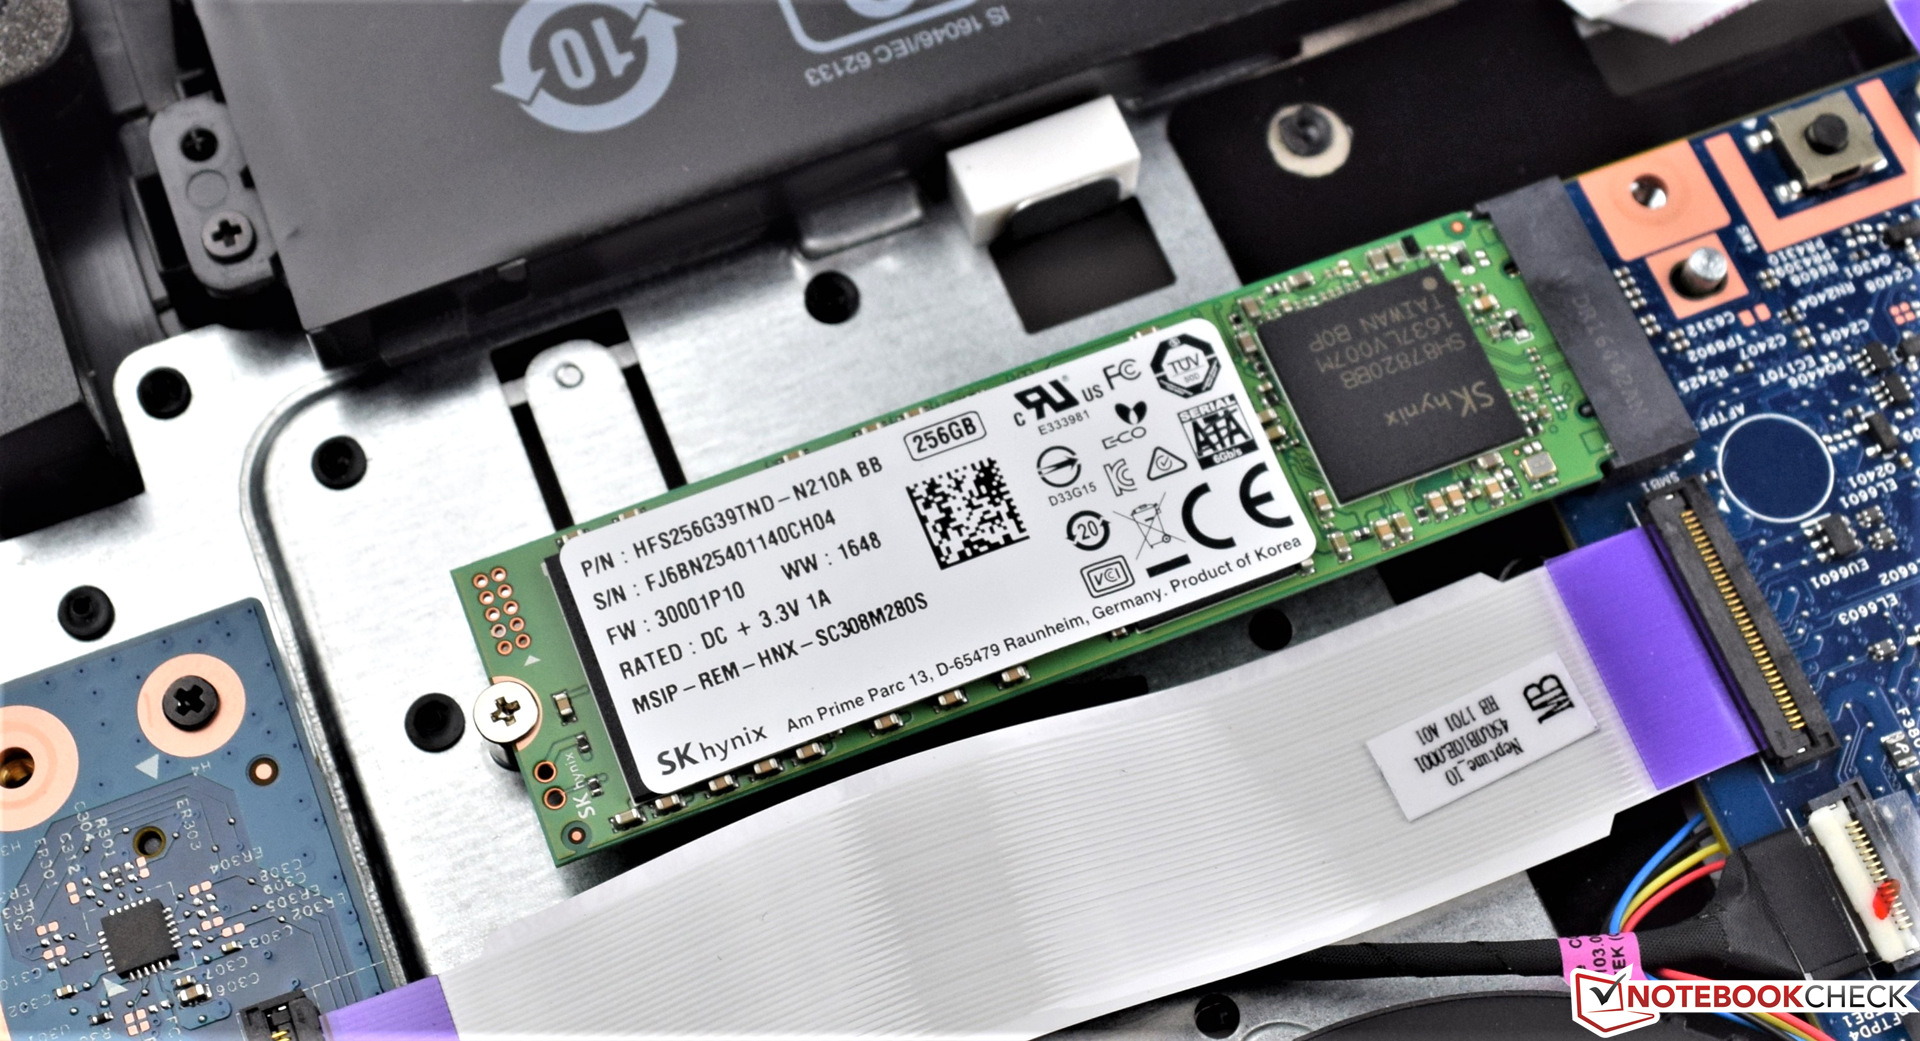
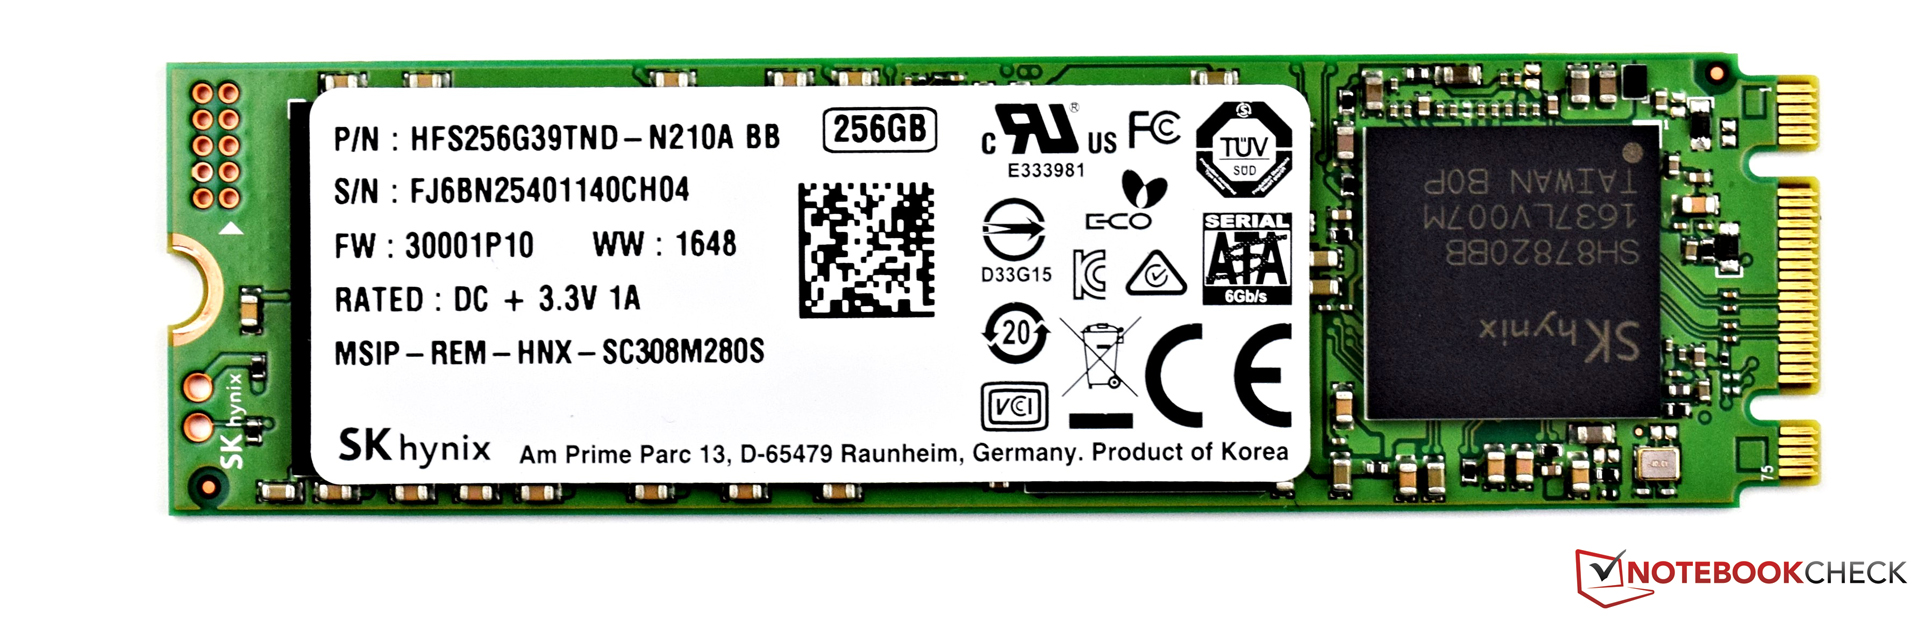
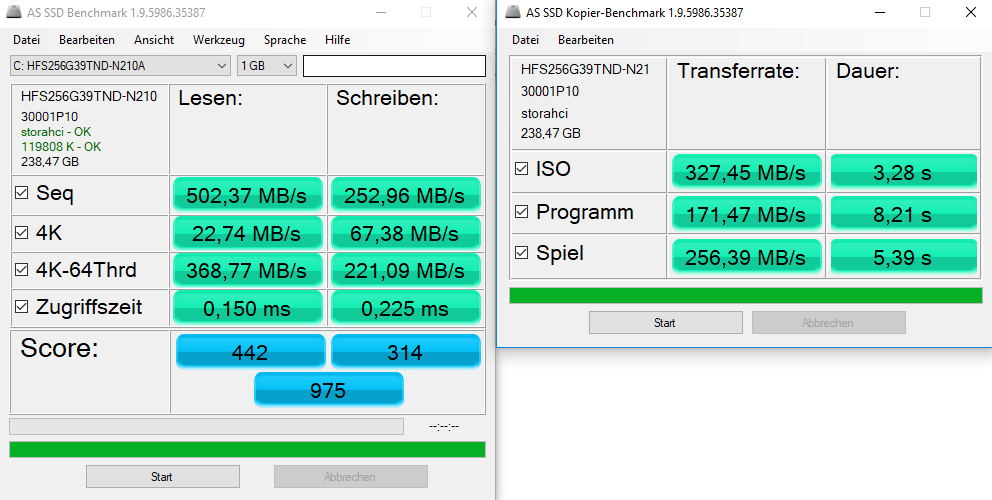
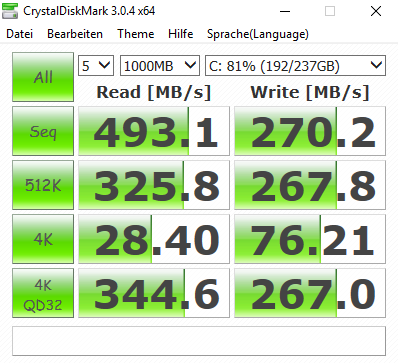
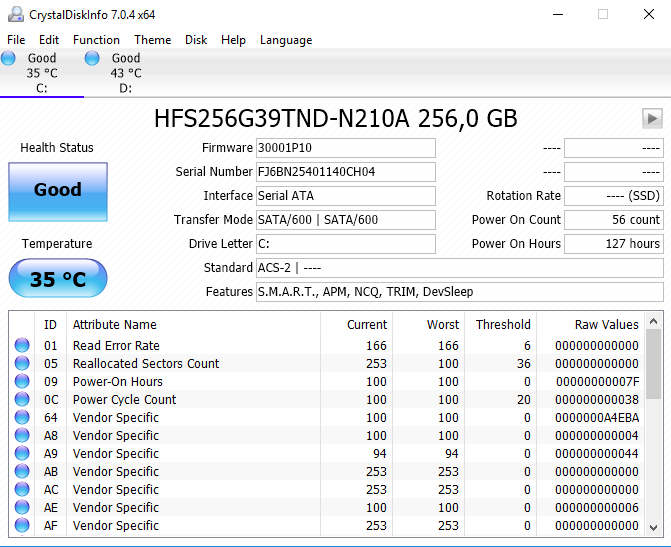
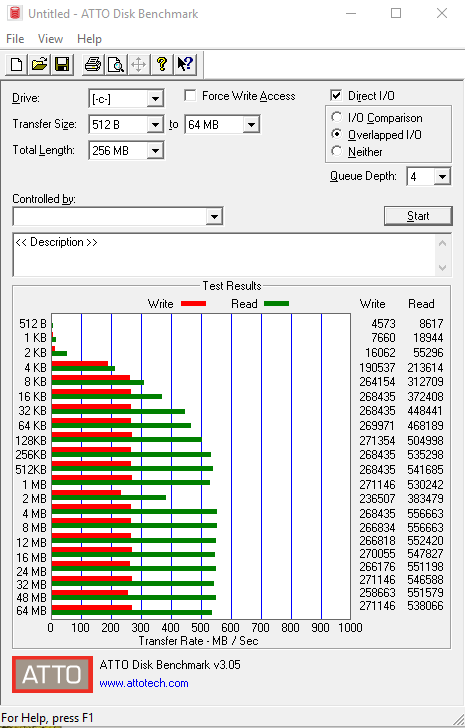
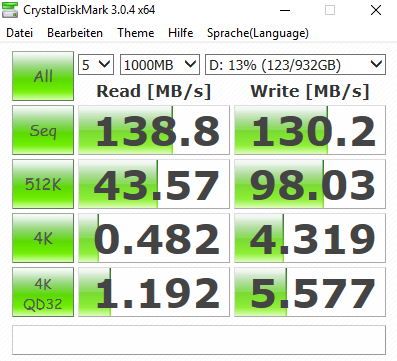
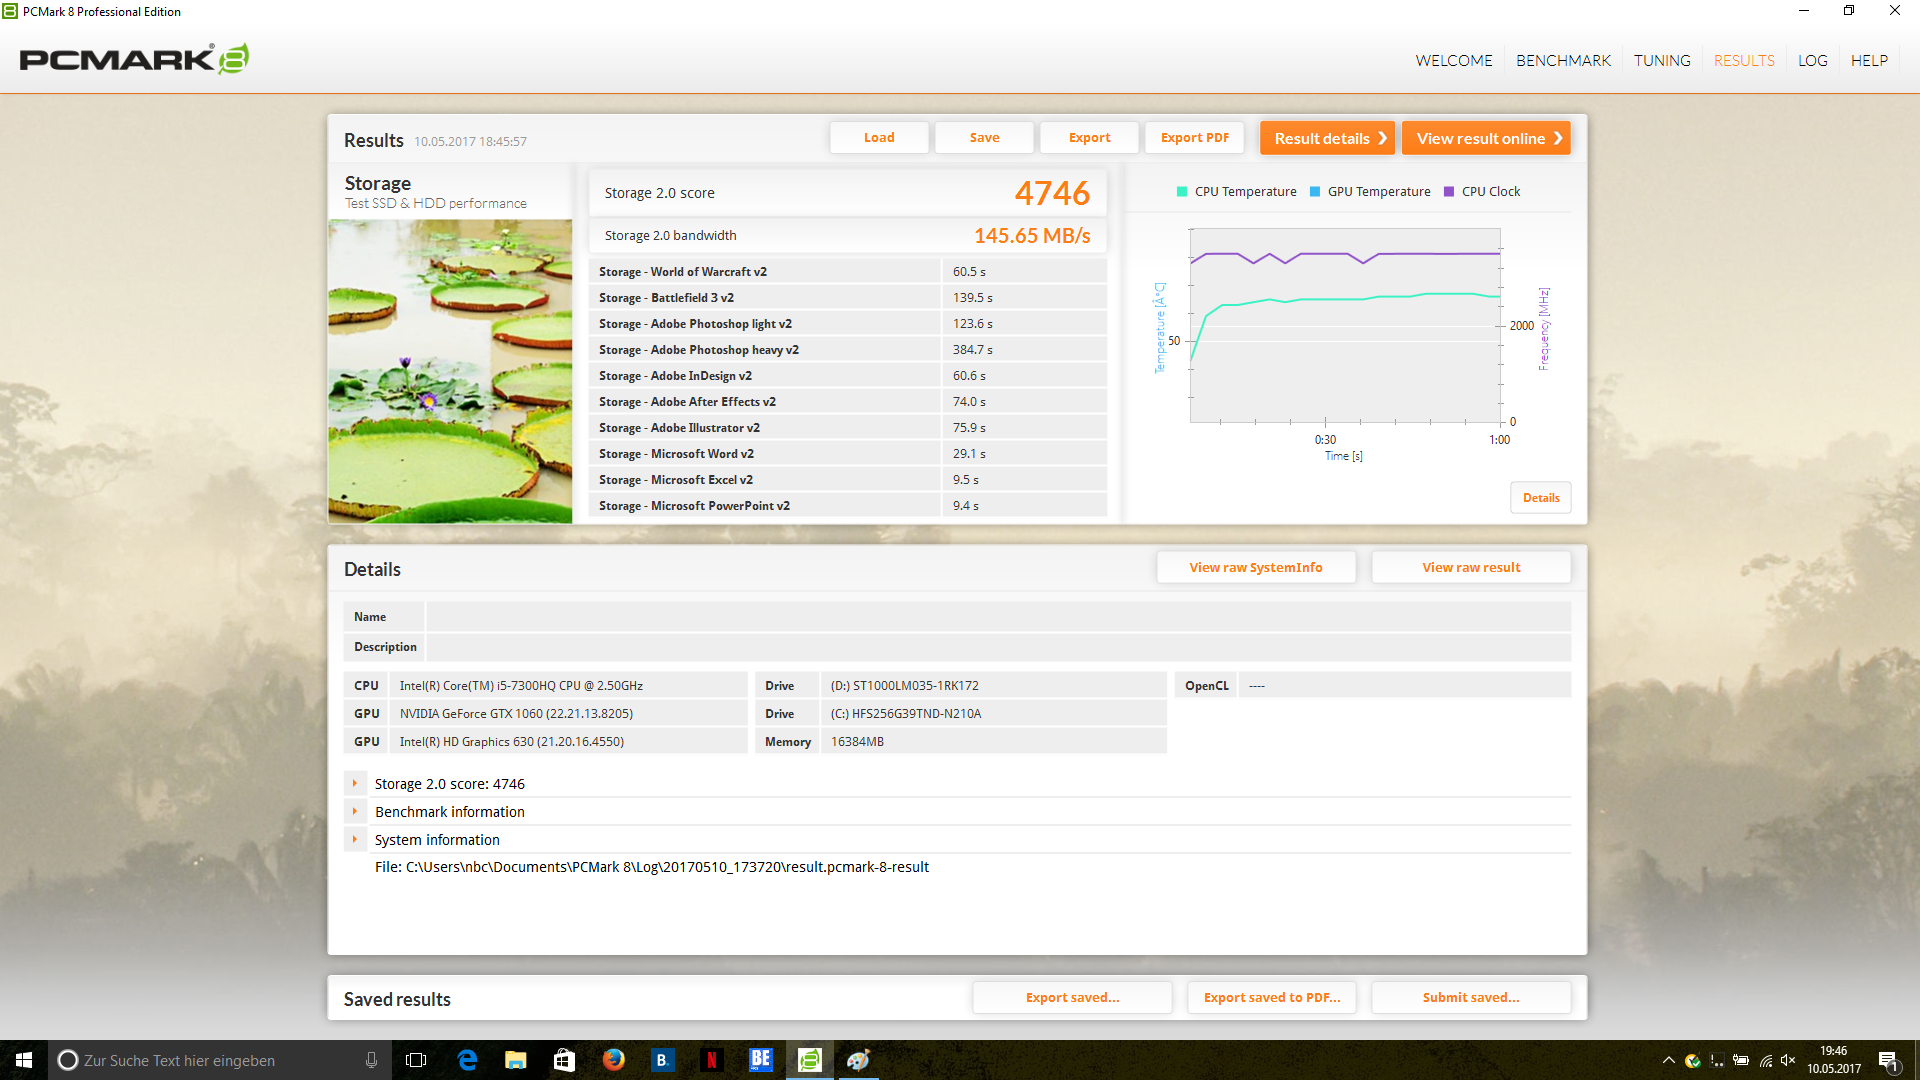
| Acer Aspire V17 Nitro BE VN7-793G-52XN SK Hynix HFS256G39TND-N210A | Asus Strix GL753VD-GC045T Micron SSD 1100 (MTFDDAV256TBN) | MSI GT72VR 7RE-433 Kingston RBU-SNS8152S3256GG5 | Gigabyte P57X v7 Transcend MTS800 256GB M.2 (TS256GMTS800) | HP Pavilion 17t-ab200 Samsung CM871a MZNTY128HDHP | HP Omen 17-w100ng SanDisk Z400s SD8SNAT-128G | |
|---|---|---|---|---|---|---|
| CrystalDiskMark 3.0 | 4% | 18% | 3% | -2% | -25% | |
| Read Seq (MB/s) | 493.1 | 475.7 -4% | 521 6% | 517 5% | 520 5% | 495 0% |
| Write Seq (MB/s) | 270.2 | 419.1 55% | 311.8 15% | 305.7 13% | 353.6 31% | 180.2 -33% |
| Read 512 (MB/s) | 325.8 | 336.1 3% | 403.1 24% | 315 -3% | 376.2 15% | 315.5 -3% |
| Write 512 (MB/s) | 267.8 | 346.6 29% | 332.3 24% | 306.1 14% | 118.5 -56% | 172.4 -36% |
| Read 4k (MB/s) | 28.4 | 24.7 -13% | 33.35 17% | 26.04 -8% | 32.7 15% | 20.25 -29% |
| Write 4k (MB/s) | 76.2 | 76.8 1% | 111.1 46% | 82.3 8% | 85.3 12% | 76.1 0% |
| Read 4k QD32 (MB/s) | 344.6 | 247.6 -28% | 331.1 -4% | 281.3 -18% | 399 16% | 141.6 -59% |
| Write 4k QD32 (MB/s) | 267 | 234.9 -12% | 318.3 19% | 296 11% | 132.5 -50% | 170.8 -36% |

| 3DMark | |
| 1280x720 Cloud Gate Standard Graphics | |
| MSI GT72VR 7RE-433 | |
| Gigabyte P57X v7 | |
| HP Omen 17-w100ng | |
| Acer Aspire V17 Nitro BE VN7-793G-52XN | |
| HP Pavilion 17t-ab200 | |
| Asus Strix GL753VD-GC045T | |
| 1920x1080 Fire Strike Graphics | |
| MSI GT72VR 7RE-433 | |
| Gigabyte P57X v7 | |
| HP Omen 17-w100ng | |
| Acer Aspire V17 Nitro BE VN7-793G-52XN | |
| HP Pavilion 17t-ab200 | |
| Asus Strix GL753VD-GC045T | |
| Asus Strix GL753VD-GC045T | |
| 3DMark 11 - 1280x720 Performance GPU | |
| Gigabyte P57X v7 | |
| MSI GT72VR 7RE-433 | |
| Acer Aspire V17 Nitro BE VN7-793G-52XN | |
| HP Omen 17-w100ng | |
| HP Pavilion 17t-ab200 | |
| Asus Strix GL753VD-GC045T | |
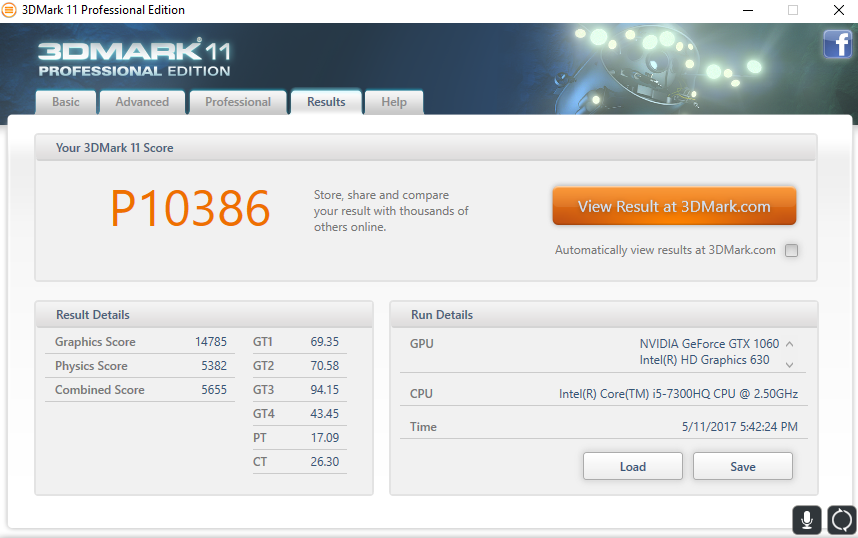
| 3DMark 11 Performance | 10386 punti | |
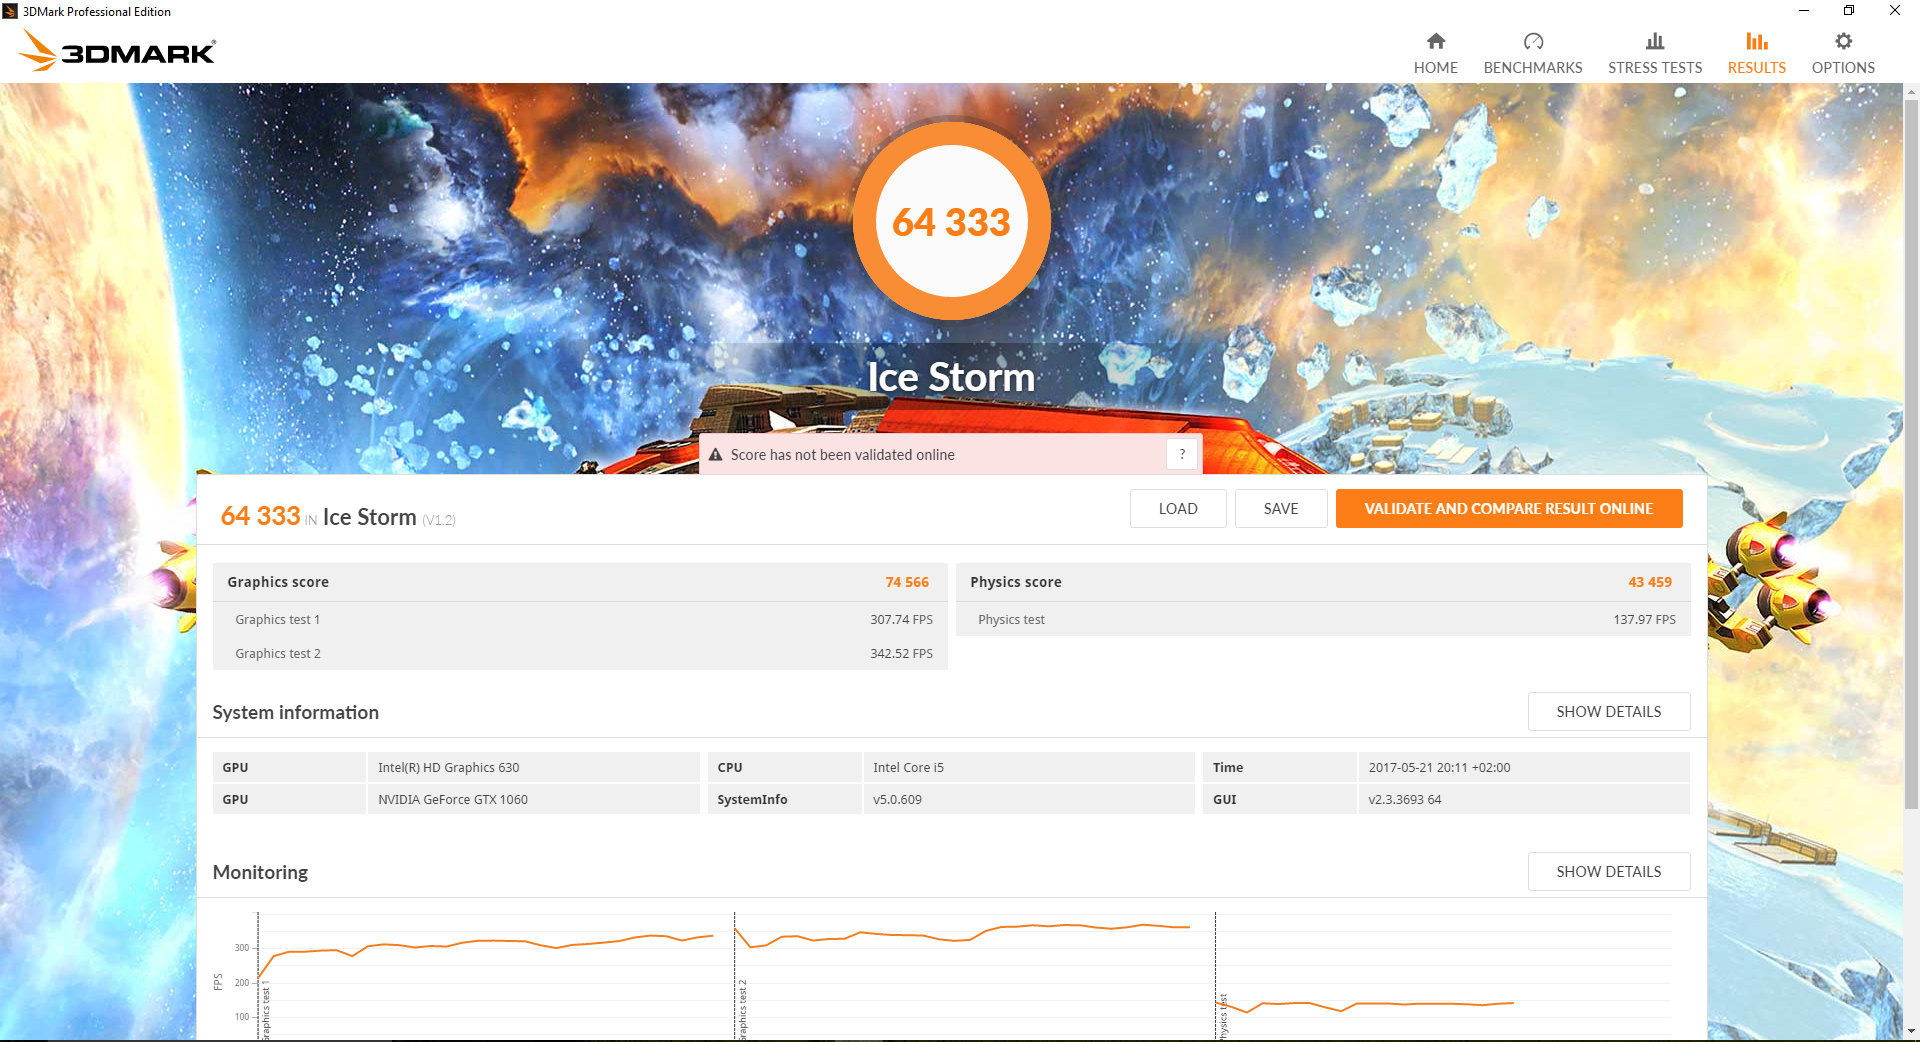
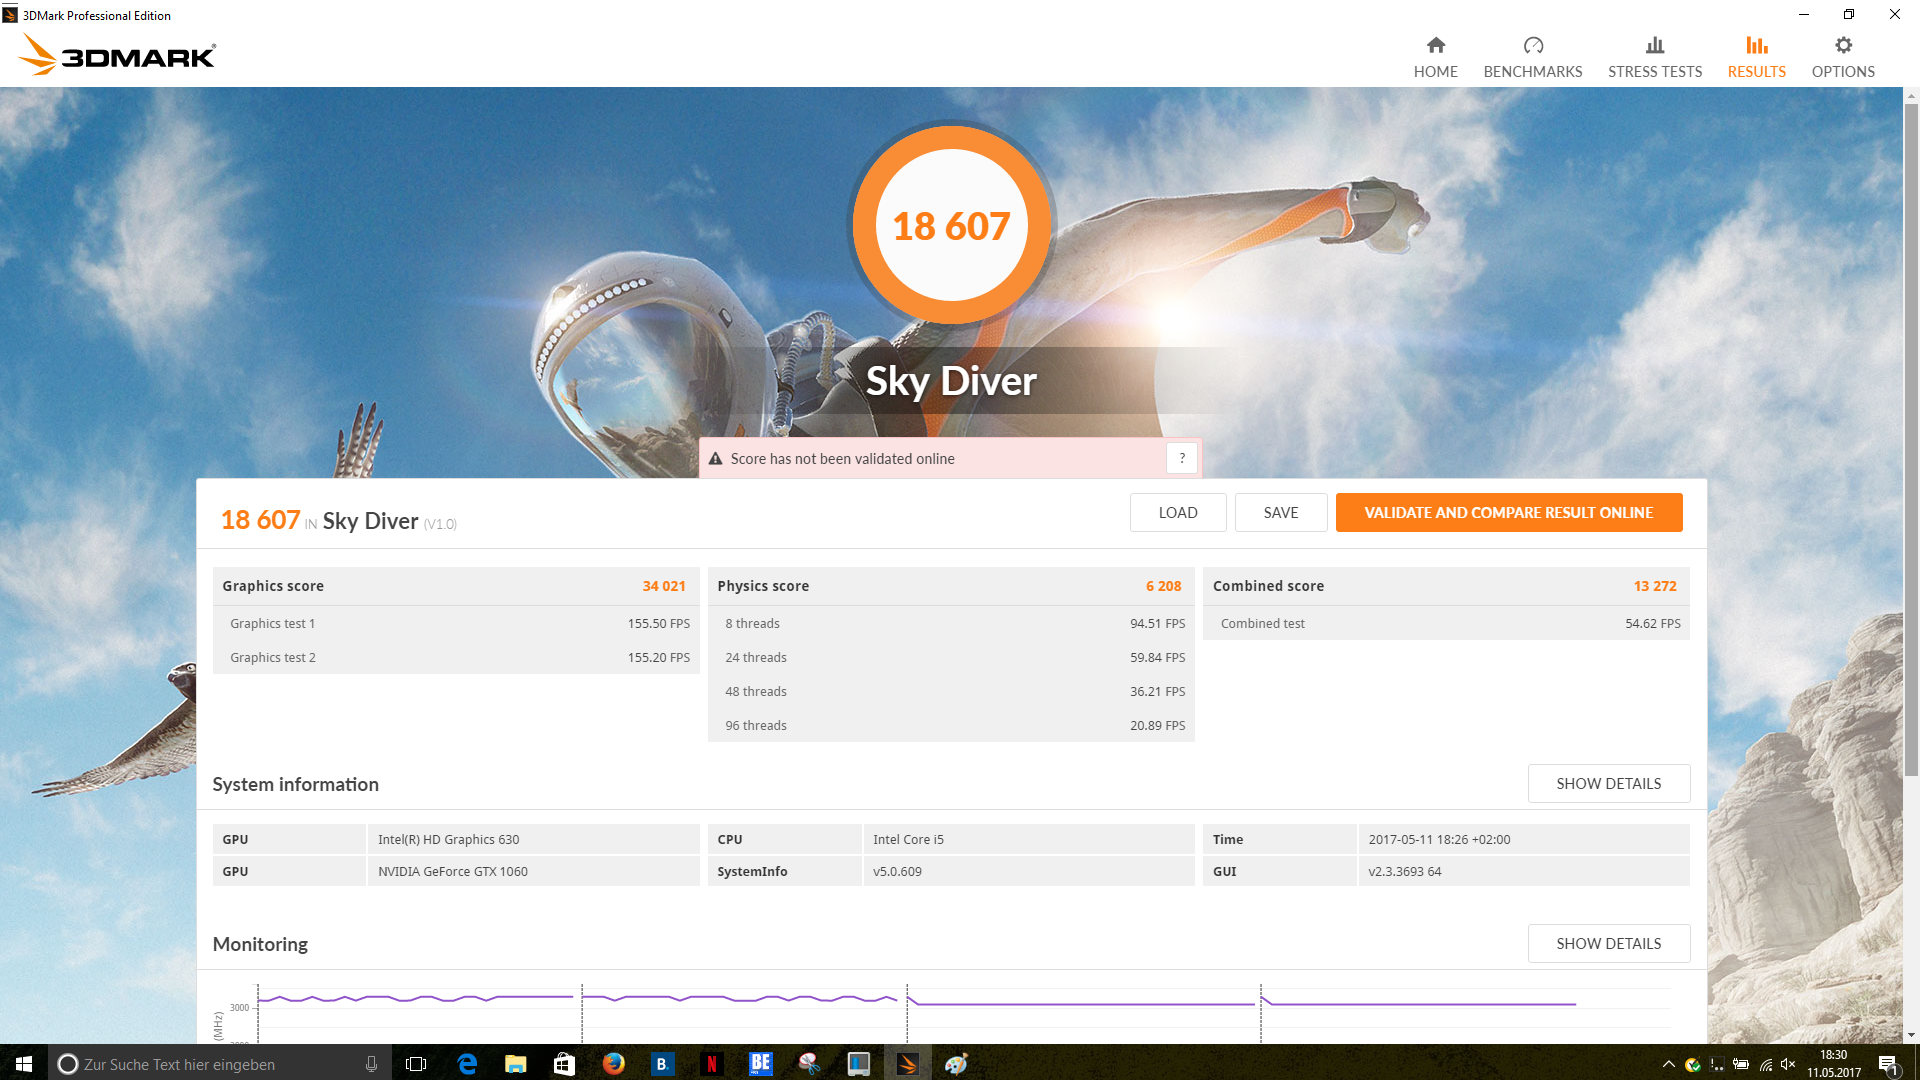
| 3DMark Ice Storm Standard Score | 64333 punti | |
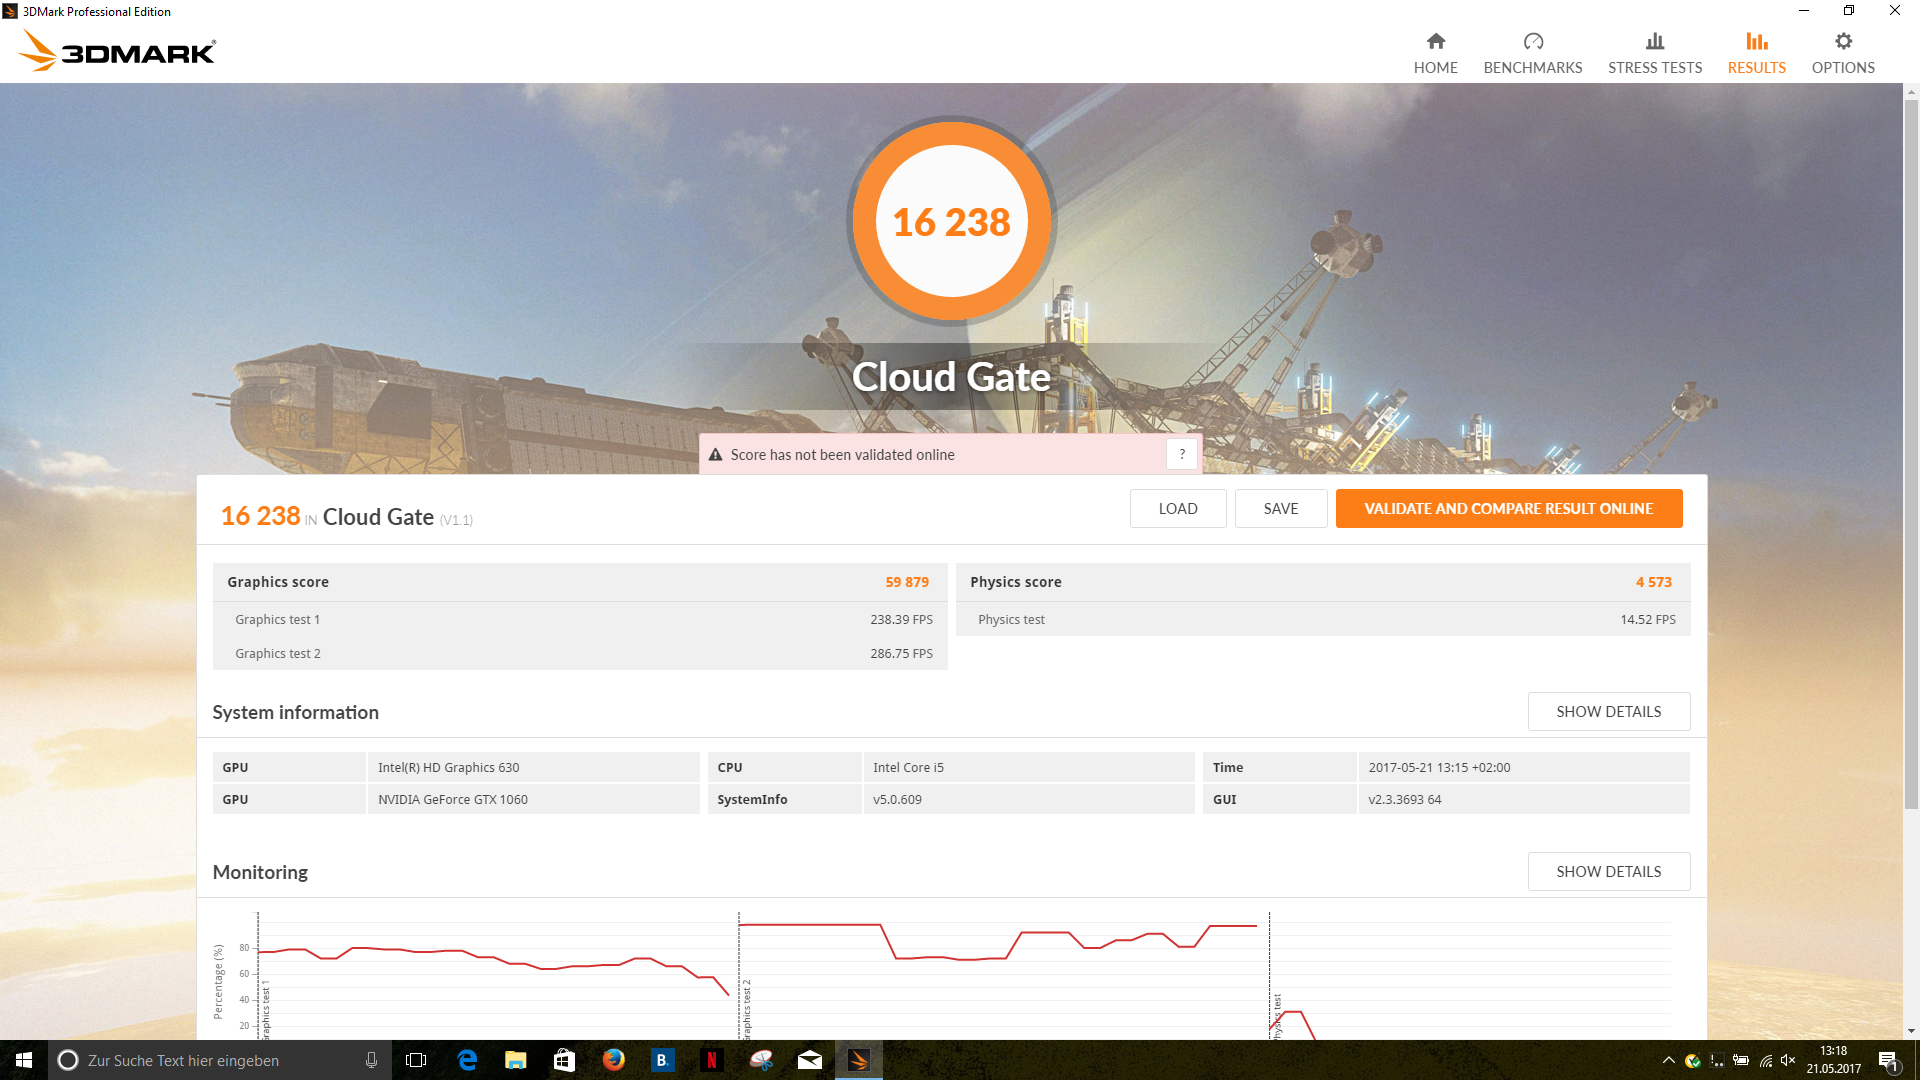
| 3DMark Cloud Gate Standard Score | 16238 punti | |
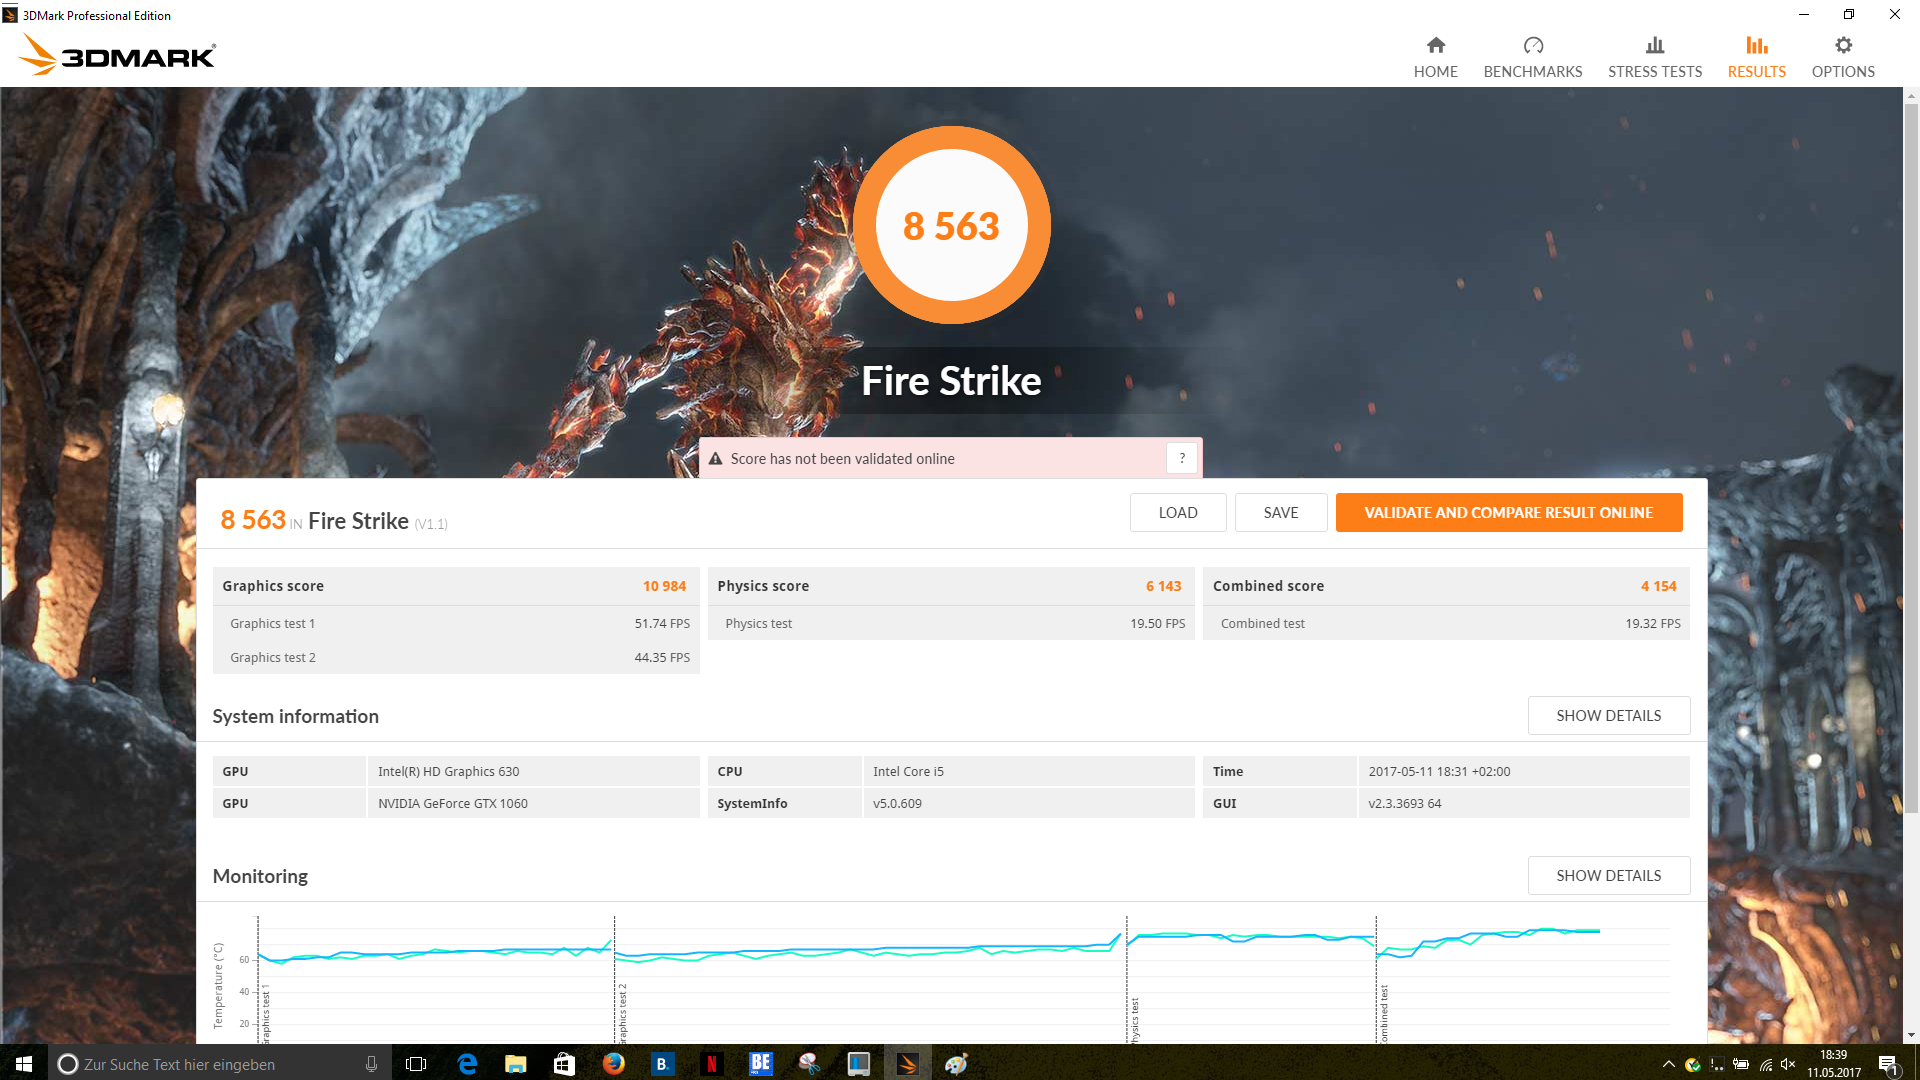
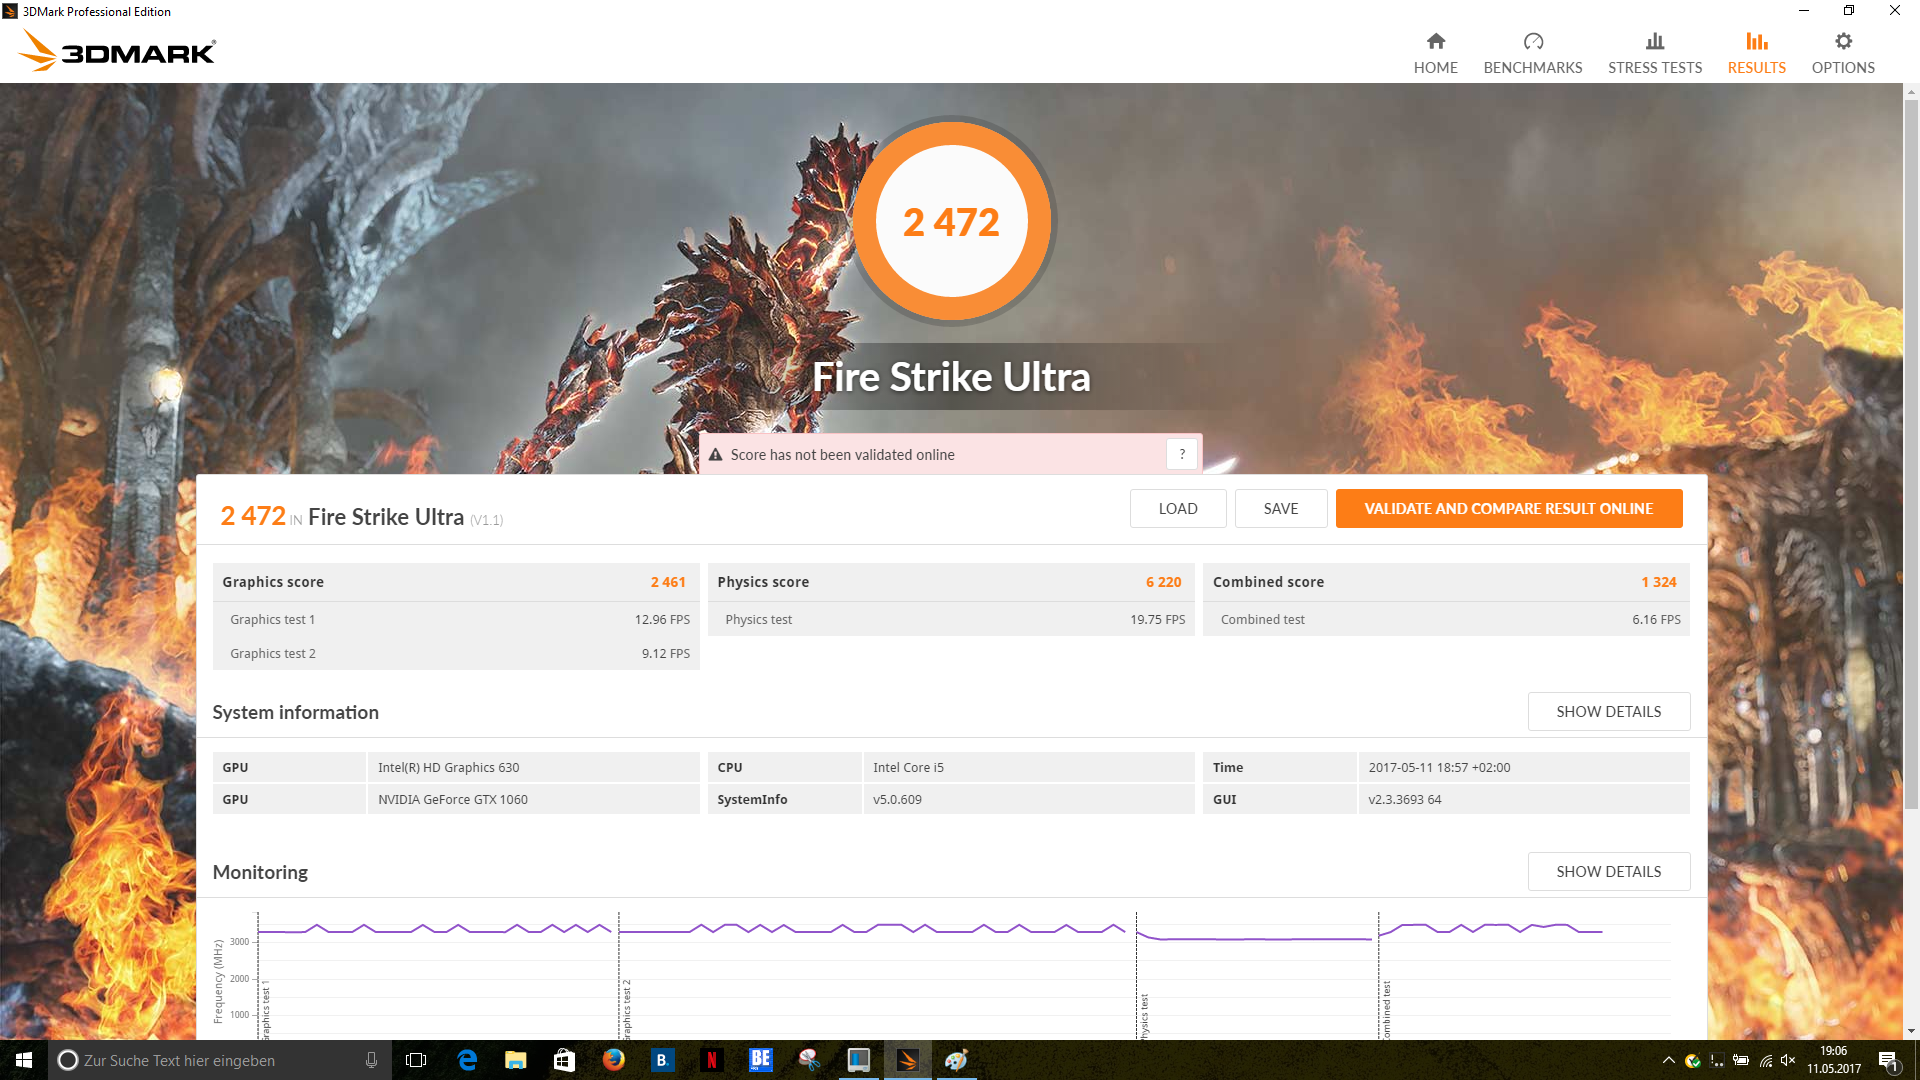
| 3DMark Fire Strike Score | 8563 punti | |
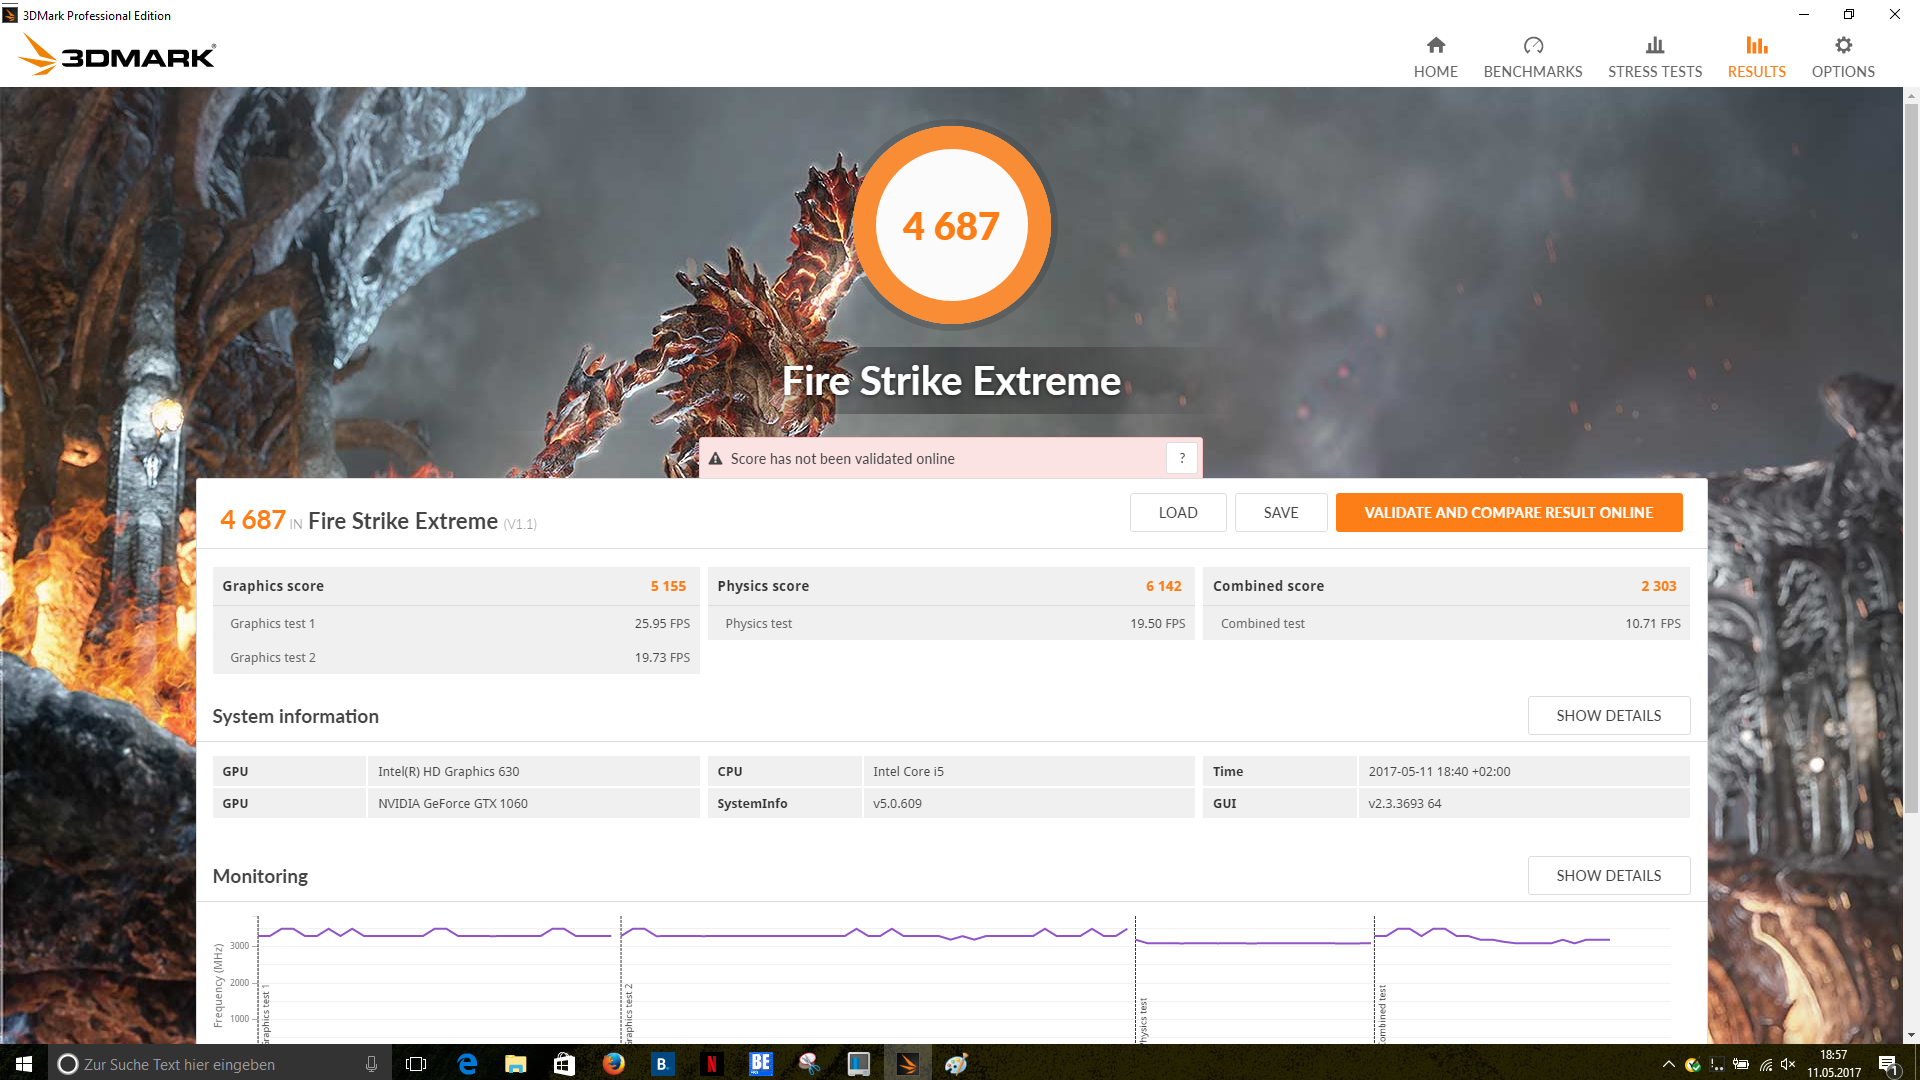
| 3DMark Fire Strike Extreme Score | 4687 punti | |
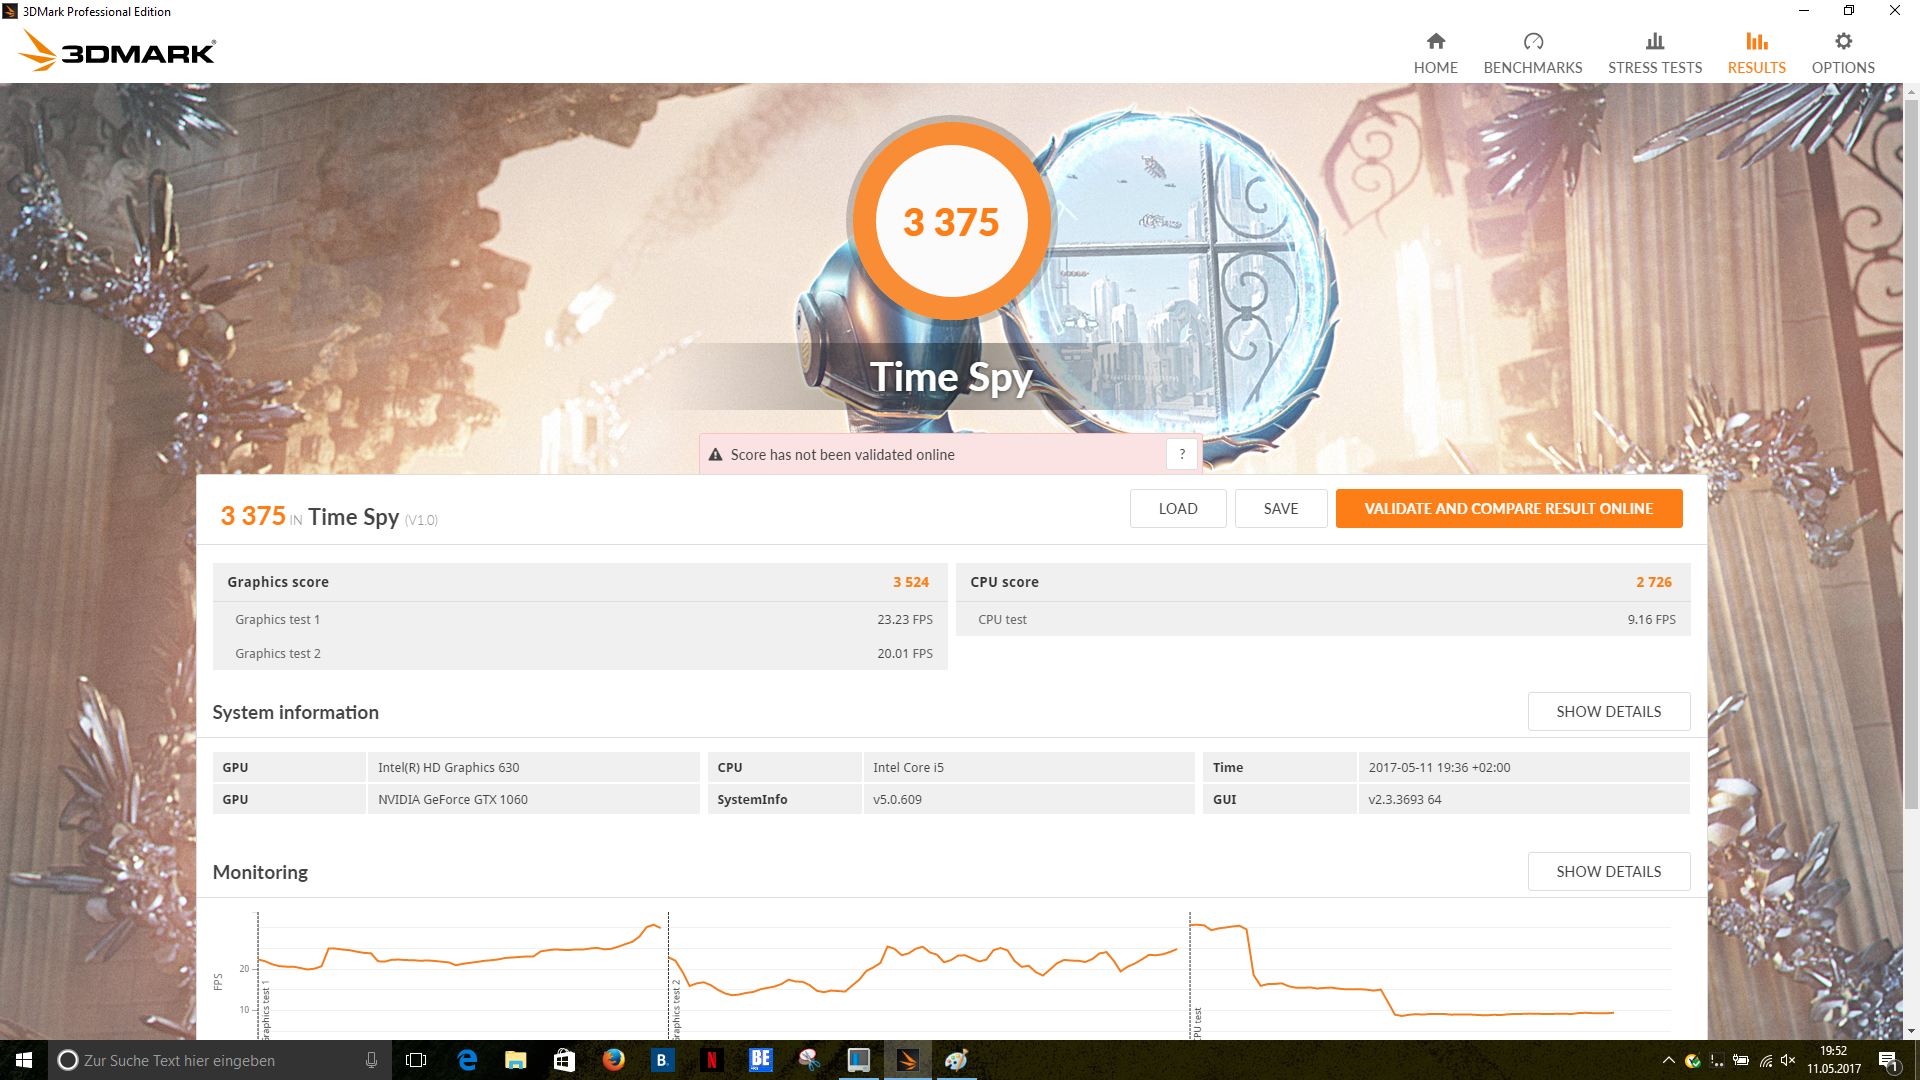
| 3DMark Time Spy Score | 3375 punti | |
Aiuto | ||
| basso | medio | alto | ultra | |
|---|---|---|---|---|
| BioShock Infinite (2013) | 187 | 164.6 | 154.7 | 92.5 |
| Battlefield 4 (2013) | 182.6 | 169.5 | 153.1 | 98 |
| The Witcher 3 (2015) | 130.2 | 118.1 | 65.9 | 37.5 |
| Rise of the Tomb Raider (2016) | 115.4 | 111.4 | 68.7 | 58.4 |
| BioShock Infinite - 1920x1080 Ultra Preset, DX11 (DDOF) | |
| MSI GT72VR 7RE-433 | |
| Gigabyte P57X v7 | |
| HP Omen 17-w100ng | |
| Acer Aspire V17 Nitro BE VN7-793G-52XN | |
| HP Pavilion 17t-ab200 | |
| Battlefield 4 - 1920x1080 Ultra Preset AA:4x MS | |
| MSI GT72VR 7RE-433 | |
| HP Omen 17-w100ng | |
| Acer Aspire V17 Nitro BE VN7-793G-52XN | |
| Rise of the Tomb Raider - 1920x1080 Very High Preset AA:FX AF:16x | |
| Acer Aspire V17 Nitro BE VN7-793G-52XN | |
| Asus Strix GL753VD-GC045T | |
| HP Pavilion 17t-ab200 | |
| The Witcher 3 - 1920x1080 Ultra Graphics & Postprocessing (HBAO+) | |
| Acer Aspire V17 Nitro BE VN7-793G-52XN | |
| Asus Strix GL753VD-GC045T | |
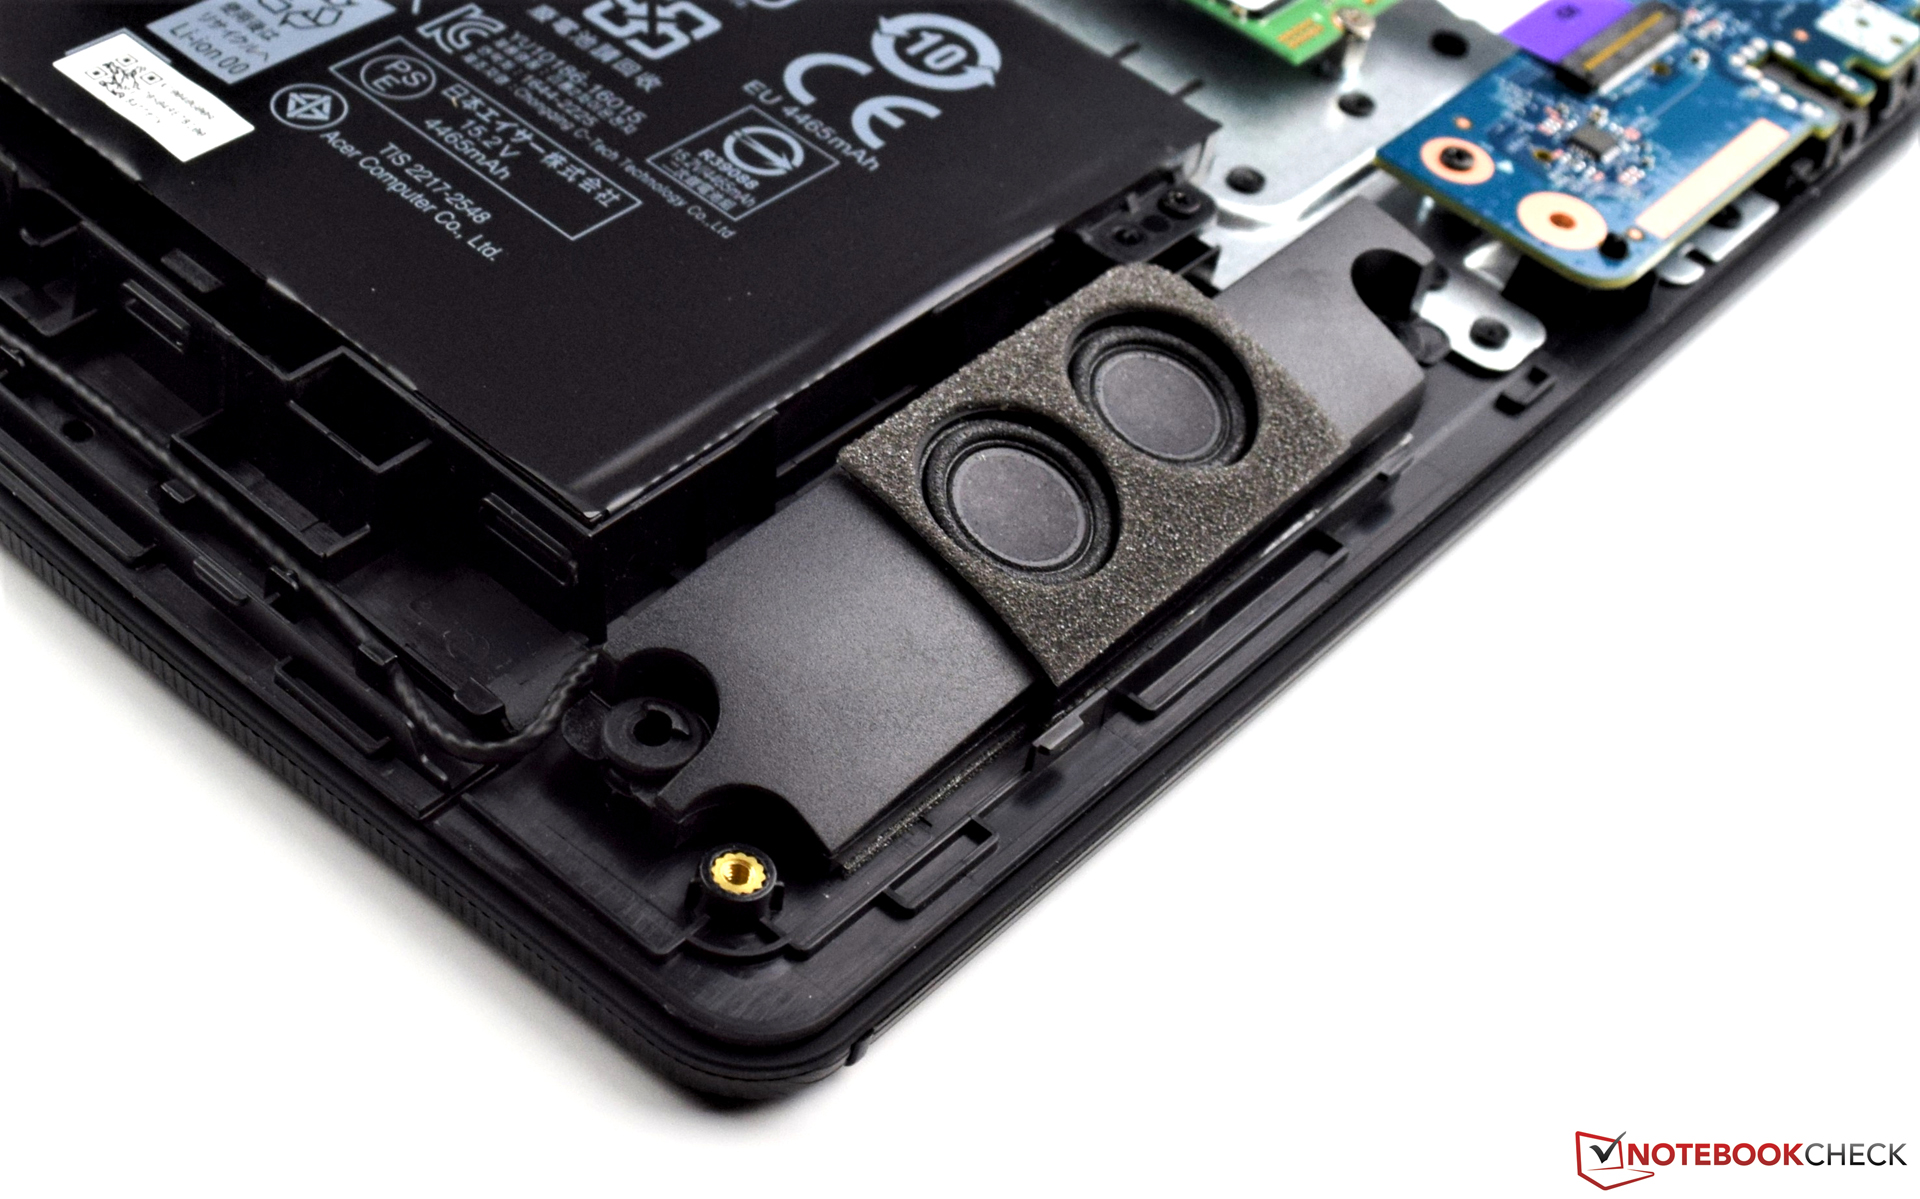
Acer Aspire V17 Nitro BE VN7-793G-52XN analisi audio
(-) | altoparlanti non molto potenti (42.8 dB)
Analysis not possible as maximum curve is missing or too high
Rumorosità
| Idle |
| 30.7 / 30.7 / 31.4 dB(A) |
| HDD |
| 30.7 dB(A) |
| Sotto carico |
| 32.1 / 42.8 dB(A) |
 | ||
30 dB silenzioso 40 dB(A) udibile 50 dB(A) rumoroso |
||
min: | ||
| Acer Aspire V17 Nitro BE VN7-793G-52XN i5-7300HQ, GeForce GTX 1060 Mobile | Asus Strix GL753VD-GC045T i7-7700HQ, GeForce GTX 1050 Mobile | MSI GT72VR 7RE-433 i7-7700HQ, GeForce GTX 1070 Mobile | Gigabyte P57X v7 i7-7700HQ, GeForce GTX 1070 Mobile | HP Pavilion 17t-ab200 i7-7700HQ, GeForce GTX 1050 Mobile | HP Omen 17-w100ng 6300HQ, GeForce GTX 1060 Mobile | |
|---|---|---|---|---|---|---|
| Noise | -13% | -10% | -10% | -18% | -19% | |
| off /ambiente * (dB) | 30.7 | 28.8 6% | 31 -1% | 29 6% | 30.8 -0% | 31 -1% |
| Idle Minimum * (dB) | 30.7 | 33.9 -10% | 34 -11% | 30.4 1% | 35.3 -15% | 35 -14% |
| Idle Average * (dB) | 30.7 | 33.9 -10% | 35 -14% | 32.1 -5% | 35.4 -15% | 36 -17% |
| Idle Maximum * (dB) | 31.4 | 37.8 -20% | 37 -18% | 32.1 -2% | 35.4 -13% | 37 -18% |
| Load Average * (dB) | 32.1 | 42.7 -33% | 37 -15% | 45.6 -42% | 48.6 -51% | 44 -37% |
| Witcher 3 ultra * (dB) | 42.8 | |||||
| Load Maximum * (dB) | 42.8 | 47.4 -11% | 44 -3% | 51.5 -20% | 49.8 -16% | 54 -26% |
* ... Meglio usare valori piccoli
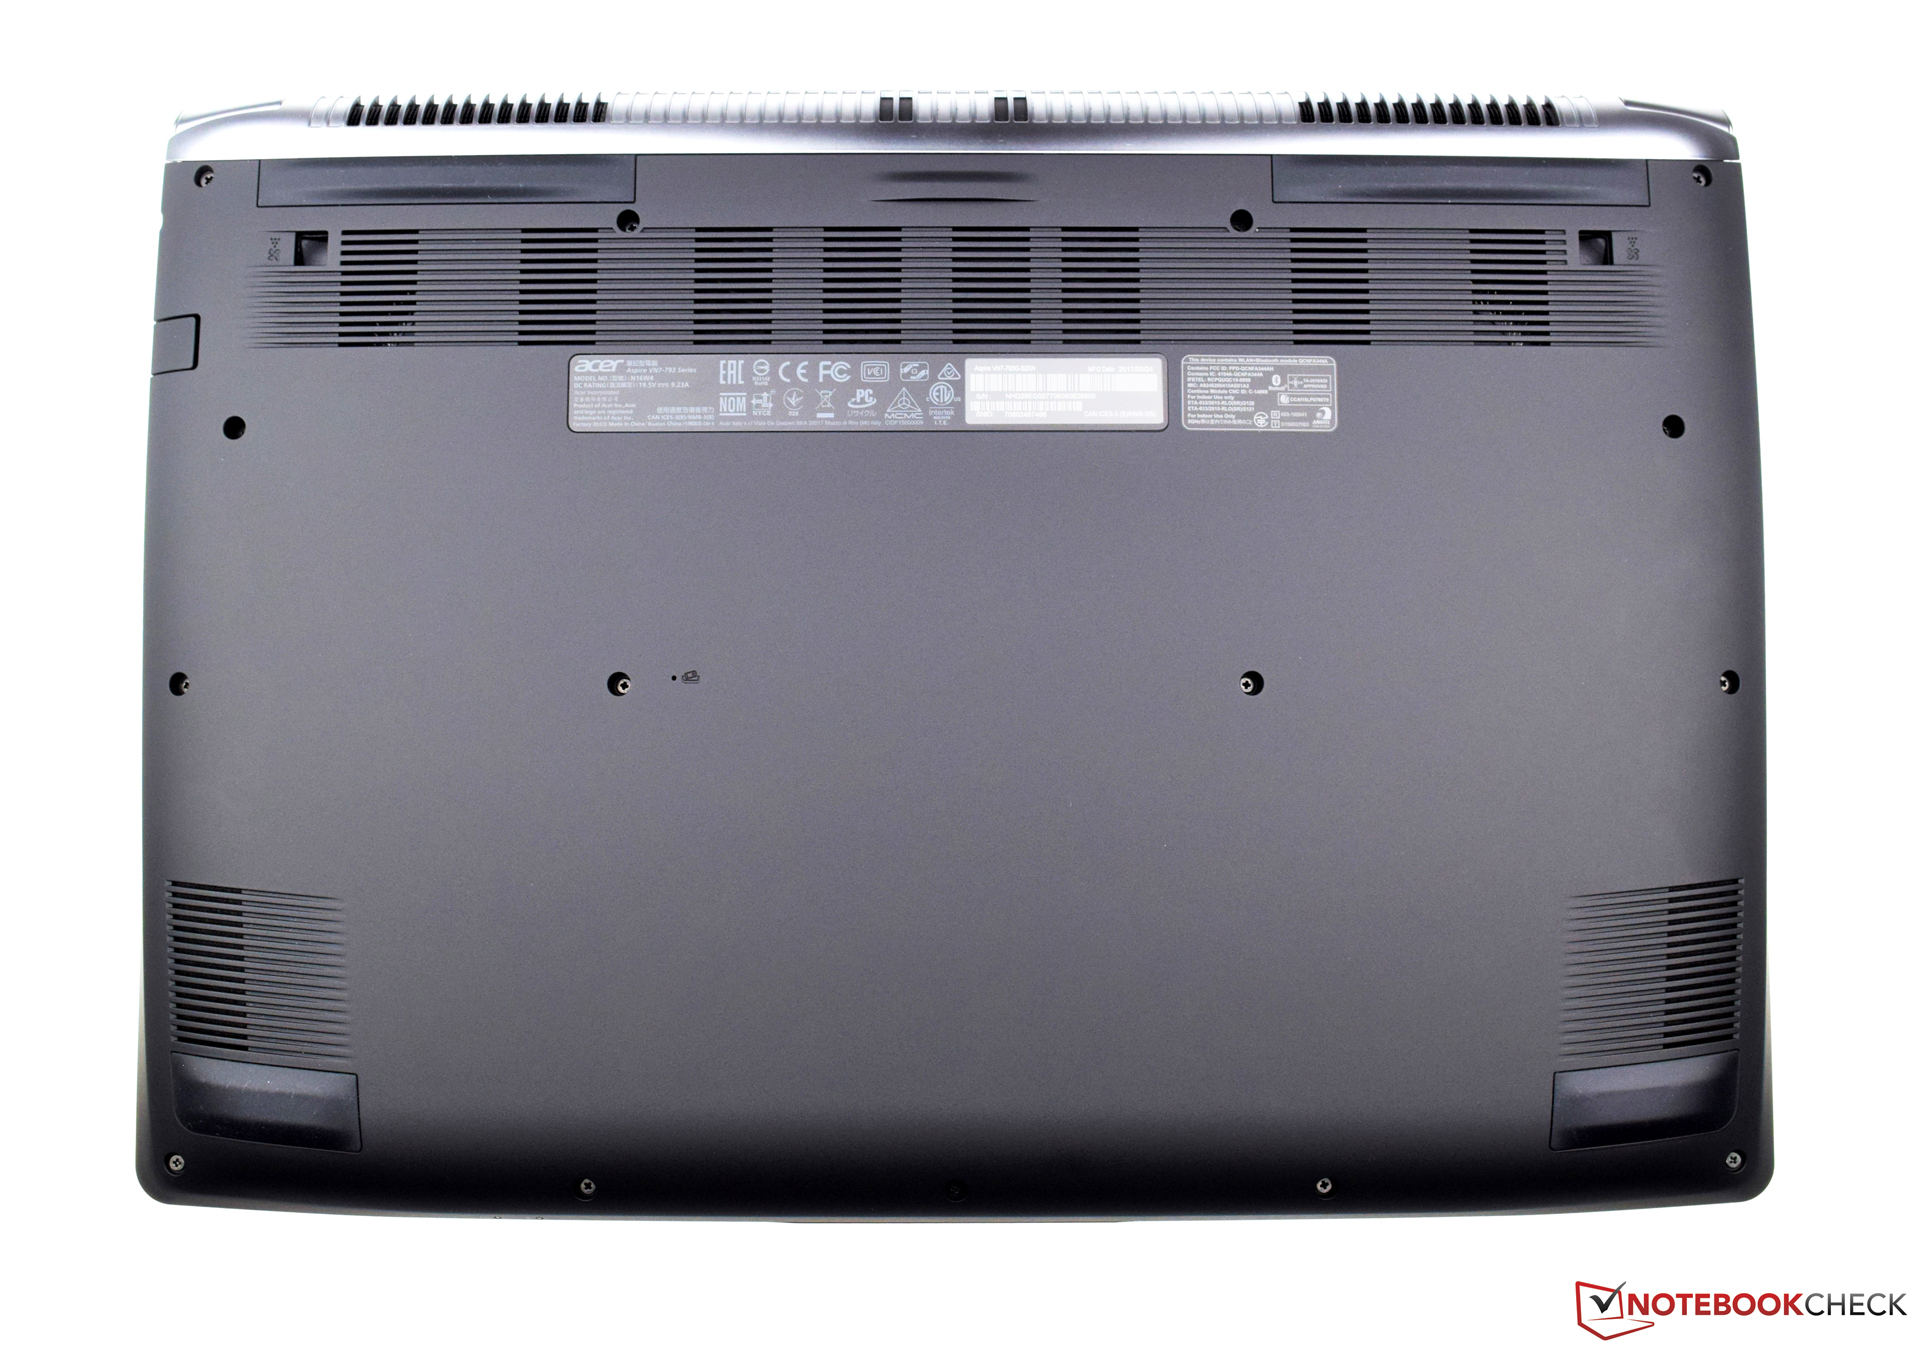
(-) La temperatura massima sul lato superiore è di 48.4 °C / 119 F, rispetto alla media di 36.8 °C / 98 F, che varia da 21 a 71 °C per questa classe Multimedia.
(±) Il lato inferiore si riscalda fino ad un massimo di 44.2 °C / 112 F, rispetto alla media di 39.1 °C / 102 F
(+) In idle, la temperatura media del lato superiore è di 23.2 °C / 74 F, rispetto alla media deld ispositivo di 31.3 °C / 88 F.
(±) Riproducendo The Witcher 3, la temperatura media per il lato superiore e' di 36.3 °C / 97 F, rispetto alla media del dispositivo di 31.3 °C / 88 F.
(+) I poggiapolsi e il touchpad sono piu' freddi della temperatura della pelle con un massimo di 28.7 °C / 83.7 F e sono quindi freddi al tatto.
(±) La temperatura media della zona del palmo della mano di dispositivi simili e'stata di 28.7 °C / 83.7 F (0 °C / 0 F).
| Acer Aspire V17 Nitro BE VN7-793G-52XN i5-7300HQ, GeForce GTX 1060 Mobile | Asus Strix GL753VD-GC045T i7-7700HQ, GeForce GTX 1050 Mobile | MSI GT72VR 7RE-433 i7-7700HQ, GeForce GTX 1070 Mobile | Gigabyte P57X v7 i7-7700HQ, GeForce GTX 1070 Mobile | HP Pavilion 17t-ab200 i7-7700HQ, GeForce GTX 1050 Mobile | HP Omen 17-w100ng 6300HQ, GeForce GTX 1060 Mobile | |
|---|---|---|---|---|---|---|
| Heat | 11% | -1% | -16% | 10% | -7% | |
| Maximum Upper Side * (°C) | 48.4 | 37.7 22% | 41.5 14% | 51.2 -6% | 45.8 5% | 41.5 14% |
| Maximum Bottom * (°C) | 44.2 | 36.3 18% | 50.6 -14% | 56.8 -29% | 37 16% | 45.5 -3% |
| Idle Upper Side * (°C) | 25.8 | 25.7 -0% | 26.4 -2% | 29.2 -13% | 24 7% | 31.8 -23% |
| Idle Bottom * (°C) | 25.5 | 24.4 4% | 25.4 -0% | 29.2 -15% | 23 10% | 29.6 -16% |
* ... Meglio usare valori piccoli
Acer Aspire V17 Nitro BE VN7-793G-52XN analisi audio
(±) | potenza degli altiparlanti media ma buona (72 dB)
Bassi 100 - 315 Hz
(±) | bassi ridotti - in media 5.7% inferiori alla media
(+) | bassi in lineaa (5% delta rispetto alla precedente frequenza)
Medi 400 - 2000 Hz
(+) | medi bilanciati - solo only 4.4% rispetto alla media
(+) | medi lineari (6% delta rispetto alla precedente frequenza)
Alti 2 - 16 kHz
(+) | Alti bilanciati - appena 3% dalla media
(±) | la linearità degli alti è media (7.2% delta rispetto alla precedente frequenza)
Nel complesso 100 - 16.000 Hz
(+) | suono nel complesso lineare (12.5% differenza dalla media)
Rispetto alla stessa classe
» 24% di tutti i dispositivi testati in questa classe è stato migliore, 3% simile, 73% peggiore
» Il migliore ha avuto un delta di 5%, medio di 17%, peggiore di 45%
Rispetto a tutti i dispositivi testati
» 11% di tutti i dispositivi testati in questa classe è stato migliore, 2% similare, 86% peggiore
» Il migliore ha avuto un delta di 4%, medio di 23%, peggiore di 134%
Asus Strix GL753VD-GC045T analisi audio
(±) | potenza degli altiparlanti media ma buona (81.5 dB)
Bassi 100 - 315 Hz
(-) | quasi nessun basso - in media 15.8% inferiori alla media
(±) | la linearità dei bassi è media (12.2% delta rispetto alla precedente frequenza)
Medi 400 - 2000 Hz
(+) | medi bilanciati - solo only 3.1% rispetto alla media
(±) | linearità dei medi adeguata (7% delta rispetto alla precedente frequenza)
Alti 2 - 16 kHz
(±) | alti elevati - circa 6.3% superiori alla media
(+) | alti lineari (5.4% delta rispetto alla precedente frequenza)
Nel complesso 100 - 16.000 Hz
(±) | la linearità complessiva del suono è media (17.2% di differenza rispetto alla media
Rispetto alla stessa classe
» 47% di tutti i dispositivi testati in questa classe è stato migliore, 11% simile, 42% peggiore
» Il migliore ha avuto un delta di 6%, medio di 18%, peggiore di 132%
Rispetto a tutti i dispositivi testati
» 32% di tutti i dispositivi testati in questa classe è stato migliore, 8% similare, 60% peggiore
» Il migliore ha avuto un delta di 4%, medio di 23%, peggiore di 134%
| Off / Standby | |
| Idle | |
| Sotto carico |
|
Leggenda:
min: | |
| Acer Aspire V17 Nitro BE VN7-793G-52XN i5-7300HQ, GeForce GTX 1060 Mobile, SK Hynix HFS256G39TND-N210A, a-Si TFT-LCD, WLED, 1920x1080, 17.3" | Asus Strix GL753VD-GC045T i7-7700HQ, GeForce GTX 1050 Mobile, Micron SSD 1100 (MTFDDAV256TBN), LED IPS, 1920x1080, 17.3" | MSI GT72VR 7RE-433 i7-7700HQ, GeForce GTX 1070 Mobile, Kingston RBU-SNS8152S3256GG5, TN LED, 1920x1080, 17.3" | Gigabyte P57X v7 i7-7700HQ, GeForce GTX 1070 Mobile, Transcend MTS800 256GB M.2 (TS256GMTS800), IPS, 3840x2160, 17.3" | HP Pavilion 17t-ab200 i7-7700HQ, GeForce GTX 1050 Mobile, Samsung CM871a MZNTY128HDHP, IPS, 1920x1080, 17.3" | HP Omen 17-w100ng 6300HQ, GeForce GTX 1060 Mobile, SanDisk Z400s SD8SNAT-128G, IPS, 1920x1080, 17.3" | |
|---|---|---|---|---|---|---|
| Power Consumption | 8% | -79% | -88% | 11% | -52% | |
| Idle Minimum * (Watt) | 7.8 | 6.2 21% | 20 -156% | 15.7 -101% | 8.2 -5% | 17 -118% |
| Idle Average * (Watt) | 13.3 | 12.2 8% | 27 -103% | 23.4 -76% | 11 17% | 22 -65% |
| Idle Maximum * (Watt) | 16.6 | 14.8 11% | 31 -87% | 23.5 -42% | 11.1 33% | 29 -75% |
| Load Average * (Watt) | 73 | 84.9 -16% | 86 -18% | 184.6 -153% | 77 -5% | 72 1% |
| Witcher 3 ultra * (Watt) | 118 | |||||
| Load Maximum * (Watt) | 140 | 120.7 14% | 184 -31% | 233.1 -67% | 116.9 16% | 141 -1% |
* ... Meglio usare valori piccoli
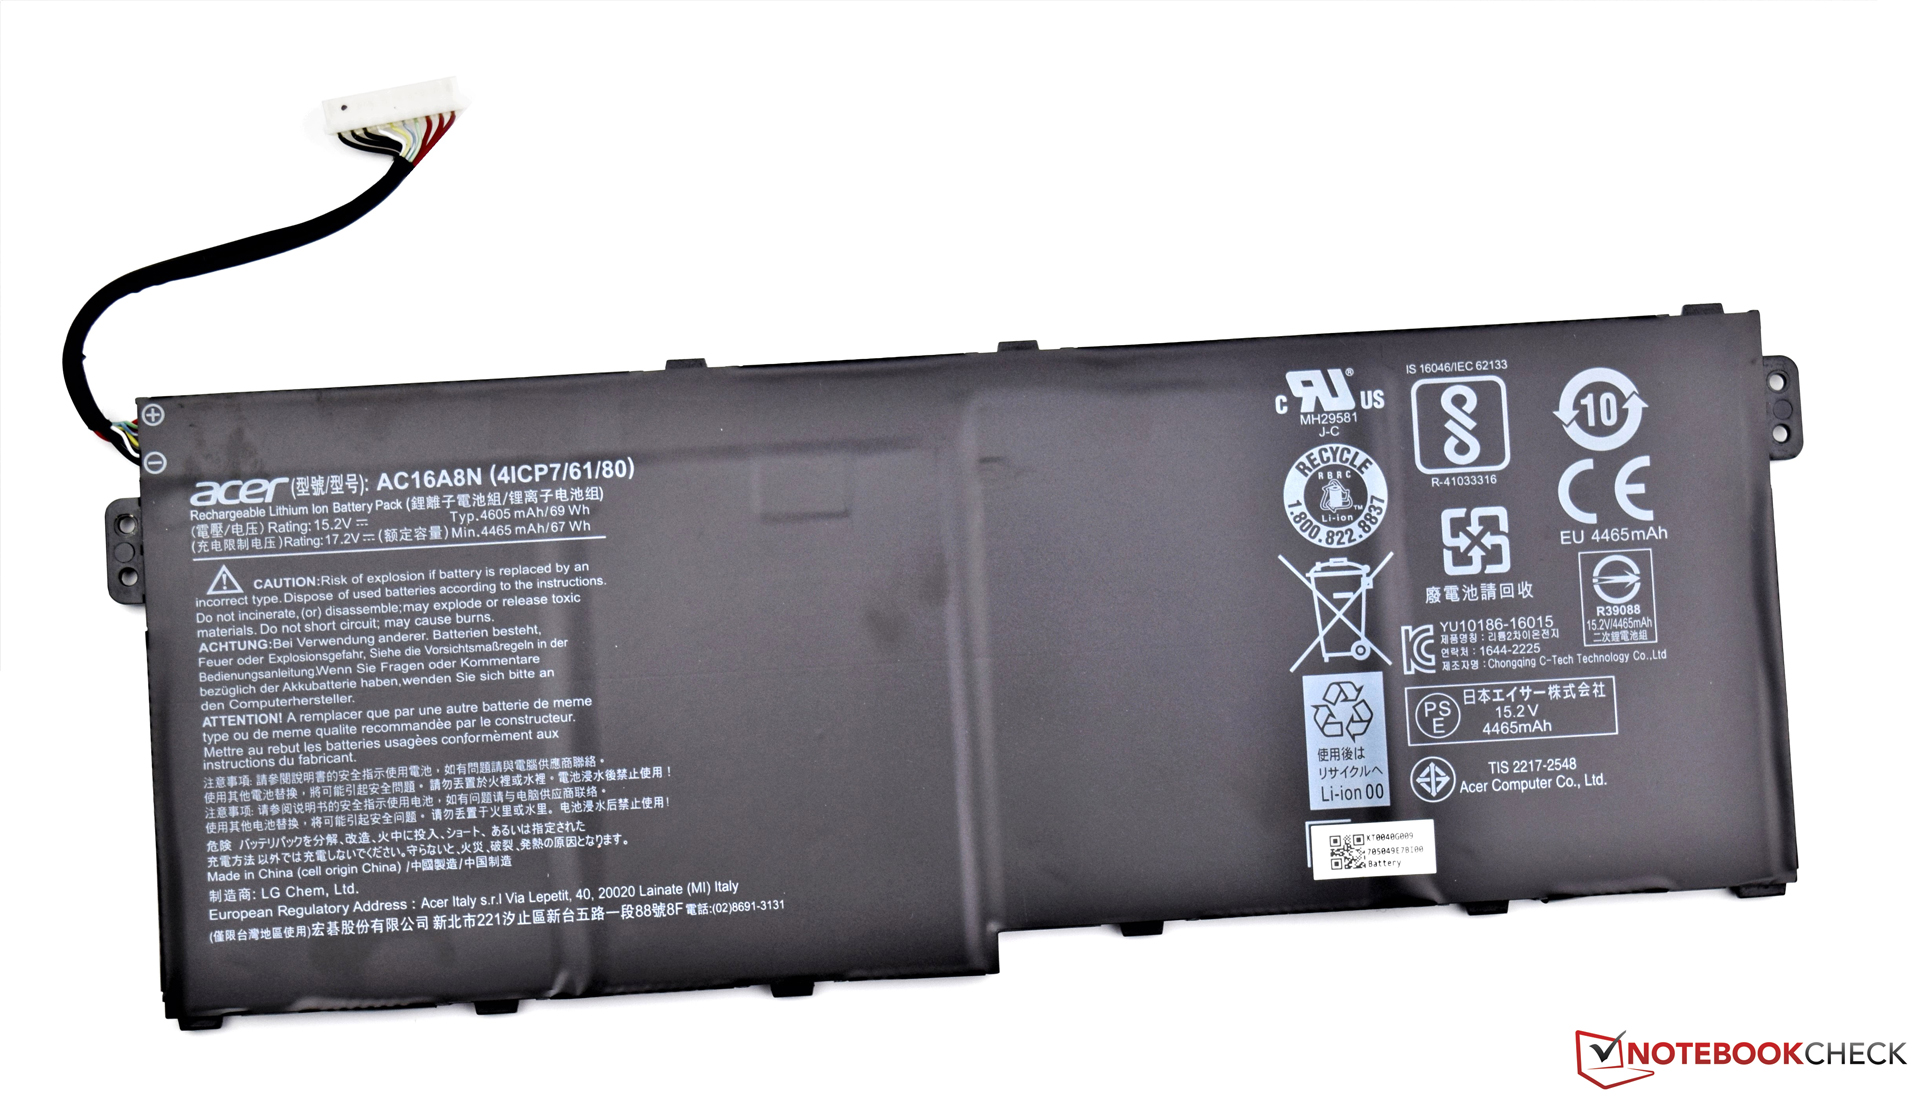
| Acer Aspire V17 Nitro BE VN7-793G-52XN i5-7300HQ, GeForce GTX 1060 Mobile, 69 Wh | Asus Strix GL753VD-GC045T i7-7700HQ, GeForce GTX 1050 Mobile, 48 Wh | MSI GT72VR 7RE-433 i7-7700HQ, GeForce GTX 1070 Mobile, 83 Wh | Gigabyte P57X v7 i7-7700HQ, GeForce GTX 1070 Mobile, 75.81 Wh | HP Pavilion 17t-ab200 i7-7700HQ, GeForce GTX 1050 Mobile, 62 Wh | HP Omen 17-w100ng 6300HQ, GeForce GTX 1060 Mobile, 95.8 Wh | |
|---|---|---|---|---|---|---|
| Autonomia della batteria | -37% | -37% | -48% | -0% | -2% | |
| Reader / Idle (h) | 10.3 | 8.6 -17% | 5.3 -49% | 4.3 -58% | 11.5 12% | 9.1 -12% |
| H.264 (h) | 5.3 | 3.8 -28% | 5.2 -2% | |||
| WiFi v1.3 (h) | 6.2 | 4.4 -29% | 3.8 -39% | 2.6 -58% | 6.8 10% | 6.1 -2% |
| Load (h) | 2.2 | 0.8 -64% | 1.5 -32% | 1.6 -27% | 1.7 -23% | 2.4 9% |
Pro
Contro
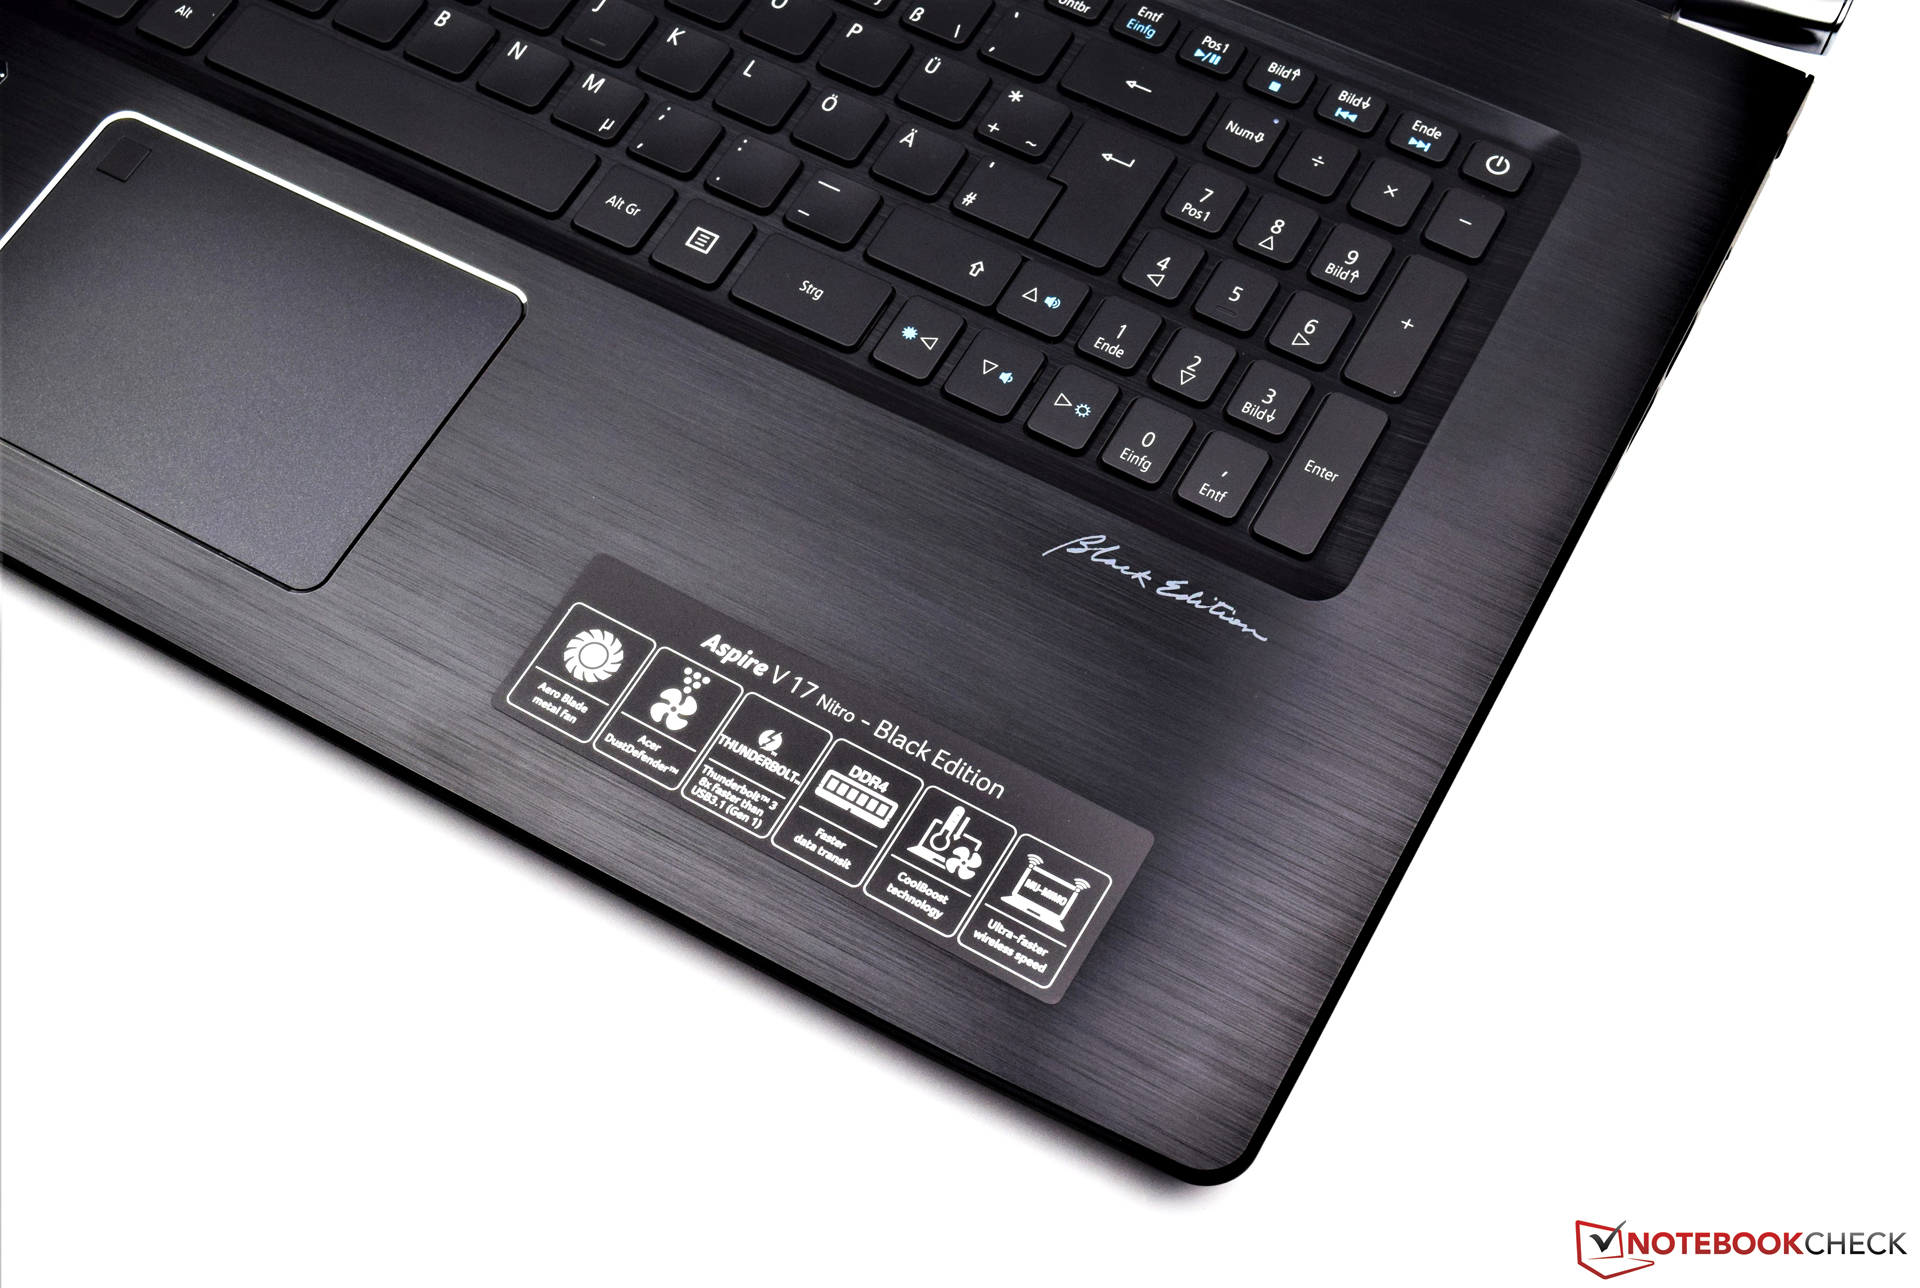
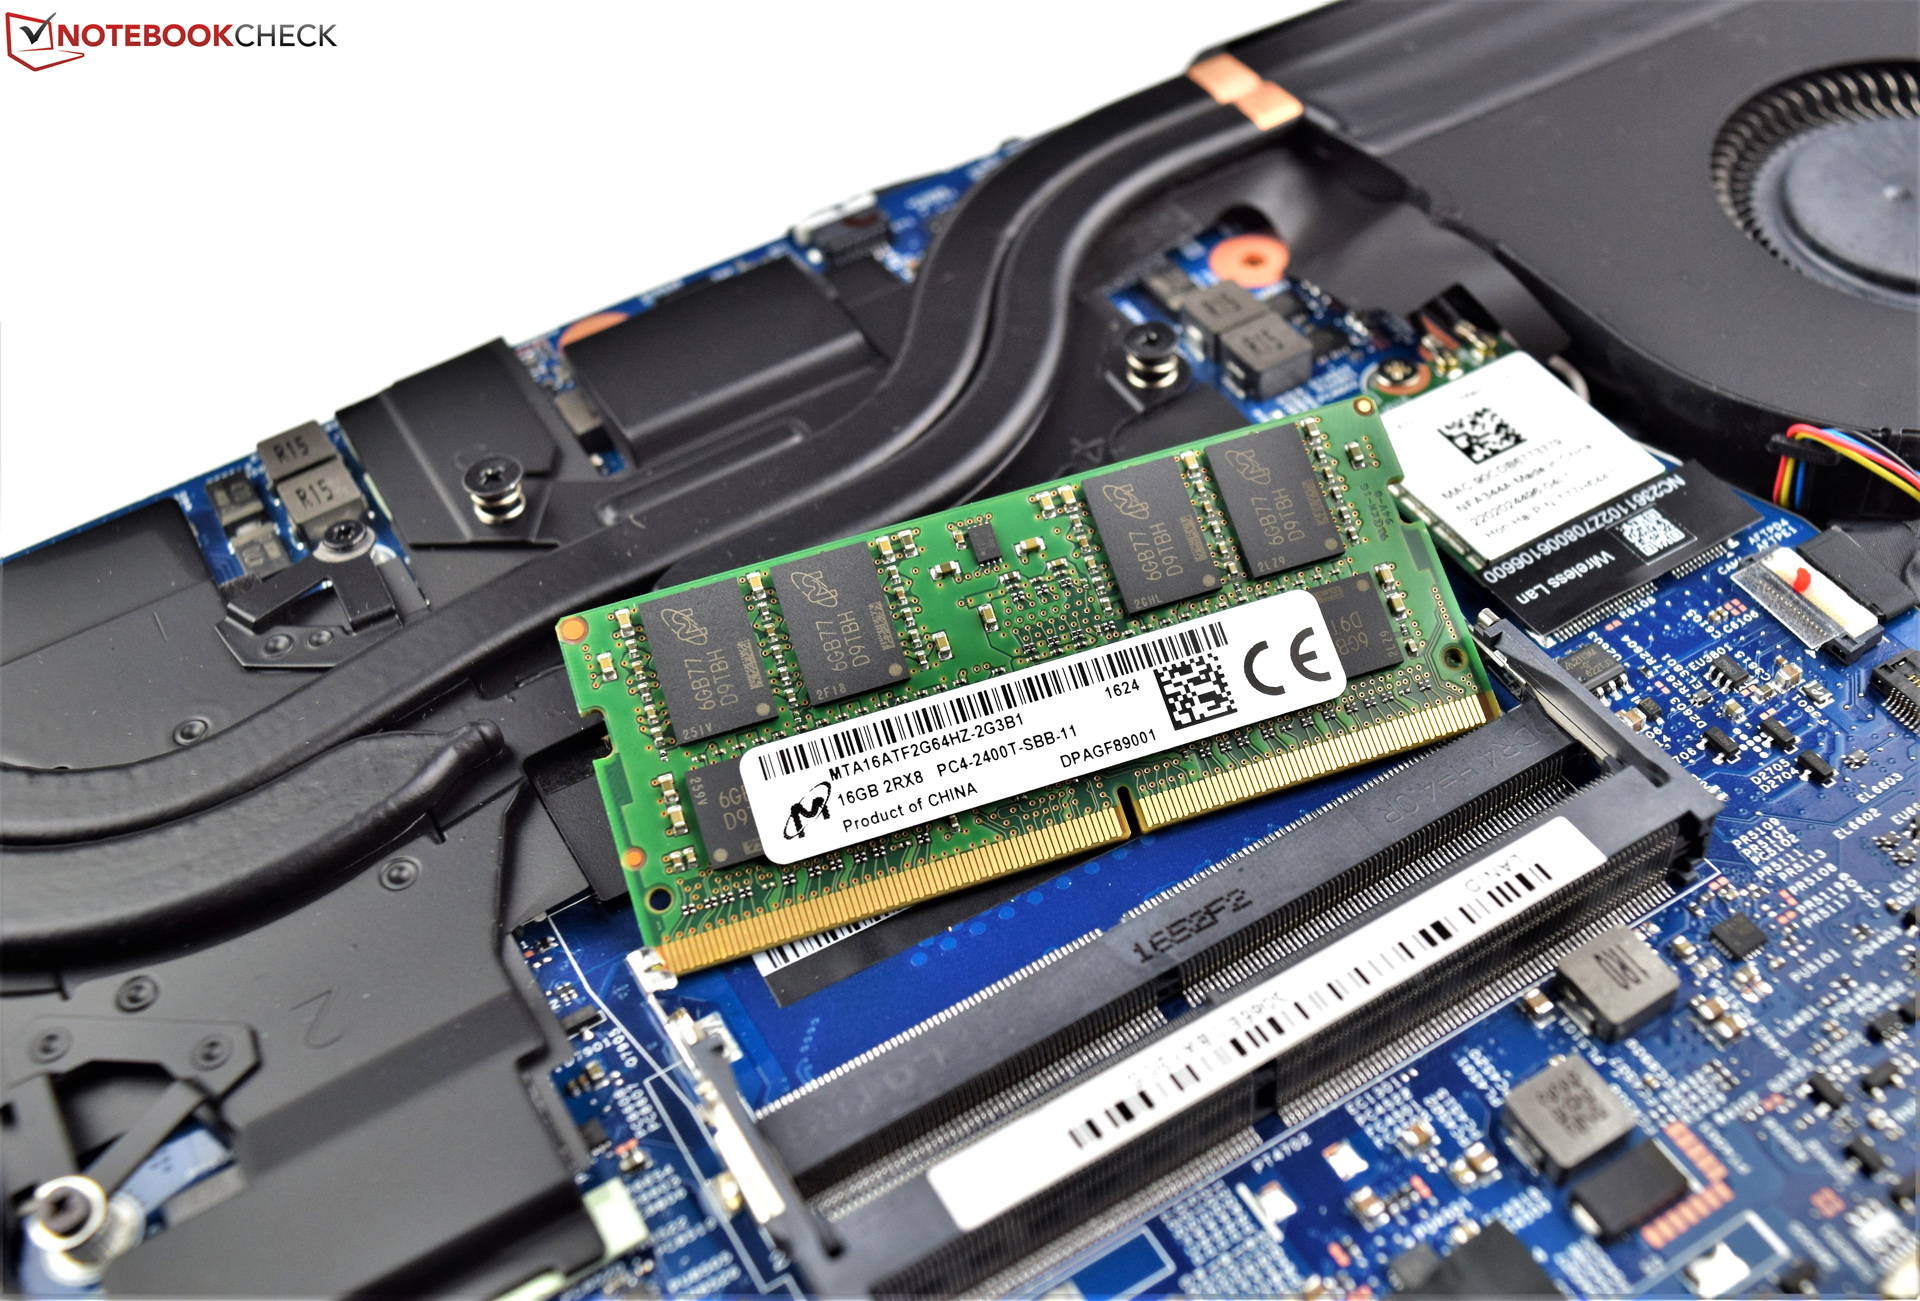
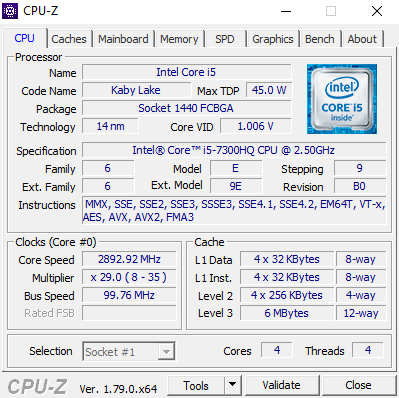
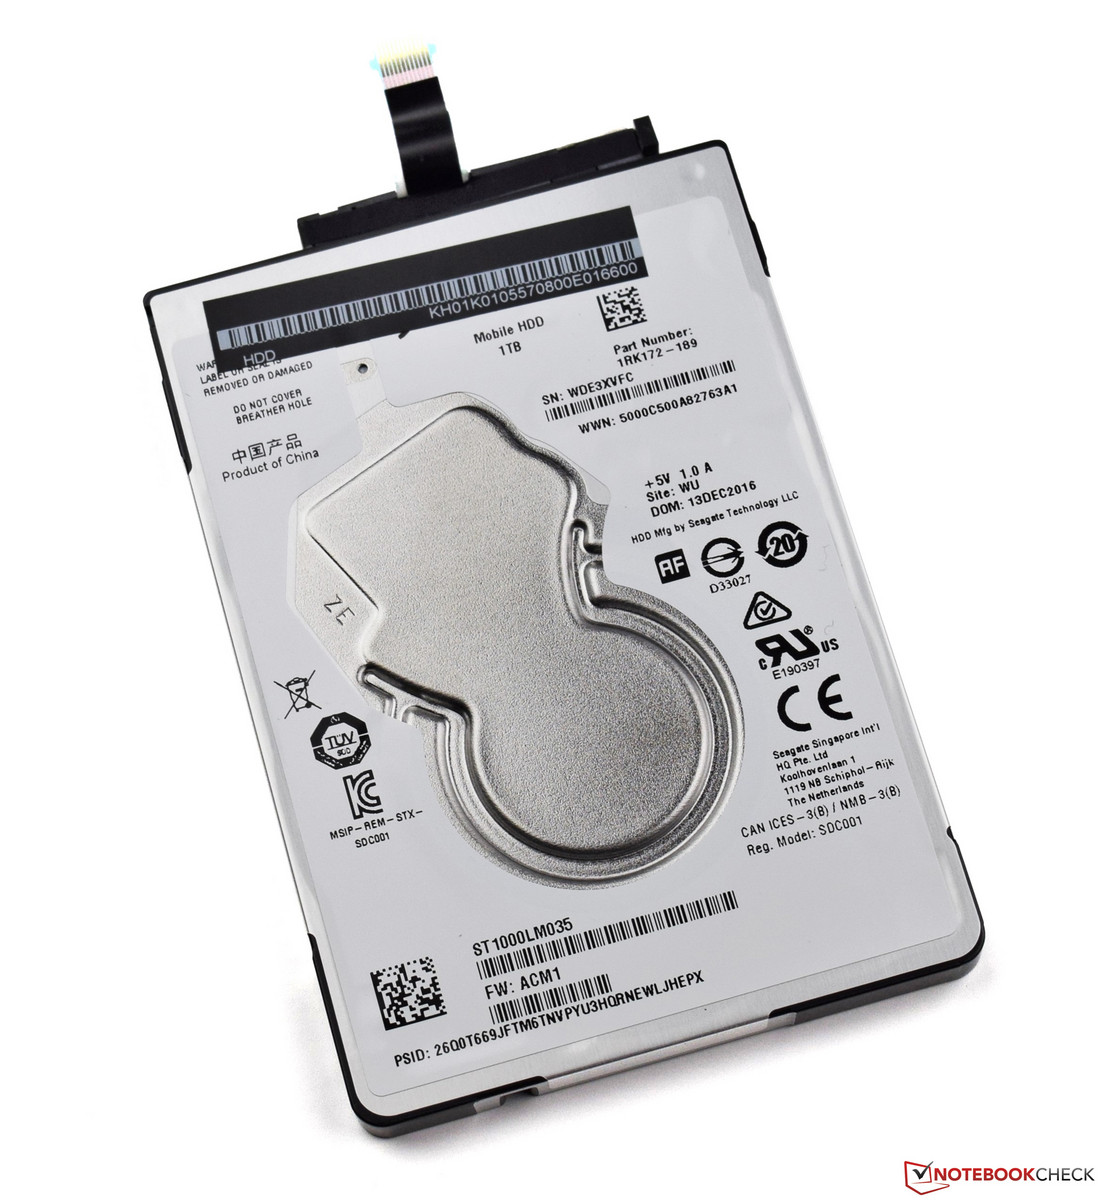
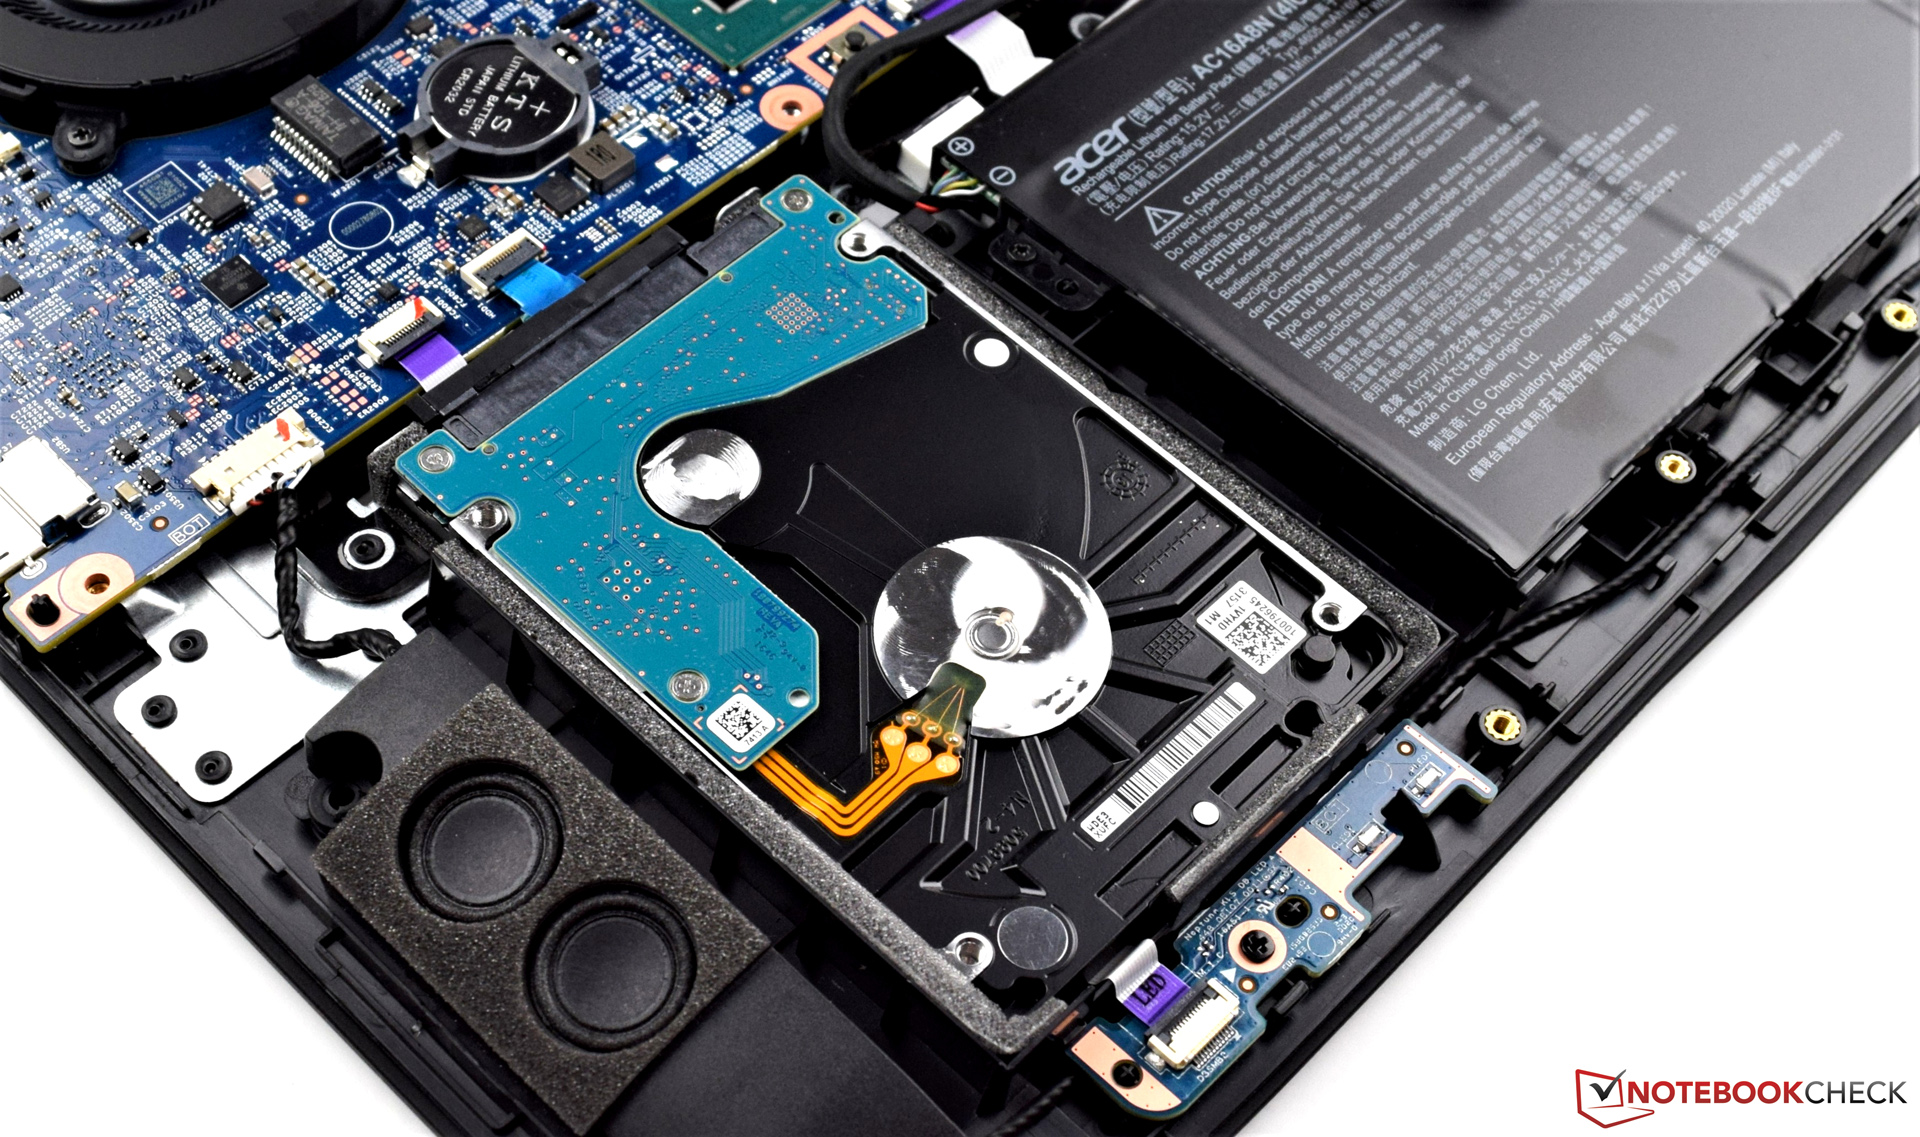
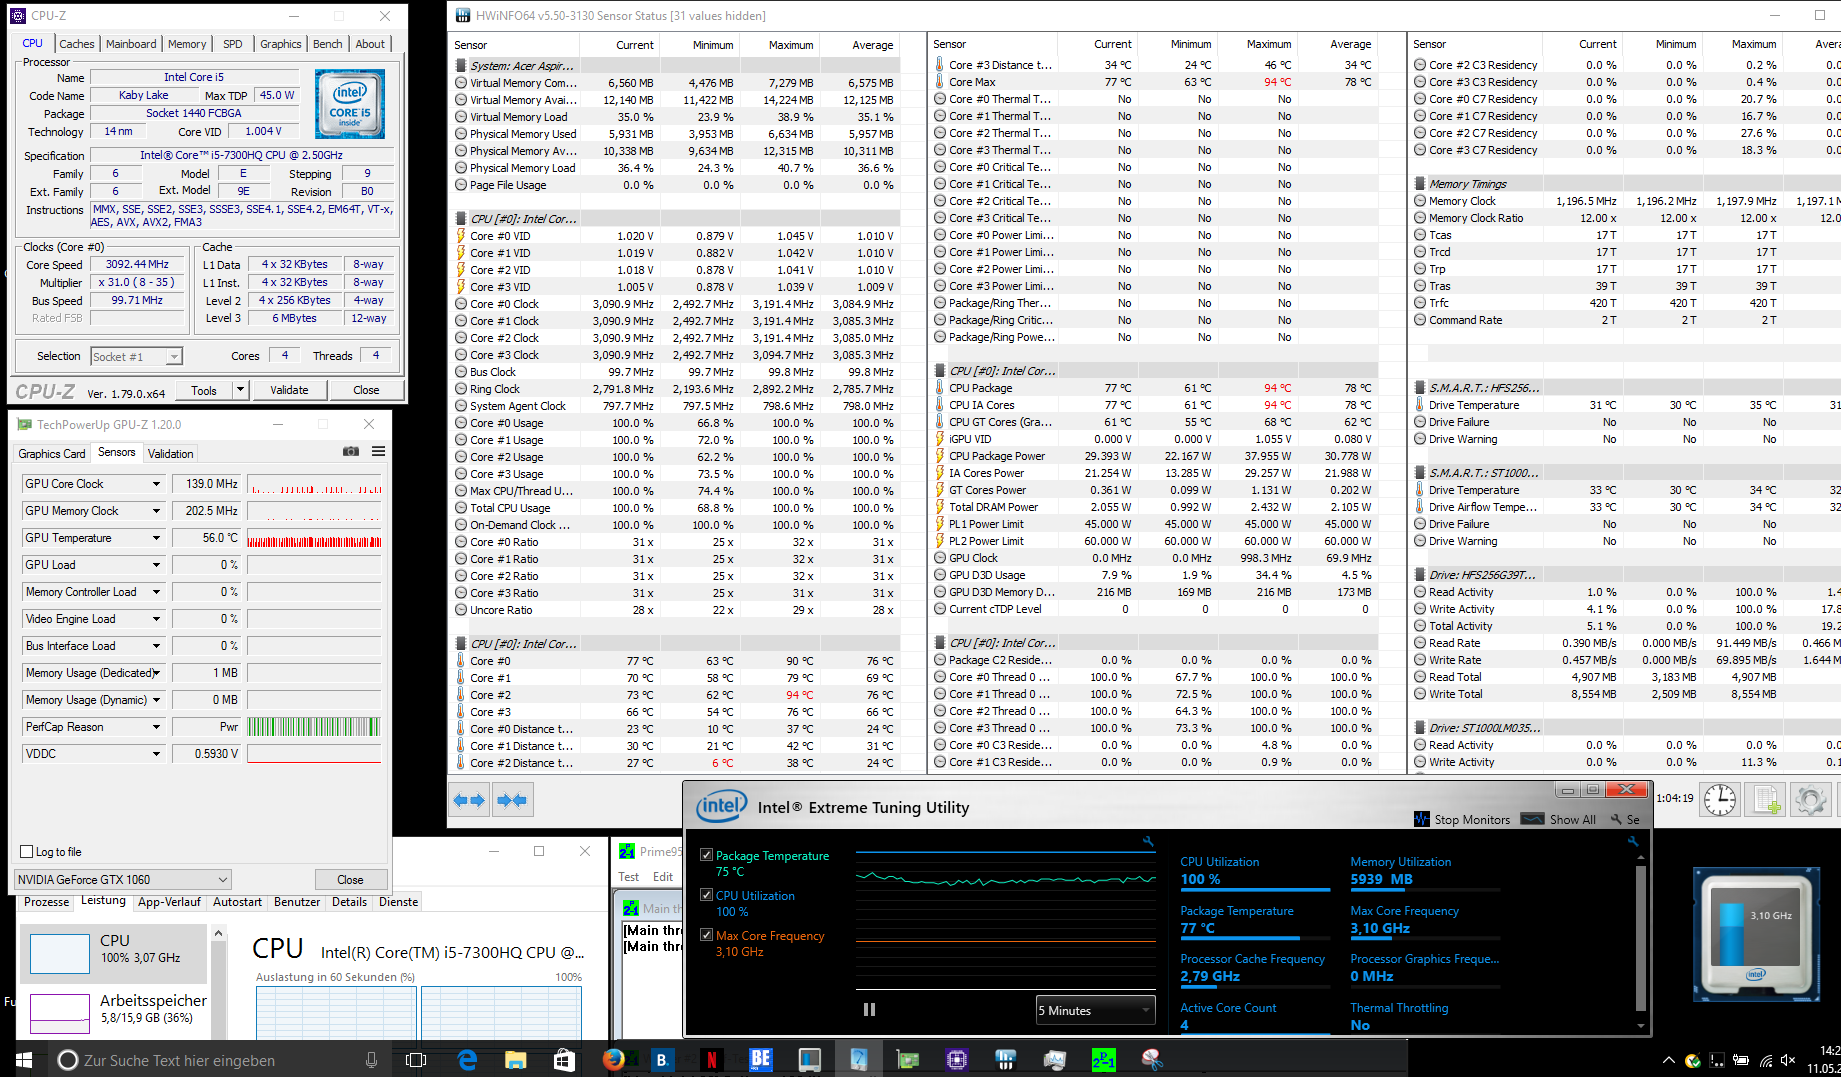
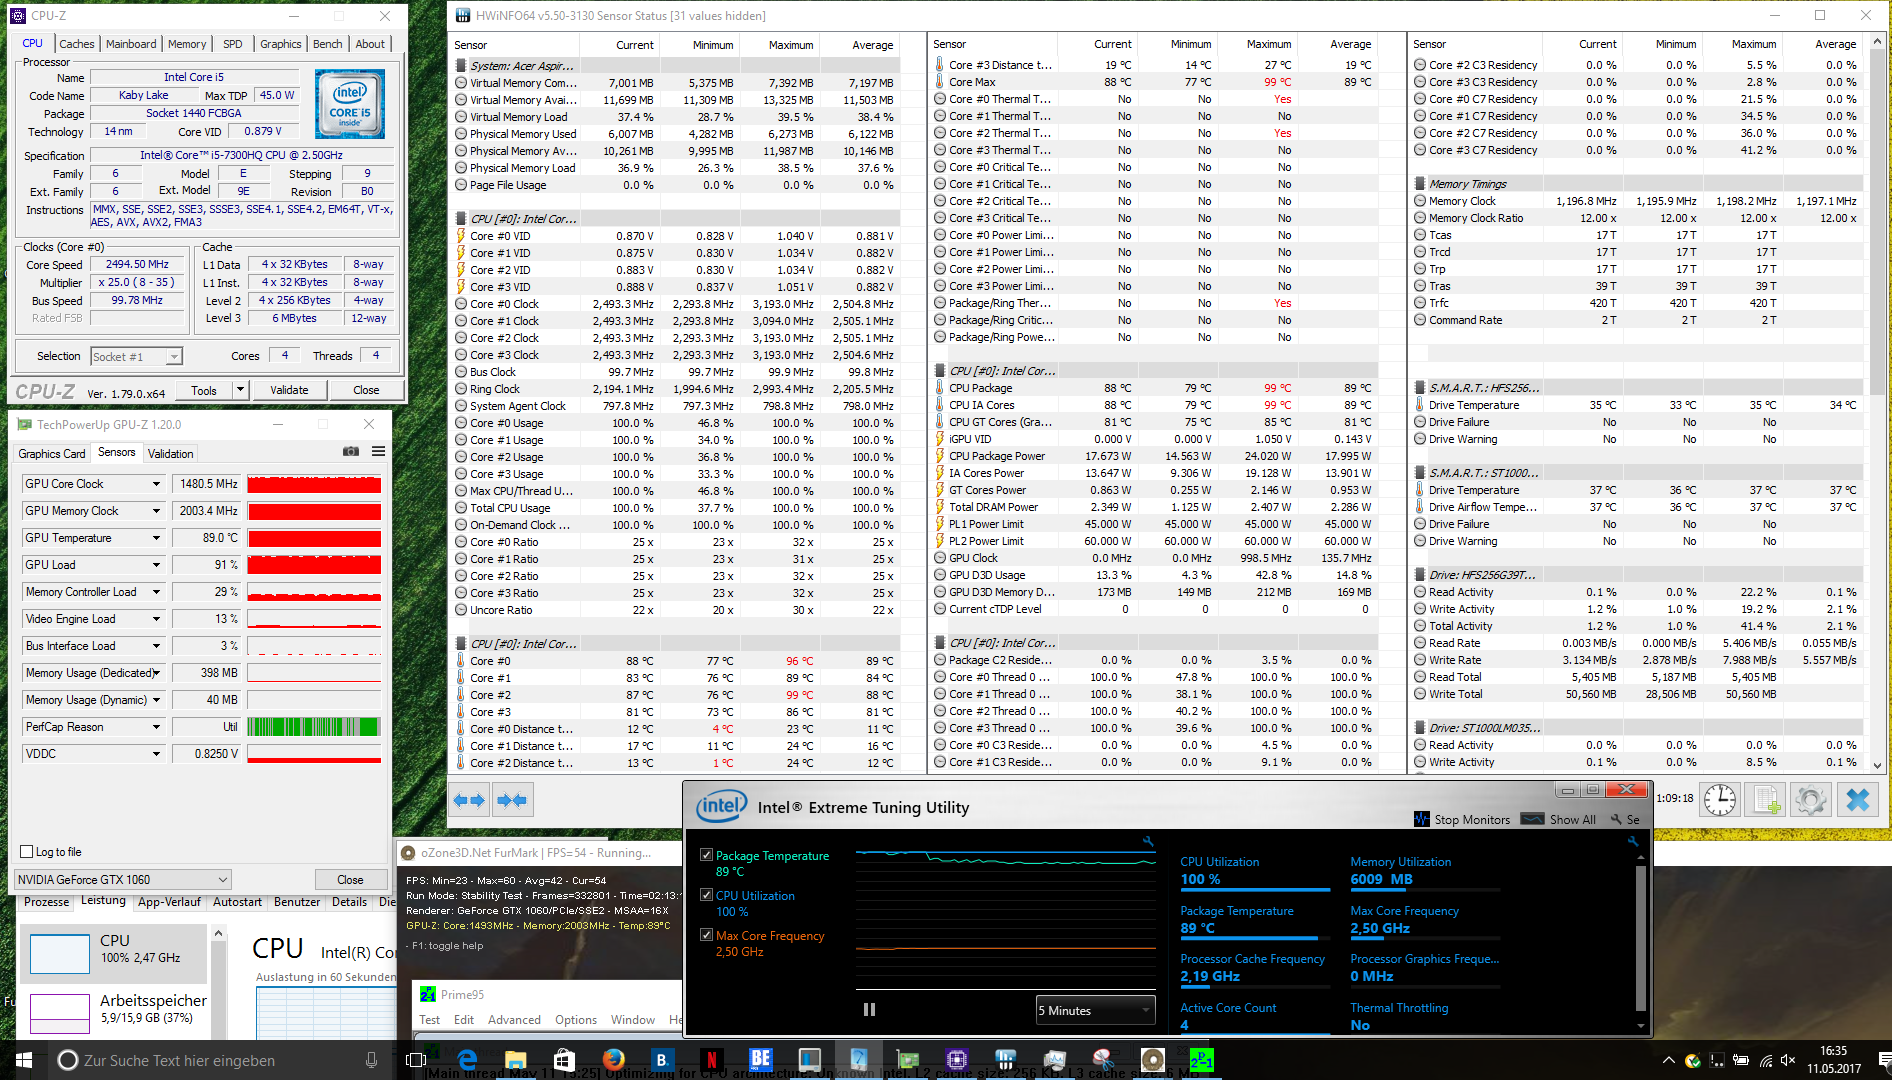
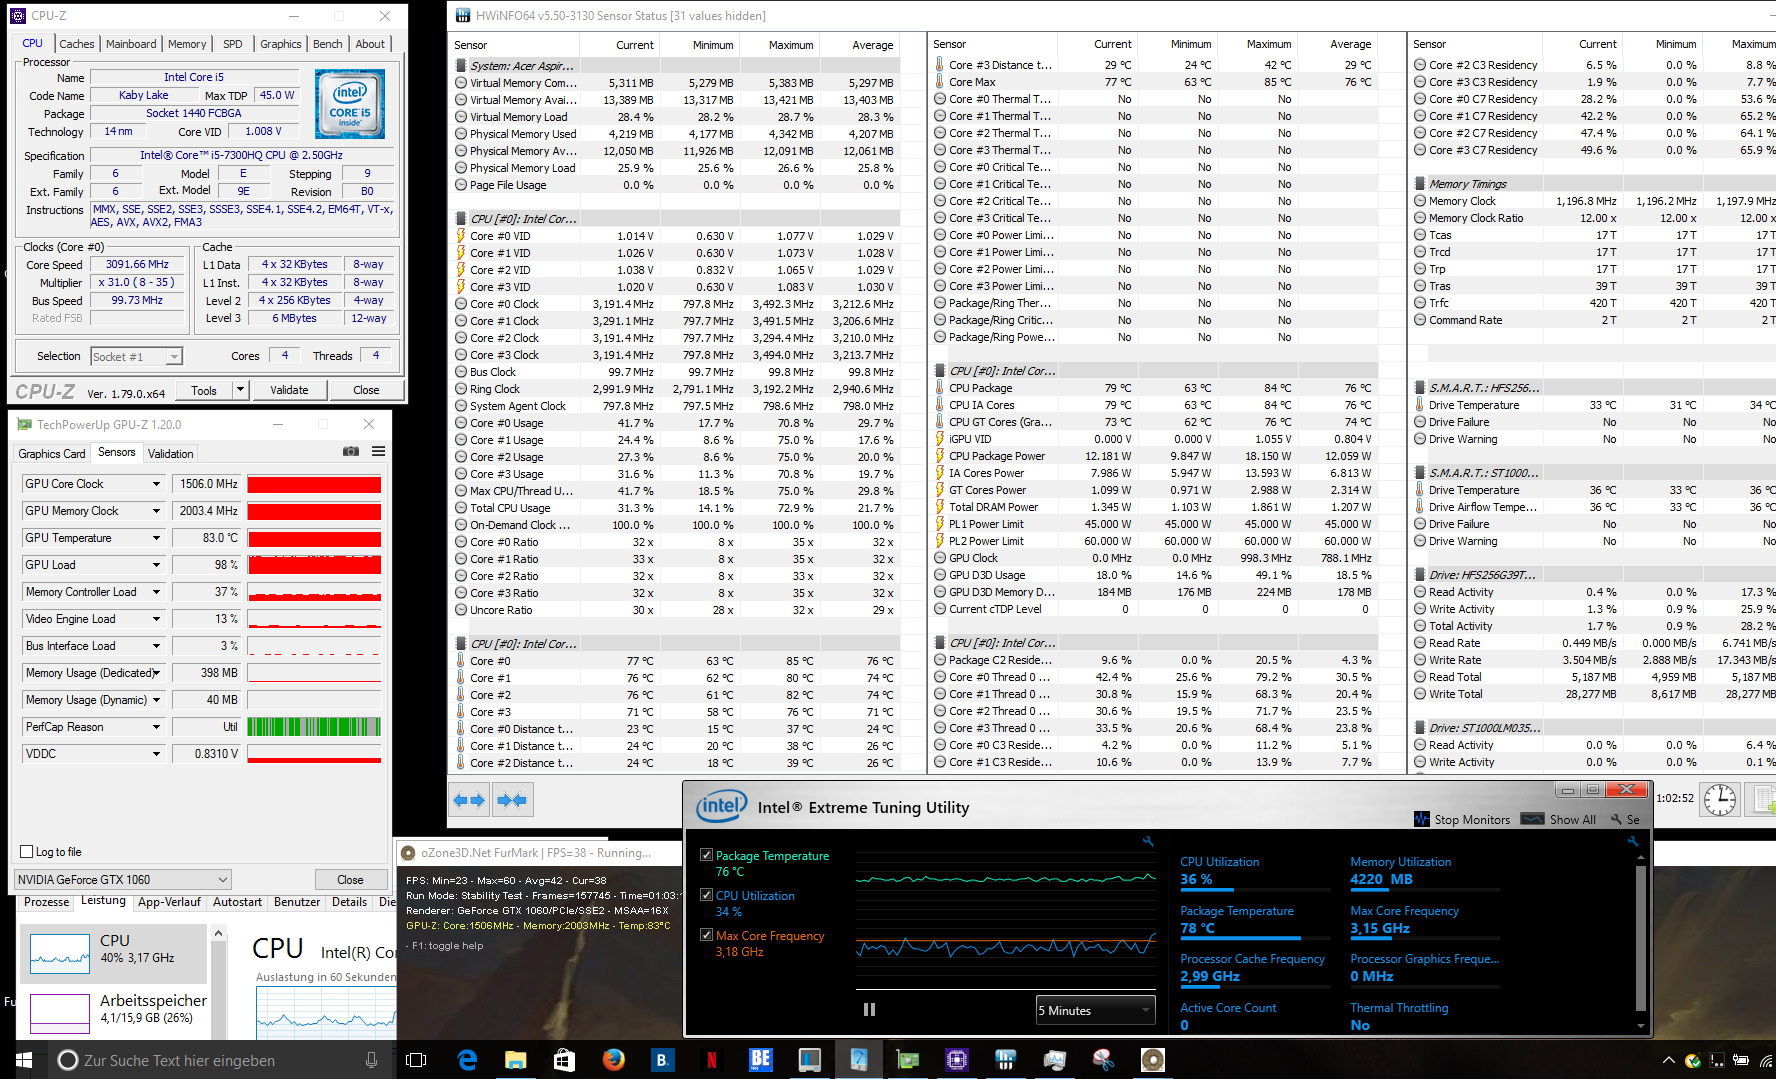
Considerando il tutto il Nitro - visto nella prospettiva gaming - va molto bene. Acer effettivamente confuta il pregiudizio che i processori Core i5 non siano adatti al gaming e dimostra che la scheda grafica è molto più importanti. L'Intel Core i5-7300HQ è un processore da 45 W quad-core e pertanto non il più efficiente. Tuttavia, se lo combiniamo con una generosa quantità di RAM ed uno spazio di archiviazione adeguato (SSD + HDD) offre prestazioni ampie.
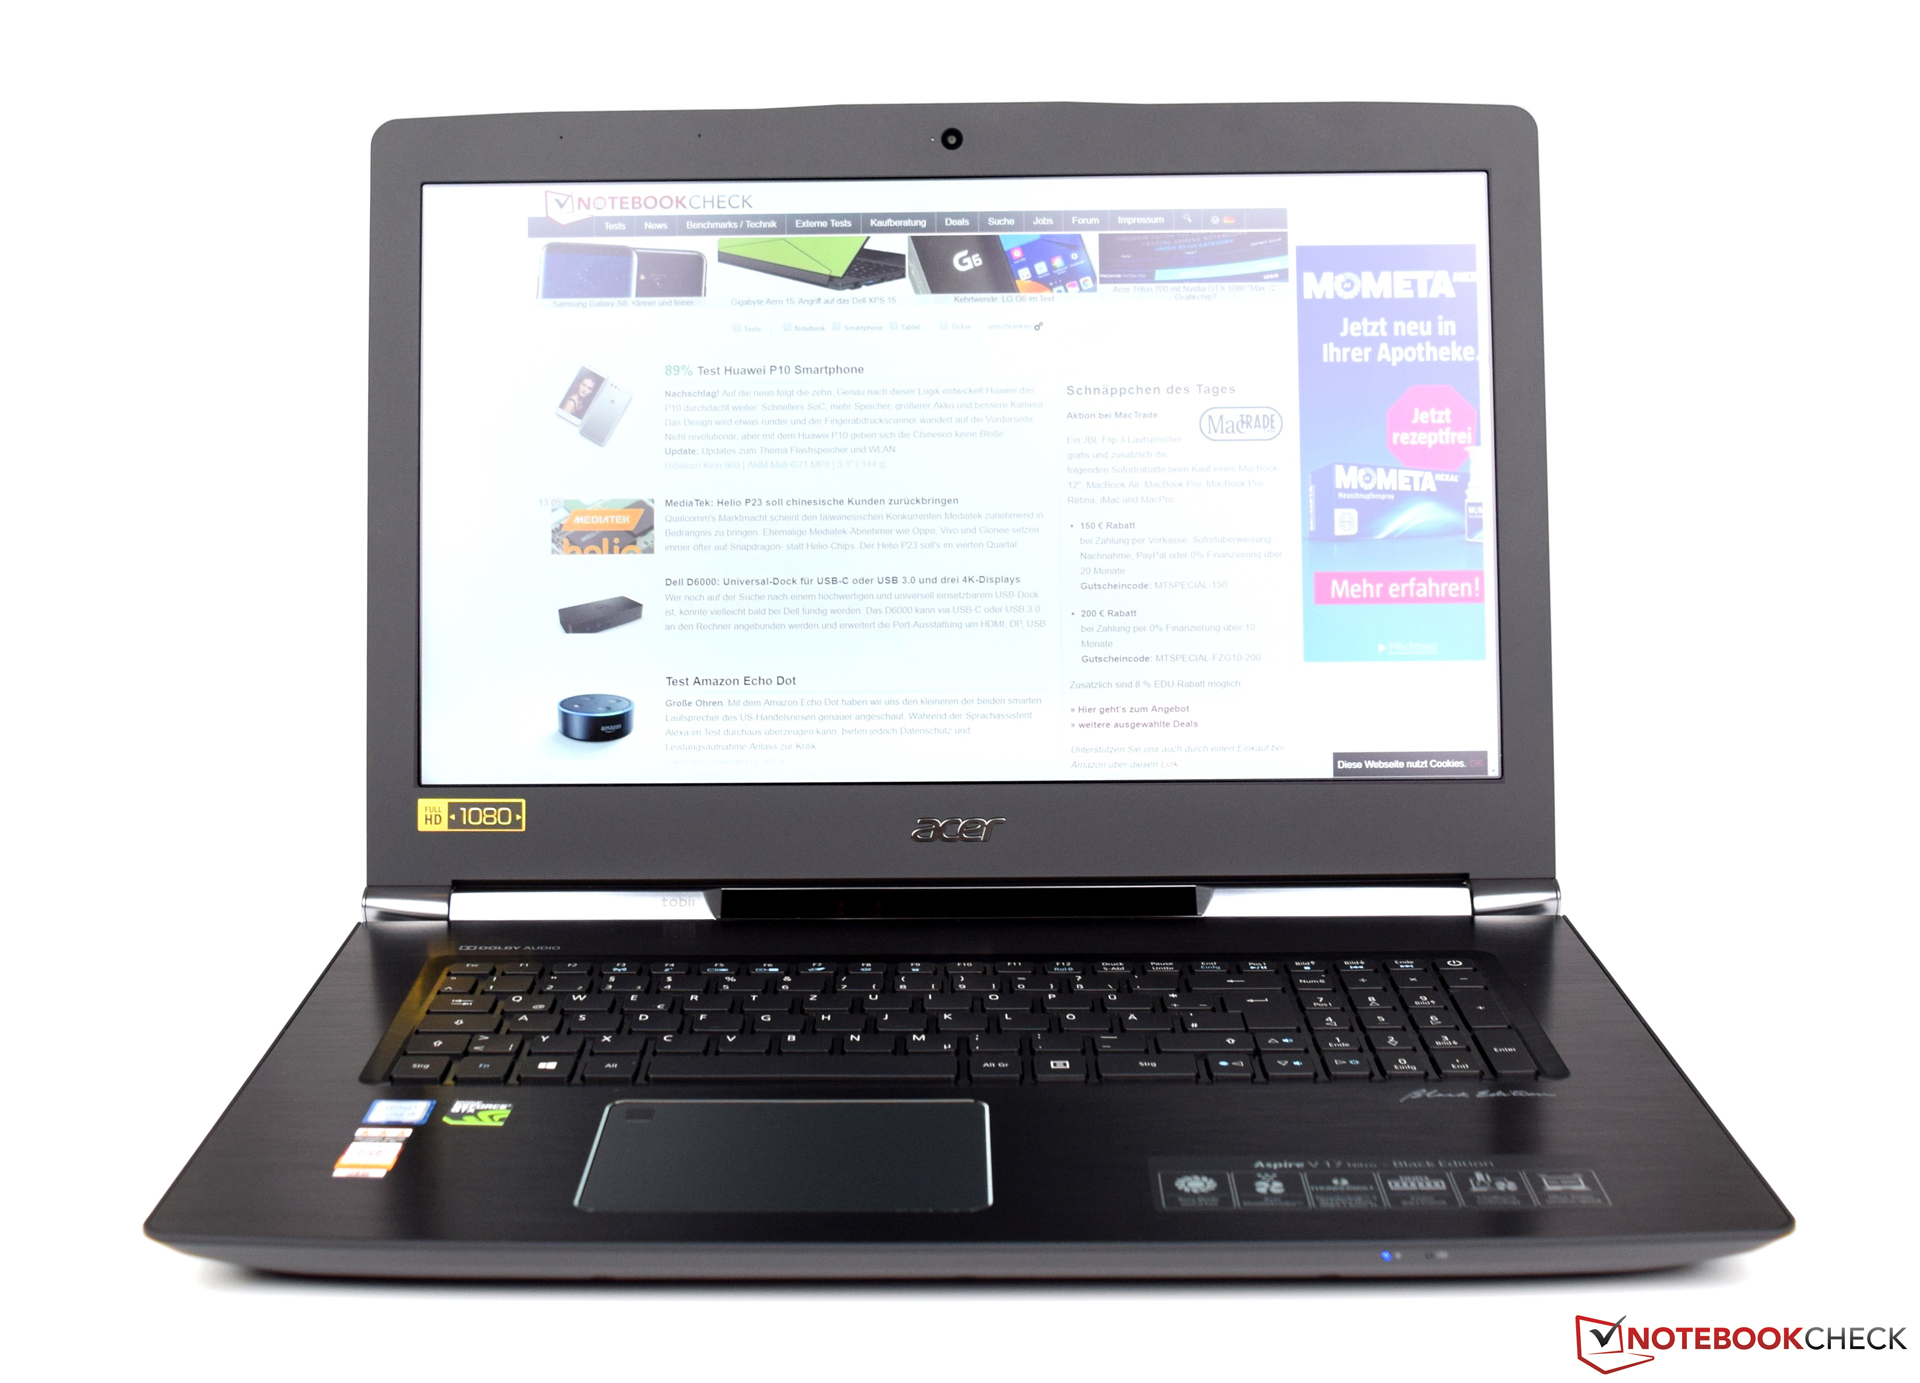
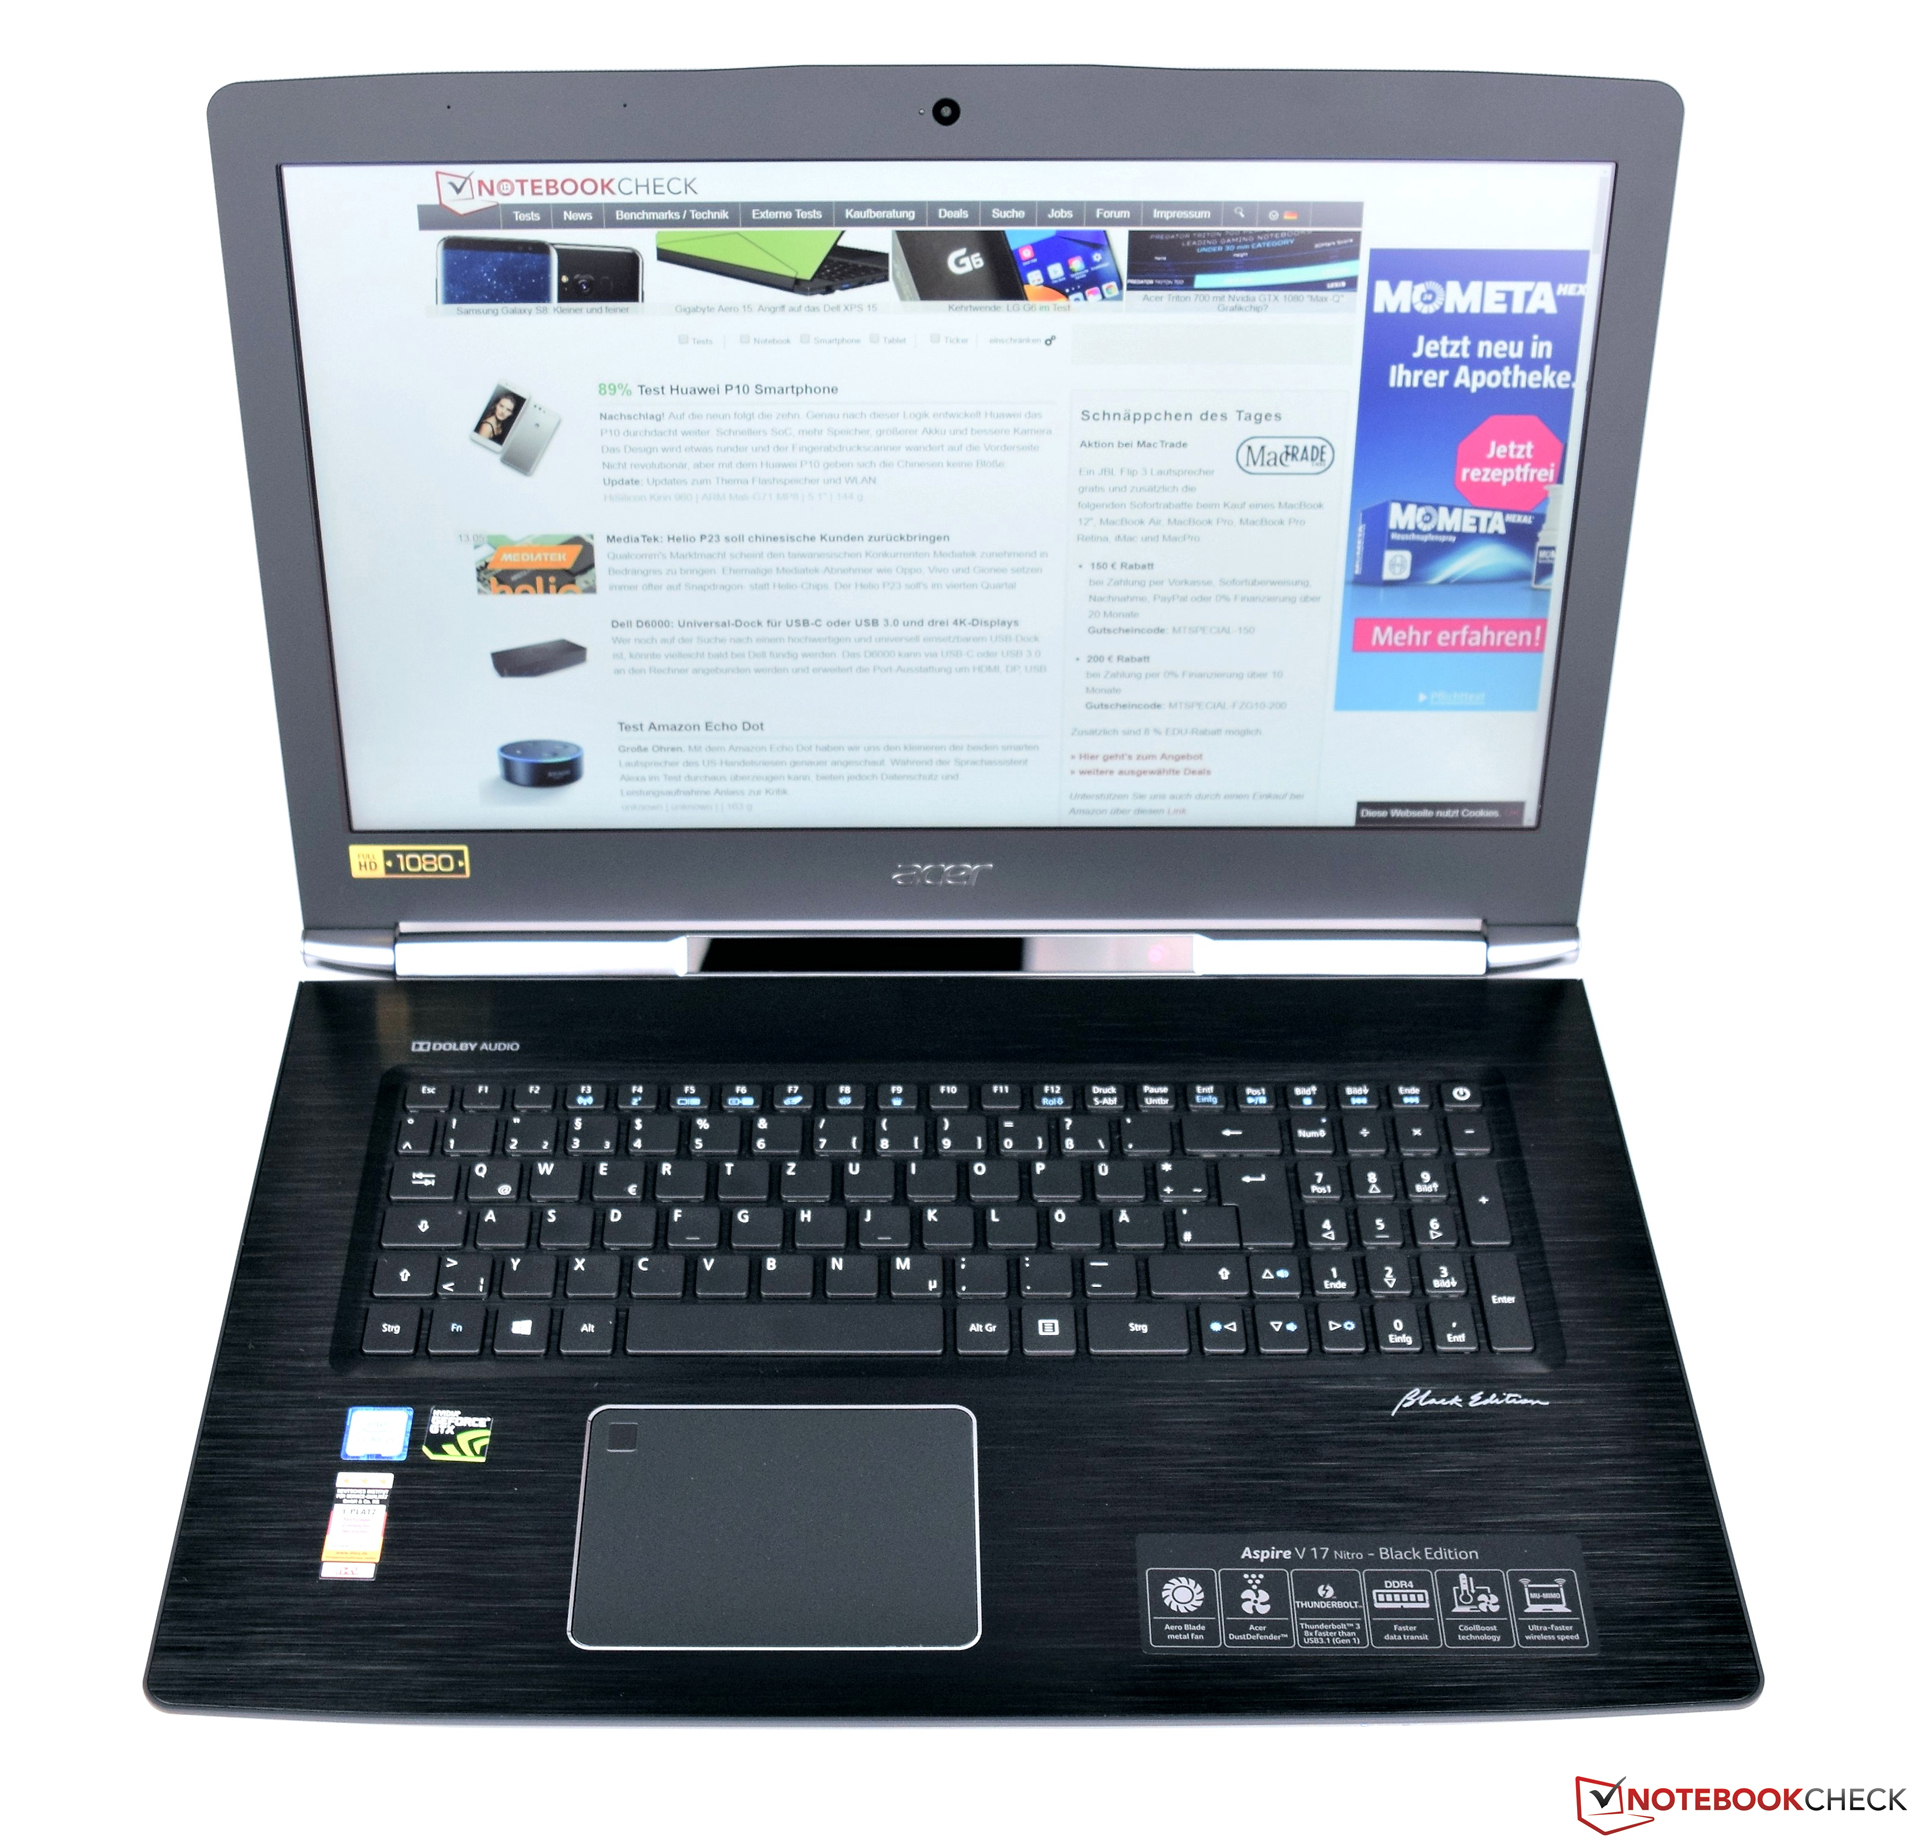
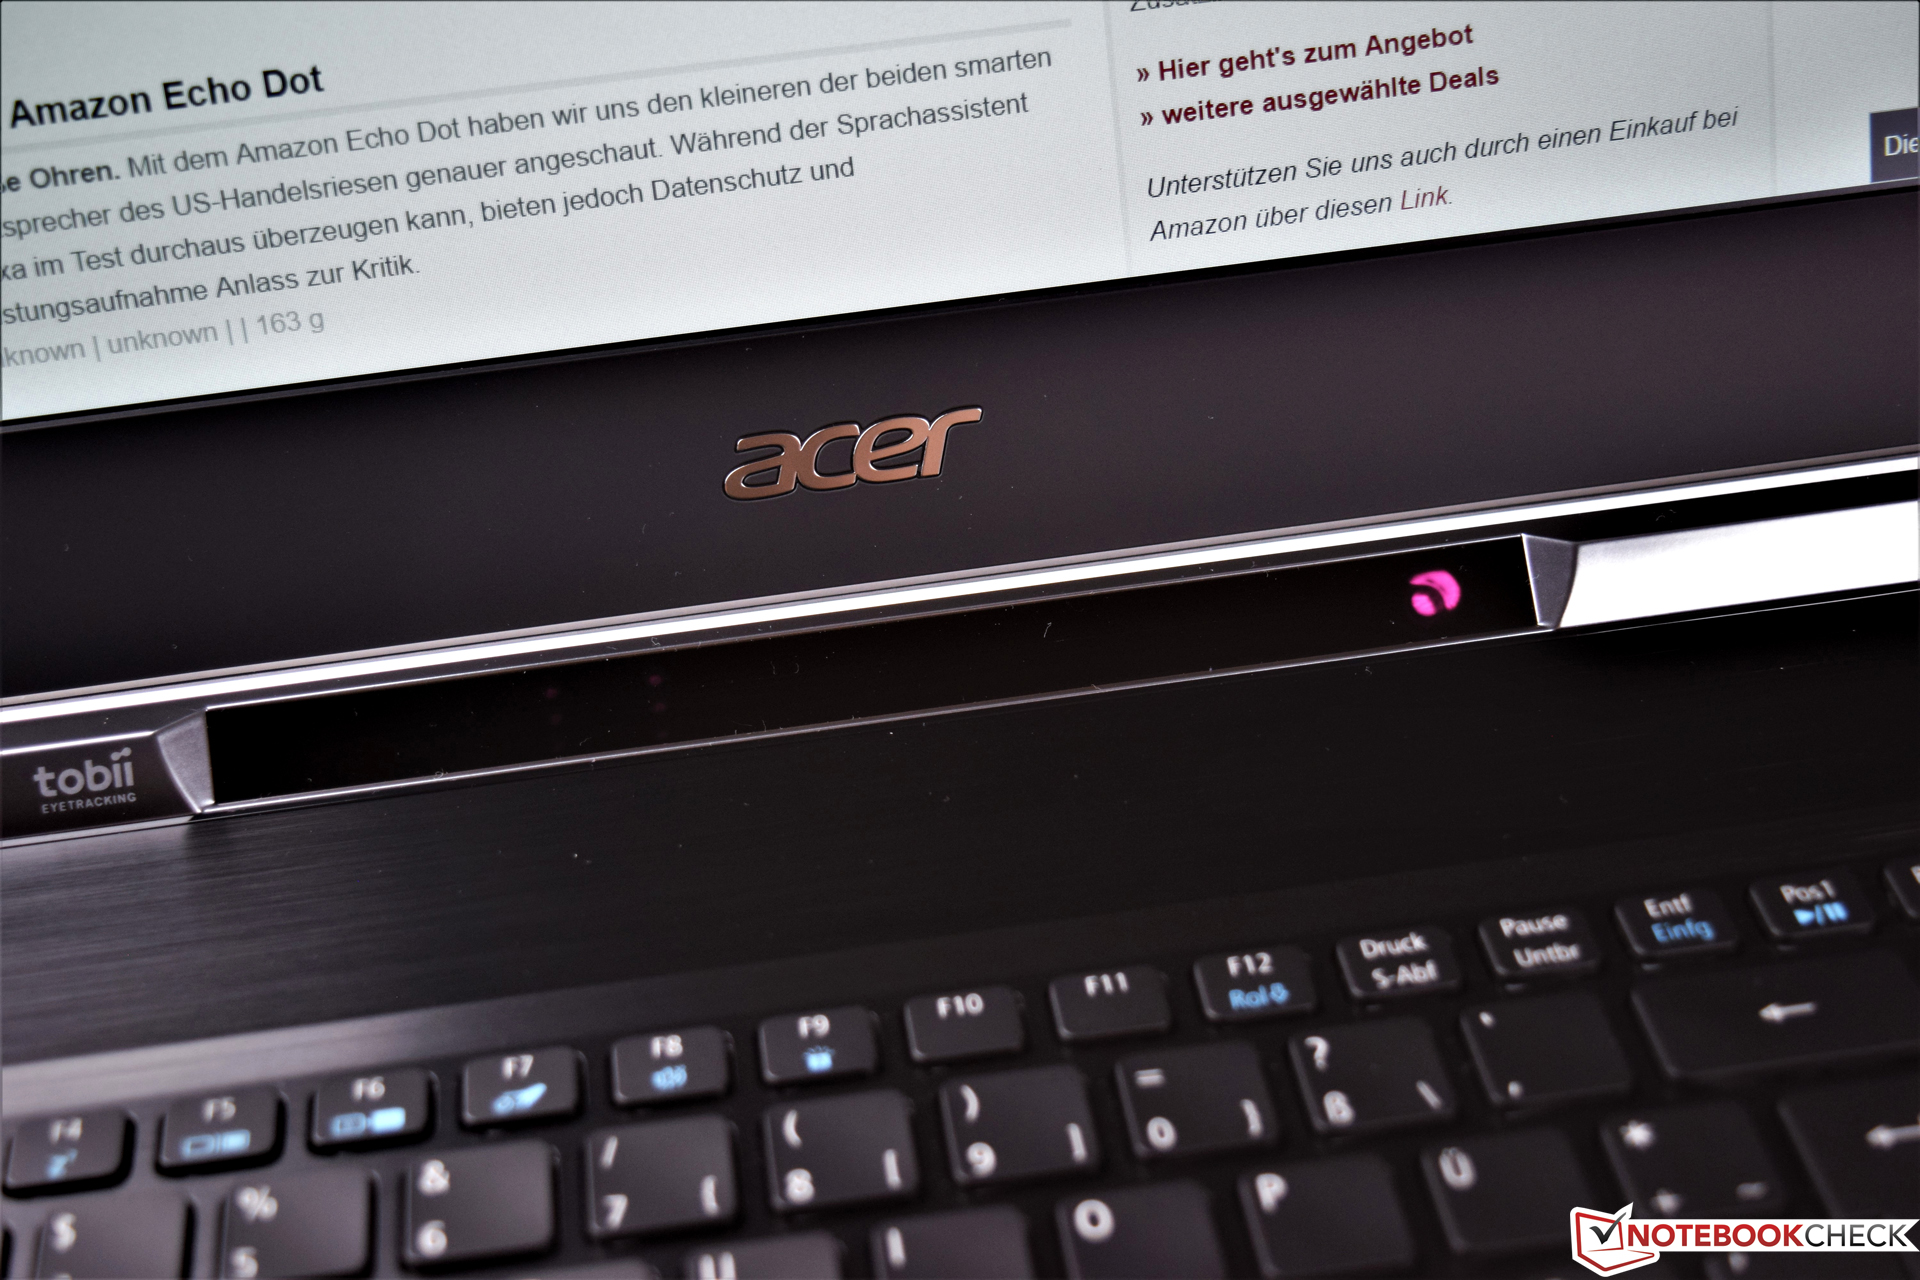
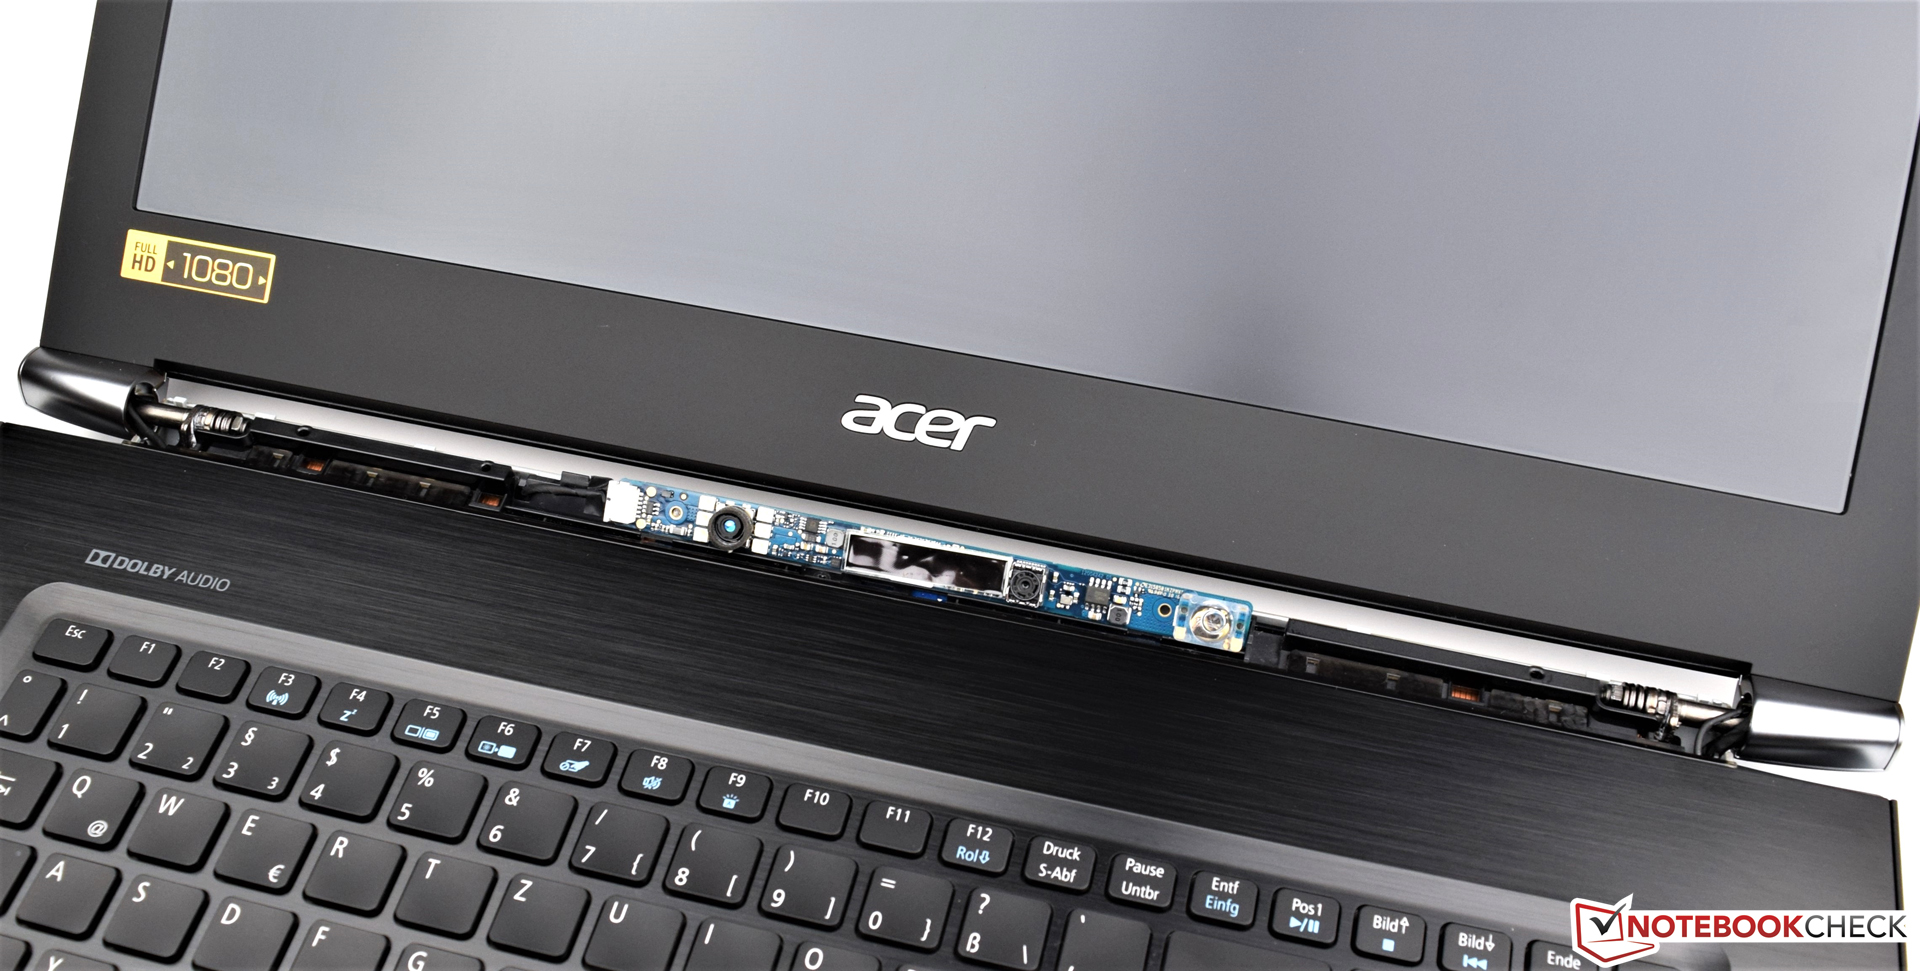
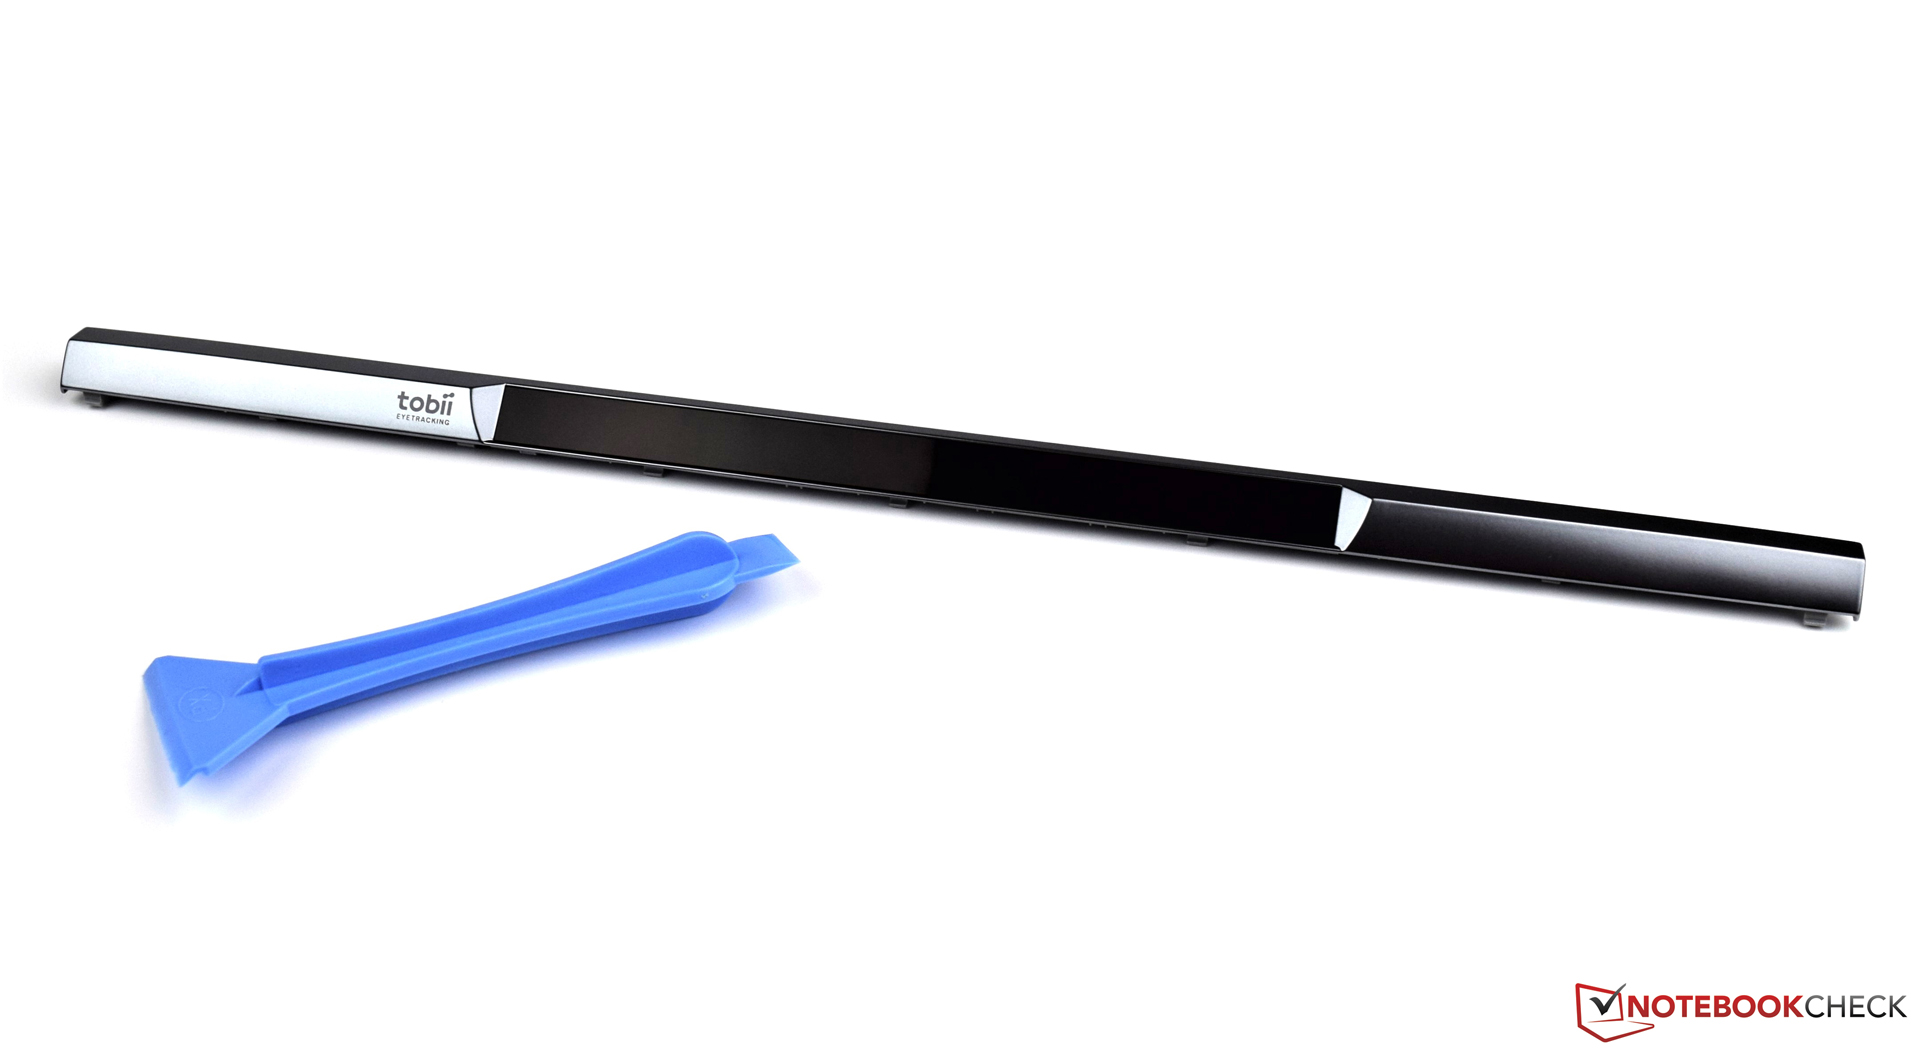
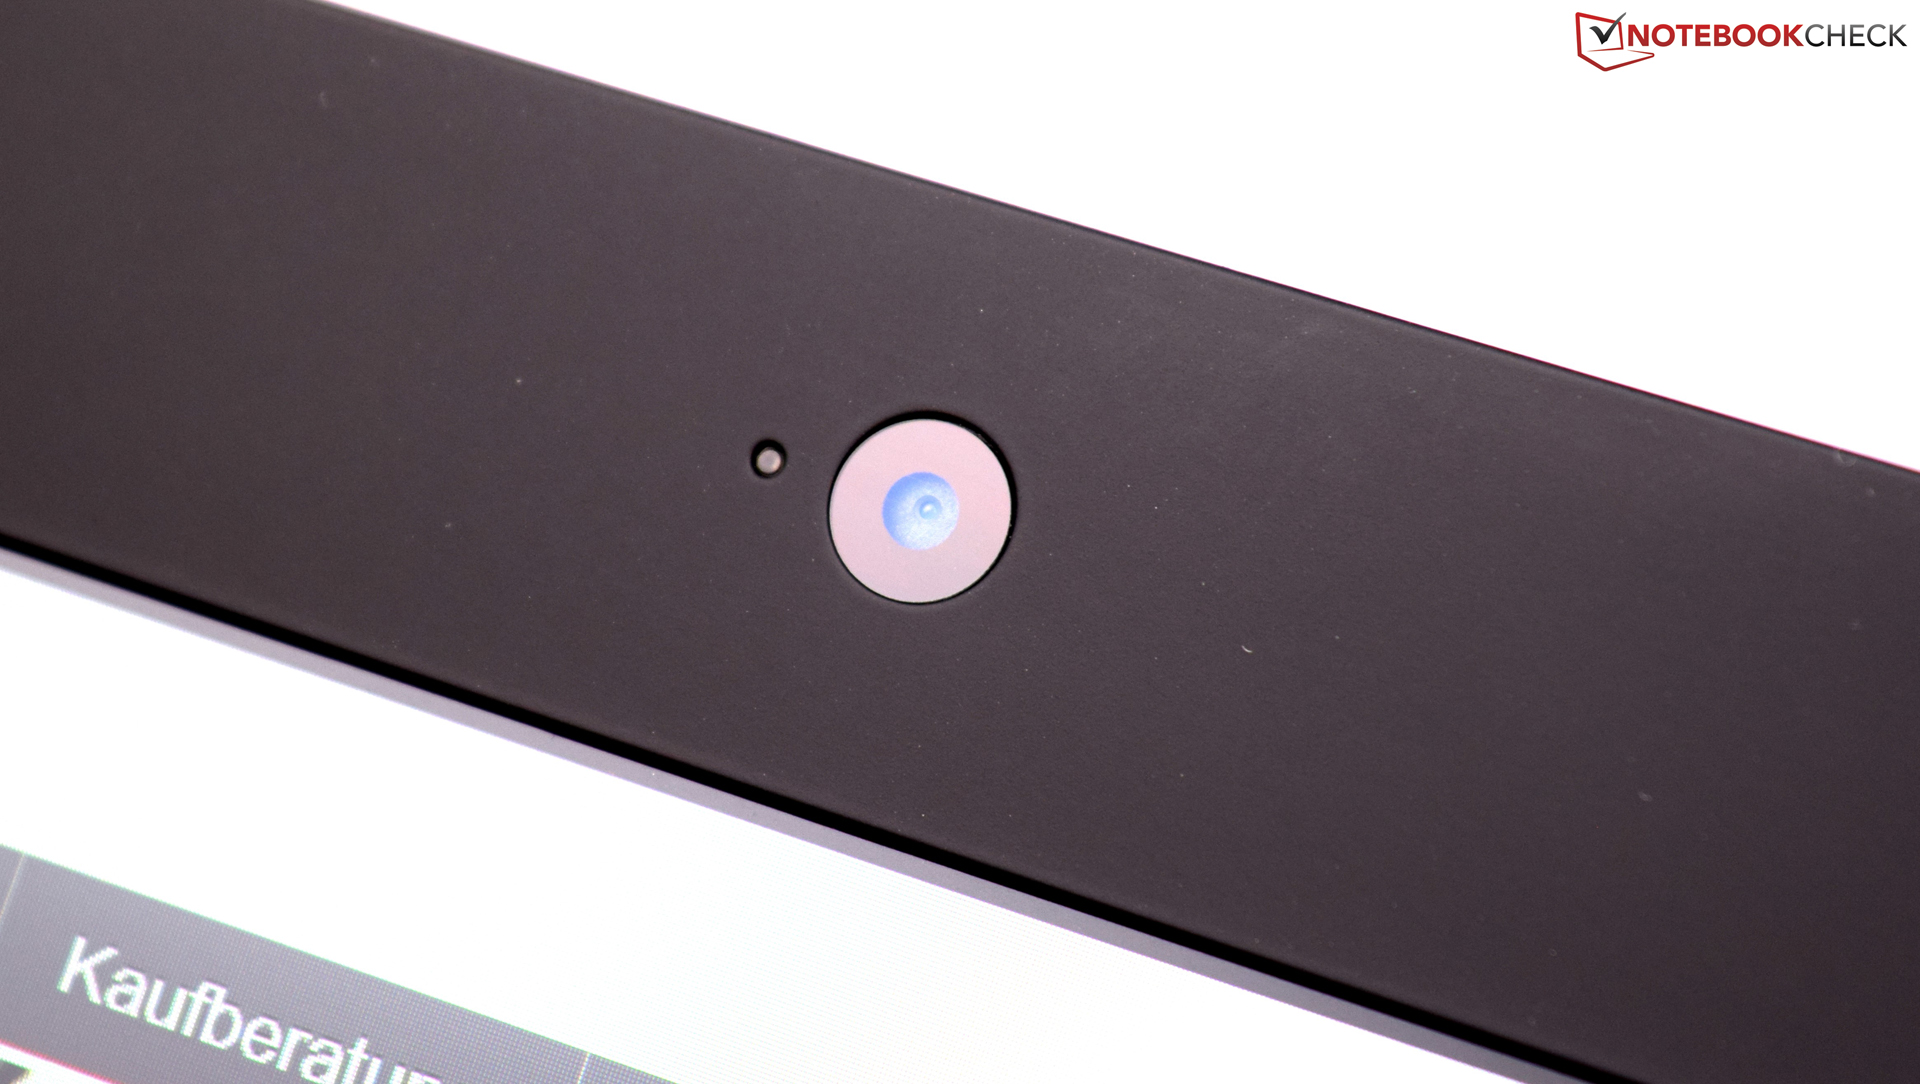
L'Acer Aspire Nitro convince con prestazioni complessivamente buone ed è abbastanza veloce per i giochi pesanti. Il modulo eye-tracking Tobii è interessante, e contribuisce ad una nuova esperienza gaming.
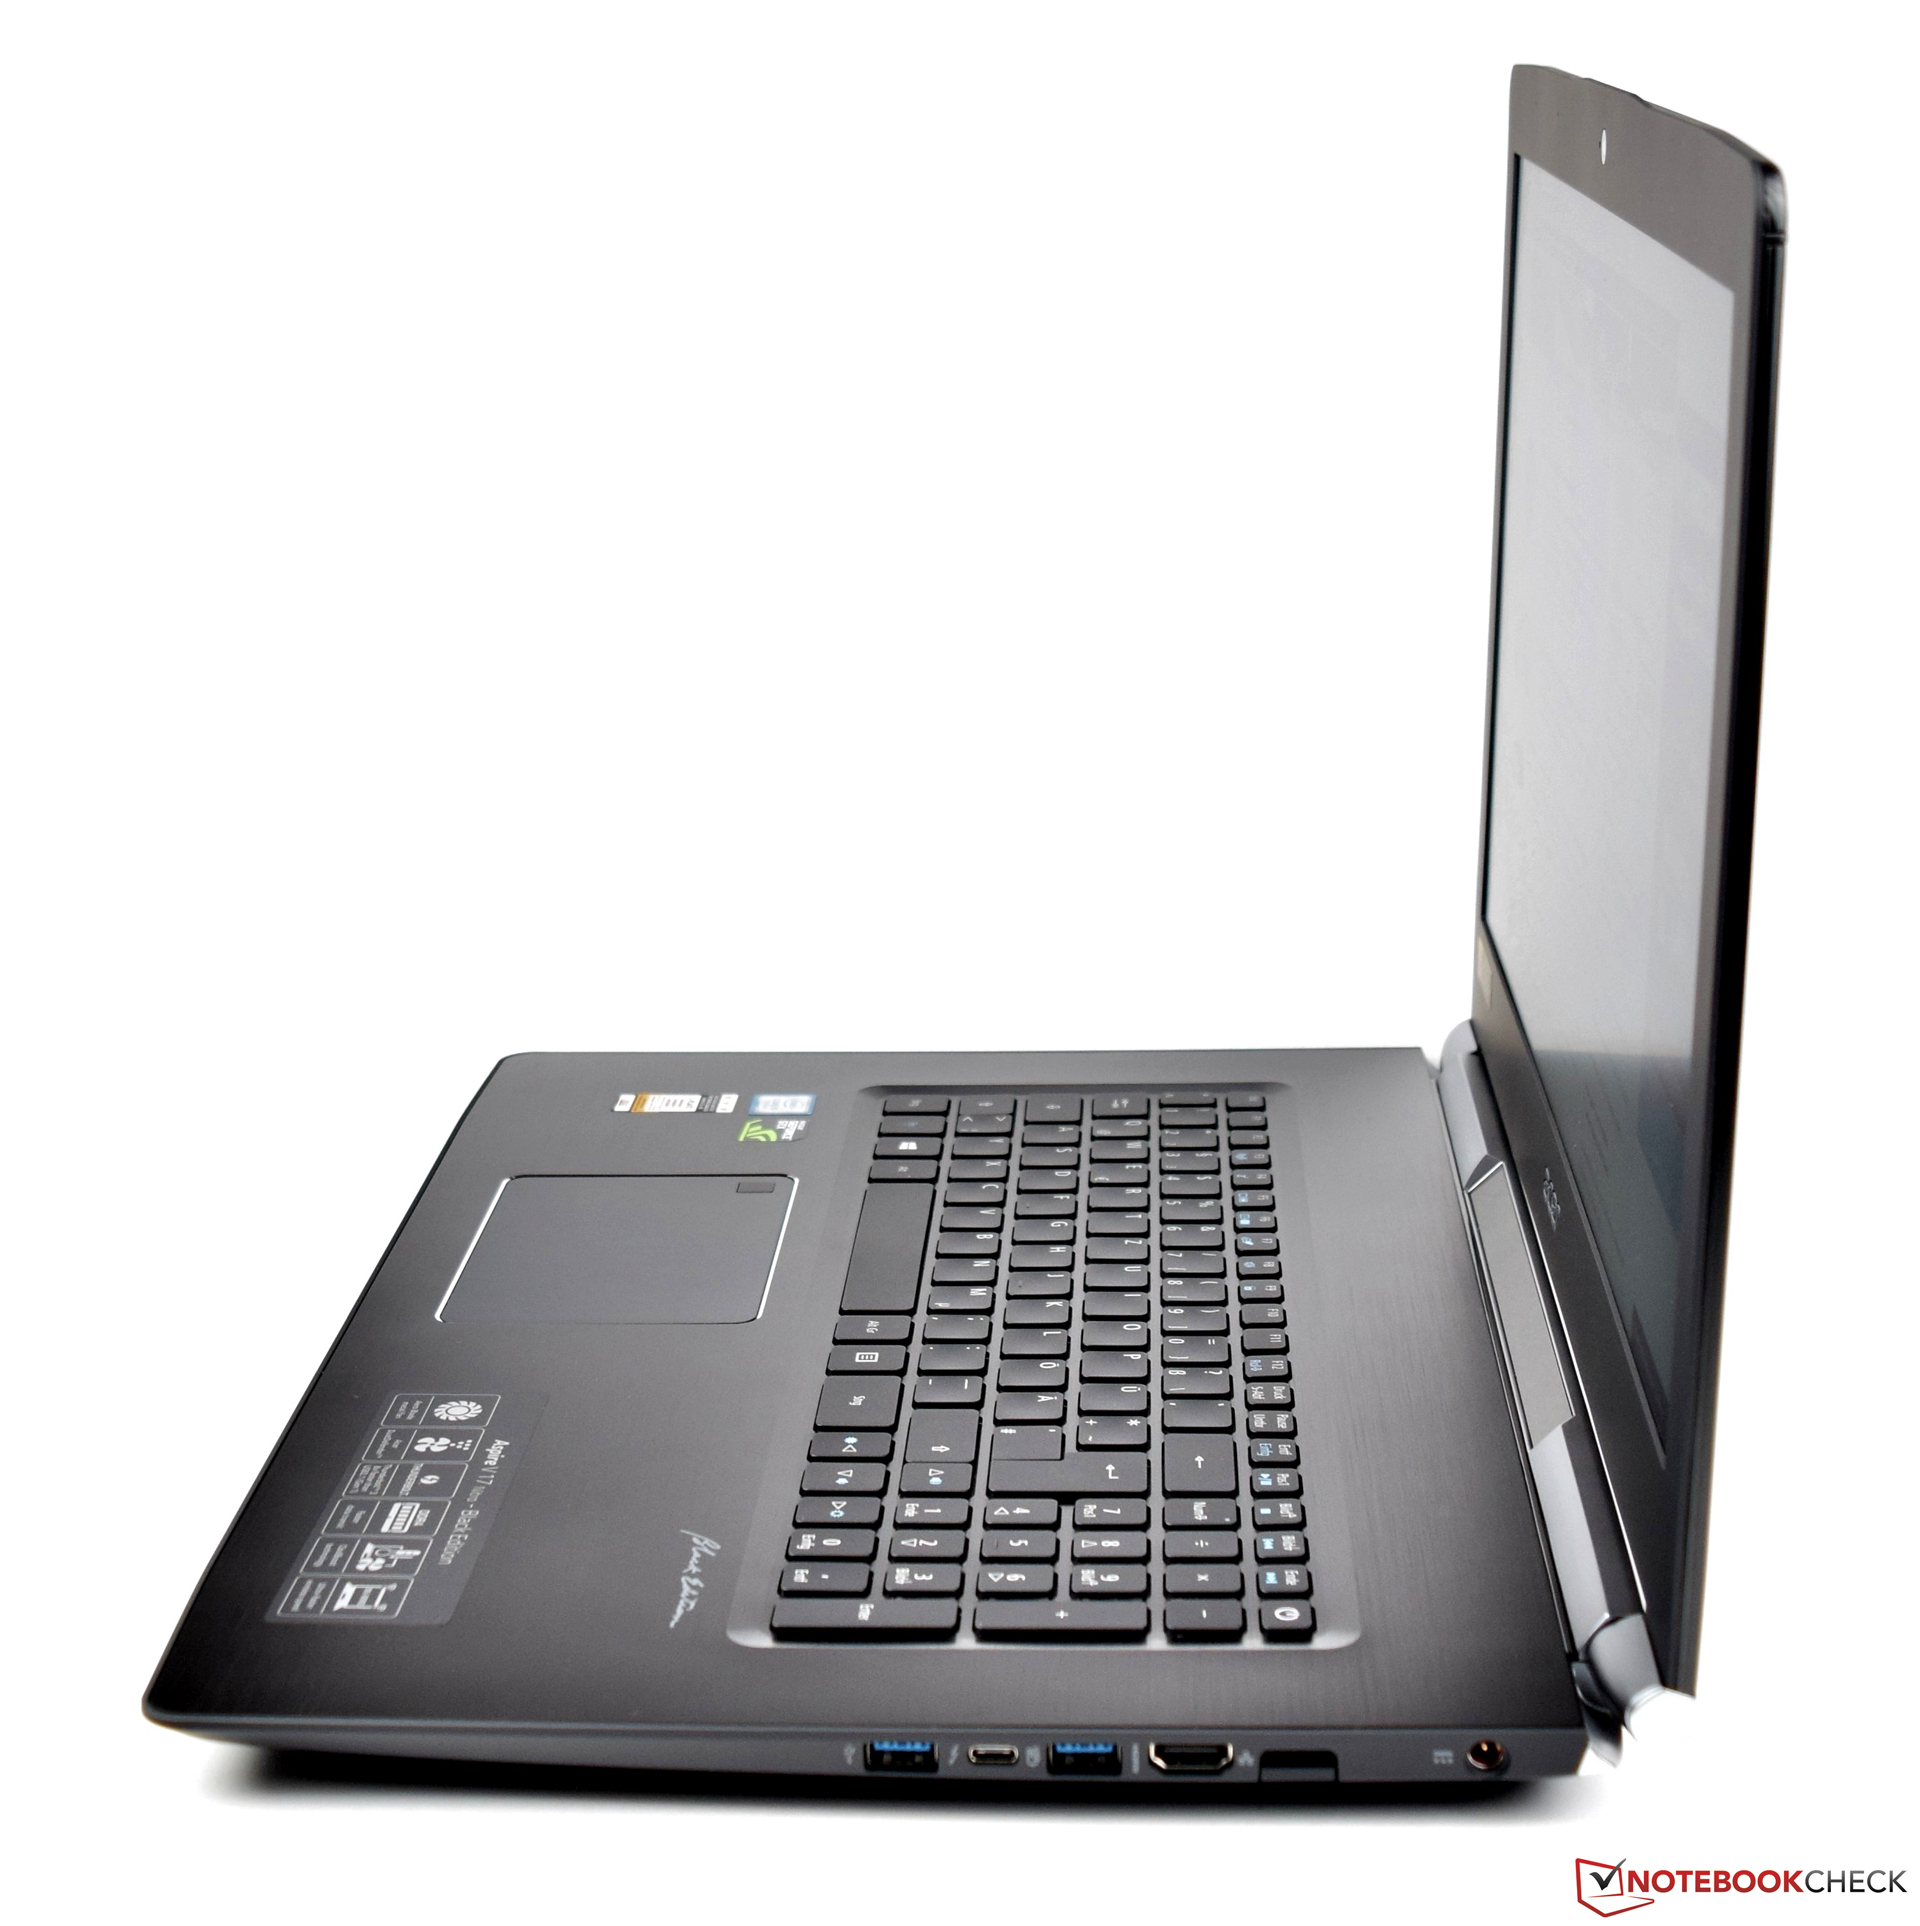
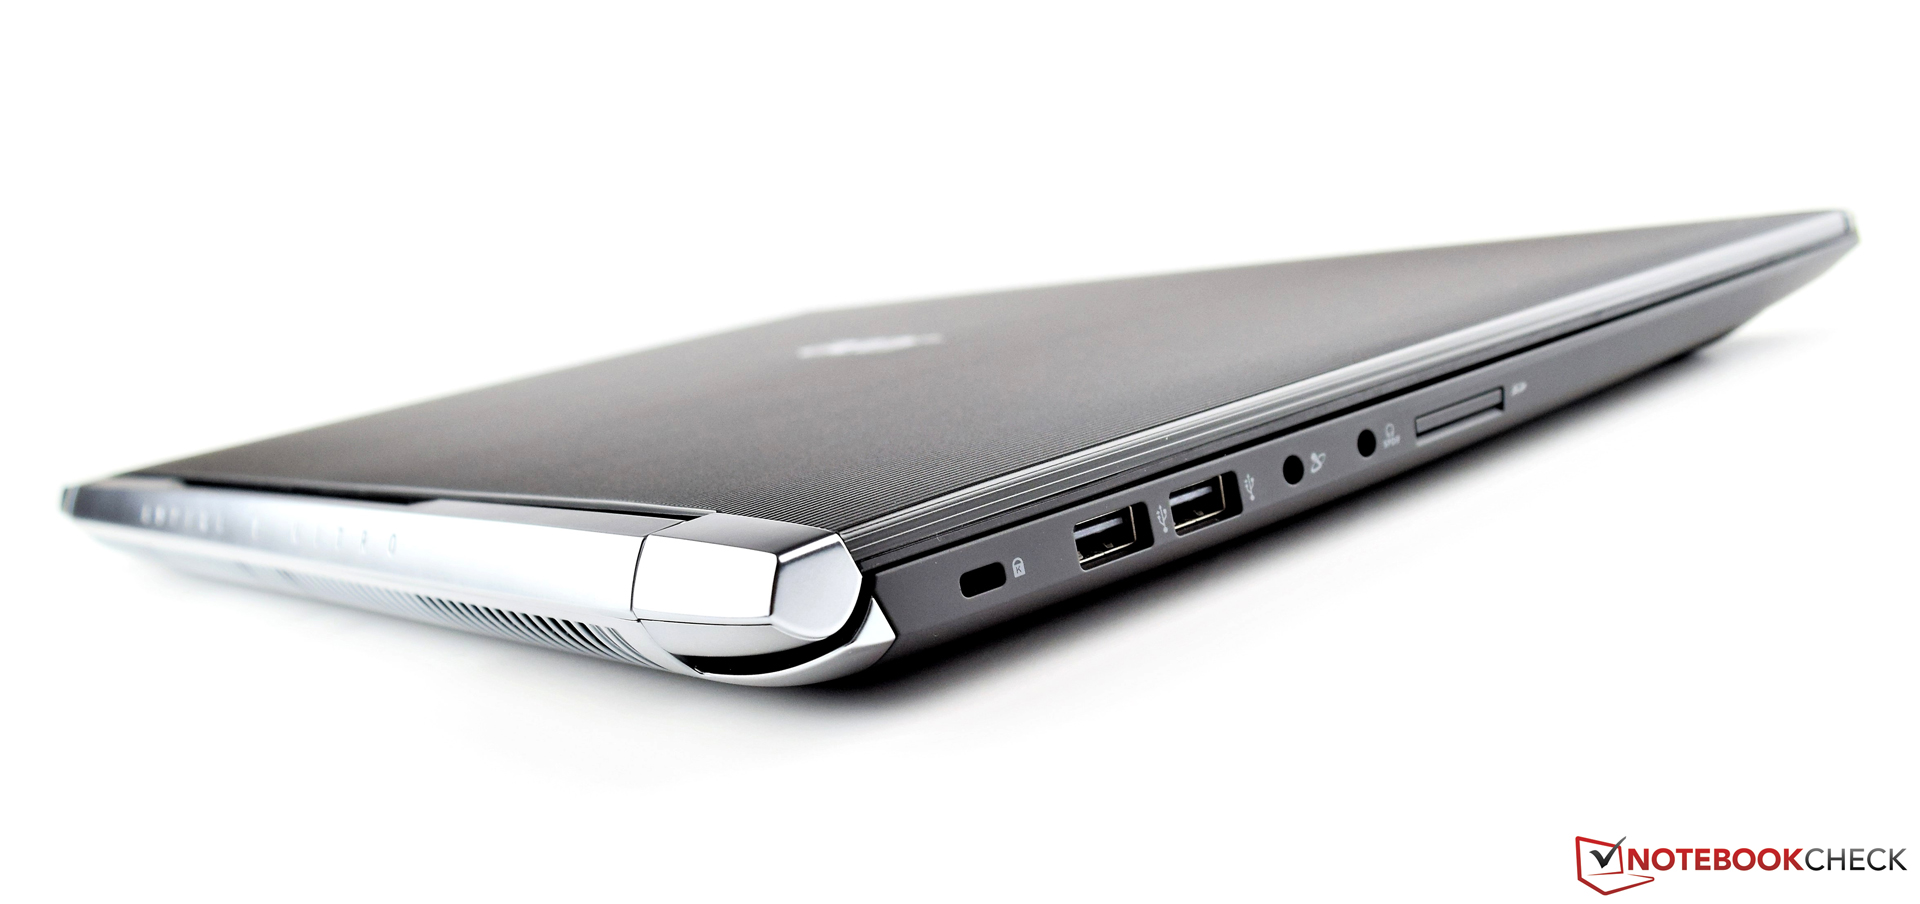
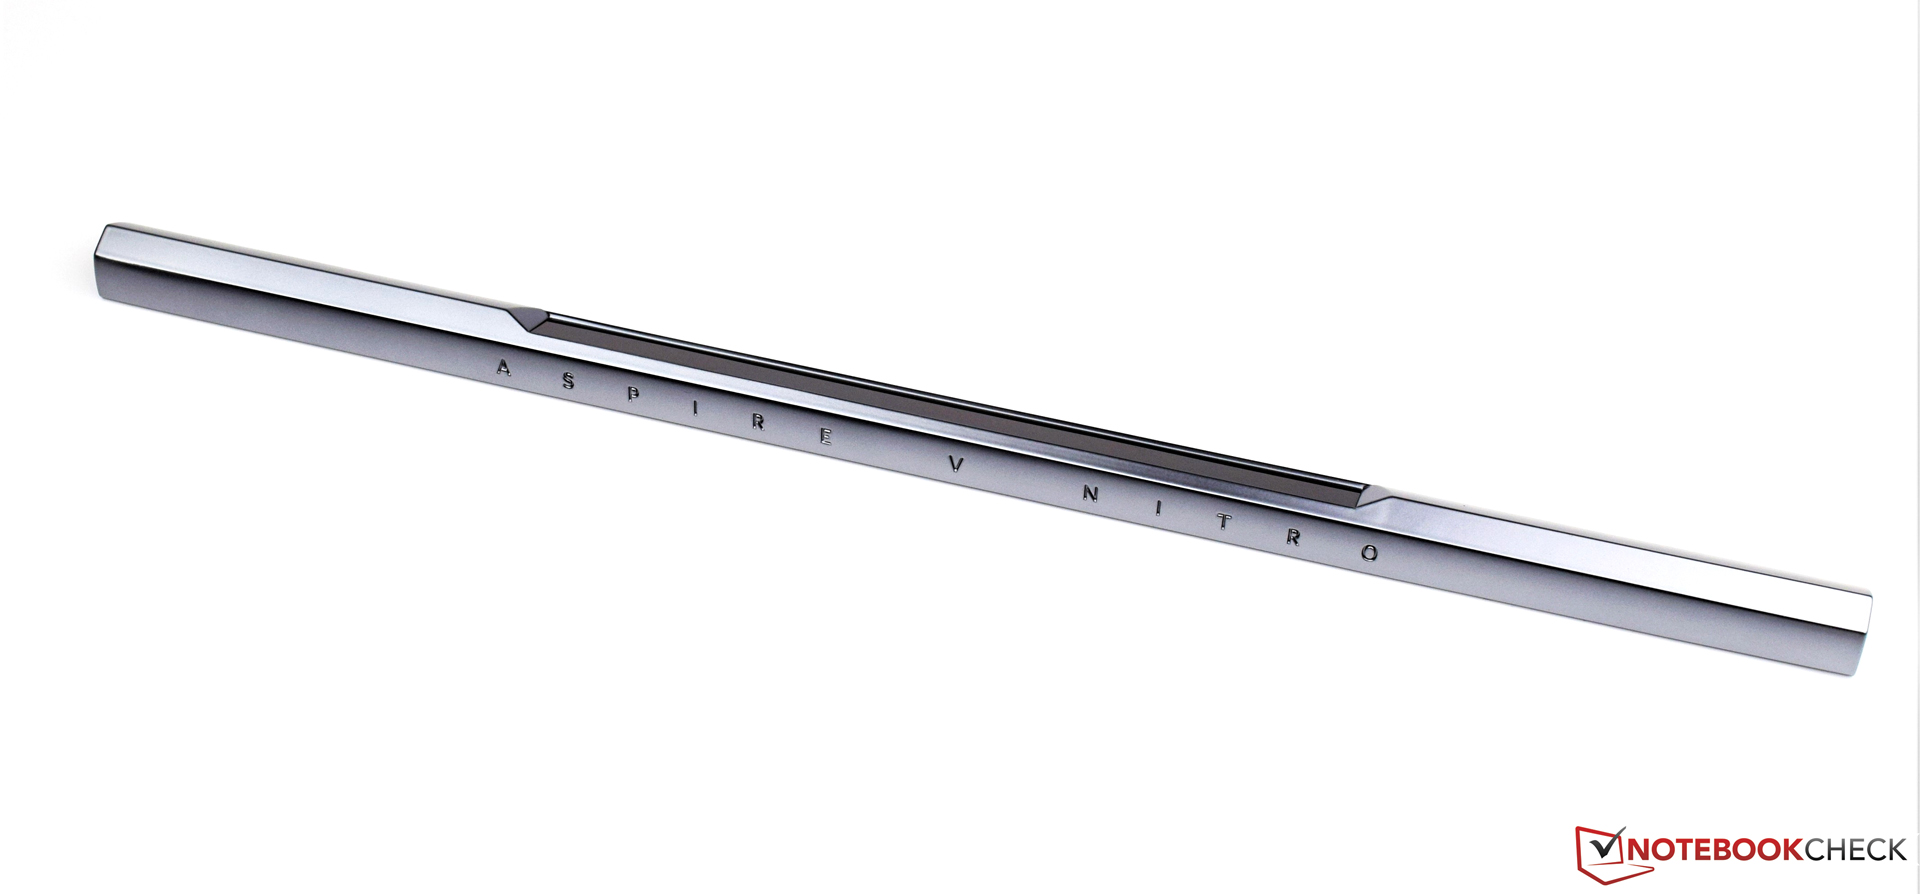
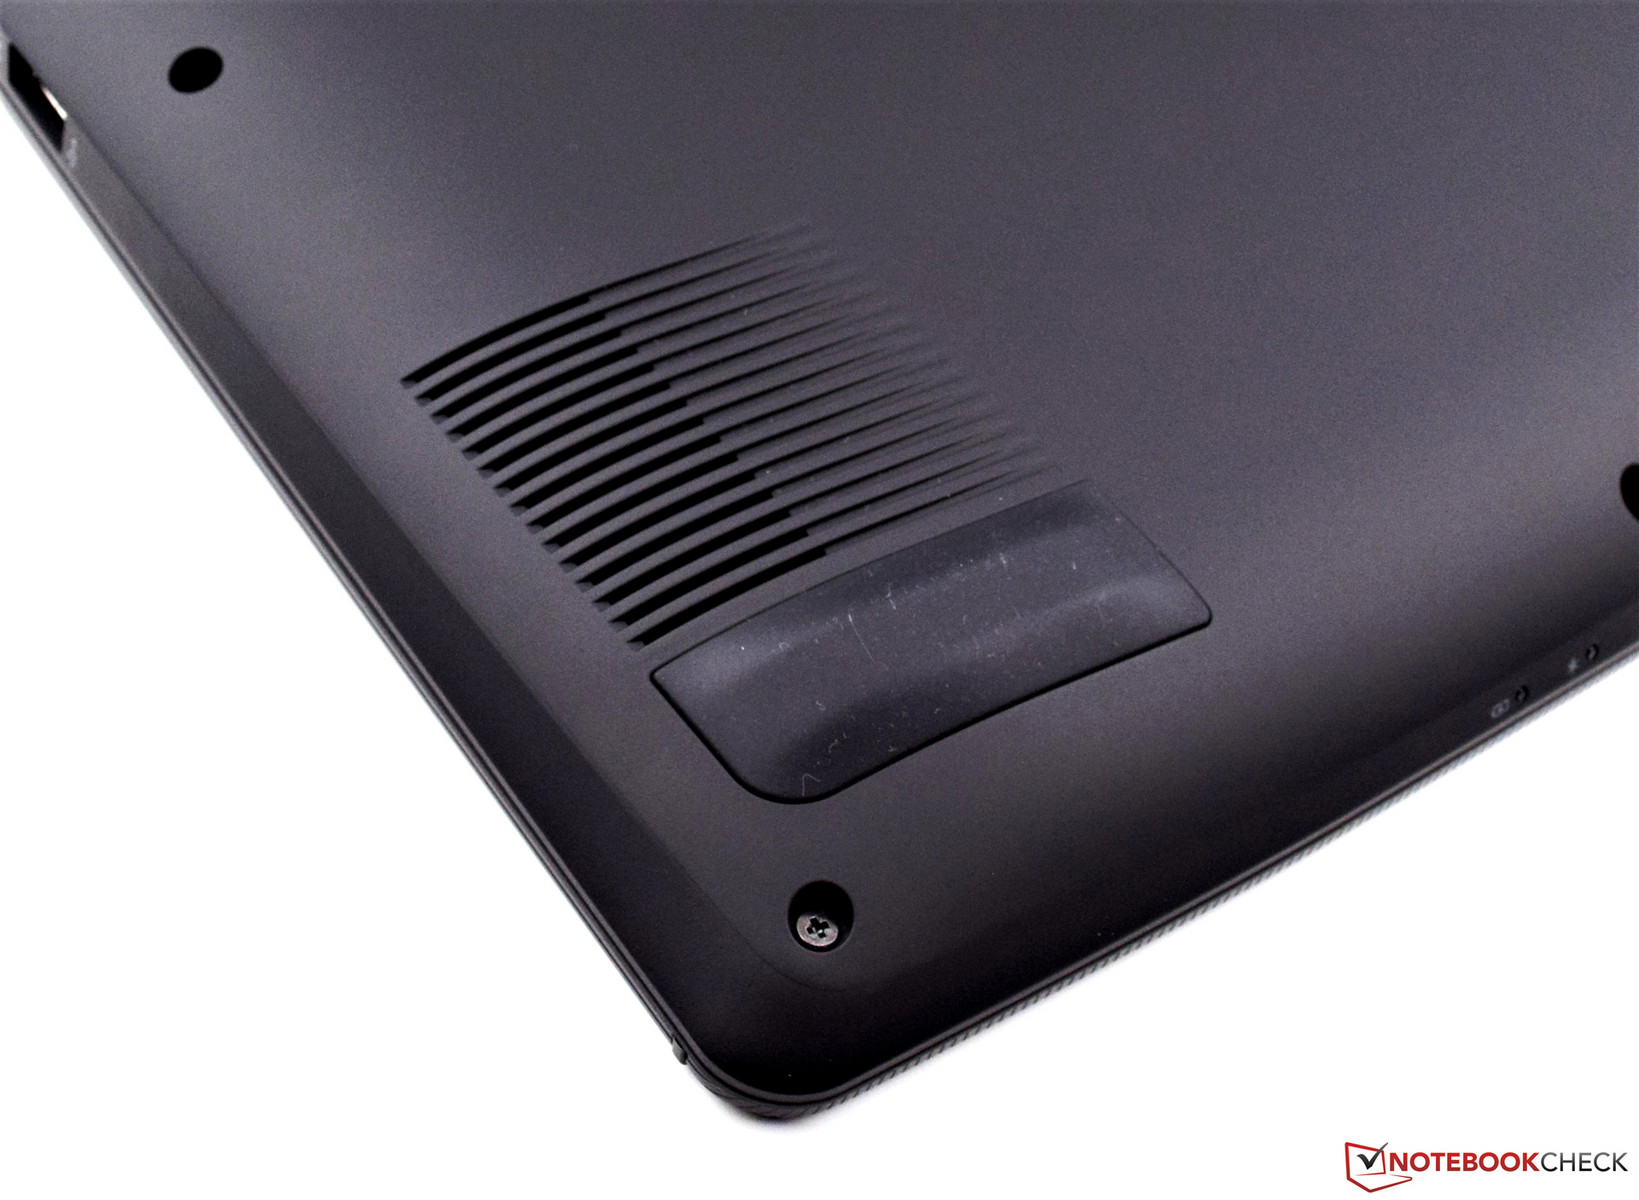
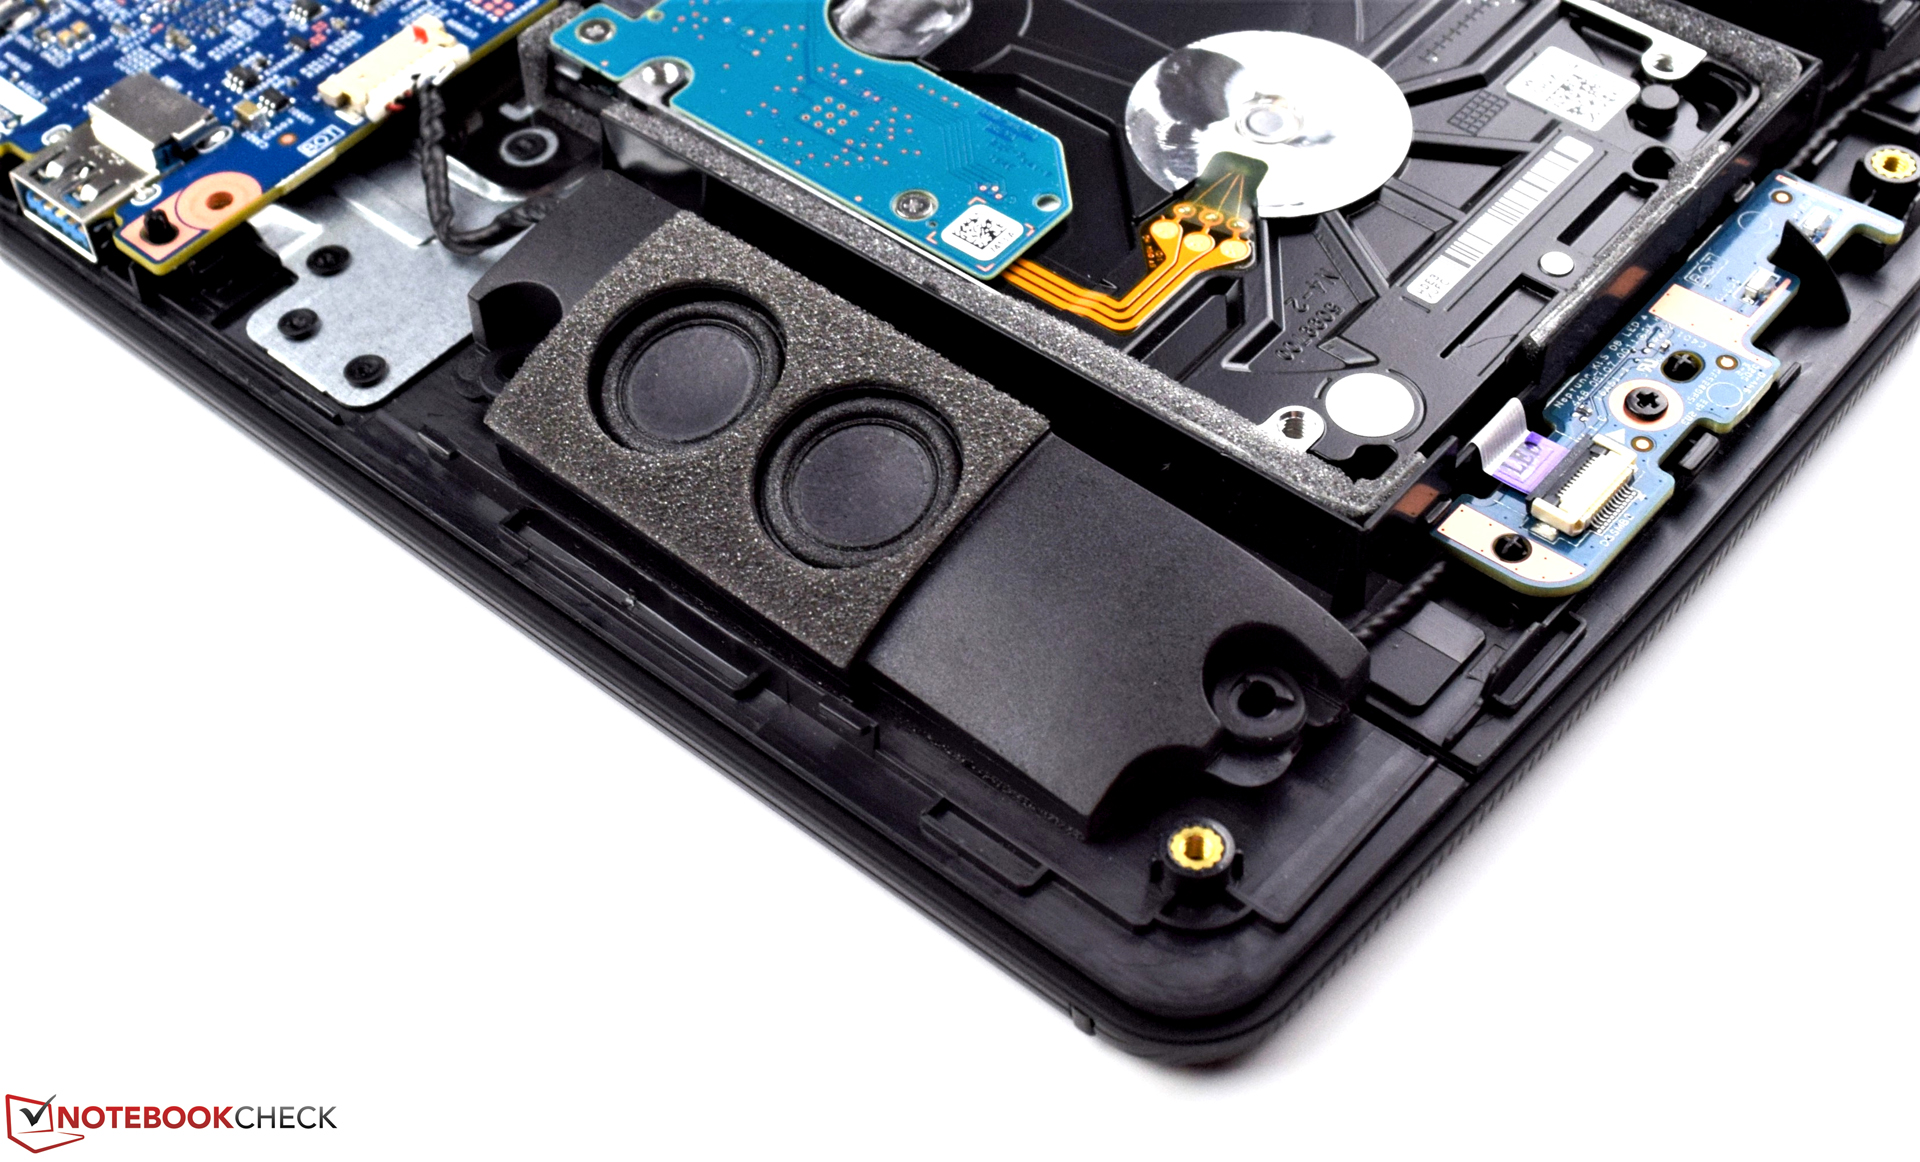
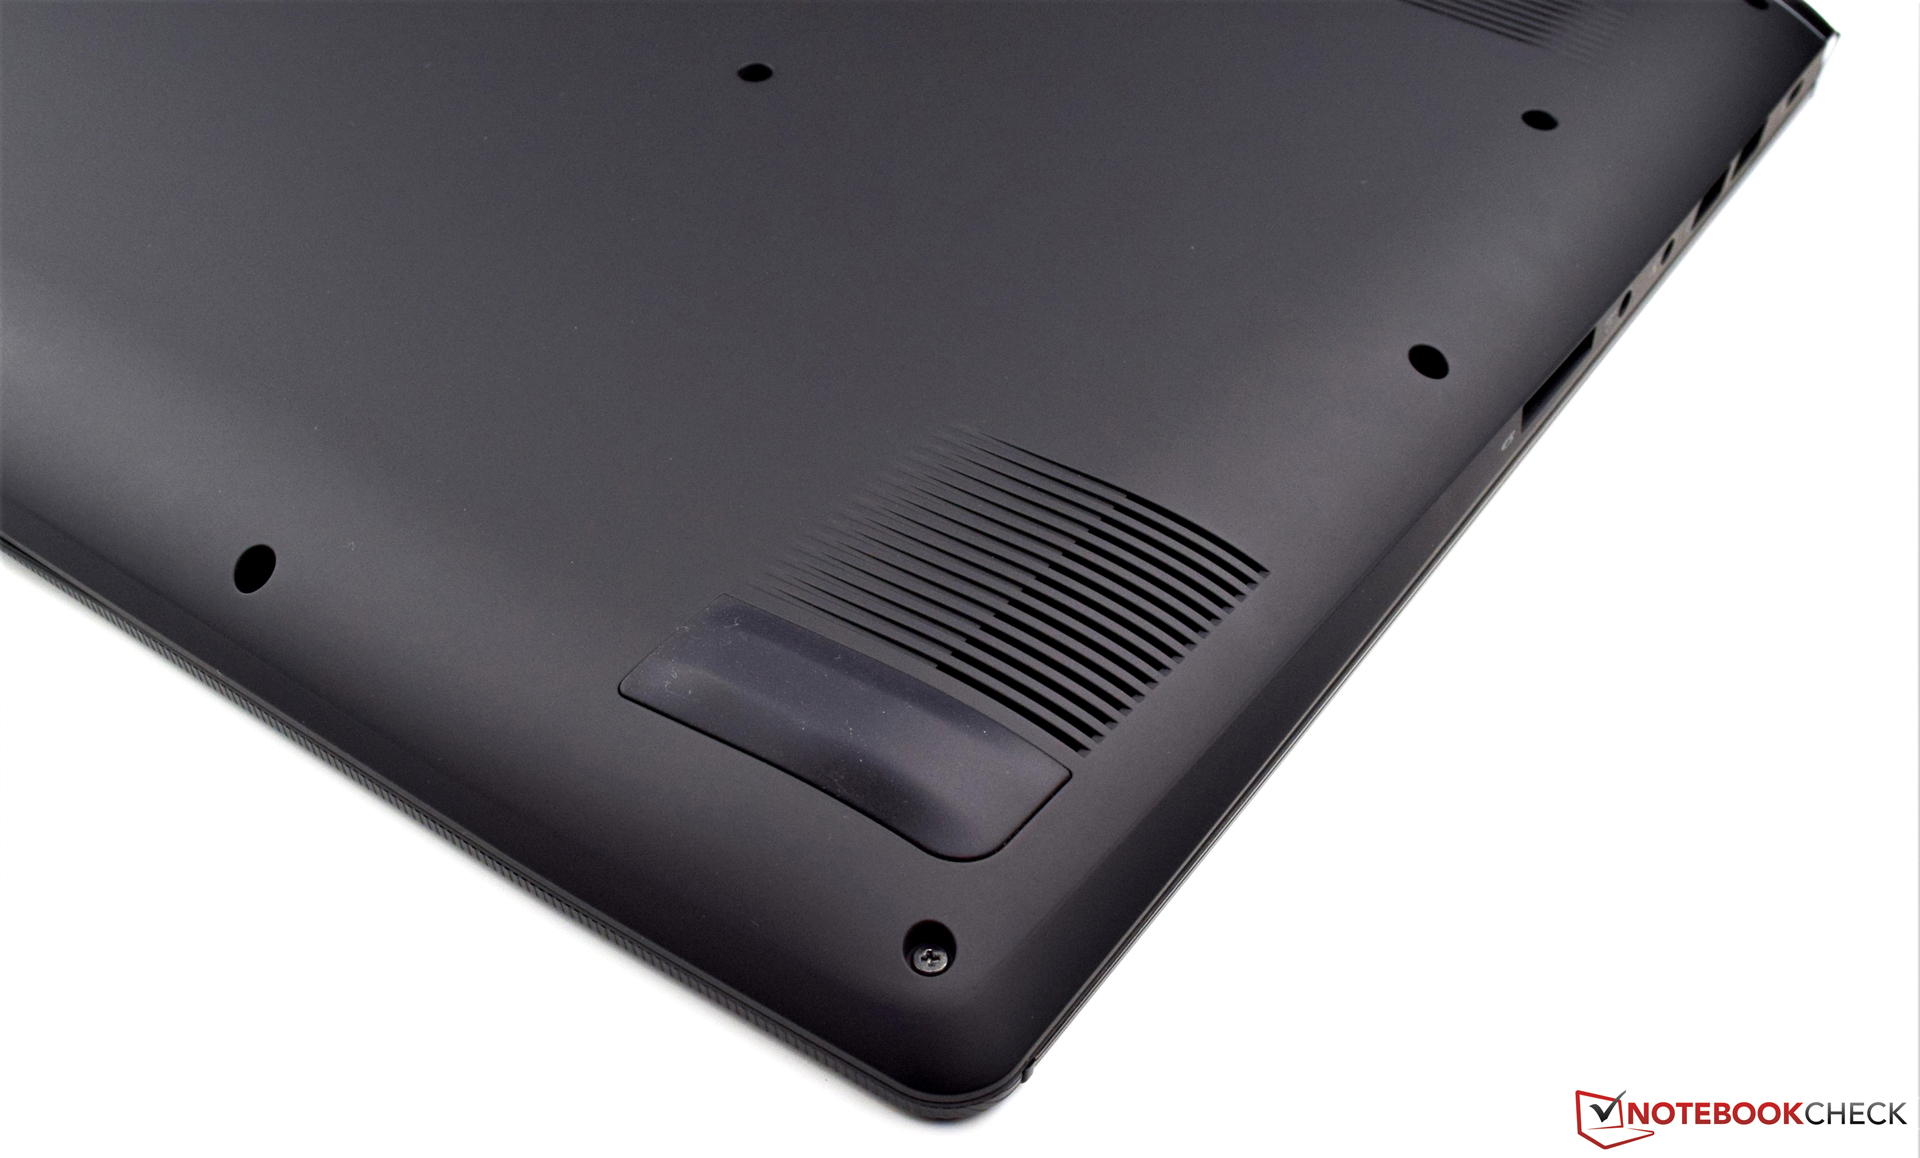
Abbiamo apprezzato il design sobrio contrapposto all'hardware potente. Il case di alta qualità è rigido, e l'assenza di un drive ottico è accettabile considerando lo spazio guadagnato è usato per una batteria più grande. Considerando il tutto, l'Acer Aspire V17 Nitro BE si adatta all'utilizzo cui è progettato ed il suo prezzo di circa $1,800 (in Europa) è giustificato.
Nota: Si tratta di una recensione breve, con alcune sezioni non tradotte, per la versione completa guarda qui.
Acer Aspire V17 Nitro BE VN7-793G-52XN
- 06/30/2017 v6 (old)
Sebastian Bade
Price comparison
