Recensione Breve del Convertibile Dell XPS 13 9365 (7Y54, QHD+)
| Networking | |
| iperf3 transmit AX12 | |
| Dell XPS 13-9365 2-in-1 | |
| HP Spectre x360 13-ac033dx | |
| Dell XPS 13 9365-4537 2-in-1 | |
| iperf3 receive AX12 | |
| HP Spectre x360 13-ac033dx | |
| Dell XPS 13-9365 2-in-1 | |
| Dell XPS 13 9365-4537 2-in-1 | |
| |||||||||||||||||||||||||
Distribuzione della luminosità: 78 %
Al centro con la batteria: 348 cd/m²
Contrasto: 1740:1 (Nero: 0.2 cd/m²)
ΔE ColorChecker Calman: 2.79 | ∀{0.5-29.43 Ø4.72}
ΔE Greyscale Calman: 3.47 | ∀{0.09-98 Ø4.97}
93% sRGB (Argyll 1.6.3 3D)
60% AdobeRGB 1998 (Argyll 1.6.3 3D)
66.1% AdobeRGB 1998 (Argyll 3D)
92.9% sRGB (Argyll 3D)
64.4% Display P3 (Argyll 3D)
Gamma: 2.54
CCT: 6564 K
| Dell XPS 13 9365-4537 2-in-1 IPS, 3200x1800, 13.3" | Dell XPS 13-9365 2-in-1 IPS, 1920x1080, 13.3" | HP Spectre x360 13-ac033dx IPS, 3840x2160, 13.3" | Lenovo Yoga 910-13IKB-80VF004CGE IPS, 3840x2160, 13.9" | |
|---|---|---|---|---|
| Display | -25% | 7% | -3% | |
| Display P3 Coverage (%) | 64.4 | 47.32 -27% | 69.4 8% | 62.2 -3% |
| sRGB Coverage (%) | 92.9 | 71.1 -23% | 96.8 4% | 90.1 -3% |
| AdobeRGB 1998 Coverage (%) | 66.1 | 48.83 -26% | 71.1 8% | 63.5 -4% |
| Response Times | -9% | -1% | 9% | |
| Response Time Grey 50% / Grey 80% * (ms) | 48 ? | 48 ? -0% | 42 ? 12% | 46 ? 4% |
| Response Time Black / White * (ms) | 28 ? | 32.8 ? -17% | 32 ? -14% | 24 ? 14% |
| PWM Frequency (Hz) | 1042 ? | |||
| Screen | -44% | -1% | -51% | |
| Brightness middle (cd/m²) | 348 | 322.6 -7% | 302.6 -13% | 348 0% |
| Brightness (cd/m²) | 306 | 306 0% | 282 -8% | 310 1% |
| Brightness Distribution (%) | 78 | 91 17% | 83 6% | 80 3% |
| Black Level * (cd/m²) | 0.2 | 0.19 5% | 0.25 -25% | 0.25 -25% |
| Contrast (:1) | 1740 | 1698 -2% | 1210 -30% | 1392 -20% |
| Colorchecker dE 2000 * | 2.79 | 7.7 -176% | 2.4 14% | 7.86 -182% |
| Colorchecker dE 2000 max. * | 5.53 | 11.1 -101% | 4.9 11% | 13.43 -143% |
| Greyscale dE 2000 * | 3.47 | 7.9 -128% | 2.8 19% | 8.25 -138% |
| Gamma | 2.54 87% | 2.88 76% | 2.2 100% | 2.05 107% |
| CCT | 6564 99% | 7044 92% | 6333 103% | 6834 95% |
| Color Space (Percent of AdobeRGB 1998) (%) | 60 | 44.1 -26% | 65.5 9% | 58 -3% |
| Color Space (Percent of sRGB) (%) | 93 | 69.9 -25% | 97.1 4% | 90 -3% |
| Media totale (Programma / Settaggio) | -26% /
-36% | 2% /
0% | -15% /
-33% |
* ... Meglio usare valori piccoli
Sfarfallio dello schermo / PWM (Pulse-Width Modulation)
| flickering dello schermo / PWM non rilevato | ||
In confronto: 52 % di tutti i dispositivi testati non utilizza PWM per ridurre la luminosita' del display. Se è rilevato PWM, una media di 7763 (minimo: 5 - massimo: 343500) Hz è stata rilevata. | ||
Tempi di risposta del Display
| ↔ Tempi di risposta dal Nero al Bianco | ||
|---|---|---|
| 28 ms ... aumenta ↗ e diminuisce ↘ combinato | ↗ 16 ms Incremento | 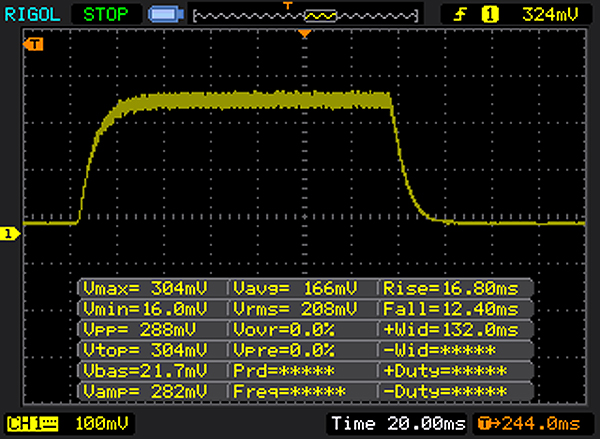 |
| ↘ 12 ms Calo | ||
| Lo schermo mostra tempi di risposta relativamente lenti nei nostri tests e potrebbe essere troppo lento per i gamers. In confronto, tutti i dispositivi di test variano da 0.1 (minimo) a 240 (massimo) ms. » 71 % di tutti i dispositivi è migliore. Questo significa che i tempi di risposta rilevati sono peggiori rispetto alla media di tutti i dispositivi testati (19.8 ms). | ||
| ↔ Tempo di risposta dal 50% Grigio all'80% Grigio | ||
| 48 ms ... aumenta ↗ e diminuisce ↘ combinato | ↗ 26 ms Incremento | 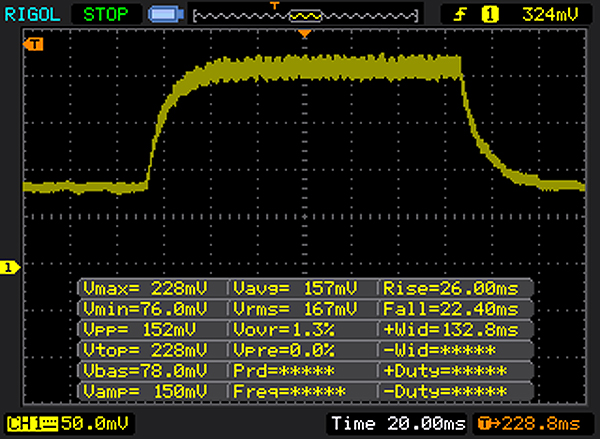 |
| ↘ 22 ms Calo | ||
| Lo schermo mostra tempi di risposta lenti nei nostri tests e sarà insoddisfacente per i gamers. In confronto, tutti i dispositivi di test variano da 0.165 (minimo) a 636 (massimo) ms. » 82 % di tutti i dispositivi è migliore. Questo significa che i tempi di risposta rilevati sono peggiori rispetto alla media di tutti i dispositivi testati (31 ms). | ||
| Cinebench R10 | |
| Rendering Multiple CPUs 32Bit | |
| HP Spectre x360 13-ac033dx | |
| Dell XPS 13-9365 2-in-1 | |
| Dell XPS 13 9365-4537 2-in-1 | |
| Rendering Single 32Bit | |
| HP Spectre x360 13-ac033dx | |
| Dell XPS 13-9365 2-in-1 | |
| Dell XPS 13 9365-4537 2-in-1 | |
| Geekbench 3 | |
| 32 Bit Multi-Core Score | |
| Dell XPS 13 9365-4537 2-in-1 | |
| 32 Bit Single-Core Score | |
| Dell XPS 13 9365-4537 2-in-1 | |
| Geekbench 4.0 | |
| 64 Bit Multi-Core Score | |
| Dell XPS 13 9365-4537 2-in-1 | |
| 64 Bit Single-Core Score | |
| Dell XPS 13 9365-4537 2-in-1 | |
| Geekbench 4.4 | |
| 64 Bit Multi-Core Score | |
| Dell XPS 13 9365-4537 2-in-1 | |
| 64 Bit Single-Core Score | |
| Dell XPS 13 9365-4537 2-in-1 | |
| JetStream 1.1 - 1.1 Total | |
| Lenovo Yoga 910-13IKB-80VF004CGE | |
| HP Spectre x360 13-ac033dx | |
| Dell XPS 13 9365-4537 2-in-1 | |
| Dell XPS 13-9365 2-in-1 | |
| PCMark 8 Home Score Accelerated v2 | 2706 punti | |
Aiuto | ||
| PCMark 8 - Home Score Accelerated v2 | |
| Lenovo Yoga 910-13IKB-80VF004CGE | |
| Dell XPS 13-9365 2-in-1 | |
| HP Spectre x360 13-ac033dx | |
| Dell XPS 13 9365-4537 2-in-1 | |

| Dell XPS 13 9365-4537 2-in-1 Toshiba NVMe THNSN5256GPUK | Dell XPS 13-9365 2-in-1 Toshiba NVMe THNSN5256GPUK | HP Spectre x360 13-ac033dx Samsung PM961 NVMe MZVLW512HMJP | Lenovo Yoga 910-13IKB-80VF004CGE Samsung PM951 NVMe MZVLV512 | |
|---|---|---|---|---|
| CrystalDiskMark 3.0 | 31% | 114% | 58% | |
| Read Seq (MB/s) | 1159 | 1206 4% | 2065 78% | 1412 22% |
| Write Seq (MB/s) | 324.1 | 629 94% | 1550 378% | 578 78% |
| Read 512 (MB/s) | 528 | 966 83% | 865 64% | 701 33% |
| Write 512 (MB/s) | 373.7 | 410.7 10% | 1229 229% | 580 55% |
| Read 4k (MB/s) | 29.26 | 32.93 13% | 54.7 87% | 43.5 49% |
| Write 4k (MB/s) | 108.3 | 121.2 12% | 139.4 29% | 159.7 47% |
| Read 4k QD32 (MB/s) | 335.9 | 411 22% | 518 54% | 570 70% |
| Write 4k QD32 (MB/s) | 234.1 | 250.2 7% | 225.6 -4% | 488.7 109% |
| 3DMark 11 Performance | 1272 punti | |
Aiuto | ||
| 3DMark 11 - 1280x720 Performance GPU | |
| Lenovo Yoga 910-13IKB-80VF004CGE | |
| HP Spectre x360 13-ac033dx | |
| Dell XPS 13-9365 2-in-1 | |
| Dell XPS 13 9365-4537 2-in-1 | |
| basso | medio | alto | ultra | |
|---|---|---|---|---|
| Diablo III (2012) | 55.8 | 36.3 | 30.1 | 17.8 |
| Counter-Strike: GO (2012) | 99.9 | 57.3 | 39.5 | 21.9 |
| BioShock Infinite (2013) | 31.4 | 20.4 | 19.3 | 6.1 |
| GRID: Autosport (2014) | 74.9 | 24.6 | ||
| F1 2014 (2014) | 55 | 34 | ||
| GTA V (2015) | 19.9 | 16.7 | ||
| World of Warships (2015) | 49.9 | 30.2 | ||
| Anno 2205 (2015) | 15.9 | 10.2 | ||
| Rainbow Six Siege (2015) | 24.6 | 16.2 | ||
| Far Cry Primal (2016) | 12 | 5 | ||
| Mirror's Edge Catalyst (2016) | 15.5 | 9 | ||
| Civilization 6 (2016) | 20.6 | 9.2 | ||
| Farming Simulator 17 (2016) | 70.2 | 45.1 | ||
| Titanfall 2 (2016) | 19.9 | 15.9 | ||
| Resident Evil 7 (2017) | 22.2 | 9.5 | ||
| For Honor (2017) | 16.8 | 6.2 | ||
| Ghost Recon Wildlands (2017) | 9.8 | 4 | ||
| Warhammer 40.000: Dawn of War III (2017) | 11.6 | 4 | ||
| Prey (2017) | 14.3 | 6.6 |
(±) La temperatura massima sul lato superiore è di 43.1 °C / 110 F, rispetto alla media di 35.4 °C / 96 F, che varia da 19.6 a 60 °C per questa classe Convertible.
(±) Il lato inferiore si riscalda fino ad un massimo di 41.7 °C / 107 F, rispetto alla media di 36.9 °C / 98 F
(+) In idle, la temperatura media del lato superiore è di 22.7 °C / 73 F, rispetto alla media deld ispositivo di 30.3 °C / 87 F.
(+) I poggiapolsi e il touchpad sono piu' freddi della temperatura della pelle con un massimo di 26.8 °C / 80.2 F e sono quindi freddi al tatto.
(±) La temperatura media della zona del palmo della mano di dispositivi simili e'stata di 28 °C / 82.4 F (+1.2 °C / 2.2 F).
Dell XPS 13 9365-4537 2-in-1 analisi audio
(±) | potenza degli altiparlanti media ma buona (73 dB)
Bassi 100 - 315 Hz
(±) | bassi ridotti - in media 14.8% inferiori alla media
(+) | bassi in lineaa (4.5% delta rispetto alla precedente frequenza)
Medi 400 - 2000 Hz
(±) | medi elevati - circa 5.2% superiore alla media
(+) | medi lineari (5.1% delta rispetto alla precedente frequenza)
Alti 2 - 16 kHz
(+) | Alti bilanciati - appena 3.4% dalla media
(±) | la linearità degli alti è media (7.4% delta rispetto alla precedente frequenza)
Nel complesso 100 - 16.000 Hz
(±) | la linearità complessiva del suono è media (17.4% di differenza rispetto alla media
Rispetto alla stessa classe
» 33% di tutti i dispositivi testati in questa classe è stato migliore, 8% simile, 59% peggiore
» Il migliore ha avuto un delta di 6%, medio di 20%, peggiore di 57%
Rispetto a tutti i dispositivi testati
» 33% di tutti i dispositivi testati in questa classe è stato migliore, 8% similare, 59% peggiore
» Il migliore ha avuto un delta di 4%, medio di 23%, peggiore di 134%
Apple MacBook 12 (Early 2016) 1.1 GHz analisi audio
(+) | gli altoparlanti sono relativamente potenti (83.6 dB)
Bassi 100 - 315 Hz
(±) | bassi ridotti - in media 11.3% inferiori alla media
(±) | la linearità dei bassi è media (14.2% delta rispetto alla precedente frequenza)
Medi 400 - 2000 Hz
(+) | medi bilanciati - solo only 2.4% rispetto alla media
(+) | medi lineari (5.5% delta rispetto alla precedente frequenza)
Alti 2 - 16 kHz
(+) | Alti bilanciati - appena 2% dalla media
(+) | alti lineari (4.5% delta rispetto alla precedente frequenza)
Nel complesso 100 - 16.000 Hz
(+) | suono nel complesso lineare (10.2% differenza dalla media)
Rispetto alla stessa classe
» 7% di tutti i dispositivi testati in questa classe è stato migliore, 2% simile, 91% peggiore
» Il migliore ha avuto un delta di 5%, medio di 18%, peggiore di 53%
Rispetto a tutti i dispositivi testati
» 5% di tutti i dispositivi testati in questa classe è stato migliore, 1% similare, 94% peggiore
» Il migliore ha avuto un delta di 4%, medio di 23%, peggiore di 134%
| Off / Standby | |
| Idle | |
| Sotto carico |
|
Leggenda:
min: | |
| Battery Runtime - WiFi Websurfing | |
| Dell XPS 13-9365 2-in-1 | |
| Lenovo Yoga 910-13IKB-80VF004CGE | |
| HP Spectre x360 13-ac033dx | |
| Dell XPS 13 9365-4537 2-in-1 | |
Pro
Contro
The Dell XPS 13 model that we are testing has a Core i5-7Y54 processor on board. This is in no way inferior to the nominally stronger Core-i7 processor that is built into the sibling model that we have already tested. Since both CPUs hardly reach their maximum speeds due to the passive cooling, their results in the CPU tests are to a large extent at the same level. Only a slight advantage that can hardly be noticed during everyday operation can be attested to the Core i7. The extra charge for the Core-i7 processor is not really worth it.
Since there is no fan, the computer always runs quietly. Yet it does not heat up too much. An NVMe SSD assures a fast-running system. Exchanging the SSD might be possible. To do that, you would need to remove the bottom of the computer casing. The keyboard of the convertible left a good overall impression.
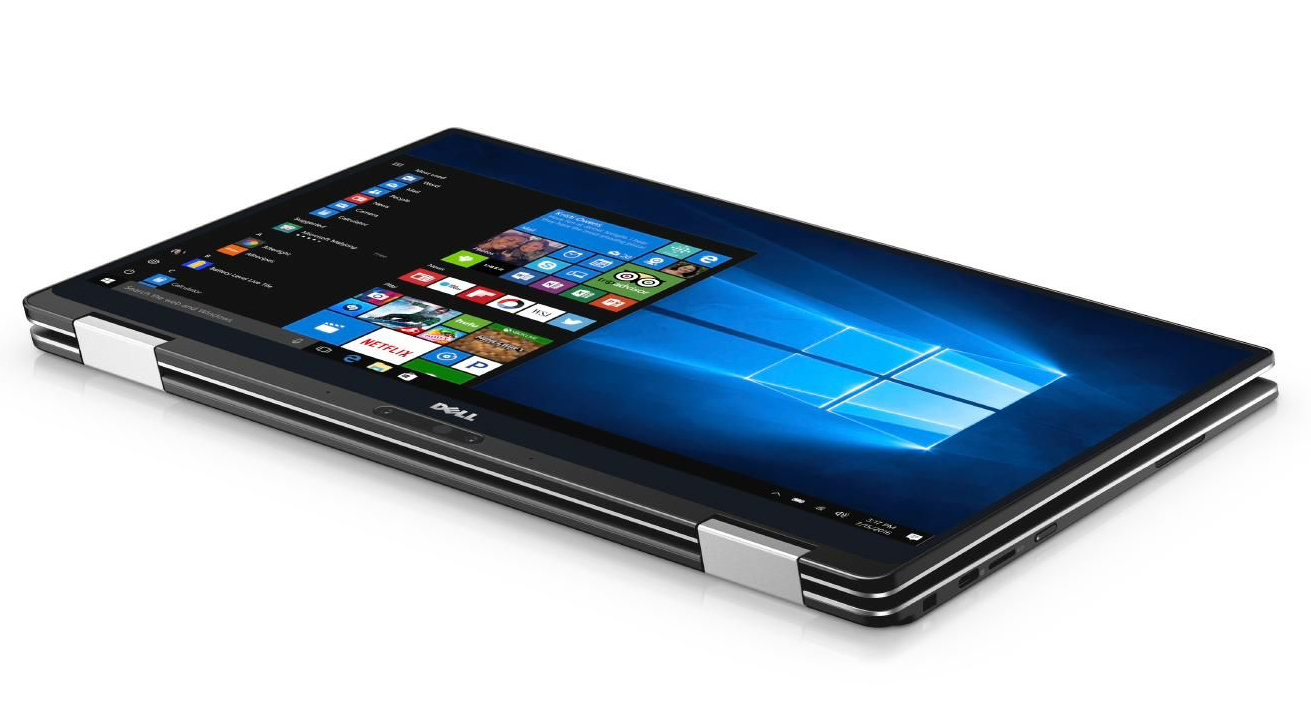
The IPS display pleases with stable viewing angles and a very good contrast. The brightness value is also favorable, although it could be even higher, since the device will be used in various places under various lighting conditions.
The razor-sharp QHD+ display has a negative effect on the battery life.
In our practically relevant WLAN test, the runtime decreases by a good 5 hours compared to the Full HD model of the XPS 13. Users who need a battery life that is as long as possible should therefore choose the Full HD model.
Nota: si tratta di una recensione breve, con alcune sezioni non tradotte, per la versione integrale in inglese guardate qui.
Dell XPS 13 9365-4537 2-in-1
- 05/26/2017 v6 (old)
Sascha Mölck