Recensione Breve del Convertibile HP Spectre x360 13 (7500U, 4K UHD)
| Networking | |
| iperf3 transmit AX12 | |
| Dell XPS 15 9560 (i7-7700HQ, UHD) | |
| Dell XPS 13-9365 2-in-1 | |
| HP Spectre x360 13-ac033dx | |
| iperf3 receive AX12 | |
| Dell XPS 15 9560 (i7-7700HQ, UHD) | |
| HP Spectre x360 13-ac033dx | |
| Dell XPS 13-9365 2-in-1 | |
| |||||||||||||||||||||||||
Distribuzione della luminosità: 83 %
Al centro con la batteria: 302.6 cd/m²
Contrasto: 1210:1 (Nero: 0.25 cd/m²)
ΔE ColorChecker Calman: 2.4 | ∀{0.5-29.43 Ø4.71}
ΔE Greyscale Calman: 2.8 | ∀{0.09-98 Ø4.96}
97.1% sRGB (Argyll 1.6.3 3D)
65.5% AdobeRGB 1998 (Argyll 1.6.3 3D)
71.1% AdobeRGB 1998 (Argyll 3D)
96.8% sRGB (Argyll 3D)
69.4% Display P3 (Argyll 3D)
Gamma: 2.2
CCT: 6333 K
| HP Spectre x360 13-ac033dx LG Philips LGD054D, IPS, 13.3", 3840x2160 | Apple MacBook Pro 13 2016 (2.9 GHz) APPA033, , 13.3", 2560x1600 | Dell XPS 13-9365 2-in-1 IPS, 13.3", 1920x1080 | Lenovo Yoga 910-13IKB-80VF004CGE AU Optronics AUO323D / B139HAN03.2, IPS, 13.9", 3840x2160 | HP Spectre 13-v131ng CMN1374, IPS UWVA, 13.3", 1920x1080 | HP Spectre x360 13-w023dx Chi Mei CMN1367, IPS, 13.3", 1920x1080 | |
|---|---|---|---|---|---|---|
| Display | 23% | -30% | -9% | -8% | -7% | |
| Display P3 Coverage (%) | 69.4 | 99.2 43% | 47.32 -32% | 62.2 -10% | 64.6 -7% | 65.4 -6% |
| sRGB Coverage (%) | 96.8 | 99.9 3% | 71.1 -27% | 90.1 -7% | 88.8 -8% | 90.4 -7% |
| AdobeRGB 1998 Coverage (%) | 71.1 | 87.6 23% | 48.83 -31% | 63.5 -11% | 64.8 -9% | 65.8 -7% |
| Response Times | -39% | -8% | 8% | -7% | 17% | |
| Response Time Grey 50% / Grey 80% * (ms) | 42 ? | 47.2 ? -12% | 48 ? -14% | 46 ? -10% | 46 ? -10% | 33.2 ? 21% |
| Response Time Black / White * (ms) | 32 ? | 53 ? -66% | 32.8 ? -2% | 24 ? 25% | 33 ? -3% | 28 ? 12% |
| PWM Frequency (Hz) | 1042 ? | |||||
| Screen | 19% | -50% | -58% | -33% | -52% | |
| Brightness middle (cd/m²) | 302.6 | 569 88% | 322.6 7% | 348 15% | 404 34% | 334.6 11% |
| Brightness (cd/m²) | 282 | 542 92% | 306 9% | 310 10% | 382 35% | 319 13% |
| Brightness Distribution (%) | 83 | 90 8% | 91 10% | 80 -4% | 91 10% | 90 8% |
| Black Level * (cd/m²) | 0.25 | 0.56 -124% | 0.19 24% | 0.25 -0% | 0.35 -40% | 0.336 -34% |
| Contrast (:1) | 1210 | 1016 -16% | 1698 40% | 1392 15% | 1154 -5% | 996 -18% |
| Colorchecker dE 2000 * | 2.4 | 1.4 42% | 7.7 -221% | 7.86 -228% | 5.37 -124% | 6.21 -159% |
| Colorchecker dE 2000 max. * | 4.9 | 2.9 41% | 11.1 -127% | 13.43 -174% | 9.46 -93% | 12 -145% |
| Greyscale dE 2000 * | 2.8 | 1.8 36% | 7.9 -182% | 8.25 -195% | 6.44 -130% | 7.71 -175% |
| Gamma | 2.2 100% | 2.16 102% | 2.88 76% | 2.05 107% | 2.52 87% | 2.36 93% |
| CCT | 6333 103% | 6877 95% | 7044 92% | 6834 95% | 6738 96% | 6458 101% |
| Color Space (Percent of AdobeRGB 1998) (%) | 65.5 | 78.4 20% | 44.1 -33% | 58 -11% | 58 -11% | 58.6 -11% |
| Color Space (Percent of sRGB) (%) | 97.1 | 99.3 2% | 69.9 -28% | 90 -7% | 89 -8% | 90 -7% |
| Media totale (Programma / Settaggio) | 1% /
12% | -29% /
-40% | -20% /
-39% | -16% /
-25% | -14% /
-34% |
* ... Meglio usare valori piccoli
Tempi di risposta del Display
| ↔ Tempi di risposta dal Nero al Bianco | ||
|---|---|---|
| 32 ms ... aumenta ↗ e diminuisce ↘ combinato | ↗ 18 ms Incremento | 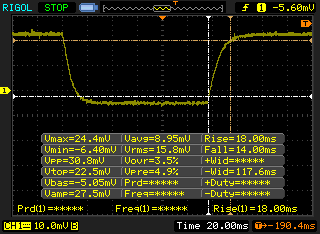 |
| ↘ 14 ms Calo | ||
| Lo schermo mostra tempi di risposta lenti nei nostri tests e sarà insoddisfacente per i gamers. In confronto, tutti i dispositivi di test variano da 0.1 (minimo) a 240 (massimo) ms. » 86 % di tutti i dispositivi è migliore. Questo significa che i tempi di risposta rilevati sono peggiori rispetto alla media di tutti i dispositivi testati (19.8 ms). | ||
| ↔ Tempo di risposta dal 50% Grigio all'80% Grigio | ||
| 42 ms ... aumenta ↗ e diminuisce ↘ combinato | ↗ 20.8 ms Incremento | 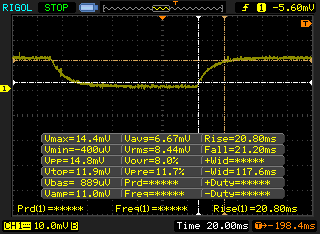 |
| ↘ 21.2 ms Calo | ||
| Lo schermo mostra tempi di risposta lenti nei nostri tests e sarà insoddisfacente per i gamers. In confronto, tutti i dispositivi di test variano da 0.165 (minimo) a 636 (massimo) ms. » 67 % di tutti i dispositivi è migliore. Questo significa che i tempi di risposta rilevati sono peggiori rispetto alla media di tutti i dispositivi testati (30.9 ms). | ||
Sfarfallio dello schermo / PWM (Pulse-Width Modulation)
| flickering dello schermo / PWM non rilevato | 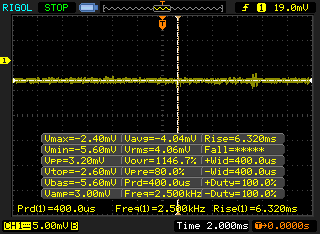 | ||
In confronto: 52 % di tutti i dispositivi testati non utilizza PWM per ridurre la luminosita' del display. Se è rilevato PWM, una media di 7744 (minimo: 5 - massimo: 343500) Hz è stata rilevata. | |||
| wPrime 2.10 - 1024m | |
| Dell XPS 13-9365 2-in-1 | |
| Dell XPS 13 9360-4764 | |
| Dell Latitude 7280 | |
| HP Spectre x360 13-ac033dx | |
* ... Meglio usare valori piccoli
| PCMark 8 | |
| Home Score Accelerated v2 | |
| HP Spectre 13-v131ng | |
| Apple MacBook Air 13 inch 2015-03 | |
| Lenovo Yoga 910-13IKB-80VF004CGE | |
| Dell XPS 13-9365 2-in-1 | |
| HP Spectre x360 13-ac033dx | |
| Work Score Accelerated v2 | |
| HP Spectre 13-v131ng | |
| Dell XPS 13-9365 2-in-1 | |
| Apple MacBook Air 13 inch 2015-03 | |
| HP Spectre x360 13-ac033dx | |
| Creative Score Accelerated v2 | |
| HP Spectre 13-v131ng | |
| Apple MacBook Air 13 inch 2015-03 | |
| HP Spectre x360 13-ac033dx | |
| Dell XPS 13-9365 2-in-1 | |
| PCMark 8 Home Score Accelerated v2 | 3023 punti | |
| PCMark 8 Creative Score Accelerated v2 | 4432 punti | |
| PCMark 8 Work Score Accelerated v2 | 3706 punti | |
Aiuto | ||
| HP Spectre x360 13-ac033dx Samsung PM961 NVMe MZVLW512HMJP | Apple MacBook Air 13 inch 2015-03 Apple SSD SD0256F | Dell XPS 13-9365 2-in-1 Toshiba NVMe THNSN5256GPUK | Lenovo Yoga 910-13IKB-80VF004CGE Samsung PM951 NVMe MZVLV512 | HP Spectre 13-v131ng Samsung PM961 NVMe MZVLW512HMJP | |
|---|---|---|---|---|---|
| CrystalDiskMark 3.0 | -25% | -27% | -6% | -4% | |
| Read Seq (MB/s) | 2065 | 1352 -35% | 1206 -42% | 1412 -32% | 1090 -47% |
| Write Seq (MB/s) | 1550 | 1111 -28% | 629 -59% | 578 -63% | 1088 -30% |
| Read 512 (MB/s) | 865 | 880 2% | 966 12% | 701 -19% | 753 -13% |
| Write 512 (MB/s) | 1229 | 1023 -17% | 410.7 -67% | 580 -53% | 911 -26% |
| Read 4k (MB/s) | 54.7 | 21.93 -60% | 32.93 -40% | 43.5 -20% | 57.5 5% |
| Write 4k (MB/s) | 139.4 | 30.94 -78% | 121.2 -13% | 159.7 15% | 140.2 1% |
| Read 4k QD32 (MB/s) | 518 | 339.5 -34% | 411 -21% | 570 10% | 497.1 -4% |
| Write 4k QD32 (MB/s) | 225.6 | 342.9 52% | 250.2 11% | 488.7 117% | 416 84% |

| 3DMark 11 Performance | 1735 punti | |
| 3DMark Ice Storm Standard Score | 51912 punti | |
| 3DMark Cloud Gate Standard Score | 6054 punti | |
| 3DMark Fire Strike Score | 940 punti | |
| 3DMark Fire Strike Extreme Score | 434 punti | |
Aiuto | ||
Rumorosità
| Idle |
| 28.7 / 34.2 / 35.8 dB(A) |
| Sotto carico |
| 35.8 / 39.6 dB(A) |
 | ||
30 dB silenzioso 40 dB(A) udibile 50 dB(A) rumoroso |
||
min: | ||
| HP Spectre x360 13-ac033dx HD Graphics 620, i7-7500U, Samsung PM961 NVMe MZVLW512HMJP | Apple MacBook Pro 13 2016 (2.9 GHz) Iris Graphics 550, 6267U, Apple SSD AP0256 | Dell XPS 13-9365 2-in-1 HD Graphics 615, i7-7Y75, Toshiba NVMe THNSN5256GPUK | Lenovo Yoga 910-13IKB-80VF004CGE HD Graphics 620, i7-7500U, Samsung PM951 NVMe MZVLV512 | HP Spectre 13-v131ng HD Graphics 620, i7-7500U, Samsung PM961 NVMe MZVLW512HMJP | |
|---|---|---|---|---|---|
| Noise | 6% | 1% | 0% | ||
| off /ambiente * (dB) | 28.7 | 30.2 -5% | 31.7 -10% | 30.4 -6% | |
| Idle Minimum * (dB) | 28.7 | 30.2 -5% | 31.7 -10% | 30.4 -6% | |
| Idle Average * (dB) | 34.2 | 30.2 12% | 31.7 7% | 30.4 11% | |
| Idle Maximum * (dB) | 35.8 | 30.2 16% | 31.7 11% | 30.4 15% | |
| Load Average * (dB) | 35.8 | 33 8% | 38.4 -7% | 40 -12% | |
| Load Maximum * (dB) | 39.6 | 36.2 9% | 34.7 12% | 40 -1% |
* ... Meglio usare valori piccoli
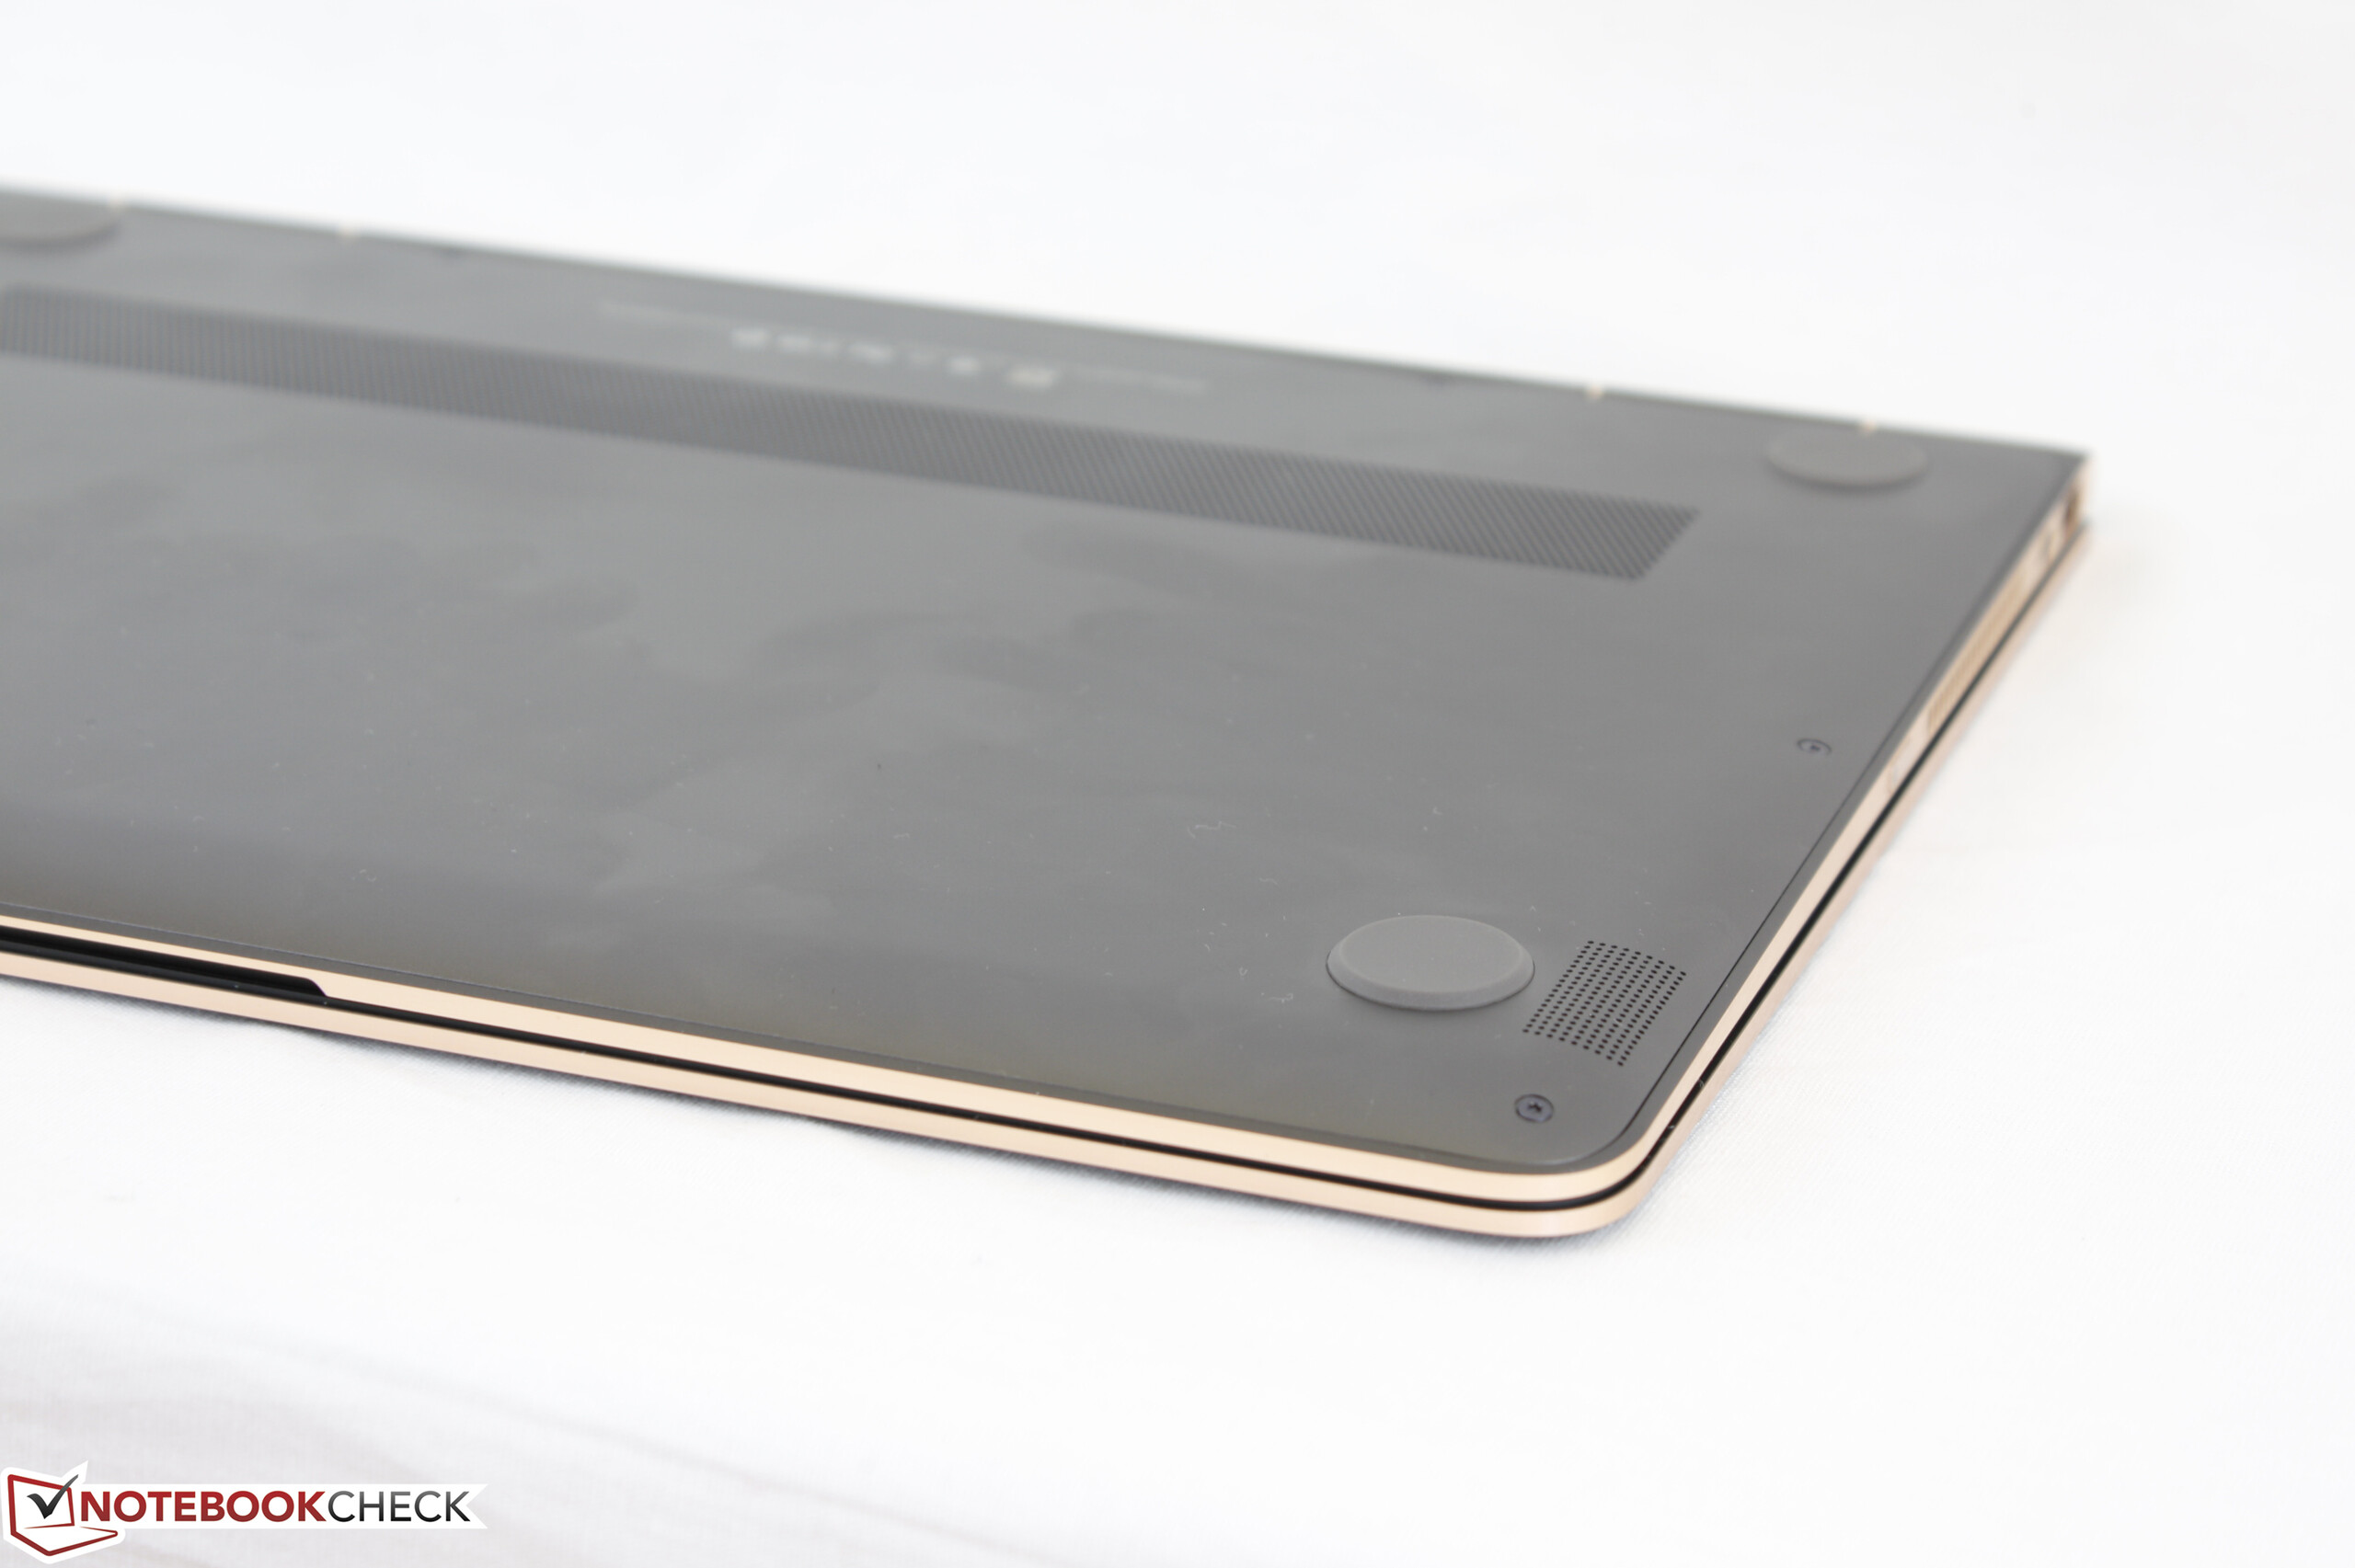
(-) La temperatura massima sul lato superiore è di 48 °C / 118 F, rispetto alla media di 35.4 °C / 96 F, che varia da 19.6 a 60 °C per questa classe Convertible.
(-) Il lato inferiore si riscalda fino ad un massimo di 45.4 °C / 114 F, rispetto alla media di 36.9 °C / 98 F
(+) In idle, la temperatura media del lato superiore è di 23.7 °C / 75 F, rispetto alla media deld ispositivo di 30.3 °C / 87 F.
(+) I poggiapolsi e il touchpad sono piu' freddi della temperatura della pelle con un massimo di 31.6 °C / 88.9 F e sono quindi freddi al tatto.
(-) La temperatura media della zona del palmo della mano di dispositivi simili e'stata di 28 °C / 82.4 F (-3.6 °C / -6.5 F).
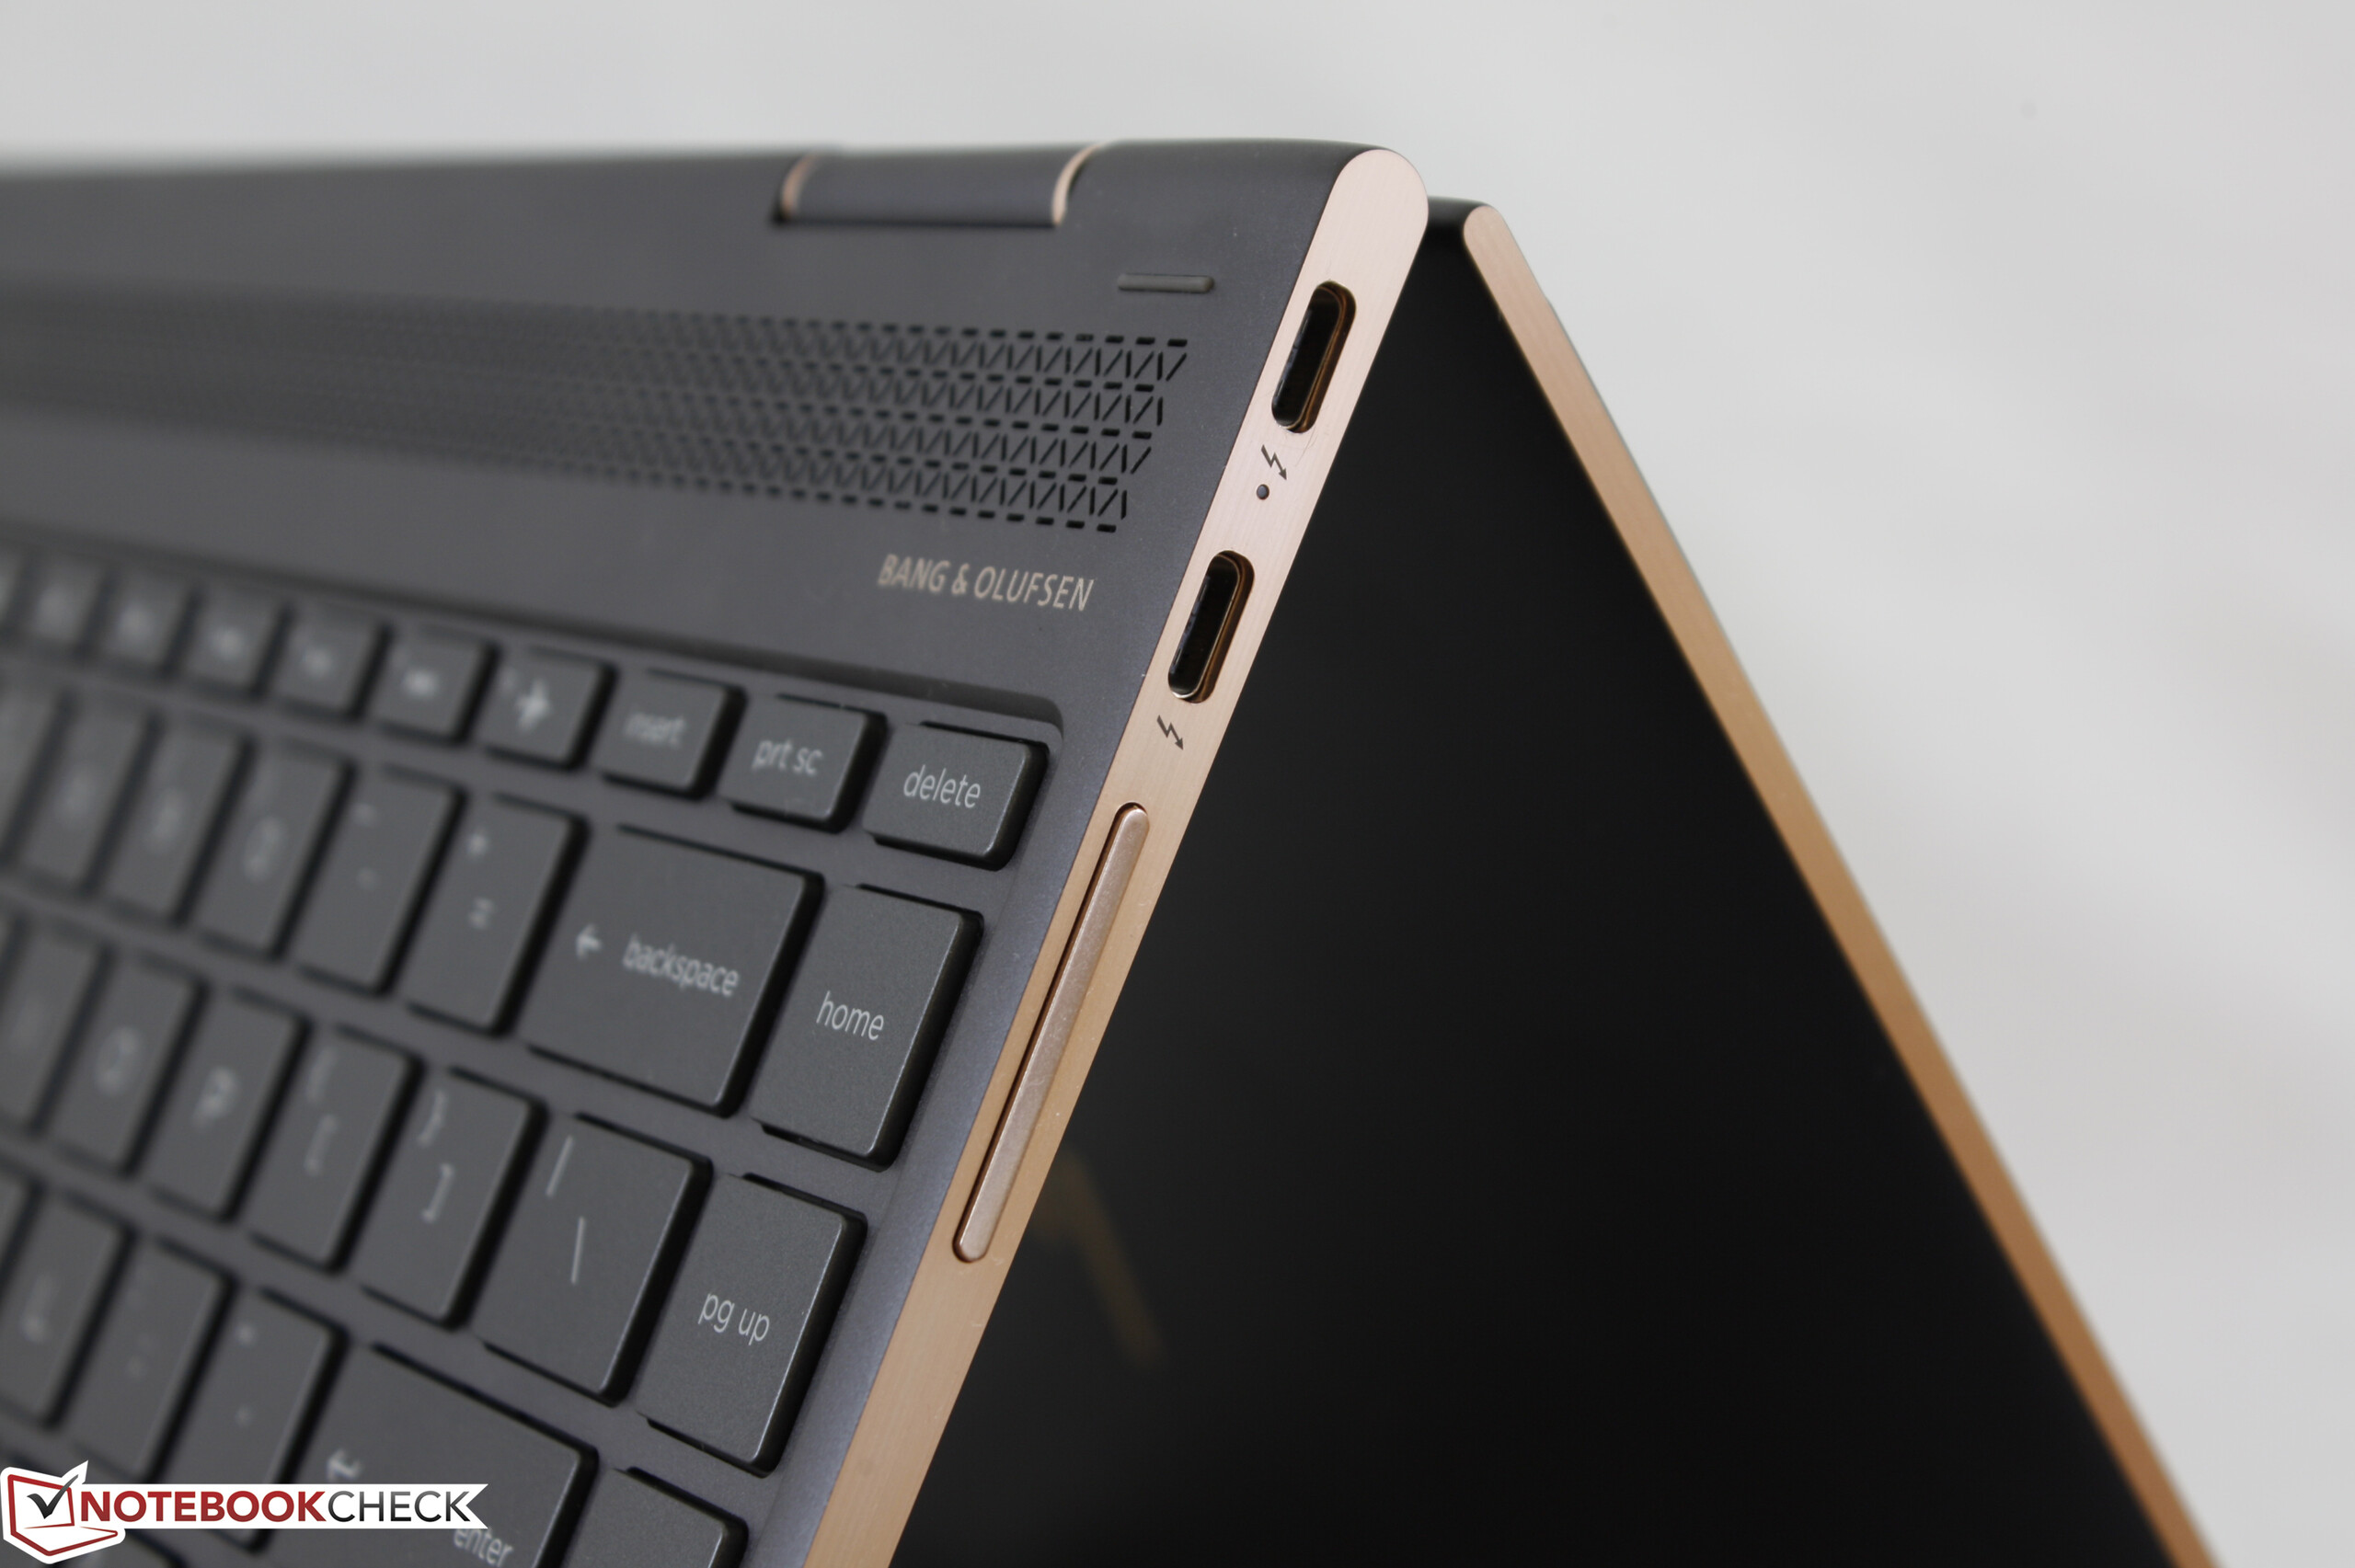
HP Spectre x360 13-ac033dx analisi audio
(-) | altoparlanti non molto potenti (67.1 dB)
Bassi 100 - 315 Hz
(-) | quasi nessun basso - in media 16.9% inferiori alla media
(-) | bassi non lineari (15.8% delta rispetto alla precedente frequenza)
Medi 400 - 2000 Hz
(+) | medi bilanciati - solo only 3% rispetto alla media
(+) | medi lineari (6.9% delta rispetto alla precedente frequenza)
Alti 2 - 16 kHz
(+) | Alti bilanciati - appena 3% dalla media
(±) | la linearità degli alti è media (9.5% delta rispetto alla precedente frequenza)
Nel complesso 100 - 16.000 Hz
(±) | la linearità complessiva del suono è media (23.4% di differenza rispetto alla media
Rispetto alla stessa classe
» 71% di tutti i dispositivi testati in questa classe è stato migliore, 5% simile, 25% peggiore
» Il migliore ha avuto un delta di 6%, medio di 20%, peggiore di 57%
Rispetto a tutti i dispositivi testati
» 70% di tutti i dispositivi testati in questa classe è stato migliore, 6% similare, 24% peggiore
» Il migliore ha avuto un delta di 4%, medio di 23%, peggiore di 134%
Apple MacBook 12 (Early 2016) 1.1 GHz analisi audio
(+) | gli altoparlanti sono relativamente potenti (83.6 dB)
Bassi 100 - 315 Hz
(±) | bassi ridotti - in media 11.3% inferiori alla media
(±) | la linearità dei bassi è media (14.2% delta rispetto alla precedente frequenza)
Medi 400 - 2000 Hz
(+) | medi bilanciati - solo only 2.4% rispetto alla media
(+) | medi lineari (5.5% delta rispetto alla precedente frequenza)
Alti 2 - 16 kHz
(+) | Alti bilanciati - appena 2% dalla media
(+) | alti lineari (4.5% delta rispetto alla precedente frequenza)
Nel complesso 100 - 16.000 Hz
(+) | suono nel complesso lineare (10.2% differenza dalla media)
Rispetto alla stessa classe
» 7% di tutti i dispositivi testati in questa classe è stato migliore, 2% simile, 90% peggiore
» Il migliore ha avuto un delta di 5%, medio di 18%, peggiore di 53%
Rispetto a tutti i dispositivi testati
» 5% di tutti i dispositivi testati in questa classe è stato migliore, 1% similare, 94% peggiore
» Il migliore ha avuto un delta di 4%, medio di 23%, peggiore di 134%
| Off / Standby | |
| Idle | |
| Sotto carico |
|
Leggenda:
min: | |
| HP Spectre x360 13-ac033dx i7-7500U, HD Graphics 620, Samsung PM961 NVMe MZVLW512HMJP, IPS, 3840x2160, 13.3" | Apple MacBook Pro 13 2016 (2.9 GHz) 6267U, Iris Graphics 550, Apple SSD AP0256, , 2560x1600, 13.3" | Dell XPS 13-9365 2-in-1 i7-7Y75, HD Graphics 615, Toshiba NVMe THNSN5256GPUK, IPS, 1920x1080, 13.3" | Lenovo Yoga 910-13IKB-80VF004CGE i7-7500U, HD Graphics 620, Samsung PM951 NVMe MZVLV512, IPS, 3840x2160, 13.9" | HP Spectre 13-v131ng i7-7500U, HD Graphics 620, Samsung PM961 NVMe MZVLW512HMJP, IPS UWVA, 1920x1080, 13.3" | HP Spectre x360 13-w023dx i7-7500U, HD Graphics 620, Samsung PM951 NVMe MZVLV512, IPS, 1920x1080, 13.3" | |
|---|---|---|---|---|---|---|
| Power Consumption | -7% | 42% | 17% | 15% | 12% | |
| Idle Minimum * (Watt) | 5.3 | 2.1 60% | 3.1 42% | 4.3 19% | 3.6 32% | 5.5 -4% |
| Idle Average * (Watt) | 9.6 | 7.6 21% | 4.3 55% | 6.3 34% | 6.4 33% | 6.7 30% |
| Idle Maximum * (Watt) | 10.1 | 8.2 19% | 4.9 51% | 9 11% | 9.2 9% | 7.1 30% |
| Load Average * (Watt) | 34.4 | 56.4 -64% | 24.3 29% | 32.7 5% | 34 1% | 33.1 4% |
| Load Maximum * (Watt) | 34.8 | 59.8 -72% | 22.8 34% | 28.8 17% | 34.4 1% | 35.2 -1% |
* ... Meglio usare valori piccoli
| HP Spectre x360 13-ac033dx i7-7500U, HD Graphics 620, 57.8 Wh | Apple MacBook Pro 13 2016 (2.9 GHz) 6267U, Iris Graphics 550, 49.2 Wh | Dell XPS 13-9365 2-in-1 i7-7Y75, HD Graphics 615, 46 Wh | Lenovo Yoga 910-13IKB-80VF004CGE i7-7500U, HD Graphics 620, 78 Wh | HP Spectre 13-v131ng i7-7500U, HD Graphics 620, 38 Wh | HP Spectre x360 13-w023dx i7-7500U, HD Graphics 620, 57.8 Wh | |
|---|---|---|---|---|---|---|
| Autonomia della batteria | -19% | 34% | 36% | -23% | 21% | |
| Reader / Idle (h) | 13.2 | 16.2 23% | 17.8 35% | 12 -9% | 20.6 56% | |
| WiFi v1.3 (h) | 9 | 9.4 4% | 11.4 27% | 10.7 19% | 6.6 -27% | 9.3 3% |
| Load (h) | 1.9 | 1.1 -42% | 2.9 53% | 2.9 53% | 1.3 -32% | 2 5% |
Pro
Contro
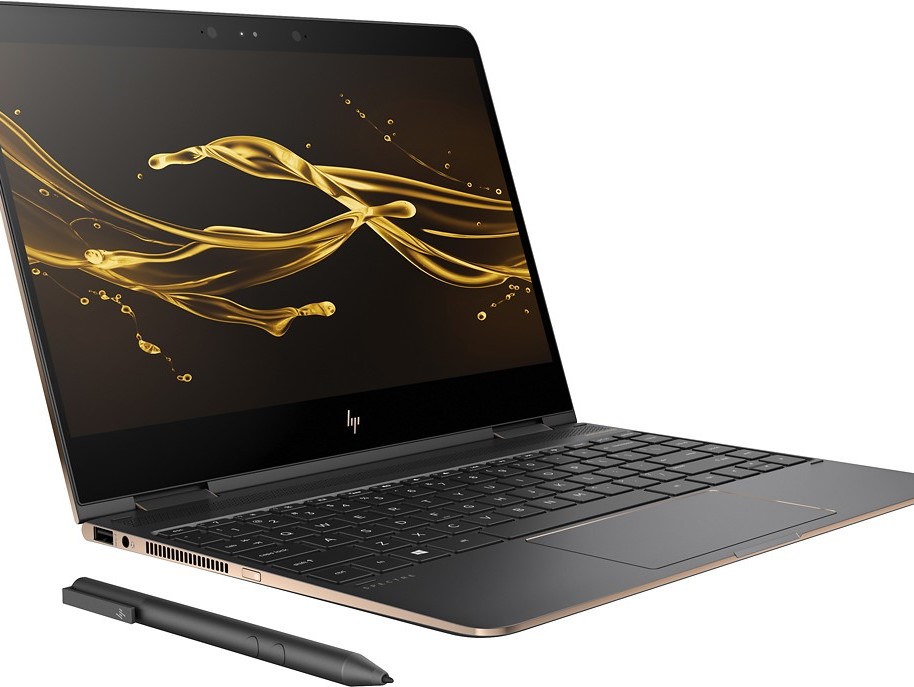
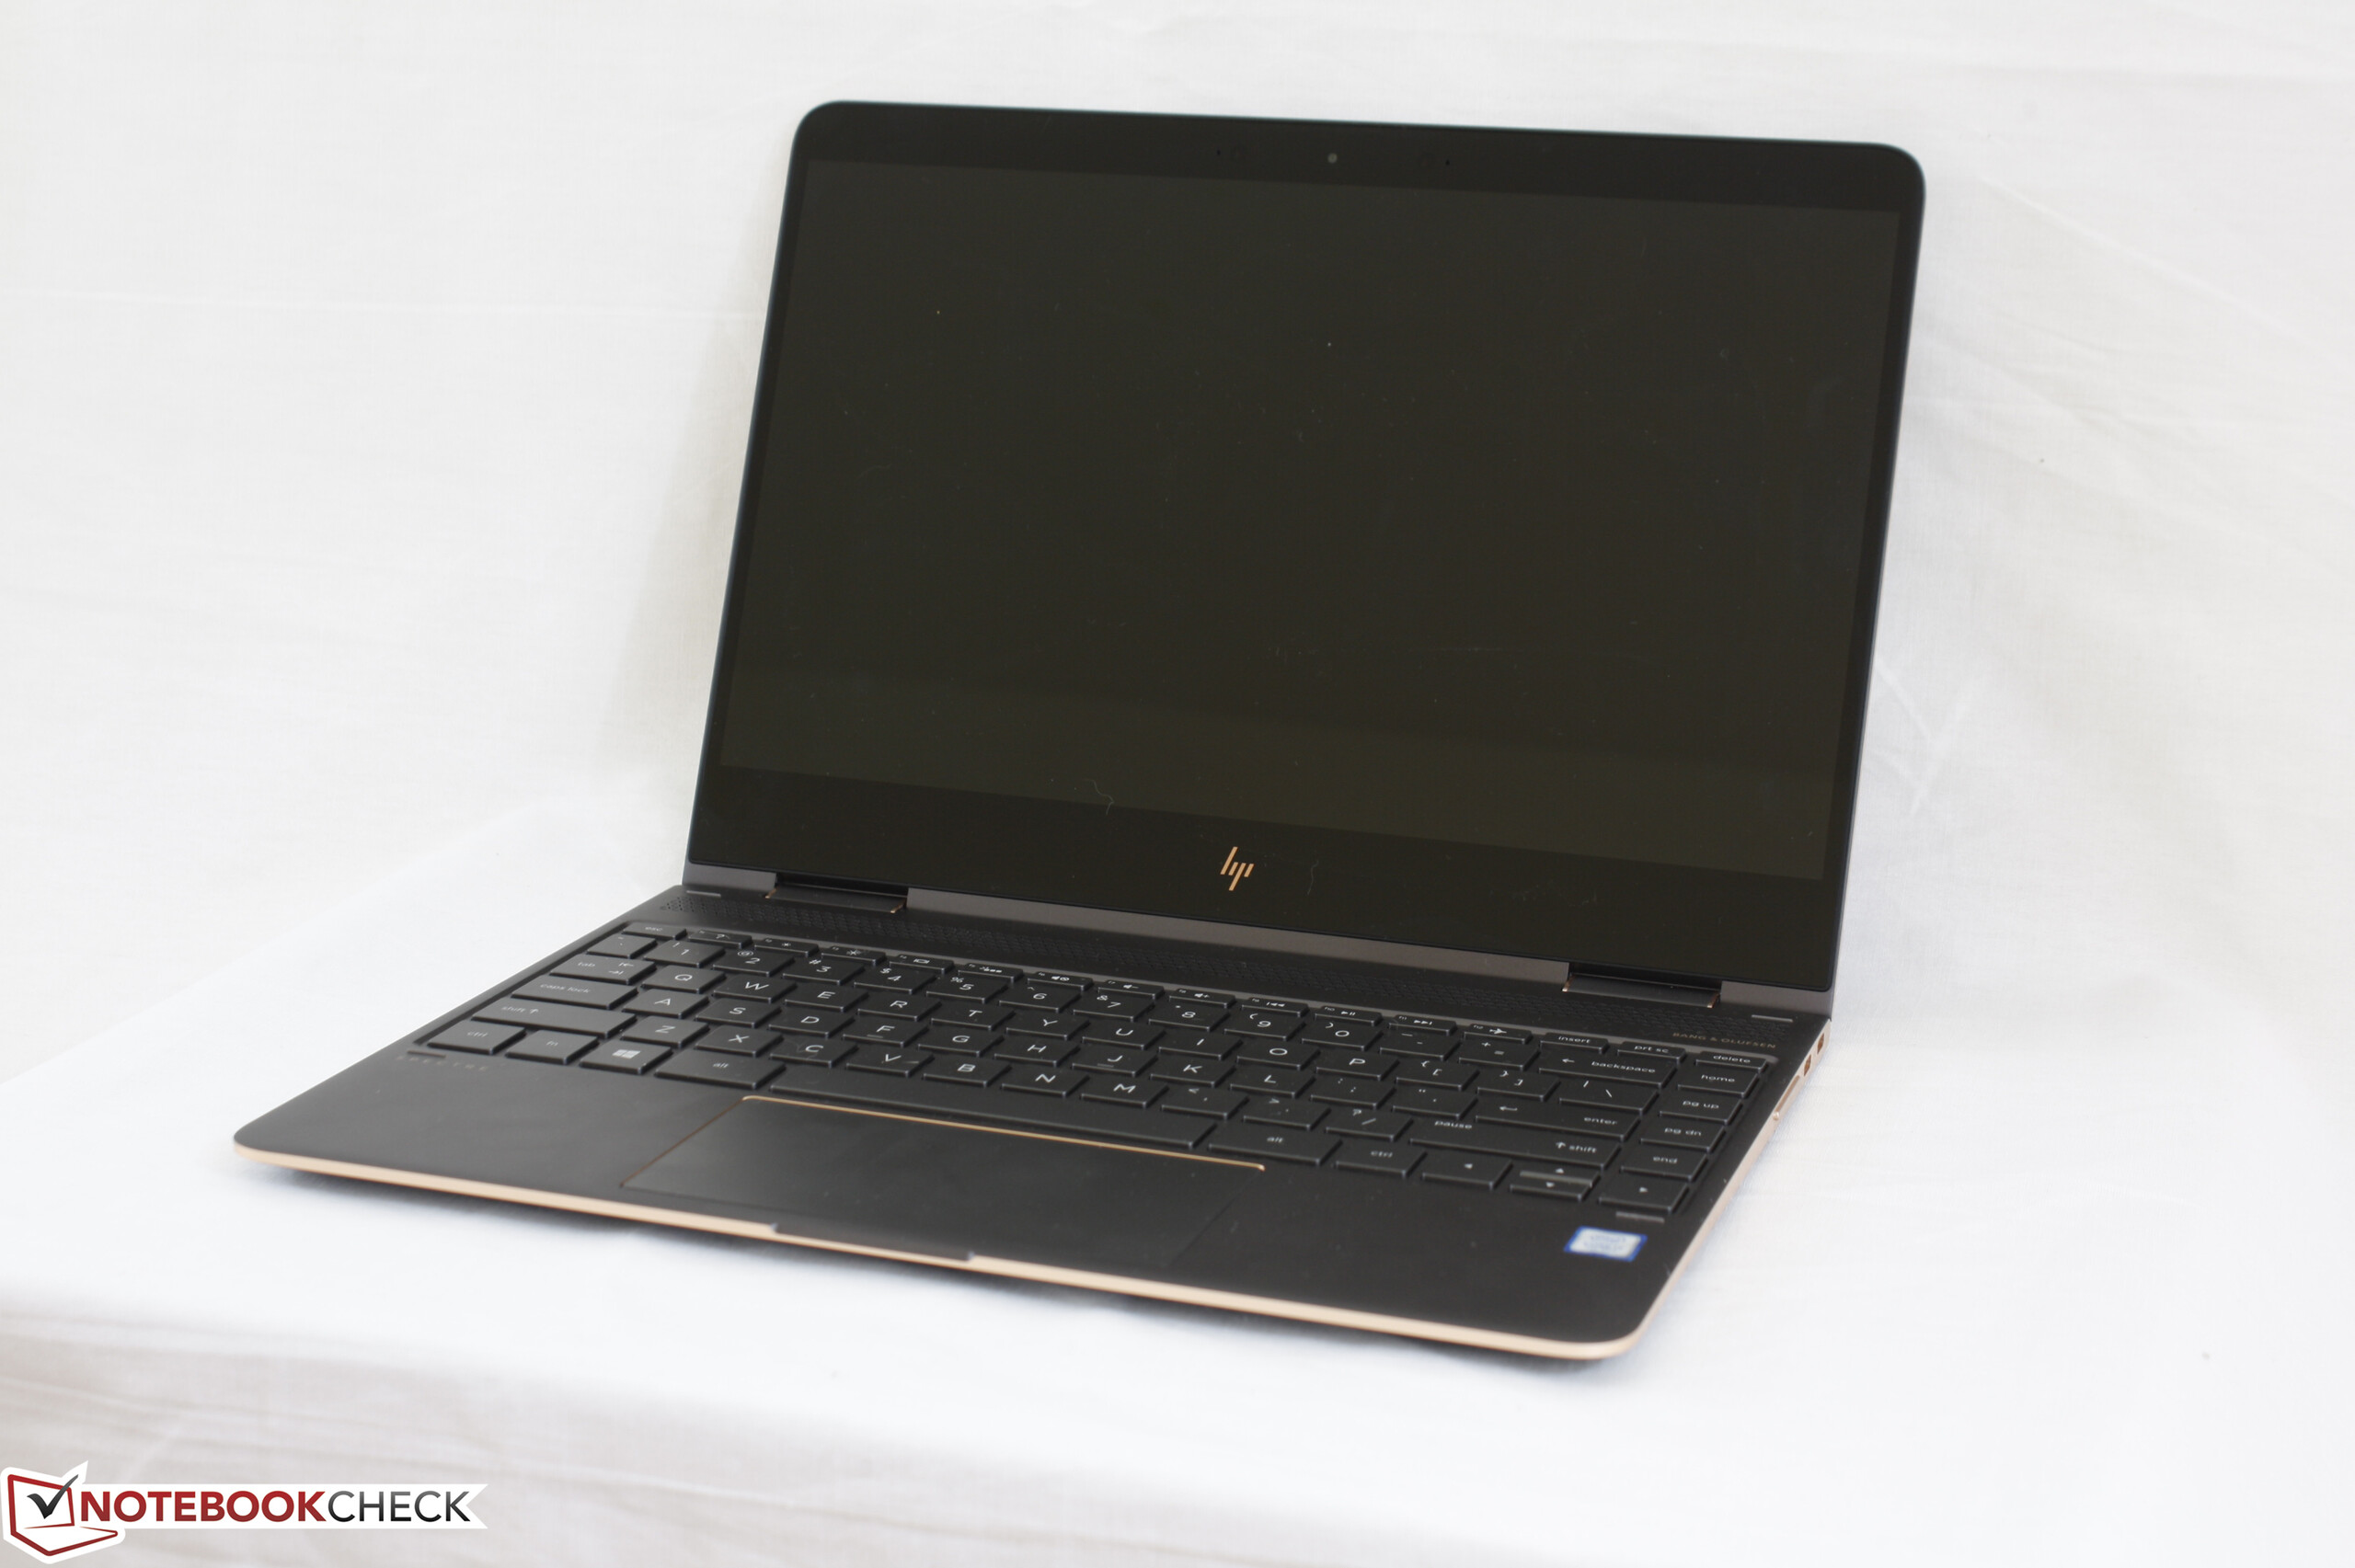
HP ha reso il suo Spectre x360 13 ancora migliore incorporando un 4K UHD e il supporto della penna attiva per un'esperienza tablet superiore. Questo conserva sempre la stessa leggerezza ed è facile da gestire 2-in-1 ciò ha fatto si che il modello 2016 emergesse come uno dei convertibili più pratici nella sua categoria.
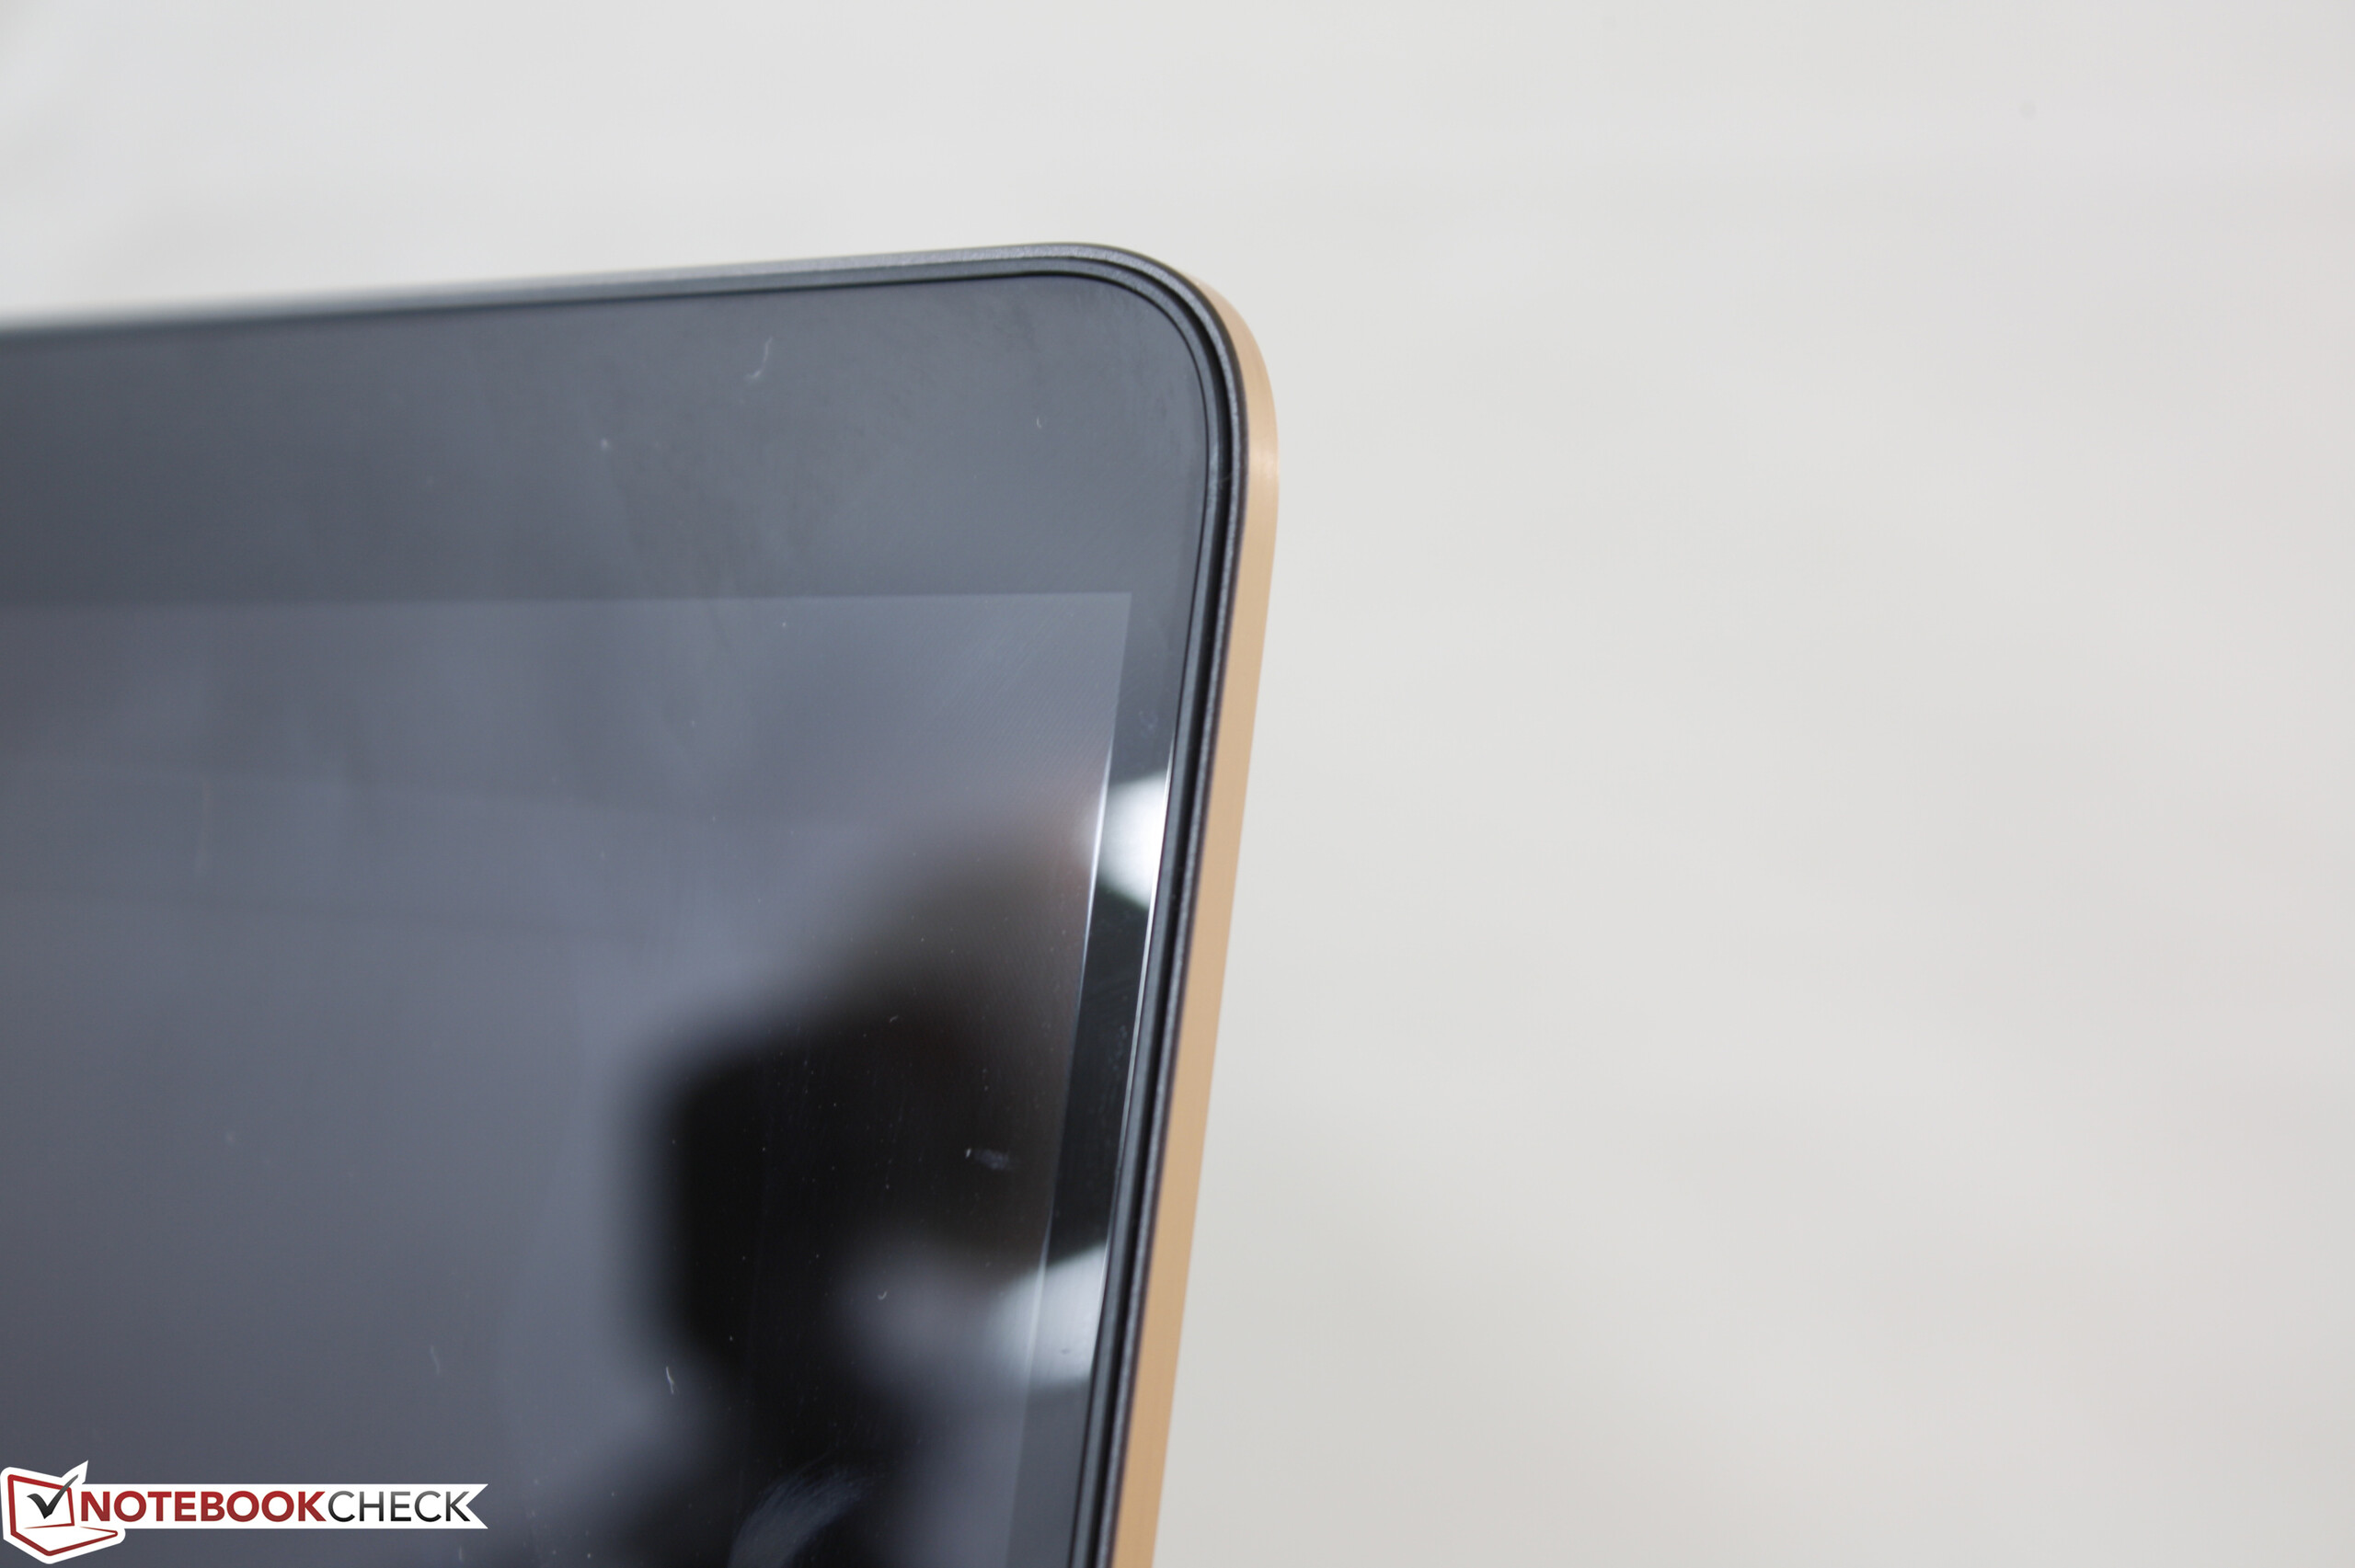
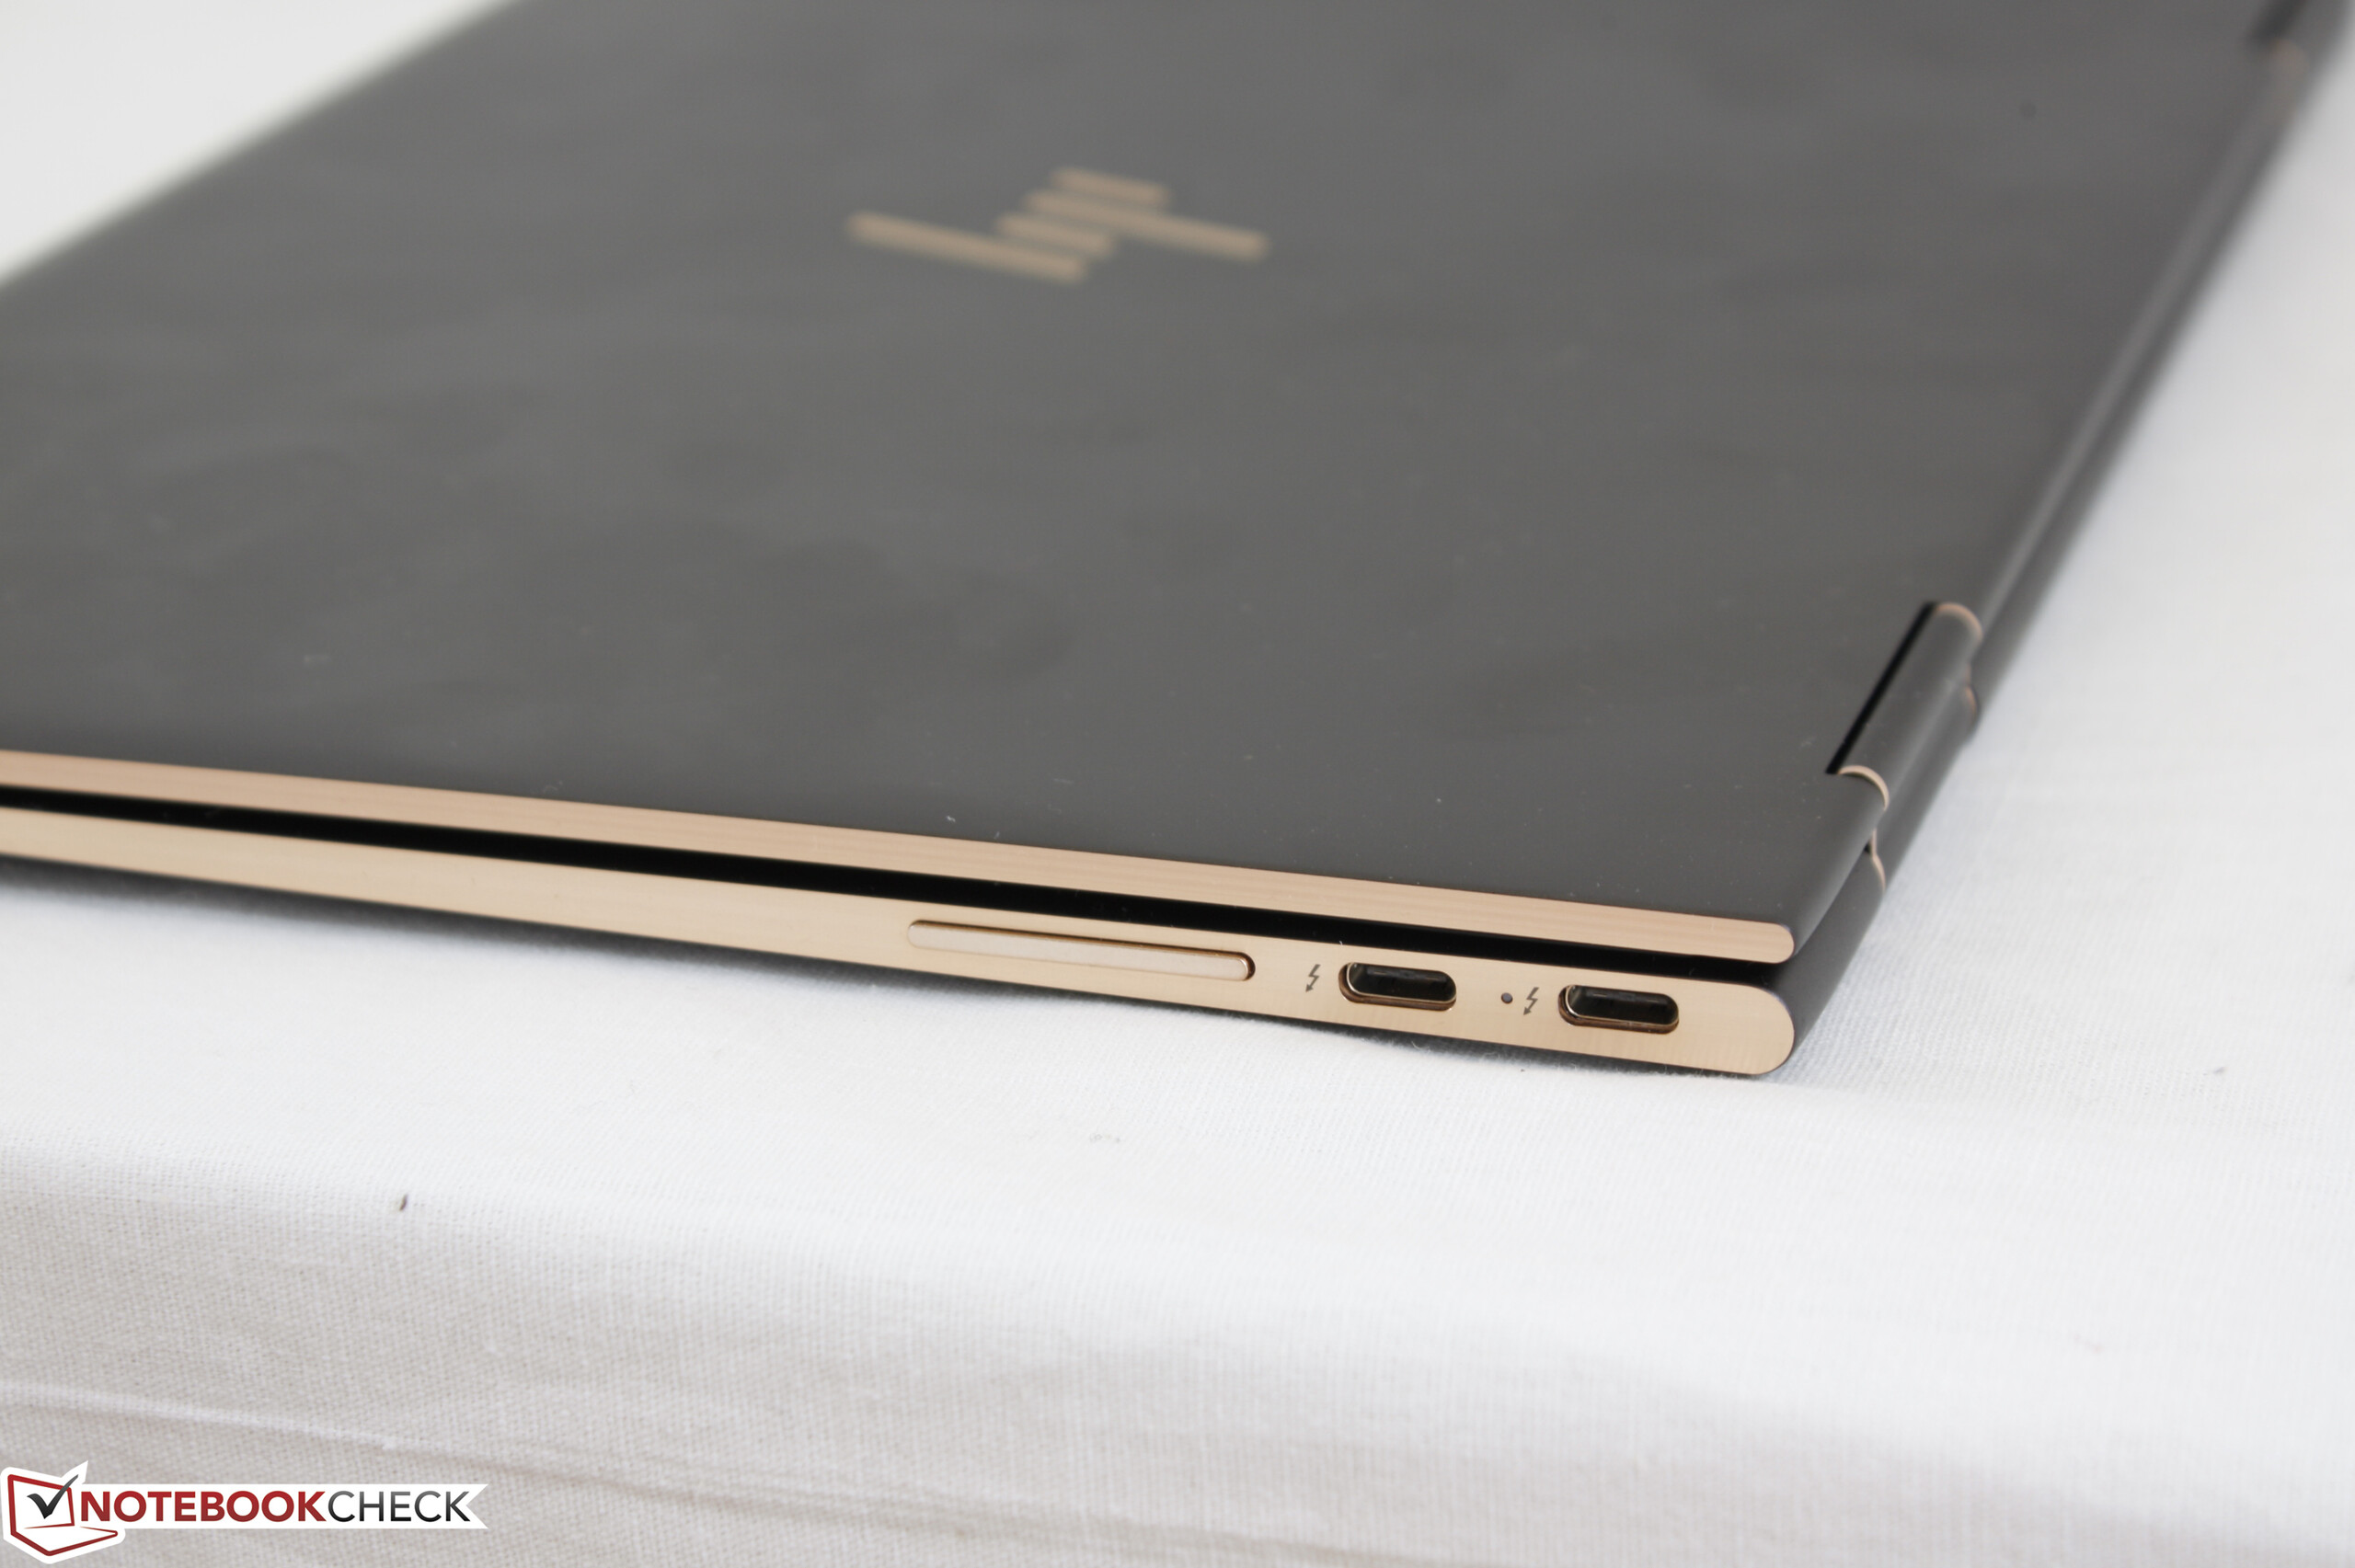
A parte il predetto piccolo numero di aggiornamenti, siamo tuttavia un po' delusi dal fatto che HP non abbia avuto il tempo di migliorare l'esperienza ancora di più. Ad esempio, l'aggiunta di un lettore SD, software di controllo manuale della ventola, e un display luminoso con retroilluminazione avrebbero meglio differenziato questo refresh dal modello 2016 FHD. Si sta tentando di lanciare l'utilizzo dello Spectre x360 13 all'aperto soprattutto ora che un active stylus è incluso in ogni confezione, ma la retroilluminazione non è così brillante come avrebbe potuto essere.
Sia l'XPS 13 9365 che lo Yoga 910 sono stati ampiamente disponibili nei mesi seguenti alla nostra iniziale recensione del 2016 x360 Spectre 13 con vantaggi e svantaggi per ciascuno. Il Dell è infatti più leggero e più piccolo senza sacrificare le dimensioni dello schermo, ma non esiste alcuna opzione UHD 4K e la CPU a raffreddamento passivo è lenta. Di contro, Yoga 910 è leggermente più grande in termini di dimensioni dello schermo come le simili SKU 4K UHD e i7-7500U, ma manca il supporto penna attivo ed è sia più largo e che pesante rispetto all'HP. Come via di mezzo per i consumatori, il nuovo X360 Spectre 13 è attualmente il meglio dei due mondi in termini di perfomance e portabilità.
Questo aggiornamento 2017, infine, pone il 4K UHD e il supporto penna attiva nei desideri dello Specter X360 13 2016. Molto non è cambiato, ma va bene - il convertibile colpisce ancora con un eccellente equilibrio di dimensioni e potenza per un uso confortevole in tutte le modalità.
Nota: si tratta di una recensione breve, con alcune sezioni non tradotte, per la versione integrale in inglese guardate quisono stati ampiamente disponibili nei mesi seguenti alla nostra iniziale recensione del 2016 x360 Spectre 13 con vantaggi e svantaggi per ciascuno. Il Dell è infatti più leggero e più piccolo senza sacrificare le dimensioni dello schermo, ma non esiste alcuna opzione UHD 4K e la CPU a raffreddamento passivo è lenta. Di contro, Yoga 910 è leggermente più grande in termini di dimensioni dello schermo come le simili SKU 4K UHD e i7-7500U, ma manca il supporto penna attivo ed è sia più largo e che pesante rispetto all'HP. Come via di mezzo per i consumatori, il nuovo X360 Spectre 13 è attualmente il meglio dei due mondi in termini di perfomance e portabilità.
Questo aggiornamento 2017, infine, pone il 4K UHD e il supporto penna attiva nei desideri dello Specter X360 13 2016. Molto non è cambiato, ma va bene - il convertibile colpisce ancora con un eccellente equilibrio di dimensioni e potenza per un uso confortevole in tutte le modalità.
Nota: si tratta di una recensione breve, con alcune sezioni non tradotte, per la versione integrale in inglese guardate qui.
HP Spectre x360 13-ac033dx
- 04/05/2017 v6 (old)
Allen Ngo
Price comparison
