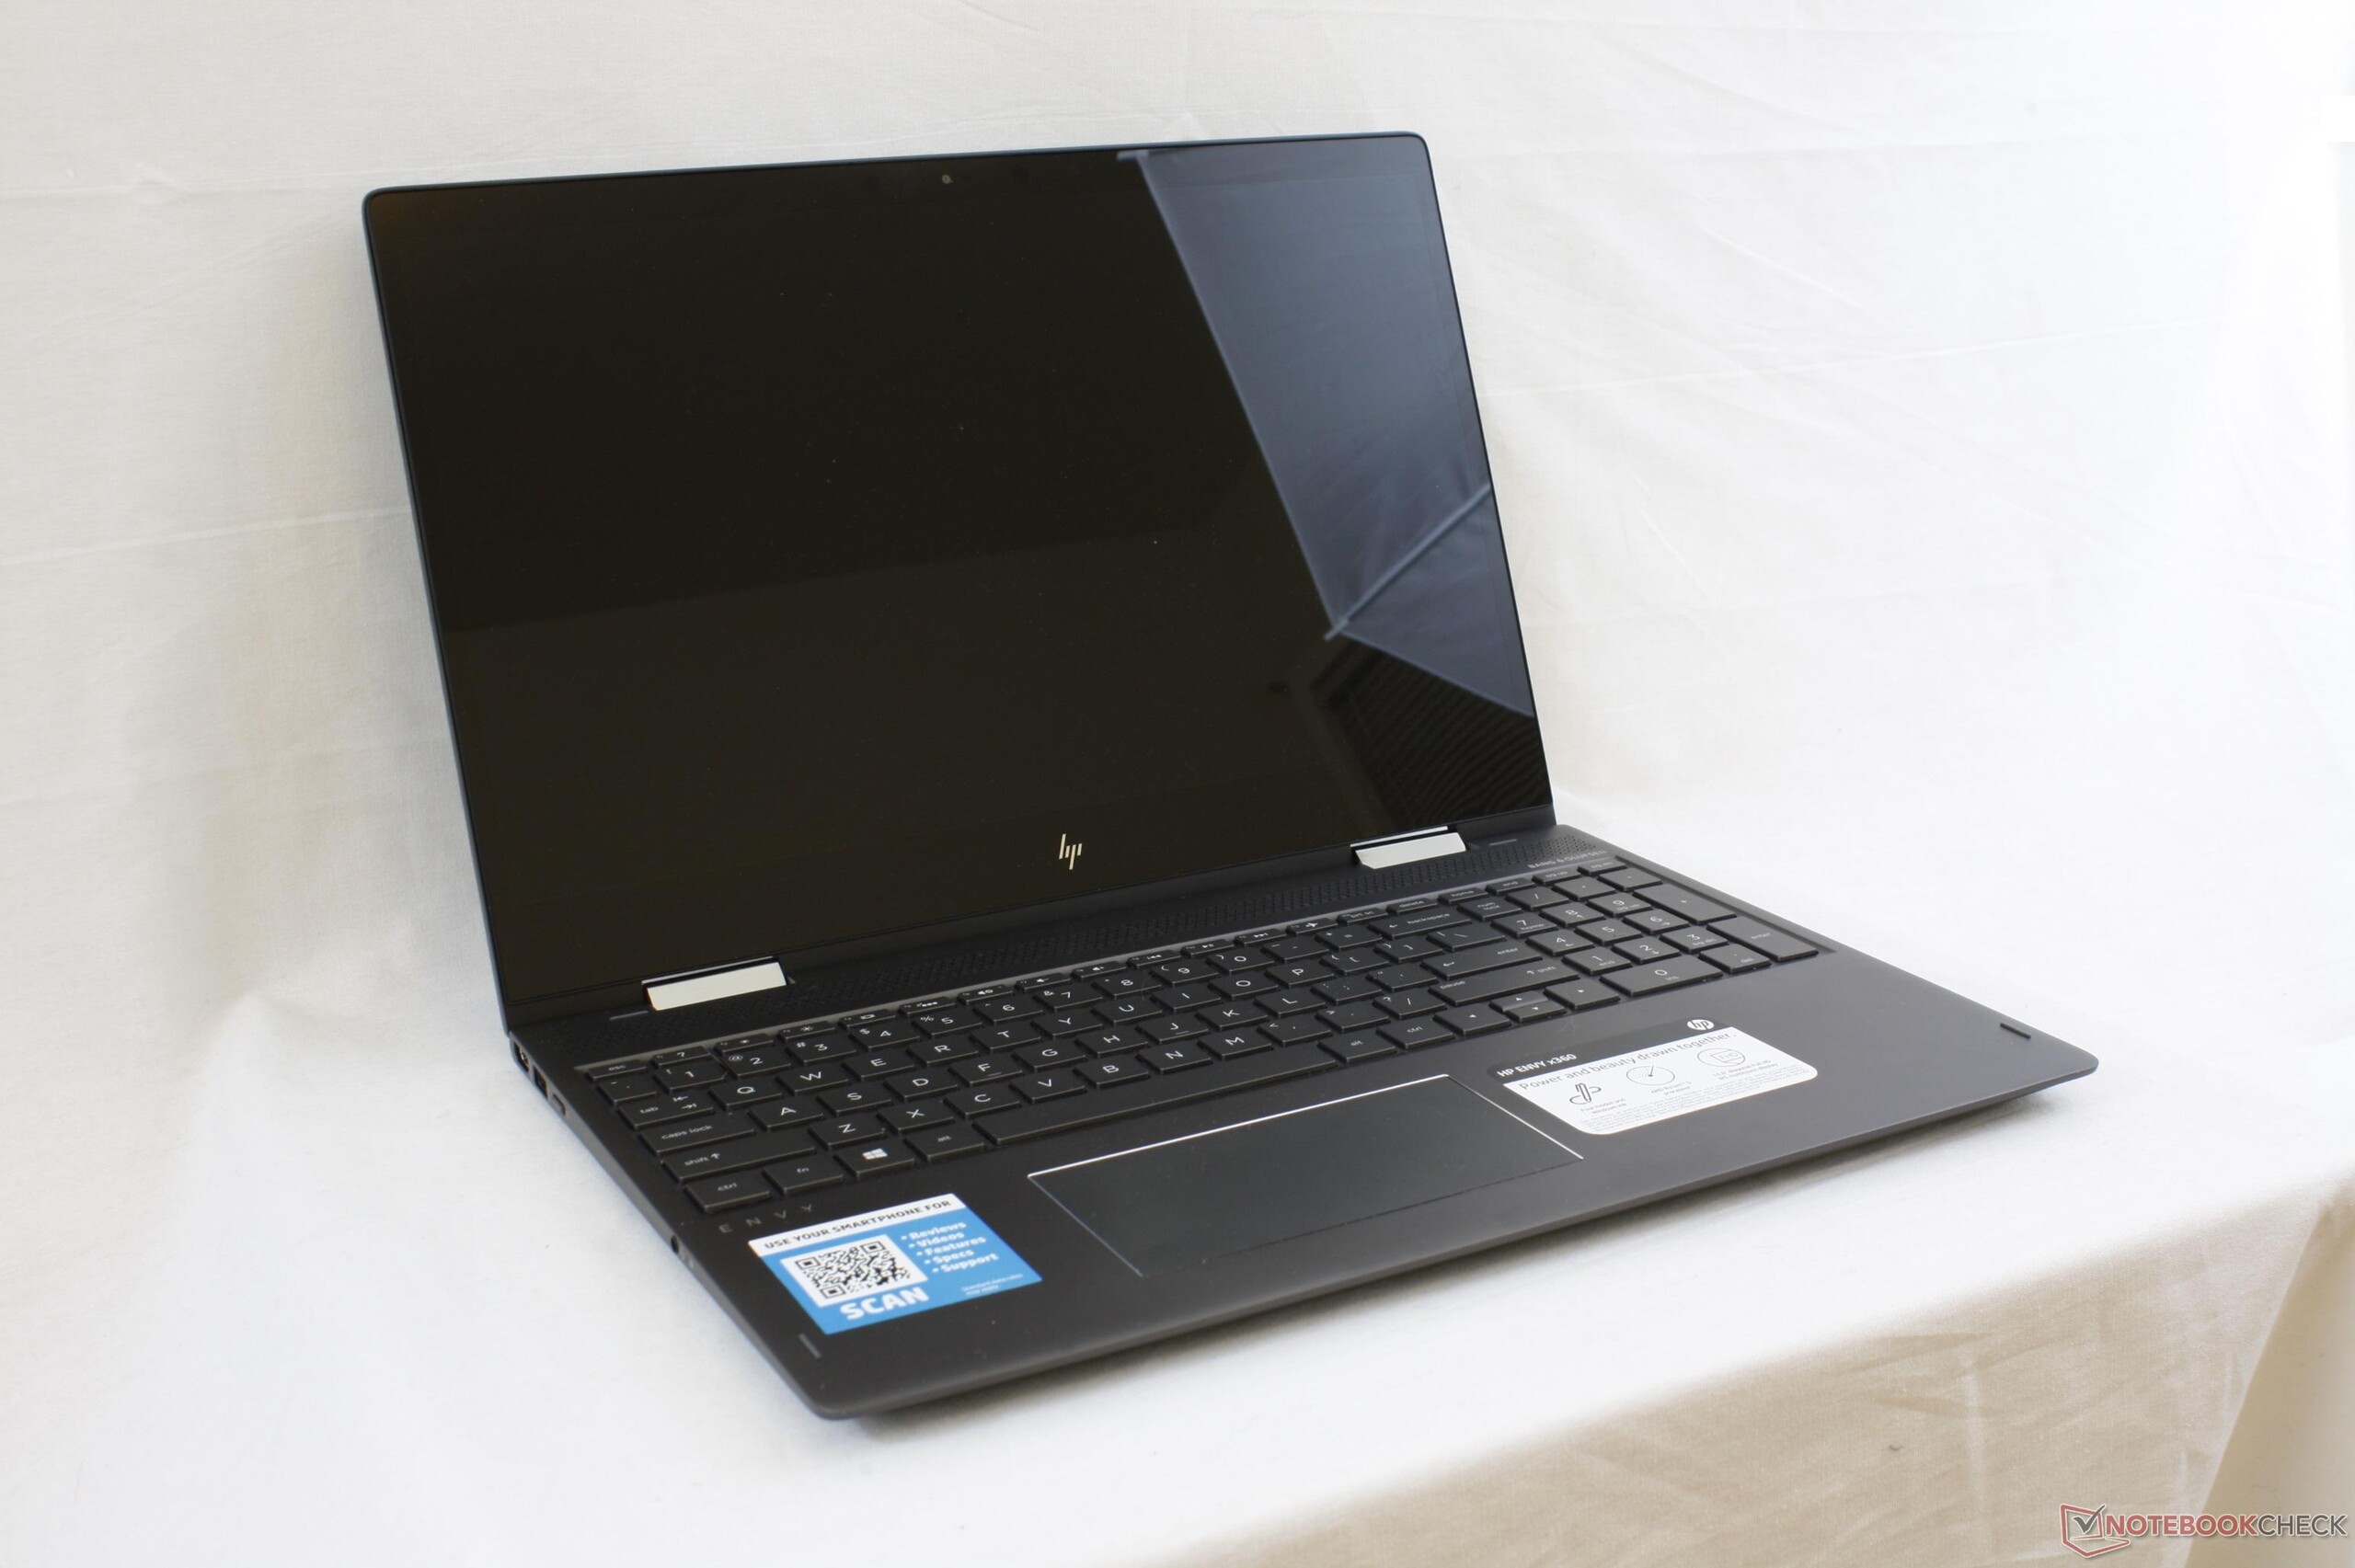
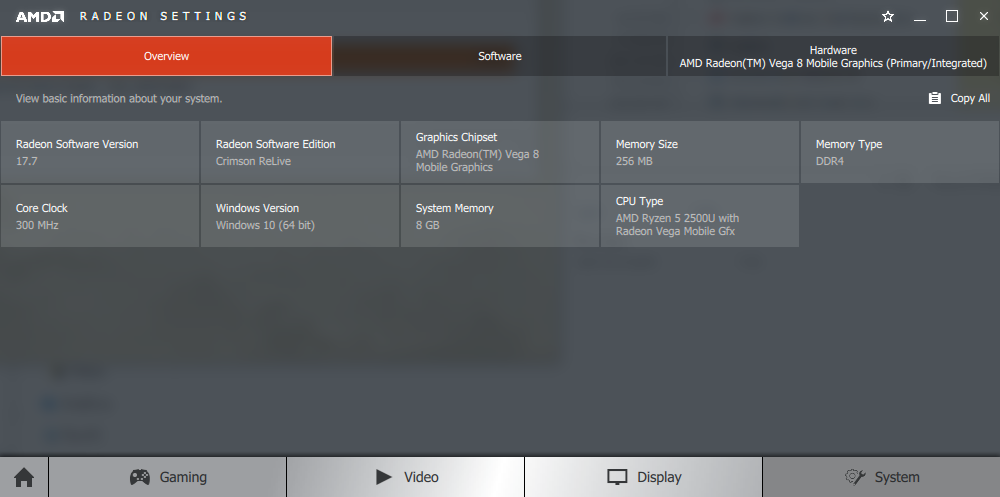
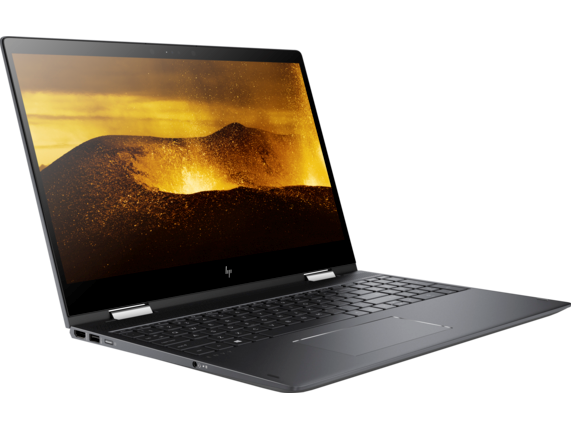
Recensione breve del Portatile HP Envy x360 15 (Ryzen 5 2500U, Radeon Vega 8)

| SD Card Reader | |
| average JPG Copy Test (av. of 3 runs) | |
| HP Spectre x360 15-bl002xx | |
| Dell XPS 15 9560 (i7-7700HQ, UHD) | |
| HP Envy x360 15m-bq121dx | |
| MSI GS63VR 7RF-228US | |
| maximum AS SSD Seq Read Test (1GB) | |
| Dell XPS 15 9560 (i7-7700HQ, UHD) | |
| HP Spectre x360 15-bl002xx | |
| HP Envy x360 15m-bq121dx | |
| MSI GS63VR 7RF-228US | |
| |||||||||||||||||||||||||
Distribuzione della luminosità: 88 %
Al centro con la batteria: 230.2 cd/m²
Contrasto: 1151:1 (Nero: 0.2 cd/m²)
ΔE ColorChecker Calman: 5.7 | ∀{0.5-29.43 Ø4.72}
ΔE Greyscale Calman: 2.6 | ∀{0.09-98 Ø4.97}
57.9% sRGB (Argyll 1.6.3 3D)
37.5% AdobeRGB 1998 (Argyll 1.6.3 3D)
41.29% AdobeRGB 1998 (Argyll 3D)
58.3% sRGB (Argyll 3D)
39.97% Display P3 (Argyll 3D)
Gamma: 2.2
CCT: 6109 K
| HP Envy x360 15m-bq121dx ID: BOE06F9, IPS, 15.6", 1920x1080 | HP Spectre x360 15-bl002xx UHD UWVA eDP BrightView WLED-backlit , IPS, 15.6", 3840x2160 | HP Envy x360 15t-w200 BOE0679 , IPS, 15.6", 1920x1080 | Dell XPS 15 9560 (i7-7700HQ, UHD) IGZO IPS, 15.6", 3840x2160 | Lenovo Yoga 720-15IKB-80X7 Chi Mei CMN N156HCE-EN1, IPS, 15.6", 1920x1080 | |
|---|---|---|---|---|---|
| Display | 59% | 9% | 113% | 59% | |
| Display P3 Coverage (%) | 39.97 | 67.9 70% | 43.31 8% | 89.7 124% | 65 63% |
| sRGB Coverage (%) | 58.3 | 88.2 51% | 65 11% | 100 72% | 90.8 56% |
| AdobeRGB 1998 Coverage (%) | 41.29 | 64.4 56% | 44.75 8% | 100 142% | 65.8 59% |
| Response Times | -29% | -34% | -52% | 13% | |
| Response Time Grey 50% / Grey 80% * (ms) | 30.8 ? | 44 ? -43% | 56 ? -82% | 57.2 ? -86% | 29.6 ? 4% |
| Response Time Black / White * (ms) | 33.6 ? | 38.8 ? -15% | 28.8 ? 14% | 39.2 ? -17% | 26.4 ? 21% |
| PWM Frequency (Hz) | 201.6 ? | 1000 ? | 201.6 | 962 | 25510 ? |
| Screen | 36% | 0% | 21% | 6% | |
| Brightness middle (cd/m²) | 230.2 | 351.5 53% | 204.9 -11% | 370.1 61% | 300.9 31% |
| Brightness (cd/m²) | 222 | 336 51% | 190 -14% | 356 60% | 285 28% |
| Brightness Distribution (%) | 88 | 83 -6% | 82 -7% | 87 -1% | 92 5% |
| Black Level * (cd/m²) | 0.2 | 0.24 -20% | 0.203 -1% | 0.37 -85% | 0.24 -20% |
| Contrast (:1) | 1151 | 1465 27% | 1009 -12% | 1000 -13% | 1254 9% |
| Colorchecker dE 2000 * | 5.7 | 3.3 42% | 4.7 18% | 5.3 7% | 5 12% |
| Colorchecker dE 2000 max. * | 20.8 | 7.3 65% | 9.03 57% | 9.9 52% | 10.2 51% |
| Greyscale dE 2000 * | 2.6 | 1.9 27% | 3.86 -48% | 4.6 -77% | 7 -169% |
| Gamma | 2.2 100% | 2.09 105% | 2.36 93% | 2.31 95% | 2.34 94% |
| CCT | 6109 106% | 6784 96% | 6834 95% | 6284 103% | 6578 99% |
| Color Space (Percent of AdobeRGB 1998) (%) | 37.5 | 64.4 72% | 41 9% | 88.3 135% | 59 57% |
| Color Space (Percent of sRGB) (%) | 57.9 | 88.2 52% | 64 11% | 100 73% | 90 55% |
| Media totale (Programma / Settaggio) | 22% /
32% | -8% /
-3% | 27% /
30% | 26% /
17% |
* ... Meglio usare valori piccoli
Tempi di risposta del Display
| ↔ Tempi di risposta dal Nero al Bianco | ||
|---|---|---|
| 33.6 ms ... aumenta ↗ e diminuisce ↘ combinato | ↗ 18 ms Incremento | 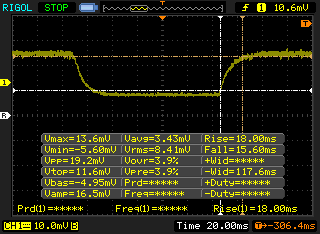 |
| ↘ 15.6 ms Calo | ||
| Lo schermo mostra tempi di risposta lenti nei nostri tests e sarà insoddisfacente per i gamers. In confronto, tutti i dispositivi di test variano da 0.1 (minimo) a 240 (massimo) ms. » 90 % di tutti i dispositivi è migliore. Questo significa che i tempi di risposta rilevati sono peggiori rispetto alla media di tutti i dispositivi testati (19.8 ms). | ||
| ↔ Tempo di risposta dal 50% Grigio all'80% Grigio | ||
| 30.8 ms ... aumenta ↗ e diminuisce ↘ combinato | ↗ 14 ms Incremento | 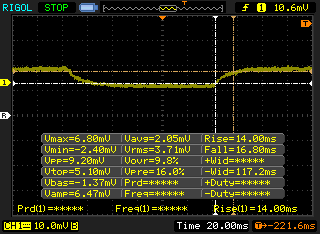 |
| ↘ 16.8 ms Calo | ||
| Lo schermo mostra tempi di risposta lenti nei nostri tests e sarà insoddisfacente per i gamers. In confronto, tutti i dispositivi di test variano da 0.165 (minimo) a 636 (massimo) ms. » 41 % di tutti i dispositivi è migliore. Questo significa che i tempi di risposta rilevati sono simili alla media di tutti i dispositivi testati (31 ms). | ||
Sfarfallio dello schermo / PWM (Pulse-Width Modulation)
| flickering dello schermo / PWM rilevato | 201.6 Hz | ≤ 99 % settaggio luminosita' | 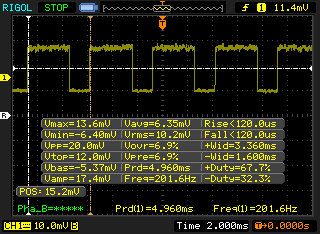 |
Il display sfarfalla a 201.6 Hz (Probabilmente a causa dell'uso di PWM) Flickering rilevato ad una luminosita' di 99 % o inferiore. Non dovrebbe verificarsi flickering o PWM sopra questo valore di luminosita'. La frequenza di 201.6 Hz è relativamente bassa, quindi gli utenti sensibili potrebbero notare il flickering ed accusare stanchezza agli occhi a questo livello di luminosità e a livelli inferiori. In confronto: 52 % di tutti i dispositivi testati non utilizza PWM per ridurre la luminosita' del display. Se è rilevato PWM, una media di 7769 (minimo: 5 - massimo: 343500) Hz è stata rilevata. | |||
| Cinebench R15 | |
| CPU Single 64Bit | |
| Microsoft Surface Laptop i7 | |
| HP Spectre x360 15t-bl100 | |
| 1300X Nvidia GeForce GTX 1080 Ti FE Asus Prime B350-PLUS | |
| Lenovo ThinkPad 25 | |
| Xiaomi Mi Notebook Pro i5 | |
| MSI GF62VR 7RF-877 | |
| Apple MacBook Pro 13 2017 Touchbar i5 | |
| HP Envy x360 15m-bq121dx | |
| Dell Inspiron 15 7000 7577 | |
| Asus FX550IU-WSFX | |
| CPU Multi 64Bit | |
| MSI GF62VR 7RF-877 | |
| Xiaomi Mi Notebook Pro i5 | |
| HP Envy x360 15m-bq121dx | |
| 1300X Nvidia GeForce GTX 1080 Ti FE Asus Prime B350-PLUS | |
| HP Spectre x360 15t-bl100 | |
| Dell Inspiron 15 7000 7577 | |
| Microsoft Surface Laptop i7 | |
| Apple MacBook Pro 13 2017 Touchbar i5 | |
| Lenovo ThinkPad 25 | |
| Asus FX550IU-WSFX | |
| Cinebench R11.5 | |
| CPU Single 64Bit | |
| Microsoft Surface Laptop i7 | |
| HP Spectre x360 15t-bl100 | |
| MSI GF62VR 7RF-877 | |
| 1300X Nvidia GeForce GTX 1080 Ti FE Asus Prime B350-PLUS | |
| Lenovo ThinkPad 25 | |
| Apple MacBook Pro 13 2017 Touchbar i5 | |
| HP Envy x360 15m-bq121dx | |
| Dell Inspiron 15 7000 7577 | |
| Asus FX550IU-WSFX | |
| CPU Multi 64Bit | |
| MSI GF62VR 7RF-877 | |
| HP Envy x360 15m-bq121dx | |
| 1300X Nvidia GeForce GTX 1080 Ti FE Asus Prime B350-PLUS | |
| Dell Inspiron 15 7000 7577 | |
| HP Spectre x360 15t-bl100 | |
| Microsoft Surface Laptop i7 | |
| Apple MacBook Pro 13 2017 Touchbar i5 | |
| Asus FX550IU-WSFX | |
| Lenovo ThinkPad 25 | |
| Cinebench R10 | |
| Rendering Multiple CPUs 32Bit | |
| MSI GF62VR 7RF-877 | |
| Dell Inspiron 15 7000 7577 | |
| HP Spectre x360 15t-bl100 | |
| 1300X Nvidia GeForce GTX 1080 Ti FE Asus Prime B350-PLUS | |
| HP Envy x360 15m-bq121dx | |
| Microsoft Surface Laptop i7 | |
| Lenovo ThinkPad 25 | |
| Apple MacBook Pro 13 2017 Touchbar i5 | |
| Asus FX550IU-WSFX | |
| Rendering Single 32Bit | |
| HP Spectre x360 15t-bl100 | |
| Microsoft Surface Laptop i7 | |
| Lenovo ThinkPad 25 | |
| MSI GF62VR 7RF-877 | |
| Dell Inspiron 15 7000 7577 | |
| Apple MacBook Pro 13 2017 Touchbar i5 | |
| 1300X Nvidia GeForce GTX 1080 Ti FE Asus Prime B350-PLUS | |
| HP Envy x360 15m-bq121dx | |
| Asus FX550IU-WSFX | |
| wPrime 2.10 - 1024m | |
| Apple MacBook Pro 13 2017 Touchbar i5 | |
| Lenovo ThinkPad 25 | |
| Microsoft Surface Laptop i7 | |
| HP Spectre x360 15t-bl100 | |
| 1300X Nvidia GeForce GTX 1080 Ti FE Asus Prime B350-PLUS | |
| Dell Inspiron 15 7000 7577 | |
| Asus FX550IU-WSFX | |
| HP Envy x360 15m-bq121dx | |
| MSI GF62VR 7RF-877 | |
* ... Meglio usare valori piccoli
| PCMark 8 Home Score Accelerated v2 | 3385 punti | |
| PCMark 10 Score | 2814 punti | |
Aiuto | ||
| HP Envy x360 15m-bq121dx HGST Travelstar 7K1000 HTS721010A9E630 | HP Omen 15-ce002ng Samsung PM961 MZVLW256HEHP | Xiaomi Mi Notebook Pro i5 Samsung PM961 MZVLW256HEHP | HP Pavilion 17z 1EX13AV Avolusion MD1TBLSSHD | HP Pavilion 15z-bw000 Avolusion MD1TBLSSHD | |
|---|---|---|---|---|---|
| CrystalDiskMark 5.2 / 6 | 14649% | 11981% | -5% | -8% | |
| Write 4K (MB/s) | 1.168 | 156 13256% | 150 12742% | 1.322 13% | 1.171 0% |
| Read 4K (MB/s) | 0.536 | 47.14 8695% | 36 6616% | 0.545 2% | 0.422 -21% |
| Write Seq (MB/s) | 114.1 | 1266 1010% | 1057 826% | 89.1 -22% | 108.6 -5% |
| Read Seq (MB/s) | 114.9 | 1419 1135% | 1074 835% | 91.4 -20% | 106.3 -7% |
| Write 4K Q32T1 (MB/s) | 1.212 | 486 39999% | 429 35296% | 1.239 2% | 1.145 -6% |
| Read 4K Q32T1 (MB/s) | 1.189 | 586 49185% | 441 36990% | 1.548 30% | 1.104 -7% |
| Write Seq Q32T1 (MB/s) | 113.2 | 1246 1001% | 1283 1033% | 90.3 -20% | 107.4 -5% |
| Read Seq Q32T1 (MB/s) | 114.1 | 3431 2907% | 1838 1511% | 88.3 -23% | 104.1 -9% |

| 3DMark | |
| 1280x720 Cloud Gate Standard Graphics | |
| Asus FX550IU-WSFX | |
| Asus Zenbook UX510UW-CN044T | |
| Acer Aspire E5-575G-549D | |
| HP Envy 13-ad006ng | |
| HP Envy x360 15m-bq121dx | |
| Intel Skull Canyon NUC6i7KYK | |
| Lenovo ThinkPad 25 | |
| Apple MacBook Pro 13 2017 Touchbar i5 | |
| Microsoft Surface Laptop i7 | |
| Acer Switch 5 SW512-52-5819 | |
| HP 17-bs103ng | |
| HP 15-bw075ax | |
| 1920x1080 Fire Strike Graphics | |
| Asus FX550IU-WSFX | |
| Asus Zenbook UX510UW-CN044T | |
| Acer Aspire E5-575G-549D | |
| HP Envy 13-ad006ng | |
| HP Envy x360 15m-bq121dx | |
| Lenovo ThinkPad 25 | |
| Intel Skull Canyon NUC6i7KYK | |
| Apple MacBook Pro 13 2017 Touchbar i5 | |
| HP 17-bs103ng | |
| Microsoft Surface Laptop i7 | |
| Acer Switch 5 SW512-52-5819 | |
| HP 15-bw075ax | |
| 3DMark 11 | |
| 1280x720 Performance GPU | |
| Asus FX550IU-WSFX | |
| Asus Zenbook UX510UW-CN044T | |
| Acer Aspire E5-575G-549D | |
| HP Envy x360 15m-bq121dx | |
| HP Envy 13-ad006ng | |
| Intel Skull Canyon NUC6i7KYK | |
| Lenovo ThinkPad 25 | |
| Apple MacBook Pro 13 2017 Touchbar i5 | |
| Microsoft Surface Laptop i7 | |
| Microsoft Surface Laptop i7 | |
| HP 17-bs103ng | |
| Acer Switch 5 SW512-52-5819 | |
| 1280x720 Performance Combined | |
| Asus Zenbook UX510UW-CN044T | |
| Acer Aspire E5-575G-549D | |
| HP Envy 13-ad006ng | |
| Lenovo ThinkPad 25 | |
| HP Envy x360 15m-bq121dx | |
| Intel Skull Canyon NUC6i7KYK | |
| Asus FX550IU-WSFX | |
| Apple MacBook Pro 13 2017 Touchbar i5 | |
| Microsoft Surface Laptop i7 | |
| Microsoft Surface Laptop i7 | |
| HP 17-bs103ng | |
| Acer Switch 5 SW512-52-5819 | |
| 3DMark 11 Performance | 3759 punti | |
| 3DMark Cloud Gate Standard Score | 10601 punti | |
| 3DMark Fire Strike Score | 2262 punti | |
| 3DMark Fire Strike Extreme Score | 1091 punti | |
Aiuto | ||
| BioShock Infinite - 1920x1080 Ultra Preset, DX11 (DDOF) | |
| Acer Aspire E5-575G-549D | |
| HP Spectre x360 15t-bl100 | |
| Lenovo ThinkPad 25 | |
| HP Envy x360 15m-bq121dx | |
| Intel Skull Canyon NUC6i7KYK | |
| Apple MacBook Pro 13 2017 | |
| HP Pavilion 17z 1EX13AV | |
| Dell XPS 13 i7-8550U | |
| Samsung Notebook 9 NP900X3N-K01US | |
| Rise of the Tomb Raider - 1920x1080 High Preset AA:FX AF:4x | |
| HP Spectre x360 15t-bl100 | |
| Acer Aspire E5-575G-549D | |
| Lenovo ThinkPad 25 | |
| HP Envy x360 15m-bq121dx | |
| Intel Skull Canyon NUC6i7KYK | |
| Dell XPS 13 i7-8550U | |
| basso | medio | alto | ultra | |
|---|---|---|---|---|
| Guild Wars 2 (2012) | 72.3 | 12.9 | ||
| BioShock Infinite (2013) | 114.4 | 20 | ||
| Metro: Last Light (2013) | 60 | 14.2 | ||
| Thief (2014) | 45.9 | 14 | ||
| The Witcher 3 (2015) | 42.3 | 14 | ||
| Batman: Arkham Knight (2015) | 42 | 16 | ||
| Metal Gear Solid V (2015) | 60 | 31 | 20 | |
| Fallout 4 (2015) | 43.9 | 14.9 | ||
| Rise of the Tomb Raider (2016) | 49.3 | 15.4 | ||
| Ashes of the Singularity (2016) | 12.9 | |||
| Overwatch (2016) | 94.2 | 40 | ||
| Mafia 3 (2016) | 13 | |||
| Prey (2017) | 63.2 | 21.7 | ||
| Dirt 4 (2017) | 90.4 | 35.6 | 20.9 | |
| F1 2017 (2017) | 60 | 27 | 22 |
Rumorosità
| Idle |
| 32.3 / 32.4 / 34.2 dB(A) |
| Sotto carico |
| 36.2 / 45.3 dB(A) |
 | ||
30 dB silenzioso 40 dB(A) udibile 50 dB(A) rumoroso |
||
min: | ||
| HP Envy x360 15m-bq121dx Vega 8, R5 2500U, HGST Travelstar 7K1000 HTS721010A9E630 | HP Omen 15-ce002ng GeForce GTX 1060 Max-Q, i7-7700HQ, Samsung PM961 MZVLW256HEHP | Lenovo Yoga 720-15IKB-80X7 GeForce GTX 1050 Mobile, i7-7700HQ, Samsung PM961 MZVLW256HEHP | HP Spectre x360 15-bl002xx GeForce 940MX, i7-7500U, Toshiba XG4 NVMe (THNSN5512GPUK) | HP Envy x360 15t-w200 GeForce 930MX, i7-7500U, WDC Slim WD10SPCX-24HWST1 | Asus Zenbook UX510UW-CN044T GeForce GTX 960M, 6500U, SanDisk SD8SNAT256G1002 | |
|---|---|---|---|---|---|---|
| Noise | -4% | 6% | 1% | -2% | -3% | |
| off /ambiente * (dB) | 28.5 | 30 -5% | 28.2 1% | 28.5 -0% | 30.2 -6% | 31.6 -11% |
| Idle Minimum * (dB) | 32.3 | 30 7% | 28.2 13% | 28.5 12% | 33.8 -5% | 31.6 2% |
| Idle Average * (dB) | 32.4 | 33 -2% | 28.2 13% | 28.5 12% | 33.9 -5% | 31.6 2% |
| Idle Maximum * (dB) | 34.2 | 37 -8% | 28.2 18% | 36.3 -6% | 34.2 -0% | 33.4 2% |
| Load Average * (dB) | 36.2 | 41 -13% | 39 -8% | 42.7 -18% | 36 1% | 41.7 -15% |
| Witcher 3 ultra * (dB) | 42.8 | 42 2% | ||||
| Load Maximum * (dB) | 45.3 | 50 -10% | 46.3 -2% | 42.7 6% | 44 3% | 44.8 1% |
* ... Meglio usare valori piccoli
(±) La temperatura massima sul lato superiore è di 40 °C / 104 F, rispetto alla media di 35.4 °C / 96 F, che varia da 19.6 a 60 °C per questa classe Convertible.
(±) Il lato inferiore si riscalda fino ad un massimo di 44 °C / 111 F, rispetto alla media di 36.9 °C / 98 F
(+) In idle, la temperatura media del lato superiore è di 22.4 °C / 72 F, rispetto alla media deld ispositivo di 30.3 °C / 87 F.
(+) Riproducendo The Witcher 3, la temperatura media per il lato superiore e' di 31.9 °C / 89 F, rispetto alla media del dispositivo di 30.3 °C / 87 F.
(+) I poggiapolsi e il touchpad sono piu' freddi della temperatura della pelle con un massimo di 30.2 °C / 86.4 F e sono quindi freddi al tatto.
(-) La temperatura media della zona del palmo della mano di dispositivi simili e'stata di 28 °C / 82.4 F (-2.2 °C / -4 F).
HP Envy x360 15m-bq121dx analisi audio
(-) | altoparlanti non molto potenti (65.5 dB)
Bassi 100 - 315 Hz
(-) | quasi nessun basso - in media 15.1% inferiori alla media
(-) | bassi non lineari (15.3% delta rispetto alla precedente frequenza)
Medi 400 - 2000 Hz
(+) | medi bilanciati - solo only 4.8% rispetto alla media
(±) | linearità dei medi adeguata (7.4% delta rispetto alla precedente frequenza)
Alti 2 - 16 kHz
(+) | Alti bilanciati - appena 2.3% dalla media
(±) | la linearità degli alti è media (7.8% delta rispetto alla precedente frequenza)
Nel complesso 100 - 16.000 Hz
(±) | la linearità complessiva del suono è media (26.3% di differenza rispetto alla media
Rispetto alla stessa classe
» 82% di tutti i dispositivi testati in questa classe è stato migliore, 3% simile, 15% peggiore
» Il migliore ha avuto un delta di 6%, medio di 20%, peggiore di 57%
Rispetto a tutti i dispositivi testati
» 81% di tutti i dispositivi testati in questa classe è stato migliore, 4% similare, 15% peggiore
» Il migliore ha avuto un delta di 4%, medio di 24%, peggiore di 134%
Apple MacBook 12 (Early 2016) 1.1 GHz analisi audio
(+) | gli altoparlanti sono relativamente potenti (83.6 dB)
Bassi 100 - 315 Hz
(±) | bassi ridotti - in media 11.3% inferiori alla media
(±) | la linearità dei bassi è media (14.2% delta rispetto alla precedente frequenza)
Medi 400 - 2000 Hz
(+) | medi bilanciati - solo only 2.4% rispetto alla media
(+) | medi lineari (5.5% delta rispetto alla precedente frequenza)
Alti 2 - 16 kHz
(+) | Alti bilanciati - appena 2% dalla media
(+) | alti lineari (4.5% delta rispetto alla precedente frequenza)
Nel complesso 100 - 16.000 Hz
(+) | suono nel complesso lineare (10.2% differenza dalla media)
Rispetto alla stessa classe
» 7% di tutti i dispositivi testati in questa classe è stato migliore, 2% simile, 91% peggiore
» Il migliore ha avuto un delta di 5%, medio di 18%, peggiore di 53%
Rispetto a tutti i dispositivi testati
» 5% di tutti i dispositivi testati in questa classe è stato migliore, 1% similare, 94% peggiore
» Il migliore ha avuto un delta di 4%, medio di 24%, peggiore di 134%
| Off / Standby | |
| Idle | |
| Sotto carico |
|
Leggenda:
min: | |
| HP Envy x360 15m-bq121dx R5 2500U, Vega 8, HGST Travelstar 7K1000 HTS721010A9E630, IPS, 1920x1080, 15.6" | Xiaomi Mi Notebook Pro i5 i5-8250U, GeForce MX150, Samsung PM961 MZVLW256HEHP, IPS LED, 1920x1080, 15.6" | HP Spectre x360 15-bl002xx i7-7500U, GeForce 940MX, Toshiba XG4 NVMe (THNSN5512GPUK), IPS, 3840x2160, 15.6" | HP Envy x360 15t-w200 i7-7500U, GeForce 930MX, WDC Slim WD10SPCX-24HWST1, IPS, 1920x1080, 15.6" | HP Spectre x360 15t-bl100 i5-8550U, GeForce MX150, Samsung PM961 NVMe MZVLW512HMJP, IPS, 3840x2160, 15.6" | Lenovo Yoga 720-15IKB-80X7 i7-7700HQ, GeForce GTX 1050 Mobile, Samsung PM961 MZVLW256HEHP, IPS, 1920x1080, 15.6" | |
|---|---|---|---|---|---|---|
| Power Consumption | 8% | -26% | 16% | -54% | -59% | |
| Idle Minimum * (Watt) | 5.9 | 3.7 37% | 8.14 -38% | 5 15% | 11.6 -97% | 8.3 -41% |
| Idle Average * (Watt) | 8.7 | 7.5 14% | 10.91 -25% | 8.3 5% | 13.8 -59% | 10.2 -17% |
| Idle Maximum * (Watt) | 10.5 | 8 24% | 12.26 -17% | 7.8 26% | 14.2 -35% | 10.4 1% |
| Load Average * (Watt) | 45.7 | 49 -7% | 45.67 -0% | 28.8 37% | 67.9 -49% | 67.5 -48% |
| Witcher 3 ultra * (Watt) | 45.8 | 50.6 -10% | 59 -29% | 96.5 -111% | ||
| Load Maximum * (Watt) | 49.4 | 55.2 -12% | 74.94 -52% | 49.7 -1% | 76.9 -56% | 117.2 -137% |
* ... Meglio usare valori piccoli
| HP Envy x360 15m-bq121dx R5 2500U, Vega 8, 55.8 Wh | Lenovo Yoga 720-15IKB-80X7 i7-7700HQ, GeForce GTX 1050 Mobile, 72 Wh | HP Spectre x360 15-bl002xx i7-7500U, GeForce 940MX, 79.2 Wh | HP Envy x360 15t-w200 i7-7500U, GeForce 930MX, 48 Wh | HP Spectre x360 15t-bl100 i5-8550U, GeForce MX150, 79.2 Wh | Dell XPS 15 9560 (i7-7700HQ, UHD) i7-7700HQ, GeForce GTX 1050 Mobile, 97 Wh | |
|---|---|---|---|---|---|---|
| Autonomia della batteria | 36% | 53% | -3% | 50% | 23% | |
| Reader / Idle (h) | 10.9 | 17.8 63% | 14.4 32% | 10.6 -3% | 15.6 43% | 13.9 28% |
| WiFi v1.3 (h) | 6.6 | 8.1 23% | 8.9 35% | 5.3 -20% | 8.5 29% | 7.2 9% |
| Load (h) | 1.3 | 1.6 23% | 2.5 92% | 1.5 15% | 2.3 77% | 1.7 31% |
Pro
Contro
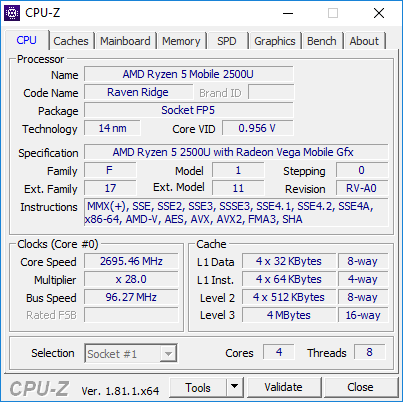
Poiché si tratta del primo portatile disponibile con Raven Ridge, il nostro giudizio deve essere suddiviso. La prima parte riguarda l'hardware AMD. Sulla carta l'APU da 25 W cTDP Ryzen 5 2500U e la GPU Vega 8 sono in grado di fare un testa a testa con le attuali opzioni 15 W Kaby Lake-R (i5-8250, i7-8550U) e supera l'Iris Pro Graphics 580 in nei synthetic benchmarks. Combinate questo con un prezzo inferiore e non ci sembrano mancare motivi per scegliere Combinate questi elementi con un prezzo inferiore e sembra non ci siamo motivo di preferire Intel rispetto ad AMD con tutto il resto uguale.
Sfortunatamente per AMD, il resto non è uguale e la Raven Ridge non è ancora matura. Il nostro modello di test è estremamente lento e soffre di crashes. In particolare, il sistema si blocca più spesso quando si stressa la GPU o si usano i giochi come nella precedente generazione di portatili con AMD Dual Graphics come l'Asus FX550IU. I synthetic benchmarks possono evidenziare che la Vega 8 è più veloce rispetto alla vecchia GeForce 940MX, ma vale l'opposto quando si usano i giochi attuali..
I potenziali clienti che sono interessati poco alle prestazioni troveranno prezzi inferiori rispetto ad una Intel Kaby Lake-R. D'altro canto, i gamers saranno delusi dalla RX Vega 8 se non si aggiornano i drivers. Potrebbe essere il doppio più veloce rispetto alla UHD Graphics 620 nei synthetic tests, ma la MX150 resta il miglior investimento per il gaming 1080p economico.
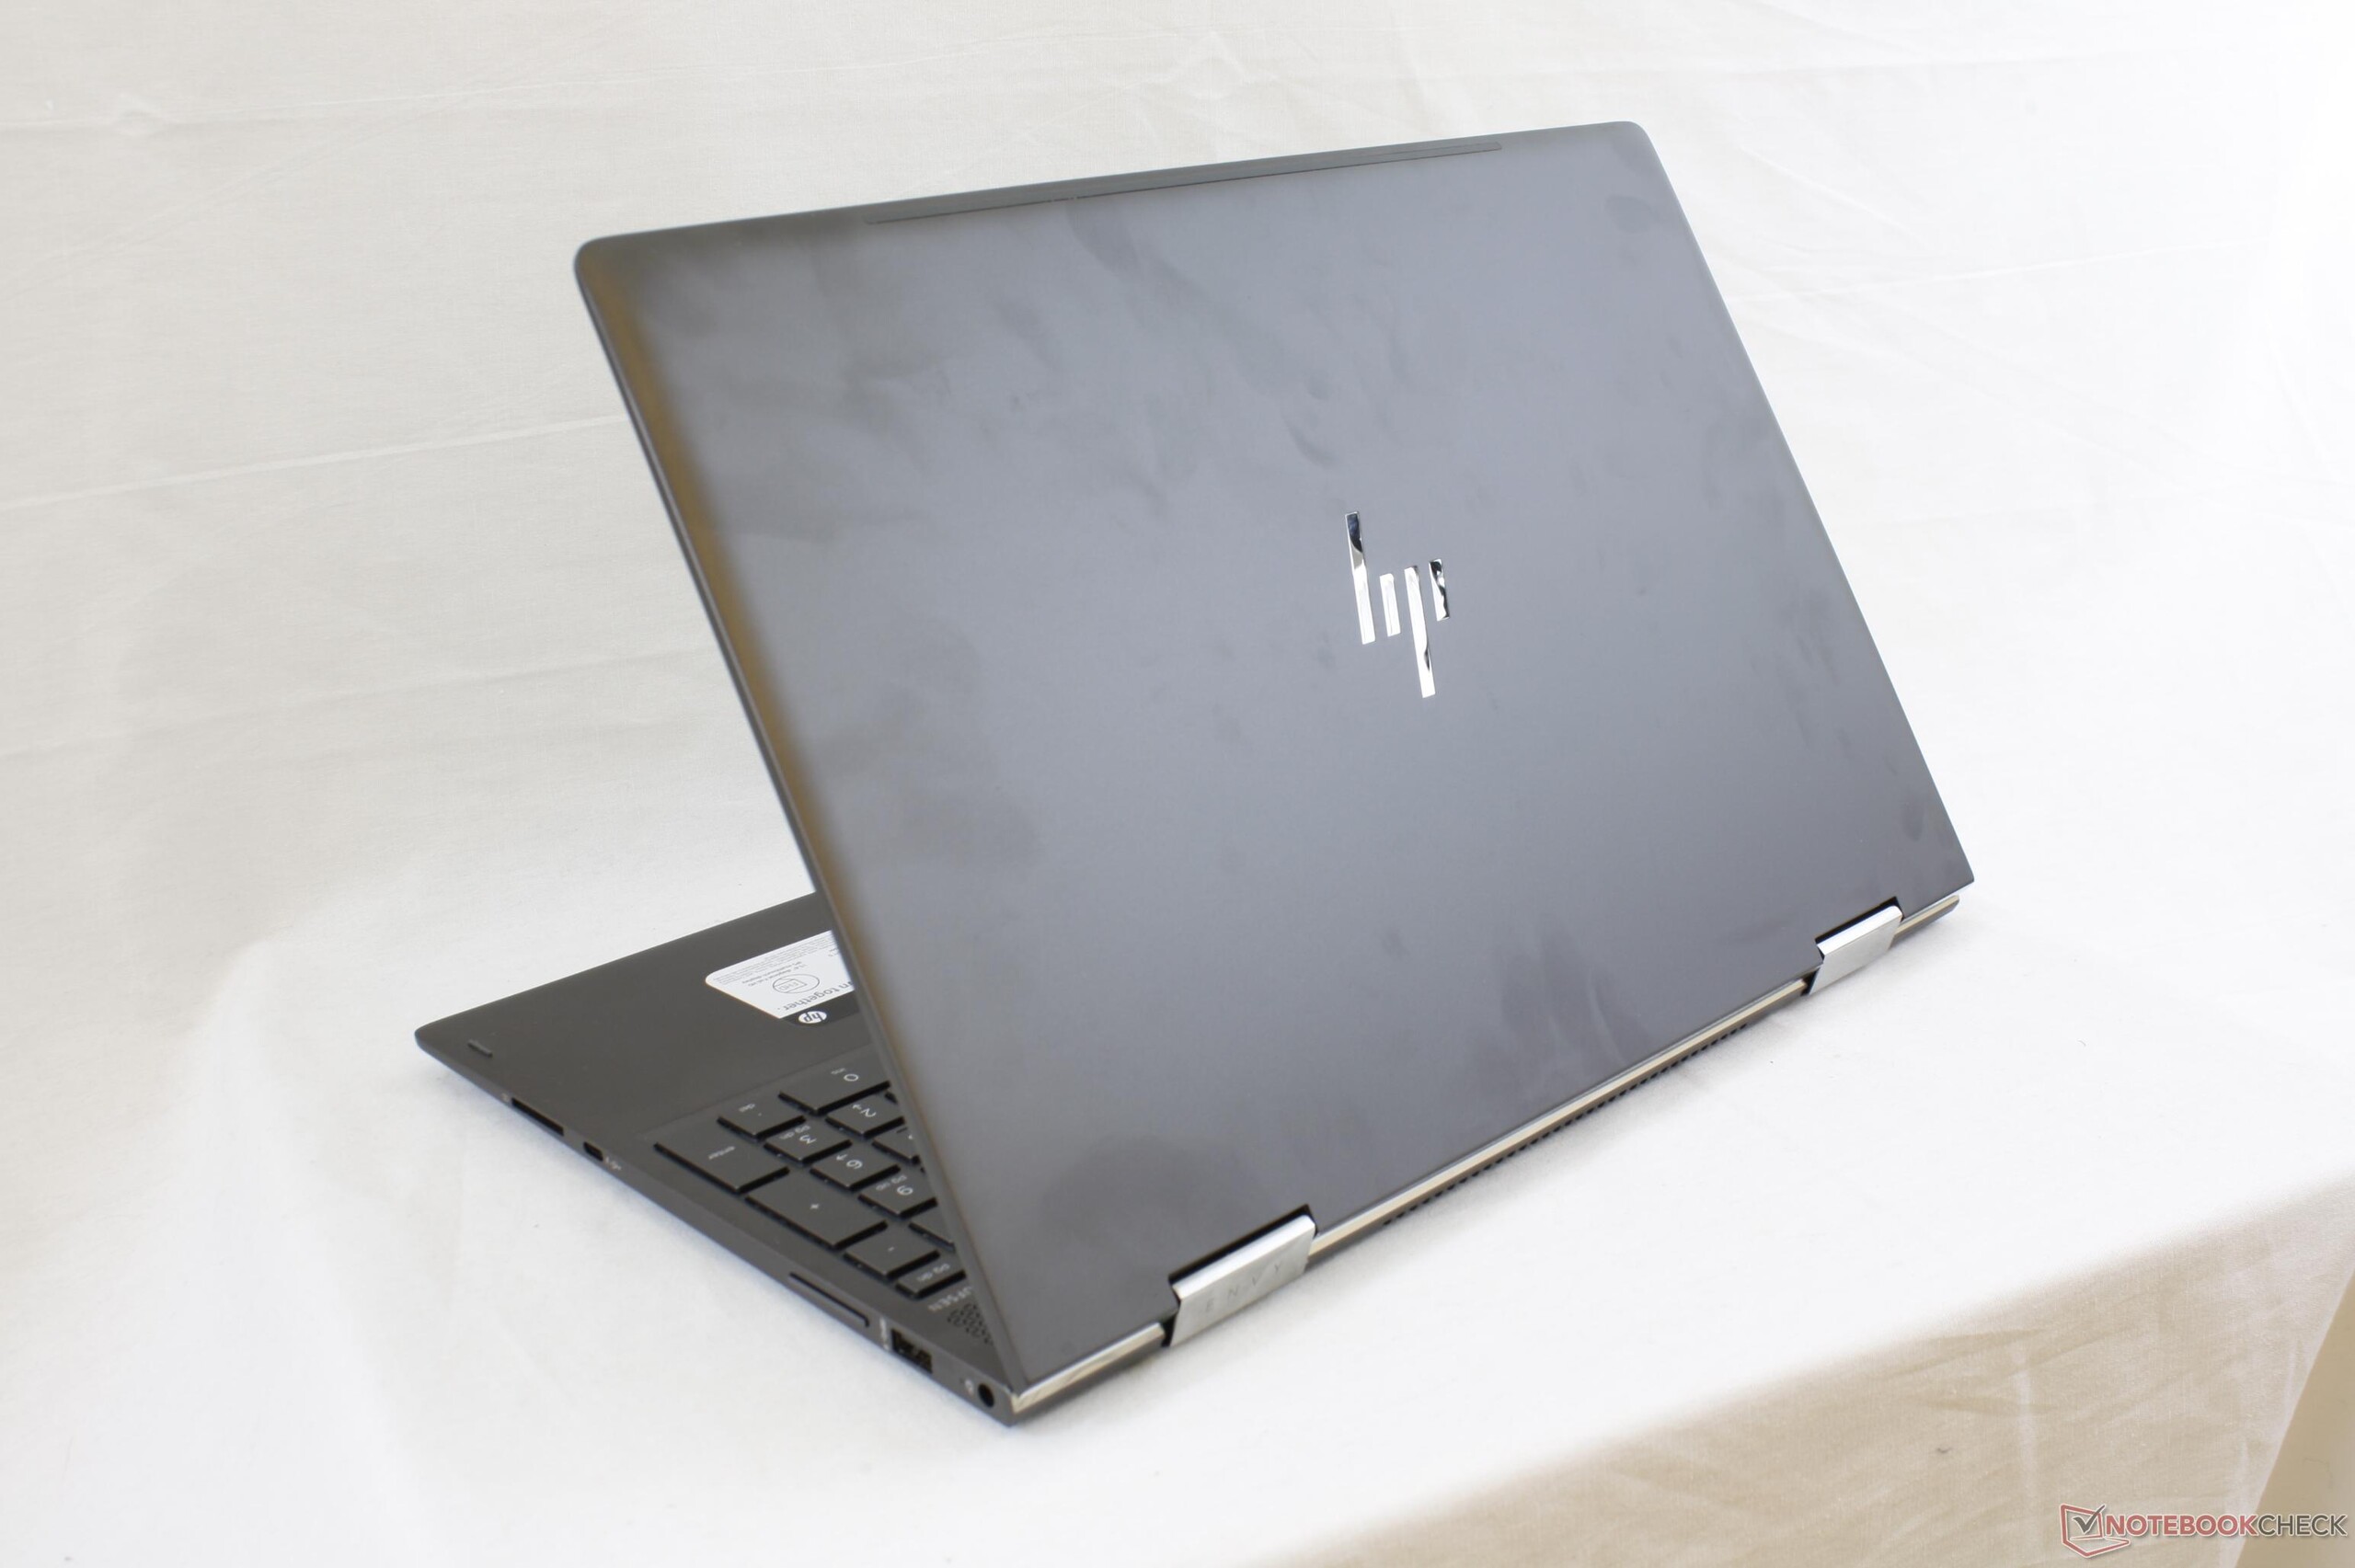
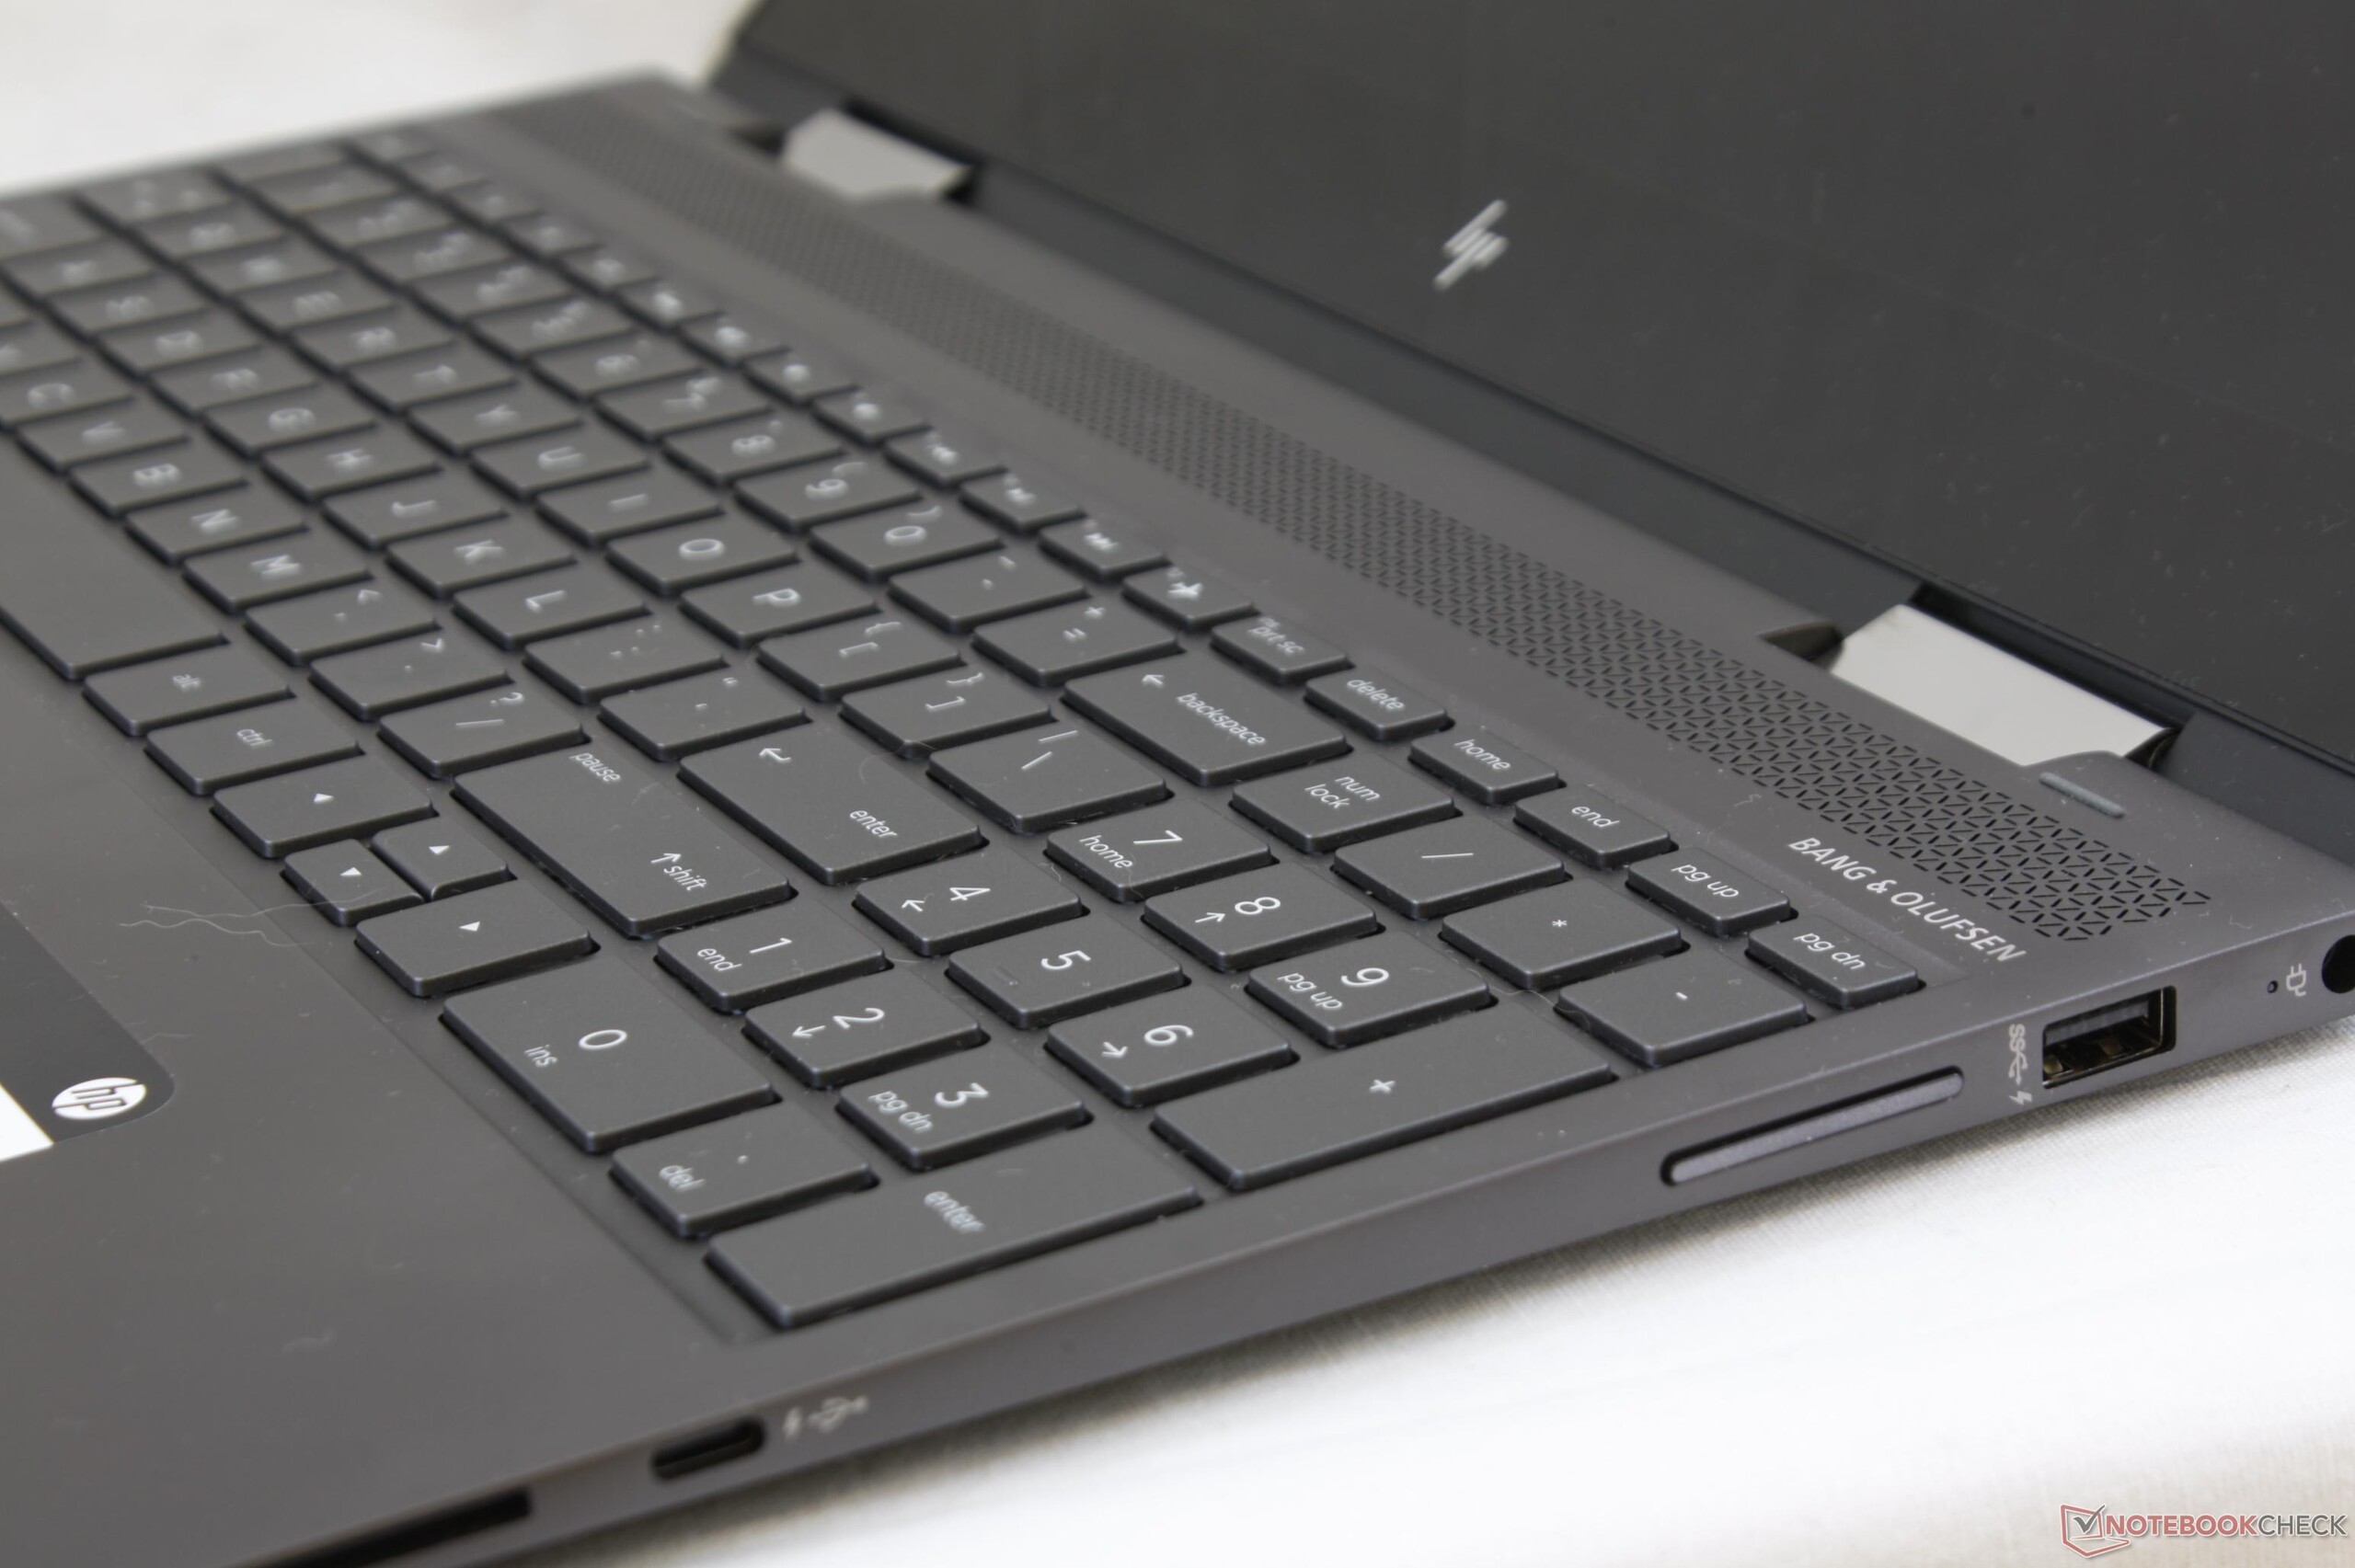
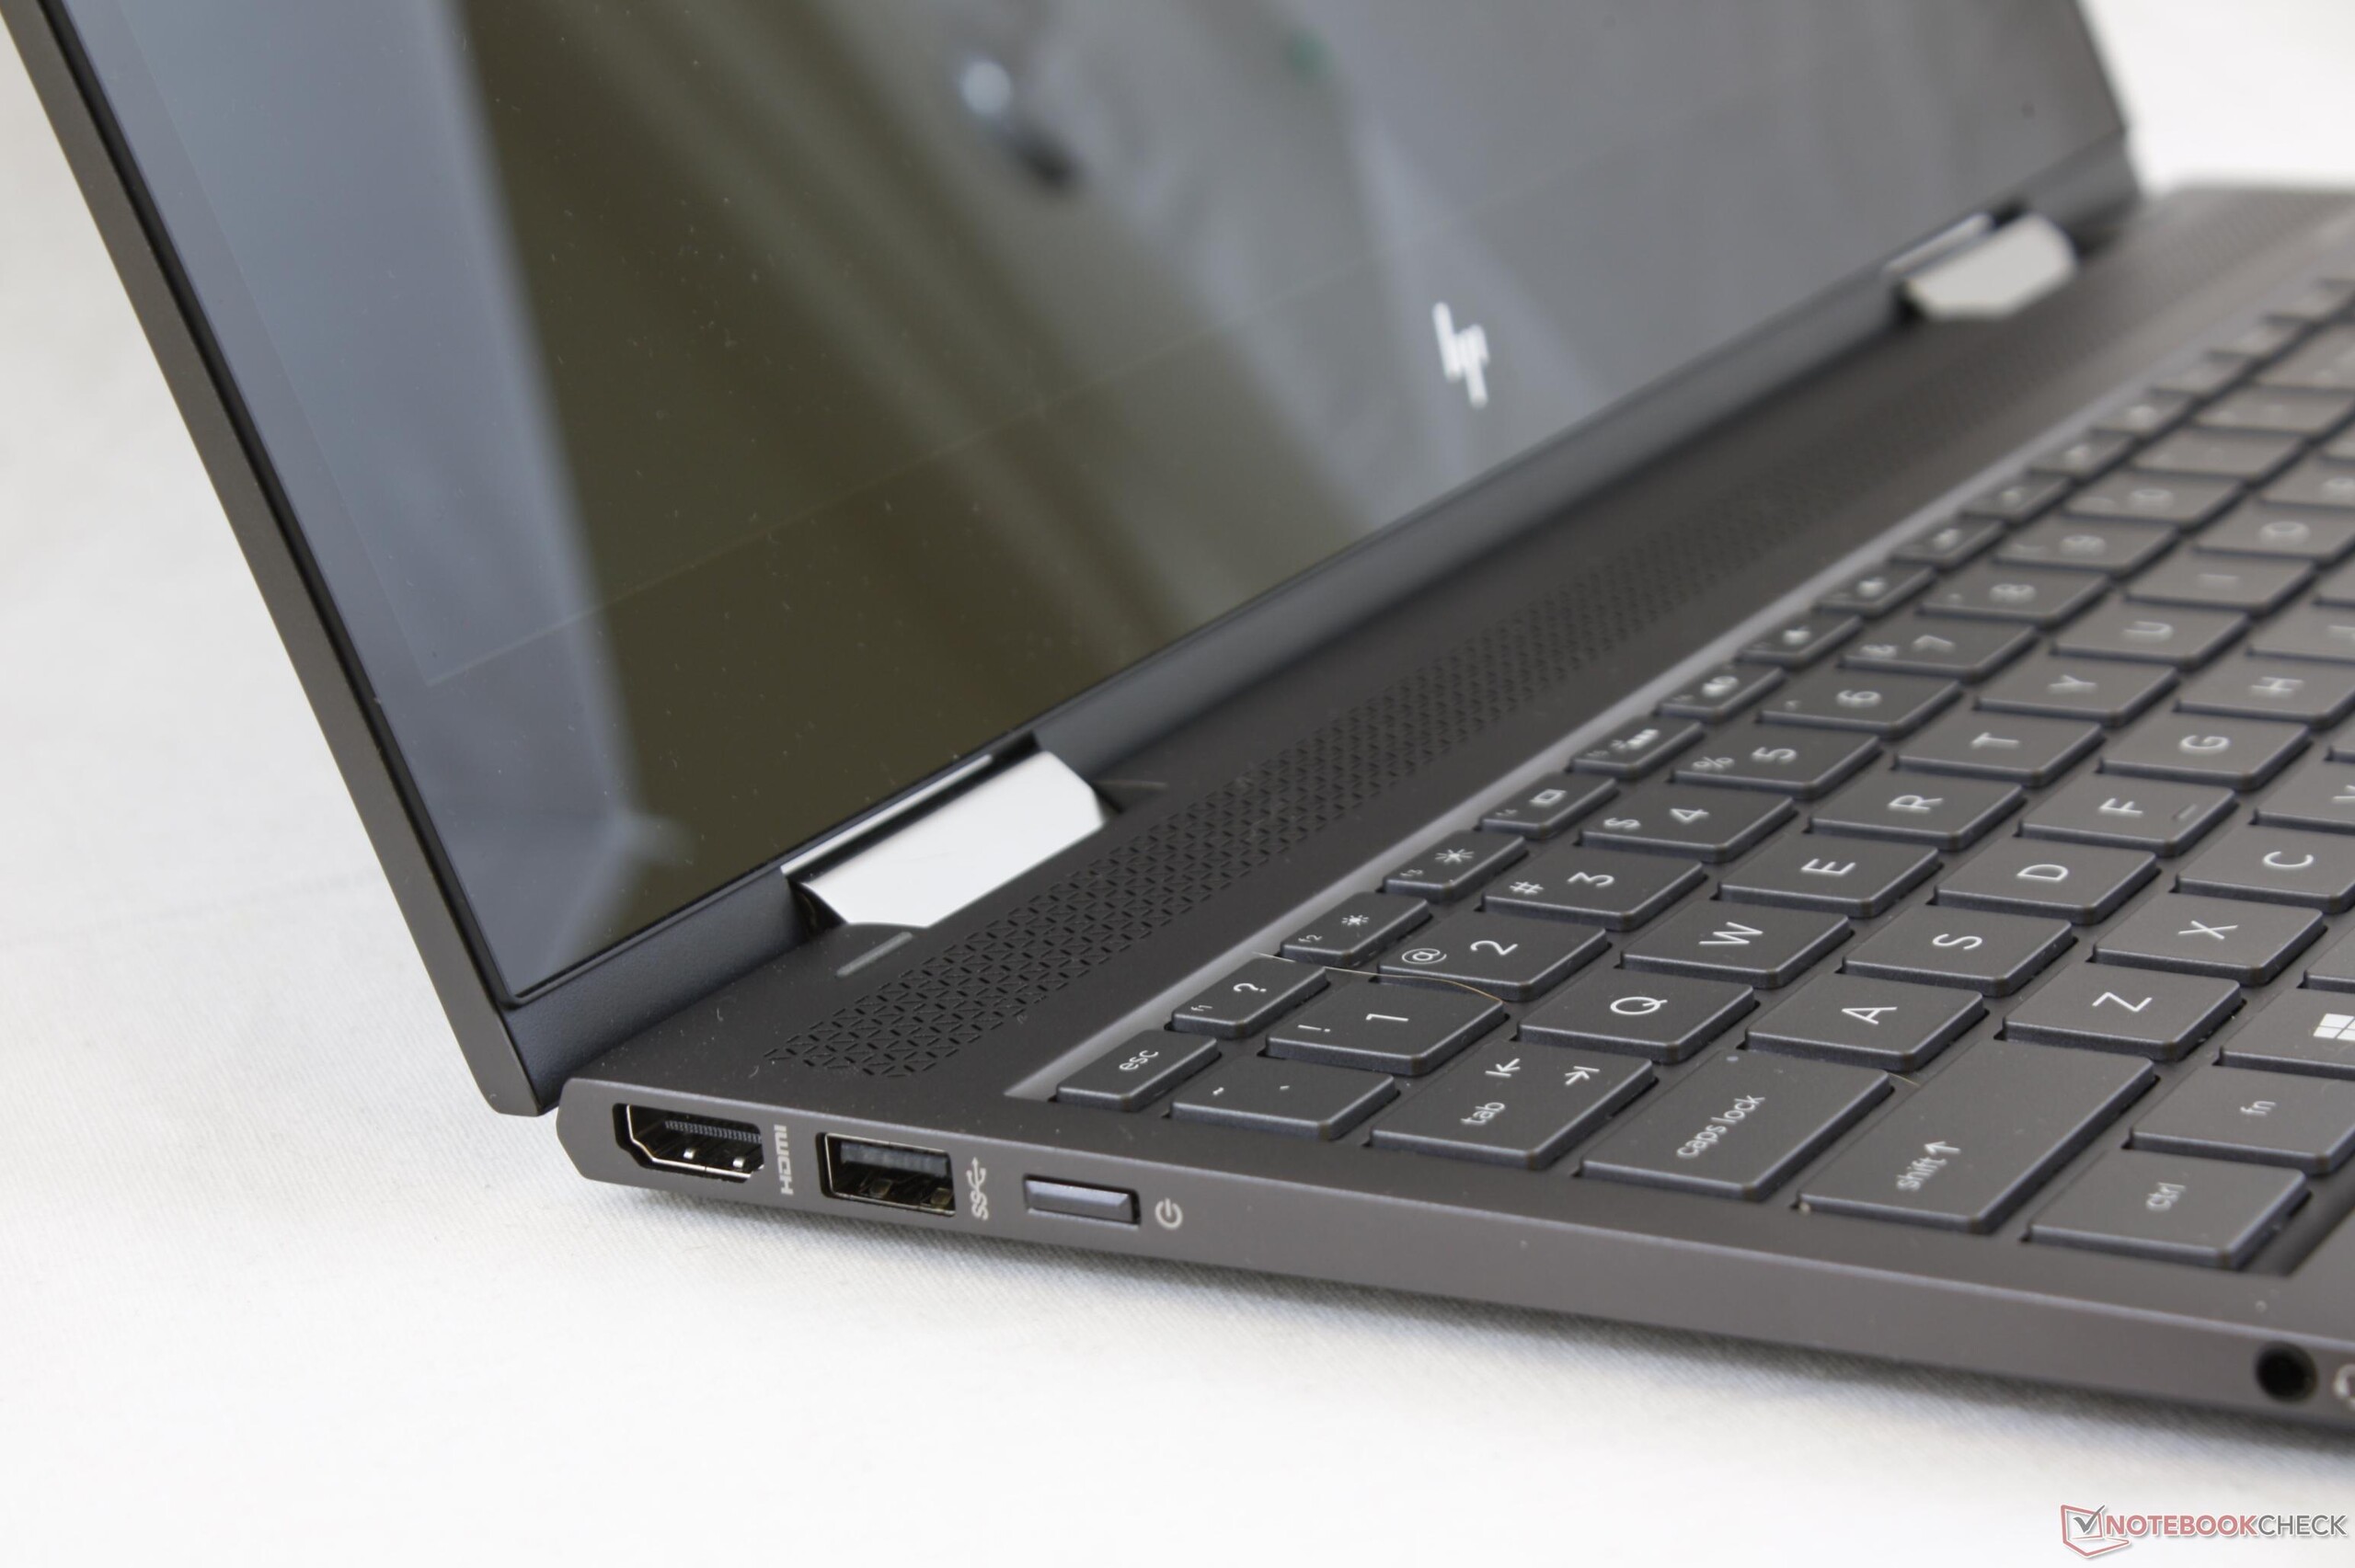
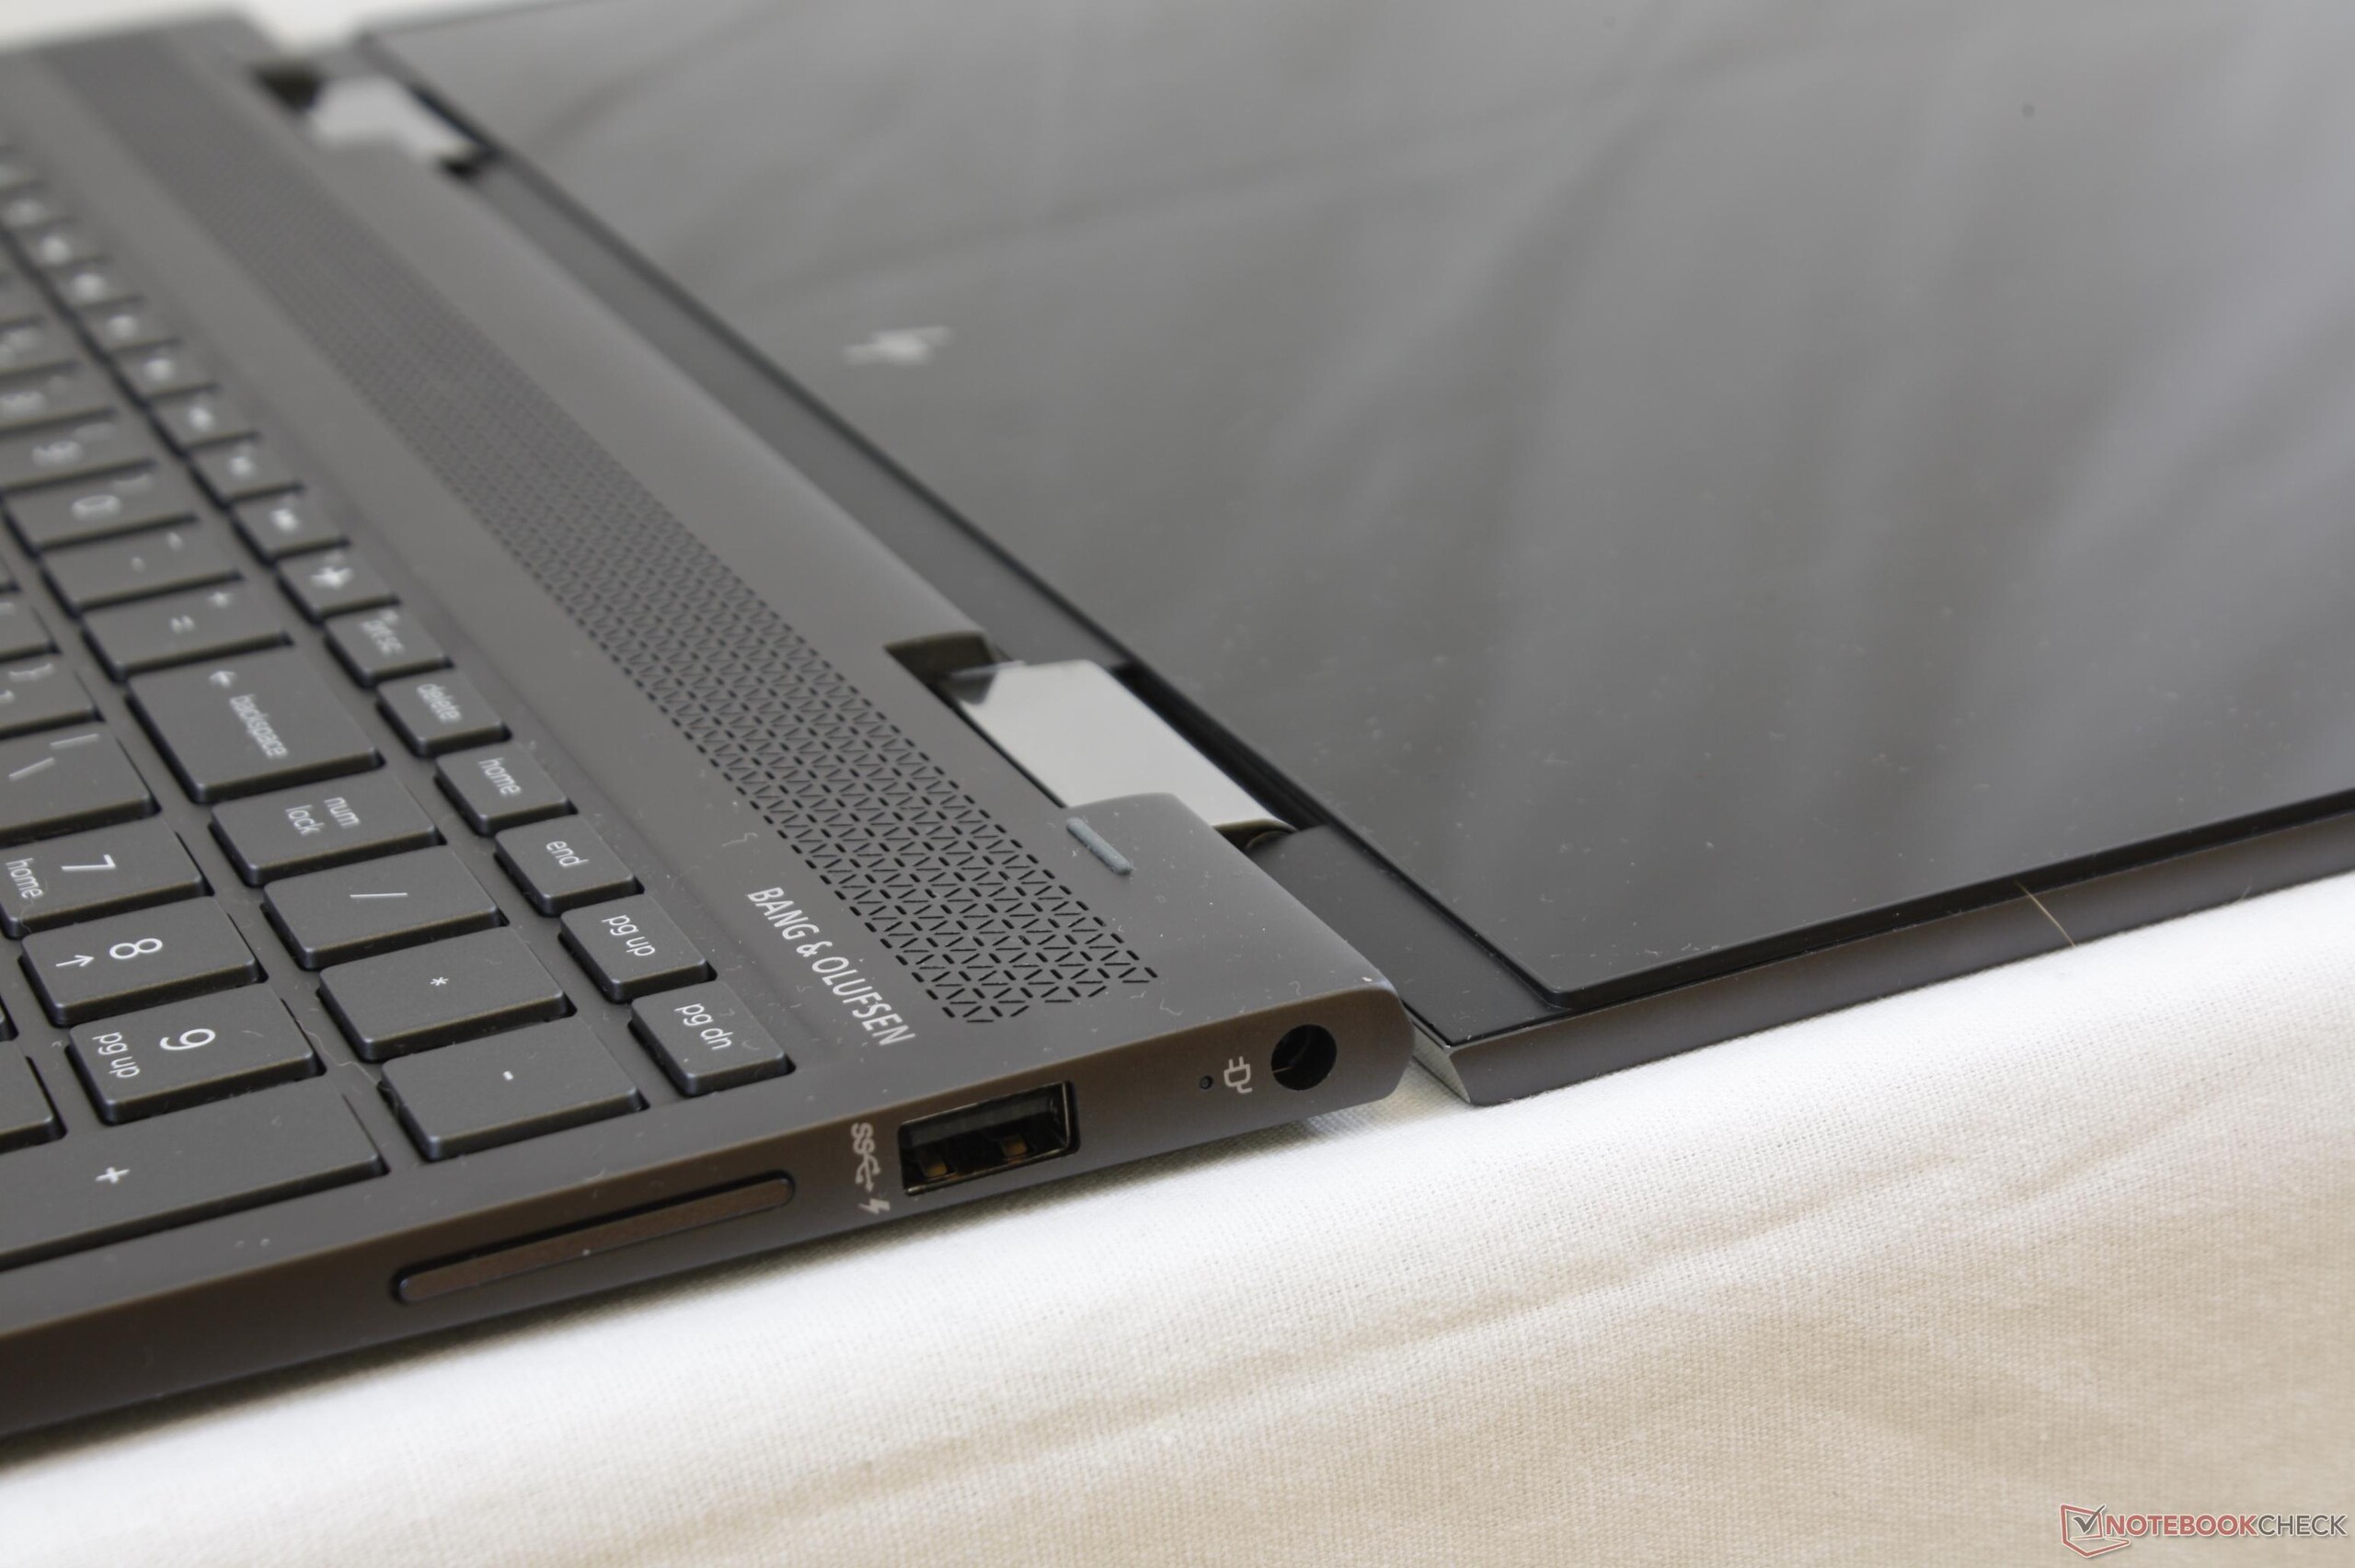
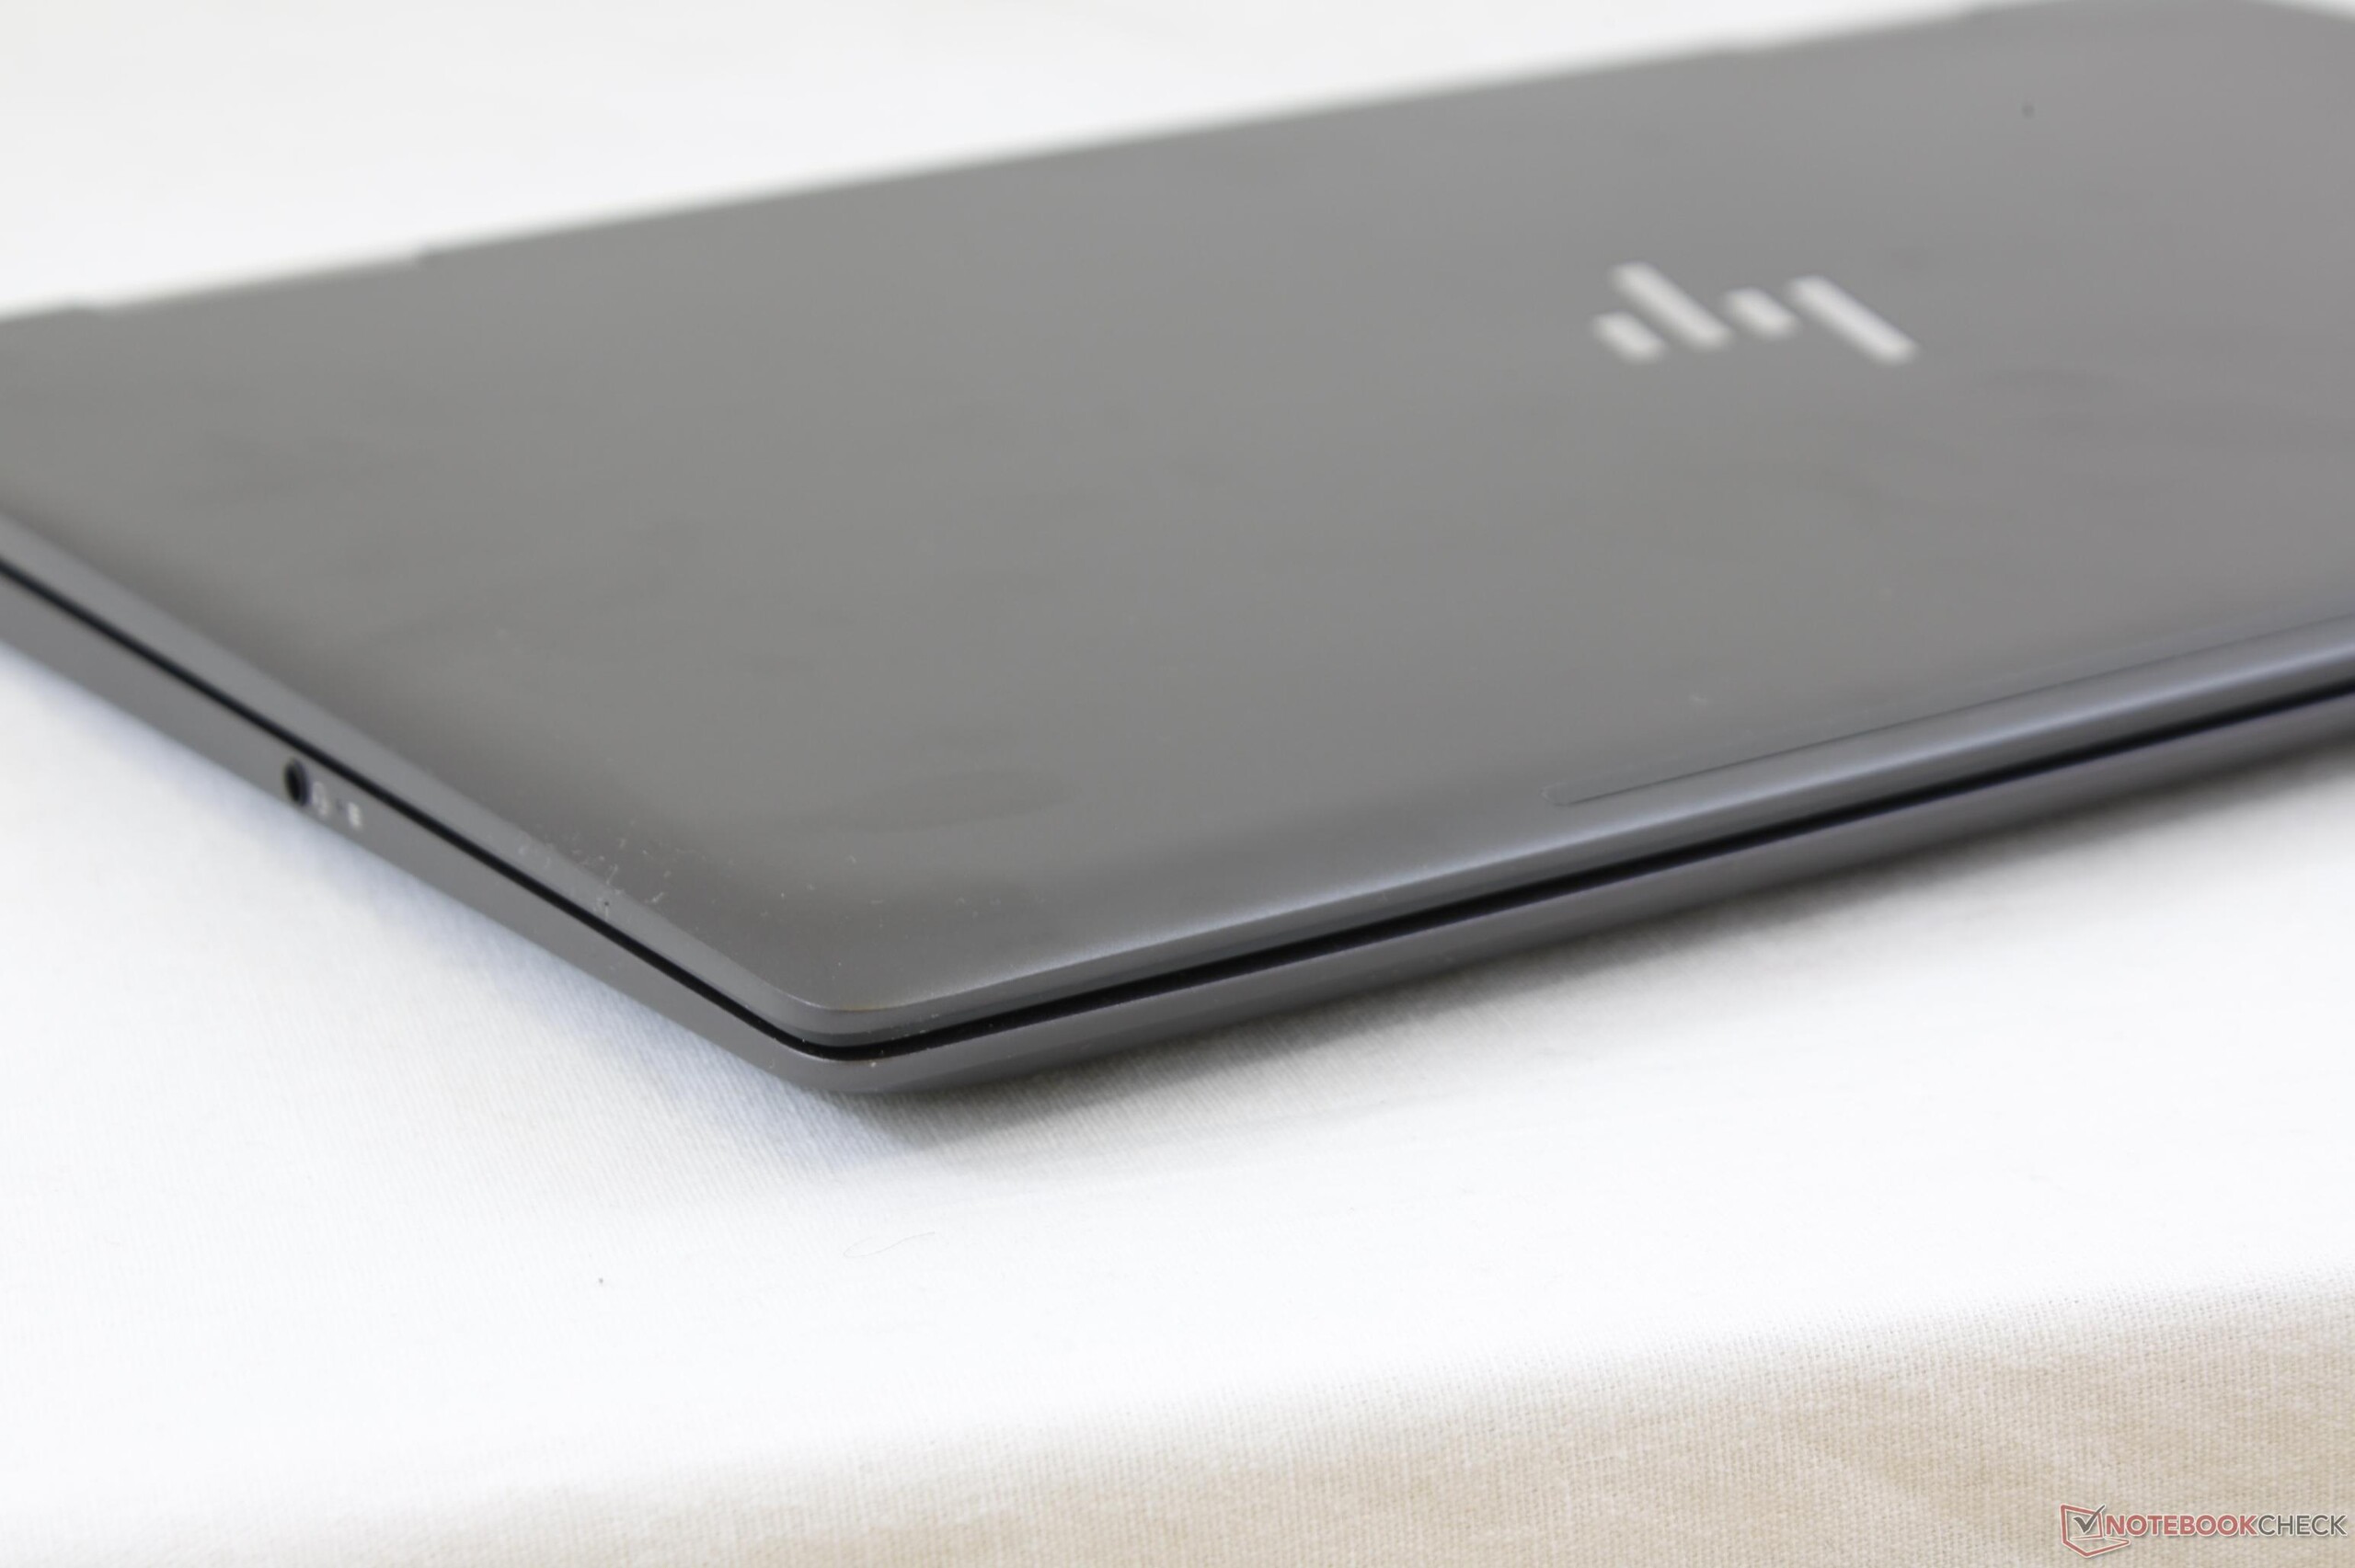
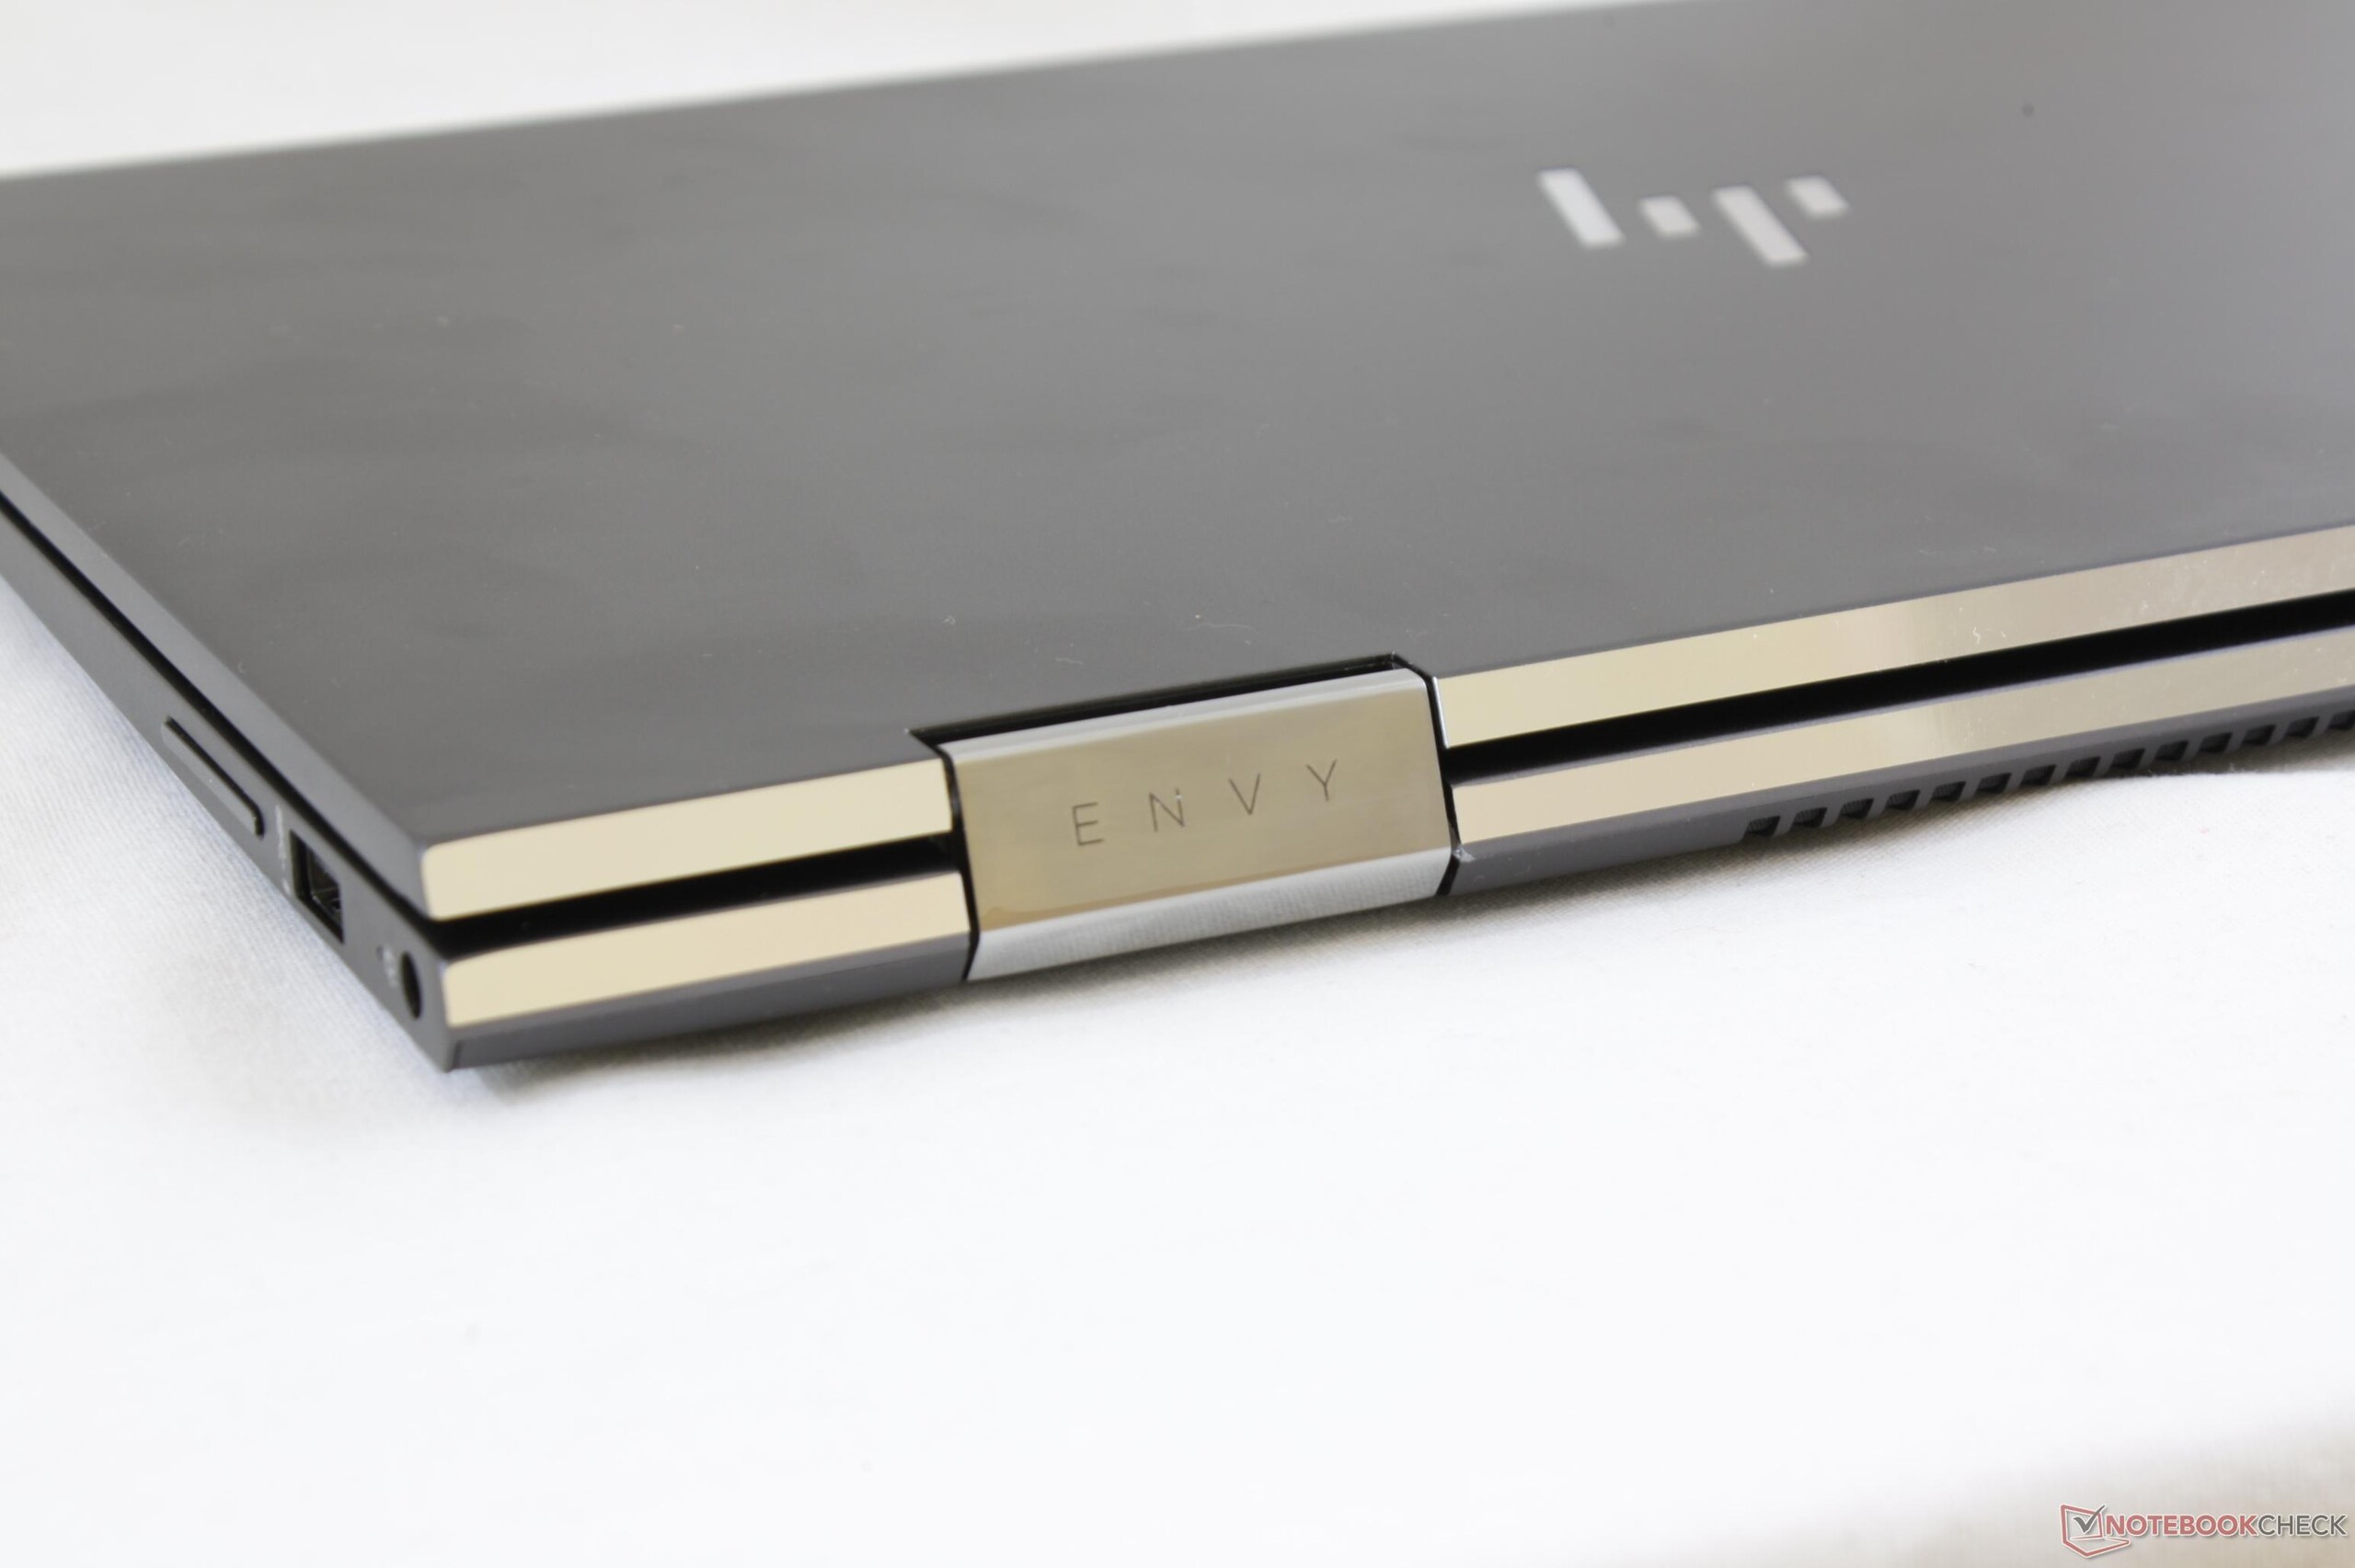
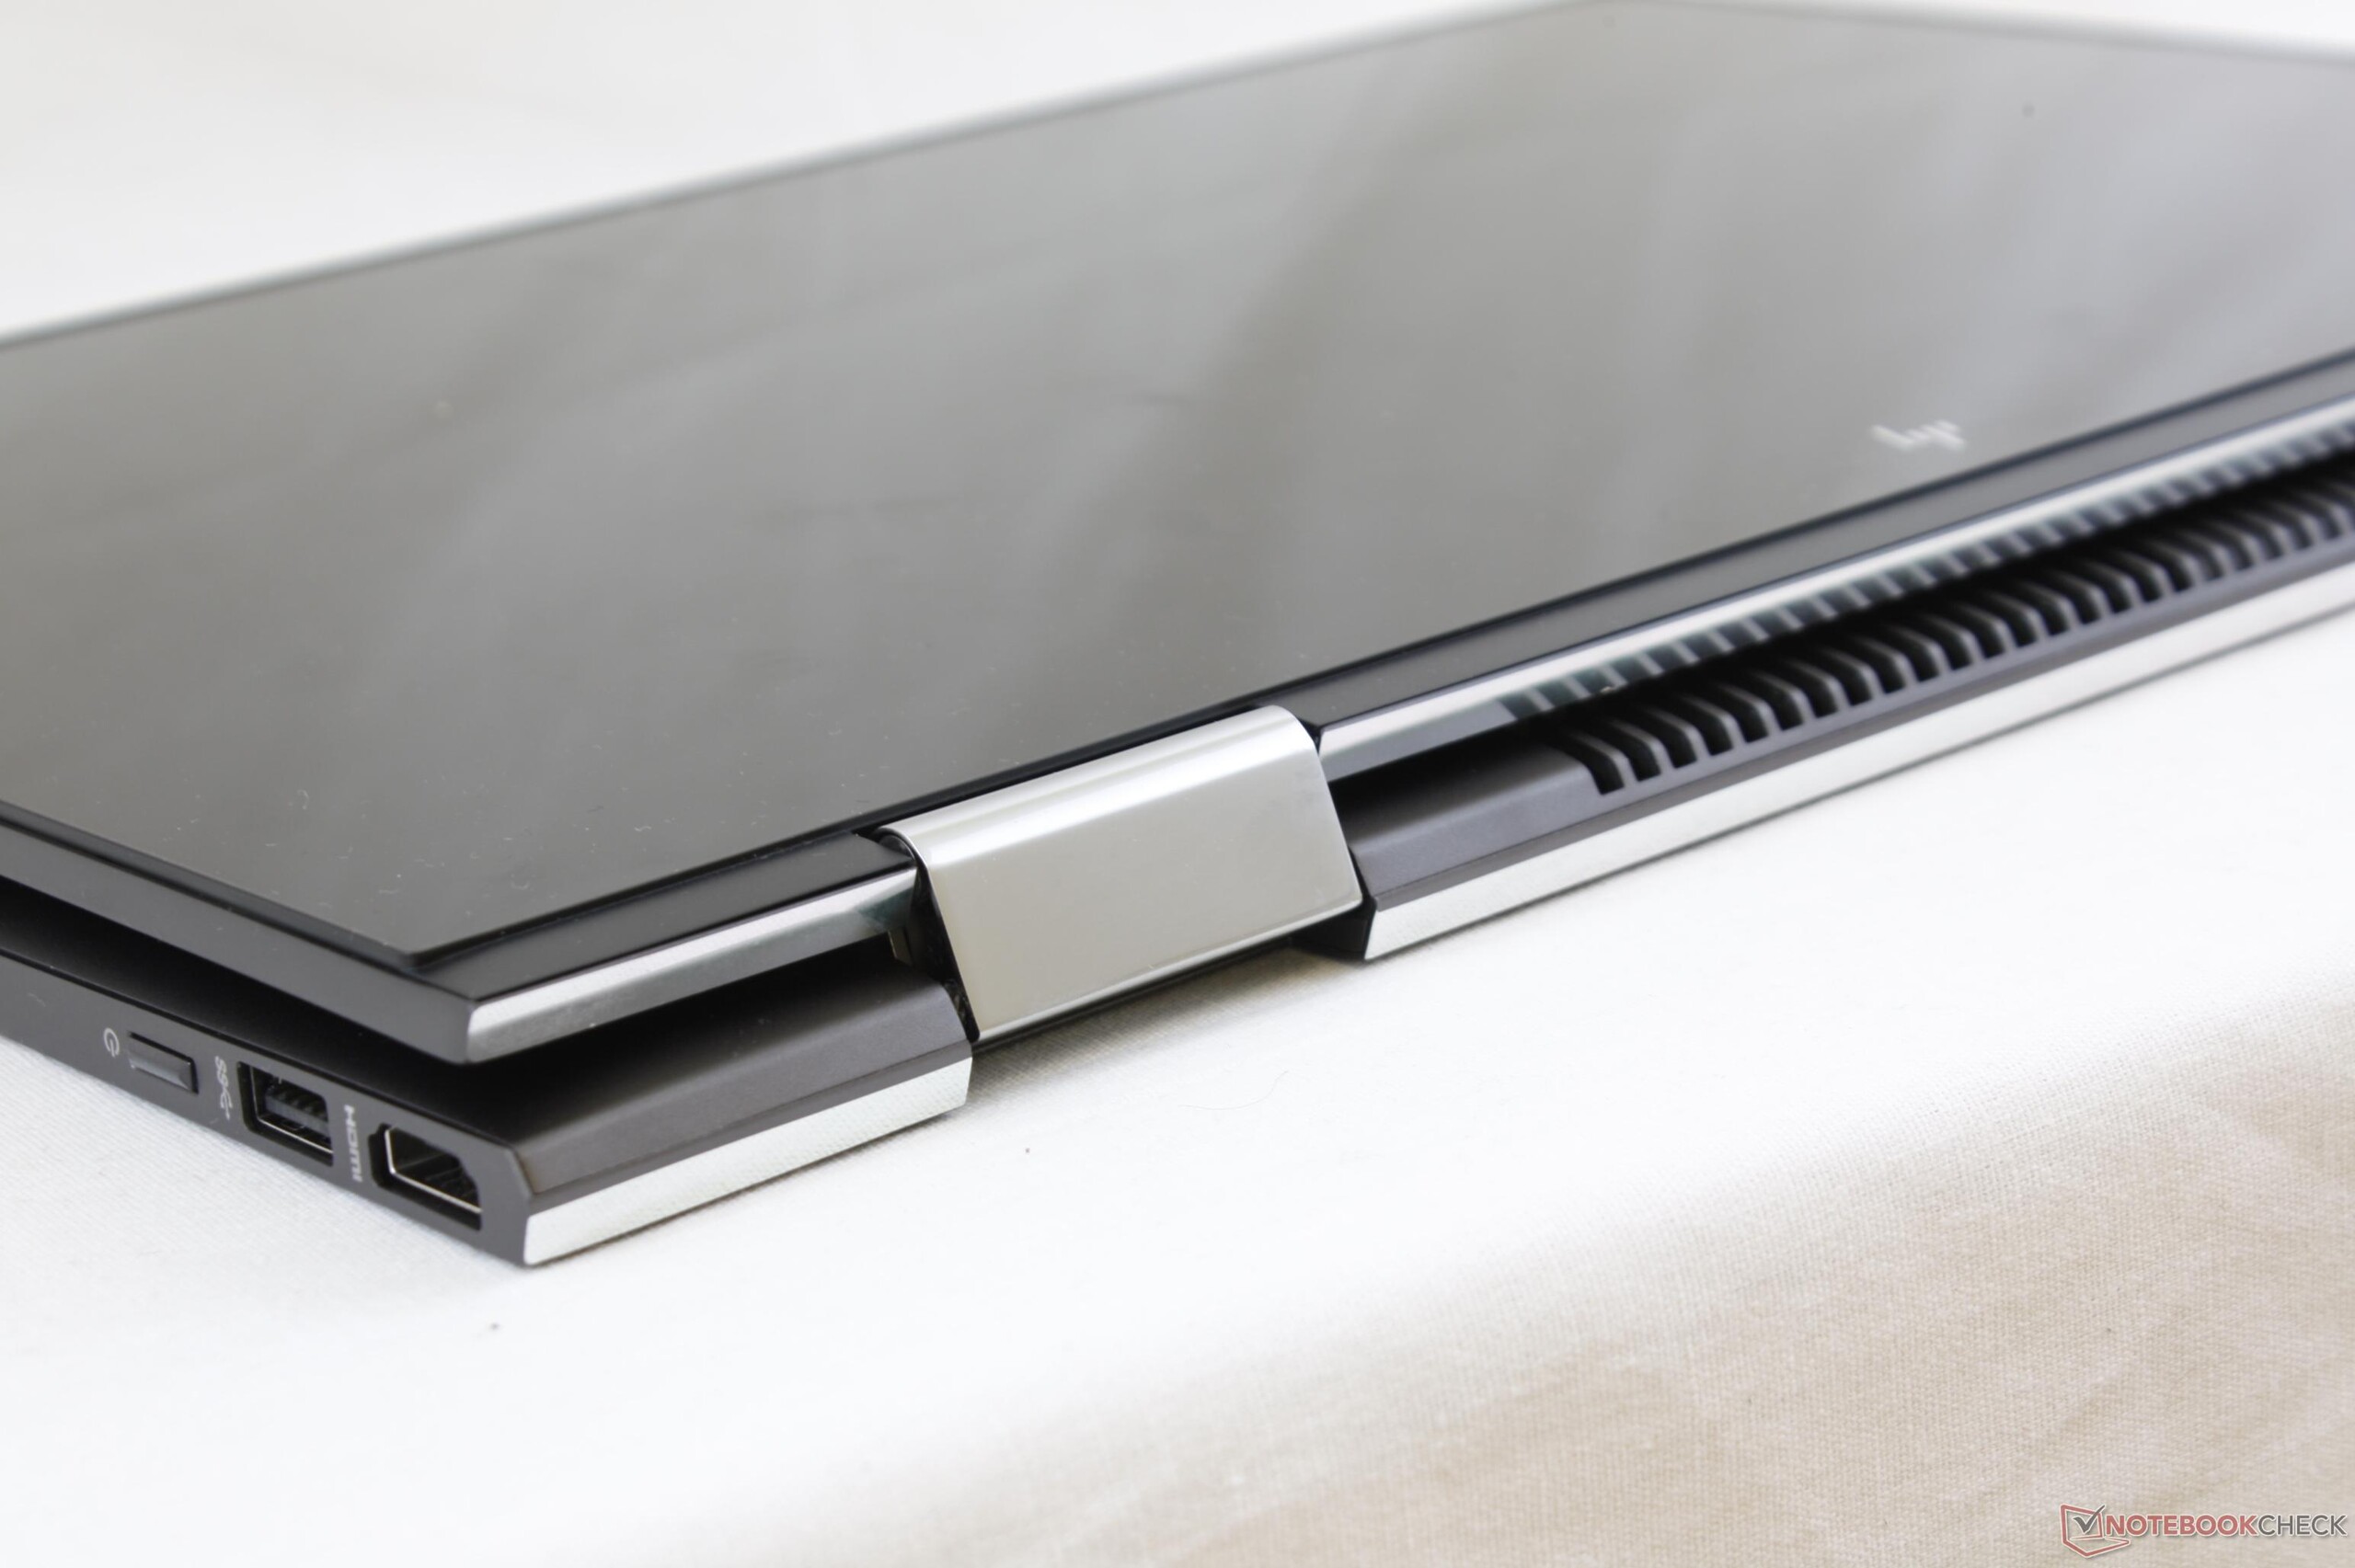
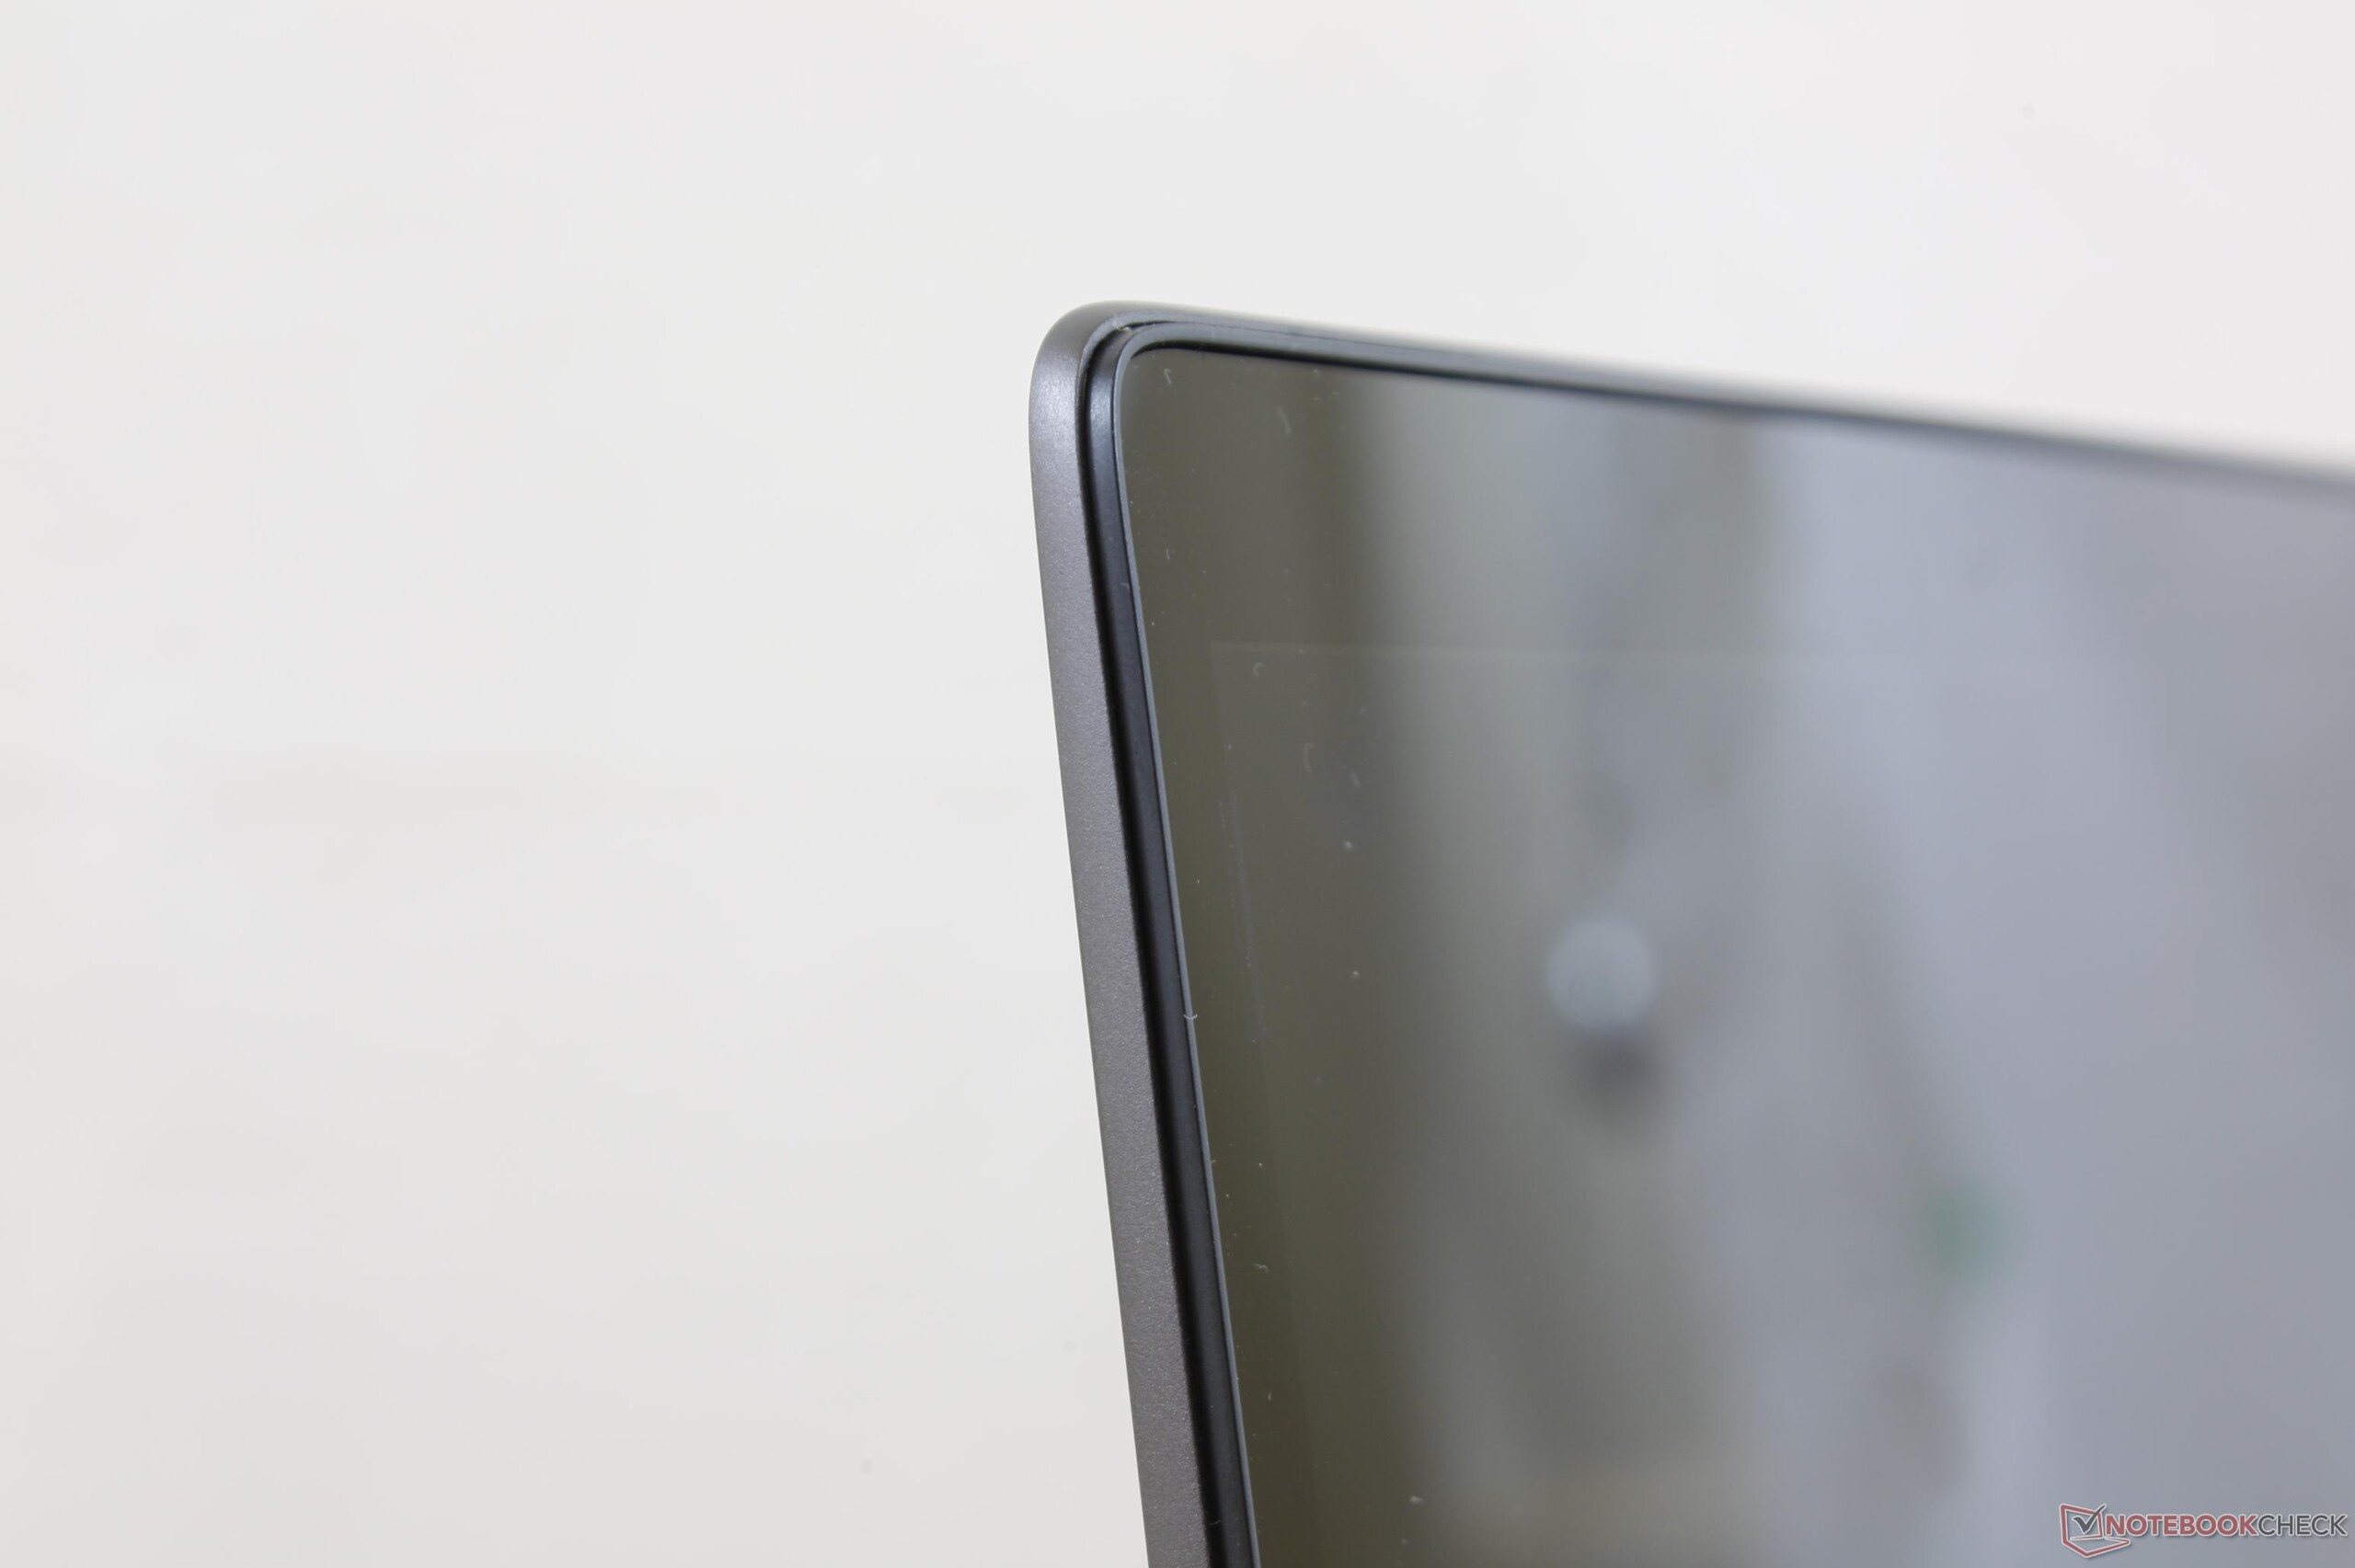
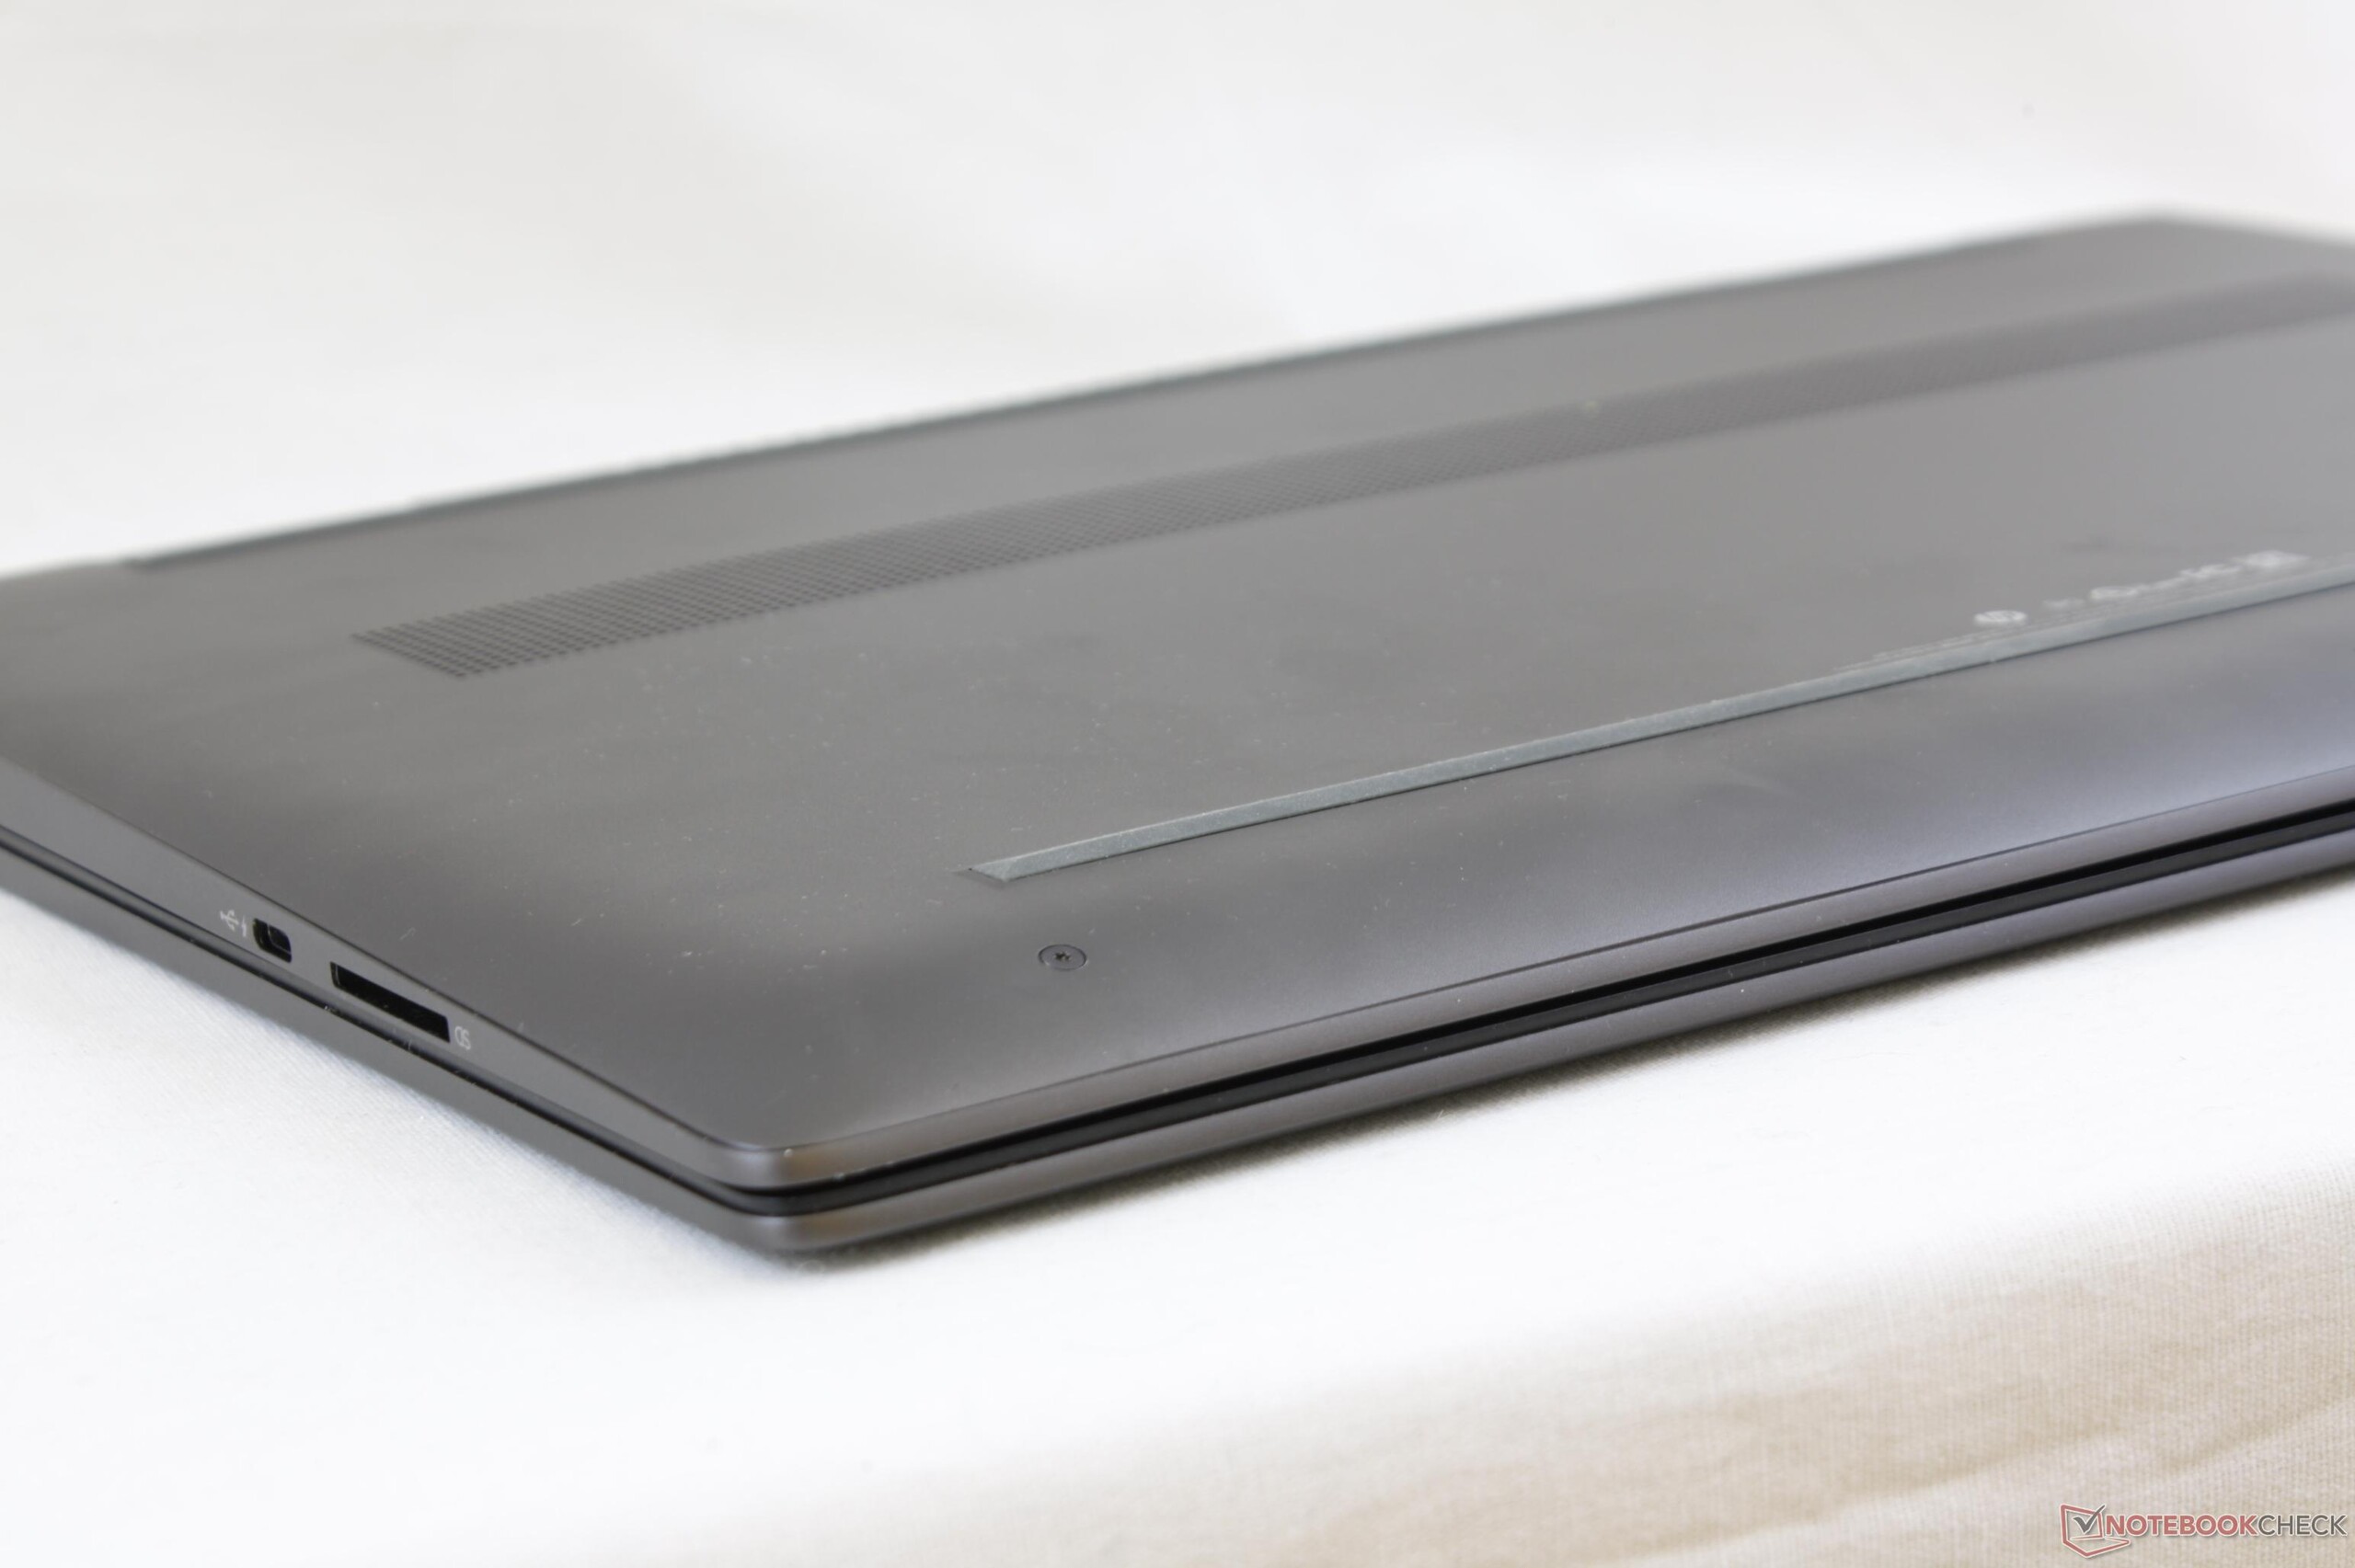
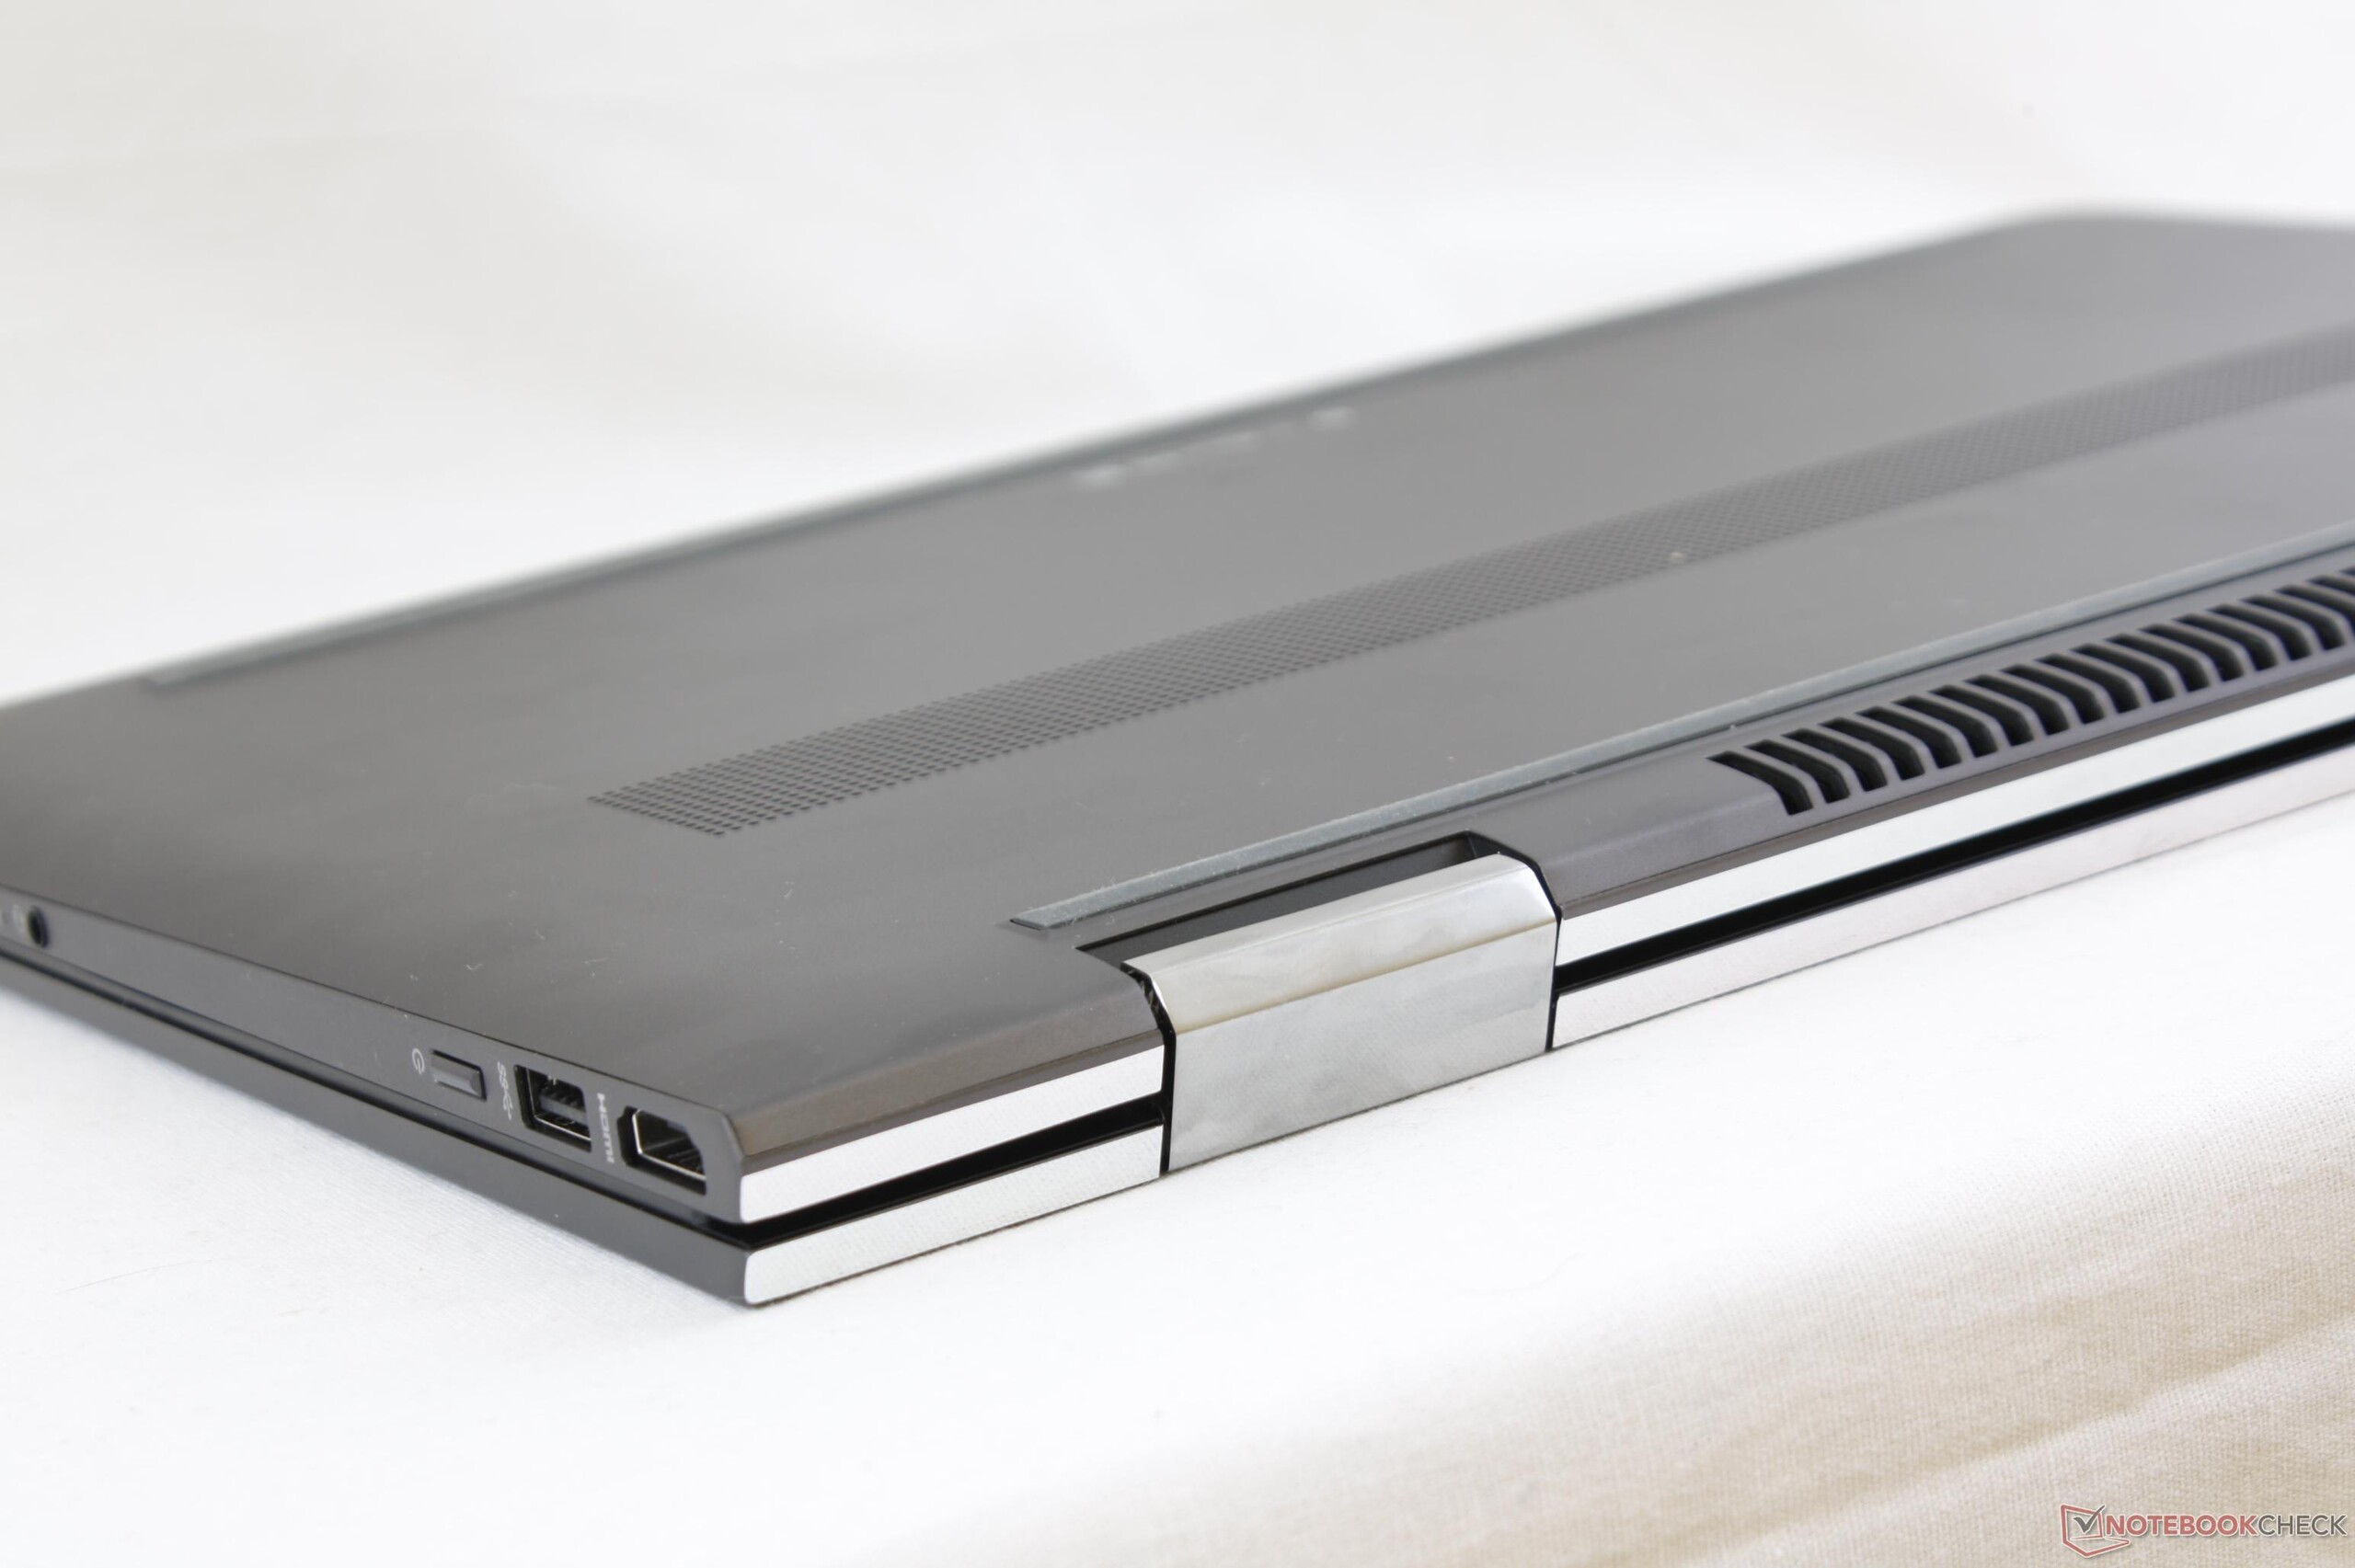
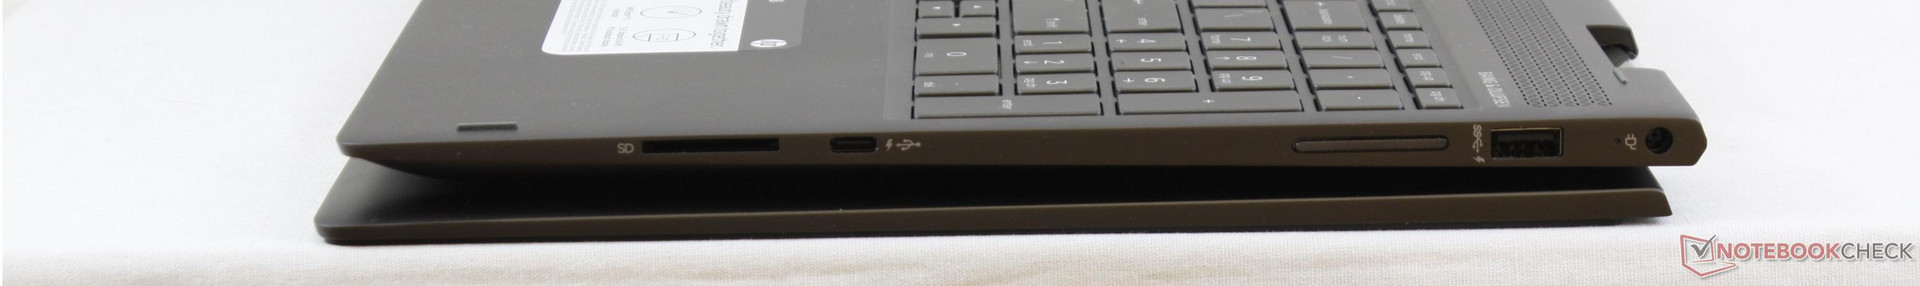
La seconda parte del giudizio riguarda il portatile HP nel complesso. Il produttore ha incorporato con successo una base sottile Spectre-class nel suo mainstream La linea Envy lentamente cede il passo. Oltre alla riprogettazione dello chassis, tuttavia, non è migliorato molto. Questa era l'occasione per HP per migliorare l'aspetto della serie Envy x360 15 ma troviamo lo stesso touchscreen scuro da 1080p, gamma di colore limitata, e PWM come nel modello dello scorso anno. Le casse, il lettore SD, la tastiera, il trackpad, le cerniere, il peso complessivo, e la ventola che pulsa non sono certo miglioramenti rispetto al modello 2016. Le principali migliorie sono il look più sottile e l'autonomia maggiore oltre alla porta USB Type-C Gen. 1.
La nuova piattaforma AMD Raven Ridge è un risultato interessante, ma peccato che la potenza sia limitata e i problemi di driver si fanno sentire. Non possiamo raccomandare questo sistema HDD-based AMD HP almeno fino a quando non si sistemano i problemi con la GPU.
Nota: si tratta di una recensione breve, con alcune sezioni non tradotte, per la versione integrale in inglese guardate qui.
HP Envy x360 15m-bq121dx
- 11/30/2017 v6 (old)
Allen Ngo
Price comparison
