Recensione breve del Convertibile HP Spectre x360 15t-bl100 (i7-8550U, MX150)

| SD Card Reader | |
| average JPG Copy Test (av. of 3 runs) | |
| HP Spectre x360 15t-bl100 | |
| Dell XPS 15 9560 (i7-7700HQ, UHD) | |
| HP Pavilion x360 15-bk102ng | |
| Dell Inspiron 15 5578-1777 2-in-1 | |
| maximum AS SSD Seq Read Test (1GB) | |
| Dell XPS 15 9560 (i7-7700HQ, UHD) | |
| HP Spectre x360 15t-bl100 | |
| HP Pavilion x360 15-bk102ng | |
| Dell Inspiron 15 5578-1777 2-in-1 | |
| |||||||||||||||||||||||||
Distribuzione della luminosità: 91 %
Al centro con la batteria: 338.7 cd/m²
Contrasto: 1210:1 (Nero: 0.28 cd/m²)
ΔE ColorChecker Calman: 4.9 | ∀{0.5-29.43 Ø4.73}
ΔE Greyscale Calman: 5.5 | ∀{0.09-98 Ø4.97}
86.92% sRGB (Argyll 1.6.3 3D)
63.5% AdobeRGB 1998 (Argyll 1.6.3 3D)
63.5% AdobeRGB 1998 (Argyll 3D)
86.9% sRGB (Argyll 3D)
66.6% Display P3 (Argyll 3D)
Gamma: 2.08
CCT: 7498 K
| HP Spectre x360 15t-bl100 BOE06C3, IPS, 15.6", 3840x2160 | Dell Inspiron 15 5578-1777 2-in-1 LG Philips (Dell 156WF7), IPS, 15.6", 1920x1080 | Lenovo Yoga 720-15IKB-80X7 Chi Mei CMN N156HCE-EN1, IPS, 15.6", 1920x1080 | HP Pavilion x360 15-bk102ng LG Philips, IPS, 15.6", 1920x1080 | Lenovo Yoga 920-13IKB-80Y7 AU Optronics B139HAN03.0, IPS, 13.9", 1920x1080 | HP Spectre x360 13-ac033dx LG Philips LGD054D, IPS, 13.3", 3840x2160 | |
|---|---|---|---|---|---|---|
| Display | -32% | 2% | -36% | 0% | 9% | |
| Display P3 Coverage (%) | 66.6 | 41.74 -37% | 65 -2% | 39.45 -41% | 62.5 -6% | 69.4 4% |
| sRGB Coverage (%) | 86.9 | 62.8 -28% | 90.8 4% | 59.2 -32% | 91.7 6% | 96.8 11% |
| AdobeRGB 1998 Coverage (%) | 63.5 | 43.13 -32% | 65.8 4% | 40.76 -36% | 64.1 1% | 71.1 12% |
| Response Times | -1% | 20% | -11% | -10% | -5% | |
| Response Time Grey 50% / Grey 80% * (ms) | 41.2 ? | 55 ? -33% | 29.6 ? 28% | 55 ? -33% | 46 ? -12% | 42 ? -2% |
| Response Time Black / White * (ms) | 29.6 ? | 20 ? 32% | 26.4 ? 11% | 26 ? 12% | 31.6 ? -7% | 32 ? -8% |
| PWM Frequency (Hz) | 1000 | 25510 ? | 50 ? | |||
| Screen | -10% | -5% | -34% | -18% | 14% | |
| Brightness middle (cd/m²) | 338.7 | 244 -28% | 300.9 -11% | 205 -39% | 297.9 -12% | 302.6 -11% |
| Brightness (cd/m²) | 325 | 242 -26% | 285 -12% | 191 -41% | 278 -14% | 282 -13% |
| Brightness Distribution (%) | 91 | 93 2% | 92 1% | 74 -19% | 81 -11% | 83 -9% |
| Black Level * (cd/m²) | 0.28 | 0.25 11% | 0.24 14% | 0.3 -7% | 0.44 -57% | 0.25 11% |
| Contrast (:1) | 1210 | 976 -19% | 1254 4% | 683 -44% | 677 -44% | 1210 0% |
| Colorchecker dE 2000 * | 4.9 | 4.94 -1% | 5 -2% | 7.2 -47% | 5.1 -4% | 2.4 51% |
| Colorchecker dE 2000 max. * | 8.7 | 7.3 16% | 10.2 -17% | 12.7 -46% | 11 -26% | 4.9 44% |
| Greyscale dE 2000 * | 5.5 | 4.93 10% | 7 -27% | 6.86 -25% | 6.7 -22% | 2.8 49% |
| Gamma | 2.08 106% | 2.7 81% | 2.34 94% | 2.27 97% | 2.9 76% | 2.2 100% |
| CCT | 7498 87% | 7401 88% | 6578 99% | 6983 93% | 6839 95% | 6333 103% |
| Color Space (Percent of AdobeRGB 1998) (%) | 63.5 | 40 -37% | 59 -7% | 38 -40% | 64.1 1% | 65.5 3% |
| Color Space (Percent of sRGB) (%) | 86.92 | 63 -28% | 90 4% | 59 -32% | 91.7 5% | 97.1 12% |
| Media totale (Programma / Settaggio) | -14% /
-13% | 6% /
-1% | -27% /
-31% | -9% /
-13% | 6% /
10% |
* ... Meglio usare valori piccoli
Tempi di risposta del Display
| ↔ Tempi di risposta dal Nero al Bianco | ||
|---|---|---|
| 29.6 ms ... aumenta ↗ e diminuisce ↘ combinato | ↗ 16.4 ms Incremento | 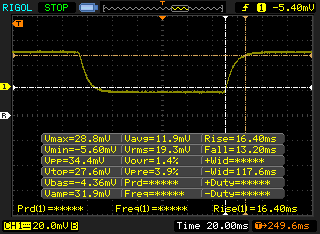 |
| ↘ 13.2 ms Calo | ||
| Lo schermo mostra tempi di risposta relativamente lenti nei nostri tests e potrebbe essere troppo lento per i gamers. In confronto, tutti i dispositivi di test variano da 0.1 (minimo) a 240 (massimo) ms. » 79 % di tutti i dispositivi è migliore. Questo significa che i tempi di risposta rilevati sono peggiori rispetto alla media di tutti i dispositivi testati (19.9 ms). | ||
| ↔ Tempo di risposta dal 50% Grigio all'80% Grigio | ||
| 41.2 ms ... aumenta ↗ e diminuisce ↘ combinato | ↗ 23.2 ms Incremento | 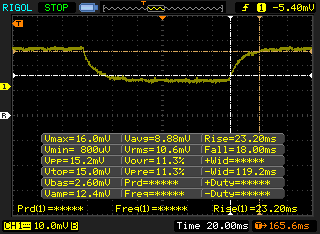 |
| ↘ 18 ms Calo | ||
| Lo schermo mostra tempi di risposta lenti nei nostri tests e sarà insoddisfacente per i gamers. In confronto, tutti i dispositivi di test variano da 0.165 (minimo) a 636 (massimo) ms. » 66 % di tutti i dispositivi è migliore. Questo significa che i tempi di risposta rilevati sono peggiori rispetto alla media di tutti i dispositivi testati (31.1 ms). | ||
Sfarfallio dello schermo / PWM (Pulse-Width Modulation)
| flickering dello schermo / PWM rilevato | 1000 Hz | 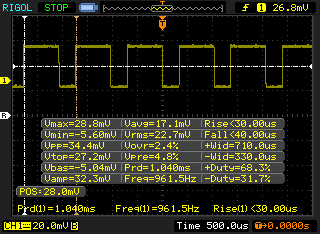 | |
Il display sfarfalla a 1000 Hz (Probabilmente a causa dell'uso di PWM) . La frequenza di 1000 Hz è abbastanza alta, quindi la maggioranza degli utenti sensibili al PWM non dovrebbero notare alcun flickering. In confronto: 52 % di tutti i dispositivi testati non utilizza PWM per ridurre la luminosita' del display. Se è rilevato PWM, una media di 7798 (minimo: 5 - massimo: 343500) Hz è stata rilevata. | |||
| wPrime 2.10 - 1024m | |
| HP Spectre x360 15-bl002xx | |
| HP Spectre x360 13-ac033dx | |
| HP Spectre x360 15t-bl100 | |
| Lenovo Yoga 720-15IKB-80X7 | |
| Dell XPS 15 9560 (i7-7700HQ, UHD) | |
* ... Meglio usare valori piccoli
| PCMark 8 Home Score Accelerated v2 | 3457 punti | |
| PCMark 8 Creative Score Accelerated v2 | 5083 punti | |
| PCMark 8 Work Score Accelerated v2 | 4217 punti | |
| PCMark 10 Score | 3673 punti | |
Aiuto | ||
| HP Spectre x360 15t-bl100 Samsung PM961 NVMe MZVLW512HMJP | Dell Inspiron 15 5578-1777 2-in-1 SanDisk X400 256GB, SATA (SD8SB8U-256G) | Lenovo Yoga 720-15IKB-80X7 Samsung PM961 MZVLW256HEHP | Lenovo Yoga 920-13IKB-80Y7 Samsung PM961 MZVLW256HEHP | HP Spectre x360 15-bl002xx Toshiba XG4 NVMe (THNSN5512GPUK) | HP Spectre x360 13-ac033dx Samsung PM961 NVMe MZVLW512HMJP | |
|---|---|---|---|---|---|---|
| AS SSD | -96% | -1505% | -27% | -649% | -20% | |
| Copy Game MB/s (MB/s) | 1134 | 150 -87% | 319.2 -72% | 727 -36% | 1123 -1% | |
| Copy Program MB/s (MB/s) | 534 | 77.3 -86% | 463.3 -13% | 475.1 -11% | 466.7 -13% | |
| Copy ISO MB/s (MB/s) | 1936 | 325.7 -83% | 1341 -31% | 1126 -42% | 1672 -14% | |
| Score Total (Points) | 3781 | 920 -76% | 942 -75% | 2536 -33% | 426 -89% | 2219 -41% |
| Score Write (Points) | 1556 | 241 -85% | 48 -97% | 608 -61% | 20 -99% | 832 -47% |
| Score Read (Points) | 1493 | 443 -70% | 646 -57% | 1316 -12% | 307 -79% | 945 -37% |
| Access Time Write * (ms) | 0.026 | 0.083 -219% | 4.15 -15862% | 0.028 -8% | 2.179 -8281% | 0.031 -19% |
| Access Time Read * (ms) | 0.04 | 0.128 -220% | 0.08 -100% | 0.044 -10% | 0.044 -10% | 0.036 10% |
| 4K-64 Write (MB/s) | 1262 | 144.6 -89% | 15.3 -99% | 391.3 -69% | 2.08 -100% | 566 -55% |
| 4K-64 Read (MB/s) | 1206 | 371.1 -69% | 371.6 -69% | 1039 -14% | 113.7 -91% | 641 -47% |
| 4K Write (MB/s) | 141.1 | 50.4 -64% | 1.2 -99% | 128.1 -9% | 1.91 -99% | 118.5 -16% |
| 4K Read (MB/s) | 51.9 | 27.09 -48% | 47.1 -9% | 48.46 -7% | 35 -33% | 48.18 -7% |
| Seq Write (MB/s) | 1530 | 460.3 -70% | 311.7 -80% | 885 -42% | 160.4 -90% | 1476 -4% |
| Seq Read (MB/s) | 2342 | 451 -81% | 2277 -3% | 2282 -3% | 1599 -32% | 2556 9% |
* ... Meglio usare valori piccoli

| 3DMark 11 Performance | 4825 punti | |
| 3DMark Cloud Gate Standard Score | 13664 punti | |
| 3DMark Fire Strike Score | 3217 punti | |
Aiuto | ||
| Rise of the Tomb Raider | |
| 1024x768 Lowest Preset (ordina per valore) | |
| HP Spectre x360 15t-bl100 | |
| Acer Aspire 5 A517-51G-80L | |
| Lenovo Yoga 920-13IKB-80Y7 | |
| HP Spectre x360 15-bl002xx | |
| 1366x768 Medium Preset AF:2x (ordina per valore) | |
| HP Spectre x360 15t-bl100 | |
| Acer Aspire 5 A517-51G-80L | |
| Lenovo Yoga 920-13IKB-80Y7 | |
| HP Spectre x360 15-bl002xx | |
| 1920x1080 High Preset AA:FX AF:4x (ordina per valore) | |
| HP Spectre x360 15t-bl100 | |
| Acer Aspire 5 A517-51G-80L | |
| Lenovo Yoga 920-13IKB-80Y7 | |
| HP Spectre x360 15-bl002xx | |
| 1920x1080 Very High Preset AA:FX AF:16x (ordina per valore) | |
| HP Spectre x360 15t-bl100 | |
| Acer Aspire 5 A517-51G-80L | |
| Lenovo Yoga 720-15IKB-80X7 | |
| HP Spectre x360 15-bl002xx | |
| The Witcher 3 | |
| 1024x768 Low Graphics & Postprocessing (ordina per valore) | |
| HP Spectre x360 15t-bl100 | |
| Dell XPS 13 9360 FHD i7 Iris | |
| 1366x768 Medium Graphics & Postprocessing (ordina per valore) | |
| HP Spectre x360 15t-bl100 | |
| 1920x1080 High Graphics & Postprocessing (Nvidia HairWorks Off) (ordina per valore) | |
| HP Spectre x360 15t-bl100 | |
| 1920x1080 Ultra Graphics & Postprocessing (HBAO+) (ordina per valore) | |
| HP Spectre x360 15t-bl100 | |
| Lenovo Yoga 720-15IKB-80X7 | |
| basso | medio | alto | ultra | |
|---|---|---|---|---|
| BioShock Infinite (2013) | 201 | 112.9 | 94.3 | 34.8 |
| The Witcher 3 (2015) | 68.3 | 39.5 | 22.8 | 12.8 |
| Rise of the Tomb Raider (2016) | 72.3 | 40.8 | 23.1 | 17.6 |
Rumorosità
| Idle |
| 28.4 / 28.4 / 28.4 dB(A) |
| Sotto carico |
| 41.6 / 41.6 dB(A) |
 | ||
30 dB silenzioso 40 dB(A) udibile 50 dB(A) rumoroso |
||
min: | ||
| HP Spectre x360 15t-bl100 GeForce MX150, i5-8550U, Samsung PM961 NVMe MZVLW512HMJP | Dell Inspiron 15 5578-1777 2-in-1 HD Graphics 620, i5-7200U, SanDisk X400 256GB, SATA (SD8SB8U-256G) | Lenovo Yoga 720-15IKB-80X7 GeForce GTX 1050 Mobile, i7-7700HQ, Samsung PM961 MZVLW256HEHP | Lenovo Yoga 920-13IKB-80Y7 UHD Graphics 620, i5-8550U, Samsung PM961 MZVLW256HEHP | HP Spectre x360 15-bl002xx GeForce 940MX, i7-7500U, Toshiba XG4 NVMe (THNSN5512GPUK) | HP Pavilion x360 15-bk102ng HD Graphics 620, i5-7200U, WDC Slim WD10SPCX-21KHST0 | HP Spectre x360 13-ac033dx HD Graphics 620, i7-7500U, Samsung PM961 NVMe MZVLW512HMJP | |
|---|---|---|---|---|---|---|---|
| Noise | 1% | -0% | 5% | -6% | -3% | -5% | |
| off /ambiente * (dB) | 28.4 | 30.6 -8% | 28.2 1% | 28 1% | 28.5 -0% | 28.7 -1% | |
| Idle Minimum * (dB) | 28.4 | 30.4 -7% | 28.2 1% | 28 1% | 28.5 -0% | 31.7 -12% | 28.7 -1% |
| Idle Average * (dB) | 28.4 | 30.4 -7% | 28.2 1% | 28.8 -1% | 28.5 -0% | 31.7 -12% | 34.2 -20% |
| Idle Maximum * (dB) | 28.4 | 30.4 -7% | 28.2 1% | 30.3 -7% | 36.3 -28% | 31.7 -12% | 35.8 -26% |
| Load Average * (dB) | 41.6 | 32.3 22% | 39 6% | 34.5 17% | 42.7 -3% | 38.8 7% | 35.8 14% |
| Witcher 3 ultra * (dB) | 36.1 | ||||||
| Load Maximum * (dB) | 41.6 | 35.2 15% | 46.3 -11% | 34.3 18% | 42.7 -3% | 36.8 12% | 39.6 5% |
* ... Meglio usare valori piccoli
(-) La temperatura massima sul lato superiore è di 49.2 °C / 121 F, rispetto alla media di 36.8 °C / 98 F, che varia da 21 a 71 °C per questa classe Multimedia.
(-) Il lato inferiore si riscalda fino ad un massimo di 52 °C / 126 F, rispetto alla media di 39.1 °C / 102 F
(+) In idle, la temperatura media del lato superiore è di 23.2 °C / 74 F, rispetto alla media deld ispositivo di 31.3 °C / 88 F.
(-) Riproducendo The Witcher 3, la temperatura media per il lato superiore e' di 38.6 °C / 101 F, rispetto alla media del dispositivo di 31.3 °C / 88 F.
(+) I poggiapolsi e il touchpad raggiungono la temperatura massima della pelle (34.2 °C / 93.6 F) e quindi non sono caldi.
(-) La temperatura media della zona del palmo della mano di dispositivi simili e'stata di 28.7 °C / 83.7 F (-5.5 °C / -9.9 F).
HP Spectre x360 15t-bl100 analisi audio
(-) | altoparlanti non molto potenti (66.3 dB)
Bassi 100 - 315 Hz
(±) | bassi ridotti - in media 14% inferiori alla media
(±) | la linearità dei bassi è media (14.7% delta rispetto alla precedente frequenza)
Medi 400 - 2000 Hz
(+) | medi bilanciati - solo only 3.7% rispetto alla media
(+) | medi lineari (4.5% delta rispetto alla precedente frequenza)
Alti 2 - 16 kHz
(+) | Alti bilanciati - appena 2.8% dalla media
(±) | la linearità degli alti è media (7% delta rispetto alla precedente frequenza)
Nel complesso 100 - 16.000 Hz
(±) | la linearità complessiva del suono è media (19.5% di differenza rispetto alla media
Rispetto alla stessa classe
» 64% di tutti i dispositivi testati in questa classe è stato migliore, 7% simile, 29% peggiore
» Il migliore ha avuto un delta di 5%, medio di 17%, peggiore di 45%
Rispetto a tutti i dispositivi testati
» 48% di tutti i dispositivi testati in questa classe è stato migliore, 7% similare, 44% peggiore
» Il migliore ha avuto un delta di 4%, medio di 24%, peggiore di 134%
Apple MacBook 12 (Early 2016) 1.1 GHz analisi audio
(+) | gli altoparlanti sono relativamente potenti (83.6 dB)
Bassi 100 - 315 Hz
(±) | bassi ridotti - in media 11.3% inferiori alla media
(±) | la linearità dei bassi è media (14.2% delta rispetto alla precedente frequenza)
Medi 400 - 2000 Hz
(+) | medi bilanciati - solo only 2.4% rispetto alla media
(+) | medi lineari (5.5% delta rispetto alla precedente frequenza)
Alti 2 - 16 kHz
(+) | Alti bilanciati - appena 2% dalla media
(+) | alti lineari (4.5% delta rispetto alla precedente frequenza)
Nel complesso 100 - 16.000 Hz
(+) | suono nel complesso lineare (10.2% differenza dalla media)
Rispetto alla stessa classe
» 7% di tutti i dispositivi testati in questa classe è stato migliore, 2% simile, 91% peggiore
» Il migliore ha avuto un delta di 5%, medio di 18%, peggiore di 53%
Rispetto a tutti i dispositivi testati
» 5% di tutti i dispositivi testati in questa classe è stato migliore, 1% similare, 94% peggiore
» Il migliore ha avuto un delta di 4%, medio di 24%, peggiore di 134%
| Off / Standby | |
| Idle | |
| Sotto carico |
|
Leggenda:
min: | |
| HP Spectre x360 15t-bl100 i5-8550U, GeForce MX150, Samsung PM961 NVMe MZVLW512HMJP, IPS, 3840x2160, 15.6" | Dell Inspiron 15 5578-1777 2-in-1 i5-7200U, HD Graphics 620, SanDisk X400 256GB, SATA (SD8SB8U-256G), IPS, 1920x1080, 15.6" | Lenovo Yoga 720-15IKB-80X7 i7-7700HQ, GeForce GTX 1050 Mobile, Samsung PM961 MZVLW256HEHP, IPS, 1920x1080, 15.6" | HP Spectre x360 15-bl002xx i7-7500U, GeForce 940MX, Toshiba XG4 NVMe (THNSN5512GPUK), IPS, 3840x2160, 15.6" | HP Pavilion x360 15-bk102ng i5-7200U, HD Graphics 620, WDC Slim WD10SPCX-21KHST0, IPS, 1920x1080, 15.6" | Lenovo Yoga 920-13IKB-80Y7 i5-8550U, UHD Graphics 620, Samsung PM961 MZVLW256HEHP, IPS, 1920x1080, 13.9" | |
|---|---|---|---|---|---|---|
| Power Consumption | 51% | -6% | 20% | 44% | 56% | |
| Idle Minimum * (Watt) | 11.6 | 4.3 63% | 8.3 28% | 8.14 30% | 5.9 49% | 3.1 73% |
| Idle Average * (Watt) | 13.8 | 7.6 45% | 10.2 26% | 10.91 21% | 9.2 33% | 6.6 52% |
| Idle Maximum * (Watt) | 14.2 | 9.8 31% | 10.4 27% | 12.26 14% | 9.3 35% | 7 51% |
| Load Average * (Watt) | 67.9 | 32.6 52% | 67.5 1% | 45.67 33% | 35.6 48% | 35.2 48% |
| Witcher 3 ultra * (Watt) | 59 | 96.5 -64% | ||||
| Load Maximum * (Watt) | 76.9 | 28.4 63% | 117.2 -52% | 74.94 3% | 32.9 57% | 34.6 55% |
* ... Meglio usare valori piccoli
| HP Spectre x360 15t-bl100 i5-8550U, GeForce MX150, 79.2 Wh | Dell Inspiron 15 5578-1777 2-in-1 i5-7200U, HD Graphics 620, 42 Wh | Lenovo Yoga 720-15IKB-80X7 i7-7700HQ, GeForce GTX 1050 Mobile, 72 Wh | Lenovo Yoga 920-13IKB-80Y7 i5-8550U, UHD Graphics 620, 70 Wh | HP Spectre x360 15-bl002xx i7-7500U, GeForce 940MX, 79.2 Wh | HP Pavilion x360 15-bk102ng i5-7200U, HD Graphics 620, 48 Wh | |
|---|---|---|---|---|---|---|
| Autonomia della batteria | -22% | -7% | 37% | 2% | -32% | |
| Reader / Idle (h) | 15.6 | 17.8 14% | 27.6 77% | 14.4 -8% | ||
| WiFi v1.3 (h) | 8.5 | 6.6 -22% | 8.1 -5% | 11.4 34% | 8.9 5% | 5.8 -32% |
| Load (h) | 2.3 | 1.6 -30% | 2.3 0% | 2.5 9% |
Pro
Contro

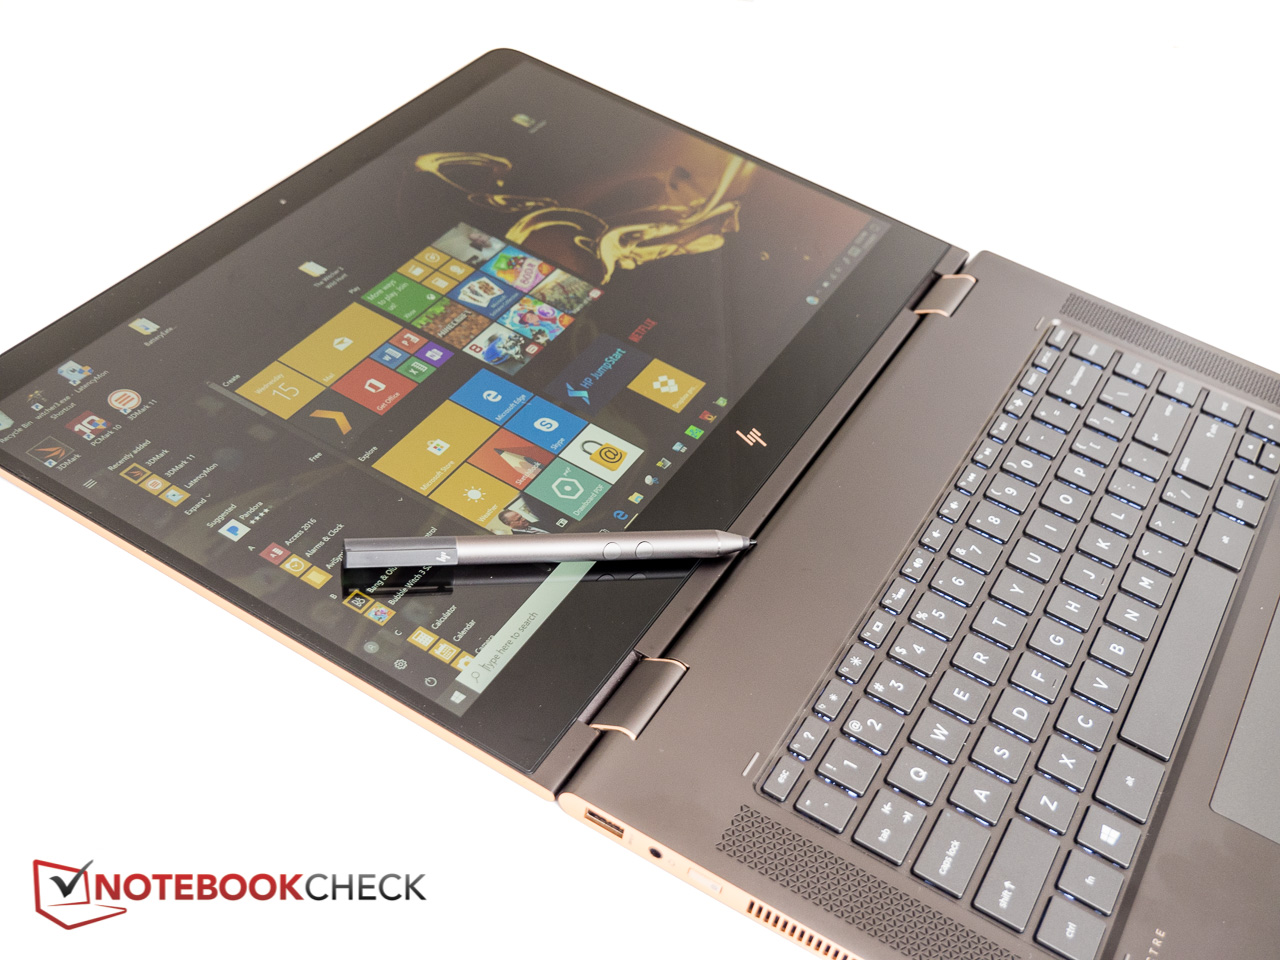
Il 15.6" Spectre x360 15 è un ottimo 2-in-1 con abbastanza potenza di calcolo con applicazioni pesanti. HP non ha modificato lo chassis, ma ha aggiornato l'hardware con una CPU Kaby Lake-R più potente e una nuova GeForce entry-level. Le principali novità riguardano le prestazioni CPU e GPU e qui il nuovo Spectre supera il predecessore di un buon margine - almeno con le applicazioni che si avvantaggiano dei due cores aggiuntivi. Questo convertibile con il suo vivido display 4K, 16 GB di RAM ed un più veloce SSD da 512 GB PCIe NVMe può essere molto attraente per coloro che cercano una macchina produttiva che riesca ad essere usata anche per il gaming.
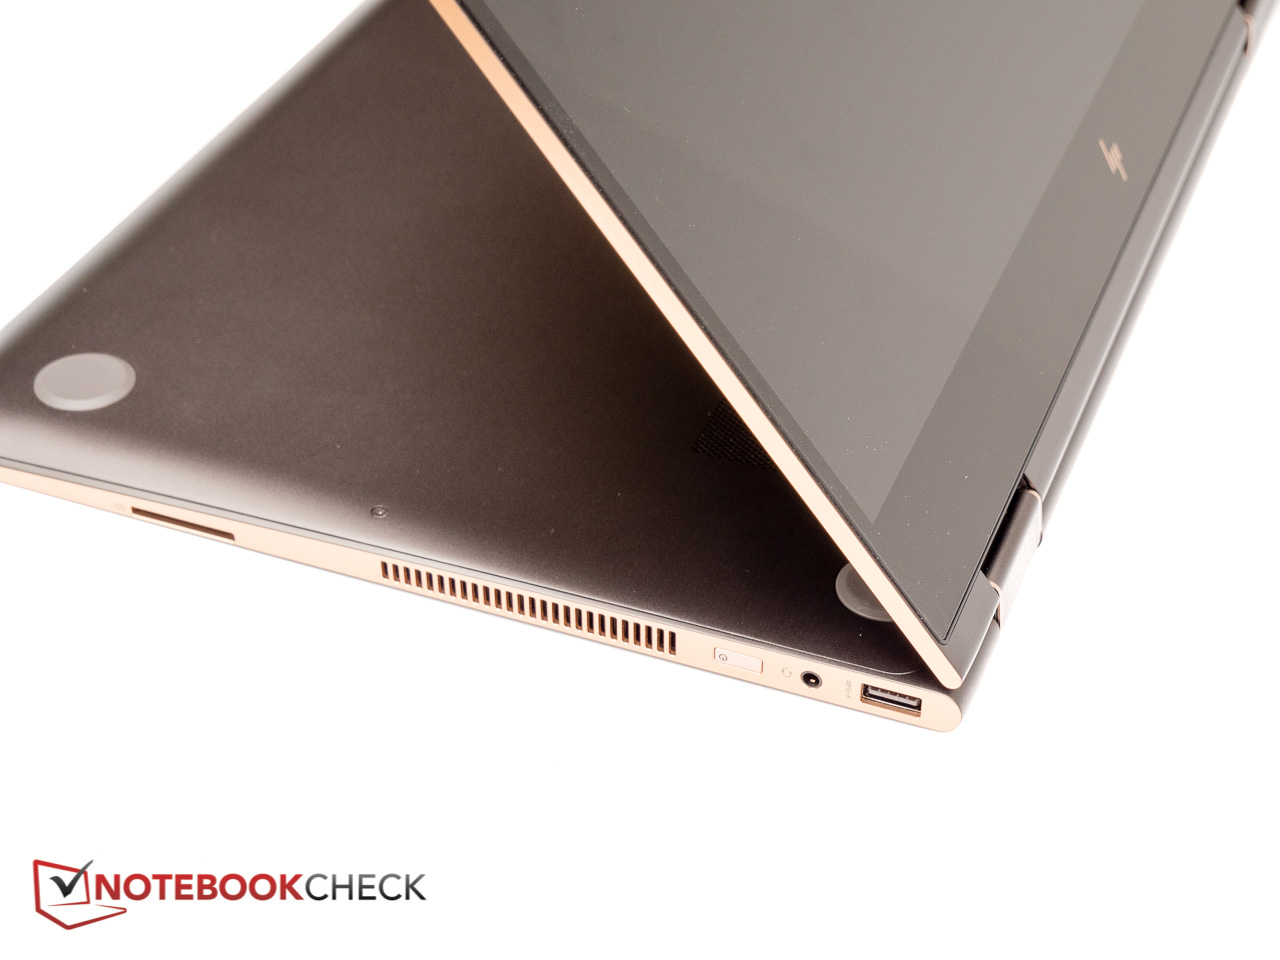
L'autonomia soffre un po', ma con un utilizzo giudizioso, lo Spectre resiste una giornata di lavoro. Per il resto, i pro e i contro restano quelli noti: le cerniere non sono molto robuste per mantenere bene il display in tutte le posizioni, il pannello 4K mostra problemi di proporzioni, e un convertibile da 15.6" è abbastanza grande e pesante, il che potrebbe limitare l'utilizzo in modalità tablet.
Dopo l'aggiornamento dell'hardware, l'HP Spectre x360 15t resta un solido e performante 2-in-1 e resta una delle migliori scelte in termini di convertibile.
Coloro che non hanno bisogno di una GPU dedicata e preferiscono una autonomia maggiore potrebbero dare uno sguardo al più piccolo Lenovo Yoga 920.
Nota: si tratta di una recensione breve, con alcune sezioni non tradotte, per la versione integrale in inglese guardate qui.
HP Spectre x360 15t-bl100
- 11/16/2017 v6 (old)
Bernie Pechlaner
Price comparison
