Recensione breve della Workstation HP ZBook Studio G4 (Xeon, Quadro M1200, DreamColor)
| SD Card Reader | |
| average JPG Copy Test (av. of 3 runs) | |
| HP ZBook Studio G4-Y6K17EA (Toshiba Exceria Pro SDXC 64 GB UHS-II) | |
| Dell Precision 5520 UHD (Toshiba Exceria Pro SDXC 64 GB UHS-II) | |
| Lenovo ThinkPad P51 20HH0016GE (Toshiba Exceria Pro SDXC 64 GB UHS-II) | |
| HP ZBook Studio G3 (Toshiba Exceria Pro SDXC 64 GB UHS-II) | |
| Lenovo ThinkPad P51s 20HB000SGE (Toshiba Exceria Pro SDXC 64 GB UHS-II) | |
| maximum AS SSD Seq Read Test (1GB) | |
| Dell Precision 5520 UHD (Toshiba Exceria Pro SDXC 64 GB UHS-II) | |
| Lenovo ThinkPad P51 20HH0016GE (Toshiba Exceria Pro SDXC 64 GB UHS-II) | |
| HP ZBook Studio G3 (Toshiba Exceria Pro SDXC 64 GB UHS-II) | |
| HP ZBook Studio G4-Y6K17EA (Toshiba Exceria Pro SDXC 64 GB UHS-II) | |
| Lenovo ThinkPad P51s 20HB000SGE (Toshiba Exceria Pro SDXC 64 GB UHS-II) | |
| |||||||||||||||||||||||||
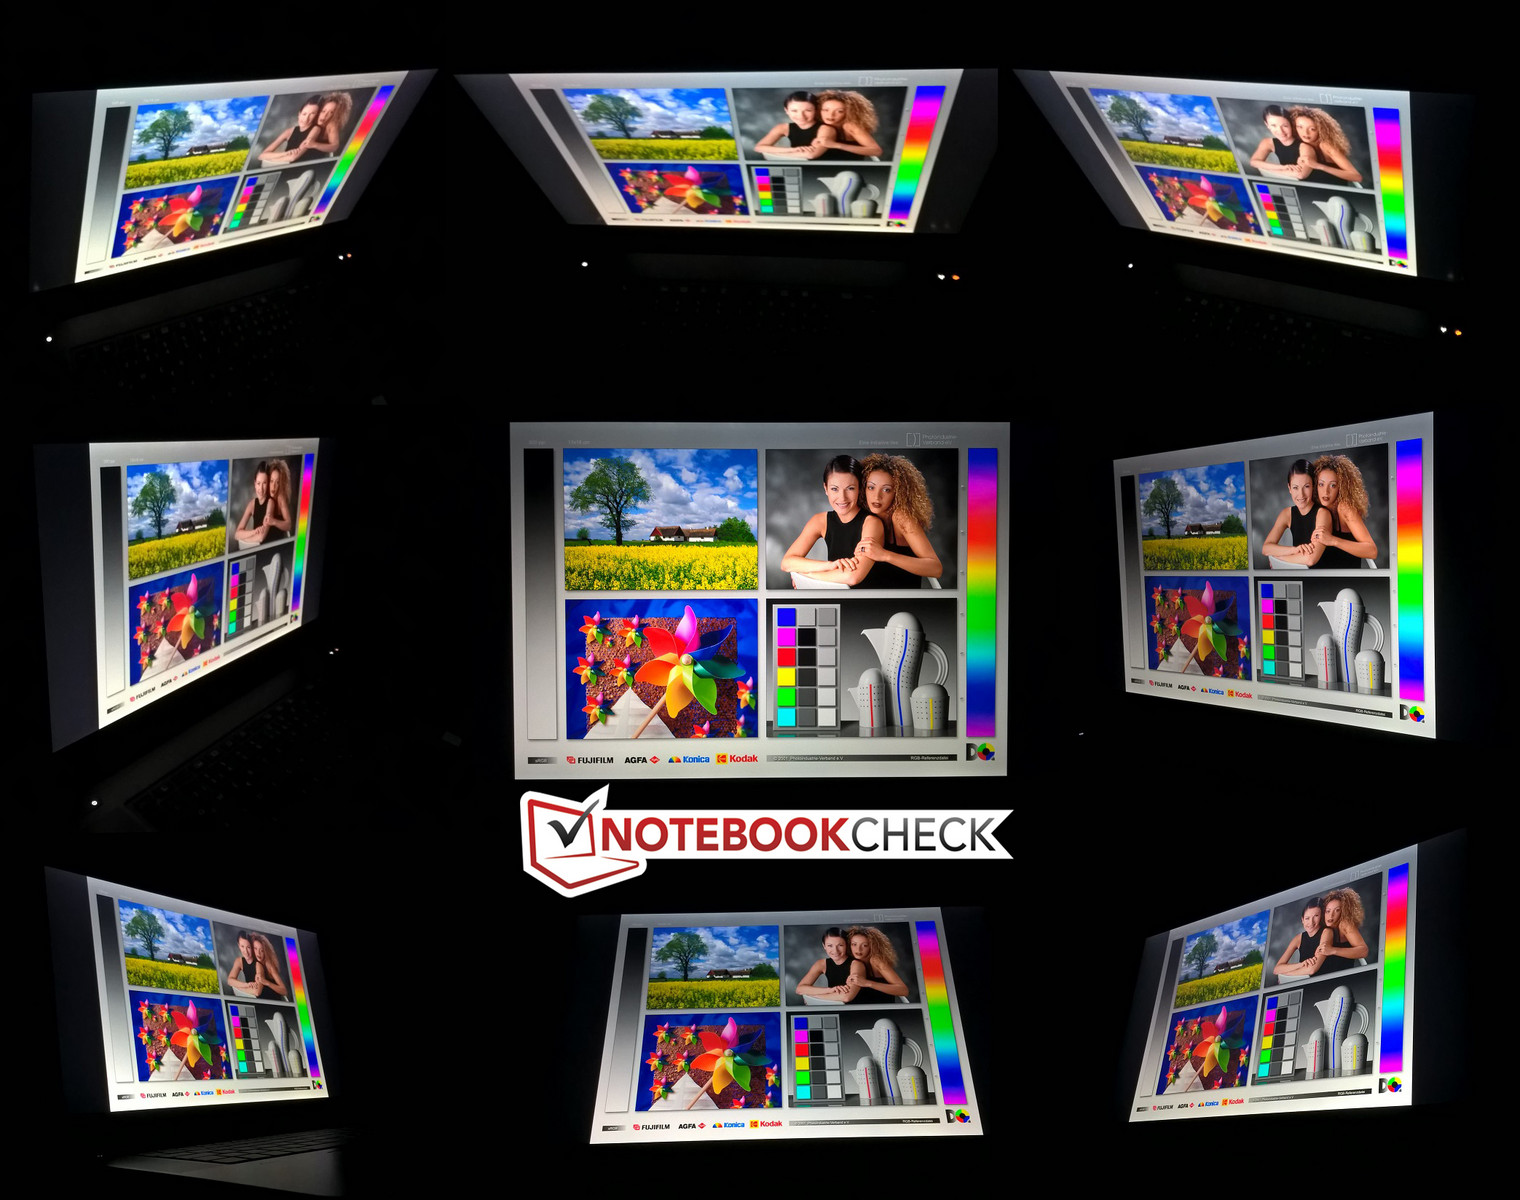
Distribuzione della luminosità: 78 %
Al centro con la batteria: 324 cd/m²
Contrasto: 1080:1 (Nero: 0.3 cd/m²)
ΔE ColorChecker Calman: 1.6 | ∀{0.5-29.43 Ø4.72}
ΔE Greyscale Calman: 2.5 | ∀{0.09-98 Ø4.97}
98.9% sRGB (Argyll 1.6.3 3D)
85.7% AdobeRGB 1998 (Argyll 1.6.3 3D)
98% AdobeRGB 1998 (Argyll 3D)
98.9% sRGB (Argyll 3D)
82.6% Display P3 (Argyll 3D)
Gamma: 2.21
CCT: 6273 K
| HP ZBook Studio G4-Y6K17EA SHP1445, , 3840x2160, 15.6" | HP ZBook Studio G3 Sharp SPH1445, , 3840x2160, 15.6" | Dell Precision 5520 UHD SHP1476, , 3840x2160, 15.6" | Lenovo ThinkPad P51 20HH0016GE LEN40BD, B156ZAN02.1, , 3840x2160, 15.6" | Lenovo ThinkPad P51s 20HB000SGE BOE NV156QUM-N44, , 3840x2160, 15.6" | Apple MacBook Pro 15 2017 (2.9 GHz, 560) 2880x1800, 15.4" | |
|---|---|---|---|---|---|---|
| Display | 1% | -16% | 2% | -19% | ||
| Display P3 Coverage (%) | 82.6 | 86 4% | 67.4 -18% | 86.3 4% | 69.7 -16% | |
| sRGB Coverage (%) | 98.9 | 98.9 0% | 98.5 0% | 99.5 1% | 91.2 -8% | |
| AdobeRGB 1998 Coverage (%) | 98 | 98 0% | 68.9 -30% | 99.3 1% | 66.8 -32% | |
| Response Times | 13% | -36% | 13% | 16% | 6% | |
| Response Time Grey 50% / Grey 80% * (ms) | 44.8 ? | 44 ? 2% | 59.2 ? -32% | 40.8 ? 9% | 38.4 ? 14% | 42.4 ? 5% |
| Response Time Black / White * (ms) | 30 ? | 23.2 ? 23% | 41.6 ? -39% | 25.2 ? 16% | 24.8 ? 17% | 28 ? 7% |
| PWM Frequency (Hz) | 1497 ? | 200 ? | 980 ? | |||
| Screen | -53% | -21% | -11% | -30% | 18% | |
| Brightness middle (cd/m²) | 324 | 310 -4% | 372.4 15% | 317 -2% | 317 -2% | 534 65% |
| Brightness (cd/m²) | 338 | 299 -12% | 368 9% | 309 -9% | 290 -14% | 502 49% |
| Brightness Distribution (%) | 78 | 86 10% | 90 15% | 89 14% | 85 9% | 86 10% |
| Black Level * (cd/m²) | 0.3 | 0.29 3% | 0.48 -60% | 0.36 -20% | 0.32 -7% | 0.31 -3% |
| Contrast (:1) | 1080 | 1069 -1% | 776 -28% | 881 -18% | 991 -8% | 1723 60% |
| Colorchecker dE 2000 * | 1.6 | 5.9 -269% | 2.6 -63% | 2.7 -69% | 3.6 -125% | 1.8 -13% |
| Colorchecker dE 2000 max. * | 4.6 | 10.7 -133% | 5.6 -22% | 4.1 11% | 6.6 -43% | 3.8 17% |
| Greyscale dE 2000 * | 2.5 | 5.5 -120% | 3.7 -48% | 3 -20% | 4.2 -68% | 2.4 4% |
| Gamma | 2.21 100% | 2.09 105% | 2.14 103% | 2.27 97% | 2.24 98% | 2.27 97% |
| CCT | 6273 104% | 5980 109% | 7096 92% | 6077 107% | 6740 96% | 6563 99% |
| Color Space (Percent of AdobeRGB 1998) (%) | 85.7 | 85 -1% | 63 -26% | 87.6 2% | 59.5 -31% | 77.92 -9% |
| Color Space (Percent of sRGB) (%) | 98.9 | 99 0% | 99 0% | 99.5 1% | 91.1 -8% | 99.94 1% |
| Media totale (Programma / Settaggio) | -13% /
-33% | -24% /
-22% | 1% /
-5% | -11% /
-21% | 12% /
16% |
* ... Meglio usare valori piccoli
Sfarfallio dello schermo / PWM (Pulse-Width Modulation)
| flickering dello schermo / PWM rilevato | 1497 Hz | ≤ 50 % settaggio luminosita' | 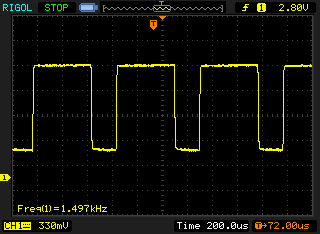 |
Il display sfarfalla a 1497 Hz (Probabilmente a causa dell'uso di PWM) Flickering rilevato ad una luminosita' di 50 % o inferiore. Non dovrebbe verificarsi flickering o PWM sopra questo valore di luminosita'. La frequenza di 1497 Hz è abbastanza alta, quindi la maggioranza degli utenti sensibili al PWM non dovrebbero notare alcun flickering. In confronto: 52 % di tutti i dispositivi testati non utilizza PWM per ridurre la luminosita' del display. Se è rilevato PWM, una media di 7778 (minimo: 5 - massimo: 343500) Hz è stata rilevata. | |||
Tempi di risposta del Display
| ↔ Tempi di risposta dal Nero al Bianco | ||
|---|---|---|
| 30 ms ... aumenta ↗ e diminuisce ↘ combinato | ↗ 17.2 ms Incremento | 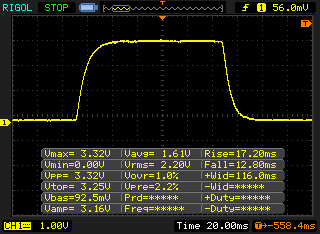 |
| ↘ 12.8 ms Calo | ||
| Lo schermo mostra tempi di risposta lenti nei nostri tests e sarà insoddisfacente per i gamers. In confronto, tutti i dispositivi di test variano da 0.1 (minimo) a 240 (massimo) ms. » 80 % di tutti i dispositivi è migliore. Questo significa che i tempi di risposta rilevati sono peggiori rispetto alla media di tutti i dispositivi testati (19.8 ms). | ||
| ↔ Tempo di risposta dal 50% Grigio all'80% Grigio | ||
| 44.8 ms ... aumenta ↗ e diminuisce ↘ combinato | ↗ 22 ms Incremento | 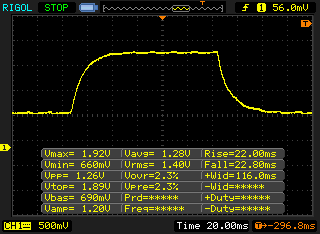 |
| ↘ 22.8 ms Calo | ||
| Lo schermo mostra tempi di risposta lenti nei nostri tests e sarà insoddisfacente per i gamers. In confronto, tutti i dispositivi di test variano da 0.165 (minimo) a 636 (massimo) ms. » 76 % di tutti i dispositivi è migliore. Questo significa che i tempi di risposta rilevati sono peggiori rispetto alla media di tutti i dispositivi testati (31 ms). | ||

| PCMark 10 - Score | |
| Apple MacBook Pro 15 2017 (2.9 GHz, 560) | |
| HP ZBook Studio G4-Y6K17EA | |
| PCMark 8 Home Score Accelerated v2 | 4093 punti | |
| PCMark 8 Creative Score Accelerated v2 | 5487 punti | |
| PCMark 8 Work Score Accelerated v2 | 4408 punti | |
| PCMark 10 Score | 4323 punti | |
Aiuto | ||
| HP ZBook Studio G4-Y6K17EA Samsung SM961 MZVKW512HMJP m.2 PCI-e | Dell Precision 5520 UHD Samsung SM961 MZVKW512HMJP m.2 PCI-e | Lenovo ThinkPad P51 20HH0016GE Samsung PM961 NVMe MZVLW512HMJP | Lenovo ThinkPad P51s 20HB000SGE Samsung SSD PM961 1TB M.2 PCIe 3.0 x4 NVMe (MZVLW1T0) | HP ZBook Studio G3 Samsung SM951 MZVPV512HDGL m.2 PCI-e | |
|---|---|---|---|---|---|
| AS SSD | 5% | -2% | -23% | -25% | |
| Score Total (Points) | 3693 | 3681 0% | 3424 -7% | 2771 -25% | 2367 -36% |
| Score Write (Points) | 1412 | 1379 -2% | 917 -35% | 1271 -10% | 470 -67% |
| Score Read (Points) | 1544 | 1554 1% | 1690 9% | 990 -36% | 1273 -18% |
| Access Time Write * (ms) | 0.026 | 0.023 12% | 0.025 4% | 0.027 -4% | 0.025 4% |
| Access Time Read * (ms) | 0.053 | 0.038 28% | 0.032 40% | 0.082 -55% | 0.046 13% |
| 4K-64 Write (MB/s) | 1108 | 1055 -5% | 623 -44% | 1018 -8% | 230.6 -79% |
| 4K-64 Read (MB/s) | 1213 | 1223 1% | 1372 13% | 792 -35% | 1050 -13% |
| 4K Write (MB/s) | 145.3 | 155.3 7% | 143.1 -2% | 130.8 -10% | 144.8 0% |
| 4K Read (MB/s) | 51.2 | 51.5 1% | 55.6 9% | 52.8 3% | 51.7 1% |
| Seq Write (MB/s) | 1588 | 1694 7% | 1506 -5% | 1217 -23% | 947 -40% |
| Seq Read (MB/s) | 2799 | 2799 0% | 2624 -6% | 1450 -48% | 1713 -39% |
* ... Meglio usare valori piccoli

| 3DMark 11 - 1280x720 Performance GPU | |
| Lenovo ThinkPad P51 20HH0016GE | |
| HP ZBook Studio G4-Y6K17EA | |
| Apple MacBook Pro 15 2017 (2.9 GHz, 560) | |
| Lenovo ThinkPad P50 20ENV509PB | |
| Dell Precision 5520 UHD | |
| HP ZBook Studio G3 | |
| Dell Precision 3520 | |
| Lenovo ThinkPad P51s 20HB000SGE | |
| 3DMark - 1920x1080 Fire Strike Graphics | |
| Lenovo ThinkPad P51 20HH0016GE | |
| Lenovo ThinkPad P50 20ENV509PB | |
| Dell Precision 5520 UHD | |
| HP ZBook Studio G4-Y6K17EA | |
| Apple MacBook Pro 15 2017 (2.9 GHz, 560) | |
| HP ZBook Studio G3 | |
| Dell Precision 3520 | |
| Lenovo ThinkPad P51s 20HB000SGE | |
| Unigine Valley 1.0 | |
| 1920x1080 Extreme HD DirectX AA:x8 | |
| HP ZBook Studio G4-Y6K17EA | |
| Lenovo ThinkPad P51 20HH0016GE | |
| HP ZBook Studio G3 | |
| Apple MacBook Pro 15 2017 (2.9 GHz, 560) | |
| Dell Precision 3520 | |
| Lenovo ThinkPad P51s 20HB000SGE | |
| 1920x1080 Extreme HD Preset OpenGL AA:x8 | |
| Lenovo ThinkPad P51 20HH0016GE | |
| HP ZBook Studio G4-Y6K17EA | |
| HP ZBook Studio G3 | |
| Dell Precision 3520 | |
| Lenovo ThinkPad P51s 20HB000SGE | |
| Apple MacBook Pro 15 2017 (2.9 GHz, 560) | |
| 3DMark 11 Performance | 5516 punti | |
| 3DMark Cloud Gate Standard Score | 17884 punti | |
| 3DMark Fire Strike Score | 3878 punti | |
Aiuto | ||
| basso | medio | alto | ultra | 4K | |
|---|---|---|---|---|---|
| BioShock Infinite (2013) | 224.7 | 130.8 | 113.1 | 42.61 | |
| Thief (2014) | 93.3 | 58.9 | 50.1 | 26.2 | |
| The Witcher 3 (2015) | 73.6 | 45.9 | 26.3 | 13 | |
| Rise of the Tomb Raider (2016) | 88.1 | 49.15 | 28.36 | 23.92 | 9.88 |
Rumorosità
| Idle |
| 29.7 / 29.7 / 31.6 dB(A) |
| Sotto carico |
| 42.3 / 42.3 dB(A) |
 | ||
30 dB silenzioso 40 dB(A) udibile 50 dB(A) rumoroso |
||
min: | ||
| HP ZBook Studio G4-Y6K17EA E3-1505M v6, Quadro M1200 | HP ZBook Studio G3 6820HQ, Quadro M1000M | Dell Precision 5520 UHD E3-1505M v6, Quadro M1200 | Apple MacBook Pro 15 2017 (2.9 GHz, 560) i7-7820HQ, Radeon Pro 560 | Lenovo ThinkPad P51 20HH0016GE E3-1505M v6, Quadro M2200 | Lenovo ThinkPad P51s 20HB000SGE i7-7600U, Quadro M520 | |
|---|---|---|---|---|---|---|
| Noise | -8% | -3% | 3% | 7% | 5% | |
| off /ambiente * (dB) | 29.4 | 30 -2% | 28.7 2% | 30.8 -5% | 29.6 -1% | 29.2 1% |
| Idle Minimum * (dB) | 29.7 | 30 -1% | 28.7 3% | 31 -4% | 29.6 -0% | 29.2 2% |
| Idle Average * (dB) | 29.7 | 30 -1% | 32.1 -8% | 31 -4% | 29.6 -0% | 29.2 2% |
| Idle Maximum * (dB) | 31.6 | 30 5% | 32.1 -2% | 31 2% | 29.6 6% | 31.1 2% |
| Load Average * (dB) | 42.3 | 51 -21% | 41.3 2% | 31.3 26% | 32.2 24% | 36.7 13% |
| Witcher 3 ultra * (dB) | 42.3 | 45.5 -8% | ||||
| Load Maximum * (dB) | 42.3 | 52.8 -25% | 45.5 -8% | 41.8 1% | 36.6 13% | 39.4 7% |
* ... Meglio usare valori piccoli
(-) La temperatura massima sul lato superiore è di 46.3 °C / 115 F, rispetto alla media di 38.2 °C / 101 F, che varia da 22.2 a 69.8 °C per questa classe Workstation.
(-) Il lato inferiore si riscalda fino ad un massimo di 55.4 °C / 132 F, rispetto alla media di 41.1 °C / 106 F
(+) In idle, la temperatura media del lato superiore è di 27.4 °C / 81 F, rispetto alla media deld ispositivo di 32 °C / 90 F.
(-) Riproducendo The Witcher 3, la temperatura media per il lato superiore e' di 41.5 °C / 107 F, rispetto alla media del dispositivo di 32 °C / 90 F.
(±) I poggiapolsi e il touchpad possono diventare molto caldi al tatto con un massimo di 37.7 °C / 99.9 F.
(-) La temperatura media della zona del palmo della mano di dispositivi simili e'stata di 27.8 °C / 82 F (-9.9 °C / -17.9 F).
| Off / Standby | |
| Idle | |
| Sotto carico |
|
Leggenda:
min: | |
| HP ZBook Studio G4-Y6K17EA E3-1505M v6, Quadro M1200, Samsung SM961 MZVKW512HMJP m.2 PCI-e, IPS, 3840x2160, 15.6" | Dell Precision 5520 UHD E3-1505M v6, Quadro M1200, Samsung SM961 MZVKW512HMJP m.2 PCI-e, IPS, 3840x2160, 15.6" | Apple MacBook Pro 15 2017 (2.9 GHz, 560) i7-7820HQ, Radeon Pro 560, , , 2880x1800, 15.4" | Lenovo ThinkPad P51 20HH0016GE E3-1505M v6, Quadro M2200, Samsung PM961 NVMe MZVLW512HMJP, IPS, 3840x2160, 15.6" | Lenovo ThinkPad P51s 20HB000SGE i7-7600U, Quadro M520, Samsung SSD PM961 1TB M.2 PCIe 3.0 x4 NVMe (MZVLW1T0), IPS, 3840x2160, 15.6" | HP ZBook Studio G3 6820HQ, Quadro M1000M, Samsung SM951 MZVPV512HDGL m.2 PCI-e, IPS, 3840x2160, 15.6" | |
|---|---|---|---|---|---|---|
| Power Consumption | 7% | 31% | 8% | 40% | 18% | |
| Idle Minimum * (Watt) | 12.6 | 8.9 29% | 3.7 71% | 8.6 32% | 5.8 54% | 8.7 31% |
| Idle Average * (Watt) | 17.1 | 13.6 20% | 16.2 5% | 15.9 7% | 10.4 39% | 14.2 17% |
| Idle Maximum * (Watt) | 19.3 | 14.1 27% | 18 7% | 22.1 -15% | 13.5 30% | 14.4 25% |
| Load Average * (Watt) | 88.3 | 100.3 -14% | 58.4 34% | 84.4 4% | 62.4 29% | 85.6 3% |
| Witcher 3 ultra * (Watt) | 74.8 | 100.2 -34% | ||||
| Load Maximum * (Watt) | 147.3 | 126.3 14% | 89.6 39% | 130.6 11% | 73.1 50% | 129.7 12% |
* ... Meglio usare valori piccoli
| HP ZBook Studio G4-Y6K17EA E3-1505M v6, Quadro M1200, 64 Wh | Dell Precision 5520 UHD E3-1505M v6, Quadro M1200, 97 Wh | Apple MacBook Pro 15 2017 (2.9 GHz, 560) i7-7820HQ, Radeon Pro 560, Wh | Lenovo ThinkPad P51 20HH0016GE E3-1505M v6, Quadro M2200, 90 Wh | Lenovo ThinkPad P51s 20HB000SGE i7-7600U, Quadro M520, 104 Wh | HP ZBook Studio G3 6820HQ, Quadro M1000M, 64 Wh | |
|---|---|---|---|---|---|---|
| Autonomia della batteria | 42% | 135% | 115% | 371% | 22% | |
| Reader / Idle (h) | 6.8 | 12.1 78% | 16.4 141% | 26.4 288% | 8.5 25% | |
| WiFi v1.3 (h) | 3.4 | 4.2 24% | 11.3 232% | 6.9 103% | 11.9 250% | 3.5 3% |
| Load (h) | 0.8 | 1 25% | 1.1 38% | 1.6 100% | 5.4 575% | 1.1 38% |
| H.264 (h) | 11.4 | 7.6 | 11.7 | 3.8 | ||
| Witcher 3 ultra (h) | 1.3 |
Pro
Contro
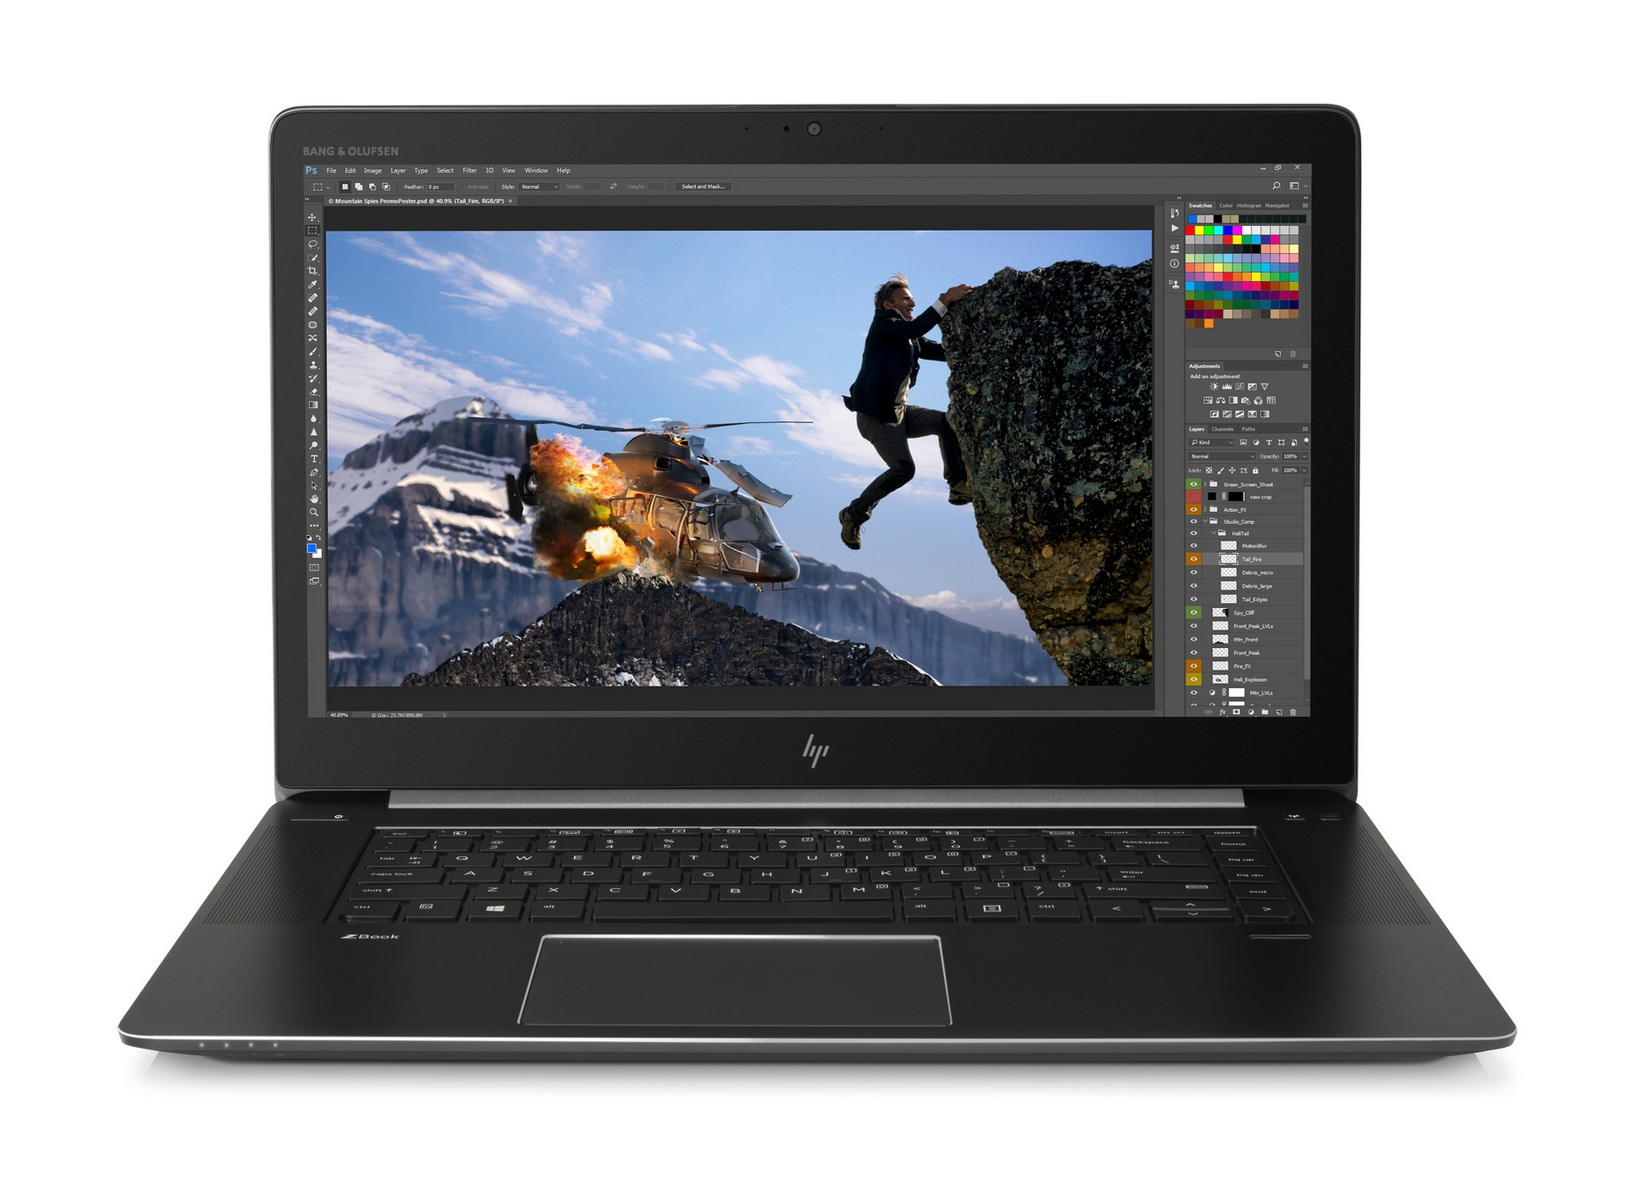
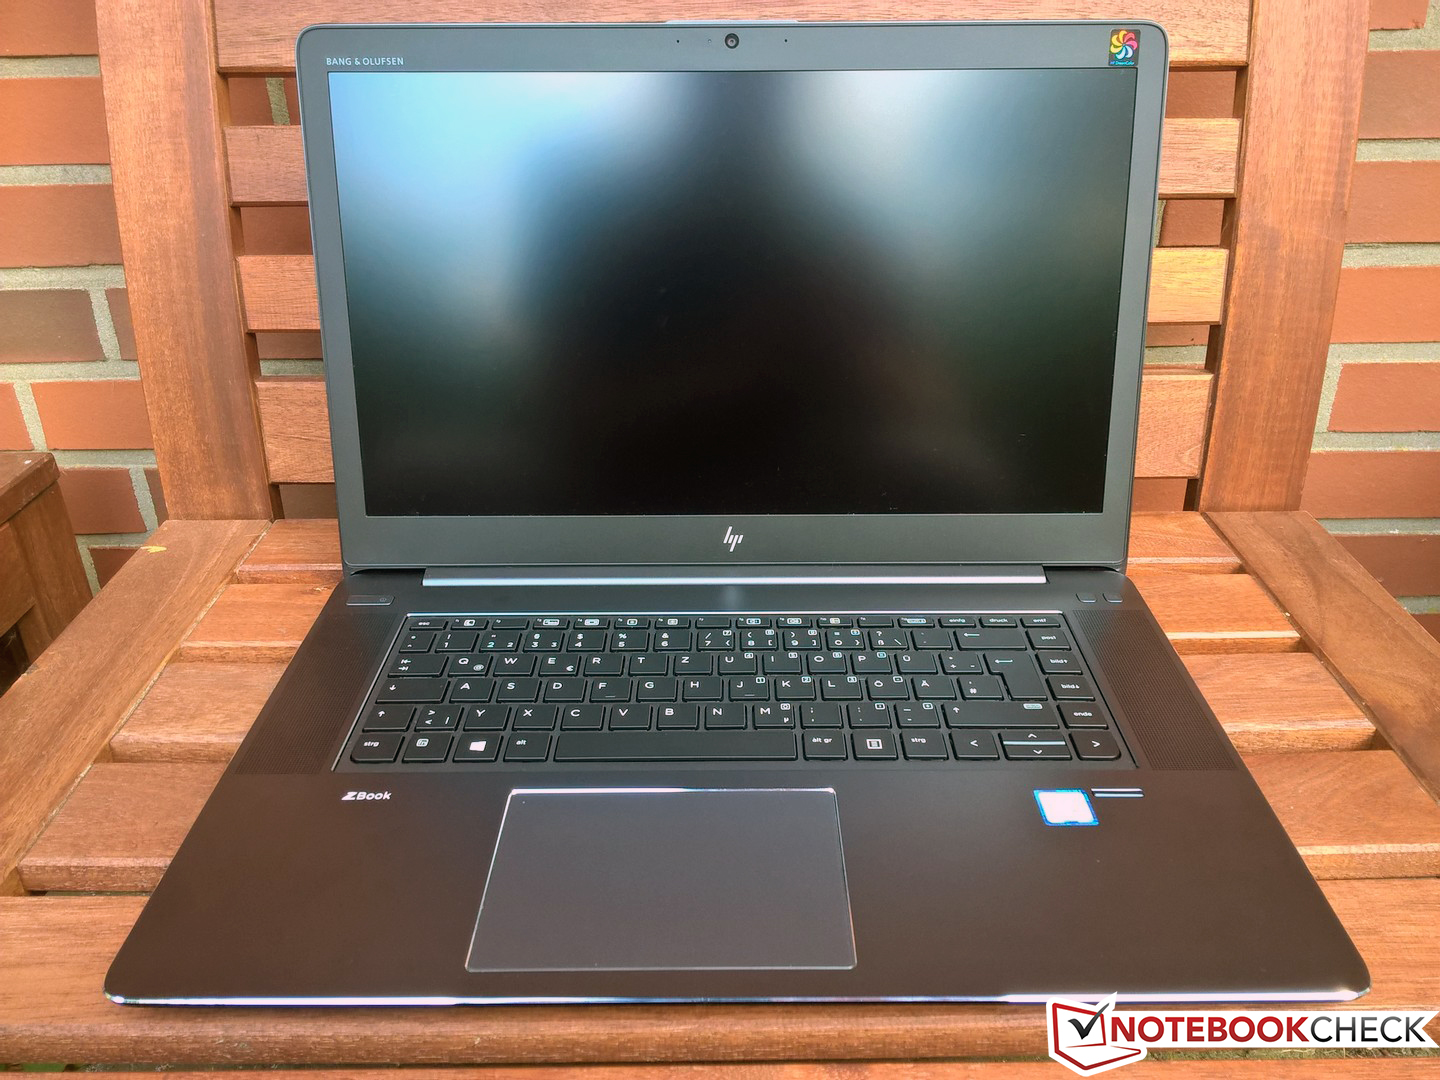
Lo ZBook Studio G4 – come gli altri modelli di workstations mobile HP – ha avuto solo un piccolo update quest'anno. Tuttavia, il case era già molto buono, quindi non dobbiamo preoccuparci. Oltre a qualche aggiornamento dei componenti, il produttore si è occupato anche del principale problema dello Studio G3, le temperature. Sul vecchio Studio G3 avevamo rilevato temperature di superficie estremamente elevate, ma ora siamo in linea con altri dispositivi sottili. Questo miglioramento dipende principalmente dalla limitazione delle prestazioni, in quanto la CPU è limitata a 35 W di default e questo valore scende ulteriormente con carichi di lavoro sostenuti. Il processore mobile Xeon del nostro modello di test pertanto non è la scelta migliore ed è alla pari con il popolare (e molto più economico) Core i7-7700HQ.
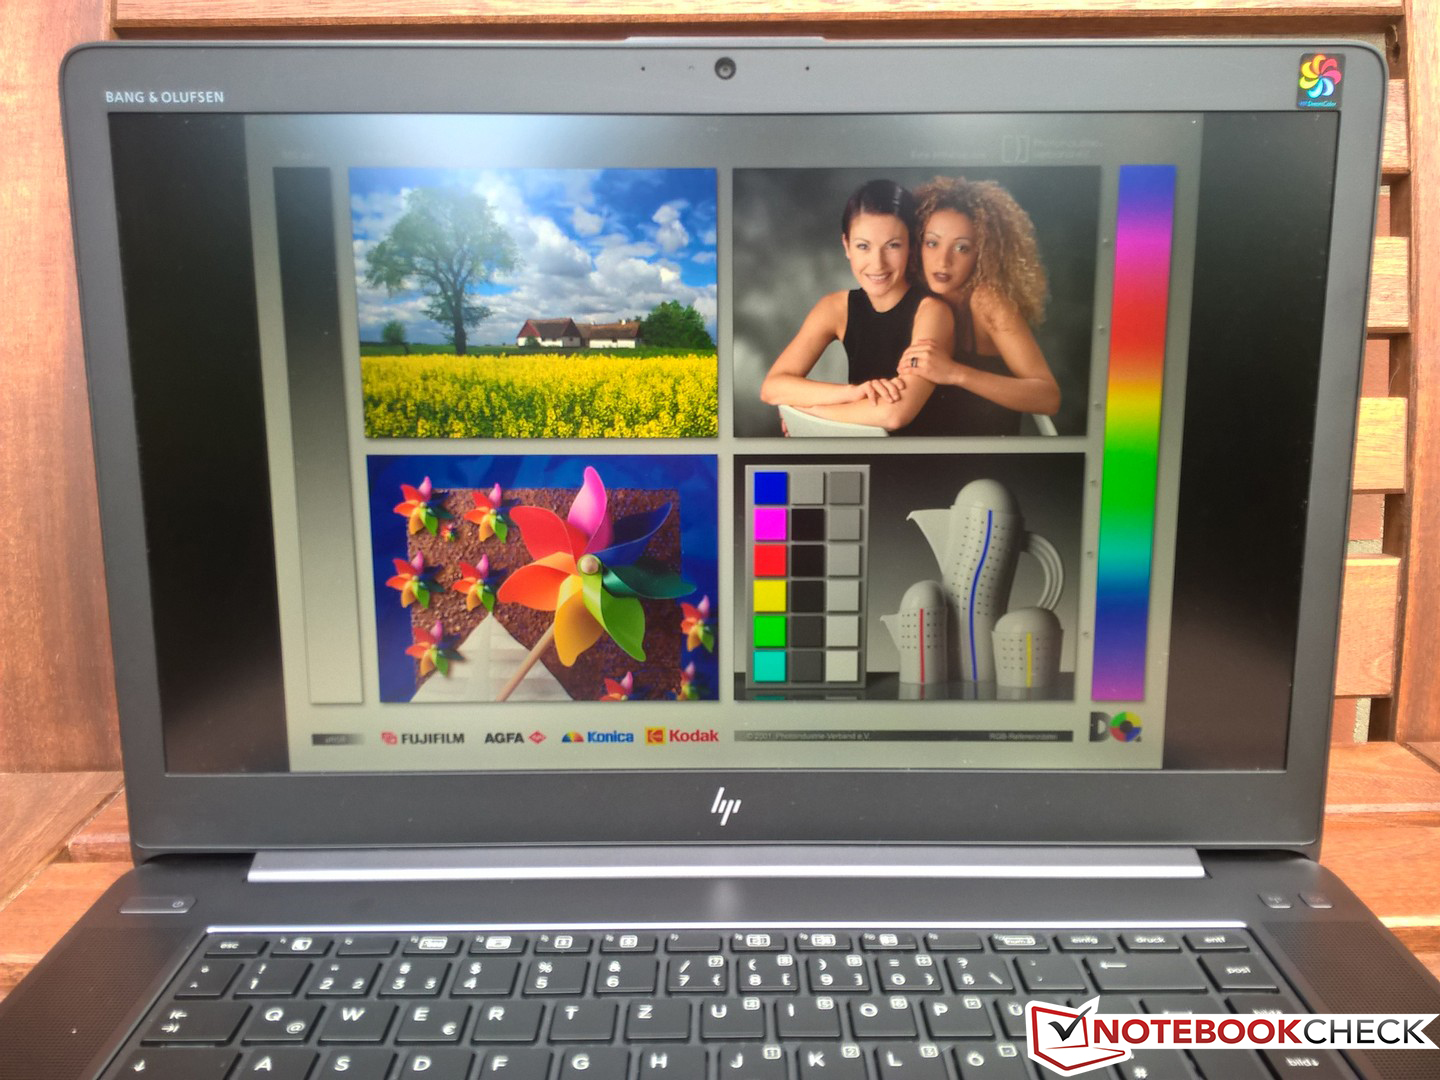
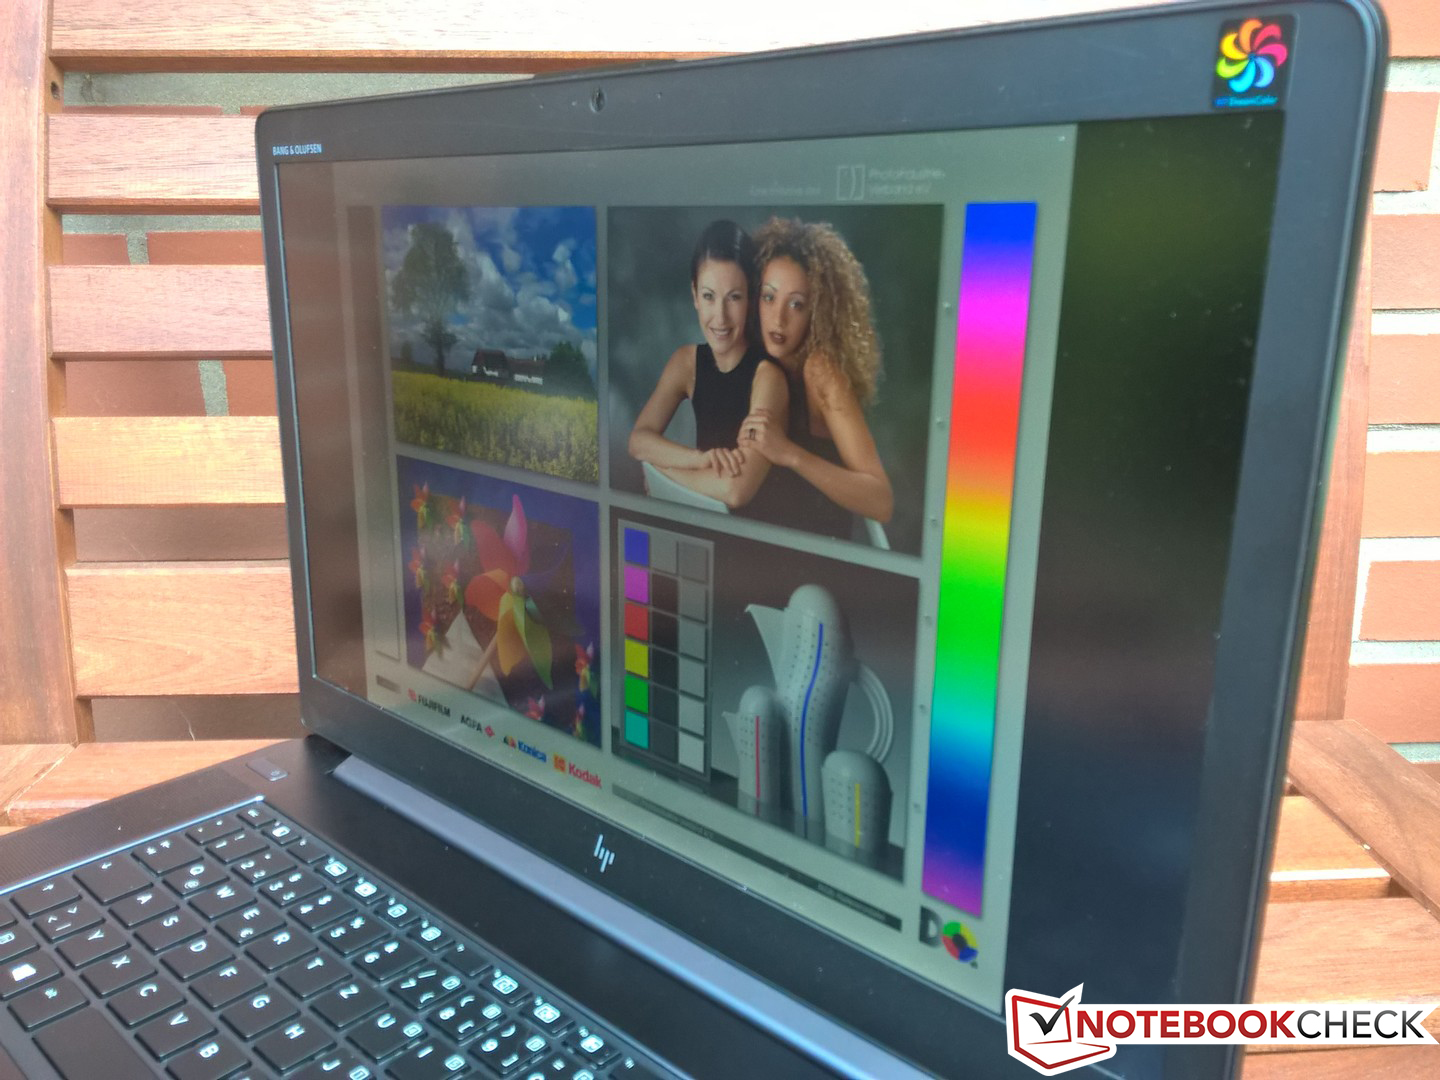
Anche il controllo della ventola è stato migliorato e lascia un'impressione migliore. Il pannello DreamColor (che è molto buono), tuttavia, non ci convince sotto tutti gli aspetti. L'unica differenza con un normale pannello UHD sembra essere il software aggiuntivo, ma risulta anche nella disattivazione della GPU integrata. Questo ovviamente impatta sui consumi della batteria. Appena 3,5 ore nel test WLAN non sono un risultato buono per un dispositivo mobile. Potete prendere il più grande e veloce ZBook 15 G4 se non avete bisogno di uno chassis sottile.
HP migliora lo ZBook Studio G4 su punti importanti ma sacrifica parte delle prestazioni per abbassare le temperature. L'autonomia sfortunatamente è molto deludente per un sistema cn desing sottile e leggero.
Lo Studio G4 resta un buon sistema, nonostante tutti i citati problemi, in quanto anche altri produttori hanno problemi di prestazioni o raffreddamento con dispositivi sottili. Il principale rivale Dell (Precision 5520) è avanti come mobilità, ma ha gli stessi problemi. Crediamo che una SKU diversa dello Studio G4 (Core i7, UHD senza DreamColor, ma con supporto Optimus) potrebbe migliorare la situazione complessiva.
Nota: si tratta di una recensione breve, con alcune sezioni non tradotte, per la versione integrale in inglese guardate qui.
HP ZBook Studio G4-Y6K17EA
- 10/19/2017 v6 (old)
Andreas Osthoff, Mike Wobker
Price comparison
