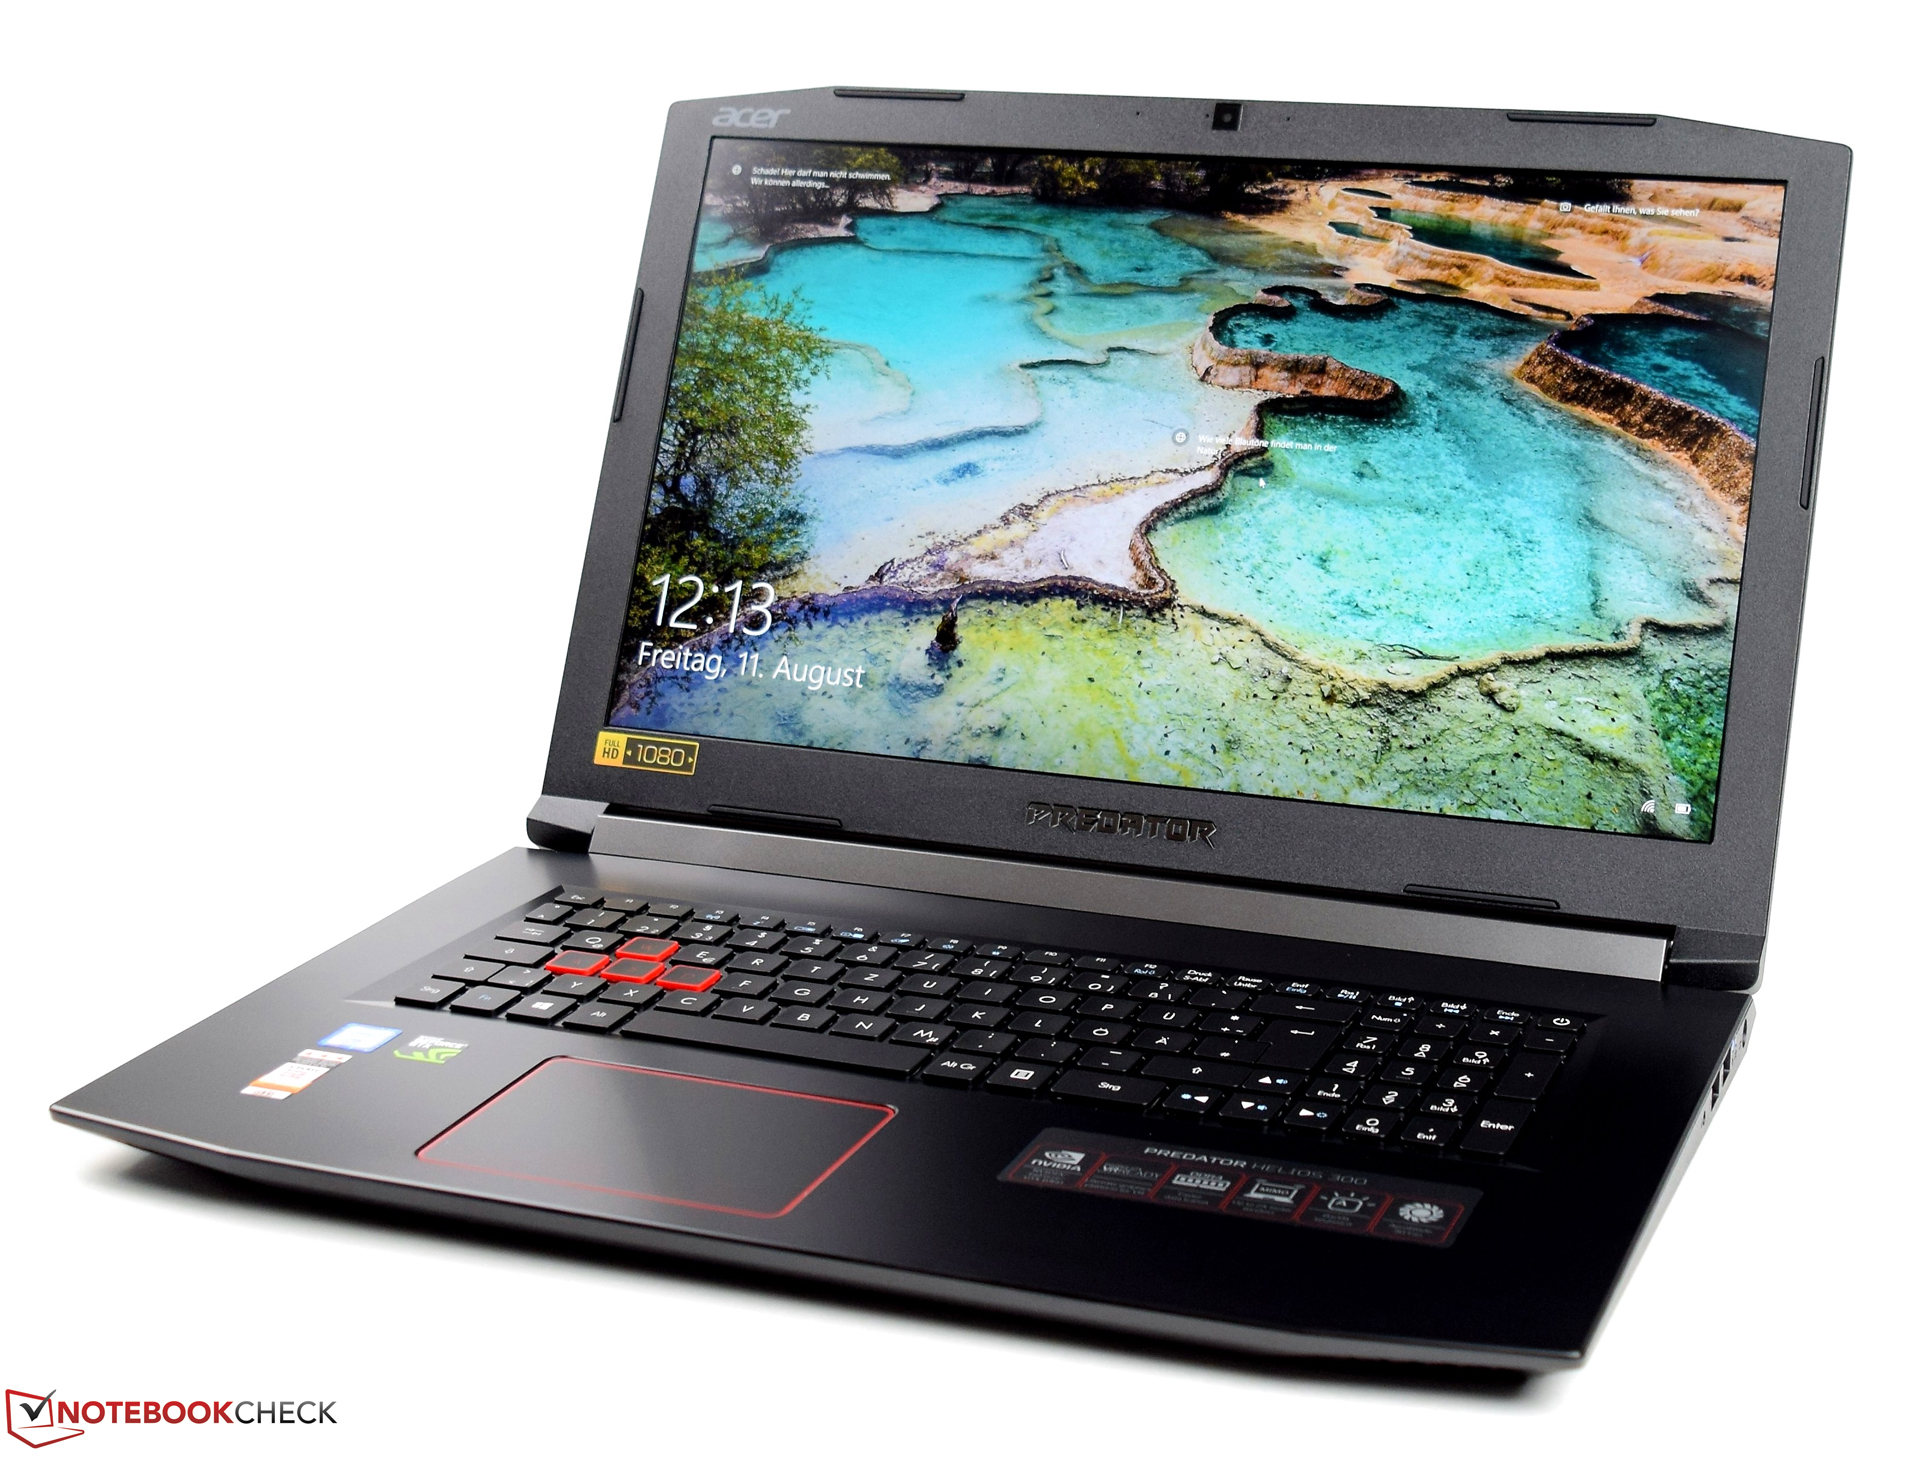
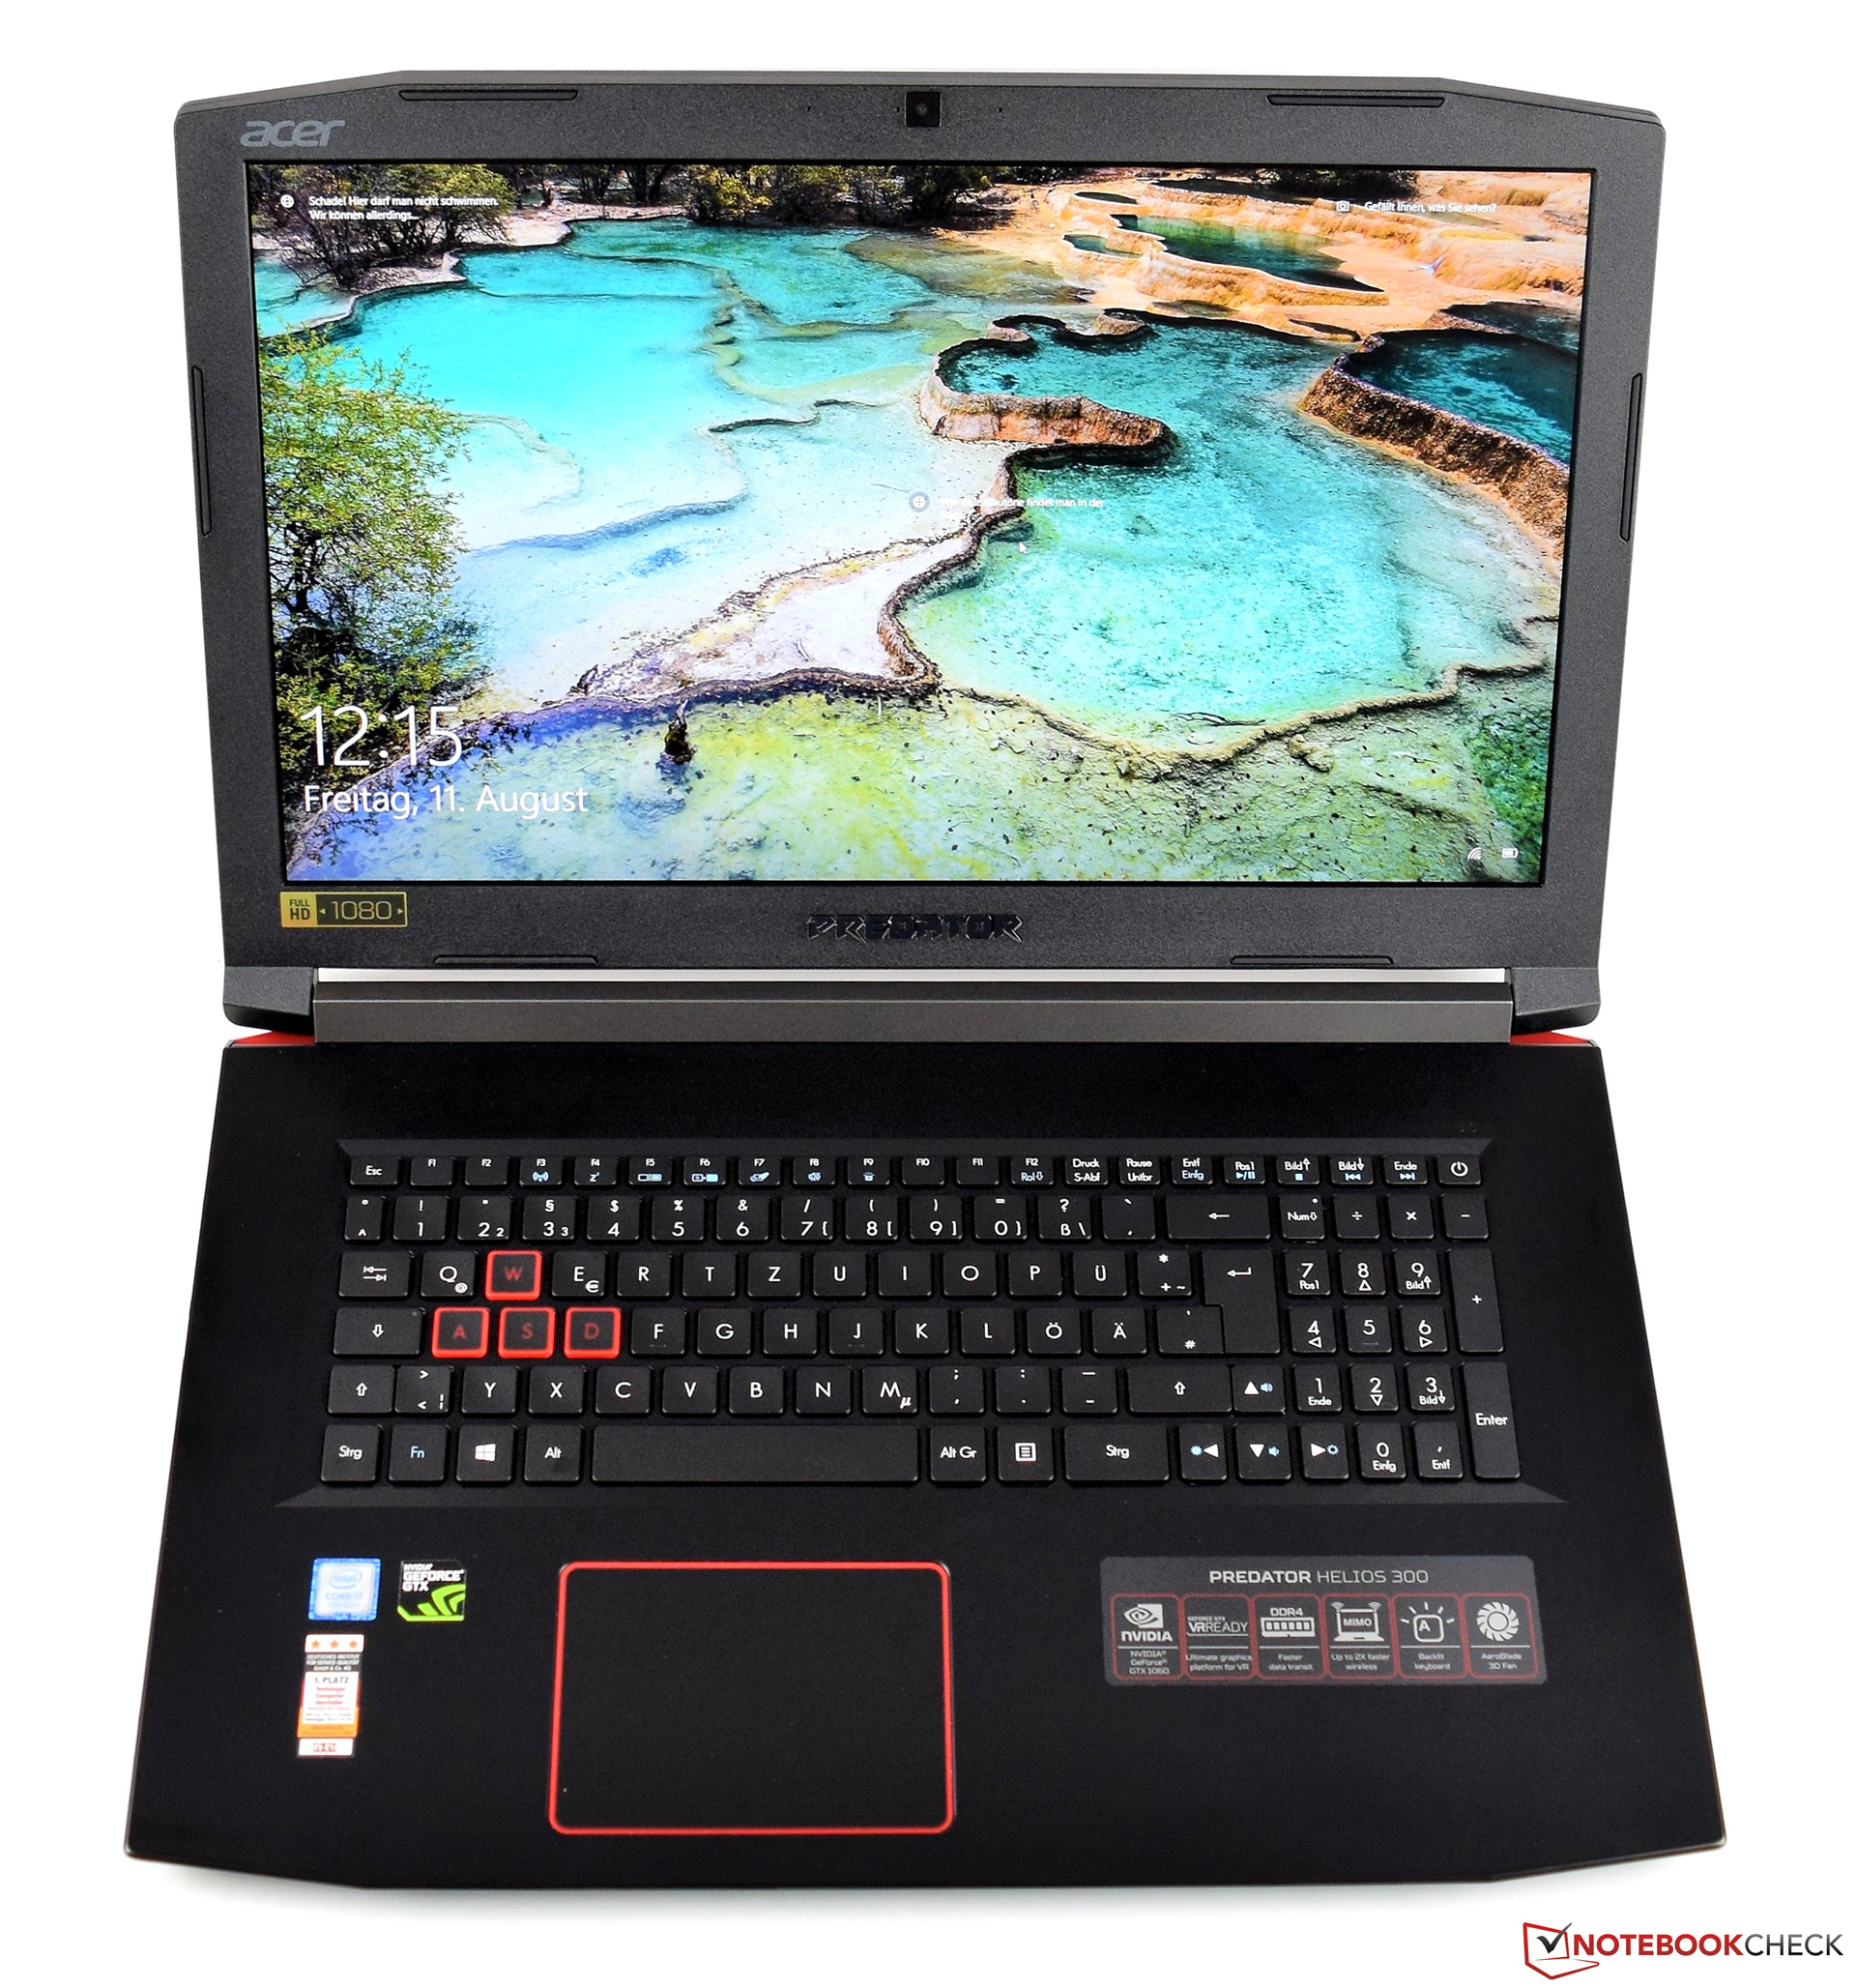
Recensione breve del Portatile Acer Predator Helios 300 (7700HQ, GTX 1060, full-HD)
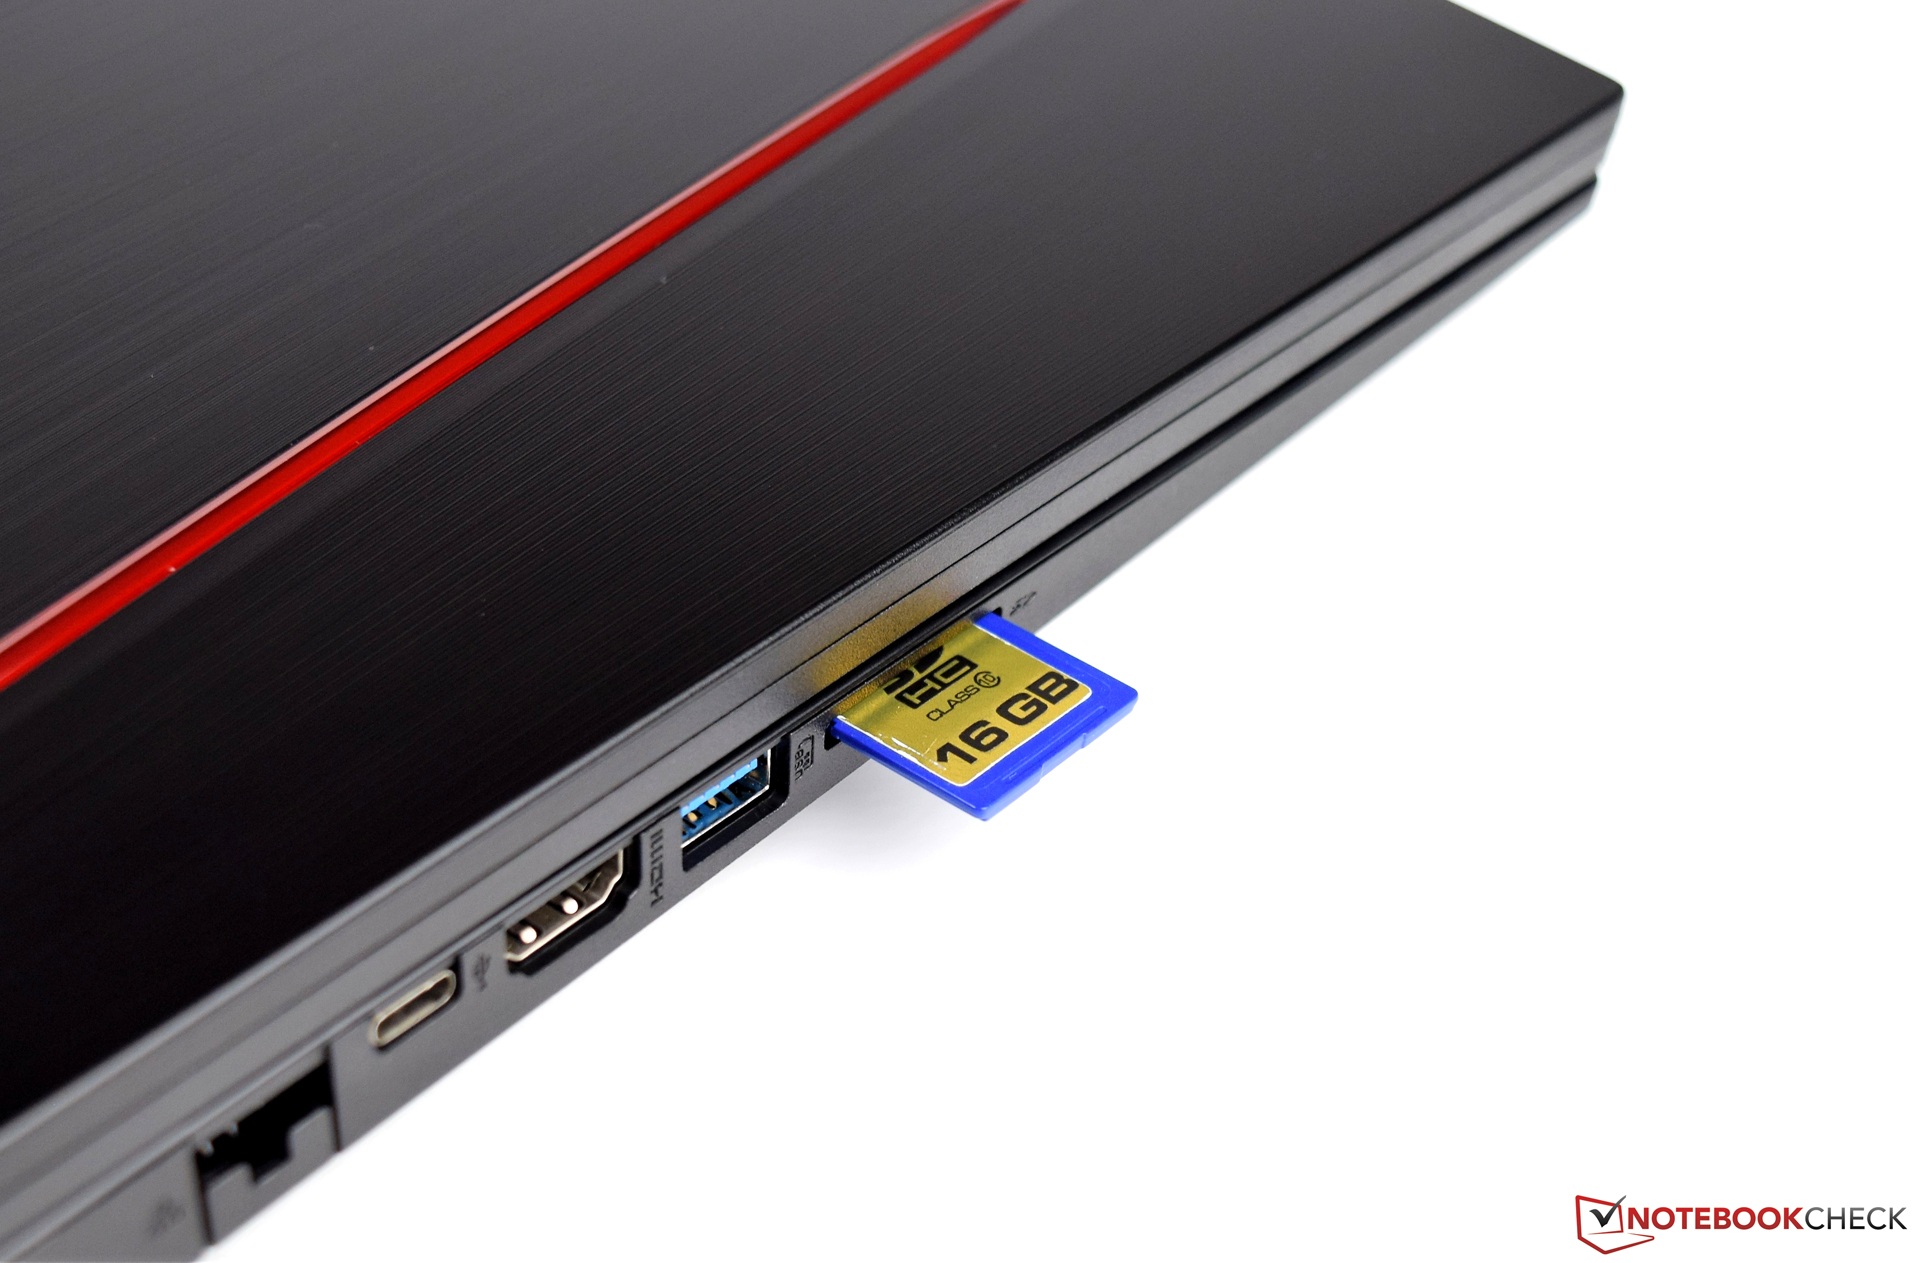

| SD Card Reader | |
| average JPG Copy Test (av. of 3 runs) | |
| Acer Predator Helios 300 (Toshiba Exceria Pro SDXC 64 GB UHS-II) | |
| Gigabyte P57X v7 (Toshiba Exceria Pro SDXC 64 GB UHS-II) | |
| Nexoc G739 (Toshiba Exceria Pro SDXC 64 GB UHS-II) | |
| HP Omen 17-an014ng (Toshiba Exceria Pro SDXC 64 GB UHS-II) | |
| Asus GL753VE-DS74 (Toshiba Exceria Pro SDXC 64 GB UHS-II) | |
| Acer Aspire V17 Nitro BE VN7-793-738J (Toshiba Exceria Pro SDXC 64 GB UHS-II) | |
| MSI GE72VR-6RF16H21 (Toshiba Exceria Pro SDXC 64 GB UHS-II) | |
| maximum AS SSD Seq Read Test (1GB) | |
| Asus GL753VE-DS74 (Toshiba Exceria Pro SDXC 64 GB UHS-II) | |
| Gigabyte P57X v7 (Toshiba Exceria Pro SDXC 64 GB UHS-II) | |
| Nexoc G739 (Toshiba Exceria Pro SDXC 64 GB UHS-II) | |
| HP Omen 17-an014ng (Toshiba Exceria Pro SDXC 64 GB UHS-II) | |
| Acer Predator Helios 300 (Toshiba Exceria Pro SDXC 64 GB UHS-II) | |
| Acer Aspire V17 Nitro BE VN7-793-738J (Toshiba Exceria Pro SDXC 64 GB UHS-II) | |
| MSI GE72VR-6RF16H21 (Toshiba Exceria Pro SDXC 64 GB UHS-II) | |
| |||||||||||||||||||||||||
Distribuzione della luminosità: 93 %
Al centro con la batteria: 384 cd/m²
Contrasto: 1097:1 (Nero: 0.35 cd/m²)
ΔE ColorChecker Calman: 4.81 | ∀{0.5-29.43 Ø4.71}
ΔE Greyscale Calman: 5.33 | ∀{0.09-98 Ø4.96}
86% sRGB (Argyll 1.6.3 3D)
56% AdobeRGB 1998 (Argyll 1.6.3 3D)
62.8% AdobeRGB 1998 (Argyll 3D)
85.8% sRGB (Argyll 3D)
66.8% Display P3 (Argyll 3D)
Gamma: 2.45
CCT: 7137 K
| Acer Predator Helios 300 LG LP173WF4-SPF5 (LGD056D), 1920x1080, 17.3" | Acer Aspire V17 Nitro BE VN7-793-738J AU Optronics B173ZAN01.0, 3840x2160, 17.3" | Asus GL753VE-DS74 LG Philips LP173WF4-SPF3, 1920x1080, 17.3" | MSI GE72VR-6RF16H21 N173HHE-G32 (CMN1747), 1920x1080, 17.3" | HP Omen 17-an014ng AUO149D, 1920x1080, 17.3" | Gigabyte P57X v7 SHP145E, 3840x2160, 17.3" | Nexoc G739 CMN1738, 1920x1080, 17.3" | |
|---|---|---|---|---|---|---|---|
| Display | 34% | 28% | 3% | 35% | 4% | ||
| Display P3 Coverage (%) | 66.8 | 85.4 28% | 90.2 35% | 64.6 -3% | 87.8 31% | 66.7 0% | |
| sRGB Coverage (%) | 85.8 | 100 17% | 99.8 16% | 92.9 8% | 100 17% | 91 6% | |
| AdobeRGB 1998 Coverage (%) | 62.8 | 97.8 56% | 83.9 34% | 66.1 5% | 98.9 57% | 66.4 6% | |
| Response Times | -8% | -5% | 41% | -39% | -94% | -33% | |
| Response Time Grey 50% / Grey 80% * (ms) | 36 ? | 29 ? 19% | 36 ? -0% | 28 ? 22% | 45.2 ? -26% | 55.6 ? -54% | 45 ? -25% |
| Response Time Black / White * (ms) | 20 ? | 27 ? -35% | 22 ? -10% | 8 ? 60% | 30.4 ? -52% | 46.8 ? -134% | 28 ? -40% |
| PWM Frequency (Hz) | 119000 ? | 1000 ? | 450 ? | ||||
| Screen | 7% | 2% | 10% | 6% | 5% | 7% | |
| Brightness middle (cd/m²) | 384 | 380 -1% | 366 -5% | 270 -30% | 314 -18% | 441.3 15% | 312 -19% |
| Brightness (cd/m²) | 373 | 336 -10% | 348 -7% | 254 -32% | 309 -17% | 408 9% | 304 -18% |
| Brightness Distribution (%) | 93 | 81 -13% | 90 -3% | 86 -8% | 88 -5% | 86 -8% | 85 -9% |
| Black Level * (cd/m²) | 0.35 | 0.32 9% | 0.35 -0% | 0.26 26% | 0.34 3% | 0.44 -26% | 0.23 34% |
| Contrast (:1) | 1097 | 1188 8% | 1046 -5% | 1038 -5% | 924 -16% | 1003 -9% | 1357 24% |
| Colorchecker dE 2000 * | 4.81 | 5.32 -11% | 4.4 9% | 3.33 31% | 3.19 34% | 5.1 -6% | 4.19 13% |
| Colorchecker dE 2000 max. * | 8.69 | 7.63 12% | 9.7 -12% | 6.07 30% | 6.1 30% | 9.8 -13% | 8.7 -0% |
| Greyscale dE 2000 * | 5.33 | 4.9 8% | 3 44% | 3.46 35% | 3.49 35% | 4.3 19% | 3.72 30% |
| Gamma | 2.45 90% | 2.61 84% | 2.1 105% | 2.13 103% | 2.34 94% | 2.08 106% | 2.29 96% |
| CCT | 7137 91% | 6558 99% | 6362 102% | 7419 88% | 7261 90% | 7345 88% | 7104 91% |
| Color Space (Percent of AdobeRGB 1998) (%) | 56 | 87.2 56% | 56 0% | 75 34% | 60 7% | 87 55% | 59 5% |
| Color Space (Percent of sRGB) (%) | 86 | 100 16% | 86 0% | 100 16% | 93 8% | 100 16% | 91 6% |
| Media totale (Programma / Settaggio) | 11% /
11% | -2% /
1% | 26% /
18% | -10% /
-0% | -18% /
-2% | -7% /
1% |
* ... Meglio usare valori piccoli
Tempi di risposta del Display
| ↔ Tempi di risposta dal Nero al Bianco | ||
|---|---|---|
| 20 ms ... aumenta ↗ e diminuisce ↘ combinato | ↗ 8.4 ms Incremento | 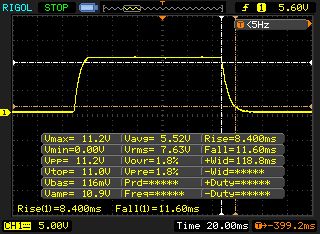 |
| ↘ 11.6 ms Calo | ||
| Lo schermo mostra buoni tempi di risposta durante i nostri tests, ma potrebbe essere troppo lento per i gamers competitivi. In confronto, tutti i dispositivi di test variano da 0.1 (minimo) a 240 (massimo) ms. » 44 % di tutti i dispositivi è migliore. Questo significa che i tempi di risposta rilevati sono simili alla media di tutti i dispositivi testati (19.8 ms). | ||
| ↔ Tempo di risposta dal 50% Grigio all'80% Grigio | ||
| 36 ms ... aumenta ↗ e diminuisce ↘ combinato | ↗ 18 ms Incremento | 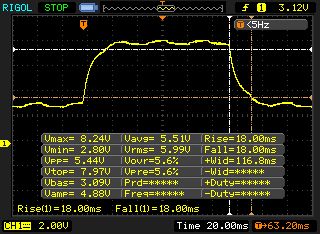 |
| ↘ 18 ms Calo | ||
| Lo schermo mostra tempi di risposta lenti nei nostri tests e sarà insoddisfacente per i gamers. In confronto, tutti i dispositivi di test variano da 0.165 (minimo) a 636 (massimo) ms. » 51 % di tutti i dispositivi è migliore. Questo significa che i tempi di risposta rilevati sono peggiori rispetto alla media di tutti i dispositivi testati (30.9 ms). | ||
Sfarfallio dello schermo / PWM (Pulse-Width Modulation)
| flickering dello schermo / PWM rilevato | 119000 Hz | ≤ 85 % settaggio luminosita' | 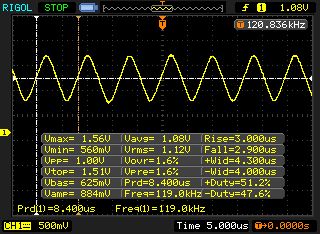 |
Il display sfarfalla a 119000 Hz (Probabilmente a causa dell'uso di PWM) Flickering rilevato ad una luminosita' di 85 % o inferiore. Non dovrebbe verificarsi flickering o PWM sopra questo valore di luminosita'. La frequenza di 119000 Hz è abbastanza alta, quindi la maggioranza degli utenti sensibili al PWM non dovrebbero notare alcun flickering. In confronto: 52 % di tutti i dispositivi testati non utilizza PWM per ridurre la luminosita' del display. Se è rilevato PWM, una media di 7744 (minimo: 5 - massimo: 343500) Hz è stata rilevata. | |||
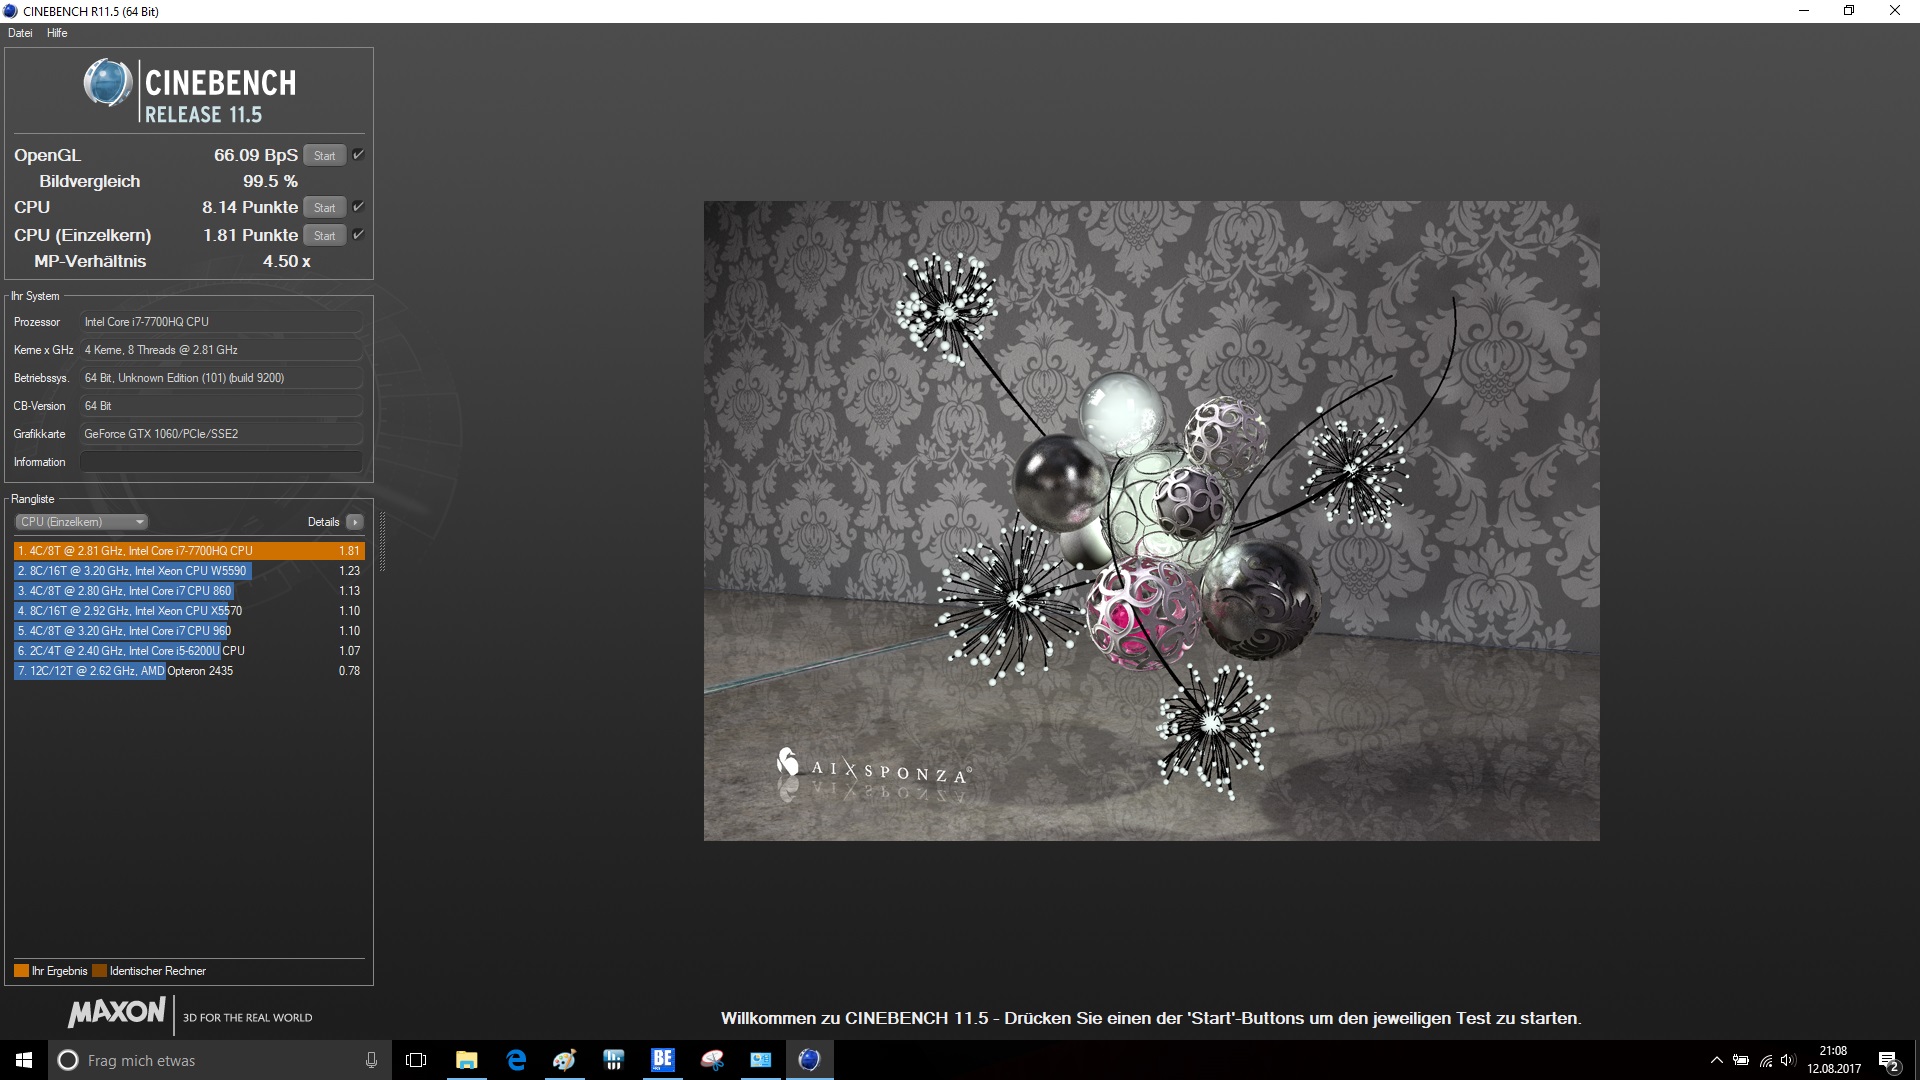
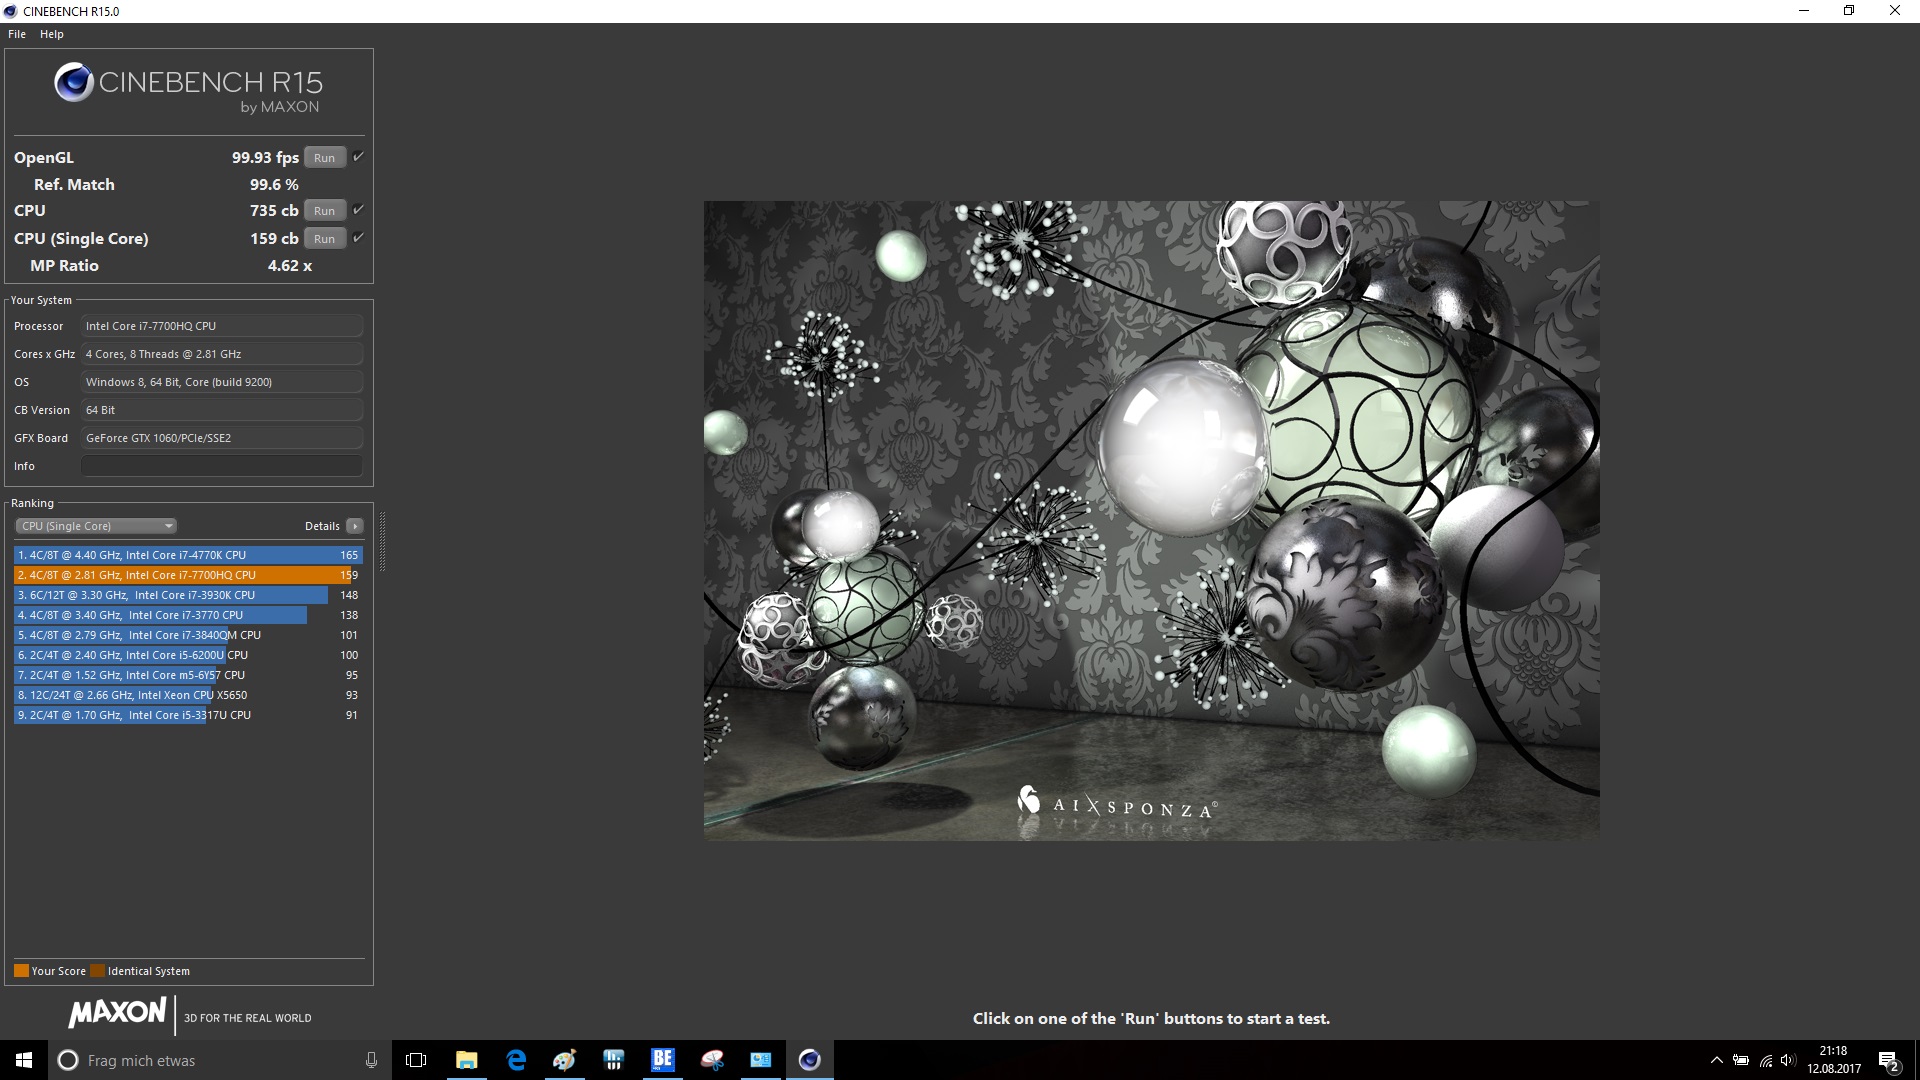
| Cinebench R11.5 | |
| CPU Single 64Bit | |
| Nexoc G739 | |
| Acer Predator Helios 300 | |
| Gigabyte P57X v7 | |
| Asus GL753VE-DS74 | |
| MSI GE72VR-6RF16H21 | |
| CPU Multi 64Bit | |
| Nexoc G739 | |
| Acer Predator Helios 300 | |
| Asus GL753VE-DS74 | |
| Gigabyte P57X v7 | |
| MSI GE72VR-6RF16H21 | |
| JetStream 1.1 - 1.1 Total | |
| Acer Aspire V17 Nitro BE VN7-793-738J | |
| Nexoc G739 | |
| Asus GL753VE-DS74 | |
| Acer Predator Helios 300 | |
| HP Omen 17-an014ng | |
| MSI GE72VR-6RF16H21 | |
| Mozilla Kraken 1.1 - Total | |
| MSI GE72VR-6RF16H21 | |
| HP Omen 17-an014ng | |
| Acer Predator Helios 300 | |
| Asus GL753VE-DS74 | |
| Nexoc G739 | |
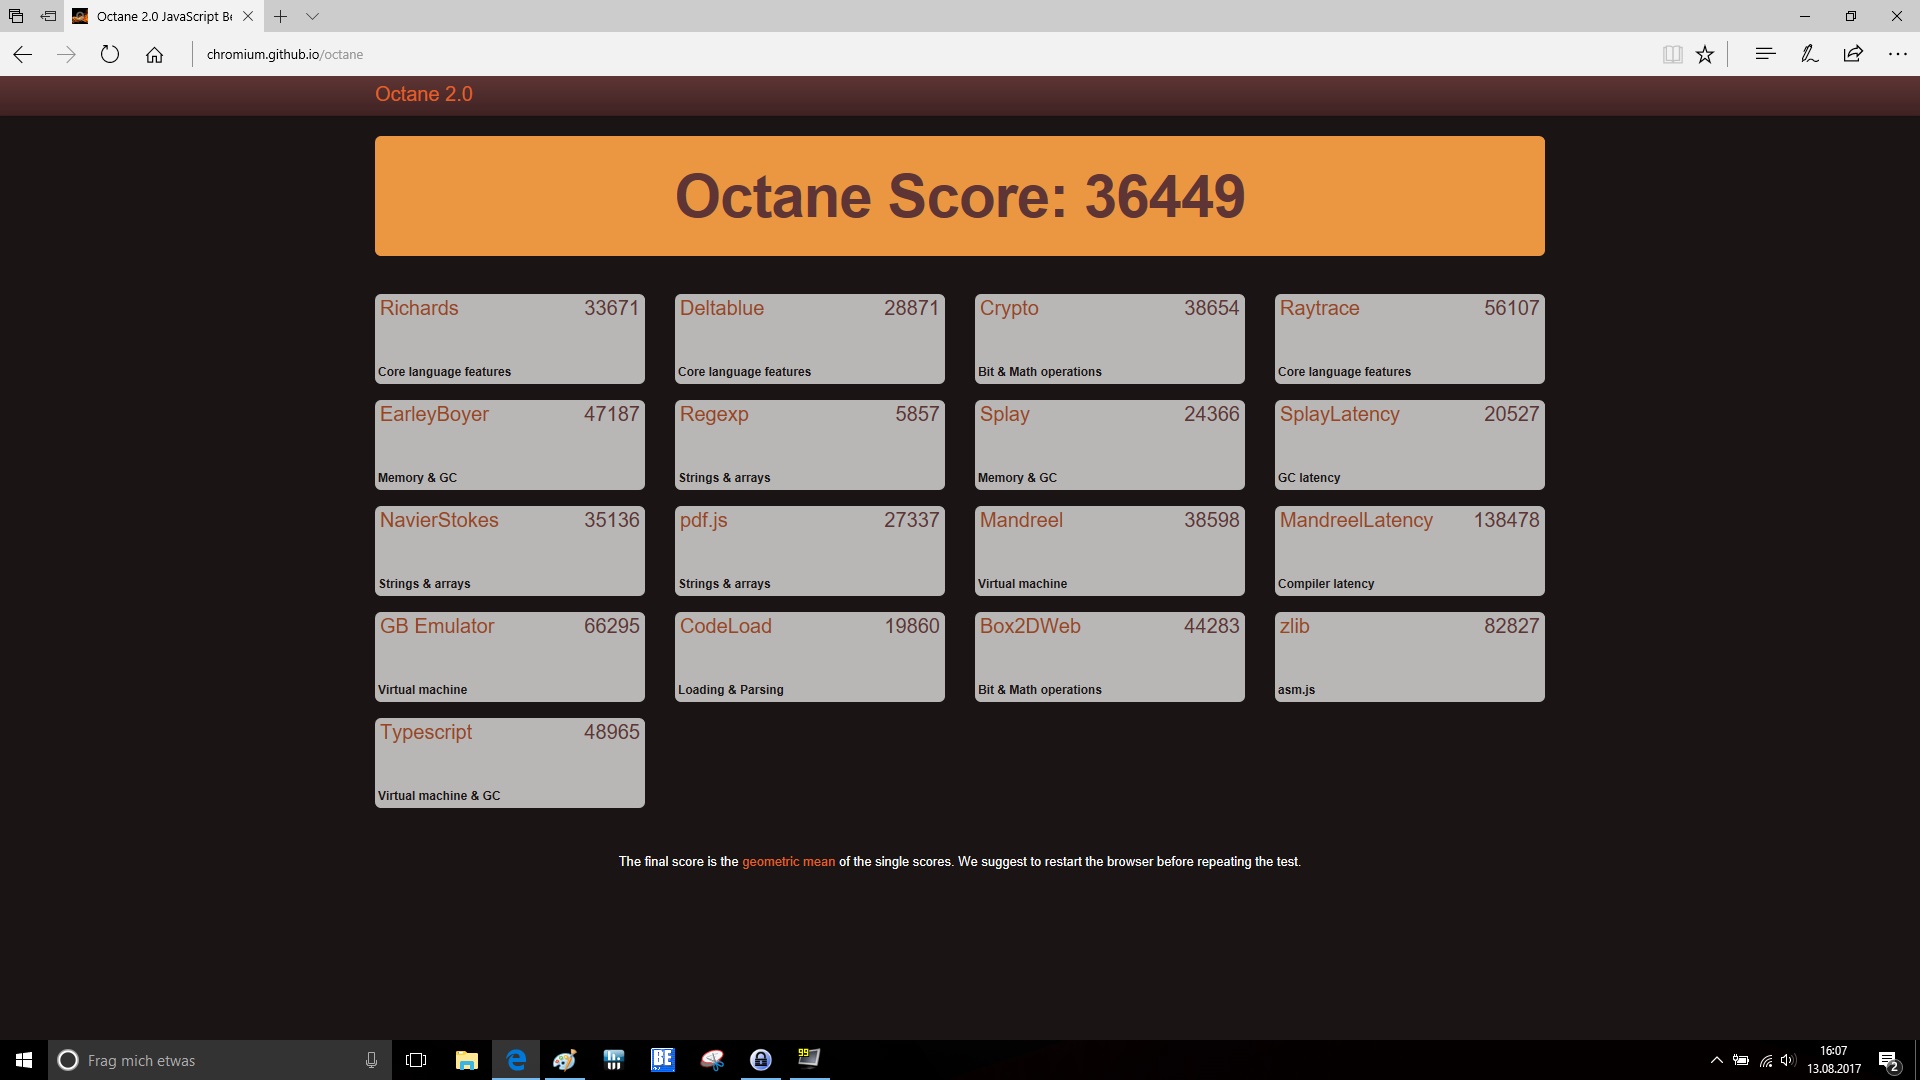
| Octane V2 - Total Score | |
| Nexoc G739 | |
| Asus GL753VE-DS74 | |
| Acer Predator Helios 300 | |
| HP Omen 17-an014ng | |
| MSI GE72VR-6RF16H21 | |
* ... Meglio usare valori piccoli


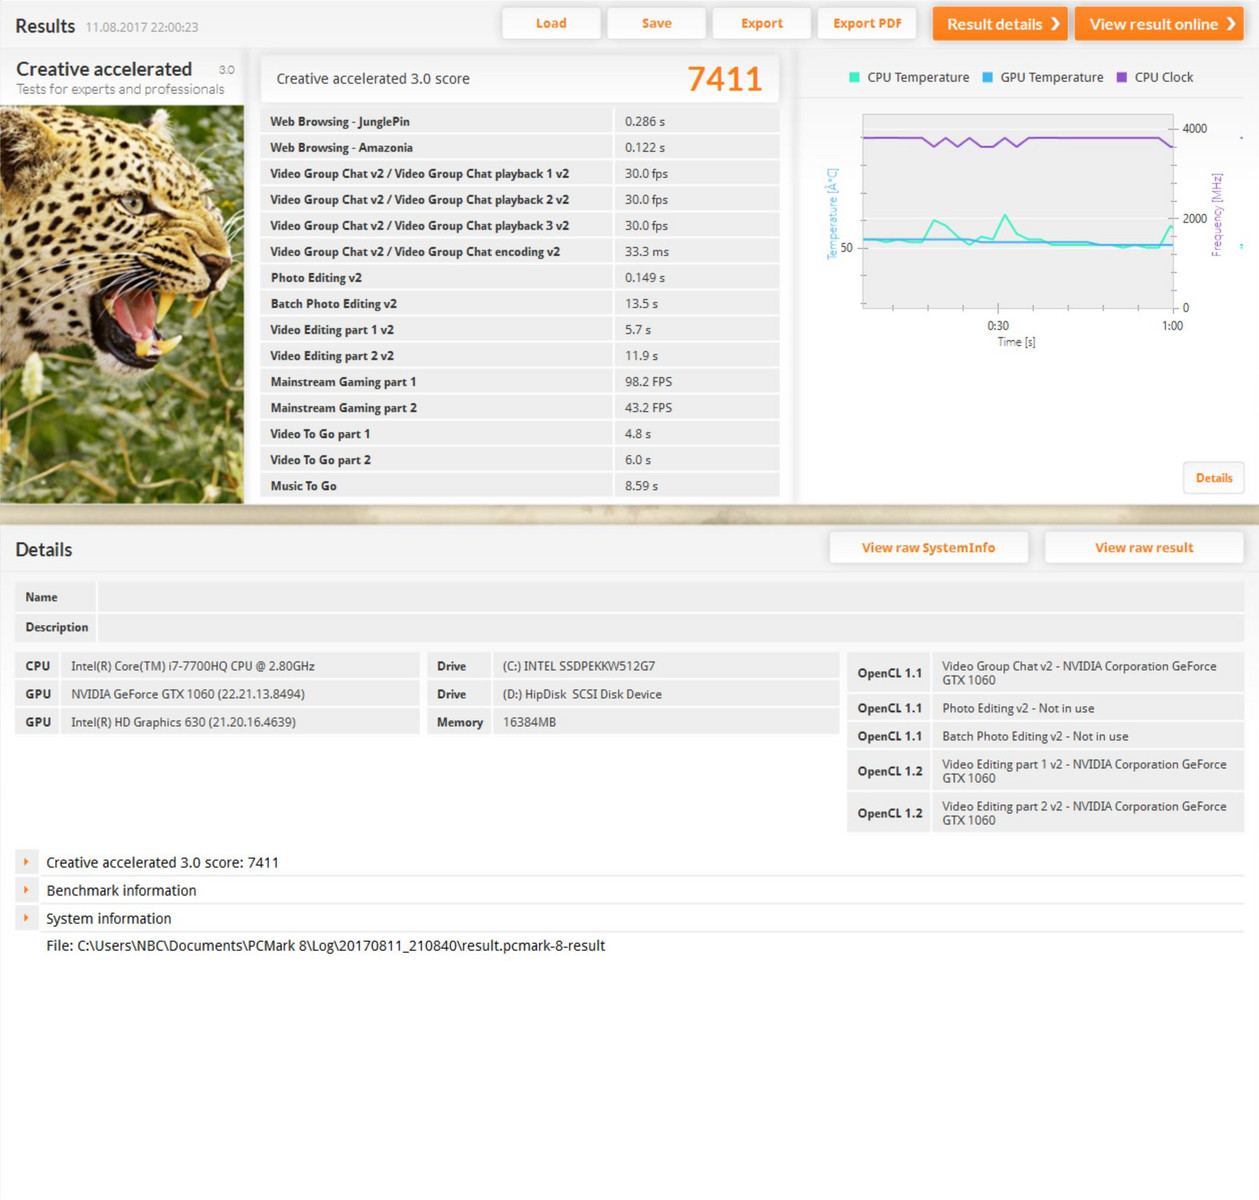
| PCMark 8 Home Score Accelerated v2 | 4874 punti | |
| PCMark 8 Creative Score Accelerated v2 | 7411 punti | |
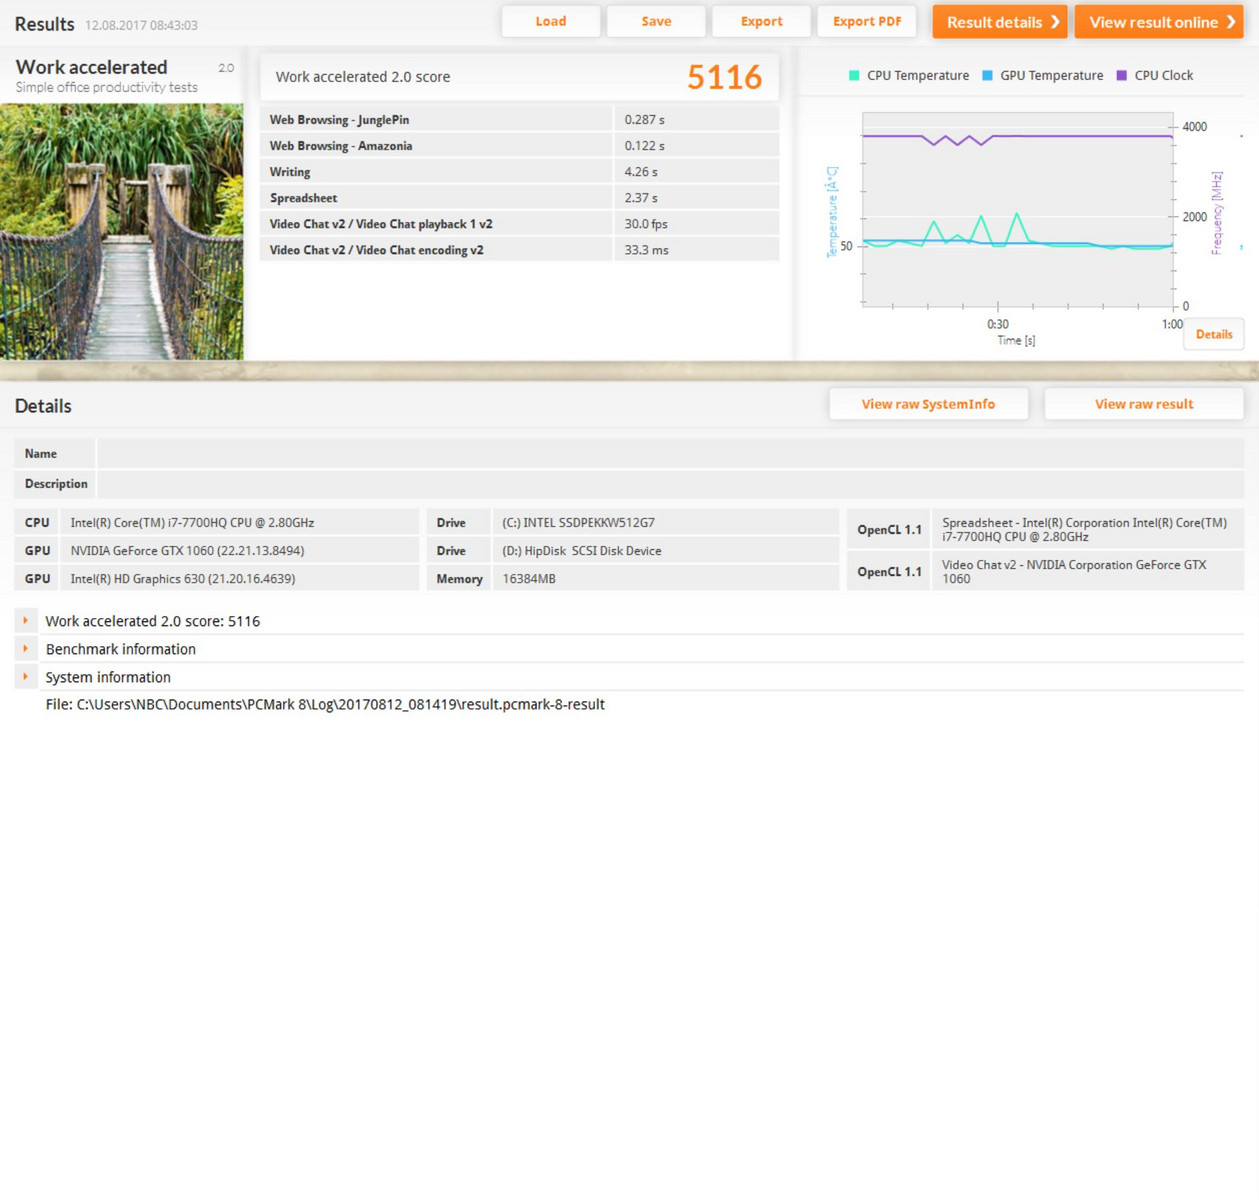
| PCMark 8 Work Score Accelerated v2 | 5116 punti | |
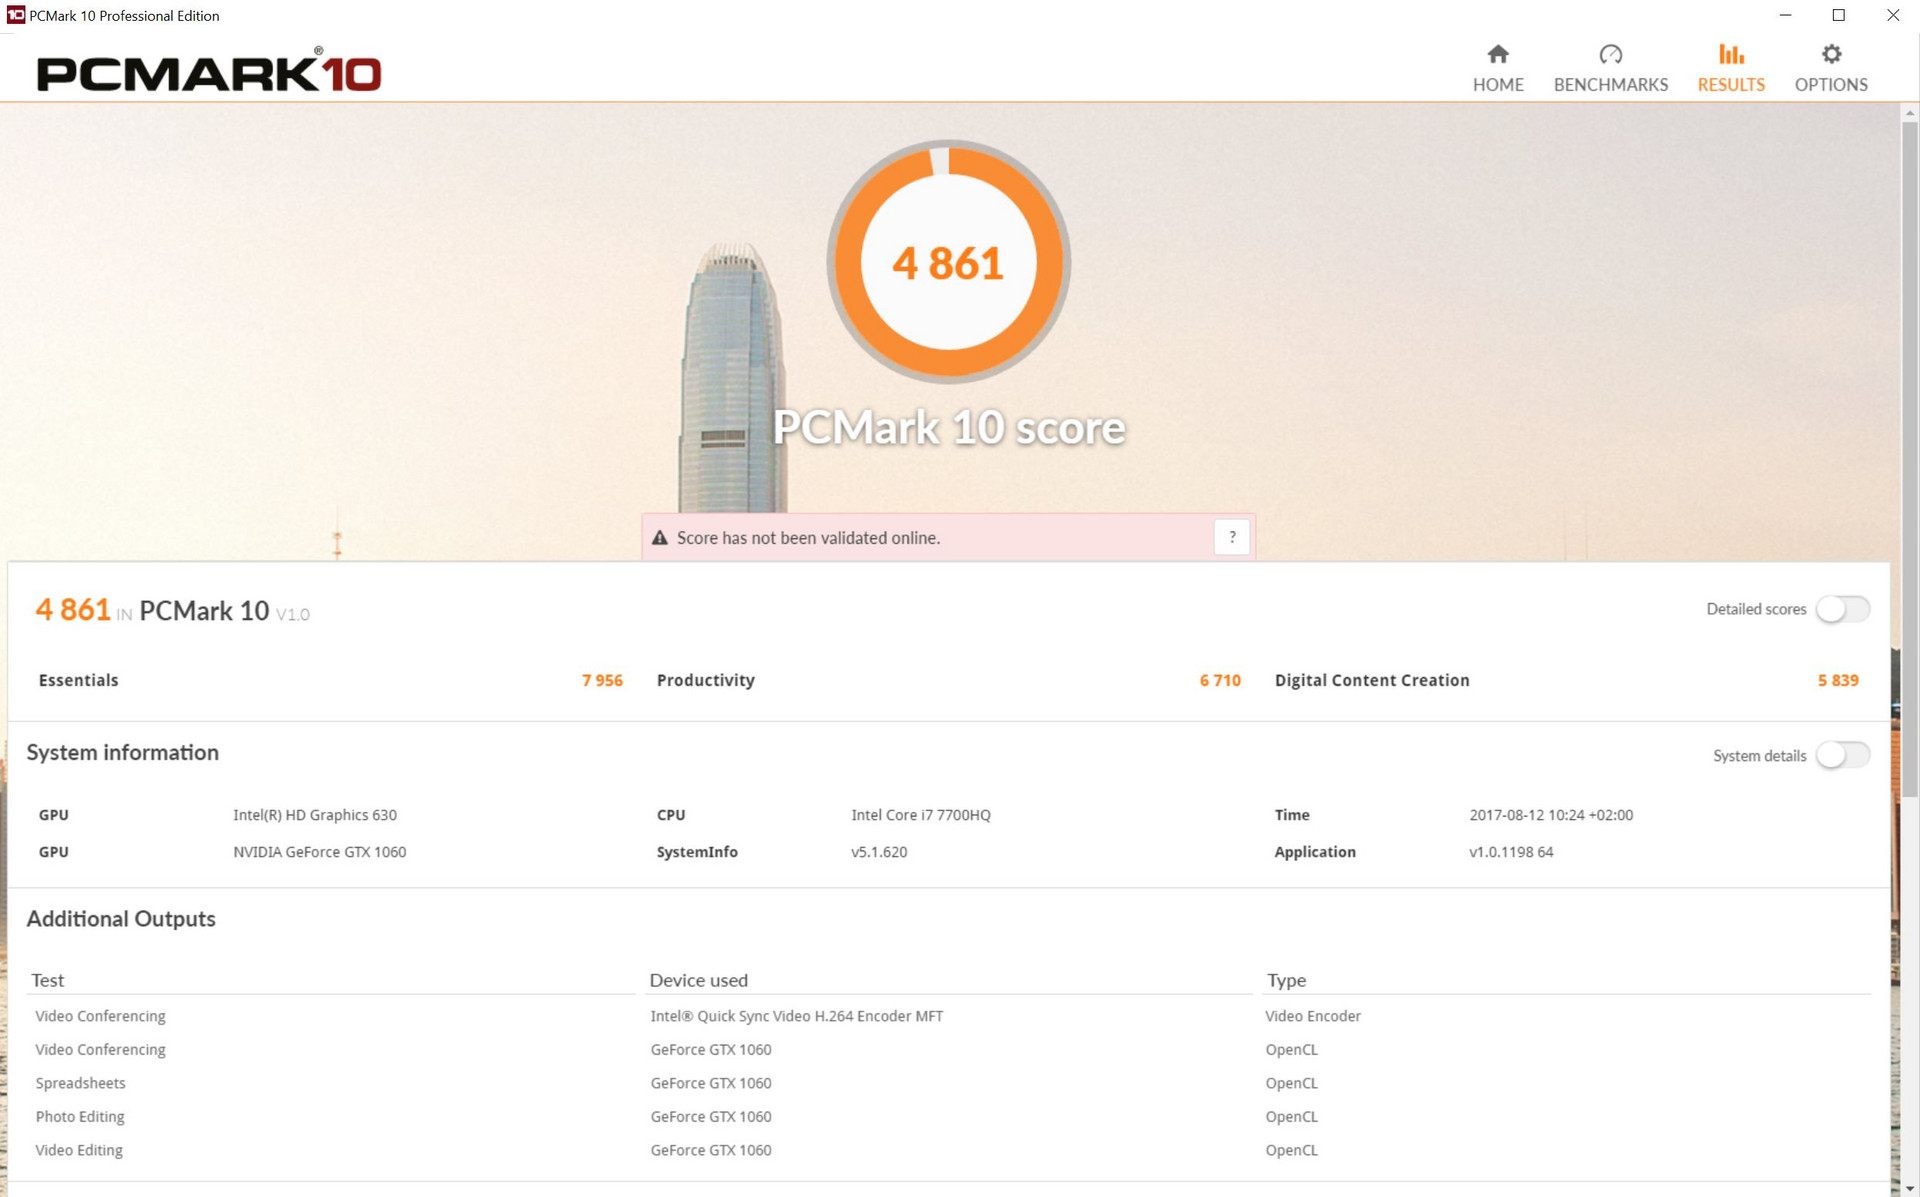
| PCMark 10 Score | 4861 punti | |
Aiuto | ||
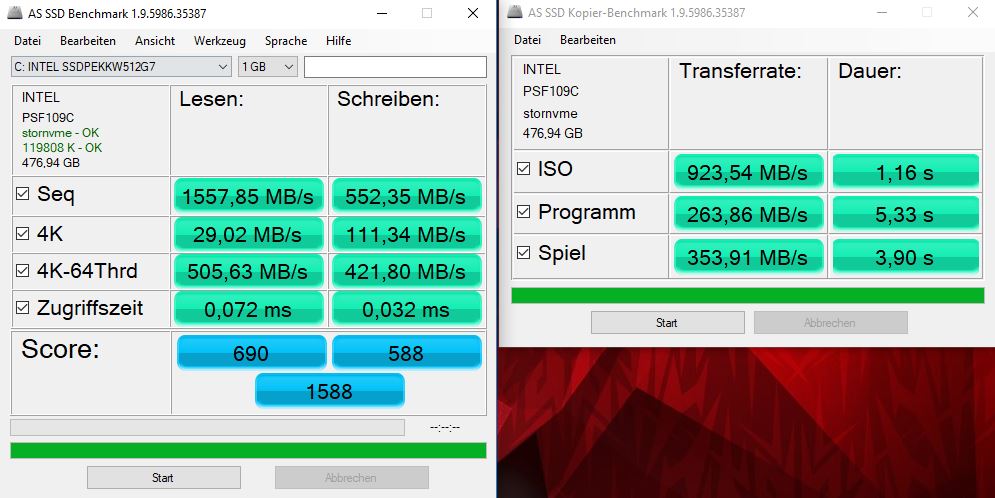
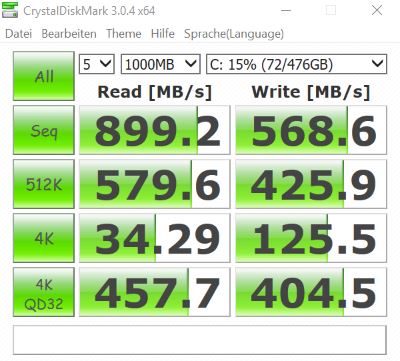
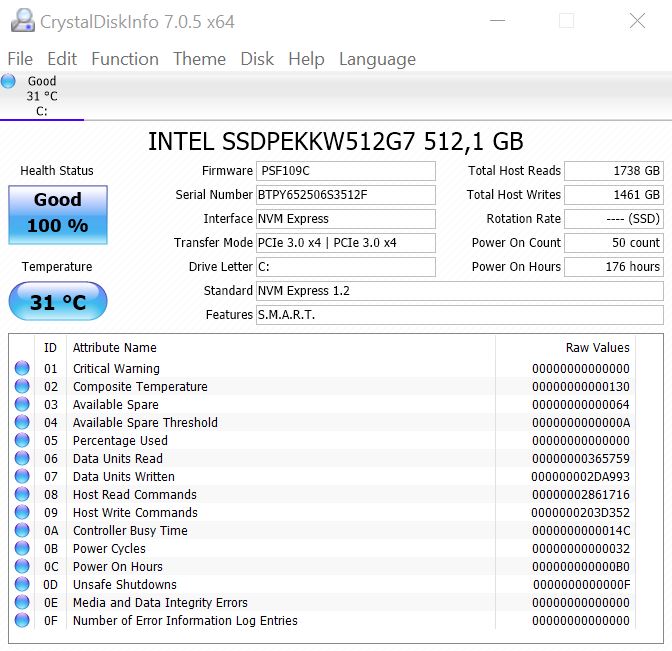
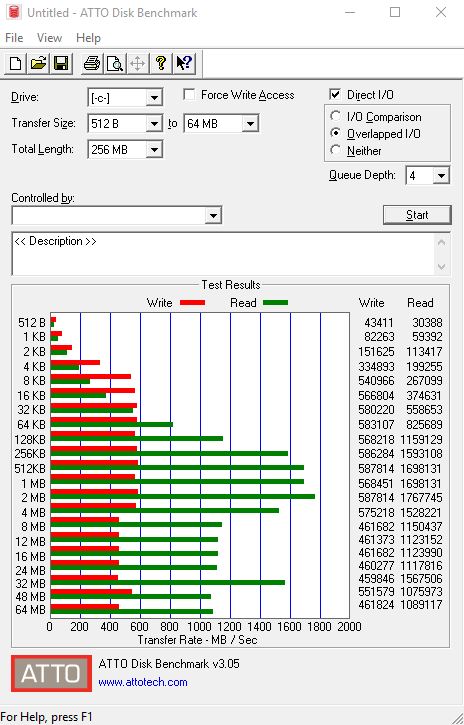
| Acer Predator Helios 300 Intel SSD 600p SSDPEKKW512G7 | Acer Aspire V17 Nitro BE VN7-793-738J Intel SSD 600p SSDPEKKW512G7 | Asus GL753VE-DS74 Intel SSD 600p SSDPEKKW512G7 | MSI GE72VR-6RF16H21 Toshiba HG6 THNSNJ256G8NY | HP Omen 17-an014ng Samsung PM961 MZVLW256HEHP | Gigabyte P57X v7 Transcend MTS800 256GB M.2 (TS256GMTS800) | Nexoc G739 Samsung PM961 MZVLW256HEHP | |
|---|---|---|---|---|---|---|---|
| CrystalDiskMark 3.0 | -3% | -21% | -39% | 66% | -36% | 64% | |
| Read Seq (MB/s) | 899 | 880 -2% | 1049 17% | 510 -43% | 1736 93% | 517 -42% | 1666 85% |
| Write Seq (MB/s) | 569 | 581 2% | 584 3% | 274.6 -52% | 1212 113% | 305.7 -46% | 1192 109% |
| Read 512 (MB/s) | 580 | 725 25% | 583 1% | 427.2 -26% | 1044 80% | 315 -46% | 857 48% |
| Write 512 (MB/s) | 425.9 | 429.3 1% | 458 8% | 247.2 -42% | 854 101% | 306.1 -28% | 827 94% |
| Read 4k (MB/s) | 34.29 | 10.46 -69% | 14.1 -59% | 21.23 -38% | 59.1 72% | 26.04 -24% | 60.7 77% |
| Write 4k (MB/s) | 125.5 | 123.4 -2% | 108 -14% | 86.8 -31% | 144.9 15% | 82.3 -34% | 154.5 23% |
| Read 4k QD32 (MB/s) | 457.7 | 459.2 0% | 57.8 -87% | 335.4 -27% | 582 27% | 281.3 -39% | 636 39% |
| Write 4k QD32 (MB/s) | 404.5 | 496.9 23% | 264 -35% | 178.1 -56% | 523 29% | 296 -27% | 544 34% |

| 3DMark | |
| 1280x720 Cloud Gate Standard Graphics | |
| HP Omen 17-an014ng | |
| Acer Predator Helios 300 | |
| Gigabyte P57X v7 | |
| MSI GE72VR-6RF16H21 | |
| Nexoc G739 | |
| Asus GL753VE-DS74 | |
| 1920x1080 Fire Strike Graphics | |
| HP Omen 17-an014ng | |
| Gigabyte P57X v7 | |
| Acer Predator Helios 300 | |
| MSI GE72VR-6RF16H21 | |
| Acer Aspire V17 Nitro BE VN7-793-738J | |
| Nexoc G739 | |
| Asus GL753VE-DS74 | |
| 3DMark 11 - 1280x720 Performance GPU | |
| Gigabyte P57X v7 | |
| HP Omen 17-an014ng | |
| Acer Predator Helios 300 | |
| MSI GE72VR-6RF16H21 | |
| Acer Aspire V17 Nitro BE VN7-793-738J | |
| Nexoc G739 | |

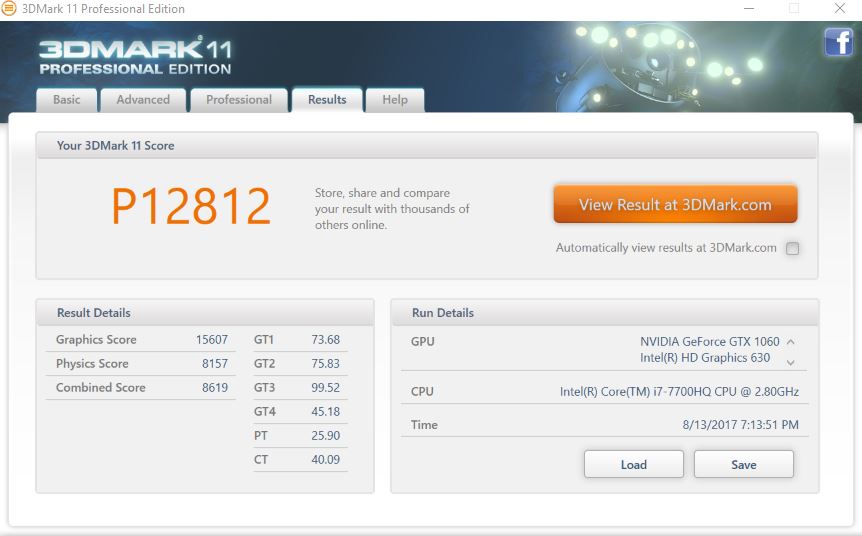
| 3DMark 11 Performance | 12812 punti | |
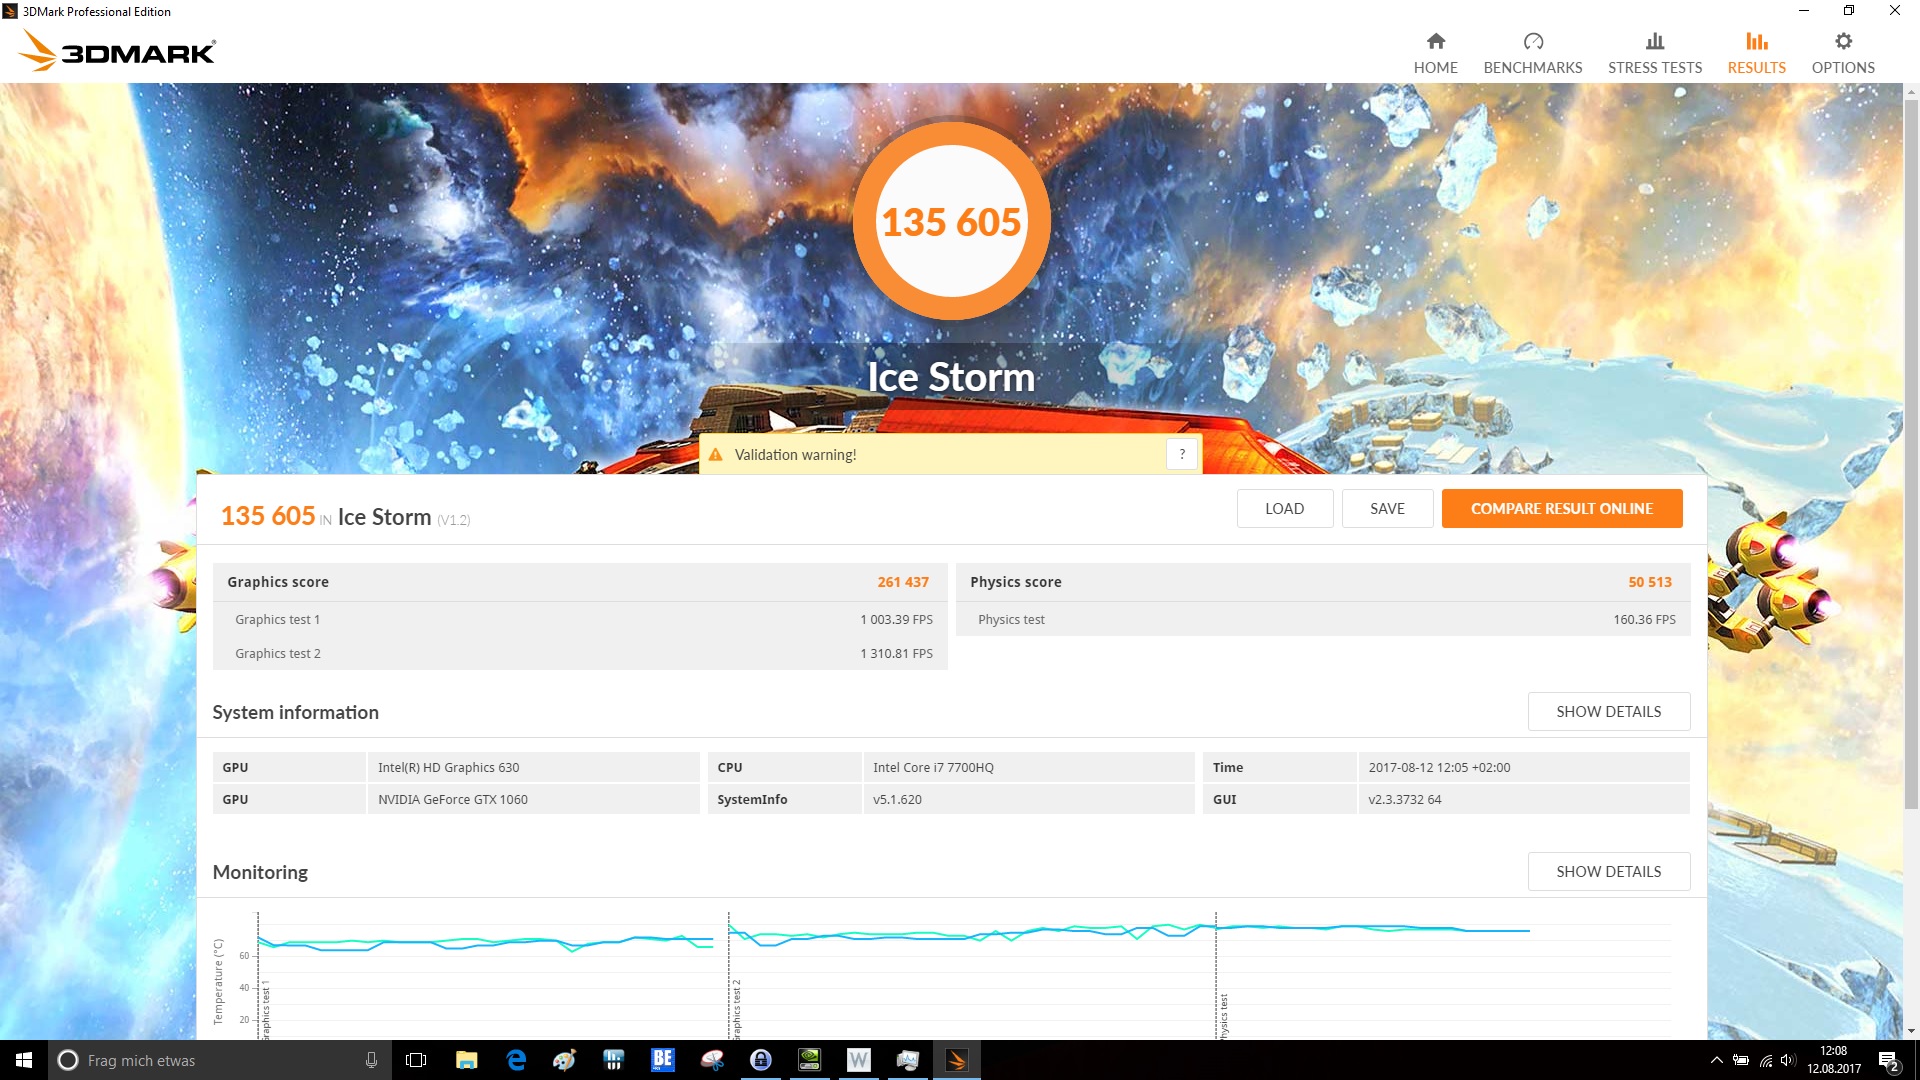
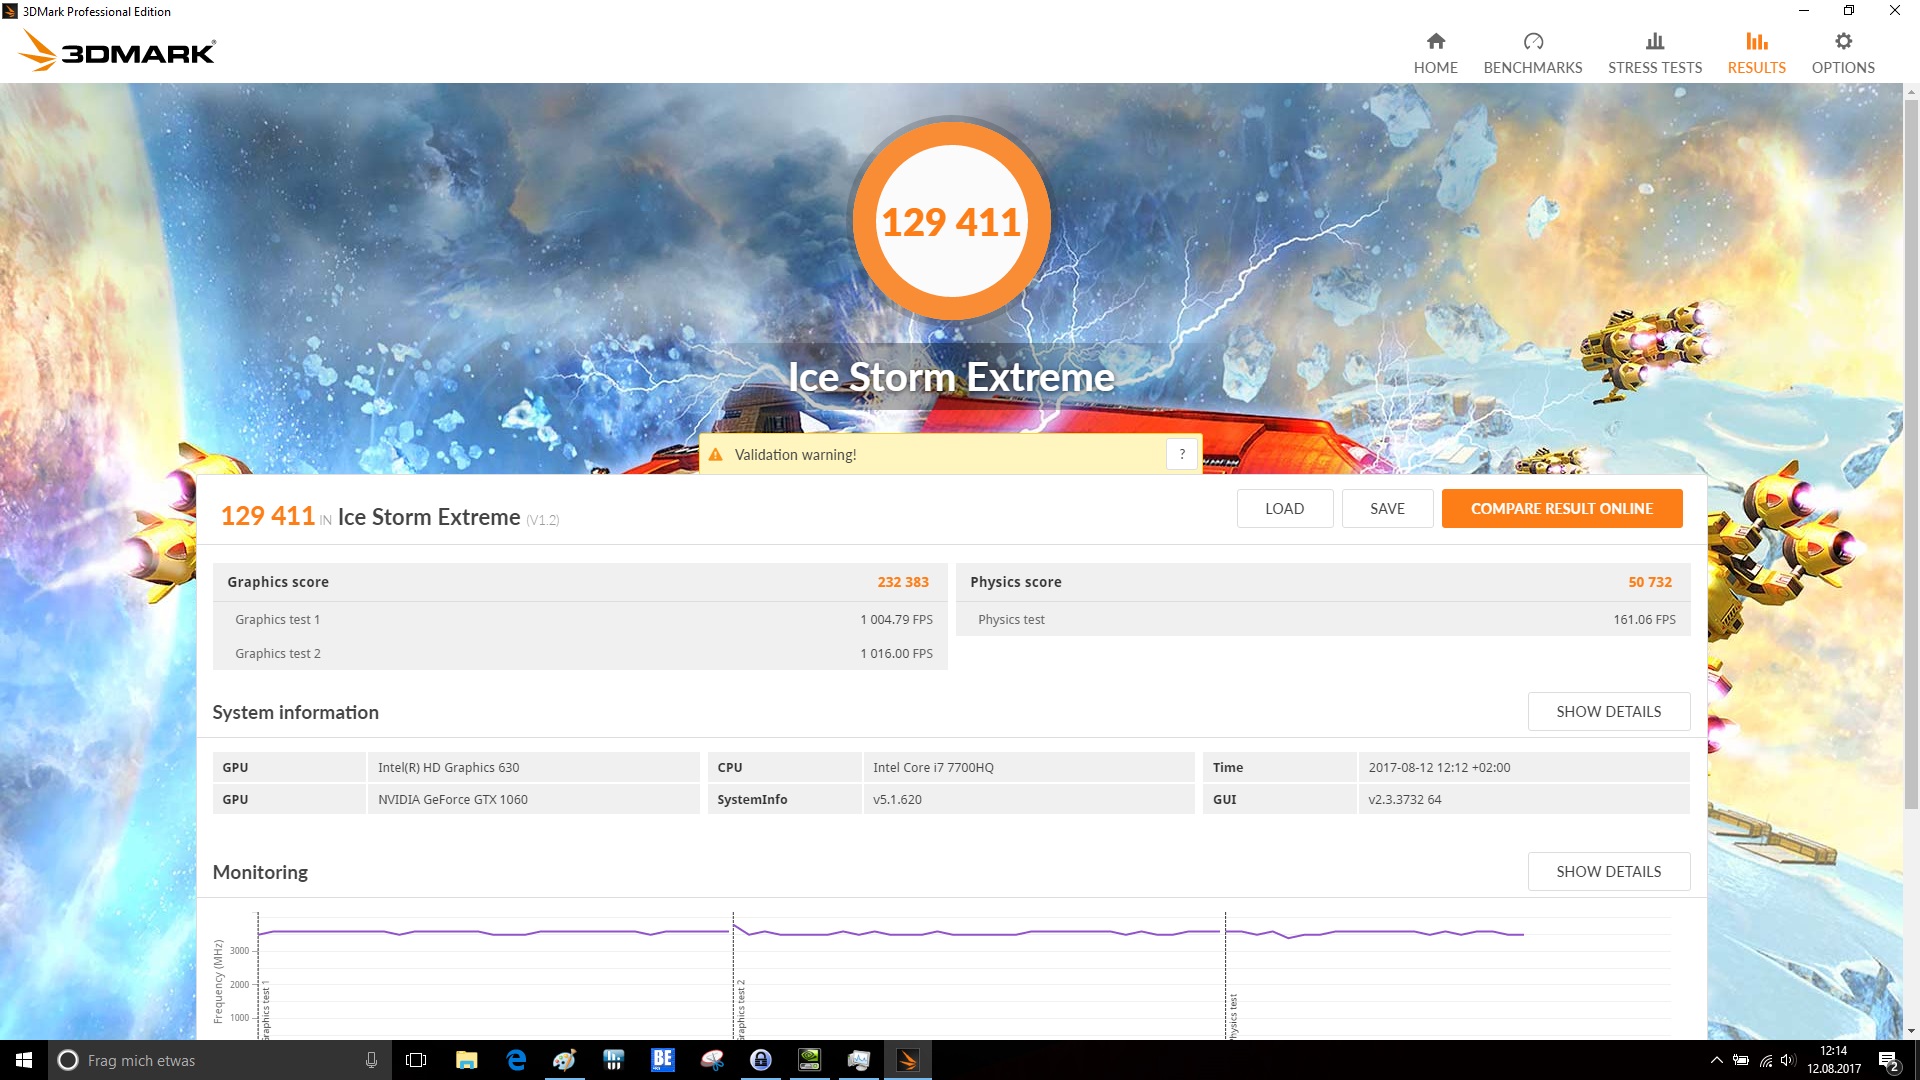
| 3DMark Ice Storm Standard Score | 135605 punti | |
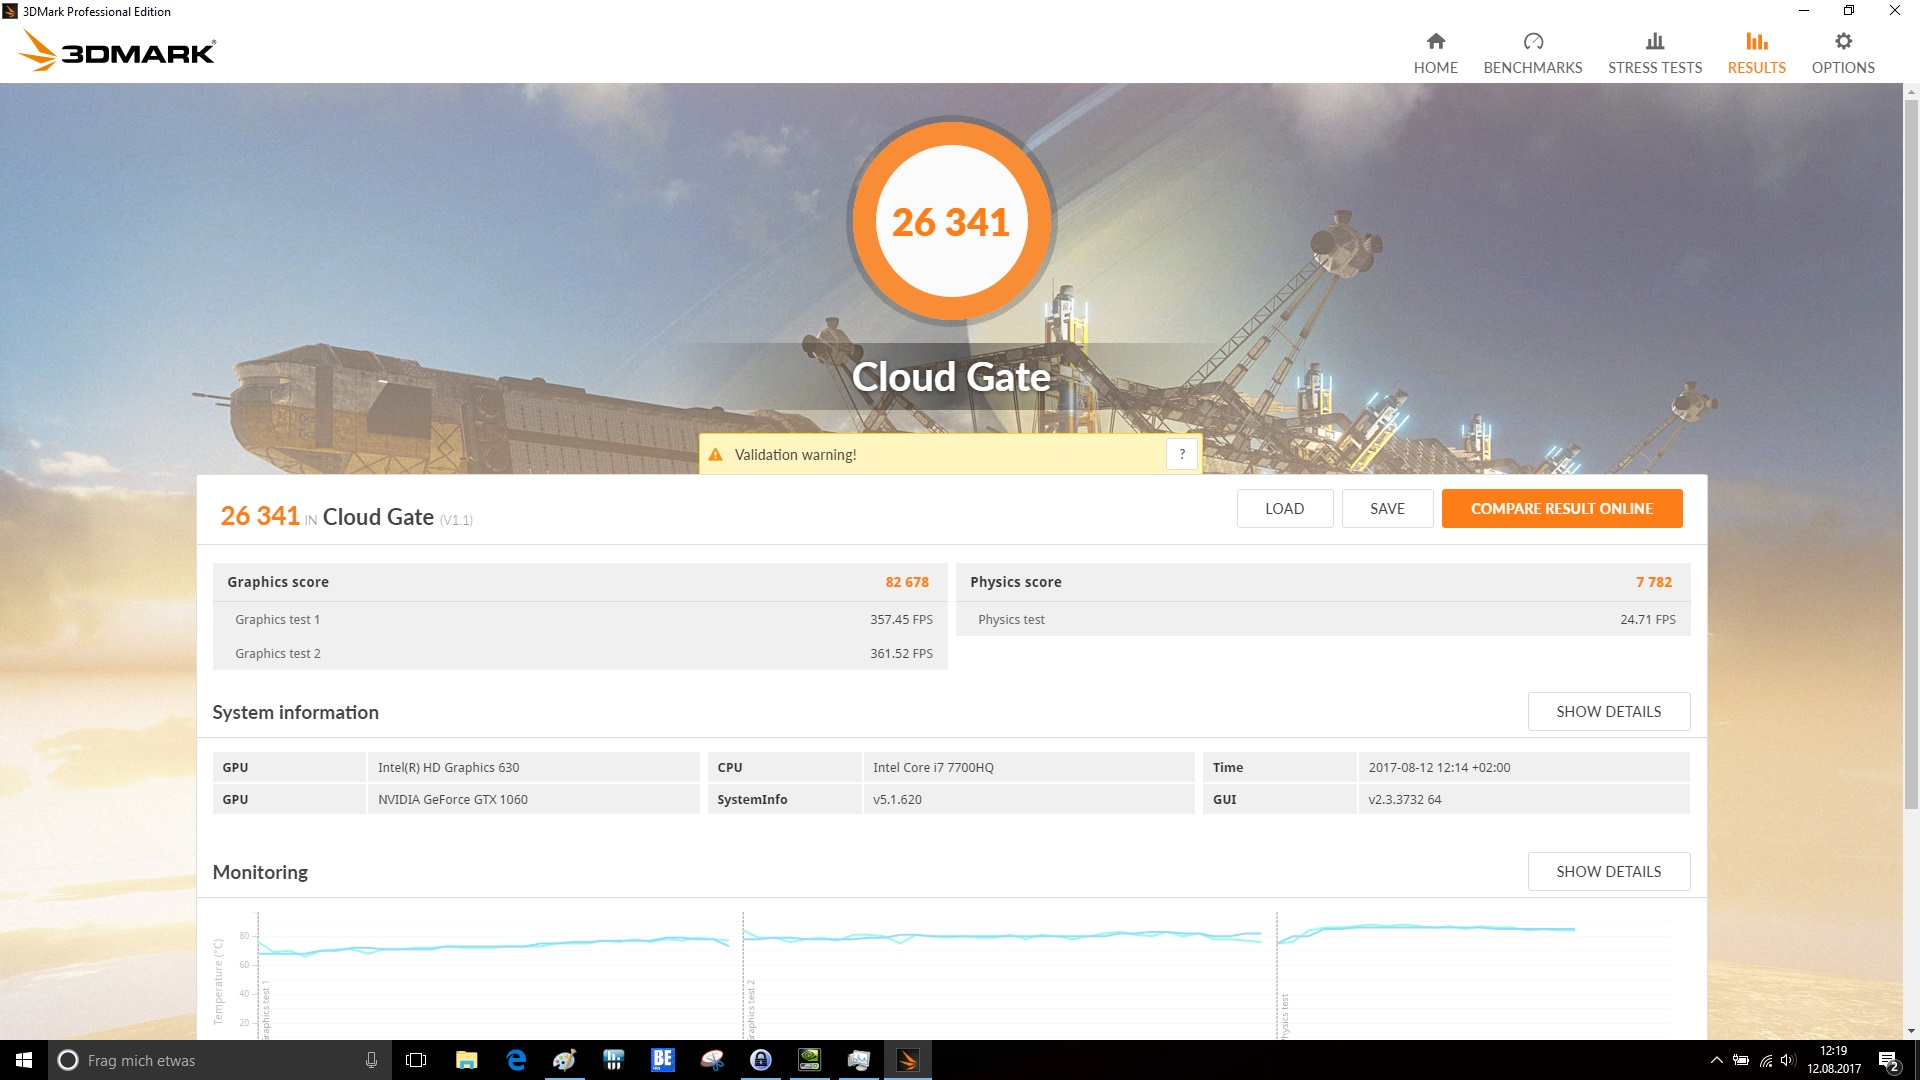
| 3DMark Cloud Gate Standard Score | 26341 punti | |
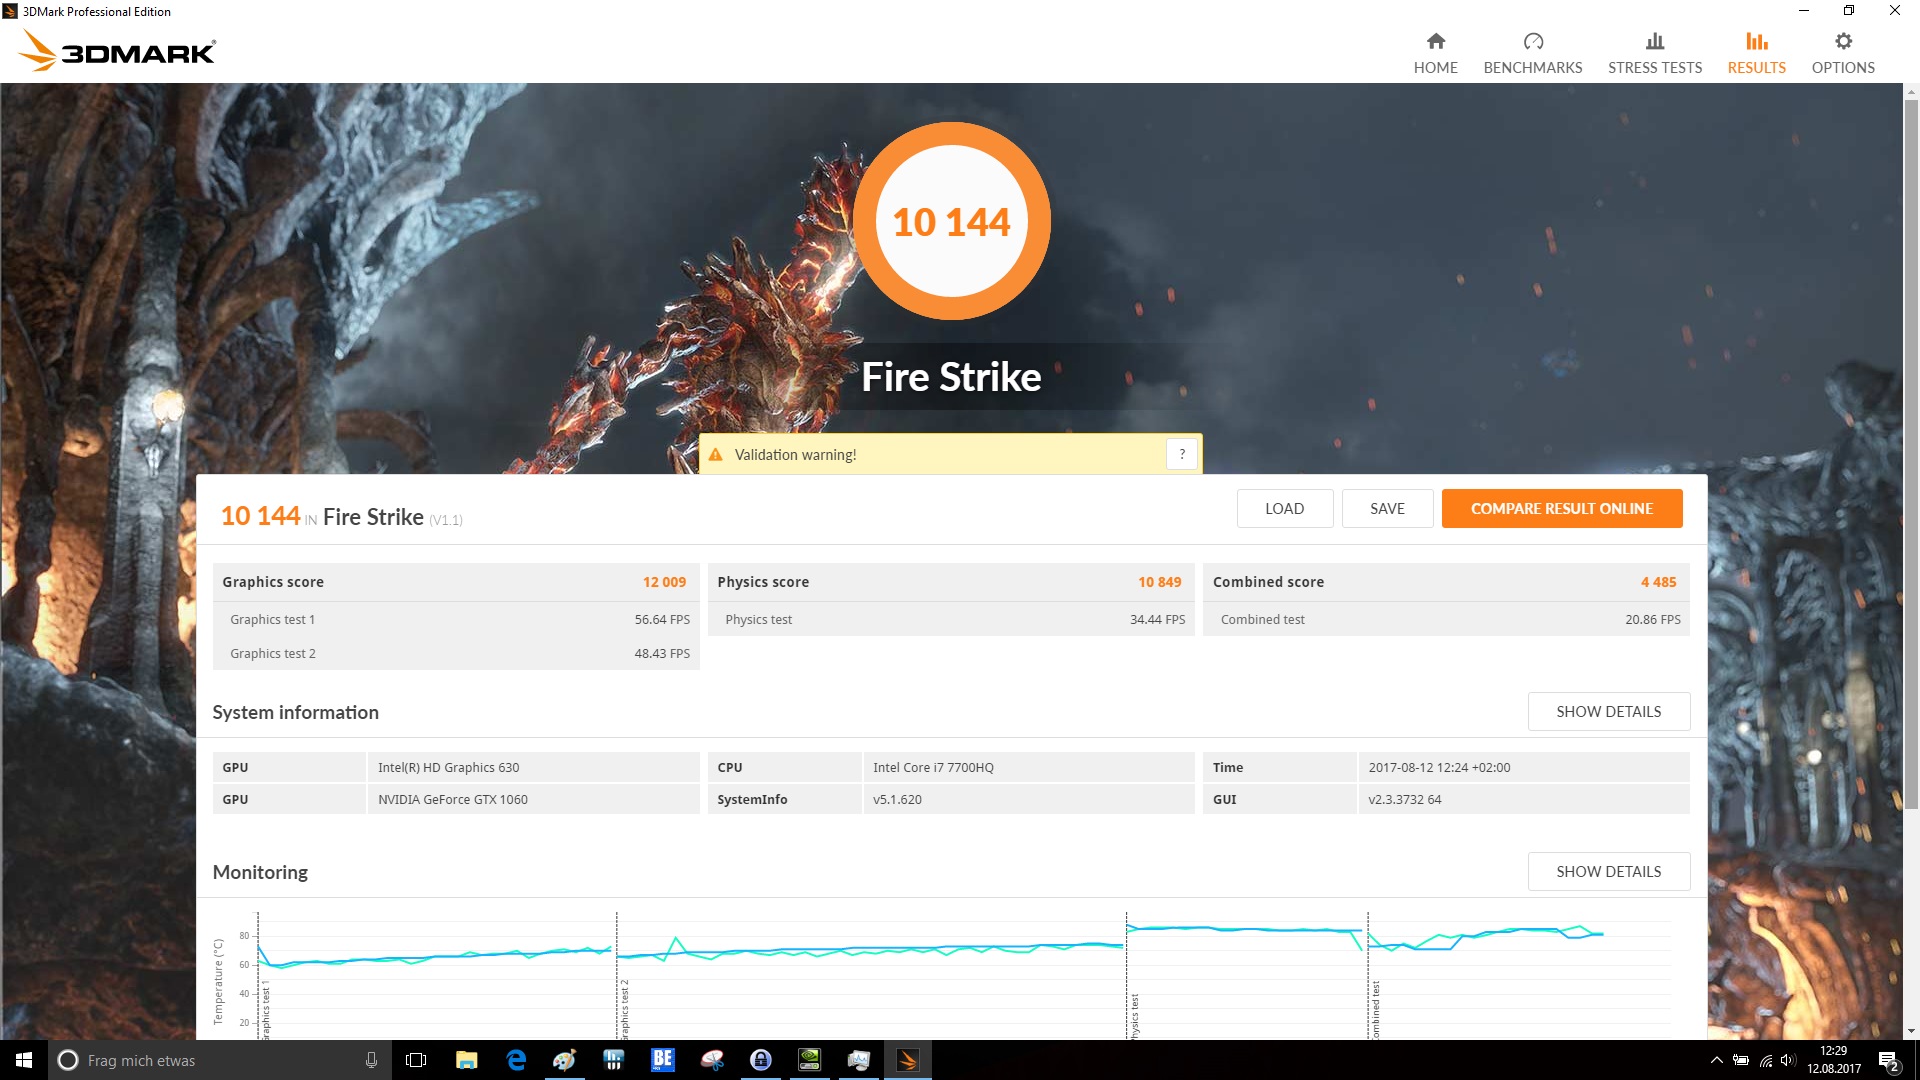
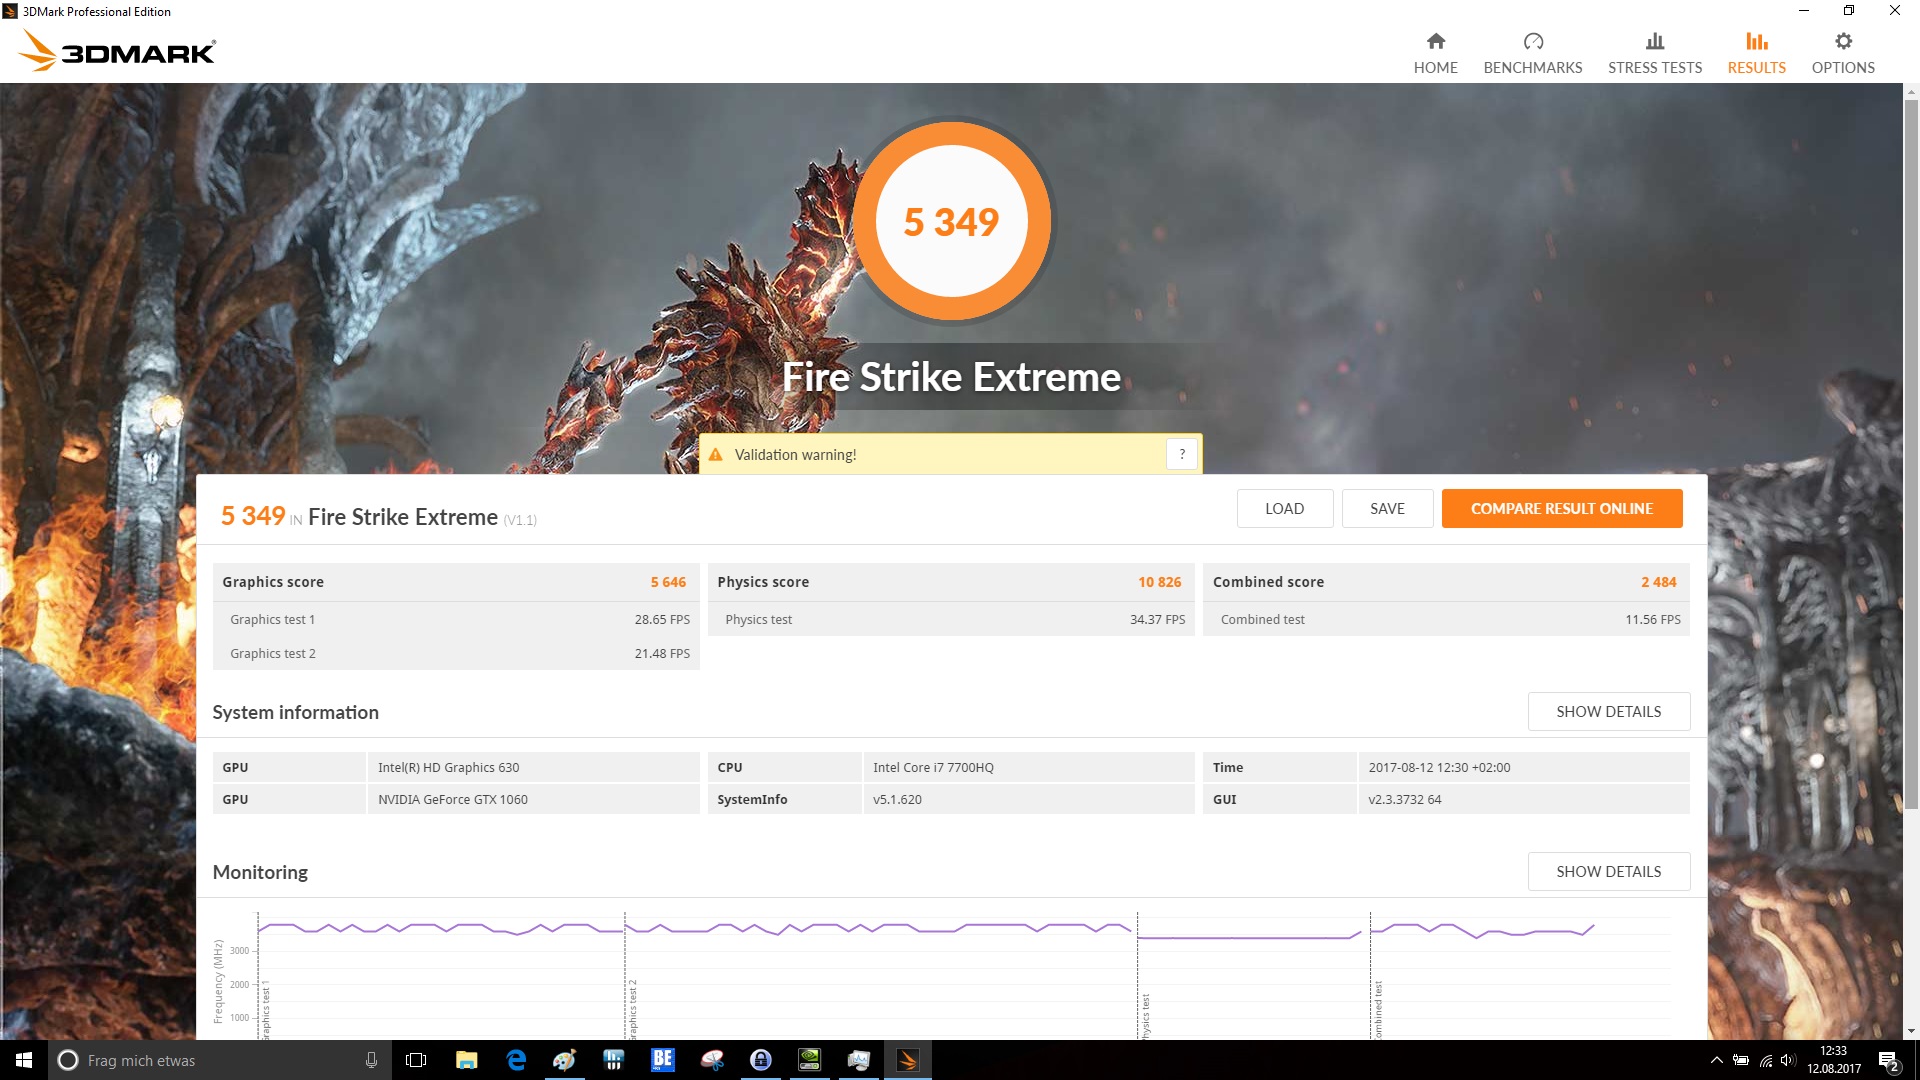
| 3DMark Fire Strike Score | 10144 punti | |
| 3DMark Fire Strike Extreme Score | 5349 punti | |
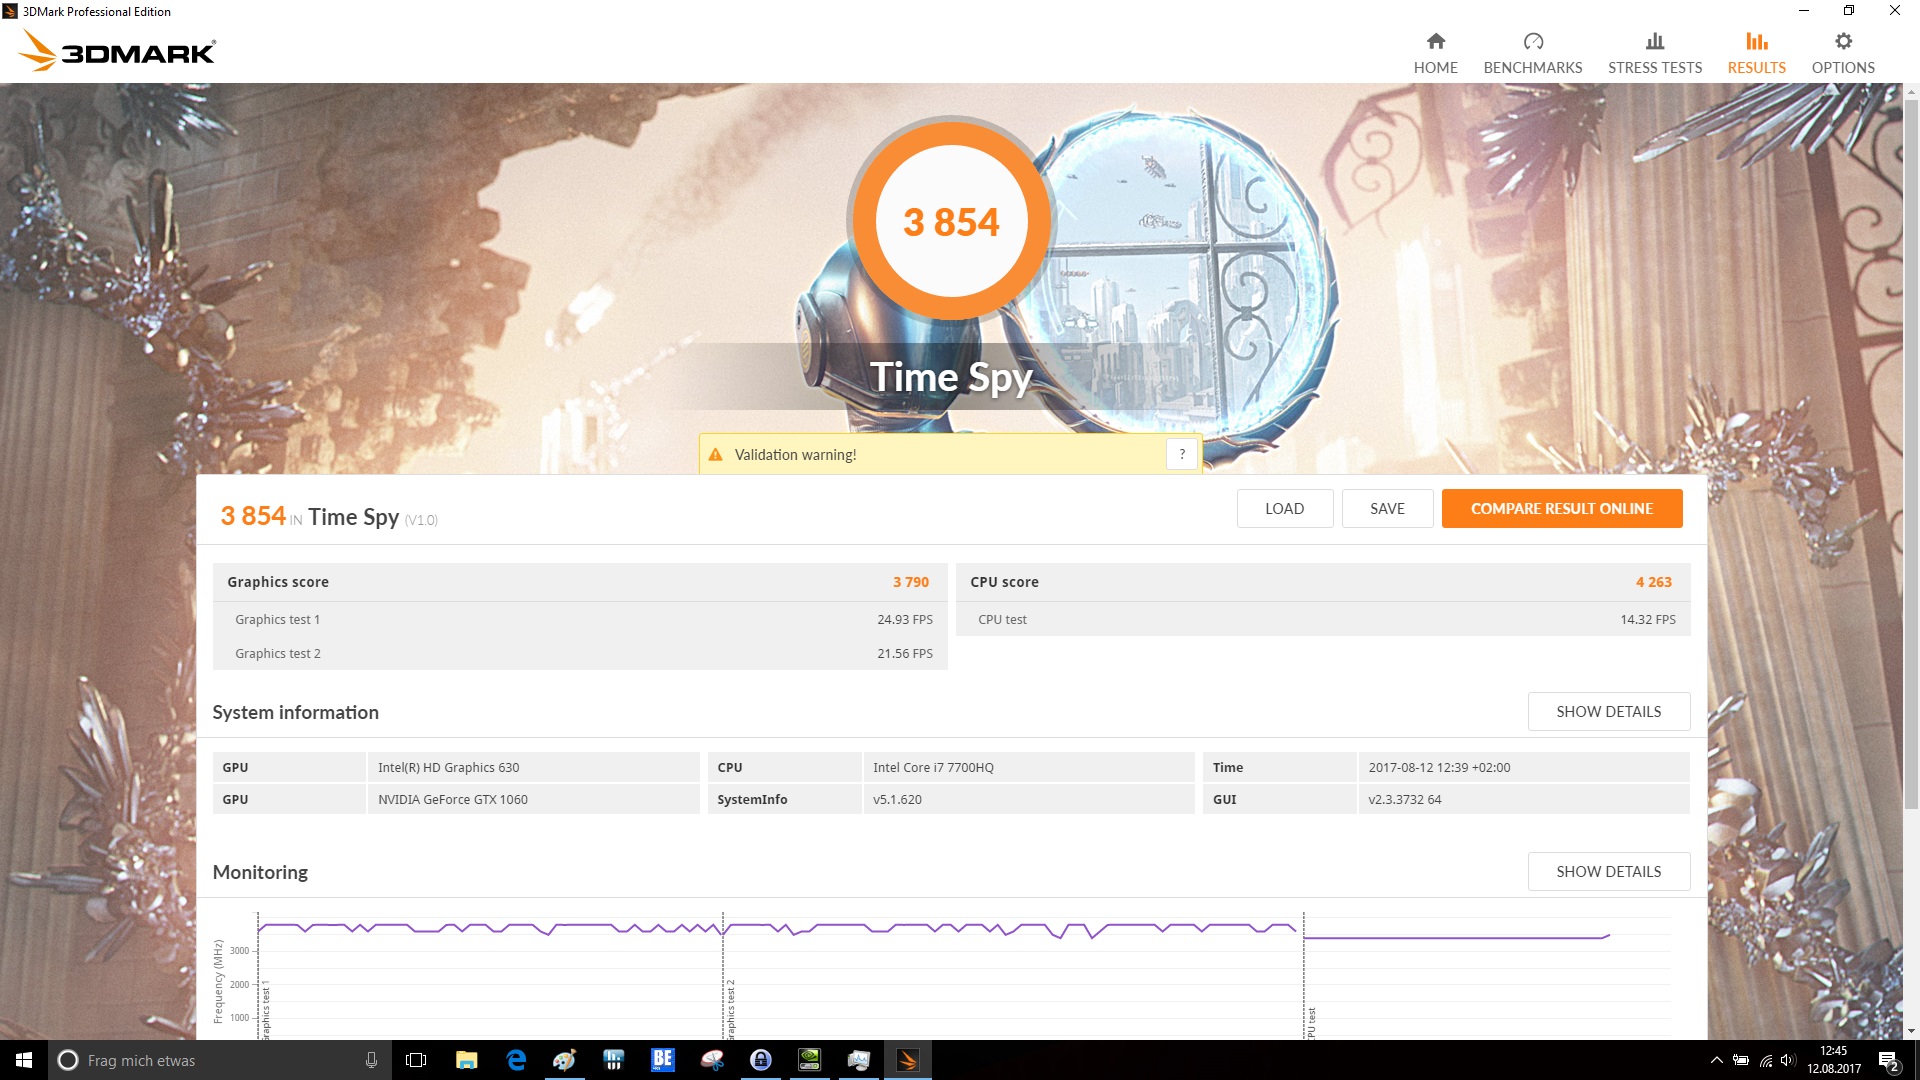
| 3DMark Time Spy Score | 3854 punti | |
Aiuto | ||
| The Witcher 3 - 1920x1080 Ultra Graphics & Postprocessing (HBAO+) | |
| HP Omen 17-an014ng | |
| Acer Predator Helios 300 | |
| MSI GE72VR-6RF16H21 | |
| Asus GL753VE-DS74 | |
| Nexoc G739 | |
| BioShock Infinite - 1920x1080 Ultra Preset, DX11 (DDOF) | |
| Gigabyte P57X v7 | |
| Acer Aspire V17 Nitro BE VN7-793-738J | |
| MSI GE72VR-6RF16H21 | |
| Asus GL753VE-DS74 | |
| Acer Predator Helios 300 | |
| Nexoc G739 | |
| Ghost Recon Wildlands - 1920x1080 Ultra Preset AA:T AF:16x | |
| Acer Predator Helios 300 | |
| Acer Aspire V17 Nitro BE VN7-793-738J | |
| Battlefield 1 - 1920x1080 Ultra Preset AA:T | |
| Acer Predator Helios 300 | |
| Nexoc G739 | |
| Far Cry Primal - 1920x1080 Ultra Preset AA:SM | |
| Acer Predator Helios 300 | |
| Acer Predator Helios 300 | |
| Acer Aspire V17 Nitro BE VN7-793-738J | |
| Deus Ex Mankind Divided - 1920x1080 Ultra Preset AA:2xMS AF:8x | |
| Acer Predator Helios 300 | |
| MSI GE72VR-6RF16H21 | |
| For Honor - 1920x1080 Extreme Preset AA:T AF:16x | |
| Acer Predator Helios 300 | |
| Acer Aspire V17 Nitro BE VN7-793-738J | |
| Nexoc G739 | |
| basso | medio | alto | ultra | 4K | |
|---|---|---|---|---|---|
| BioShock Infinite (2013) | 255.5 | 204.6 | 194.7 | 87.5 | |
| Battlefield 4 (2013) | 199.9 | 198.6 | 195.9 | 106 | 49.8 |
| The Witcher 3 (2015) | 198.3 | 135 | 71.7 | 38.9 | 26.1 |
| Rise of the Tomb Raider (2016) | 203.1 | 135.3 | 77.8 | 65.7 | 27.2 |
| Far Cry Primal (2016) | 122 | 92 | 82 | 62 | 26 |
| The Division (2016) | 217.3 | 146.3 | 73.3 | 57.4 | 26.9 |
| Deus Ex Mankind Divided (2016) | 140.4 | 109.1 | 59.9 | 31.2 | 19.1 |
| Battlefield 1 (2016) | 177.8 | 142.5 | 93.2 | 83.6 | 32.8 |
| For Honor (2017) | 226 | 107.1 | 101.1 | 72.3 | 30.2 |
| Ghost Recon Wildlands (2017) | 140 | 73.6 | 67.2 | 38.4 | 25.3 |
| Mass Effect Andromeda (2017) | 131.4 | 85.7 | 59.3 | 53.8 | 21.5 |
Rumorosità
| Idle |
| 31 / 32 / 33 dB(A) |
| Sotto carico |
| 44 / 50 dB(A) |
 | ||
30 dB silenzioso 40 dB(A) udibile 50 dB(A) rumoroso |
||
min: | ||
| Acer Predator Helios 300 i7-7700HQ, GeForce GTX 1060 Mobile | Acer Aspire V17 Nitro BE VN7-793-738J i7-7700HQ, GeForce GTX 1060 Mobile | Asus GL753VE-DS74 i7-7700HQ, GeForce GTX 1050 Ti Mobile | MSI GE72VR-6RF16H21 6700HQ, GeForce GTX 1060 Mobile | HP Omen 17-an014ng i7-7700HQ, GeForce GTX 1070 Mobile | Gigabyte P57X v7 i7-7700HQ, GeForce GTX 1070 Mobile | Nexoc G739 i7-7700HQ, GeForce GTX 1050 Ti Mobile | |
|---|---|---|---|---|---|---|---|
| Noise | 5% | 0% | -4% | -6% | 1% | -2% | |
| off /ambiente * (dB) | 31 | 30.8 1% | 29.1 6% | 31 -0% | 30 3% | 29 6% | 30 3% |
| Idle Minimum * (dB) | 31 | 31.4 -1% | 33.3 -7% | 34 -10% | 30 3% | 30.4 2% | 31 -0% |
| Idle Average * (dB) | 32 | 31.4 2% | 33.3 -4% | 35 -9% | 37 -16% | 32.1 -0% | 32 -0% |
| Idle Maximum * (dB) | 33 | 31.4 5% | 33.4 -1% | 36 -9% | 39 -18% | 32.1 3% | 38 -15% |
| Load Average * (dB) | 44 | 38.6 12% | 42.6 3% | 40 9% | 44 -0% | 45.6 -4% | 44 -0% |
| Witcher 3 ultra * (dB) | 46 | 46.8 -2% | 47 -2% | ||||
| Load Maximum * (dB) | 50 | 44.3 11% | 46.8 6% | 51 -2% | 55 -10% | 51.5 -3% | 50 -0% |
* ... Meglio usare valori piccoli
(-) La temperatura massima sul lato superiore è di 57 °C / 135 F, rispetto alla media di 40.4 °C / 105 F, che varia da 21.2 a 68.8 °C per questa classe Gaming.
(-) Il lato inferiore si riscalda fino ad un massimo di 59 °C / 138 F, rispetto alla media di 43.2 °C / 110 F
(+) In idle, la temperatura media del lato superiore è di 30.6 °C / 87 F, rispetto alla media deld ispositivo di 33.9 °C / 93 F.
(-) Riproducendo The Witcher 3, la temperatura media per il lato superiore e' di 42.2 °C / 108 F, rispetto alla media del dispositivo di 33.9 °C / 93 F.
(+) I poggiapolsi e il touchpad raggiungono la temperatura massima della pelle (35 °C / 95 F) e quindi non sono caldi.
(-) La temperatura media della zona del palmo della mano di dispositivi simili e'stata di 28.8 °C / 83.8 F (-6.2 °C / -11.2 F).
| Acer Predator Helios 300 i7-7700HQ, GeForce GTX 1060 Mobile | Acer Aspire V17 Nitro BE VN7-793-738J i7-7700HQ, GeForce GTX 1060 Mobile | Asus GL753VE-DS74 i7-7700HQ, GeForce GTX 1050 Ti Mobile | MSI GE72VR-6RF16H21 6700HQ, GeForce GTX 1060 Mobile | HP Omen 17-an014ng i7-7700HQ, GeForce GTX 1070 Mobile | Gigabyte P57X v7 i7-7700HQ, GeForce GTX 1070 Mobile | Nexoc G739 i7-7700HQ, GeForce GTX 1050 Ti Mobile | |
|---|---|---|---|---|---|---|---|
| Heat | 9% | 35% | 13% | 2% | 10% | 15% | |
| Maximum Upper Side * (°C) | 57 | 56 2% | 35.8 37% | 48.8 14% | 48 16% | 51.2 10% | 50.6 11% |
| Maximum Bottom * (°C) | 59 | 48.7 17% | 36.4 38% | 48.2 18% | 54 8% | 56.8 4% | 50.8 14% |
| Idle Upper Side * (°C) | 36 | 30.9 14% | 22.2 38% | 30.1 16% | 35 3% | 29.2 19% | 28.7 20% |
| Idle Bottom * (°C) | 31 | 30.6 1% | 22.2 28% | 30.4 2% | 37 -19% | 29.2 6% | 27.1 13% |
* ... Meglio usare valori piccoli
Acer Predator Helios 300 analisi audio
(±) | potenza degli altiparlanti media ma buona (81 dB)
Bassi 100 - 315 Hz
(-) | quasi nessun basso - in media 15.1% inferiori alla media
(-) | bassi non lineari (18.3% delta rispetto alla precedente frequenza)
Medi 400 - 2000 Hz
(±) | medi elevati - circa 8.2% superiore alla media
(+) | medi lineari (5.3% delta rispetto alla precedente frequenza)
Alti 2 - 16 kHz
(+) | Alti bilanciati - appena 1.8% dalla media
(+) | alti lineari (6.6% delta rispetto alla precedente frequenza)
Nel complesso 100 - 16.000 Hz
(±) | la linearità complessiva del suono è media (19.1% di differenza rispetto alla media
Rispetto alla stessa classe
» 64% di tutti i dispositivi testati in questa classe è stato migliore, 7% simile, 28% peggiore
» Il migliore ha avuto un delta di 6%, medio di 18%, peggiore di 132%
Rispetto a tutti i dispositivi testati
» 46% di tutti i dispositivi testati in questa classe è stato migliore, 7% similare, 47% peggiore
» Il migliore ha avuto un delta di 4%, medio di 23%, peggiore di 134%
Acer Aspire V17 Nitro BE VN7-793-738J analisi audio
(±) | potenza degli altiparlanti media ma buona (72 dB)
Bassi 100 - 315 Hz
(±) | bassi ridotti - in media 5.7% inferiori alla media
(+) | bassi in lineaa (5% delta rispetto alla precedente frequenza)
Medi 400 - 2000 Hz
(+) | medi bilanciati - solo only 4.4% rispetto alla media
(+) | medi lineari (6% delta rispetto alla precedente frequenza)
Alti 2 - 16 kHz
(+) | Alti bilanciati - appena 3% dalla media
(±) | la linearità degli alti è media (7.2% delta rispetto alla precedente frequenza)
Nel complesso 100 - 16.000 Hz
(+) | suono nel complesso lineare (12.5% differenza dalla media)
Rispetto alla stessa classe
» 15% di tutti i dispositivi testati in questa classe è stato migliore, 3% simile, 81% peggiore
» Il migliore ha avuto un delta di 6%, medio di 18%, peggiore di 132%
Rispetto a tutti i dispositivi testati
» 11% di tutti i dispositivi testati in questa classe è stato migliore, 2% similare, 86% peggiore
» Il migliore ha avuto un delta di 4%, medio di 23%, peggiore di 134%
| Off / Standby | |
| Idle | |
| Sotto carico |
|
Leggenda:
min: | |
| Acer Predator Helios 300 i7-7700HQ, GeForce GTX 1060 Mobile | Acer Aspire V17 Nitro BE VN7-793-738J i7-7700HQ, GeForce GTX 1060 Mobile | Asus GL753VE-DS74 i7-7700HQ, GeForce GTX 1050 Ti Mobile | MSI GE72VR-6RF16H21 6700HQ, GeForce GTX 1060 Mobile | HP Omen 17-an014ng i7-7700HQ, GeForce GTX 1070 Mobile | Gigabyte P57X v7 i7-7700HQ, GeForce GTX 1070 Mobile | Nexoc G739 i7-7700HQ, GeForce GTX 1050 Ti Mobile | |
|---|---|---|---|---|---|---|---|
| Power Consumption | -25% | 16% | -35% | -79% | -79% | -5% | |
| Idle Minimum * (Watt) | 7 | 10.5 -50% | 7.5 -7% | 13 -86% | 22 -214% | 15.7 -124% | 7 -0% |
| Idle Average * (Watt) | 13 | 20.5 -58% | 11.3 13% | 20 -54% | 28 -115% | 23.4 -80% | 14 -8% |
| Idle Maximum * (Watt) | 20 | 22 -10% | 11.8 41% | 26 -30% | 35 -75% | 23.5 -18% | 23 -15% |
| Load Average * (Watt) | 81 | 91 -12% | 82.1 -1% | 83 -2% | 93 -15% | 184.6 -128% | 82 -1% |
| Witcher 3 ultra * (Watt) | 127 | 96.3 24% | 157 -24% | ||||
| Load Maximum * (Watt) | 162 | 155 4% | 116.6 28% | 169 -4% | 208 -28% | 233.1 -44% | 163 -1% |
* ... Meglio usare valori piccoli
| Acer Predator Helios 300 i7-7700HQ, GeForce GTX 1060 Mobile, 48 Wh | Acer Aspire V17 Nitro BE VN7-793-738J i7-7700HQ, GeForce GTX 1060 Mobile, 69 Wh | Asus GL753VE-DS74 i7-7700HQ, GeForce GTX 1050 Ti Mobile, 48 Wh | MSI GE72VR-6RF16H21 6700HQ, GeForce GTX 1060 Mobile, 51 Wh | HP Omen 17-an014ng i7-7700HQ, GeForce GTX 1070 Mobile, 86 Wh | Gigabyte P57X v7 i7-7700HQ, GeForce GTX 1070 Mobile, 75.81 Wh | Nexoc G739 i7-7700HQ, GeForce GTX 1050 Ti Mobile, 62 Wh | |
|---|---|---|---|---|---|---|---|
| Autonomia della batteria | -2% | -14% | -48% | 0% | -8% | 38% | |
| Reader / Idle (h) | 10.2 | 8.7 -15% | 3.3 -68% | 5.8 -43% | 4.3 -58% | 10.2 0% | |
| H.264 (h) | 4.7 | 2.3 -51% | 4.3 -9% | 5.4 15% | |||
| WiFi v1.3 (h) | 4.7 | 4.6 -2% | 3.9 -17% | 2.4 -49% | 4.5 -4% | 2.6 -45% | 4.8 2% |
| Load (h) | 0.9 | 0.8 -11% | 0.7 -22% | 1.4 56% | 1.6 78% | 2.1 133% |
Pro
Contro
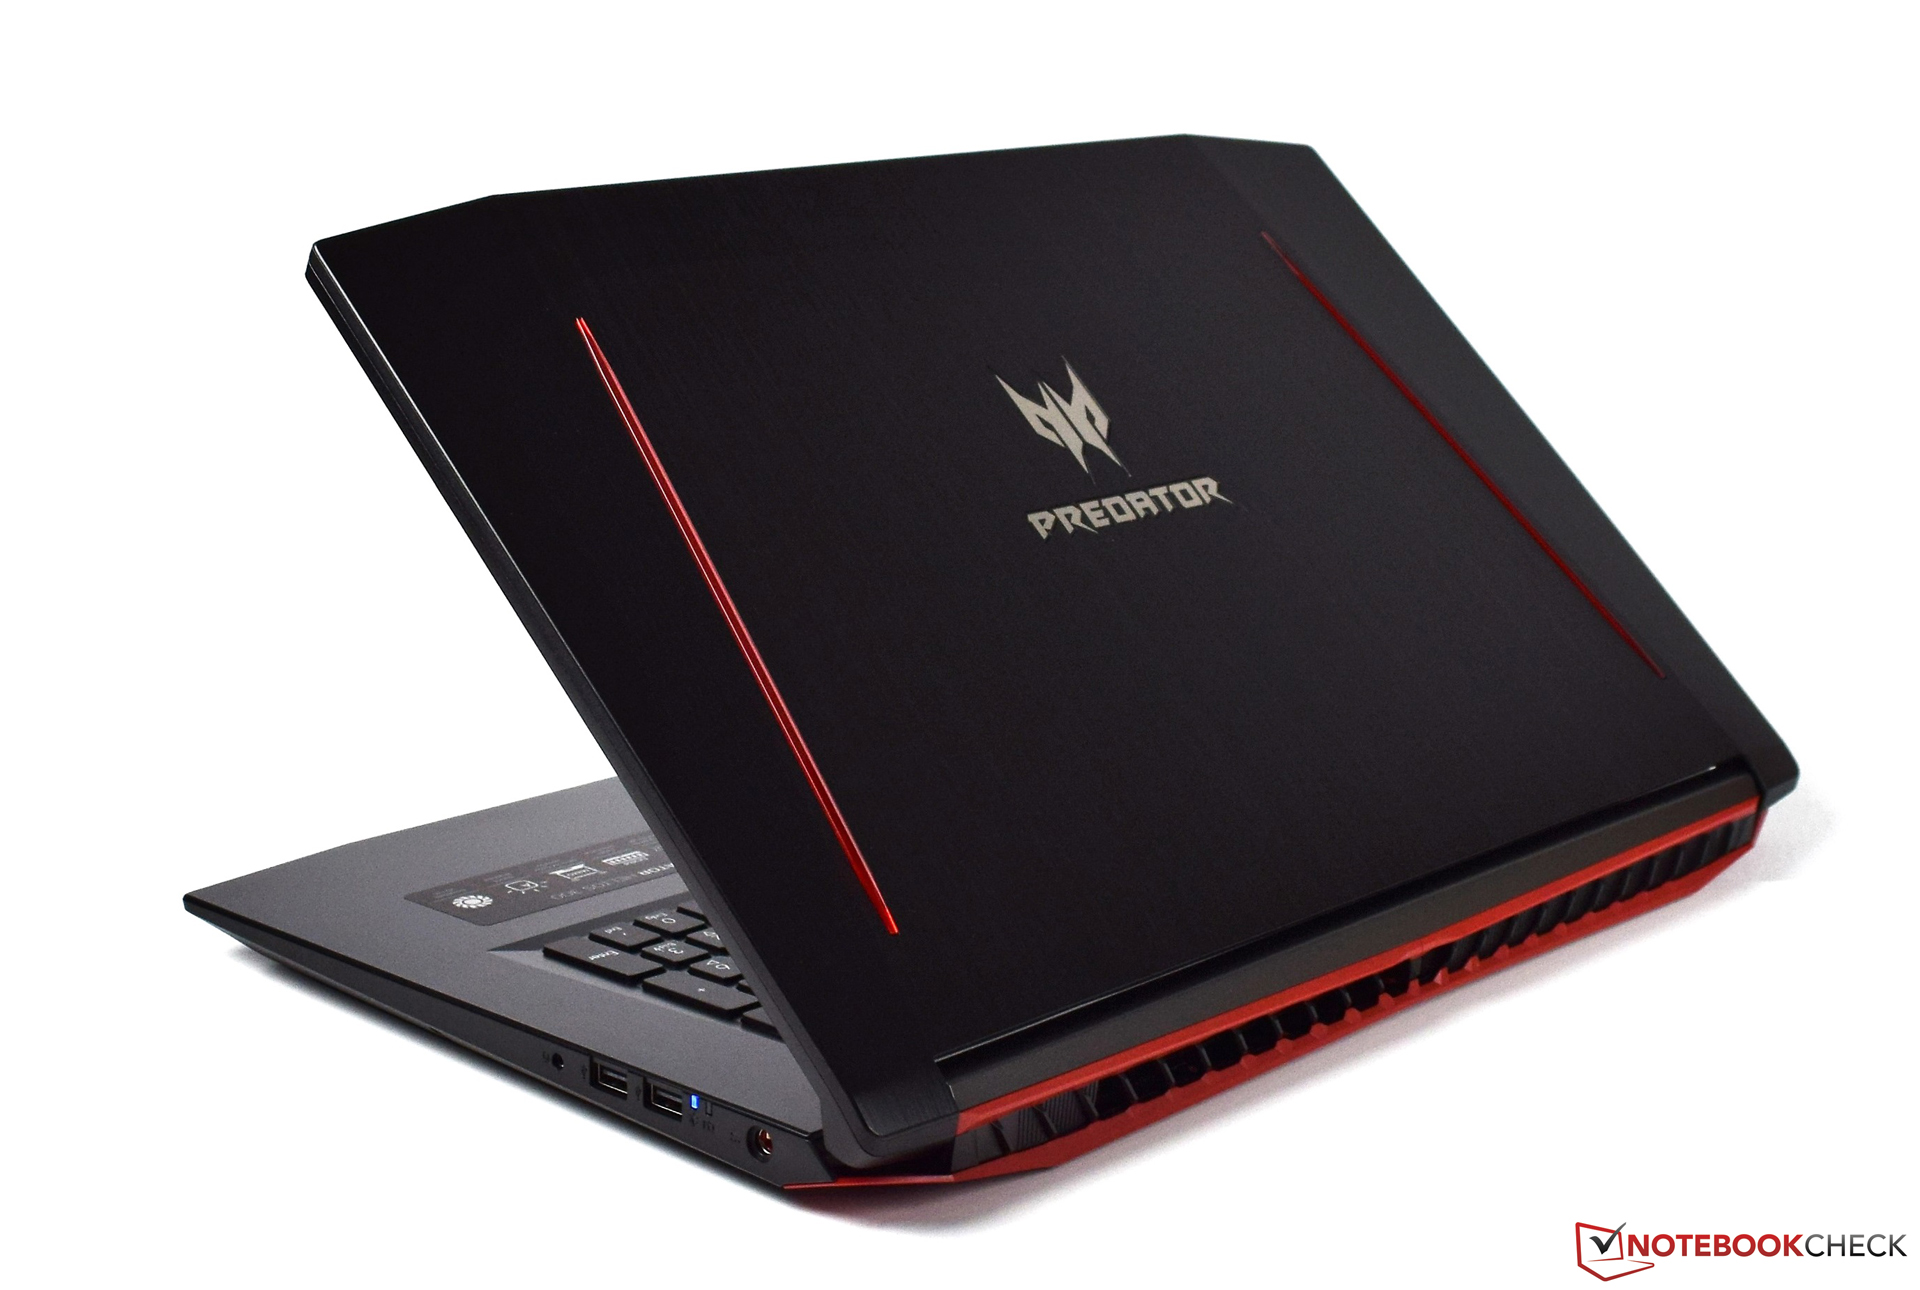
L'Acer Predator Helios 300 è un ottimo dispositivo entry-level per i giocatori. Questo 17" monta un veloce Intel Core i7-7700HQ e la Nvidia GeForce GTX 1060 è una solida base per usare i giochi attuali con risoluzione nativa 1080p. I framerates sono buoni anche con dettagli massimi. Il modello da $1800 monta anche 16 GB di RAM DDR4 ed un veloce SSD da 512-GB NVMe. L'Acer Predator Helios soddisfa tutte le esigenze di un portatile gaming.
L'Acer Predator Helios 300 offre solide prestazioni gaming per il suo prezzo. Tuttavia, il produttore ha sprecato punti importanti come il sistema audio, che non è adatto ad un portatile gaming.
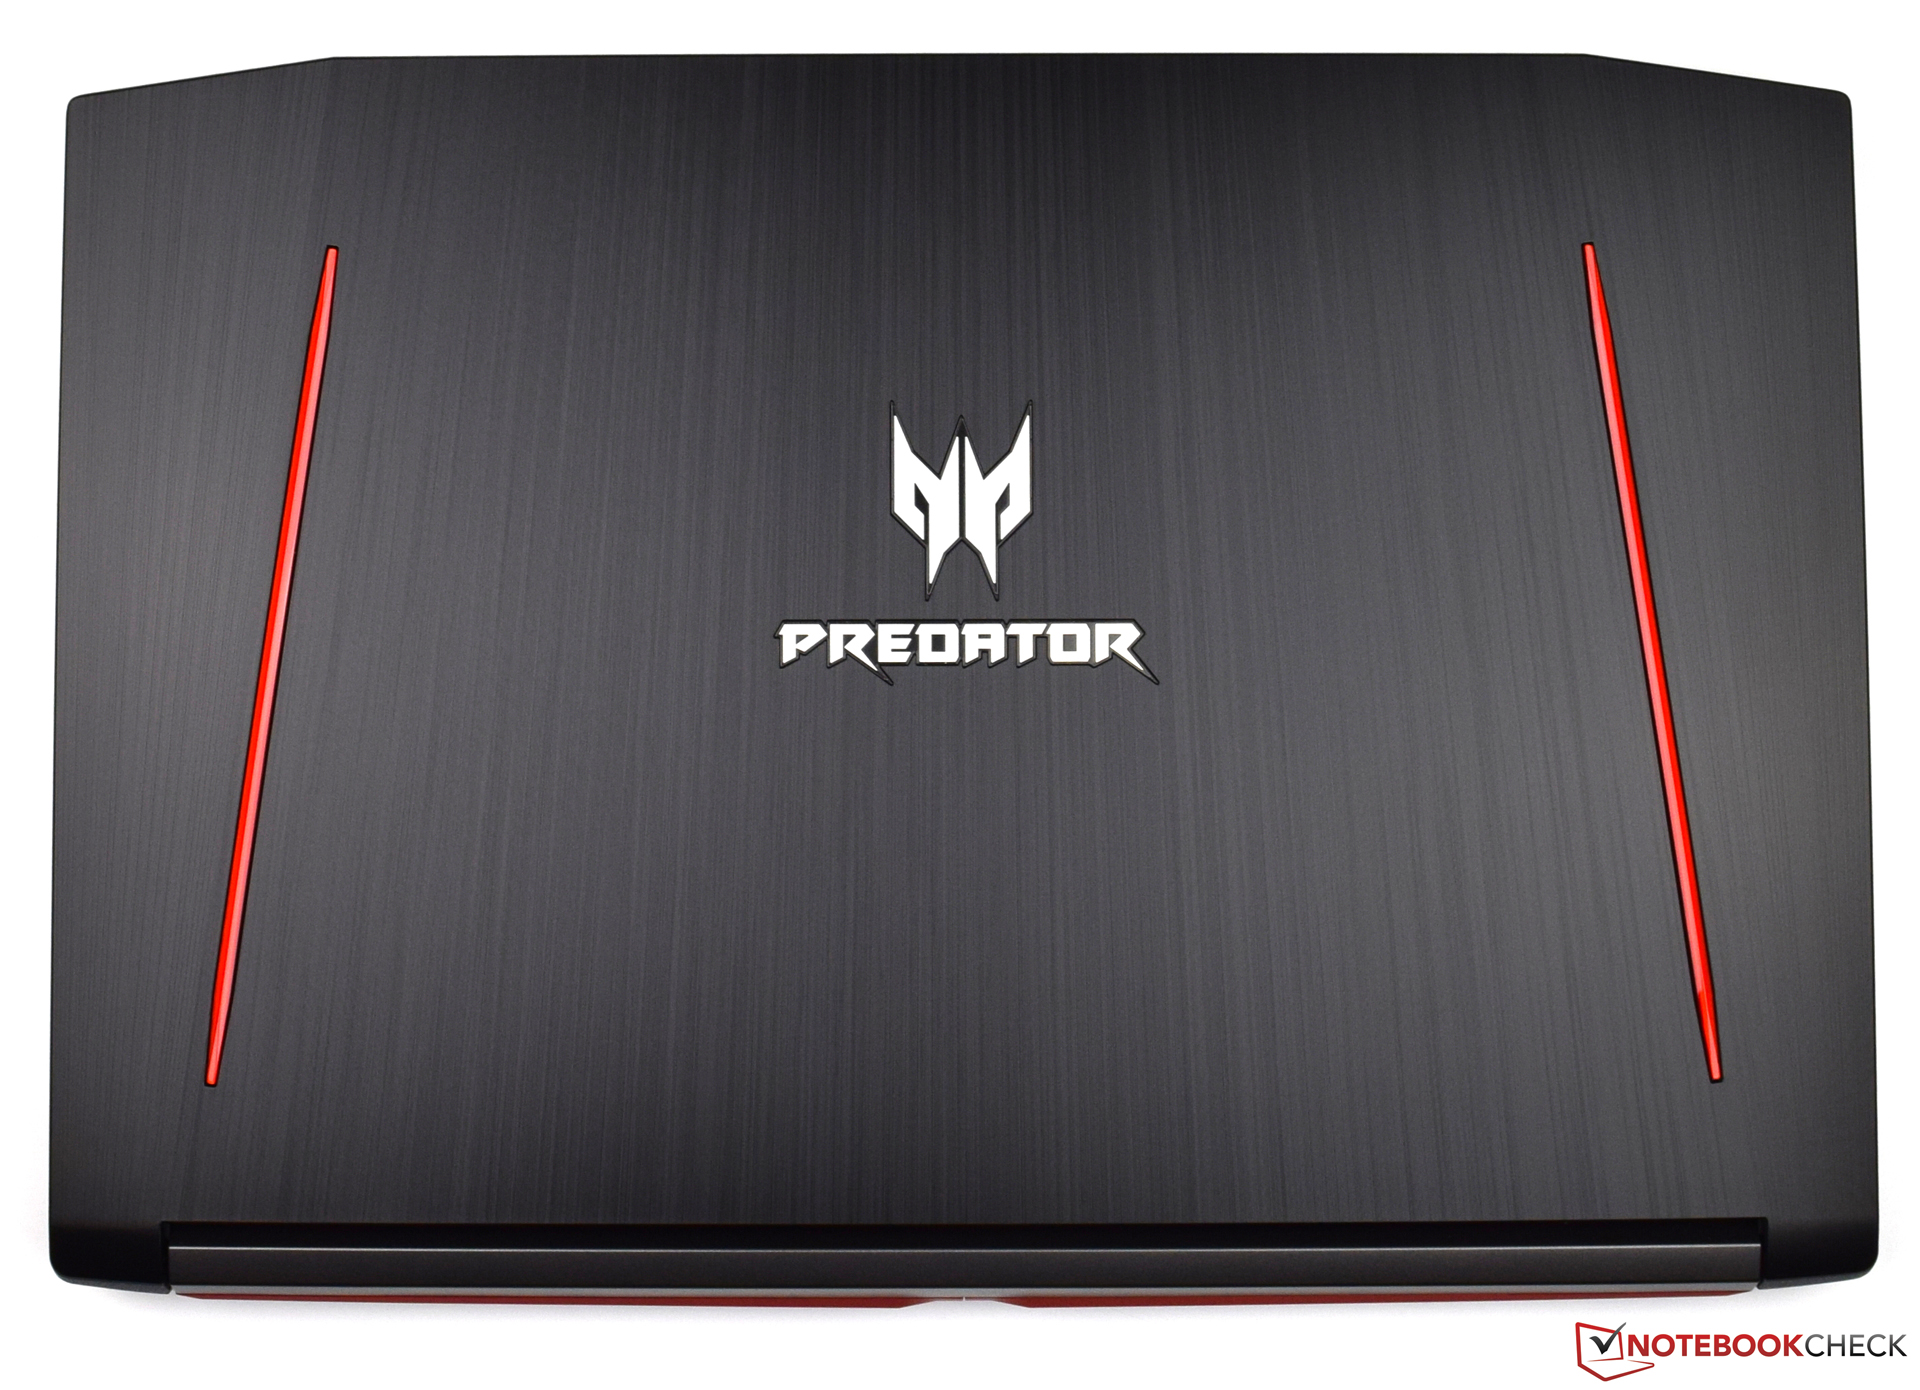
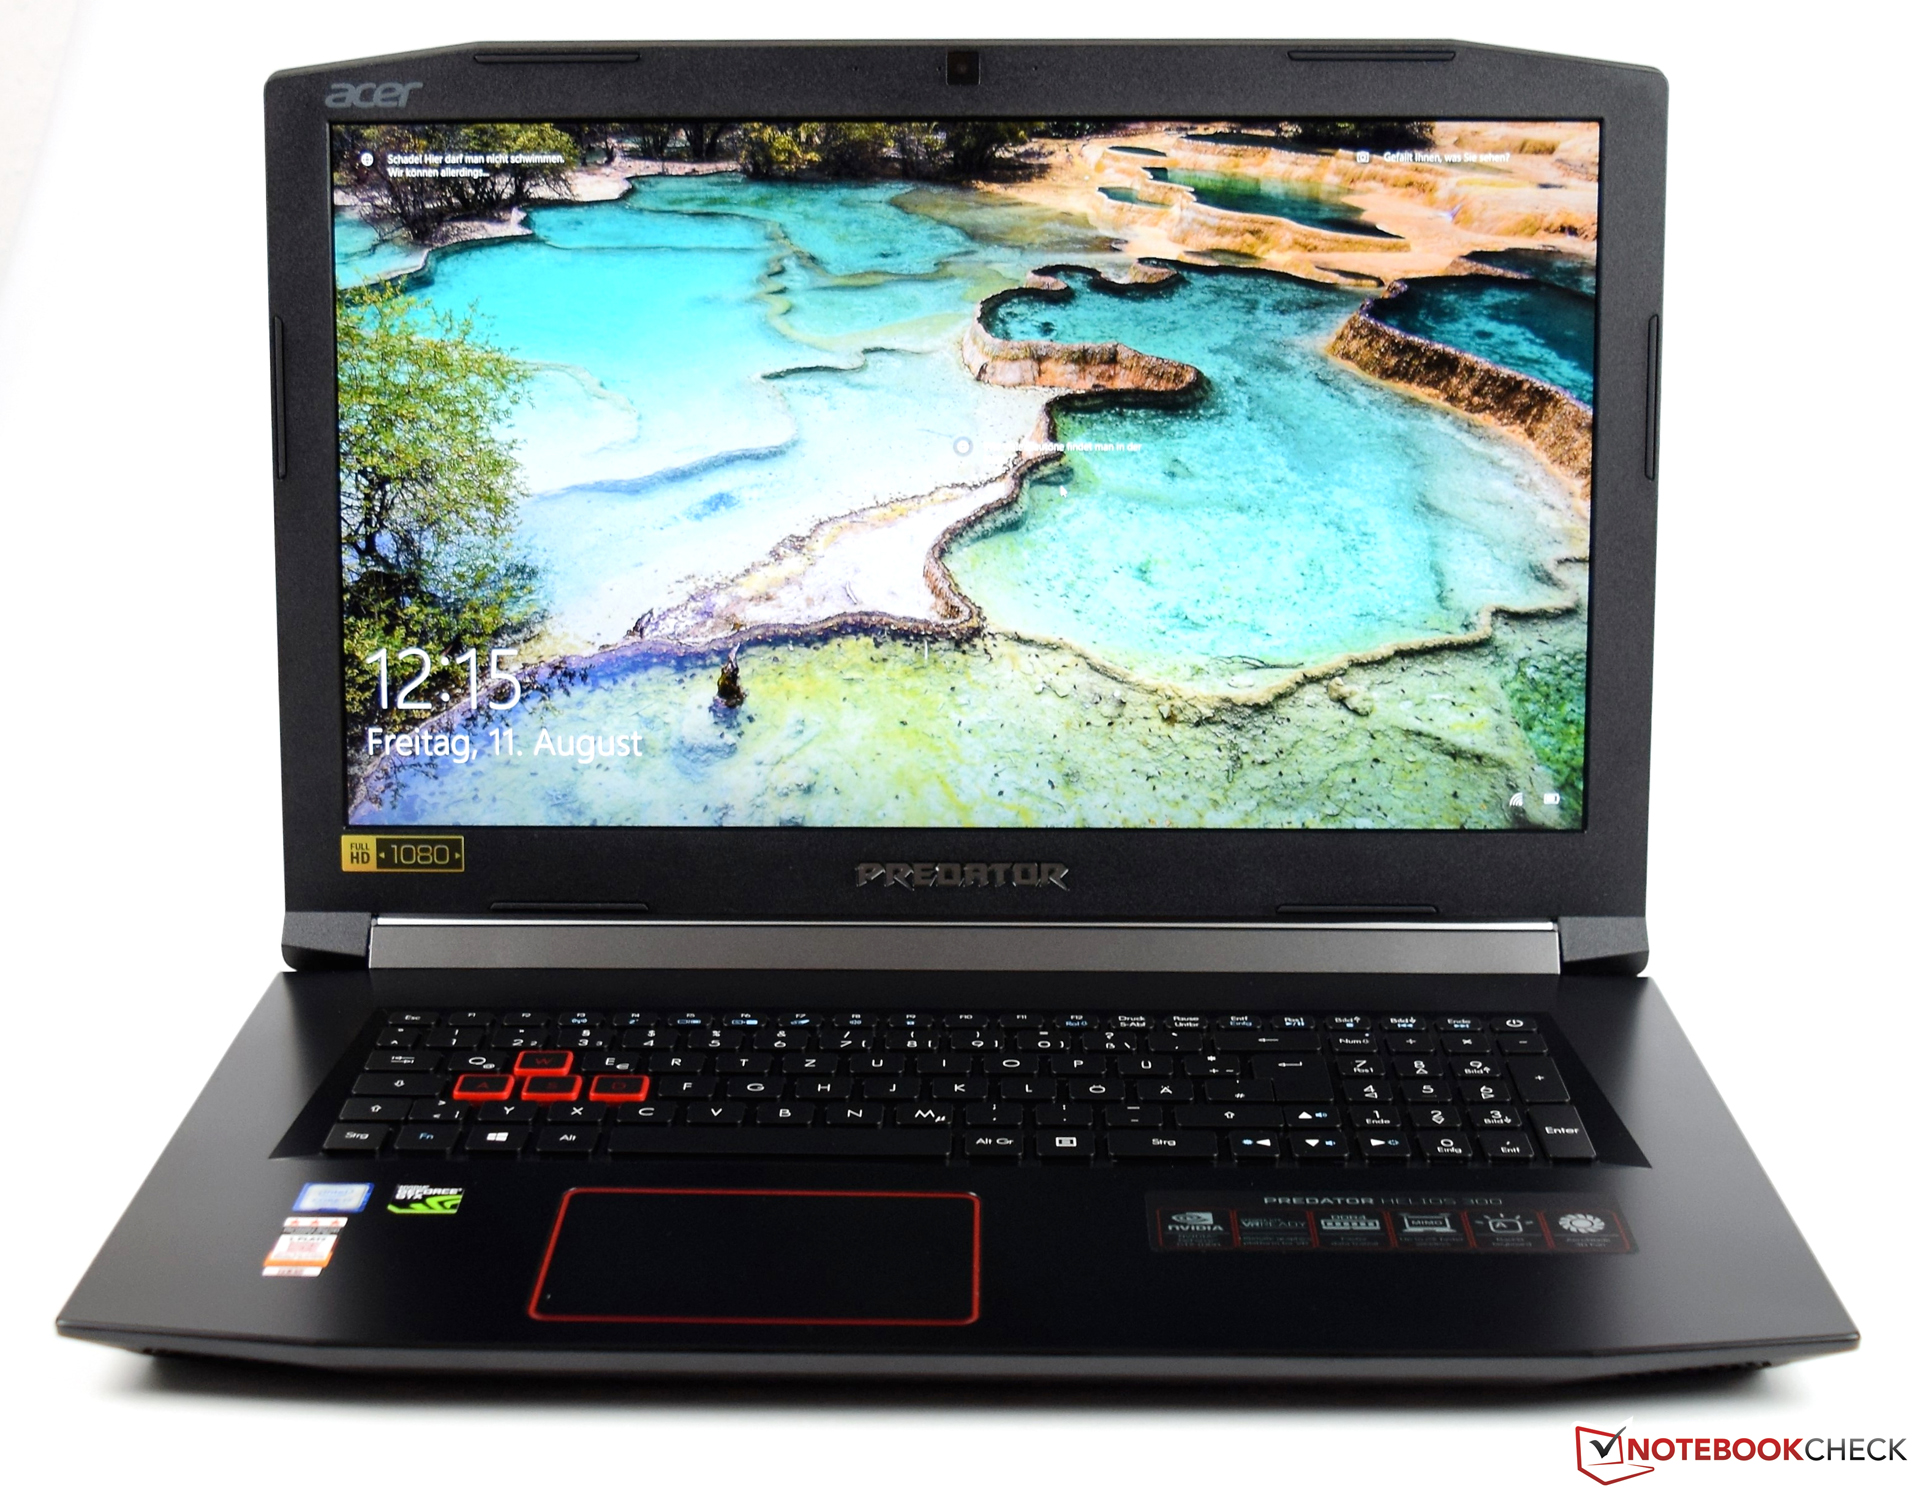
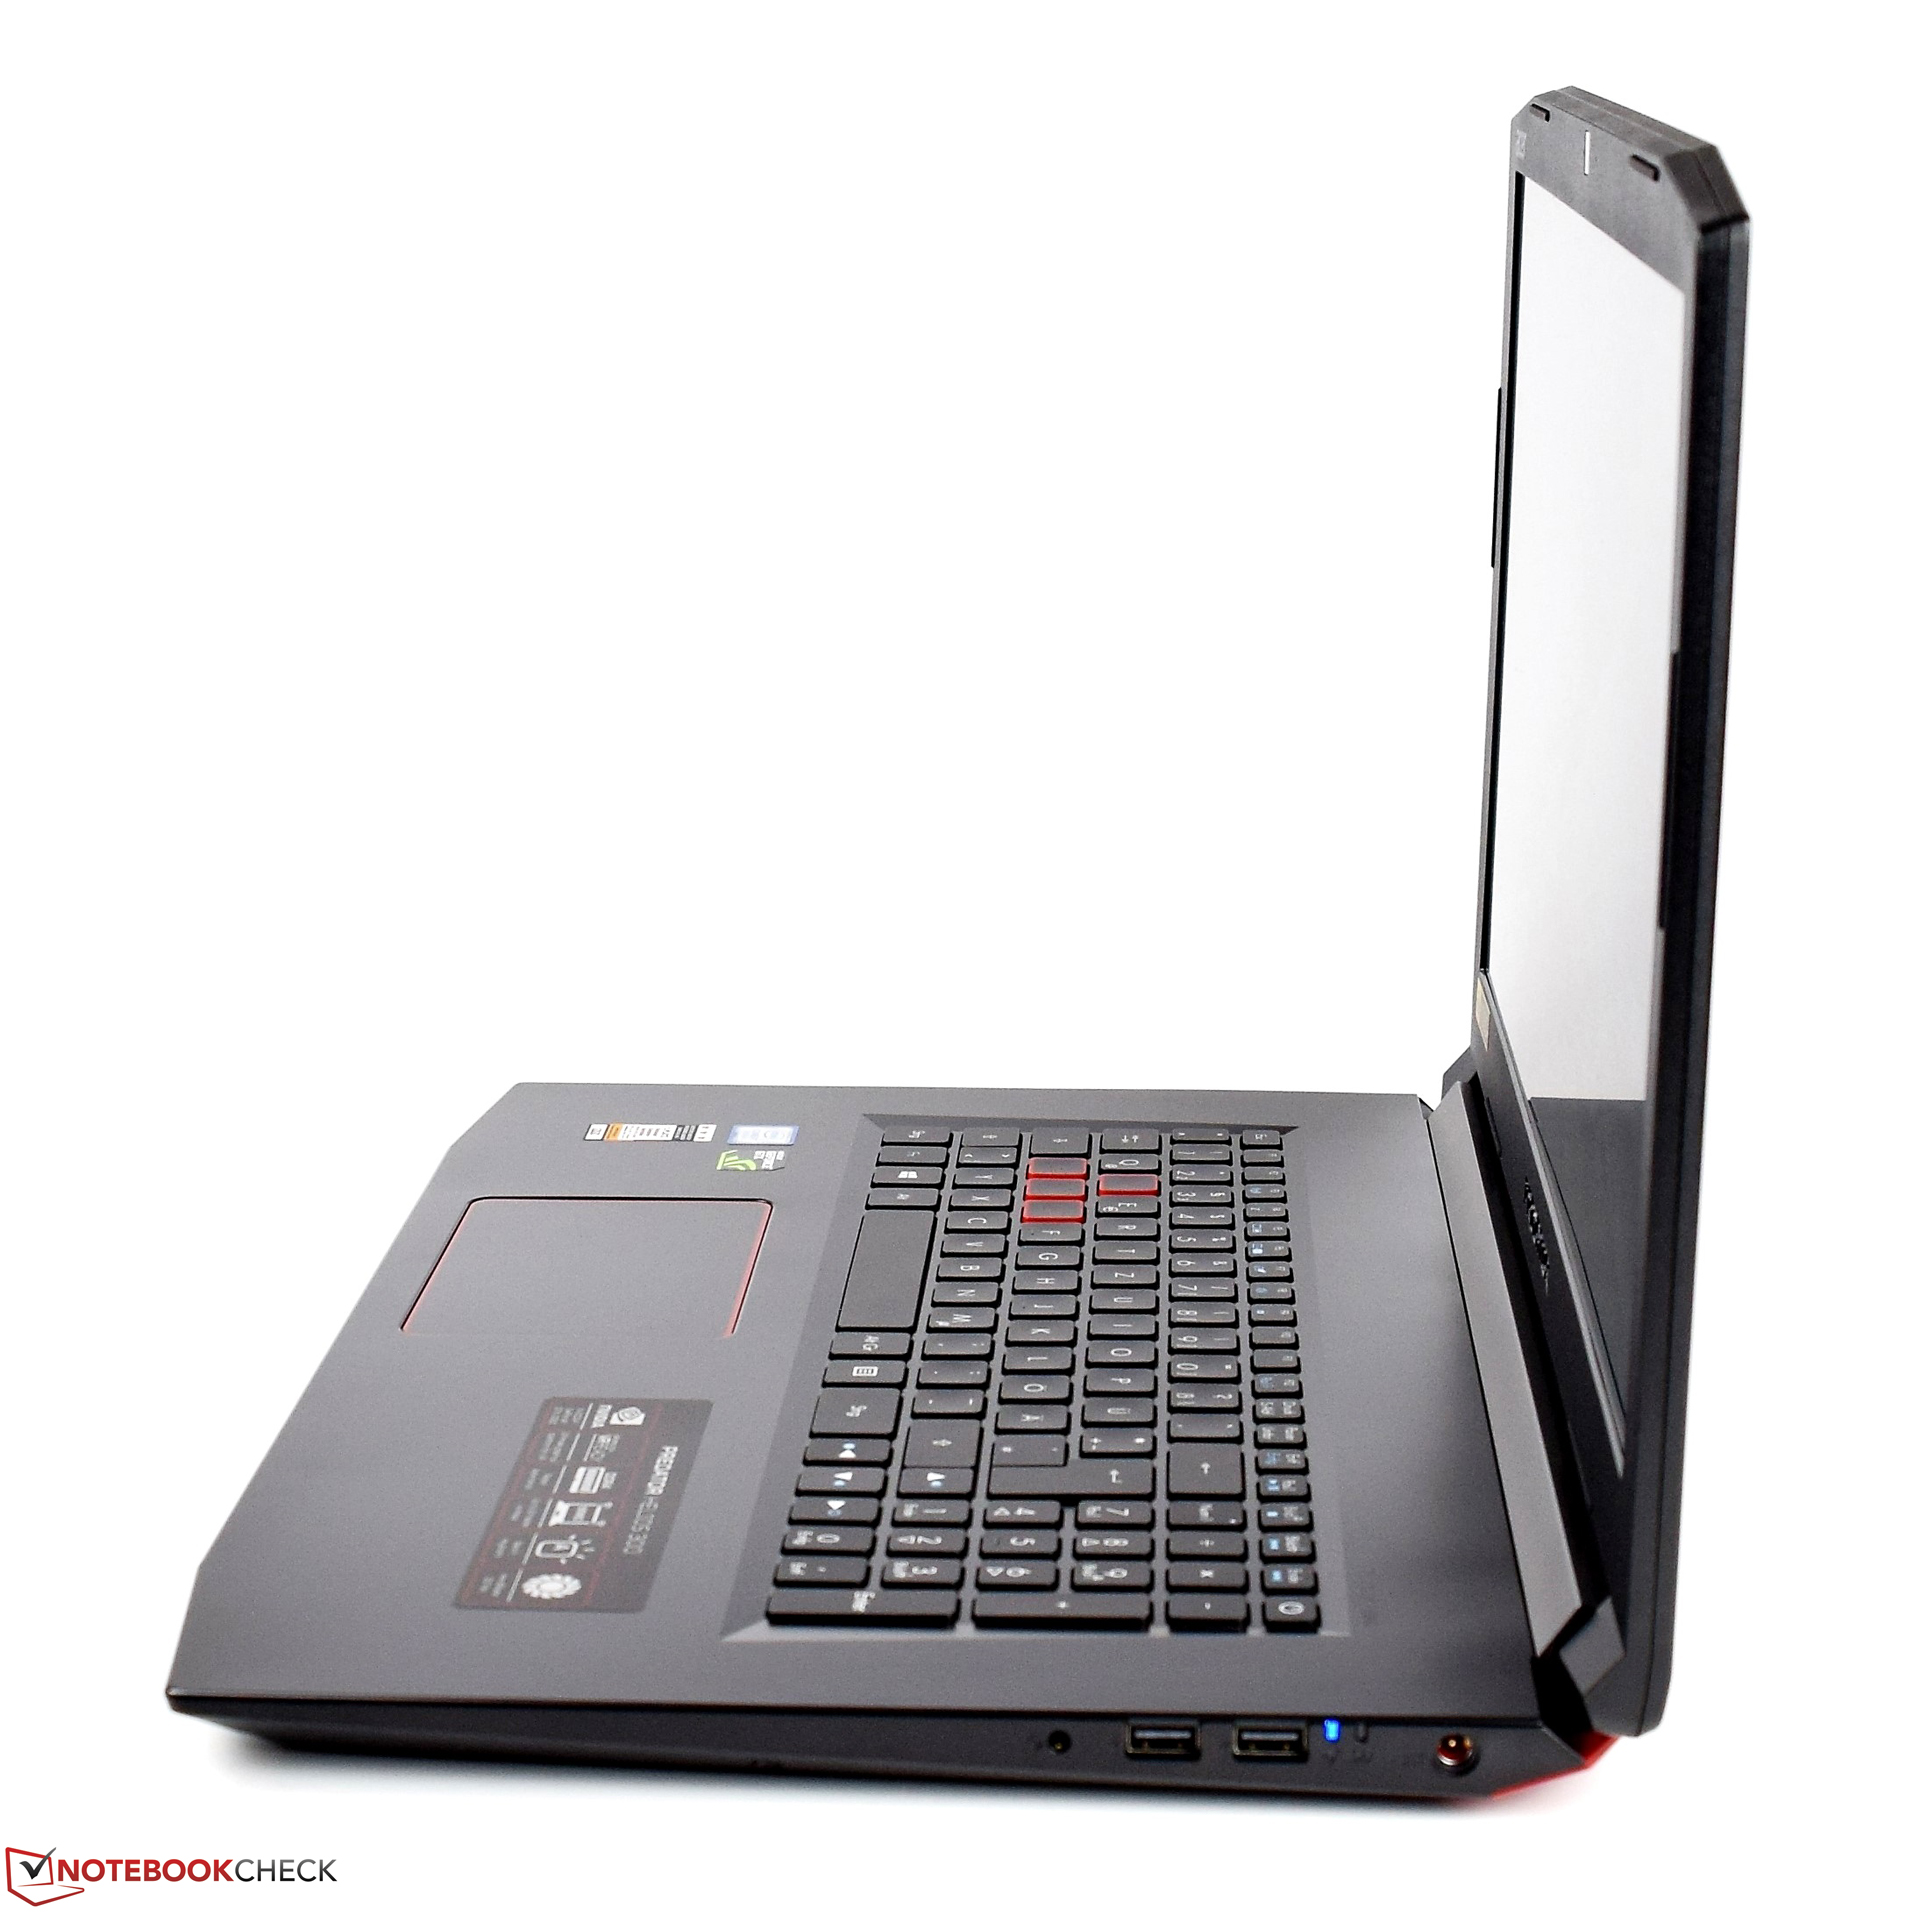
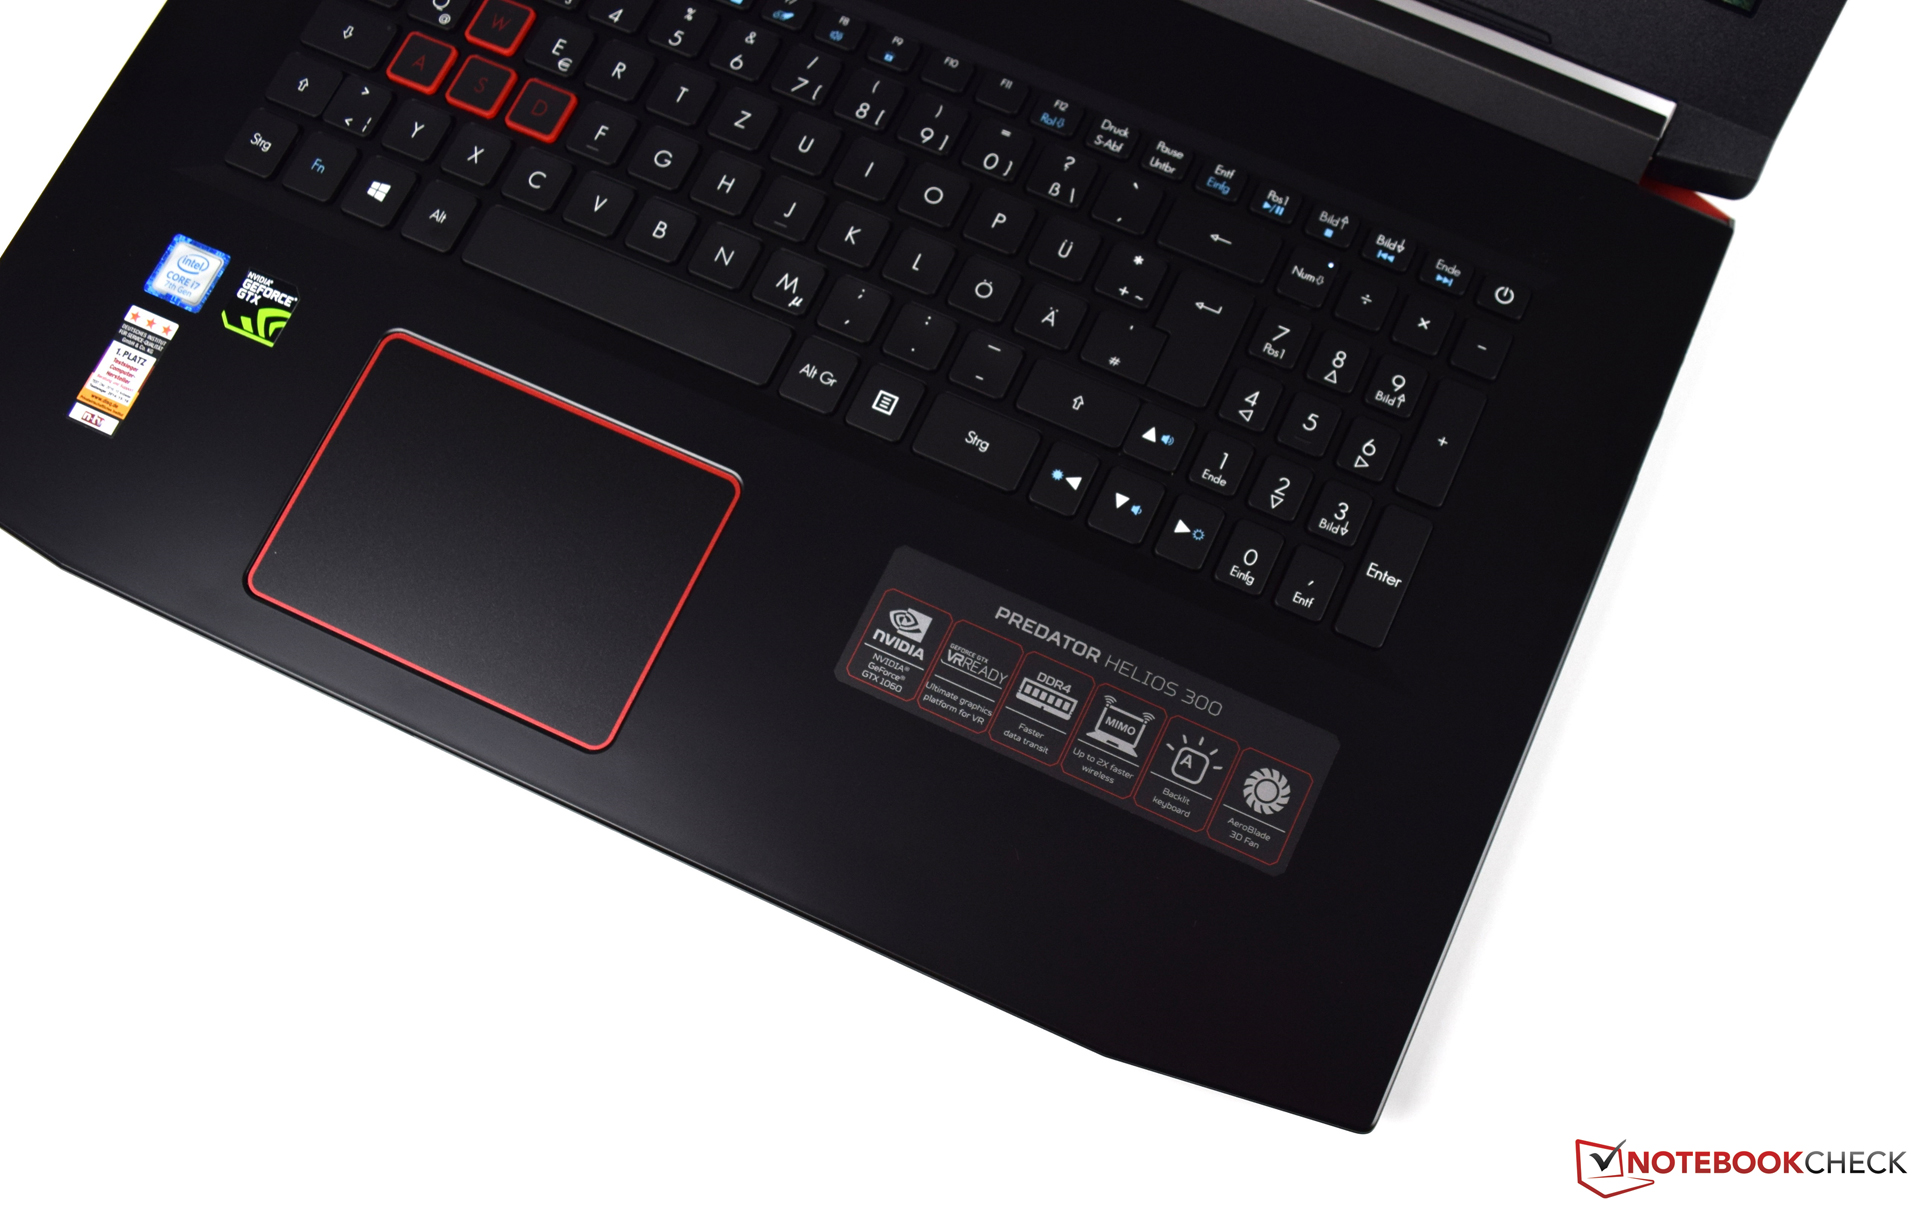
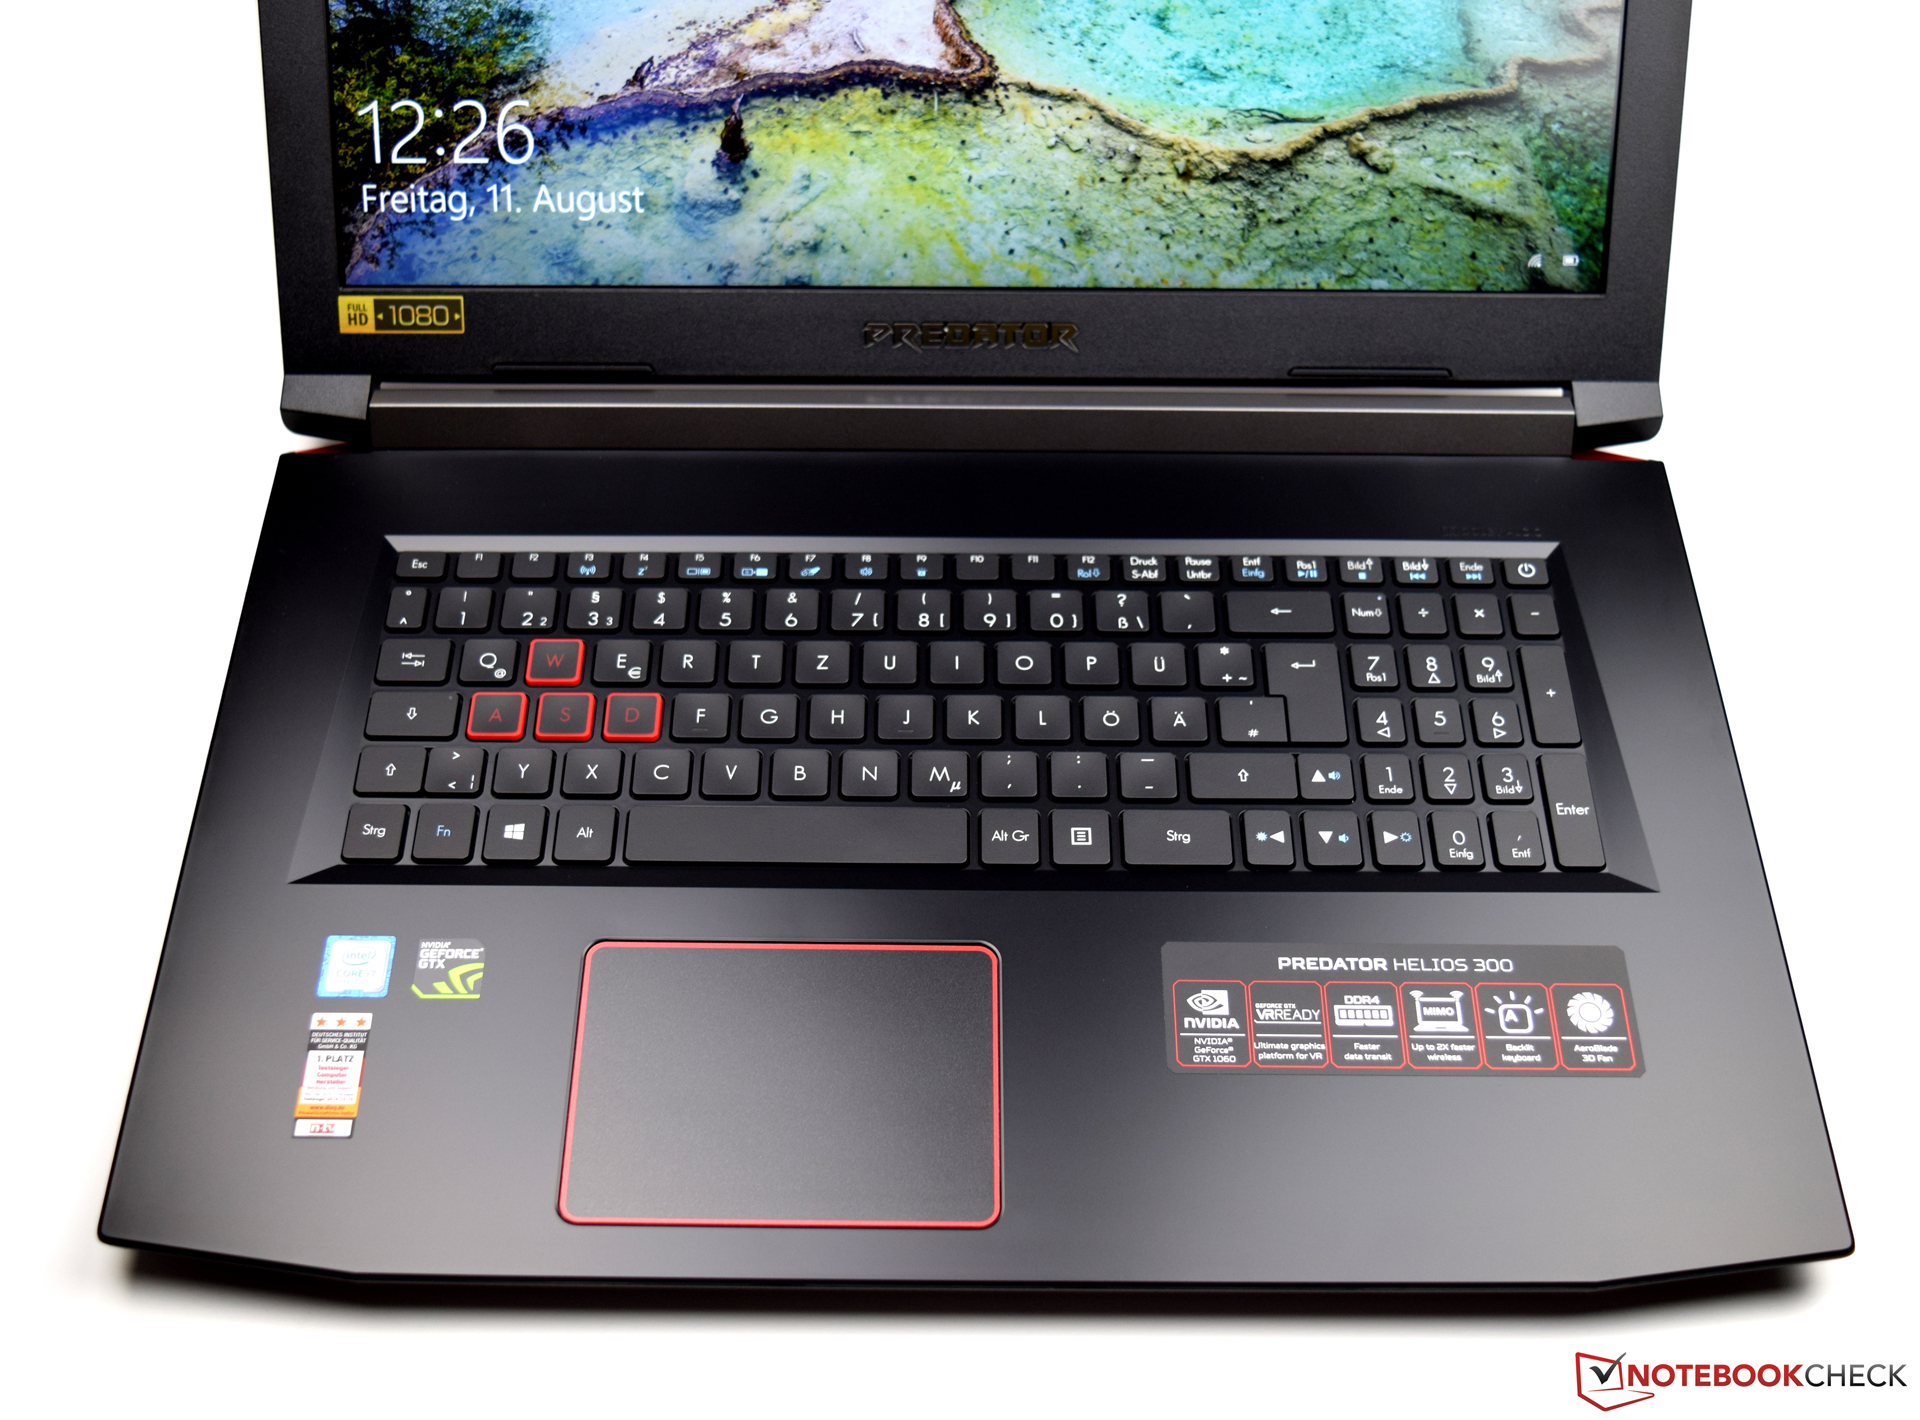
Nel complesso, l'Acer Predator Helios 300 ci ha fato una buona impressione. Il case è molto stabile nonostante il design piatto e la combinazione di colori rende il dispositivo riconoscibile come un Predator anche da lontano. Abbiamo particolarmente apprezzato i dispositivi di input che difficilmente sono criticabili e Acer ha scelto bene anche lo schermo.
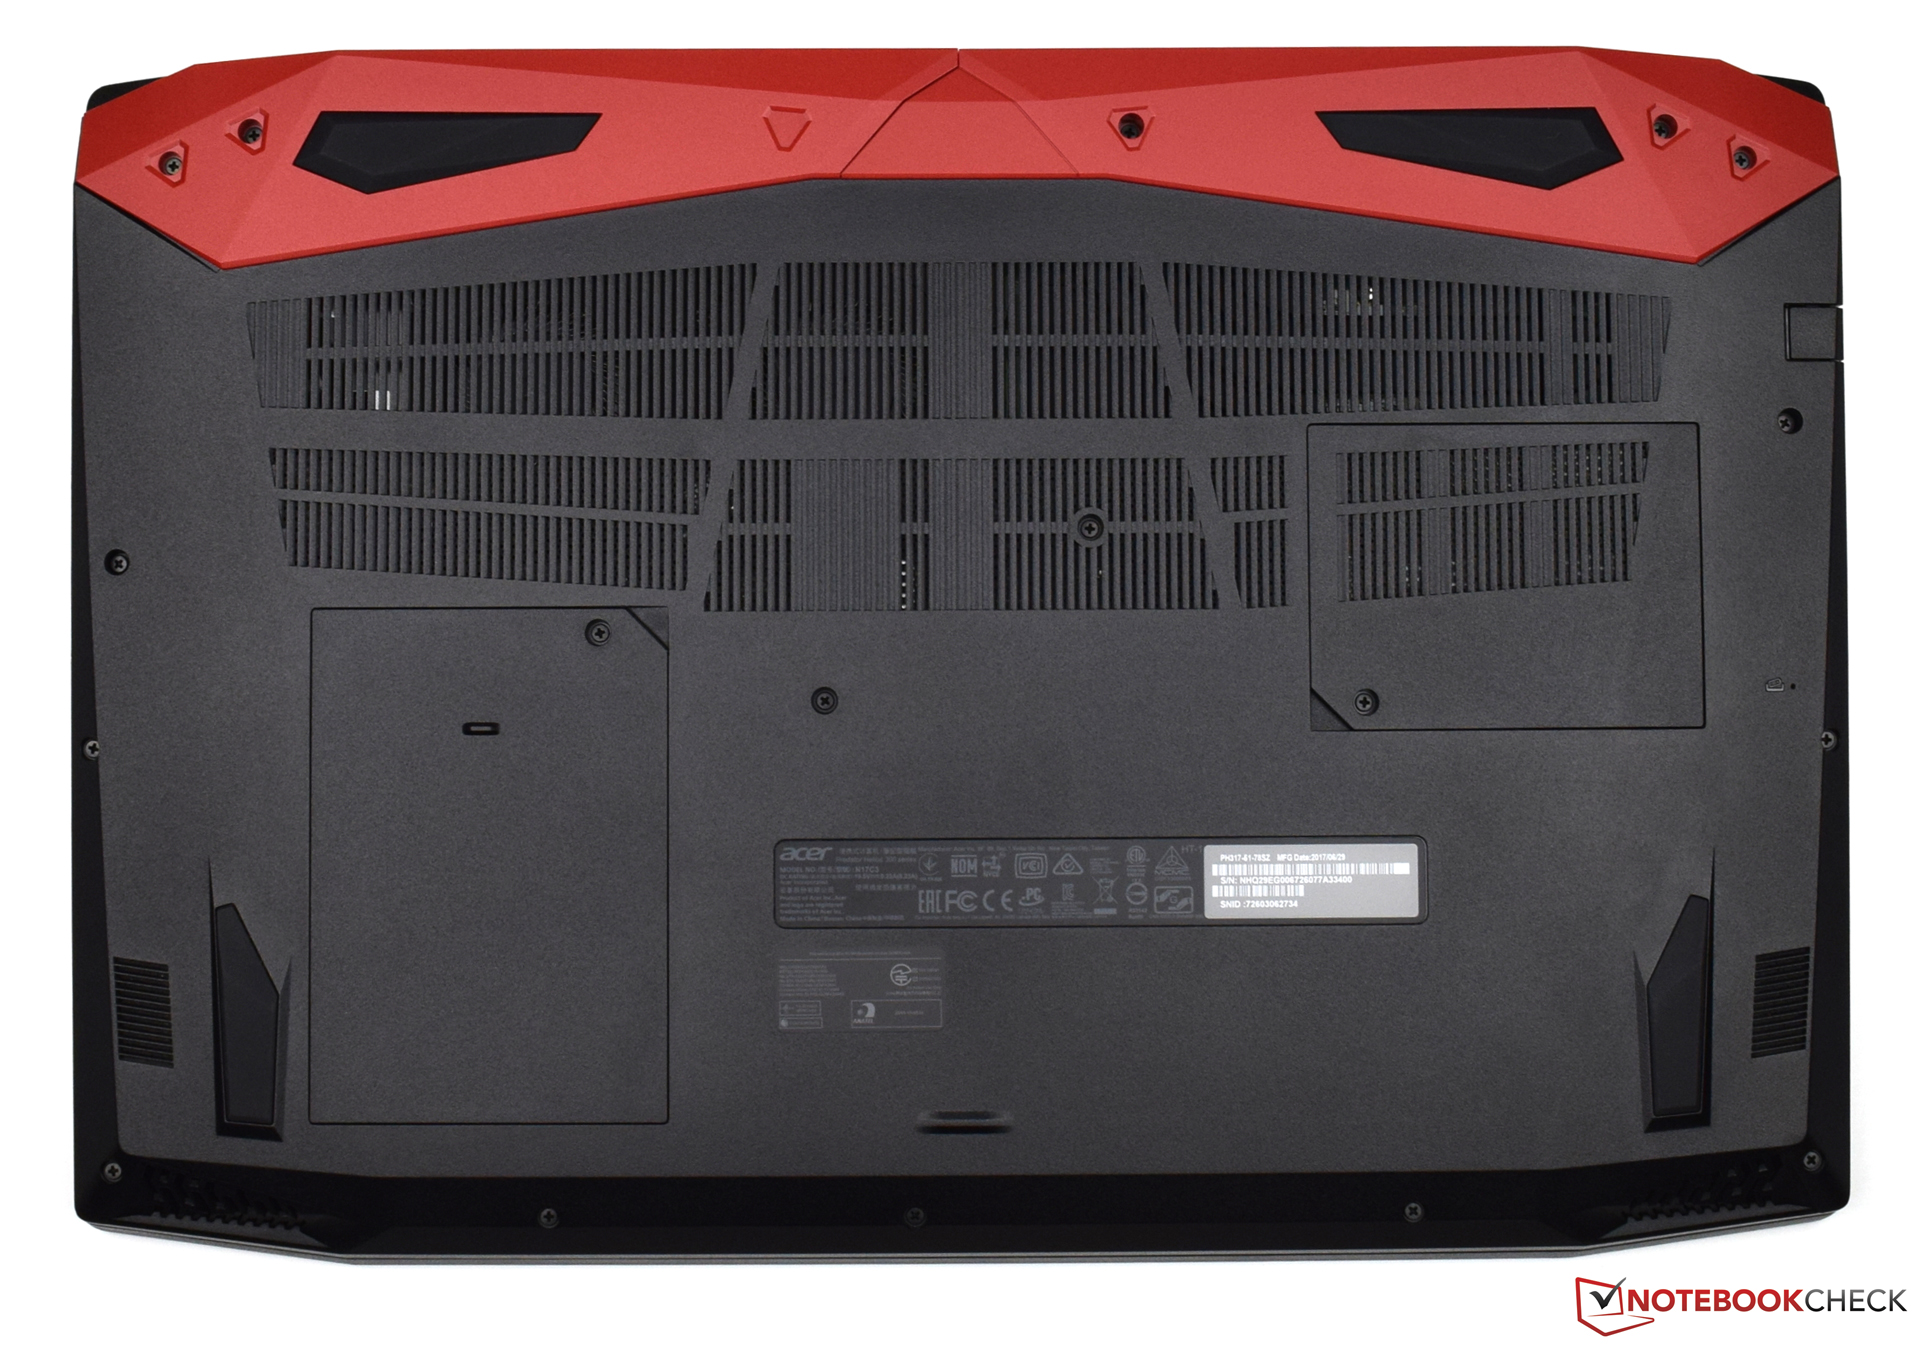
Siamo stati un po' delusi dal sistema audio, che ci saremmo aspettati in un dispositivo da ufficio medio, non in un gamer. Anche la manutenzione può essere un po' difficoltosa a causa delle cover di manutenzione piccole. Uno sportello più grande sarebbe stato più comodo.
Gli acquirenti dell'Acer Predator Helios 300 saranno premiati con le buone performance per un prezzo onesto.
Nota: si tratta di una recensione breve, con alcune sezioni non tradotte, per la versione integrale in inglese guardate qui.
Acer Predator Helios 300
- 06/01/2018 v6 (old)
Sebastian Bade