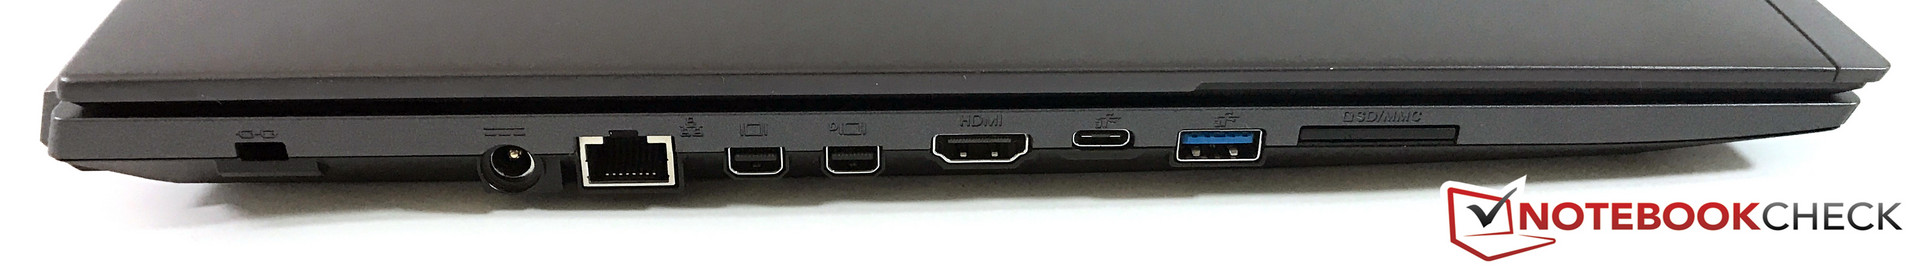
Recensione breve del Portatile Nexoc G739 (Clevo N870HK1)

| SD Card Reader | |
| average JPG Copy Test (av. of 3 runs) | |
| Nexoc G739 | |
| Asus Strix GL753VD-GC045T | |
| HP Omen 17-w100ng | |
| Asus GL702VM-GC102D | |
| MSI GE72 7RE-046 | |
| maximum AS SSD Seq Read Test (1GB) | |
| HP Omen 17-w100ng | |
| Nexoc G739 | |
| Asus Strix GL753VD-GC045T | |
| Asus GL702VM-GC102D | |
| MSI GE72 7RE-046 | |
| Networking | |
| iperf3 transmit AX12 | |
| Asus Strix GL753VD-GC045T | |
| HP Omen 17-w100ng | |
| Nexoc G739 | |
| MSI GE72 7RE-046 | |
| iperf3 receive AX12 | |
| HP Omen 17-w100ng | |
| Asus Strix GL753VD-GC045T | |
| Nexoc G739 | |
| MSI GE72 7RE-046 | |
| |||||||||||||||||||||||||
Distribuzione della luminosità: 85 %
Al centro con la batteria: 312 cd/m²
Contrasto: 1357:1 (Nero: 0.23 cd/m²)
ΔE ColorChecker Calman: 4.19 | ∀{0.5-29.43 Ø4.72}
ΔE Greyscale Calman: 3.72 | ∀{0.09-98 Ø4.97}
91% sRGB (Argyll 1.6.3 3D)
59% AdobeRGB 1998 (Argyll 1.6.3 3D)
66.4% AdobeRGB 1998 (Argyll 3D)
91% sRGB (Argyll 3D)
66.7% Display P3 (Argyll 3D)
Gamma: 2.29
CCT: 7104 K
| Nexoc G739 CMN1738, 1920x1080, 17.3" | Asus Strix GL753VD-GC045T LP173WF4-SPF3, 1920x1080, 17.3" | HP Omen 17-w100ng LG Philips LGD046E, 1920x1080, 17.3" | MSI GE72 7RE-046 N173HHE-G32 (CMN1747), 1920x1080, 17.3" | Asus GL702VM-GC102D LG Philips LP173WF4-SPF3, 1920x1080, 17.3" | |
|---|---|---|---|---|---|
| Display | -4% | -3% | 25% | -6% | |
| Display P3 Coverage (%) | 66.7 | 67.1 1% | 67.2 1% | 90.7 36% | 65.1 -2% |
| sRGB Coverage (%) | 91 | 84.8 -7% | 86.6 -5% | 99.9 10% | 83.5 -8% |
| AdobeRGB 1998 Coverage (%) | 66.4 | 62 -7% | 63.3 -5% | 85.2 28% | 61.1 -8% |
| Response Times | 12% | 17% | 54% | 17% | |
| Response Time Grey 50% / Grey 80% * (ms) | 45 ? | 33.2 ? 26% | 35 ? 22% | 27 ? 40% | 38 ? 16% |
| Response Time Black / White * (ms) | 28 ? | 28.8 ? -3% | 25 ? 11% | 9 ? 68% | 23 ? 18% |
| PWM Frequency (Hz) | 450 ? | ||||
| Screen | -21% | -6% | -16% | -35% | |
| Brightness middle (cd/m²) | 312 | 349 12% | 342 10% | 253 -19% | 326 4% |
| Brightness (cd/m²) | 304 | 337 11% | 331 9% | 230 -24% | 312 3% |
| Brightness Distribution (%) | 85 | 91 7% | 84 -1% | 86 1% | 91 7% |
| Black Level * (cd/m²) | 0.23 | 0.58 -152% | 0.32 -39% | 0.24 -4% | 0.5 -117% |
| Contrast (:1) | 1357 | 602 -56% | 1069 -21% | 1054 -22% | 652 -52% |
| Colorchecker dE 2000 * | 4.19 | 4.5 -7% | 4.35 -4% | 5.01 -20% | 6.3 -50% |
| Colorchecker dE 2000 max. * | 8.7 | 10.2 -17% | 9.24 -6% | 10.4 -20% | 11.69 -34% |
| Greyscale dE 2000 * | 3.72 | 3.3 11% | 3.73 -0% | 7.26 -95% | 7.37 -98% |
| Gamma | 2.29 96% | 2.15 102% | 2.23 99% | 2.09 105% | 2.37 93% |
| CCT | 7104 91% | 6103 107% | 6801 96% | 6329 103% | 7116 91% |
| Color Space (Percent of AdobeRGB 1998) (%) | 59 | 55.7 -6% | 57 -3% | 76 29% | 55 -7% |
| Color Space (Percent of sRGB) (%) | 91 | 75.7 -17% | 86 -5% | 100 10% | 83 -9% |
| Media totale (Programma / Settaggio) | -4% /
-14% | 3% /
-2% | 21% /
1% | -8% /
-22% |
* ... Meglio usare valori piccoli
Tempi di risposta del Display
| ↔ Tempi di risposta dal Nero al Bianco | ||
|---|---|---|
| 28 ms ... aumenta ↗ e diminuisce ↘ combinato | ↗ 7 ms Incremento | 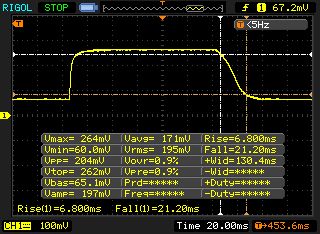 |
| ↘ 21 ms Calo | ||
| Lo schermo mostra tempi di risposta relativamente lenti nei nostri tests e potrebbe essere troppo lento per i gamers. In confronto, tutti i dispositivi di test variano da 0.1 (minimo) a 240 (massimo) ms. » 71 % di tutti i dispositivi è migliore. Questo significa che i tempi di risposta rilevati sono peggiori rispetto alla media di tutti i dispositivi testati (19.8 ms). | ||
| ↔ Tempo di risposta dal 50% Grigio all'80% Grigio | ||
| 45 ms ... aumenta ↗ e diminuisce ↘ combinato | ↗ 20 ms Incremento | 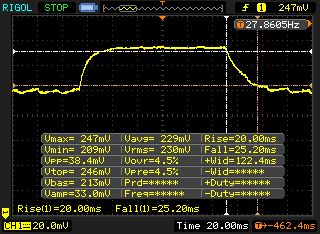 |
| ↘ 25 ms Calo | ||
| Lo schermo mostra tempi di risposta lenti nei nostri tests e sarà insoddisfacente per i gamers. In confronto, tutti i dispositivi di test variano da 0.165 (minimo) a 636 (massimo) ms. » 77 % di tutti i dispositivi è migliore. Questo significa che i tempi di risposta rilevati sono peggiori rispetto alla media di tutti i dispositivi testati (31 ms). | ||
Sfarfallio dello schermo / PWM (Pulse-Width Modulation)
| flickering dello schermo / PWM rilevato | 450 Hz | ≤ 90 % settaggio luminosita' | 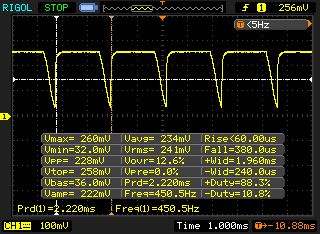 |
Il display sfarfalla a 450 Hz (Probabilmente a causa dell'uso di PWM) Flickering rilevato ad una luminosita' di 90 % o inferiore. Non dovrebbe verificarsi flickering o PWM sopra questo valore di luminosita'. La frequenza di 450 Hz è relativamente elevata, quindi la maggioranza degli utenti sensibili al PWM non dovrebbe notare alcun flickering. Tuttavia, è stato segnalato che alcuni utenti sono sensibili al PWM a 500 Hz ed oltre, quindi prestate attenzione. In confronto: 52 % di tutti i dispositivi testati non utilizza PWM per ridurre la luminosita' del display. Se è rilevato PWM, una media di 7781 (minimo: 5 - massimo: 343500) Hz è stata rilevata. | |||

| Cinebench R15 | |
| CPU Single 64Bit | |
| Nexoc G739 | |
| Asus Strix GL753VD-GC045T | |
| MSI GE72 7RE-046 | |
| Asus GL702VM-GC102D | |
| HP Omen 17-w100ng | |
| CPU Multi 64Bit | |
| Nexoc G739 | |
| Asus Strix GL753VD-GC045T | |
| MSI GE72 7RE-046 | |
| Asus GL702VM-GC102D | |
| HP Omen 17-w100ng | |
| Cinebench R11.5 | |
| CPU Single 64Bit | |
| Nexoc G739 | |
| Asus Strix GL753VD-GC045T | |
| MSI GE72 7RE-046 | |
| Asus GL702VM-GC102D | |
| HP Omen 17-w100ng | |
| CPU Multi 64Bit | |
| Nexoc G739 | |
| Asus Strix GL753VD-GC045T | |
| MSI GE72 7RE-046 | |
| Asus GL702VM-GC102D | |
| HP Omen 17-w100ng | |
| PCMark 8 | |
| Home Score Accelerated v2 | |
| HP Omen 17-w100ng | |
| Asus GL702VM-GC102D | |
| Nexoc G739 | |
| Asus Strix GL753VD-GC045T | |
| Work Score Accelerated v2 | |
| HP Omen 17-w100ng | |
| Nexoc G739 | |
| Asus GL702VM-GC102D | |
| PCMark 7 - Score | |
| Nexoc G739 | |
| HP Omen 17-w100ng | |
| MSI GE72 7RE-046 | |
| Asus GL702VM-GC102D | |
| PCMark 7 Score | 6331 punti | |
| PCMark 8 Home Score Accelerated v2 | 4270 punti | |
| PCMark 8 Creative Score Accelerated v2 | 5420 punti | |
| PCMark 8 Work Score Accelerated v2 | 5243 punti | |
Aiuto | ||
| Nexoc G739 Samsung PM961 MZVLW256HEHP | Asus Strix GL753VD-GC045T Micron SSD 1100 (MTFDDAV256TBN) | HP Omen 17-w100ng SanDisk Z400s SD8SNAT-128G | MSI GE72 7RE-046 Toshiba HG6 THNSNJ256G8NY | Asus GL702VM-GC102D HGST Travelstar 7K1000 HTS721010A9E630 | |
|---|---|---|---|---|---|
| CrystalDiskMark 3.0 | -60% | -70% | -51% | -96% | |
| Read Seq (MB/s) | 1666 | 475.7 -71% | 495 -70% | 540 -68% | 134.6 -92% |
| Write Seq (MB/s) | 1192 | 419.1 -65% | 180.2 -85% | 495.7 -58% | 130.6 -89% |
| Read 512 (MB/s) | 857 | 336.1 -61% | 315.5 -63% | 455.1 -47% | 44.85 -95% |
| Write 512 (MB/s) | 827 | 346.6 -58% | 172.4 -79% | 481.4 -42% | 63.3 -92% |
| Read 4k (MB/s) | 60.7 | 24.7 -59% | 20.25 -67% | 22.7 -63% | 0.602 -99% |
| Write 4k (MB/s) | 154.5 | 76.8 -50% | 76.1 -51% | 112.9 -27% | 1.146 -99% |
| Read 4k QD32 (MB/s) | 636 | 247.6 -61% | 141.6 -78% | 372.5 -41% | 1.106 -100% |
| Write 4k QD32 (MB/s) | 544 | 234.9 -57% | 170.8 -69% | 212.9 -61% | 1.186 -100% |

| 3DMark 11 - 1280x720 Performance GPU | |
| HP Omen 17-w100ng | |
| Asus GL702VM-GC102D | |
| MSI GE72 7RE-046 | |
| Nexoc G739 | |
| Asus Strix GL753VD-GC045T | |
| 3DMark | |
| 1280x720 Cloud Gate Standard Graphics | |
| Asus GL702VM-GC102D | |
| HP Omen 17-w100ng | |
| Nexoc G739 | |
| MSI GE72 7RE-046 | |
| Asus Strix GL753VD-GC045T | |
| 1920x1080 Fire Strike Graphics | |
| HP Omen 17-w100ng | |
| Asus GL702VM-GC102D | |
| MSI GE72 7RE-046 | |
| Nexoc G739 | |
| Asus Strix GL753VD-GC045T | |
| Asus Strix GL753VD-GC045T | |
| 3DMark 11 Performance | 9687 punti | |
| 3DMark Cloud Gate Standard Score | 22876 punti | |
| 3DMark Fire Strike Score | 6950 punti | |
| 3DMark Time Spy Score | 2519 punti | |
Aiuto | ||
| Battlefield 1 | |
| 1920x1080 Ultra Preset AA:T | |
| Asus GL702VM-GC102D | |
| HP Omen 17-w100ng | |
| MSI GE72 7RE-046 | |
| Nexoc G739 | |
| Asus Strix GL753VD-GC045T | |
| 1920x1080 High Preset AA:T | |
| Asus GL702VM-GC102D | |
| HP Omen 17-w100ng | |
| MSI GE72 7RE-046 | |
| Nexoc G739 | |
| Asus Strix GL753VD-GC045T | |
| The Witcher 3 | |
| 1920x1080 Ultra Graphics & Postprocessing (HBAO+) | |
| Nexoc G739 | |
| MSI GE72 7RE-046 | |
| Asus Strix GL753VD-GC045T | |
| 1920x1080 High Graphics & Postprocessing (Nvidia HairWorks Off) | |
| Nexoc G739 | |
| MSI GE72 7RE-046 | |
| Asus Strix GL753VD-GC045T | |
| Rise of the Tomb Raider | |
| 1920x1080 Very High Preset AA:FX AF:16x | |
| Nexoc G739 | |
| MSI GE72 7RE-046 | |
| Asus Strix GL753VD-GC045T | |
| 1920x1080 High Preset AA:FX AF:4x | |
| Nexoc G739 | |
| MSI GE72 7RE-046 | |
| Asus Strix GL753VD-GC045T | |
| For Honor | |
| 1920x1080 Extreme Preset AA:T AF:16x | |
| Nexoc G739 | |
| MSI GE72 7RE-046 | |
| 1920x1080 High Preset AA:T AF:8x | |
| MSI GE72 7RE-046 | |
| Nexoc G739 | |
| BioShock Infinite - 1920x1080 Ultra Preset, DX11 (DDOF) | |
| HP Omen 17-w100ng | |
| Asus GL702VM-GC102D | |
| Nexoc G739 | |
| basso | medio | alto | ultra | |
|---|---|---|---|---|
| BioShock Infinite (2013) | 72.5 | |||
| The Witcher 3 (2015) | 89.8 | 50.4 | 27.6 | |
| Rise of the Tomb Raider (2016) | 84.2 | 47.6 | 40.7 | |
| Battlefield 1 (2016) | 79.2 | 55.7 | 50.8 | |
| For Honor (2017) | 65.8 | 62.1 | 46.1 |
Rumorosità
| Idle |
| 31 / 32 / 38 dB(A) |
| HDD |
| 31 dB(A) |
| Sotto carico |
| 44 / 50 dB(A) |
 | ||
30 dB silenzioso 40 dB(A) udibile 50 dB(A) rumoroso |
||
min: | ||
| Nexoc G739 GeForce GTX 1050 Ti Mobile, i7-7700HQ | Asus Strix GL753VD-GC045T GeForce GTX 1050 Mobile, i7-7700HQ | HP Omen 17-w100ng GeForce GTX 1060 Mobile, 6300HQ | MSI GE72 7RE-046 GeForce GTX 1050 Ti Mobile, i7-7700HQ | Asus GL702VM-GC102D GeForce GTX 1060 Mobile, 6700HQ | |
|---|---|---|---|---|---|
| Noise | -0% | -6% | -1% | 5% | |
| off /ambiente * (dB) | 30 | 28.8 4% | 31 -3% | 30 -0% | 30.5 -2% |
| Idle Minimum * (dB) | 31 | 33.9 -9% | 35 -13% | 34 -10% | 31.4 -1% |
| Idle Average * (dB) | 32 | 33.9 -6% | 36 -13% | 35 -9% | 31.4 2% |
| Idle Maximum * (dB) | 38 | 37.8 1% | 37 3% | 36 5% | 31.5 17% |
| Load Average * (dB) | 44 | 42.7 3% | 44 -0% | 41 7% | 40.9 7% |
| Load Maximum * (dB) | 50 | 47.4 5% | 54 -8% | 49 2% | 46.2 8% |
* ... Meglio usare valori piccoli
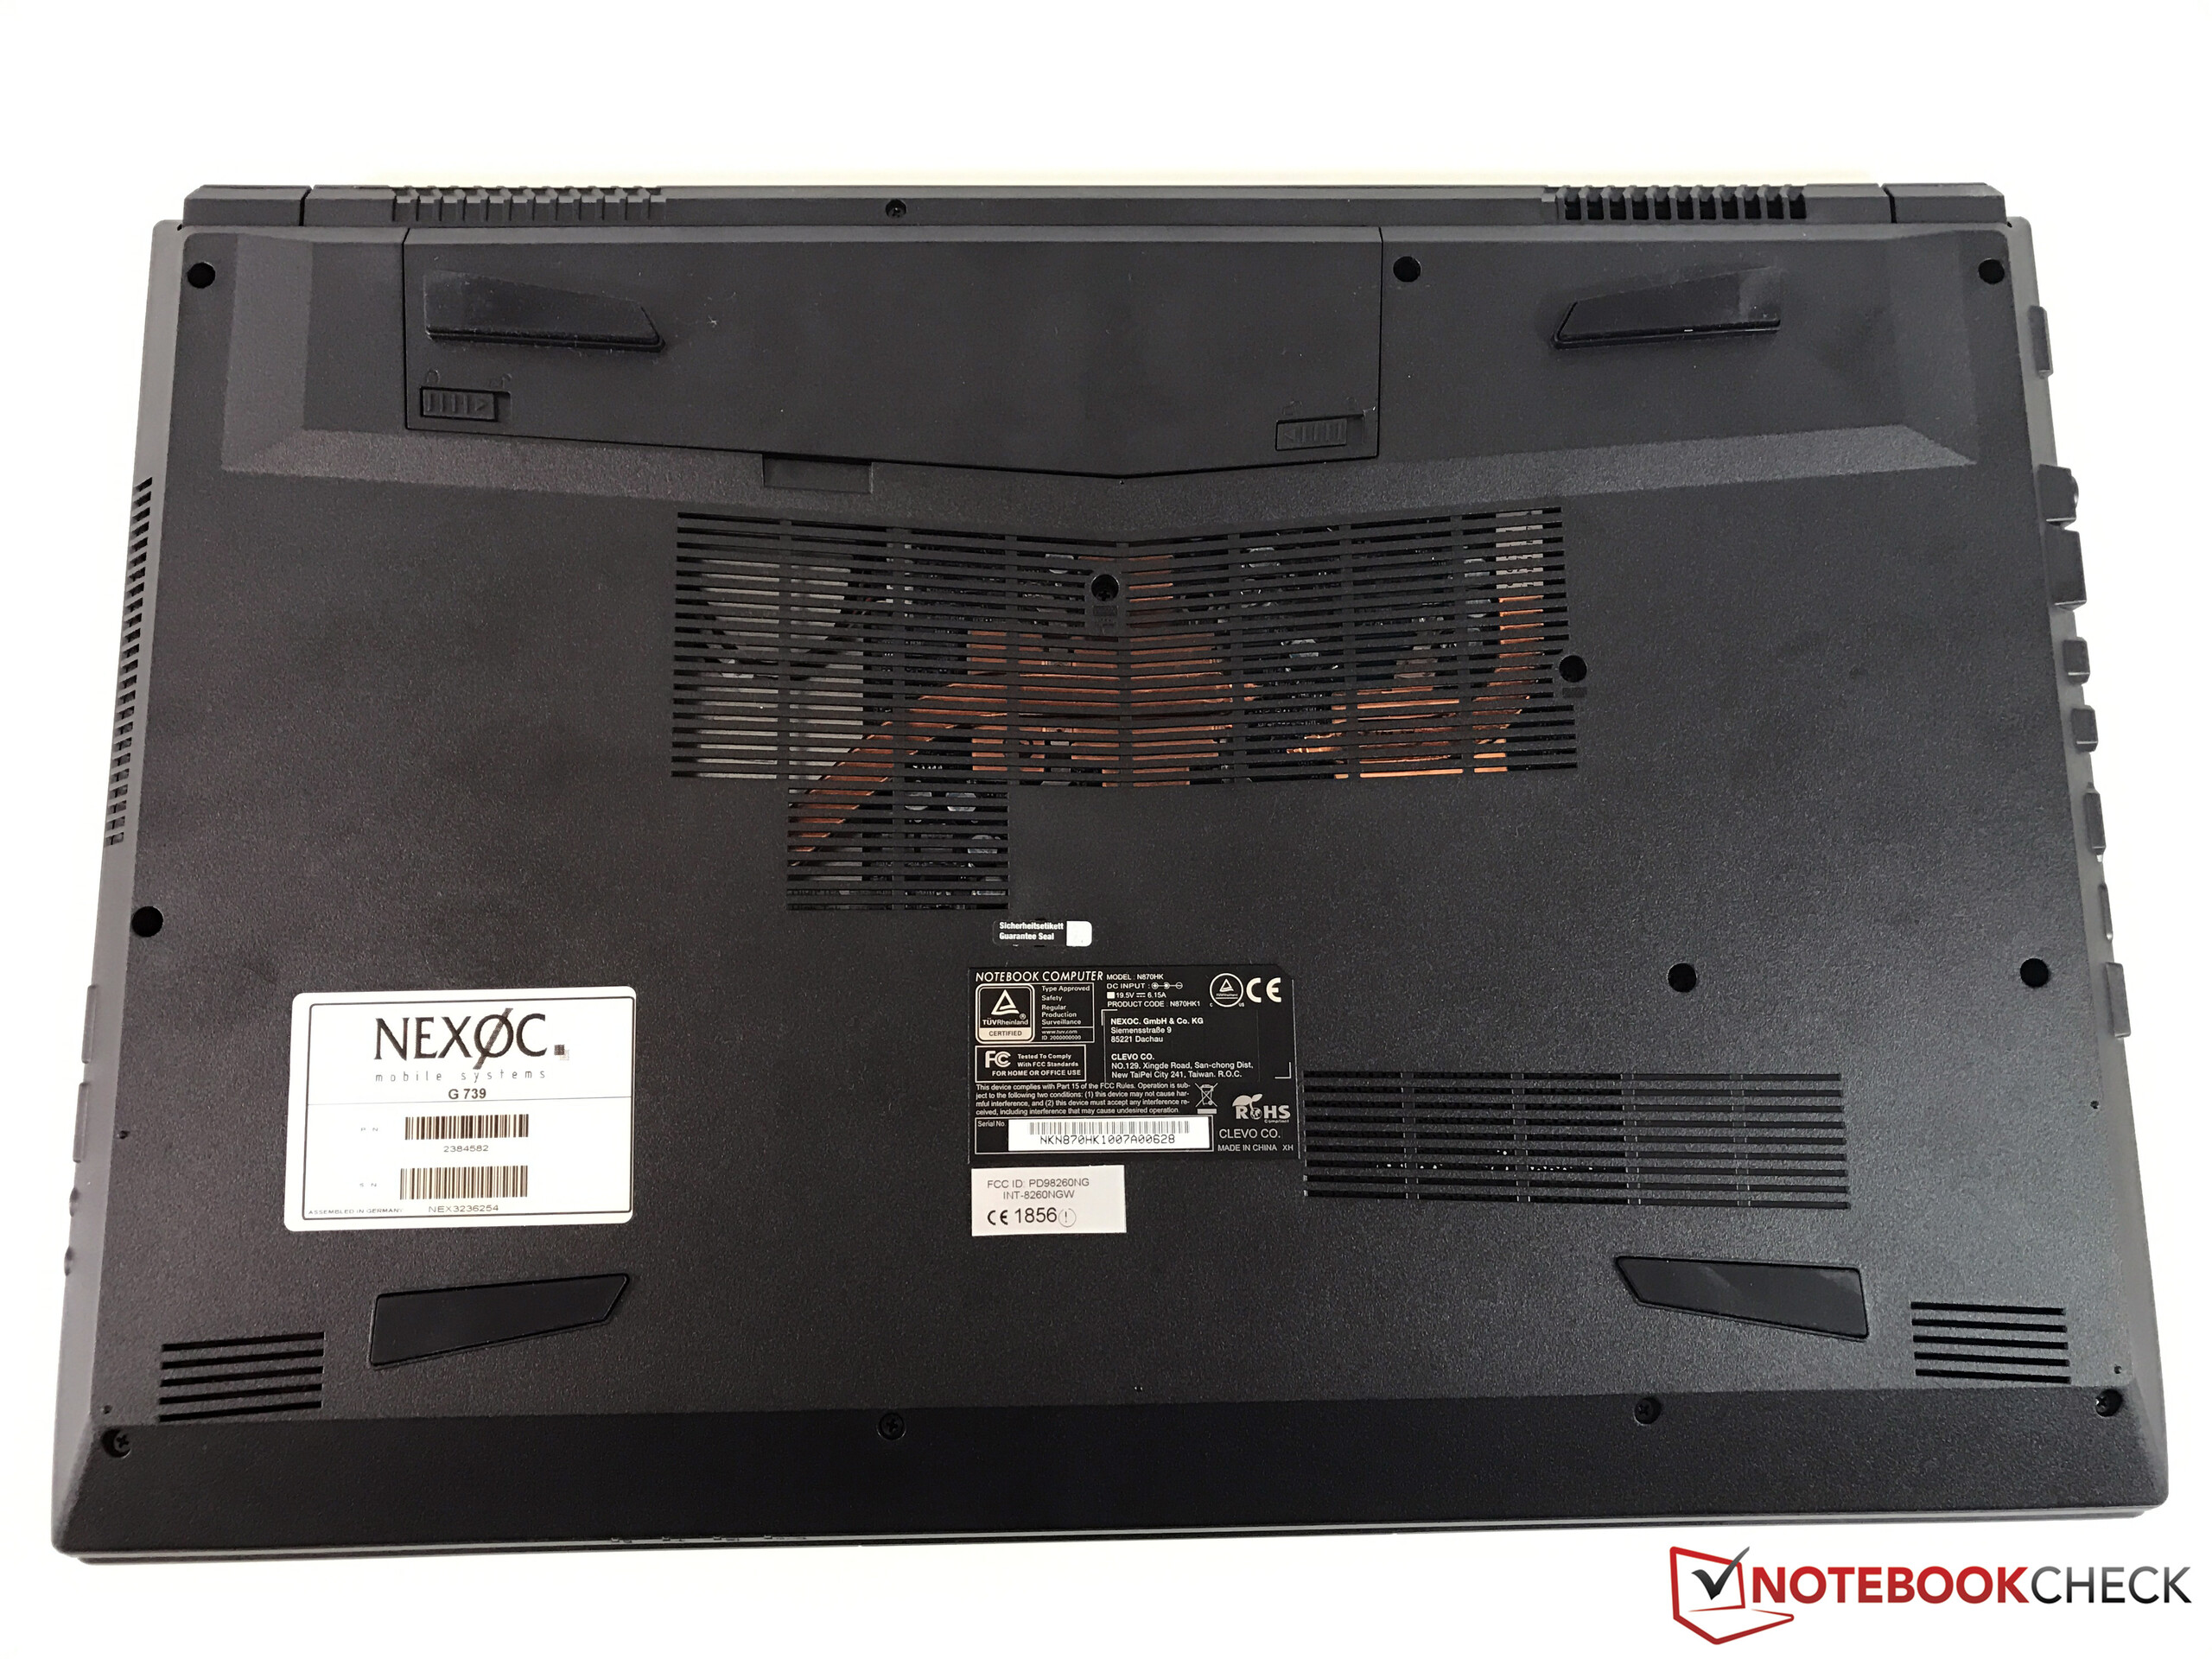
(-) La temperatura massima sul lato superiore è di 50.6 °C / 123 F, rispetto alla media di 40.4 °C / 105 F, che varia da 21.2 a 68.8 °C per questa classe Gaming.
(-) Il lato inferiore si riscalda fino ad un massimo di 50.8 °C / 123 F, rispetto alla media di 43.2 °C / 110 F
(+) In idle, la temperatura media del lato superiore è di 25.6 °C / 78 F, rispetto alla media deld ispositivo di 33.9 °C / 93 F.
(-) I poggiapolsi e il touchpad possono diventare molto caldi al tatto con un massimo di 42.8 °C / 109 F.
(-) La temperatura media della zona del palmo della mano di dispositivi simili e'stata di 28.8 °C / 83.8 F (-14 °C / -25.2 F).
| Nexoc G739 GeForce GTX 1050 Ti Mobile, i7-7700HQ | Asus Strix GL753VD-GC045T GeForce GTX 1050 Mobile, i7-7700HQ | HP Omen 17-w100ng GeForce GTX 1060 Mobile, 6300HQ | MSI GE72 7RE-046 GeForce GTX 1050 Ti Mobile, i7-7700HQ | Asus GL702VM-GC102D GeForce GTX 1060 Mobile, 6700HQ | |
|---|---|---|---|---|---|
| Heat | 19% | 2% | 0% | -8% | |
| Maximum Upper Side * (°C) | 50.6 | 37.7 25% | 41.5 18% | 45.8 9% | 53.1 -5% |
| Maximum Bottom * (°C) | 50.8 | 36.3 29% | 45.5 10% | 45.2 11% | 44.9 12% |
| Idle Upper Side * (°C) | 28.7 | 25.7 10% | 31.8 -11% | 31.7 -10% | 32.9 -15% |
| Idle Bottom * (°C) | 27.1 | 24.4 10% | 29.6 -9% | 29.9 -10% | 33.4 -23% |
* ... Meglio usare valori piccoli
Nexoc G739 analisi audio
(±) | potenza degli altiparlanti media ma buona (76 dB)
Bassi 100 - 315 Hz
(-) | quasi nessun basso - in media 23.2% inferiori alla media
(±) | la linearità dei bassi è media (13.3% delta rispetto alla precedente frequenza)
Medi 400 - 2000 Hz
(±) | medi elevati - circa 7.8% superiore alla media
(±) | linearità dei medi adeguata (8% delta rispetto alla precedente frequenza)
Alti 2 - 16 kHz
(±) | alti elevati - circa 6.4% superiori alla media
(±) | la linearità degli alti è media (12.4% delta rispetto alla precedente frequenza)
Nel complesso 100 - 16.000 Hz
(-) | suono nel complesso non lineare (31.5% di differenza rispetto alla media
Rispetto alla stessa classe
» 97% di tutti i dispositivi testati in questa classe è stato migliore, 1% simile, 2% peggiore
» Il migliore ha avuto un delta di 6%, medio di 18%, peggiore di 132%
Rispetto a tutti i dispositivi testati
» 90% di tutti i dispositivi testati in questa classe è stato migliore, 2% similare, 8% peggiore
» Il migliore ha avuto un delta di 4%, medio di 24%, peggiore di 134%
Asus Strix GL753VD-GC045T analisi audio
(±) | potenza degli altiparlanti media ma buona (81.5 dB)
Bassi 100 - 315 Hz
(-) | quasi nessun basso - in media 15.8% inferiori alla media
(±) | la linearità dei bassi è media (12.2% delta rispetto alla precedente frequenza)
Medi 400 - 2000 Hz
(+) | medi bilanciati - solo only 3.1% rispetto alla media
(±) | linearità dei medi adeguata (7% delta rispetto alla precedente frequenza)
Alti 2 - 16 kHz
(±) | alti elevati - circa 6.3% superiori alla media
(+) | alti lineari (5.4% delta rispetto alla precedente frequenza)
Nel complesso 100 - 16.000 Hz
(±) | la linearità complessiva del suono è media (17.2% di differenza rispetto alla media
Rispetto alla stessa classe
» 46% di tutti i dispositivi testati in questa classe è stato migliore, 11% simile, 42% peggiore
» Il migliore ha avuto un delta di 6%, medio di 18%, peggiore di 132%
Rispetto a tutti i dispositivi testati
» 32% di tutti i dispositivi testati in questa classe è stato migliore, 8% similare, 60% peggiore
» Il migliore ha avuto un delta di 4%, medio di 24%, peggiore di 134%
| Off / Standby | |
| Idle | |
| Sotto carico |
|
Leggenda:
min: | |
| Nexoc G739 GeForce GTX 1050 Ti Mobile, i7-7700HQ | Asus Strix GL753VD-GC045T GeForce GTX 1050 Mobile, i7-7700HQ | HP Omen 17-w100ng GeForce GTX 1060 Mobile, 6300HQ | MSI GE72 7RE-046 GeForce GTX 1050 Ti Mobile, i7-7700HQ | Asus GL702VM-GC102D GeForce GTX 1060 Mobile, 6700HQ | |
|---|---|---|---|---|---|
| Power Consumption | 16% | -40% | -27% | -32% | |
| Idle Minimum * (Watt) | 7 | 6.2 11% | 17 -143% | 14 -100% | 15.6 -123% |
| Idle Average * (Watt) | 14 | 12.2 13% | 22 -57% | 20 -43% | 20.2 -44% |
| Idle Maximum * (Watt) | 23 | 14.8 36% | 29 -26% | 25 -9% | 21.4 7% |
| Load Average * (Watt) | 82 | 84.9 -4% | 72 12% | 82 -0% | 90 -10% |
| Load Maximum * (Watt) | 163 | 120.7 26% | 141 13% | 135 17% | 147 10% |
* ... Meglio usare valori piccoli
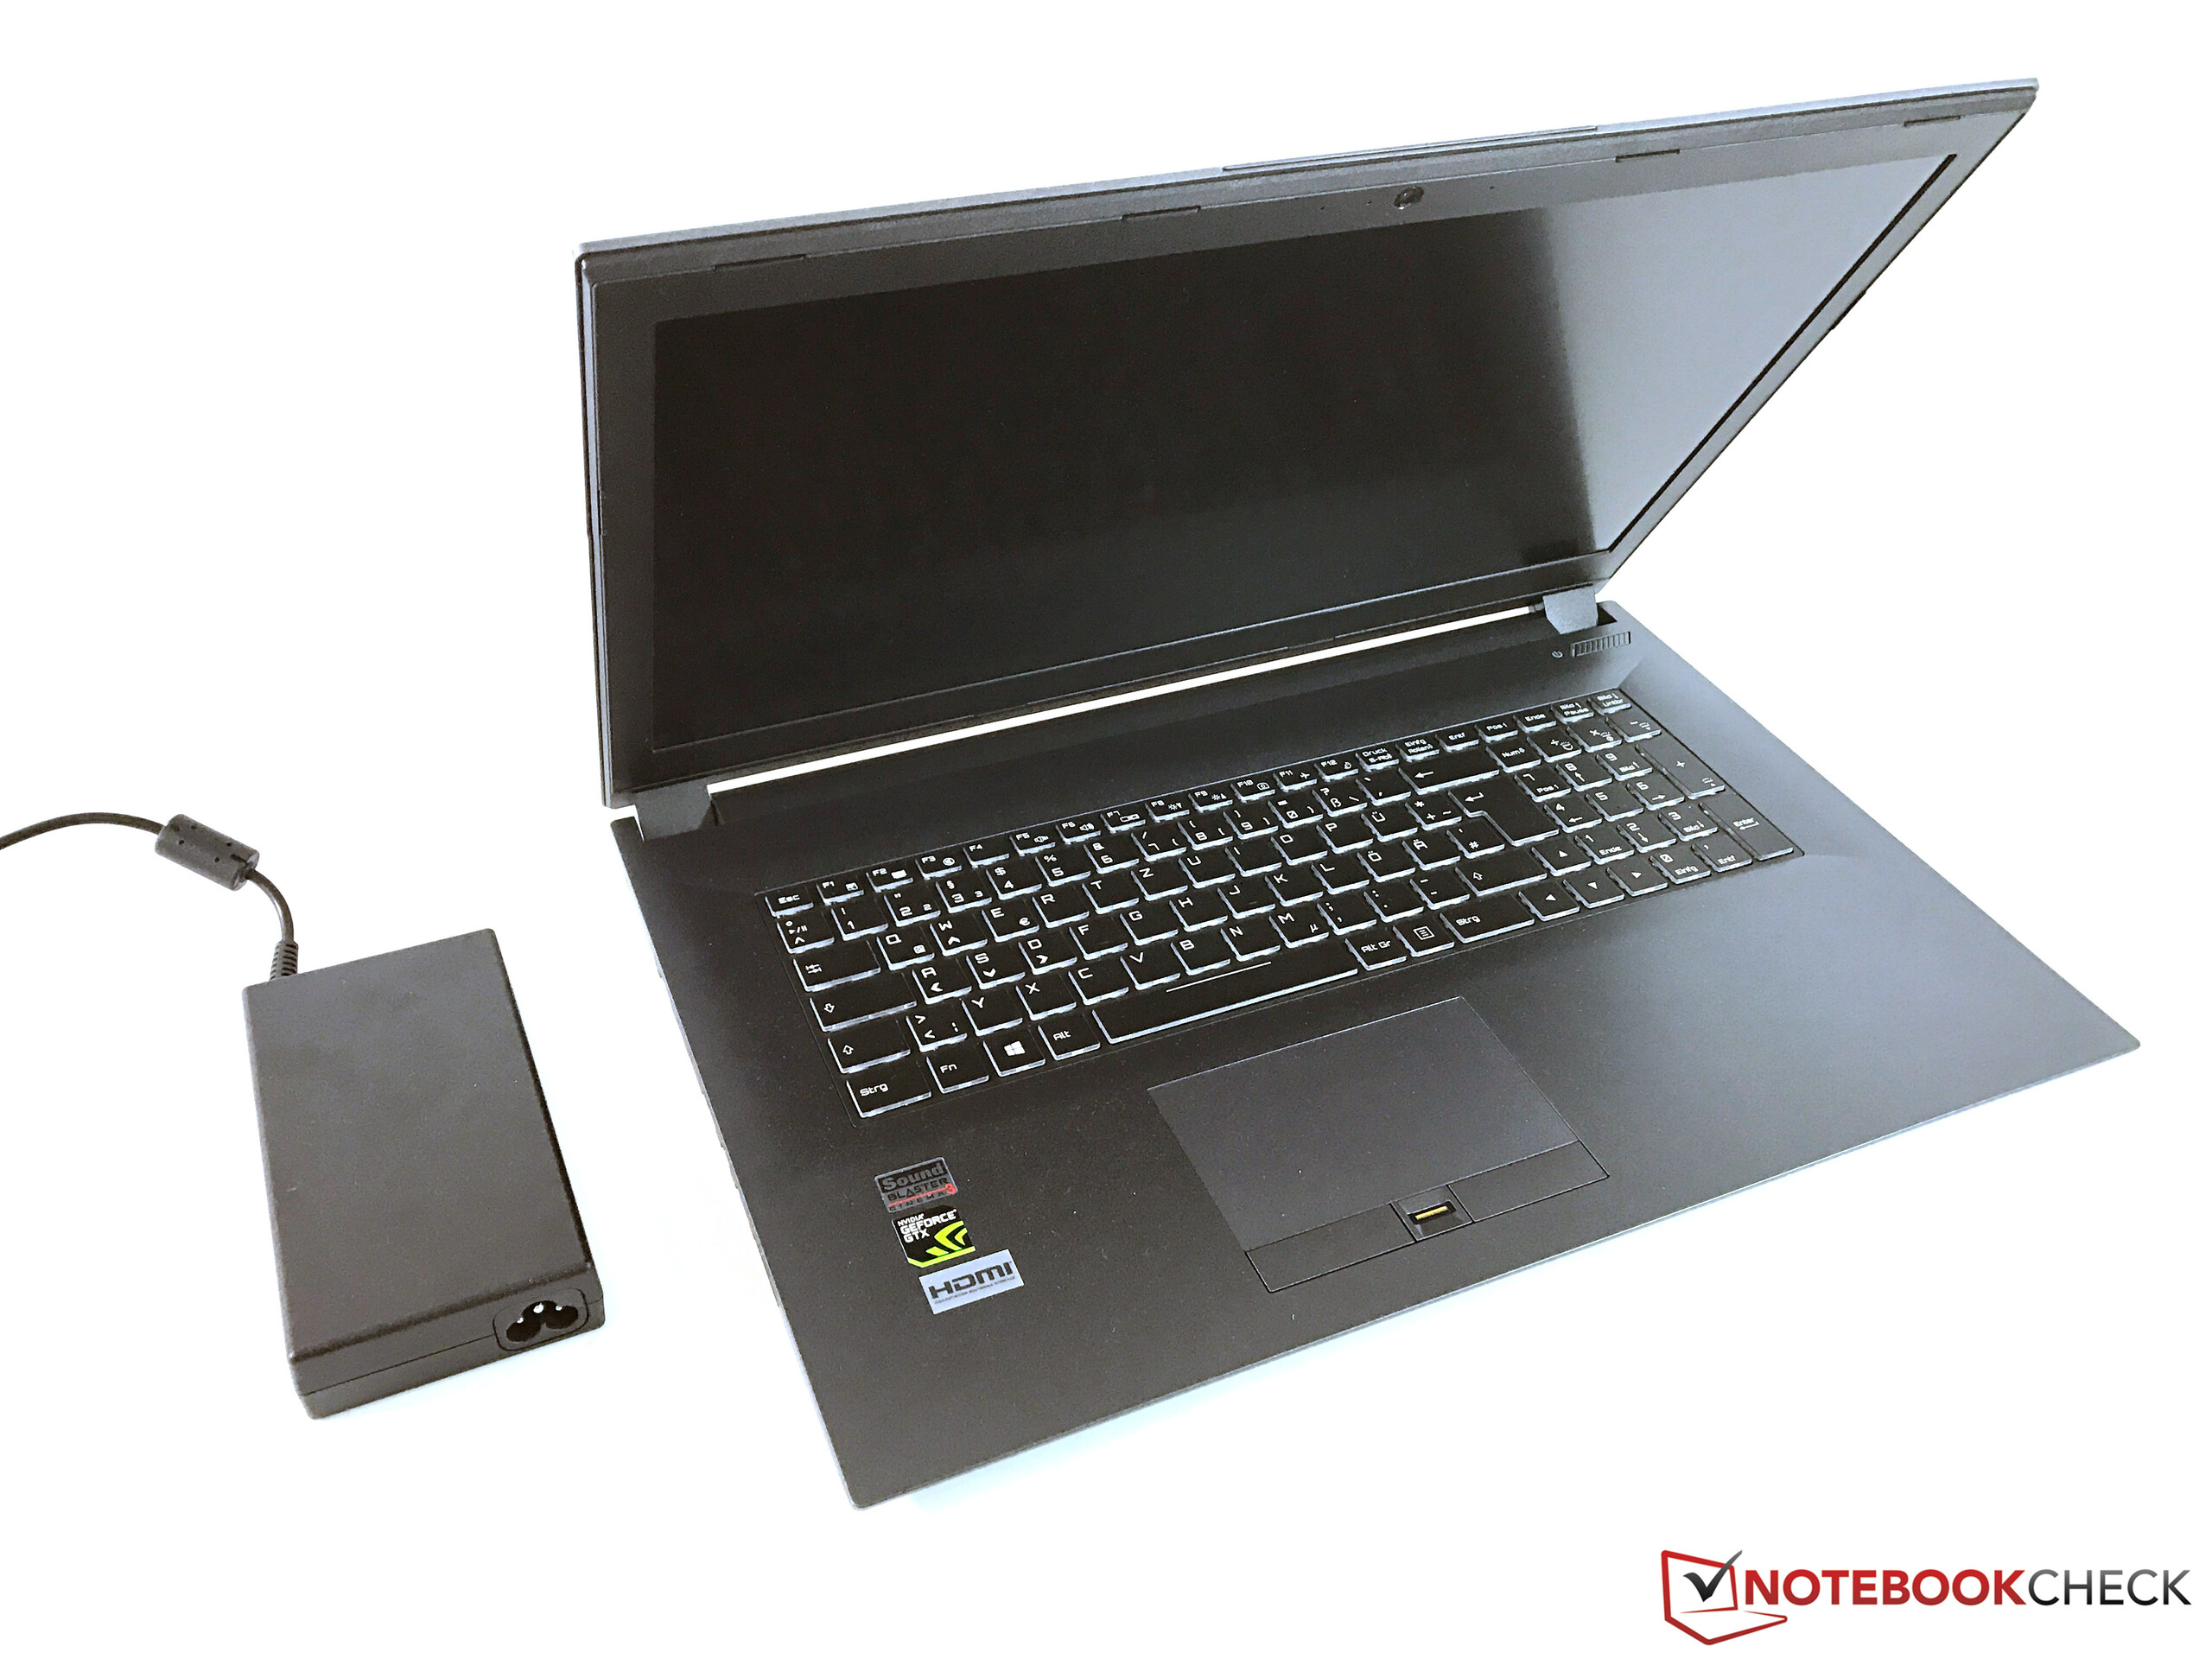
| Nexoc G739 GeForce GTX 1050 Ti Mobile, i7-7700HQ, 62 Wh | Asus Strix GL753VD-GC045T GeForce GTX 1050 Mobile, i7-7700HQ, 48 Wh | HP Omen 17-w100ng GeForce GTX 1060 Mobile, 6300HQ, 95.8 Wh | MSI GE72 7RE-046 GeForce GTX 1050 Ti Mobile, i7-7700HQ, 51.4 Wh | Asus GL702VM-GC102D GeForce GTX 1060 Mobile, 6700HQ, 76 Wh | |
|---|---|---|---|---|---|
| Autonomia della batteria | -29% | 7% | -37% | -26% | |
| Reader / Idle (h) | 10.2 | 8.6 -16% | 9.1 -11% | 5.9 -42% | |
| H.264 (h) | 5.4 | 5.2 -4% | 3.3 -39% | 4.4 -19% | |
| WiFi v1.3 (h) | 4.8 | 4.4 -8% | 6.1 27% | 3.1 -35% | 4.2 -12% |
| Load (h) | 2.1 | 0.8 -62% | 2.4 14% | 1.5 -29% |
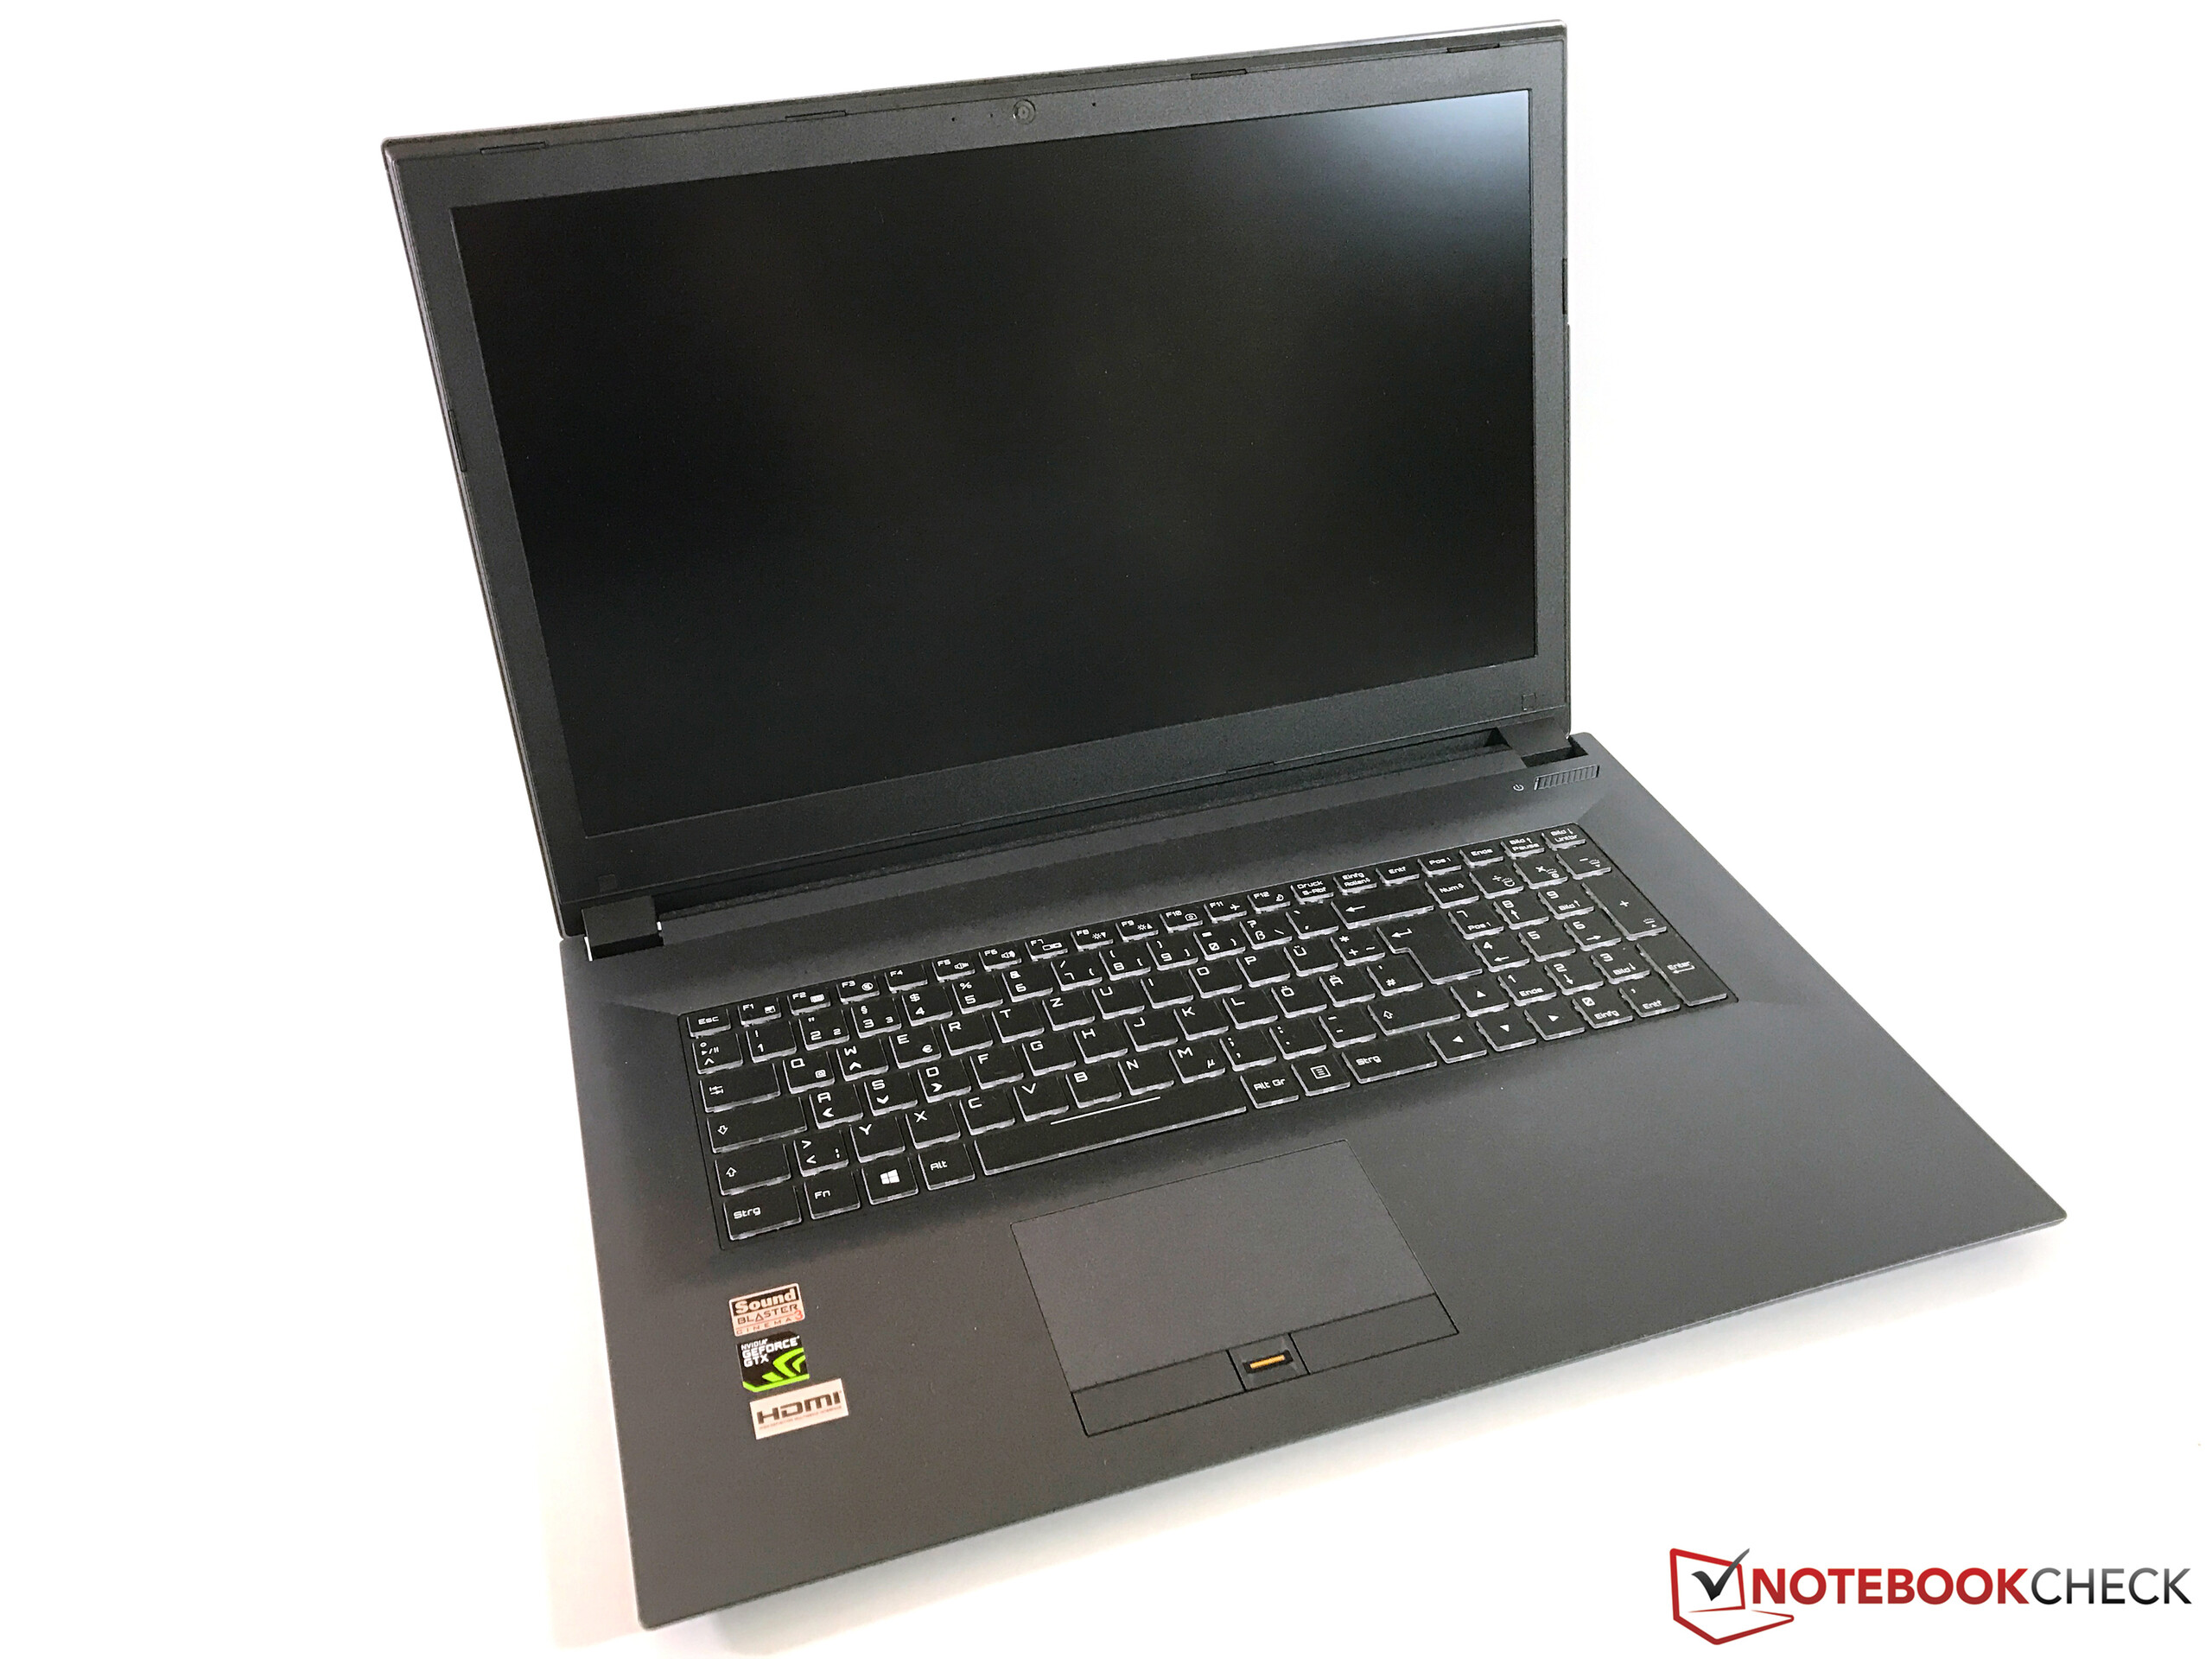
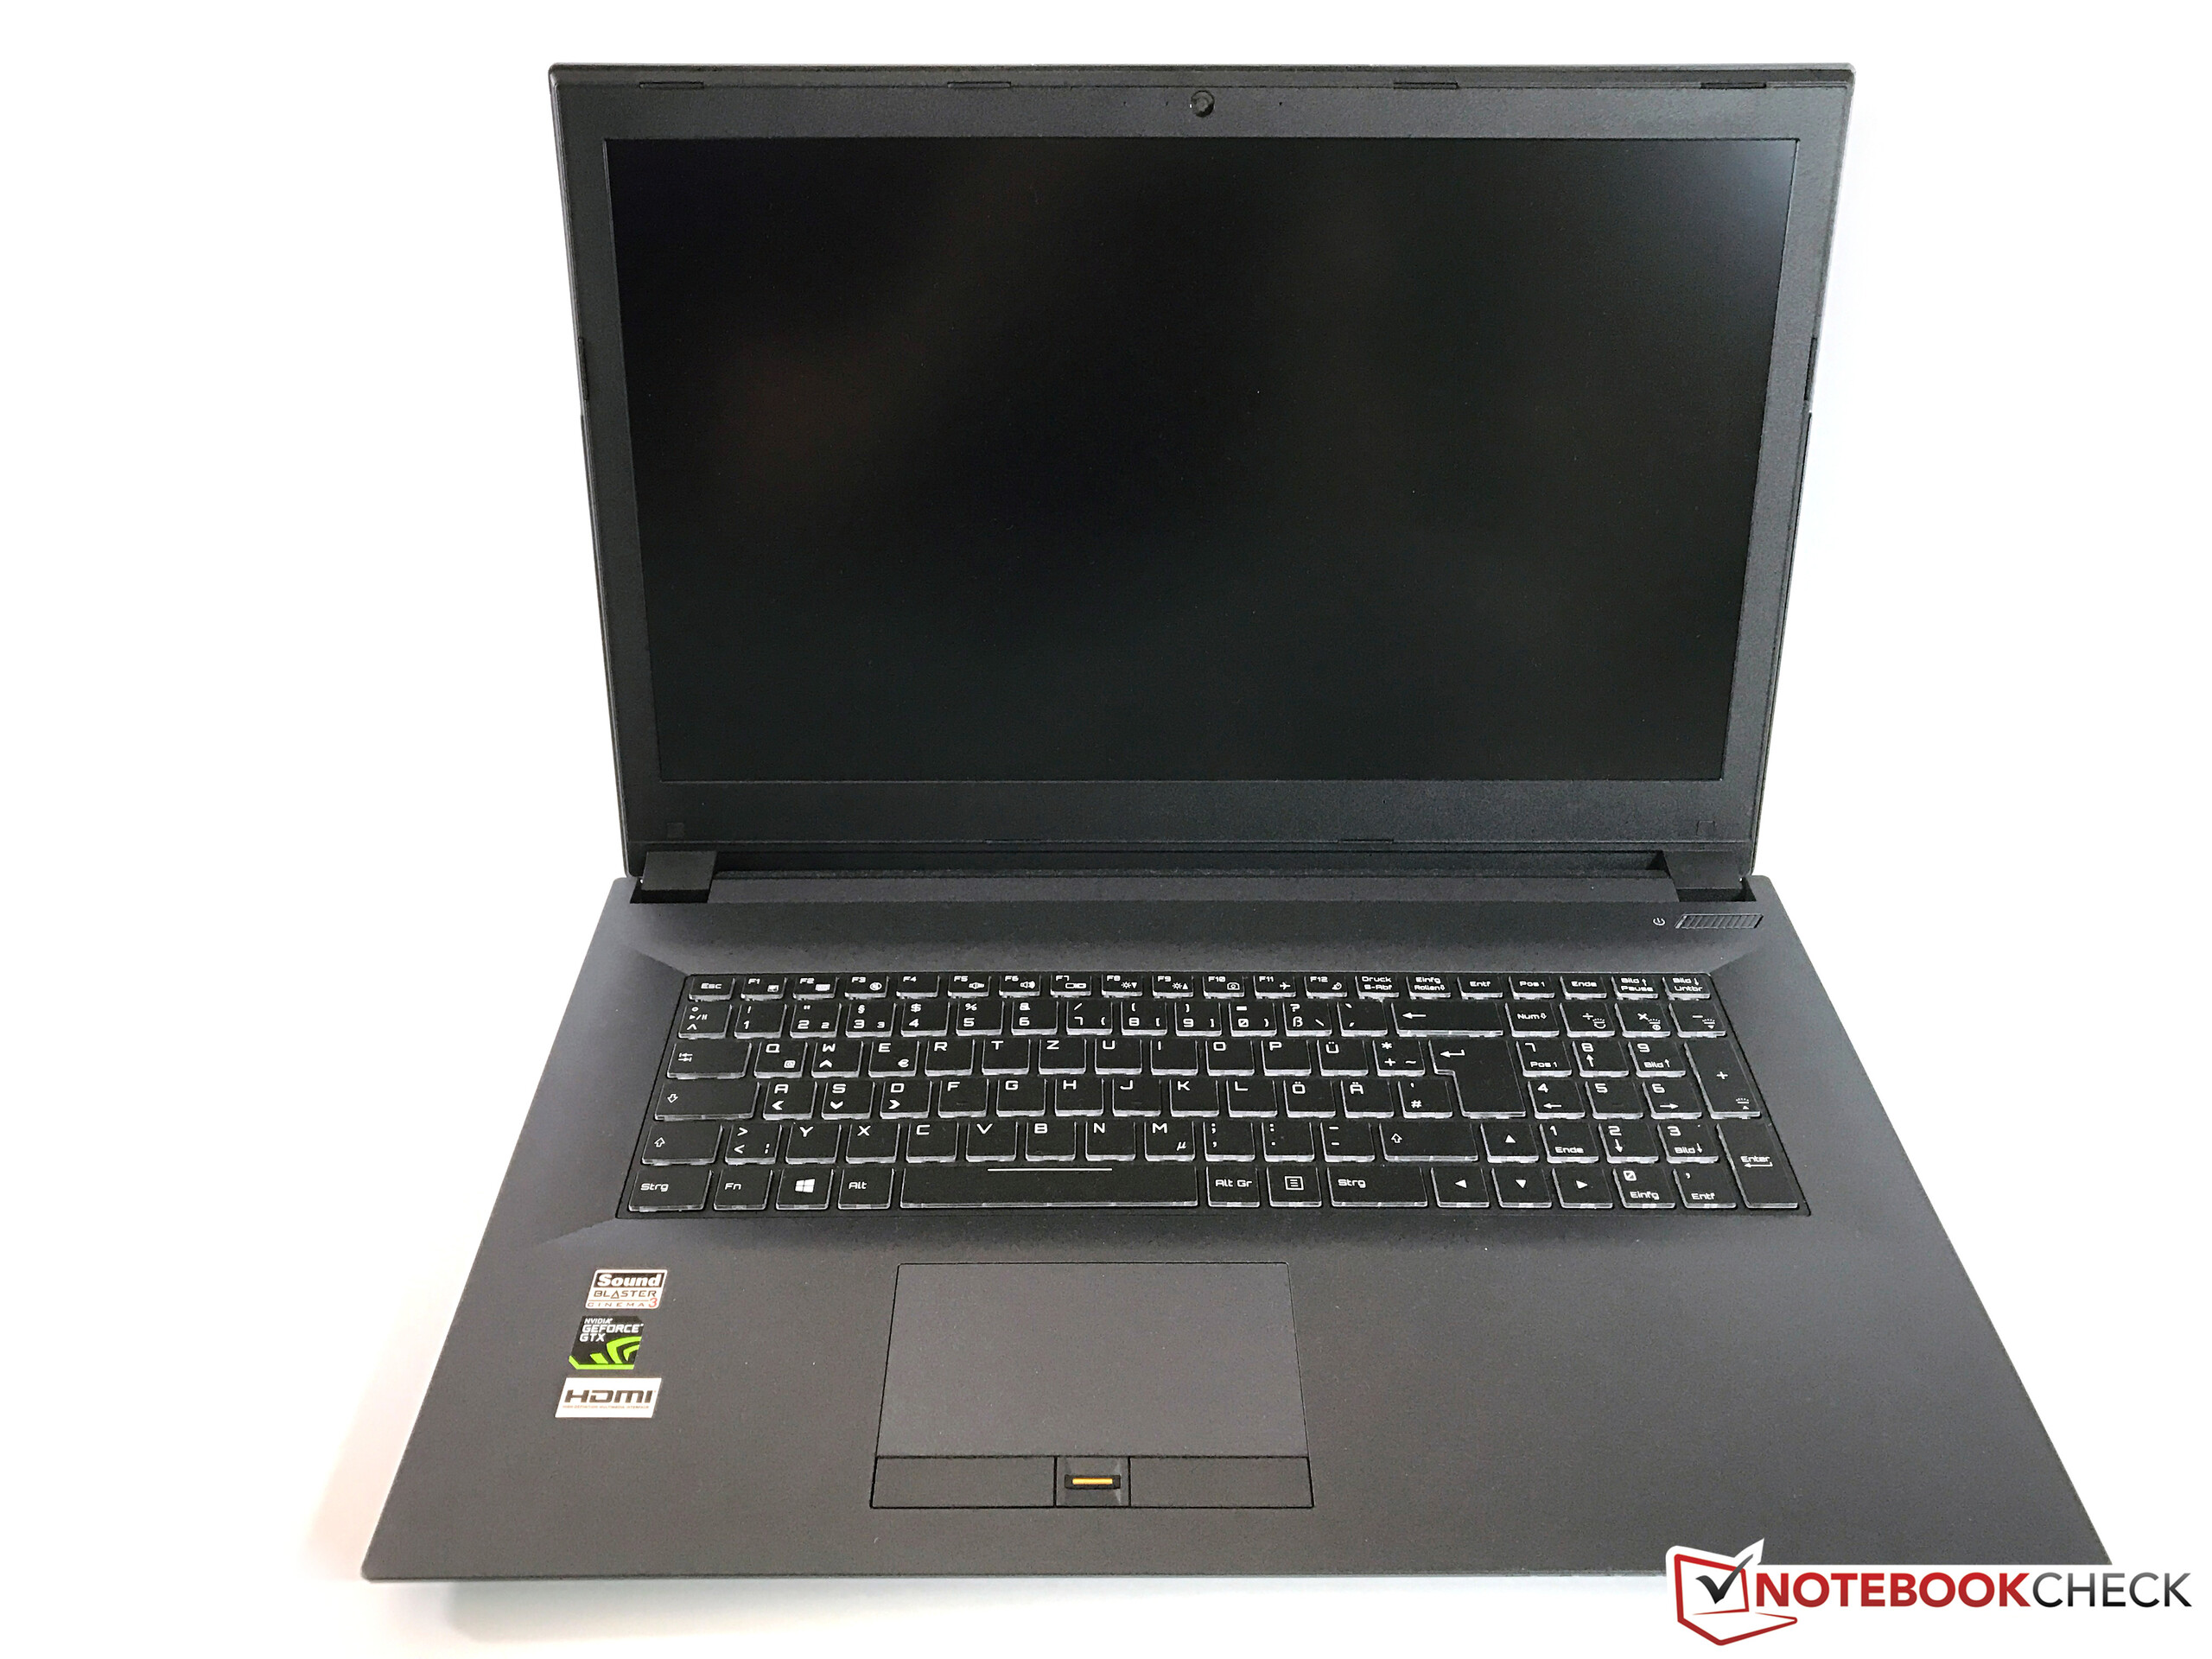
Grazie al potente hardware, il Nexoc G739 è un buon portatile entry-level. La scheda grafica si armonizza bene con il display Full-HD, che è sufficientemente luminoso bright e per il resto decente. Ma in molte altre aree, ad esempio connessioni e dispositivi di input, il dispositivo è mediocre.
In termini di performance, il Nexoc G739 non mostra alcuna debolezza e gestisca anche i giochi pesanti, ma le emissioni del Clevo-N870HK1 Barebones possono essere migliorate.
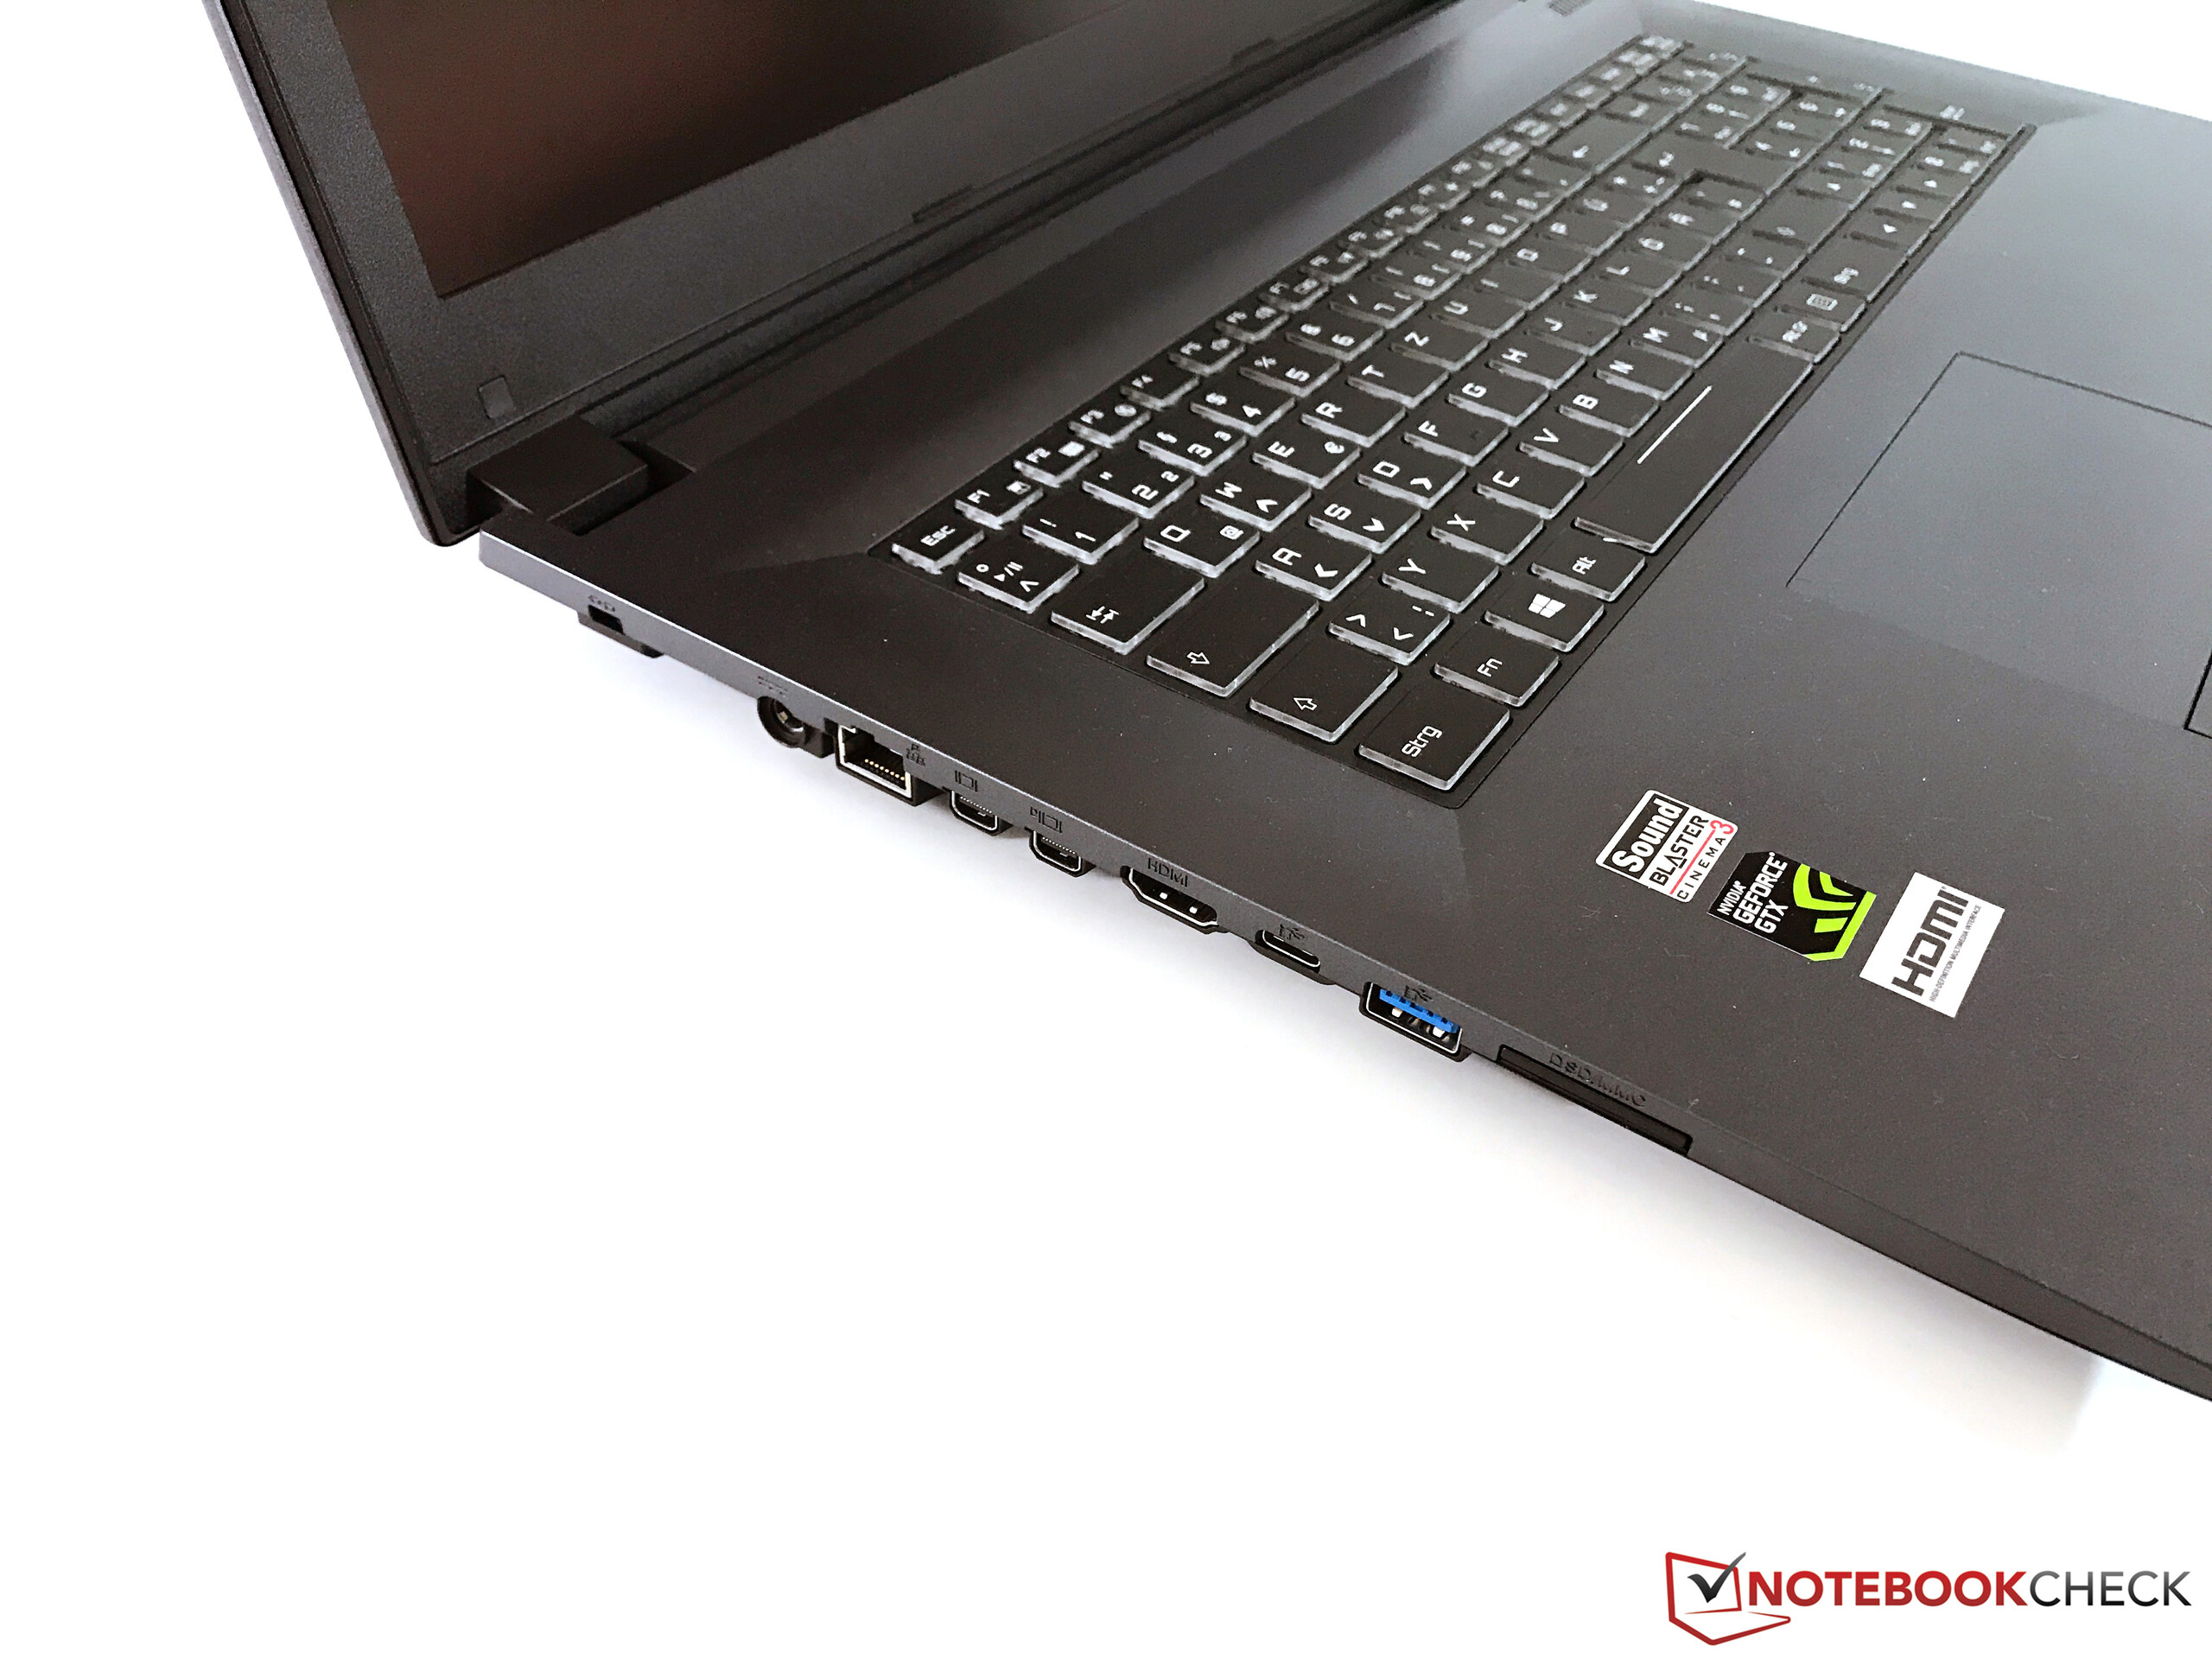
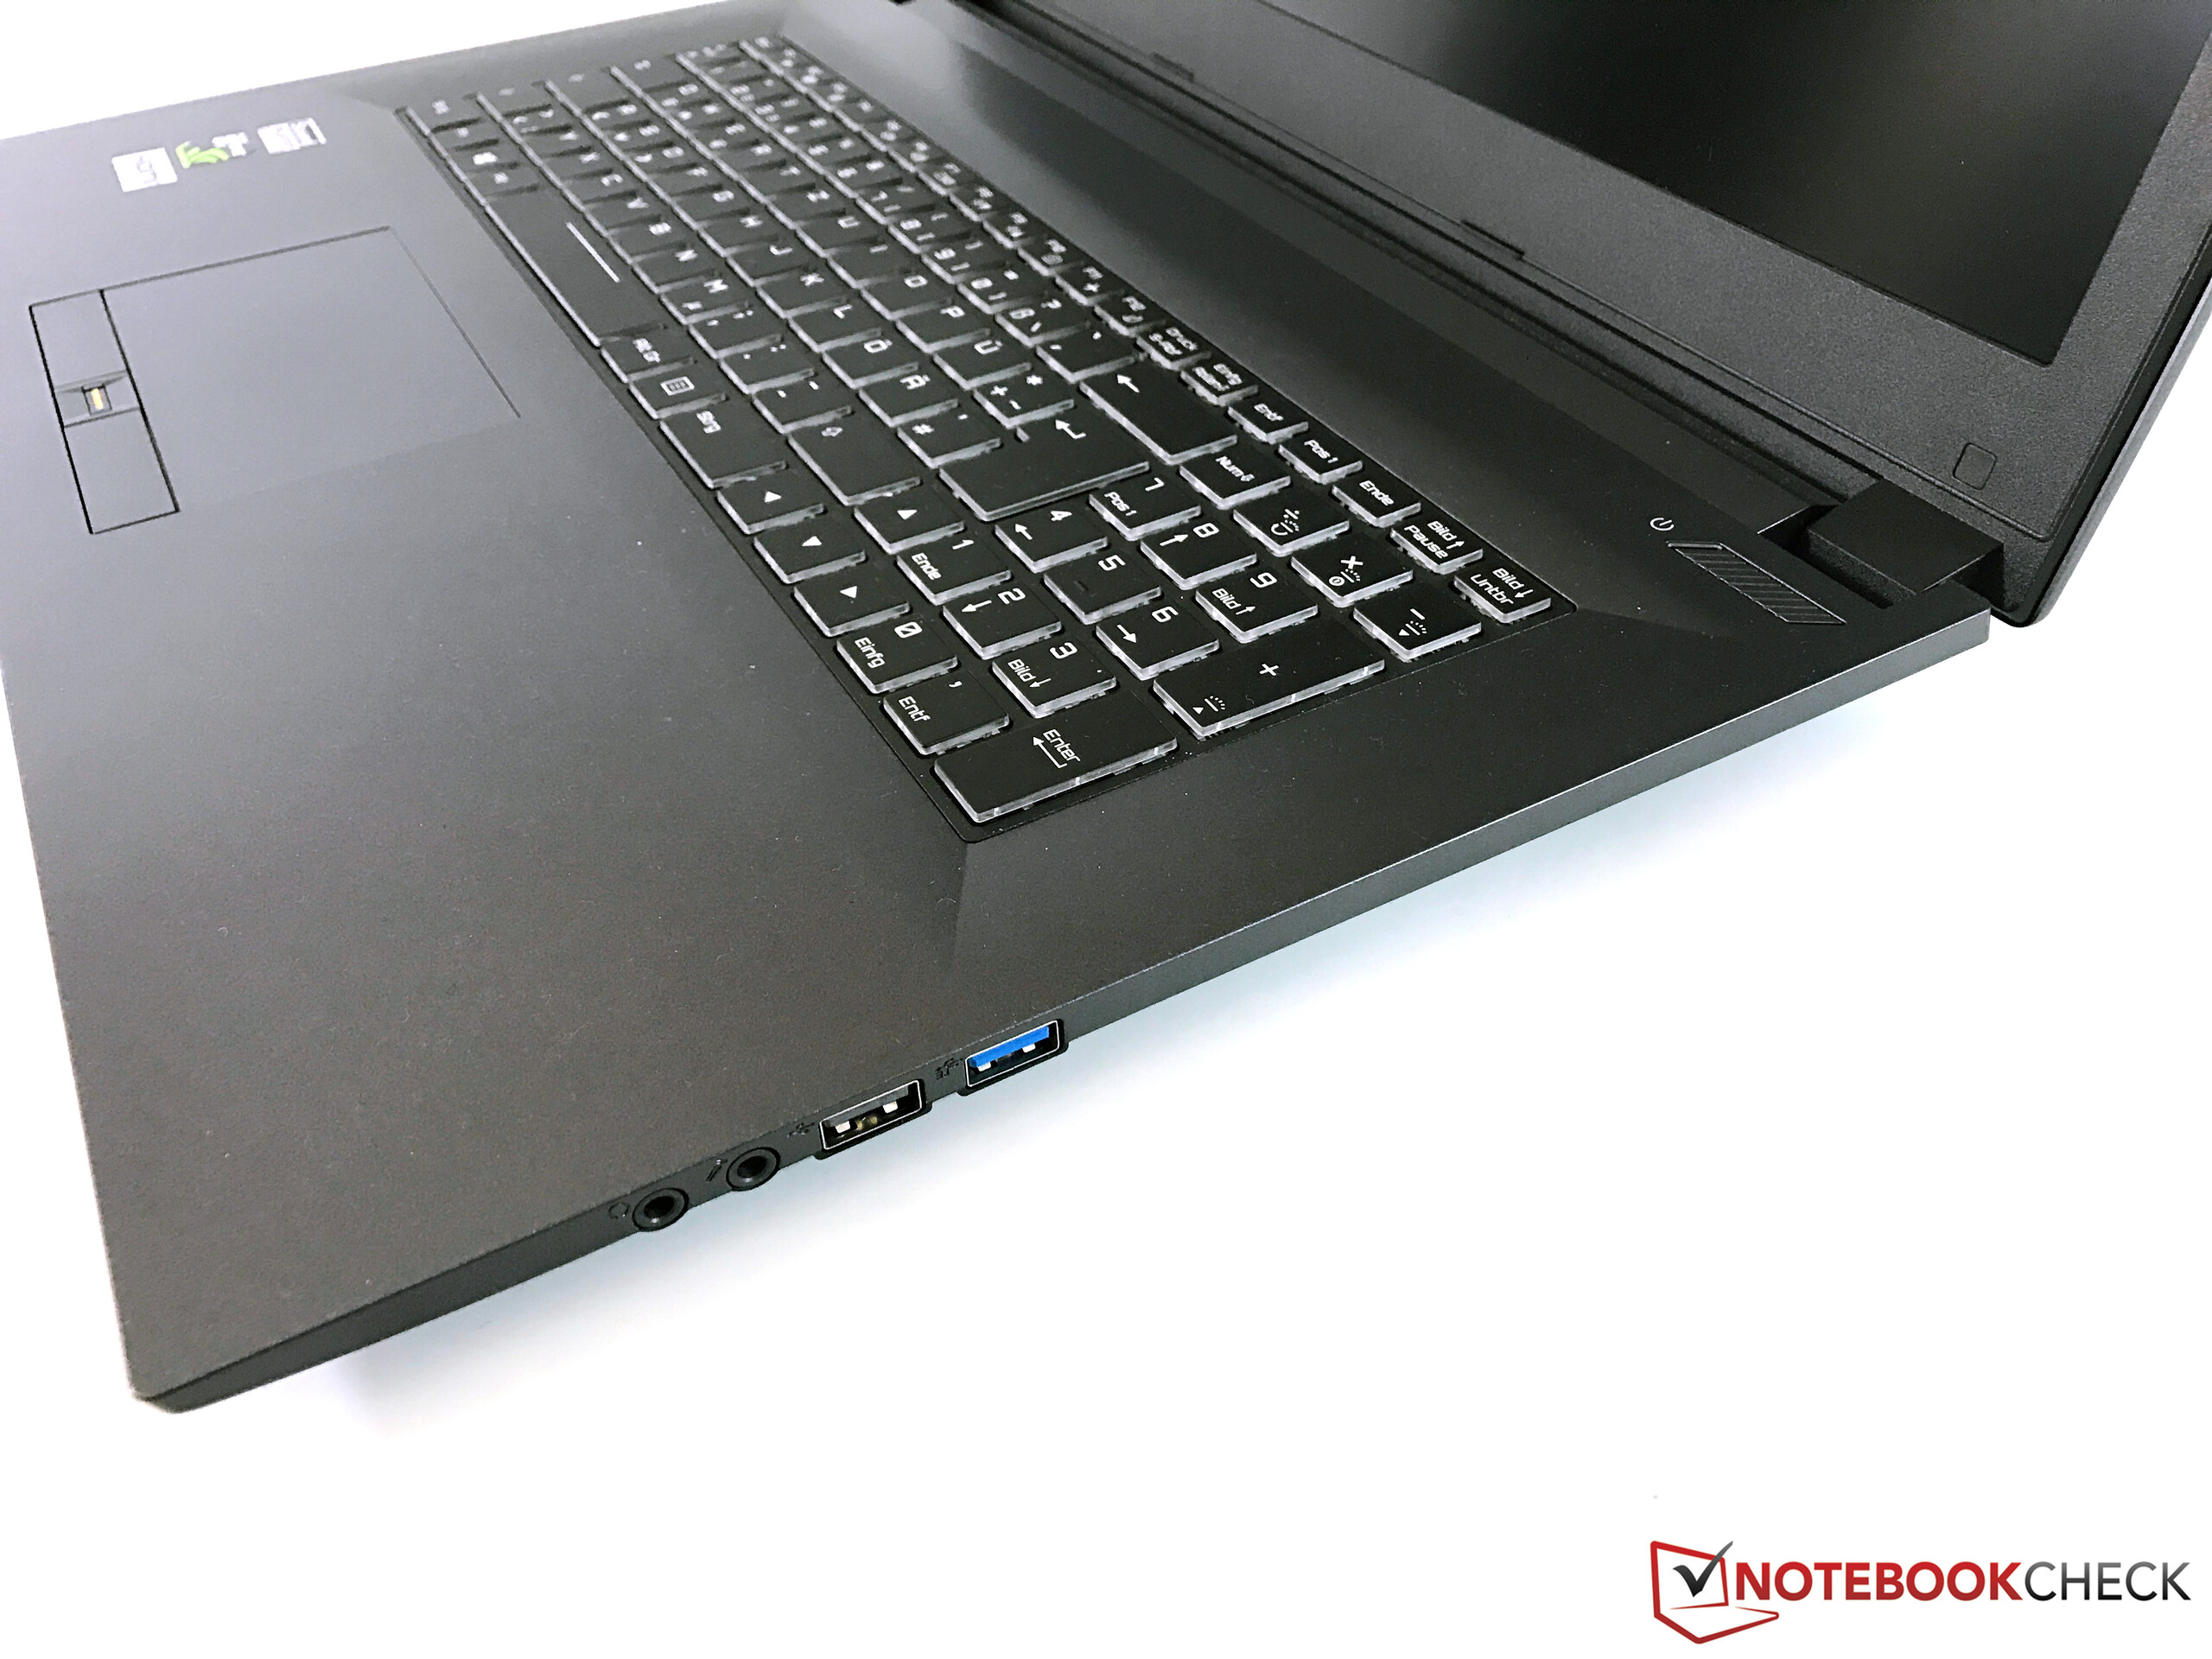
I punti deboli includono temperature e rumorosità. Il case dovrebbe offrire spazio per un sistema di raffreddamento più potente, e le piccole ventole sono rumorose oltre al fatto che si scalda abbastanza. Bisogna migliorare anche le connessioni (manca una Thunderbolt), ed inserire gaming features come G-Sync.
Nel complesso, il Nexoc G739 non è male come portatile gaming, ma uno sguardo alla concorrenza no fa male.
Nota: si tratta di una recensione breve, con alcune sezioni non tradotte, per la versione integrale in inglese guardate qui.
Pro
Contro
Thanks to the powerful hardware, the Nexoc G739 is a capable entry-level notebook. The graphics card harmonizes well with the Full-HD display, which is sufficiently bright and otherwise achieves decent results as well. But in many other areas, such as for example the connections, casing, and input devices, the test device is only average.
In terms of the performance, the Nexoc G739 does not show any weaknesses and handles also demanding games, but the emissions of the Clevo-N870HK1 Barebones could be improved.
The weak points clearly include the temperature and noise generation. The casing would offer sufficient space for a stronger cooling system, but both small fans make a lot of noise and the casing gets very warm as well. There is also need for improvements in the connectors (no Thunderbolt), and we looked for particular gaming features such as G-Sync here in vain as well.
Overall, the Nexoc G739 sure is not a bad gaming notebook, but a look at the competition cannot hurt.
Nexoc G739
- 06/23/2018 v6 (old)
Andreas Osthoff