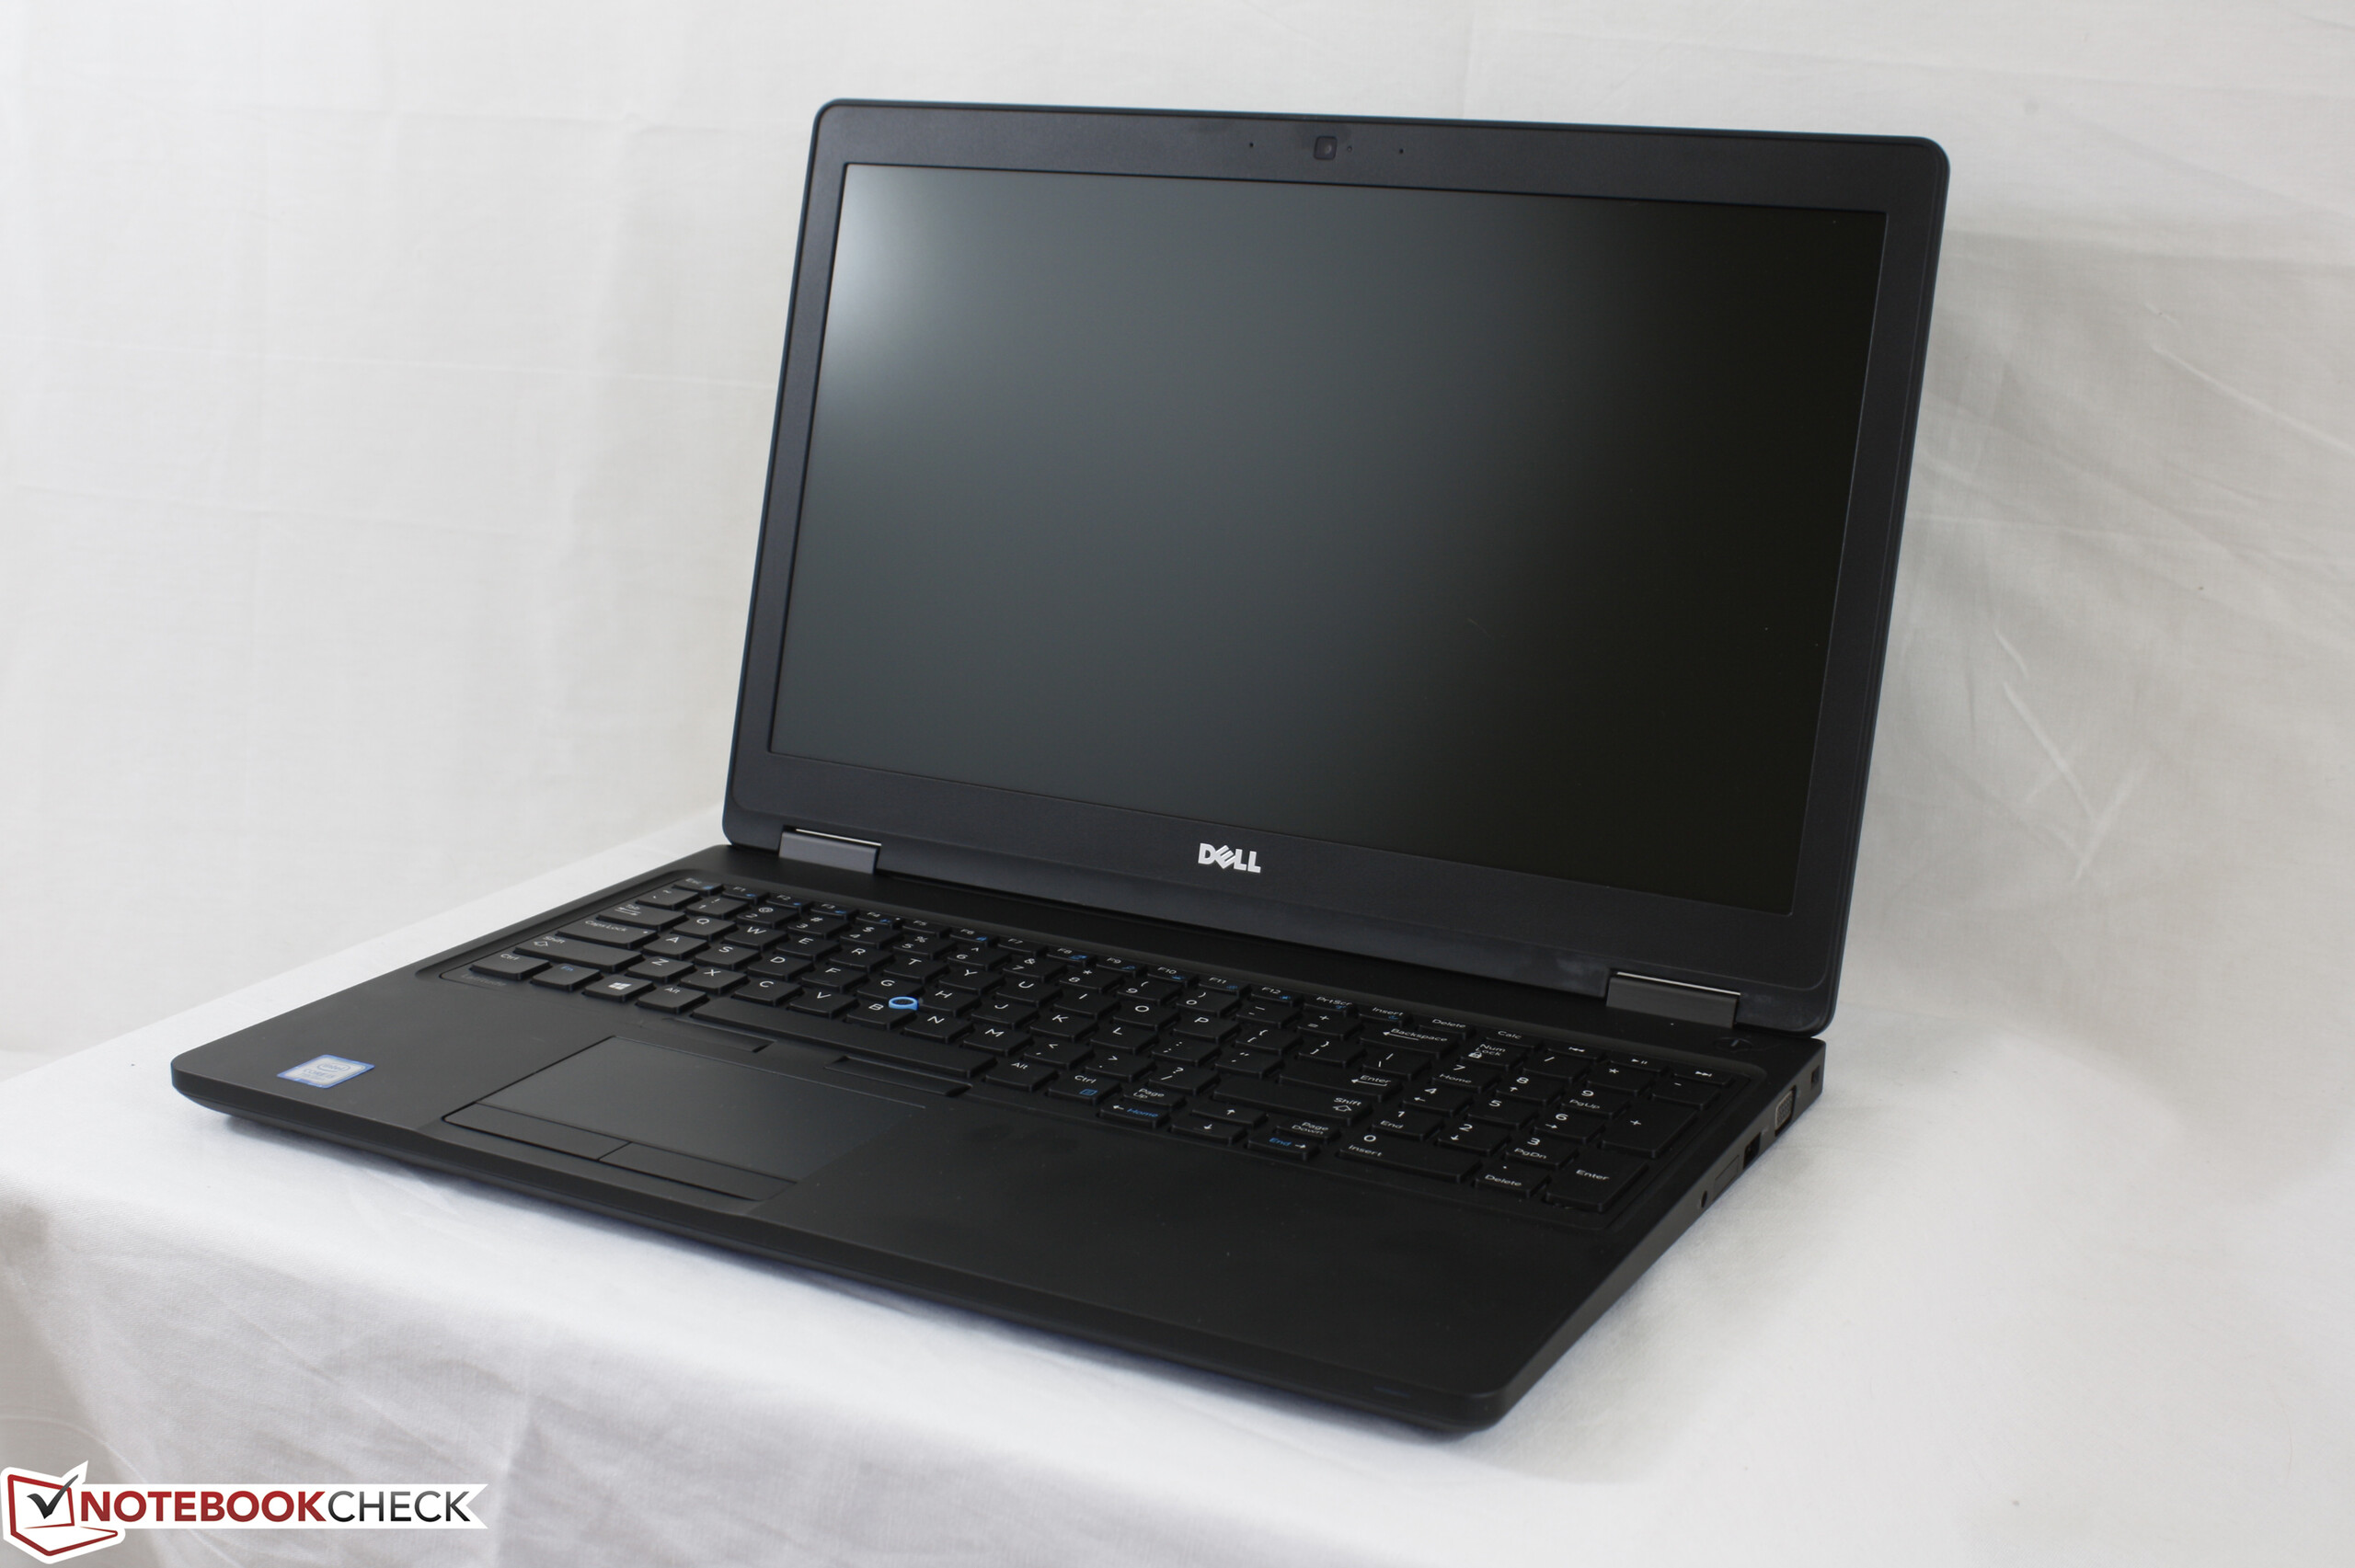
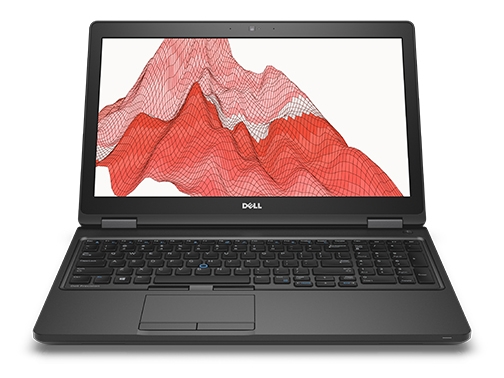
Recensione breve della Workstation Dell Precision 3520 (i7-7820HQ, M620M)
| SD Card Reader | |
| average JPG Copy Test (av. of 3 runs) | |
| Dell Precision 3520 | |
| Dell Precision 5520 UHD | |
| Dell Precision 3510 | |
| maximum AS SSD Seq Read Test (1GB) | |
| Dell Precision 5520 UHD | |
| Dell Precision 3510 | |
| Dell Precision 3520 | |
| Networking | |
| iperf3 transmit AX12 | |
| Dell Precision 5520 UHD | |
| Dell Precision 3520 | |
| iperf3 receive AX12 | |
| Dell Precision 3520 | |
| Dell Precision 5520 UHD | |
| |||||||||||||||||||||||||
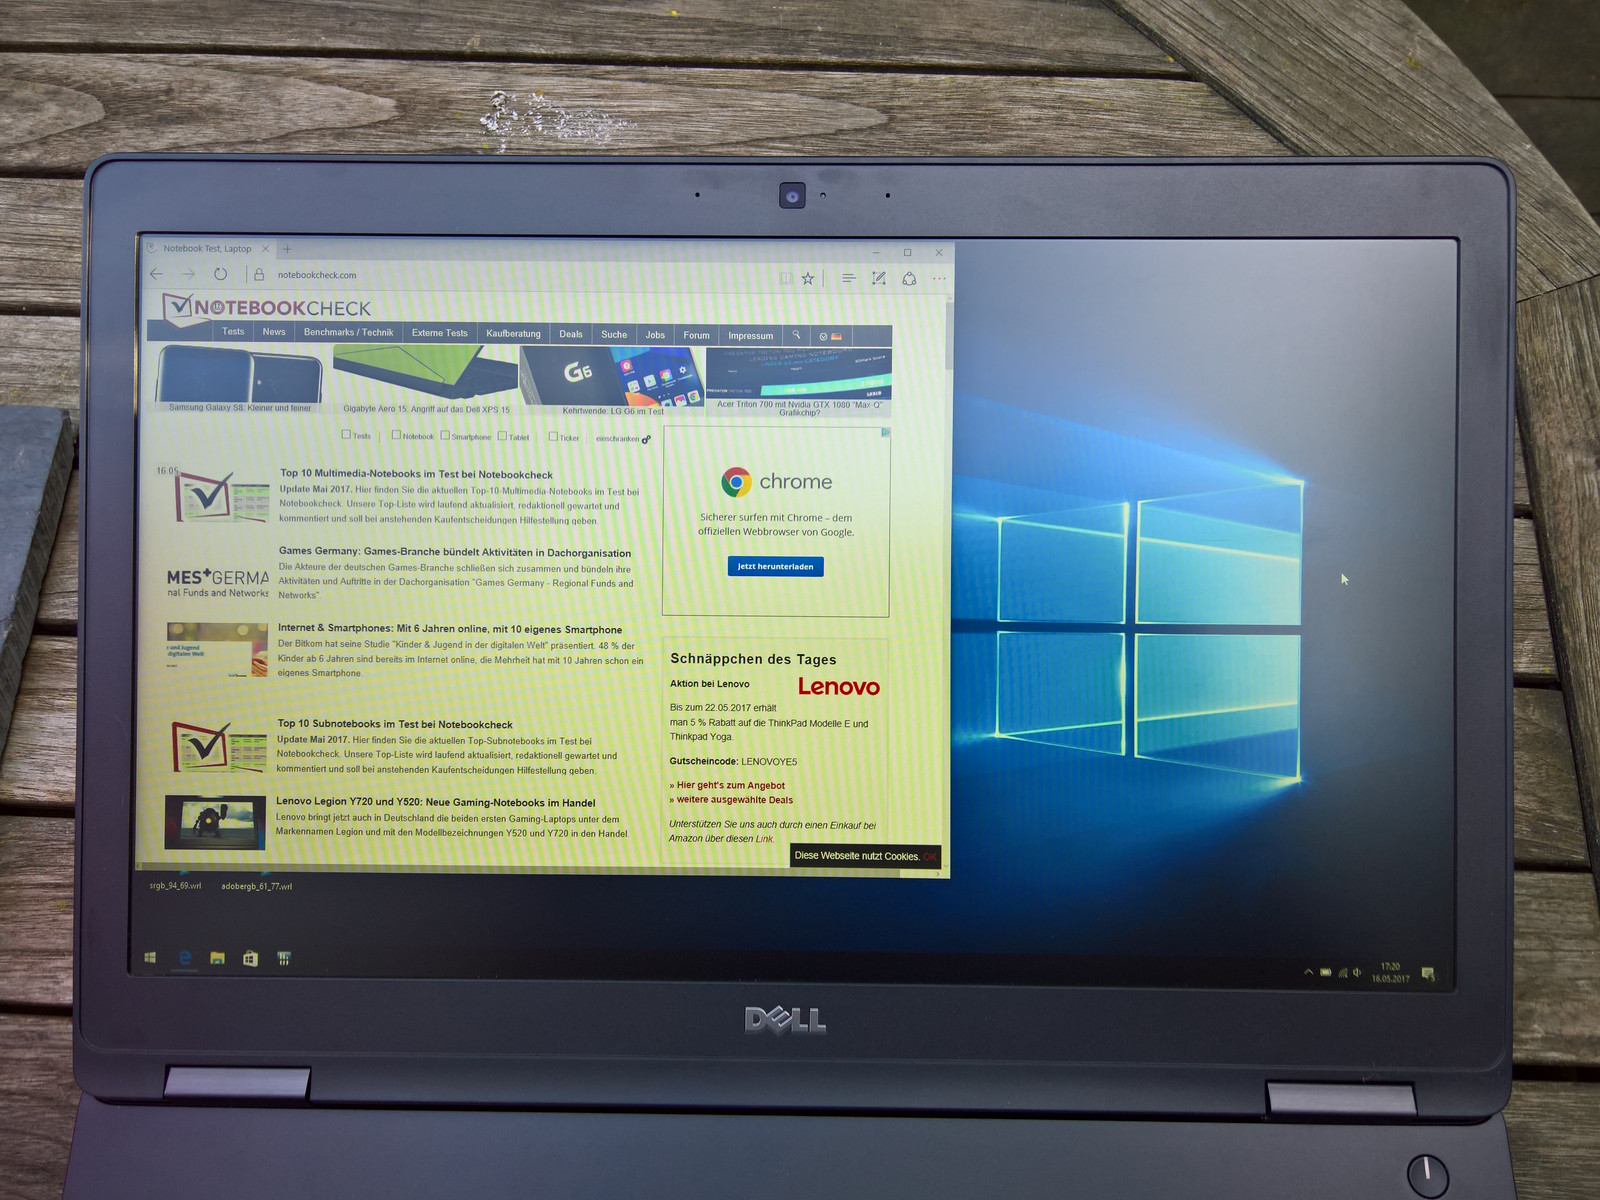
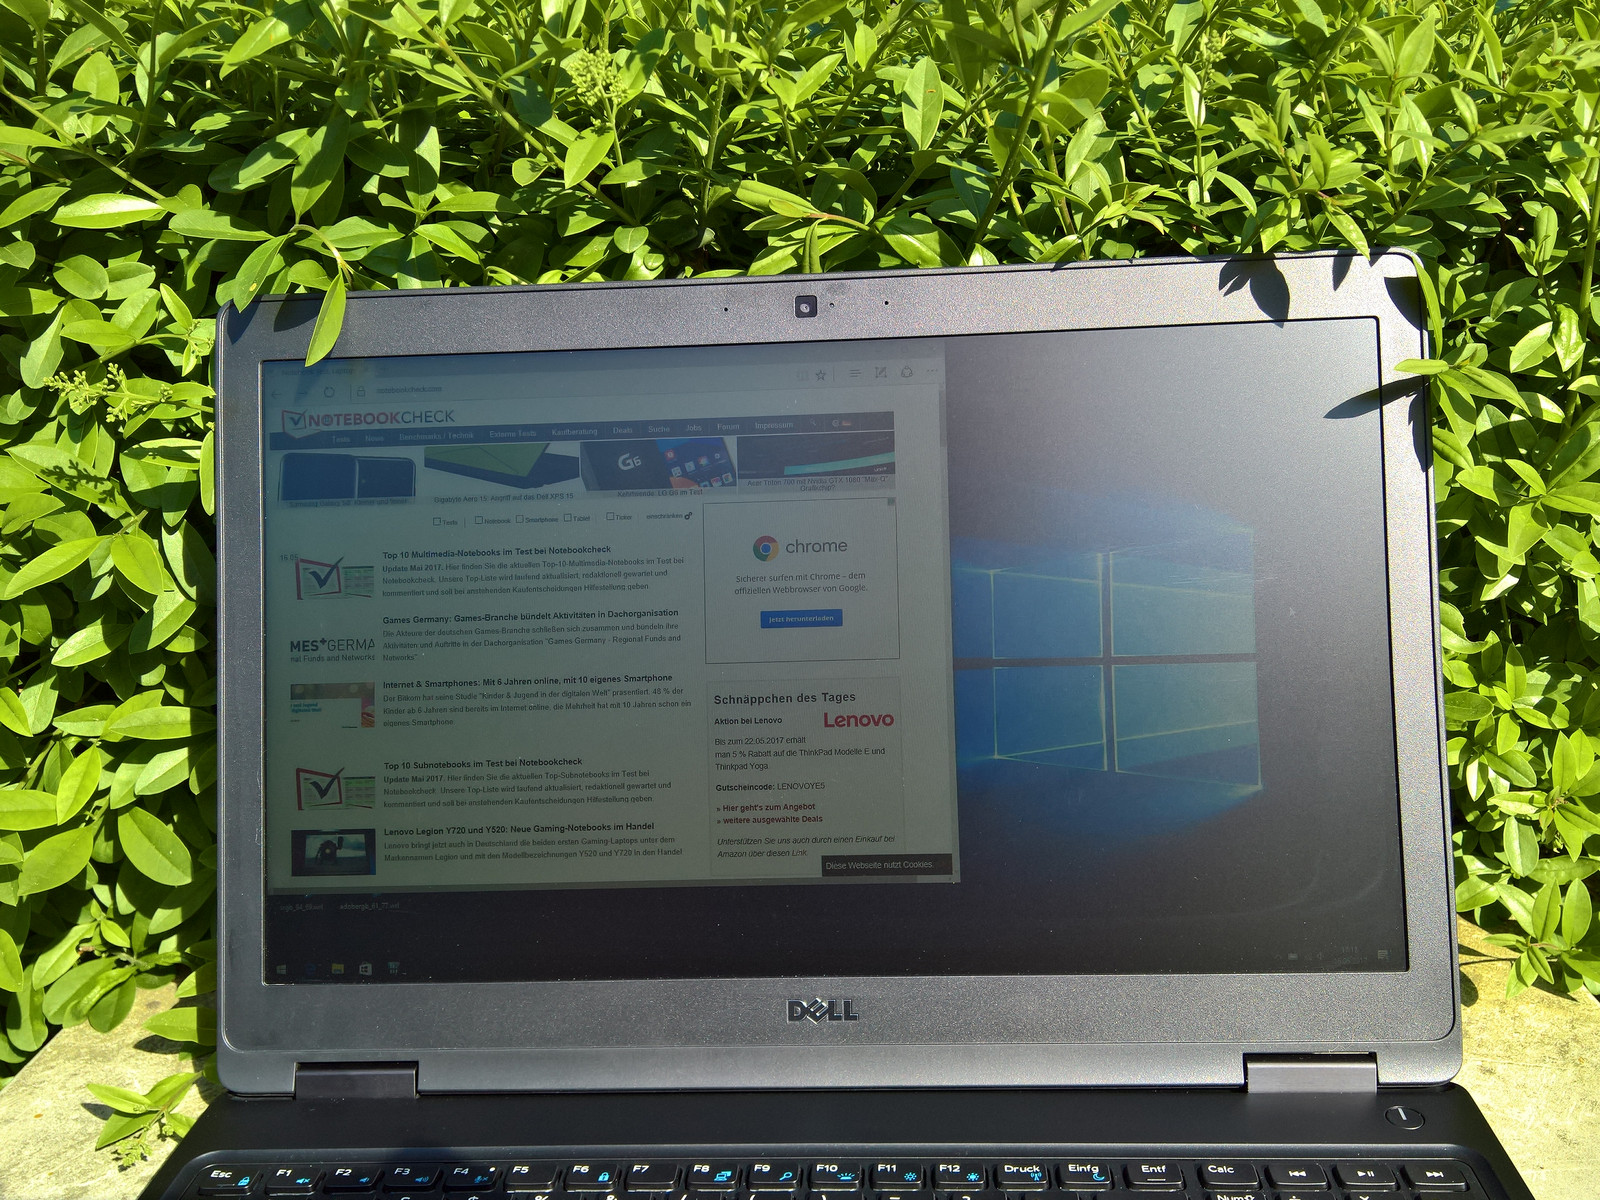
Distribuzione della luminosità: 88 %
Al centro con la batteria: 346 cd/m²
Contrasto: 932:1 (Nero: 0.37 cd/m²)
ΔE ColorChecker Calman: 5 | ∀{0.5-29.43 Ø4.72}
ΔE Greyscale Calman: 6.2 | ∀{0.09-98 Ø4.97}
94.7% sRGB (Argyll 1.6.3 3D)
61.8% AdobeRGB 1998 (Argyll 1.6.3 3D)
69.3% AdobeRGB 1998 (Argyll 3D)
94.8% sRGB (Argyll 3D)
72.7% Display P3 (Argyll 3D)
Gamma: 2.35
CCT: 6702 K
| Dell Precision 3520 1920x1080, 15.6" | Dell Precision 3510 LGD04AF, K96D2_156WHU, , 1366x768, 15.6" | Dell Precision 5520 UHD SHP1476, , 3840x2160, 15.6" | Lenovo ThinkPad P50 LP156WF6-SPK1, , 1920x1080, 15.6" | HP ZBook 15 G3 Samsung SDC5344, , 1920x1080, 15.6" | Lenovo ThinkPad T570-20HAS01E00 BOE NV156QUM-N44, , 3840x2160, 15.6" | |
|---|---|---|---|---|---|---|
| Display | -38% | -1% | -42% | -2% | -4% | |
| Display P3 Coverage (%) | 72.7 | 41.48 -43% | 67.4 -7% | 39.13 -46% | 66.8 -8% | 70 -4% |
| sRGB Coverage (%) | 94.8 | 62.4 -34% | 98.5 4% | 58.5 -38% | 95.5 1% | 91.1 -4% |
| AdobeRGB 1998 Coverage (%) | 69.3 | 42.86 -38% | 68.9 -1% | 40.45 -42% | 69 0% | 66.7 -4% |
| Response Times | 1% | -22% | 14% | -8% | 35% | |
| Response Time Grey 50% / Grey 80% * (ms) | 48 ? | 56 ? -17% | 59.2 ? -23% | 46 ? 4% | 54 ? -13% | 41.6 ? 13% |
| Response Time Black / White * (ms) | 34.4 ? | 28 ? 19% | 41.6 ? -21% | 26 ? 24% | 35.6 ? -3% | 15.2 ? 56% |
| PWM Frequency (Hz) | 1064 ? | 198 ? | 926 ? | |||
| Screen | -41% | 10% | -6% | -6% | 3% | |
| Brightness middle (cd/m²) | 345 | 199 -42% | 372.4 8% | 263 -24% | 306 -11% | 339 -2% |
| Brightness (cd/m²) | 329 | 201 -39% | 368 12% | 236 -28% | 289 -12% | 314 -5% |
| Brightness Distribution (%) | 88 | 83 -6% | 90 2% | 78 -11% | 85 -3% | 89 1% |
| Black Level * (cd/m²) | 0.37 | 0.4 -8% | 0.48 -30% | 0.34 8% | 0.34 8% | 0.36 3% |
| Contrast (:1) | 932 | 498 -47% | 776 -17% | 774 -17% | 900 -3% | 942 1% |
| Colorchecker dE 2000 * | 5 | 9 -80% | 2.6 48% | 2.35 53% | 5.1 -2% | 4.2 16% |
| Colorchecker dE 2000 max. * | 8 | 13.3 -66% | 5.6 30% | 9.9 -24% | 7.8 2% | |
| Greyscale dE 2000 * | 6.2 | 9.6 -55% | 3.7 40% | 3.33 46% | 7.4 -19% | 5.1 18% |
| Gamma | 2.35 94% | 2.41 91% | 2.14 103% | 2.38 92% | 2.37 93% | 2.16 102% |
| CCT | 6702 97% | 10695 61% | 7096 92% | 6917 94% | 7263 89% | 6569 99% |
| Color Space (Percent of AdobeRGB 1998) (%) | 61.8 | 39.6 -36% | 63 2% | 37 -40% | 63 2% | 59.4 -4% |
| Color Space (Percent of sRGB) (%) | 94.7 | 62.4 -34% | 99 5% | 58 -39% | 95 0% | 91 -4% |
| Media totale (Programma / Settaggio) | -26% /
-35% | -4% /
3% | -11% /
-11% | -5% /
-6% | 11% /
6% |
* ... Meglio usare valori piccoli
Sfarfallio dello schermo / PWM (Pulse-Width Modulation)
| flickering dello schermo / PWM rilevato | 1064 Hz | ≤ 90 % settaggio luminosita' | 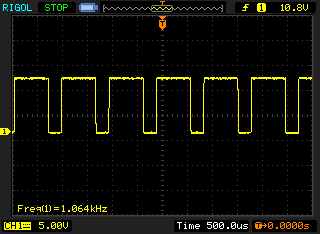 |
Il display sfarfalla a 1064 Hz (Probabilmente a causa dell'uso di PWM) Flickering rilevato ad una luminosita' di 90 % o inferiore. Non dovrebbe verificarsi flickering o PWM sopra questo valore di luminosita'. La frequenza di 1064 Hz è abbastanza alta, quindi la maggioranza degli utenti sensibili al PWM non dovrebbero notare alcun flickering. In confronto: 52 % di tutti i dispositivi testati non utilizza PWM per ridurre la luminosita' del display. Se è rilevato PWM, una media di 7747 (minimo: 5 - massimo: 343500) Hz è stata rilevata. | |||
Tempi di risposta del Display
| ↔ Tempi di risposta dal Nero al Bianco | ||
|---|---|---|
| 34.4 ms ... aumenta ↗ e diminuisce ↘ combinato | ↗ 17.2 ms Incremento | 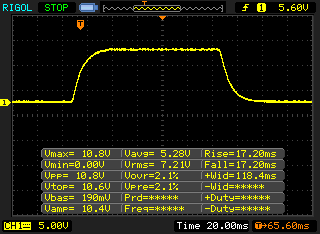 |
| ↘ 17.2 ms Calo | ||
| Lo schermo mostra tempi di risposta lenti nei nostri tests e sarà insoddisfacente per i gamers. In confronto, tutti i dispositivi di test variano da 0.1 (minimo) a 240 (massimo) ms. » 92 % di tutti i dispositivi è migliore. Questo significa che i tempi di risposta rilevati sono peggiori rispetto alla media di tutti i dispositivi testati (19.8 ms). | ||
| ↔ Tempo di risposta dal 50% Grigio all'80% Grigio | ||
| 48 ms ... aumenta ↗ e diminuisce ↘ combinato | ↗ 24.4 ms Incremento | 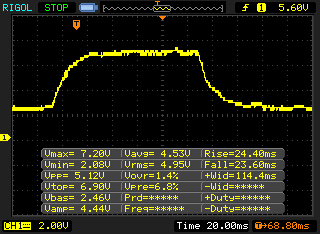 |
| ↘ 23.6 ms Calo | ||
| Lo schermo mostra tempi di risposta lenti nei nostri tests e sarà insoddisfacente per i gamers. In confronto, tutti i dispositivi di test variano da 0.165 (minimo) a 636 (massimo) ms. » 82 % di tutti i dispositivi è migliore. Questo significa che i tempi di risposta rilevati sono peggiori rispetto alla media di tutti i dispositivi testati (31 ms). | ||
| PCMark 8 | |
| Home Score Accelerated v2 | |
| Dell Precision 3510 | |
| Lenovo ThinkPad P50 | |
| Dell Precision 3520 | |
| HP ZBook 15 G3 | |
| Dell Precision 5520 UHD | |
| Work Score Accelerated v2 | |
| Dell Precision 3510 | |
| HP ZBook 15 G3 | |
| Dell Precision 3520 | |
| Lenovo ThinkPad P50 | |
| Dell Precision 5520 UHD | |
| PCMark 8 Home Score Accelerated v2 | 4183 punti | |
| PCMark 8 Work Score Accelerated v2 | 5194 punti | |
Aiuto | ||
| Dell Precision 3520 Toshiba XG4 NVMe (THNSN5512GPUK) | Dell Precision 5520 UHD Samsung SM961 MZVKW512HMJP m.2 PCI-e | HP ZBook 15 G3 Samsung SM951 MZVPV512HDGL m.2 PCI-e | Lenovo ThinkPad T570-20HAS01E00 Samsung PM961 NVMe MZVLW512HMJP | Lenovo ThinkPad P51 20HH0016GE Samsung PM961 NVMe MZVLW512HMJP | |
|---|---|---|---|---|---|
| CrystalDiskMark 3.0 | 87% | 86% | 43% | 79% | |
| Read Seq (MB/s) | 1096 | 2253 106% | 1502 37% | 1210 10% | 1705 56% |
| Write Seq (MB/s) | 476.3 | 1662 249% | 1538 223% | 1134 138% | 1541 224% |
| Read 512 (MB/s) | 829 | 459.1 -45% | 1164 40% | 789 -5% | 1038 25% |
| Write 512 (MB/s) | 456.1 | 1611 253% | 1432 214% | 903 98% | 1157 154% |
| Read 4k (MB/s) | 35.2 | 56.1 59% | 59.1 68% | 58.4 66% | 61.3 74% |
| Write 4k (MB/s) | 128 | 169.4 32% | 207.3 62% | 144.1 13% | 176 38% |
| Read 4k QD32 (MB/s) | 552 | 633 15% | 798 45% | 559 1% | 664 20% |
| Write 4k QD32 (MB/s) | 396.1 | 506 28% | 393.8 -1% | 474.4 20% | 560 41% |

| LuxMark v2.0 64Bit | |
| Room GPUs-only | |
| Dell Precision 5520 UHD | |
| HP ZBook 15 G3 | |
| Dell Precision 3520 | |
| Lenovo ThinkPad P50 | |
| Lenovo ThinkPad P70-20ER000BMS | |
| Dell Precision 3510 | |
| Sala GPUs-only | |
| Dell Precision 5520 UHD | |
| HP ZBook 15 G3 | |
| Dell Precision 3520 | |
| Lenovo ThinkPad P50 | |
| Lenovo ThinkPad P70-20ER000BMS | |
| Dell Precision 3510 | |
| SiSoft Sandra 2016 | |
| Image Processing | |
| HP ZBook 15 G3 | |
| Lenovo ThinkPad P50 | |
| Dell Precision 3520 | |
| GP Cryptography (Higher Security AES256+SHA2-512) | |
| Lenovo ThinkPad P50 | |
| HP ZBook 15 G3 | |
| Dell Precision 3520 | |
| GP Financial Analysis (FP High/Double Precision) | |
| HP ZBook 15 G3 | |
| Lenovo ThinkPad P50 | |
| Dell Precision 3520 | |
| SPECviewperf 11 | |
| 1920x1080 Siemens NX | |
| Lenovo ThinkPad P50 | |
| HP ZBook 15 G3 | |
| Dell Precision 3520 | |
| Lenovo ThinkPad P70-20ER000BMS | |
| Dell Precision 3510 | |
| 1920x1080 Tcvis | |
| HP ZBook 15 G3 | |
| Lenovo ThinkPad P50 | |
| Dell Precision 3520 | |
| Lenovo ThinkPad P70-20ER000BMS | |
| Dell Precision 3510 | |
| 1920x1080 SolidWorks | |
| Dell Precision 3520 | |
| HP ZBook 15 G3 | |
| Lenovo ThinkPad P70-20ER000BMS | |
| Lenovo ThinkPad P50 | |
| Dell Precision 3510 | |
| 1920x1080 Pro/ENGINEER | |
| HP ZBook 15 G3 | |
| Dell Precision 3520 | |
| Lenovo ThinkPad P50 | |
| Lenovo ThinkPad P70-20ER000BMS | |
| Dell Precision 3510 | |
| 1920x1080 Maya | |
| HP ZBook 15 G3 | |
| Lenovo ThinkPad P50 | |
| Dell Precision 3520 | |
| Lenovo ThinkPad P70-20ER000BMS | |
| Dell Precision 3510 | |
| 1920x1080 Lightwave | |
| Dell Precision 3520 | |
| Lenovo ThinkPad P70-20ER000BMS | |
| HP ZBook 15 G3 | |
| Lenovo ThinkPad P50 | |
| Dell Precision 3510 | |
| 1920x1080 Ensight | |
| HP ZBook 15 G3 | |
| Lenovo ThinkPad P50 | |
| Dell Precision 3520 | |
| Lenovo ThinkPad P70-20ER000BMS | |
| Dell Precision 3510 | |
| 1920x1080 Catia | |
| Lenovo ThinkPad P50 | |
| HP ZBook 15 G3 | |
| Dell Precision 3520 | |
| Lenovo ThinkPad P70-20ER000BMS | |
| Dell Precision 3510 | |
| Unigine Heaven 2.1 - 1280x1024 high, Tesselation (normal), DirectX11 AA:off AF:1x | |
| Lenovo ThinkPad P50 | |
| HP ZBook 15 G3 | |
| Dell Precision 3520 | |
| Dell Precision 3510 | |
| Unigine Valley 1.0 | |
| 1920x1080 Extreme HD DirectX AA:x8 | |
| Lenovo ThinkPad P50 | |
| HP ZBook 15 G3 | |
| Dell Precision 3520 | |
| 1920x1080 Extreme HD Preset OpenGL AA:x8 | |
| HP ZBook 15 G3 | |
| Dell Precision 3520 | |
| Lenovo ThinkPad P50 | |
| 3DMark 11 - 1280x720 Performance GPU | |
| Lenovo ThinkPad P50 | |
| Dell Precision 5520 UHD | |
| HP ZBook 15 G3 | |
| Dell Precision 3520 | |
| Lenovo ThinkPad P70-20ER000BMS | |
| 3DMark | |
| 1280x720 Cloud Gate Standard Graphics | |
| Lenovo ThinkPad P50 | |
| HP ZBook 15 G3 | |
| Dell Precision 5520 UHD | |
| Dell Precision 3520 | |
| Lenovo ThinkPad P70-20ER000BMS | |
| Dell Precision 3510 | |
| 1920x1080 Fire Strike Graphics | |
| Dell Precision 5520 UHD | |
| Lenovo ThinkPad P50 | |
| HP ZBook 15 G3 | |
| Dell Precision 3520 | |
| Lenovo ThinkPad P70-20ER000BMS | |
| Dell Precision 3510 | |
| 1280x720 Ice Storm Standard Graphics | |
| Dell Precision 3520 | |
| HP ZBook 15 G3 | |
| Lenovo ThinkPad P50 | |
| Lenovo ThinkPad P70-20ER000BMS | |
| Dell Precision 5520 UHD | |
| Unigine Heaven 4.0 | |
| Extreme Preset OpenGL | |
| Lenovo ThinkPad P70-20ER000BMS | |
| Dell Precision 3520 | |
| Extreme Preset DX11 | |
| Lenovo ThinkPad P70-20ER000BMS | |
| Dell Precision 3520 | |
| 3DMark 06 Standard Score | 24751 punti | |
| 3DMark Vantage P Result | 17237 punti | |
| 3DMark 11 Performance | 4200 punti | |
| 3DMark Ice Storm Standard Score | 103599 punti | |
| 3DMark Cloud Gate Standard Score | 15759 punti | |
| 3DMark Fire Strike Score | 3059 punti | |
Aiuto | ||
| BioShock Infinite - 1366x768 High Preset | |
| Dell Precision 5520 UHD | |
| HP ZBook 15 G3 | |
| Lenovo ThinkPad P50 | |
| Dell Precision 3520 | |
| Lenovo ThinkPad P70-20ER000BMS | |
| Lenovo ThinkPad T570-20HAS01E00 | |
| Rise of the Tomb Raider - 1920x1080 High Preset AA:FX AF:4x | |
| HP ZBook 15 G3 | |
| Dell Precision 3520 | |
| Lenovo ThinkPad P70-20ER000BMS | |
| Star Wars Battlefront - 1920x1080 Ultra Preset AA:FX | |
| Lenovo ThinkPad P50 | |
| Dell Precision 3520 | |
| Lenovo ThinkPad P70-20ER000BMS | |
| basso | medio | alto | ultra | |
|---|---|---|---|---|
| BioShock Infinite (2013) | 176.4 | 105.6 | 92.3 | 35.6 |
| GRID 2 (2013) | 192.8 | 147.4 | 126 | 39.1 |
| Company of Heroes 2 (2013) | 51.7 | 44.4 | 27.1 | 11.7 |
| Total War: Rome II (2013) | 190.5 | 139.6 | 114.4 | 17.8 |
| Dirt Rally (2015) | 249 | 118.5 | 62 | 28.2 |
| The Witcher 3 (2015) | 53.9 | 32.83 | 18.62 | 10 |
| Star Wars Battlefront (2015) | 110.6 | 64.3 | 28.92 | 24.37 |
| Rise of the Tomb Raider (2016) | 62.2 | 36.6 | 20.4 | |
| Doom (2016) | 60.4 | 46.3 | 25.2 | 19.5 |
| Warhammer 40.000: Dawn of War III (2017) | 70.3 | 18.7 |
Rumorosità
| Idle |
| 29.6 / 29.6 / 31.2 dB(A) |
| Sotto carico |
| 43 / 46.9 dB(A) |
 | ||
30 dB silenzioso 40 dB(A) udibile 50 dB(A) rumoroso |
||
min: | ||
(-) La temperatura massima sul lato superiore è di 45.8 °C / 114 F, rispetto alla media di 38.2 °C / 101 F, che varia da 22.2 a 69.8 °C per questa classe Workstation.
(-) Il lato inferiore si riscalda fino ad un massimo di 57.1 °C / 135 F, rispetto alla media di 41.1 °C / 106 F
(+) In idle, la temperatura media del lato superiore è di 23.7 °C / 75 F, rispetto alla media deld ispositivo di 32 °C / 90 F.
(±) Riproducendo The Witcher 3, la temperatura media per il lato superiore e' di 32 °C / 90 F, rispetto alla media del dispositivo di 32 °C / 90 F.
(+) I poggiapolsi e il touchpad raggiungono la temperatura massima della pelle (34.1 °C / 93.4 F) e quindi non sono caldi.
(-) La temperatura media della zona del palmo della mano di dispositivi simili e'stata di 27.8 °C / 82 F (-6.3 °C / -11.4 F).
Dell Precision 3520 analisi audio
(+) | gli altoparlanti sono relativamente potenti (85.6 dB)
Bassi 100 - 315 Hz
(-) | quasi nessun basso - in media 16.2% inferiori alla media
(±) | la linearità dei bassi è media (7% delta rispetto alla precedente frequenza)
Medi 400 - 2000 Hz
(±) | medi elevati - circa 5.2% superiore alla media
(+) | medi lineari (3.9% delta rispetto alla precedente frequenza)
Alti 2 - 16 kHz
(+) | Alti bilanciati - appena 3.7% dalla media
(+) | alti lineari (3.5% delta rispetto alla precedente frequenza)
Nel complesso 100 - 16.000 Hz
(±) | la linearità complessiva del suono è media (15.2% di differenza rispetto alla media
Rispetto alla stessa classe
» 33% di tutti i dispositivi testati in questa classe è stato migliore, 10% simile, 57% peggiore
» Il migliore ha avuto un delta di 7%, medio di 17%, peggiore di 35%
Rispetto a tutti i dispositivi testati
» 22% di tutti i dispositivi testati in questa classe è stato migliore, 4% similare, 74% peggiore
» Il migliore ha avuto un delta di 4%, medio di 23%, peggiore di 134%
Apple MacBook 12 (Early 2016) 1.1 GHz analisi audio
(+) | gli altoparlanti sono relativamente potenti (83.6 dB)
Bassi 100 - 315 Hz
(±) | bassi ridotti - in media 11.3% inferiori alla media
(±) | la linearità dei bassi è media (14.2% delta rispetto alla precedente frequenza)
Medi 400 - 2000 Hz
(+) | medi bilanciati - solo only 2.4% rispetto alla media
(+) | medi lineari (5.5% delta rispetto alla precedente frequenza)
Alti 2 - 16 kHz
(+) | Alti bilanciati - appena 2% dalla media
(+) | alti lineari (4.5% delta rispetto alla precedente frequenza)
Nel complesso 100 - 16.000 Hz
(+) | suono nel complesso lineare (10.2% differenza dalla media)
Rispetto alla stessa classe
» 7% di tutti i dispositivi testati in questa classe è stato migliore, 2% simile, 90% peggiore
» Il migliore ha avuto un delta di 5%, medio di 18%, peggiore di 53%
Rispetto a tutti i dispositivi testati
» 5% di tutti i dispositivi testati in questa classe è stato migliore, 1% similare, 94% peggiore
» Il migliore ha avuto un delta di 4%, medio di 23%, peggiore di 134%
| Off / Standby | |
| Idle | |
| Sotto carico |
|
Leggenda:
min: | |
| Dell Precision 3520 i7-7820HQ, Quadro M620, Toshiba XG4 NVMe (THNSN5512GPUK), IPS LED, 1920x1080, 15.6" | Dell Precision 3510 6700HQ, FirePro W5130M, Samsung SM951 MZVPV256HDGL m.2 PCI-e, TN LED, 1366x768, 15.6" | Dell Precision 5520 UHD E3-1505M v6, Quadro M1200, Samsung SM961 MZVKW512HMJP m.2 PCI-e, IPS, 3840x2160, 15.6" | Lenovo ThinkPad P50 6820HQ, Quadro M2000M, Samsung SSD PM871 MZNLN256HCHP, IPS, 1920x1080, 15.6" | HP ZBook 15 G3 E3-1505M v5, Quadro M2000M, Samsung SM951 MZVPV512HDGL m.2 PCI-e, UWVA-IPS, 1920x1080, 15.6" | |
|---|---|---|---|---|---|
| Power Consumption | 28% | -32% | 10% | -6% | |
| Idle Minimum * (Watt) | 5.8 | 4.2 28% | 8.9 -53% | 5.6 3% | 5.7 2% |
| Idle Average * (Watt) | 10.7 | 6.5 39% | 13.6 -27% | 8.6 20% | 12.2 -14% |
| Idle Maximum * (Watt) | 13.3 | 7.1 47% | 14.1 -6% | 9.3 30% | 12.6 5% |
| Load Average * (Watt) | 78.2 | 74.6 5% | 100.3 -28% | 89.5 -14% | 83.1 -6% |
| Witcher 3 ultra * (Watt) | 58.8 | 100.2 -70% | |||
| Load Maximum * (Watt) | 116 | 92.2 21% | 126.3 -9% | 105 9% | 138.2 -19% |
* ... Meglio usare valori piccoli
| Dell Precision 3520 i7-7820HQ, Quadro M620, 68 Wh | Dell Precision 3510 6700HQ, FirePro W5130M, 84 Wh | Dell Precision 5520 UHD E3-1505M v6, Quadro M1200, 97 Wh | HP ZBook 15 G3 E3-1505M v5, Quadro M2000M, 90 Wh | Lenovo ThinkPad T570-20HAS01E00 i7-7500U, GeForce 940MX, 56 Wh | Lenovo ThinkPad P50 6820HQ, Quadro M2000M, 90 Wh | |
|---|---|---|---|---|---|---|
| Autonomia della batteria | 30% | -32% | -1% | 24% | 13% | |
| Reader / Idle (h) | 16.6 | 19.5 17% | 12.1 -27% | 13.7 -17% | 13.3 -20% | 14.3 -14% |
| H.264 (h) | 8.1 | 10.1 25% | 7.5 -7% | 8.1 0% | 8.9 10% | |
| WiFi v1.3 (h) | 7.6 | 9.9 30% | 4.2 -45% | 6.4 -16% | 6.9 -9% | 8.3 9% |
| Load (h) | 1.3 | 1.9 46% | 1 -23% | 1.8 38% | 2.9 123% | 1.9 46% |
Pro
Contro
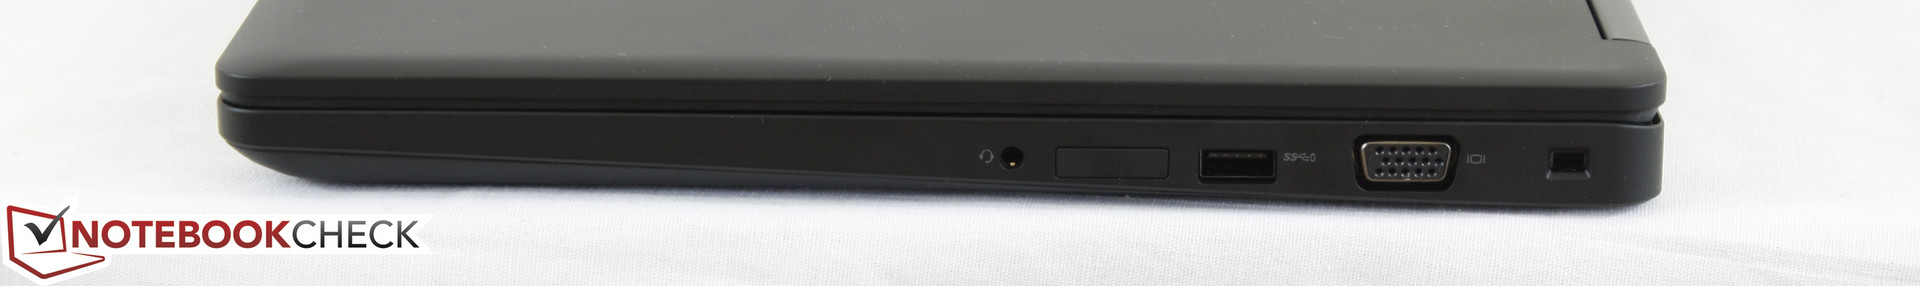
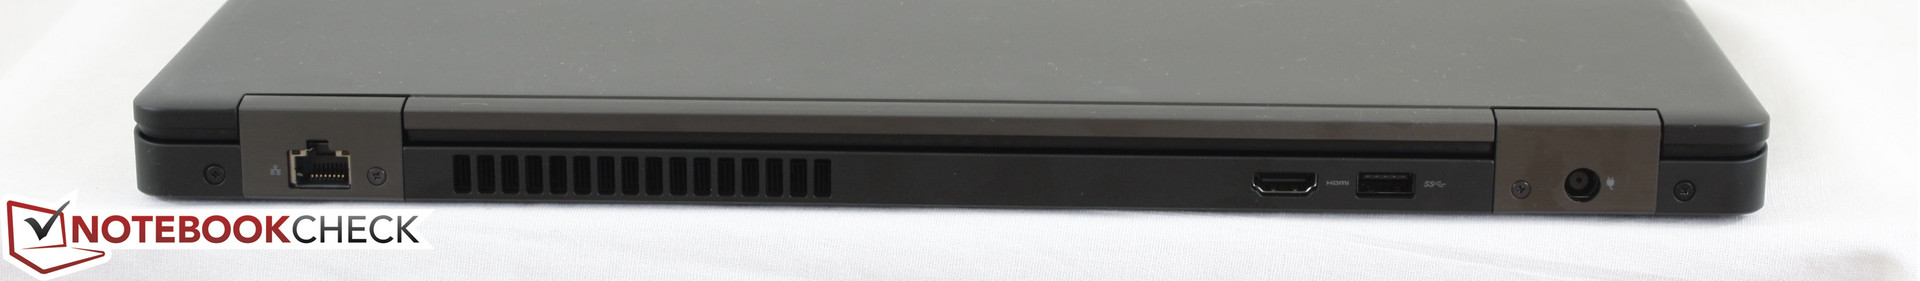
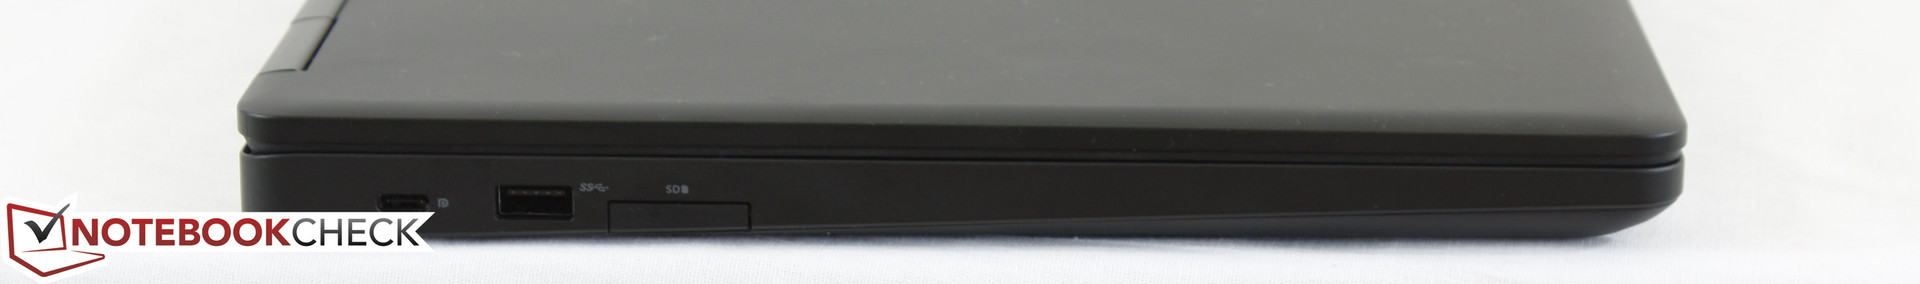
Il Precision 3520 ha i suoi punti positivi. Innanzitutto, il display, vivido e luminoso, un piacere da usare. L'autonomia è abbastanza buona per una workstation e dovrebbe essere sorprendente scegliendo una batteria da 92. Il numero di porte fisiche è sufficiente. Lo chassis ed il dispositivi di input sono abbastanza decenti per una macchina business, ma nemmeno perfetti.
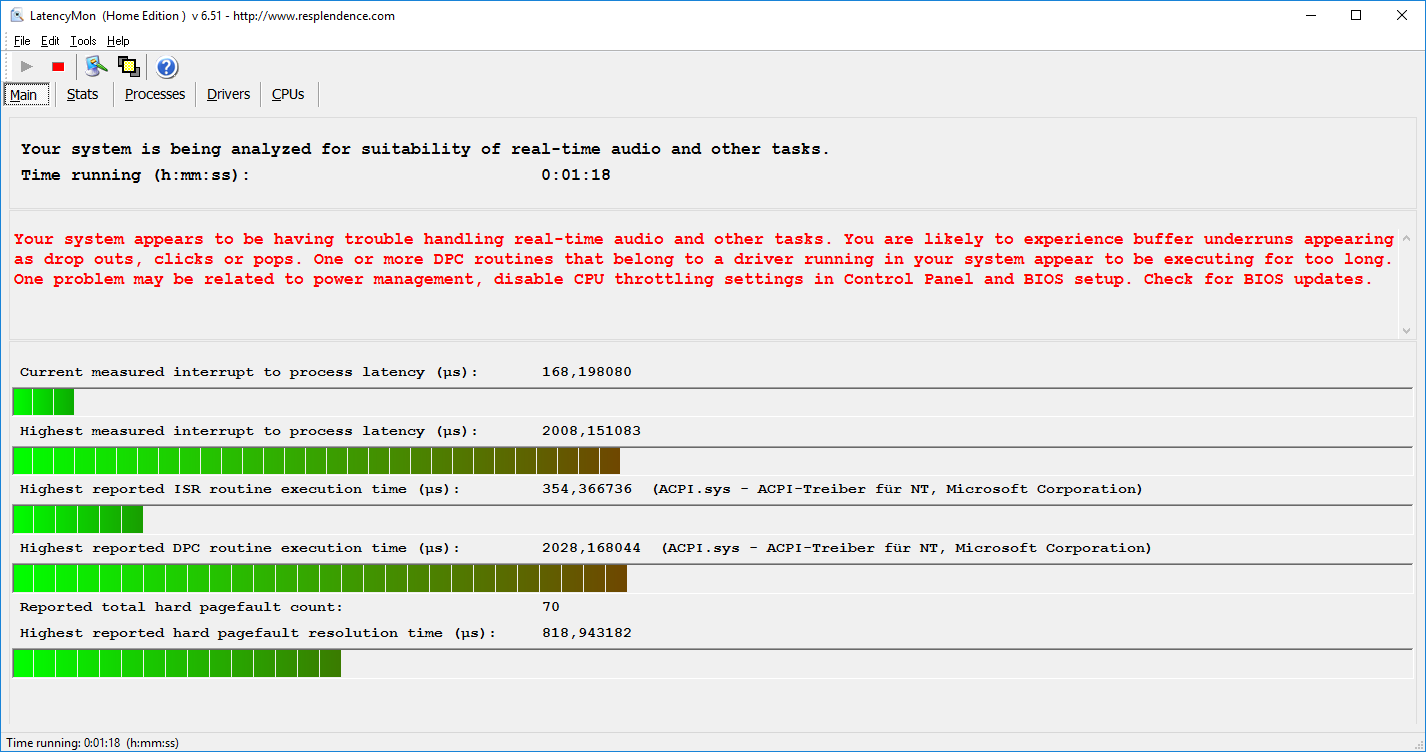
Sfortunatamente, il Precision vacilla su aspetti importanti per una workstations: performance e rumorosità. La limitazione ad un TDP di 35 W potrebbe lasciarvi sorpresi - Dell forse avrebbe dovuto investire in un sistema di raffreddamento più sofisticato, tuttavia bisogna ricordare che si tratta di una workstation economica. Dobbiamo chiederci se una CPU meno potente non sarebbe stata la scelta migliore. Il nostro stress test mostra che le performance possono variare di molto sotto carico, forse a causa del firmware che utilizza un tuning aggiuntivo. Sfortunatamente, anche la ventola accelera spesso anche in assenza di carico. Dopo i benchmarks, impiega molto tempo prima di fermare la ventola. In aggiunta, il 3520 emette un ronzio.
Il Precision 3520 è una solida workstation - ma urgono dei miglioramenti.
In sintesi possiamo dire che il Precision 3520 ha un buon potenziale. Il portatile è abbastanza potente ed ha un buon rapporto prezzo-prestazioni. Dopo tutto: le workstations sono in genere costose. Dell deve tornare sul progetto e migliorare il controllo della ventola ed ottimizzare le prestazioni. Non appena ciò accadrà, il 3520 riuscirà ad avere la nostra raccomandazione.
Nota: Si tratta di una recensione breve, con alcune sezioni non tradotte, per la versione completa guarda qui.
Dell Precision 3520
- 05/25/2017 v6 (old)
Benjamin Herzig
Price comparison
