Rencensione Breve della Workstation Dell Precision 5520 (E3-1505M, UHD)


| SD Card Reader | |
| average JPG Copy Test (av. of 3 runs) | |
| Dell Precision 5520 UHD | |
| Dell Precision 3510 | |
| Dell Precision 7510 (4K IGZO) | |
| Lenovo ThinkPad P50 | |
| Fujitsu Celsius H760 | |
| maximum AS SSD Seq Read Test (1GB) | |
| Dell Precision 5520 UHD | |
| Dell Precision 3510 | |
| Lenovo ThinkPad P50 | |
| Fujitsu Celsius H760 | |
| Networking | |
| iperf3 transmit AX12 | |
| Dell Precision 5520 UHD | |
| iperf3 receive AX12 | |
| Dell Precision 5520 UHD | |
| |||||||||||||||||||||||||
Distribuzione della luminosità: 90 %
Al centro con la batteria: 372.4 cd/m²
Contrasto: 776:1 (Nero: 0.48 cd/m²)
ΔE ColorChecker Calman: 2.6 | ∀{0.5-29.43 Ø4.72}
ΔE Greyscale Calman: 3.7 | ∀{0.09-98 Ø4.97}
99% sRGB (Argyll 1.6.3 3D)
63% AdobeRGB 1998 (Argyll 1.6.3 3D)
68.9% AdobeRGB 1998 (Argyll 3D)
98.5% sRGB (Argyll 3D)
67.4% Display P3 (Argyll 3D)
Gamma: 2.14
CCT: 7096 K
| Dell Precision 5520 UHD SHP1476, IPS, 15.6", 3840x2160 | Dell Precision 5510 SHP143E, 7PHPT_LQ156D1, IGZO LED, 15.6", 3840x2160 | Fujitsu Celsius H760 LGD046F LP156WF6-SPP1, IPS LED, 15.6", 1920x1080 | Dell Precision 7510 (4K IGZO) Sharp LQ156D1, IGZO IPS, 15.6", 3840x2160 | Lenovo ThinkPad P50 LQ156D1JW05, IPS, 15.6", 3840x2160 | |
|---|---|---|---|---|---|
| Display | 26% | -11% | 24% | 23% | |
| Display P3 Coverage (%) | 67.4 | 88.4 31% | 63.9 -5% | 86.2 28% | 85.8 27% |
| sRGB Coverage (%) | 98.5 | 100 2% | 82.4 -16% | 99.7 1% | 98.6 0% |
| AdobeRGB 1998 Coverage (%) | 68.9 | 99.5 44% | 60.3 -12% | 99 44% | 98.2 43% |
| Response Times | 12% | 37% | 33% | 41% | |
| Response Time Grey 50% / Grey 80% * (ms) | 59.2 ? | 56.4 ? 5% | 38 ? 36% | 40.4 ? 32% | 39.2 ? 34% |
| Response Time Black / White * (ms) | 41.6 ? | 34 ? 18% | 26 ? 37% | 27.6 ? 34% | 22 ? 47% |
| PWM Frequency (Hz) | 198.4 ? | 217 | |||
| Screen | 0% | -10% | -1% | -23% | |
| Brightness middle (cd/m²) | 372.4 | 391 5% | 341 -8% | 279.2 -25% | 250 -33% |
| Brightness (cd/m²) | 368 | 361 -2% | 310 -16% | 271 -26% | 250 -32% |
| Brightness Distribution (%) | 90 | 87 -3% | 82 -9% | 83 -8% | 86 -4% |
| Black Level * (cd/m²) | 0.48 | 0.4 17% | 0.34 29% | 0.266 45% | 0.31 35% |
| Contrast (:1) | 776 | 978 26% | 1003 29% | 1050 35% | 806 4% |
| Colorchecker dE 2000 * | 2.6 | 4.85 -87% | 3.8 -46% | 4.14 -59% | 4.5 -73% |
| Colorchecker dE 2000 max. * | 5.6 | 10.8 -93% | 6.56 -17% | 9.3 -66% | |
| Greyscale dE 2000 * | 3.7 | 4.01 -8% | 2 46% | 3.26 12% | 7.2 -95% |
| Gamma | 2.14 103% | 2.18 101% | 2.17 101% | 2.19 100% | 2.31 95% |
| CCT | 7096 92% | 7340 89% | 6581 99% | 6375 102% | 6399 102% |
| Color Space (Percent of AdobeRGB 1998) (%) | 63 | 96 52% | 54 -14% | 85.68 36% | 85 35% |
| Color Space (Percent of sRGB) (%) | 99 | 100 1% | 82.2 -17% | 99.72 1% | 98.6 0% |
| Media totale (Programma / Settaggio) | 13% /
7% | 5% /
-4% | 19% /
9% | 14% /
-5% |
* ... Meglio usare valori piccoli
Tempi di risposta del Display
| ↔ Tempi di risposta dal Nero al Bianco | ||
|---|---|---|
| 41.6 ms ... aumenta ↗ e diminuisce ↘ combinato | ↗ 26.8 ms Incremento | 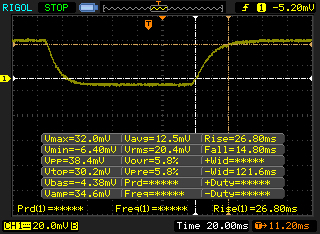 |
| ↘ 14.8 ms Calo | ||
| Lo schermo mostra tempi di risposta lenti nei nostri tests e sarà insoddisfacente per i gamers. In confronto, tutti i dispositivi di test variano da 0.1 (minimo) a 240 (massimo) ms. » 98 % di tutti i dispositivi è migliore. Questo significa che i tempi di risposta rilevati sono peggiori rispetto alla media di tutti i dispositivi testati (19.9 ms). | ||
| ↔ Tempo di risposta dal 50% Grigio all'80% Grigio | ||
| 59.2 ms ... aumenta ↗ e diminuisce ↘ combinato | ↗ 27.6 ms Incremento | 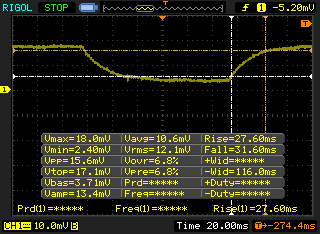 |
| ↘ 31.6 ms Calo | ||
| Lo schermo mostra tempi di risposta lenti nei nostri tests e sarà insoddisfacente per i gamers. In confronto, tutti i dispositivi di test variano da 0.165 (minimo) a 636 (massimo) ms. » 95 % di tutti i dispositivi è migliore. Questo significa che i tempi di risposta rilevati sono peggiori rispetto alla media di tutti i dispositivi testati (31.1 ms). | ||
Sfarfallio dello schermo / PWM (Pulse-Width Modulation)
| flickering dello schermo / PWM non rilevato | 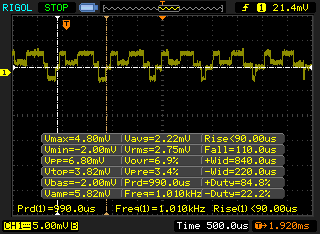 | ||
In confronto: 52 % di tutti i dispositivi testati non utilizza PWM per ridurre la luminosita' del display. Se è rilevato PWM, una media di 7784 (minimo: 5 - massimo: 343500) Hz è stata rilevata. | |||
| wPrime 2.10 - 1024m | |
| Dell Precision 7510 (4K IGZO) | |
| Dell Precision 5520 UHD | |
| Dell Precision 5510 | |
| Dell XPS 15 9560 (i7-7700HQ, UHD) | |
* ... Meglio usare valori piccoli
| PCMark 8 Home Score Accelerated v2 | 3504 punti | |
| PCMark 8 Creative Score Accelerated v2 | 5086 punti | |
| PCMark 8 Work Score Accelerated v2 | 4291 punti | |
Aiuto | ||
| Dell Precision 5520 UHD Samsung SM961 MZVKW512HMJP m.2 PCI-e | Dell Precision 7510 (4K IGZO) Samsung SSD SM951a 512GB M.2 PCIe 3.0 x4 NVMe (MZVKV512) | Lenovo ThinkPad P50 Samsung SM951 MZVPV256HDGL m.2 PCI-e | HP ZBook Studio G3 Samsung SM951 MZVPV512HDGL m.2 PCI-e | Dell XPS 15 9560 (i7-7700HQ, UHD) Lite-On CX2-8B512-Q11 | |
|---|---|---|---|---|---|
| CrystalDiskMark 3.0 | 11% | 28% | 22% | -7% | |
| Read Seq (MB/s) | 2253 | 1648 -27% | 1771 -21% | 1578 -30% | 1684 -25% |
| Write Seq (MB/s) | 1662 | 1575 -5% | 1304 -22% | 1557 -6% | 1106 -33% |
| Read 512 (MB/s) | 459.1 | 1155 152% | 1364 197% | 1234 169% | 977 113% |
| Write 512 (MB/s) | 1611 | 1561 -3% | 1291 -20% | 1391 -14% | 1119 -31% |
| Read 4k (MB/s) | 56.1 | 53 -6% | 60.2 7% | 59.9 7% | 45.14 -20% |
| Write 4k (MB/s) | 169.4 | 158.9 -6% | 256.7 52% | 225.6 33% | 134.1 -21% |
| Read 4k QD32 (MB/s) | 633 | 623 -2% | 953 51% | 946 49% | 509 -20% |
| Write 4k QD32 (MB/s) | 506 | 423 -16% | 389.6 -23% | 359 -29% | 398.1 -21% |

| 3DMark 11 | |
| 1280x720 Performance GPU | |
| Lenovo ThinkPad P50 | |
| Dell Precision 5520 UHD | |
| Dell Precision 7510 (4K IGZO) | |
| Dell Precision 5510 | |
| 1280x720 Performance Combined | |
| Dell Precision 5520 UHD | |
| Lenovo ThinkPad P50 | |
| Dell Precision 7510 (4K IGZO) | |
| Dell Precision 5510 | |
| 3DMark | |
| 1280x720 Cloud Gate Standard Graphics | |
| Dell XPS 15 9560 (i7-7700HQ, UHD) | |
| Fujitsu Celsius H760 | |
| Dell Precision 5520 UHD | |
| Dell Precision 7510 (4K IGZO) | |
| Lenovo ThinkPad P50 | |
| Dell Precision 5510 | |
| Dell Precision 3510 | |
| 1920x1080 Fire Strike Graphics | |
| Dell XPS 15 9560 (i7-7700HQ, UHD) | |
| Dell Precision 7510 (4K IGZO) | |
| Dell Precision 5520 UHD | |
| Lenovo ThinkPad P50 | |
| Fujitsu Celsius H760 | |
| Dell Precision 5510 | |
| Dell Precision 3510 | |
| 1920x1080 Ice Storm Extreme Graphics | |
| Dell XPS 15 9560 (i7-7700HQ, UHD) | |
| Dell Precision 5520 UHD | |
| 3DMark 06 Standard Score | 26109 punti | |
| 3DMark 11 Performance | 5513 punti | |
| 3DMark Ice Storm Standard Score | 57997 punti | |
| 3DMark Cloud Gate Standard Score | 12632 punti | |
| 3DMark Fire Strike Score | 3759 punti | |
| 3DMark Fire Strike Extreme Score | 1919 punti | |
Aiuto | ||
| Doom | |
| 3840x2160 High Preset AA:FX (ordina per valore) | |
| Dell Precision 5520 UHD | |
| Dell XPS 15 9560 (i7-7700HQ, UHD) | |
| 1920x1080 Ultra Preset AA:SM (ordina per valore) | |
| Dell Precision 5520 UHD | |
| Dell XPS 15 9560 (i7-7700HQ, UHD) | |
| 1920x1080 High Preset AA:FX (ordina per valore) | |
| Dell Precision 5520 UHD | |
| Dell XPS 15 9560 (i7-7700HQ, UHD) | |
| 1366x768 Medium Preset (ordina per valore) | |
| Dell Precision 5520 UHD | |
| 1280x720 Low Preset (ordina per valore) | |
| Dell Precision 5520 UHD | |
| Batman: Arkham Knight | |
| 3840x2160 High / On (Interactive Smoke & Paper Debris Off) AA:SM AF:8x (ordina per valore) | |
| Dell Precision 5520 UHD | |
| Dell XPS 15 9560 (i7-7700HQ, UHD) | |
| 1920x1080 High / On AA:SM AF:16x (ordina per valore) | |
| Dell Precision 5520 UHD | |
| Dell XPS 15 9560 (i7-7700HQ, UHD) | |
| 1920x1080 High / On (Interactive Smoke & Paper Debris Off) AA:SM AF:8x (ordina per valore) | |
| Dell Precision 5520 UHD | |
| Dell XPS 15 9560 (i7-7700HQ, UHD) | |
| 1366x768 Normal / Off AF:4x (ordina per valore) | |
| Dell Precision 5520 UHD | |
| Dell XPS 15 9560 (i7-7700HQ, UHD) | |
| 1280x720 Low / Off AF:Trilinear (ordina per valore) | |
| Dell Precision 5520 UHD | |
| basso | medio | alto | ultra | 4K | |
|---|---|---|---|---|---|
| BioShock Infinite (2013) | 189 | 137 | 125 | 47 | |
| The Witcher 3 (2015) | 29 | ||||
| Batman: Arkham Knight (2015) | 74 | 63 | 35 | 29 | 11 |
| Doom (2016) | 79 | 66 | 37 | 34 | 12 |
Rumorosità
| Idle |
| 28.7 / 32.1 / 32.1 dB(A) |
| Sotto carico |
| 41.3 / 45.5 dB(A) |
 | ||
30 dB silenzioso 40 dB(A) udibile 50 dB(A) rumoroso |
||
min: | ||
| Dell Precision 5520 UHD Quadro M1200, E3-1505M v6, Samsung SM961 MZVKW512HMJP m.2 PCI-e | Fujitsu Celsius H760 Quadro M2000M, E3-1505M v5, Samsung SM951 MZVPV512 m.2 PCI-e | Dell Precision 7510 (4K IGZO) Quadro M2000M, E3-1535M v5, Samsung SSD SM951a 512GB M.2 PCIe 3.0 x4 NVMe (MZVKV512) | Dell Precision 3510 FirePro W5130M, 6700HQ, Samsung SM951 MZVPV256HDGL m.2 PCI-e | Lenovo ThinkPad P50 Quadro M2000M, E3-1505M v5, Samsung SM951 MZVPV256HDGL m.2 PCI-e | Dell Precision 5510 Quadro M1000M, E3-1505M v5, SK hynix SC920 512 GB | |
|---|---|---|---|---|---|---|
| Noise | 1% | 2% | 2% | 2% | 1% | |
| off /ambiente * (dB) | 28.7 | 29 -1% | 28.2 2% | 30 -5% | 30 -5% | |
| Idle Minimum * (dB) | 28.7 | 29 -1% | 29.8 -4% | 30 -5% | 30 -5% | 30 -5% |
| Idle Average * (dB) | 32.1 | 29 10% | 29.8 7% | 30 7% | 30 7% | 30 7% |
| Idle Maximum * (dB) | 32.1 | 29 10% | 31.2 3% | 30 7% | 30 7% | 30 7% |
| Load Average * (dB) | 41.3 | 43.1 -4% | 37.2 10% | 38.1 8% | 42.1 -2% | 42.08 -2% |
| Witcher 3 ultra * (dB) | 45.5 | |||||
| Load Maximum * (dB) | 45.5 | 49.2 -8% | 49.4 -9% | 44.4 2% | 42.1 7% | 46.78 -3% |
* ... Meglio usare valori piccoli
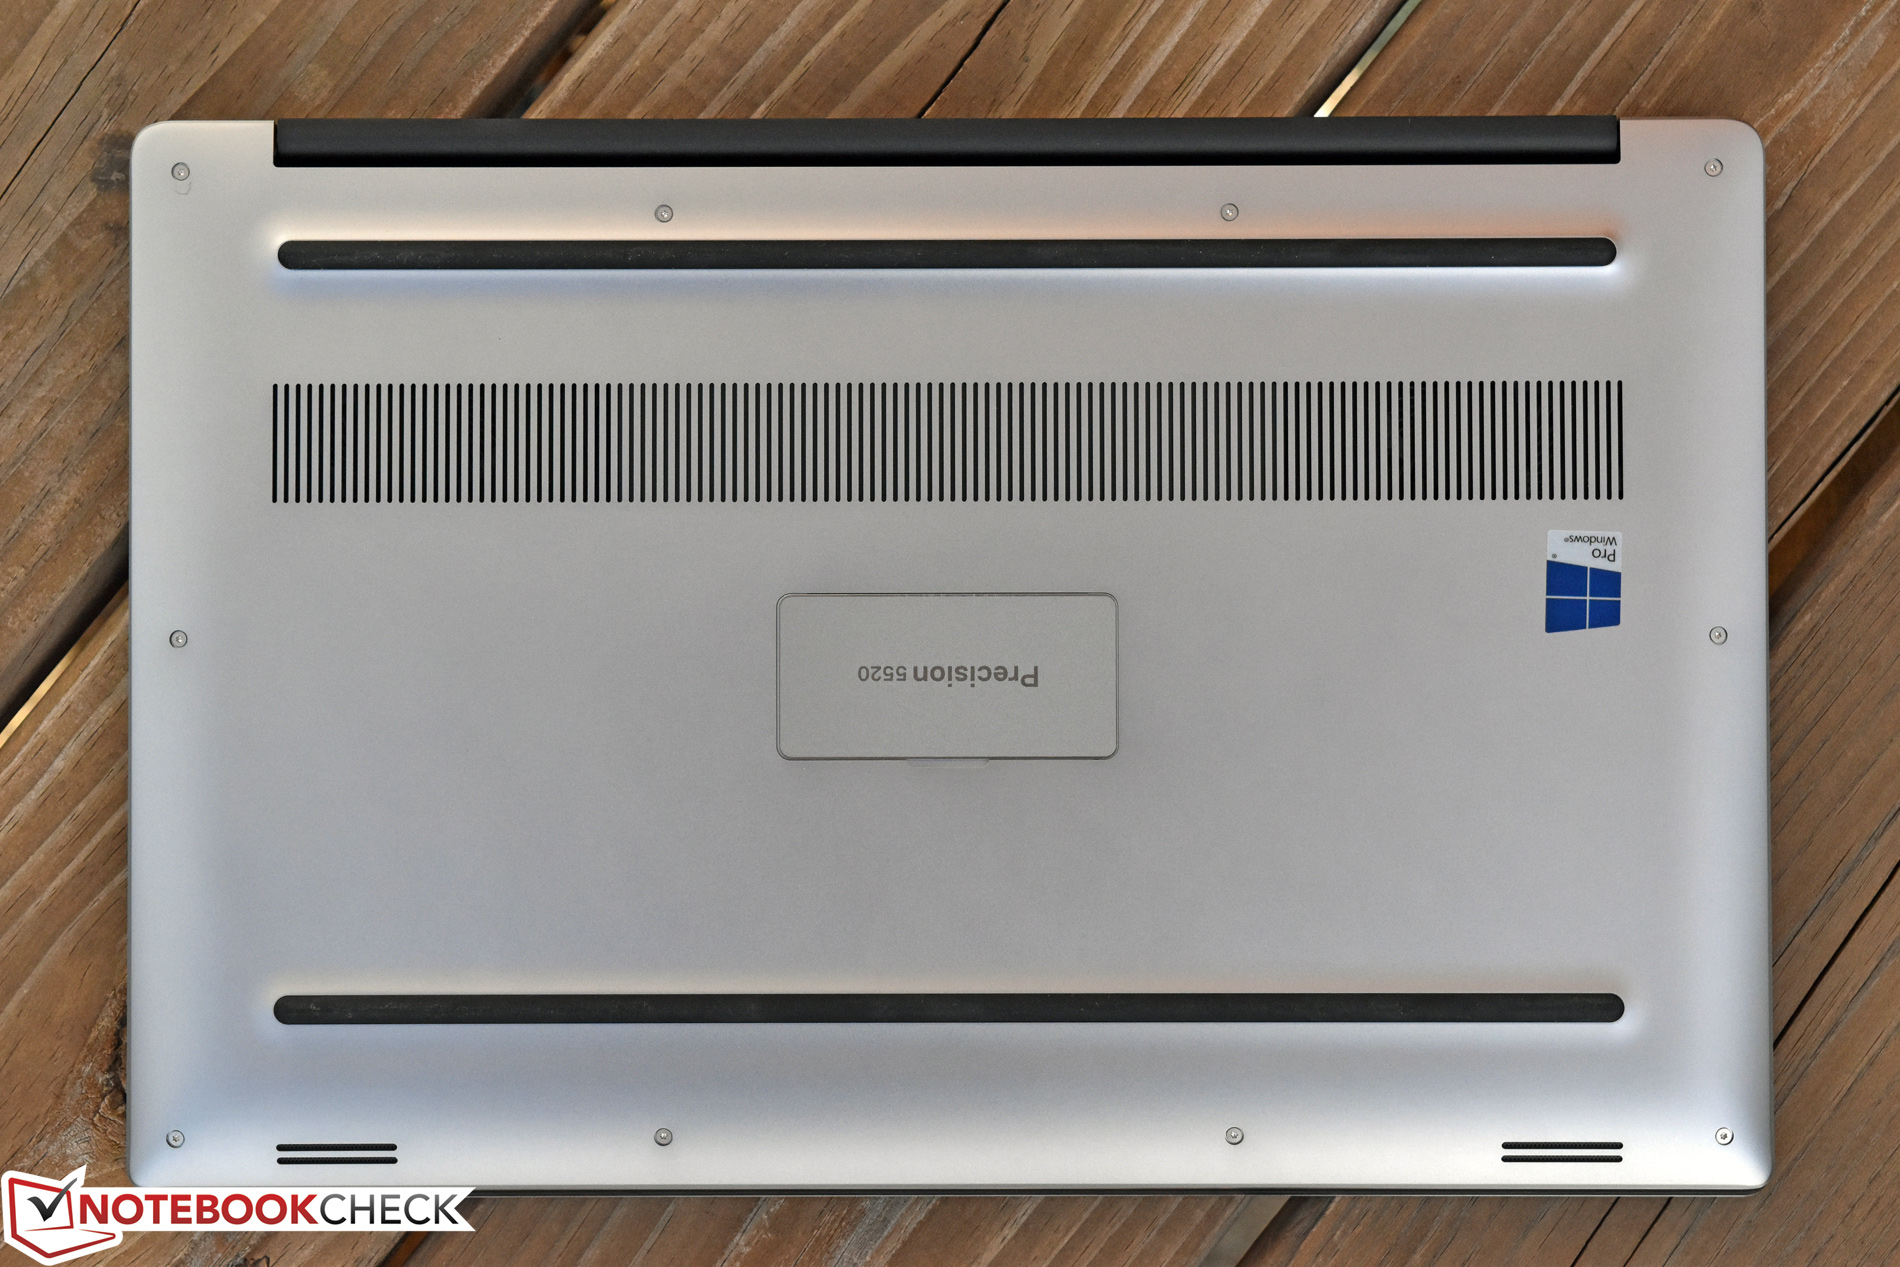
(-) La temperatura massima sul lato superiore è di 51.6 °C / 125 F, rispetto alla media di 38.2 °C / 101 F, che varia da 22.2 a 69.8 °C per questa classe Workstation.
(±) Il lato inferiore si riscalda fino ad un massimo di 43.6 °C / 110 F, rispetto alla media di 41.1 °C / 106 F
(+) In idle, la temperatura media del lato superiore è di 25.3 °C / 78 F, rispetto alla media deld ispositivo di 32 °C / 90 F.
(±) Riproducendo The Witcher 3, la temperatura media per il lato superiore e' di 34.6 °C / 94 F, rispetto alla media del dispositivo di 32 °C / 90 F.
(+) I poggiapolsi e il touchpad sono piu' freddi della temperatura della pelle con un massimo di 28.4 °C / 83.1 F e sono quindi freddi al tatto.
(±) La temperatura media della zona del palmo della mano di dispositivi simili e'stata di 27.8 °C / 82 F (-0.6 °C / -1.1 F).
Dell Precision 5520 UHD analisi audio
(±) | potenza degli altiparlanti media ma buona (79.6 dB)
Bassi 100 - 315 Hz
(±) | bassi ridotti - in media 12.8% inferiori alla media
(±) | la linearità dei bassi è media (14.2% delta rispetto alla precedente frequenza)
Medi 400 - 2000 Hz
(+) | medi bilanciati - solo only 4% rispetto alla media
(±) | linearità dei medi adeguata (9.9% delta rispetto alla precedente frequenza)
Alti 2 - 16 kHz
(+) | Alti bilanciati - appena 3.3% dalla media
(±) | la linearità degli alti è media (12% delta rispetto alla precedente frequenza)
Nel complesso 100 - 16.000 Hz
(±) | la linearità complessiva del suono è media (16.7% di differenza rispetto alla media
Rispetto alla stessa classe
» 46% di tutti i dispositivi testati in questa classe è stato migliore, 9% simile, 45% peggiore
» Il migliore ha avuto un delta di 7%, medio di 17%, peggiore di 35%
Rispetto a tutti i dispositivi testati
» 29% di tutti i dispositivi testati in questa classe è stato migliore, 7% similare, 64% peggiore
» Il migliore ha avuto un delta di 4%, medio di 24%, peggiore di 134%
Apple MacBook 12 (Early 2016) 1.1 GHz analisi audio
(+) | gli altoparlanti sono relativamente potenti (83.6 dB)
Bassi 100 - 315 Hz
(±) | bassi ridotti - in media 11.3% inferiori alla media
(±) | la linearità dei bassi è media (14.2% delta rispetto alla precedente frequenza)
Medi 400 - 2000 Hz
(+) | medi bilanciati - solo only 2.4% rispetto alla media
(+) | medi lineari (5.5% delta rispetto alla precedente frequenza)
Alti 2 - 16 kHz
(+) | Alti bilanciati - appena 2% dalla media
(+) | alti lineari (4.5% delta rispetto alla precedente frequenza)
Nel complesso 100 - 16.000 Hz
(+) | suono nel complesso lineare (10.2% differenza dalla media)
Rispetto alla stessa classe
» 7% di tutti i dispositivi testati in questa classe è stato migliore, 2% simile, 91% peggiore
» Il migliore ha avuto un delta di 5%, medio di 18%, peggiore di 53%
Rispetto a tutti i dispositivi testati
» 5% di tutti i dispositivi testati in questa classe è stato migliore, 1% similare, 94% peggiore
» Il migliore ha avuto un delta di 4%, medio di 24%, peggiore di 134%
| Off / Standby | |
| Idle | |
| Sotto carico |
|
Leggenda:
min: | |
| Dell Precision 5520 UHD E3-1505M v6, Quadro M1200, Samsung SM961 MZVKW512HMJP m.2 PCI-e, IPS, 3840x2160, 15.6" | Fujitsu Celsius H760 E3-1505M v5, Quadro M2000M, Samsung SM951 MZVPV512 m.2 PCI-e, IPS LED, 1920x1080, 15.6" | Dell Precision 7510 (4K IGZO) E3-1535M v5, Quadro M2000M, Samsung SSD SM951a 512GB M.2 PCIe 3.0 x4 NVMe (MZVKV512), IGZO IPS, 3840x2160, 15.6" | Dell Precision 3510 6700HQ, FirePro W5130M, Samsung SM951 MZVPV256HDGL m.2 PCI-e, TN LED, 1366x768, 15.6" | Lenovo ThinkPad P50 E3-1505M v5, Quadro M2000M, Samsung SM951 MZVPV256HDGL m.2 PCI-e, IPS, 3840x2160, 15.6" | Dell Precision 5510 E3-1505M v5, Quadro M1000M, SK hynix SC920 512 GB, IGZO LED, 3840x2160, 15.6" | |
|---|---|---|---|---|---|---|
| Power Consumption | 8% | -83% | 42% | -10% | -4% | |
| Idle Minimum * (Watt) | 8.9 | 7.7 13% | 23.9 -169% | 4.2 53% | 10.2 -15% | 8.6 3% |
| Idle Average * (Watt) | 13.6 | 11.8 13% | 28.9 -113% | 6.5 52% | 17.8 -31% | 16.2 -19% |
| Idle Maximum * (Watt) | 14.1 | 12.9 9% | 30 -113% | 7.1 50% | 18.3 -30% | 16.7 -18% |
| Load Average * (Watt) | 100.3 | 90.2 10% | 95.2 5% | 74.6 26% | 76.9 23% | 82.6 18% |
| Witcher 3 ultra * (Watt) | 100.2 | |||||
| Load Maximum * (Watt) | 126.3 | 130.8 -4% | 157.1 -24% | 92.2 27% | 123.5 2% | 131.8 -4% |
* ... Meglio usare valori piccoli
| Dell Precision 5520 UHD E3-1505M v6, Quadro M1200, 97 Wh | Fujitsu Celsius H760 E3-1505M v5, Quadro M2000M, 72 Wh | Dell Precision 7510 (4K IGZO) E3-1535M v5, Quadro M2000M, 91 Wh | Dell Precision 3510 6700HQ, FirePro W5130M, 84 Wh | Lenovo ThinkPad P50 E3-1505M v5, Quadro M2000M, 90 Wh | Dell XPS 15 9560 (i7-7700HQ, UHD) i7-7700HQ, GeForce GTX 1050 Mobile, 97 Wh | Dell Precision 5510 E3-1505M v5, Quadro M1000M, 56 Wh | |
|---|---|---|---|---|---|---|---|
| Autonomia della batteria | 30% | -16% | 96% | 16% | 52% | 18% | |
| Reader / Idle (h) | 12.1 | 9.3 -23% | 4.5 -63% | 19.5 61% | 9 -26% | 13.9 15% | 7.1 -41% |
| WiFi v1.3 (h) | 4.2 | 5.6 33% | 4 -5% | 9.9 136% | 4.8 14% | 7.2 71% | 4.8 14% |
| Load (h) | 1 | 1.8 80% | 1.2 20% | 1.9 90% | 1.6 60% | 1.7 70% | 1.8 80% |
| WiFi (h) | 5 |
Pro
Contro
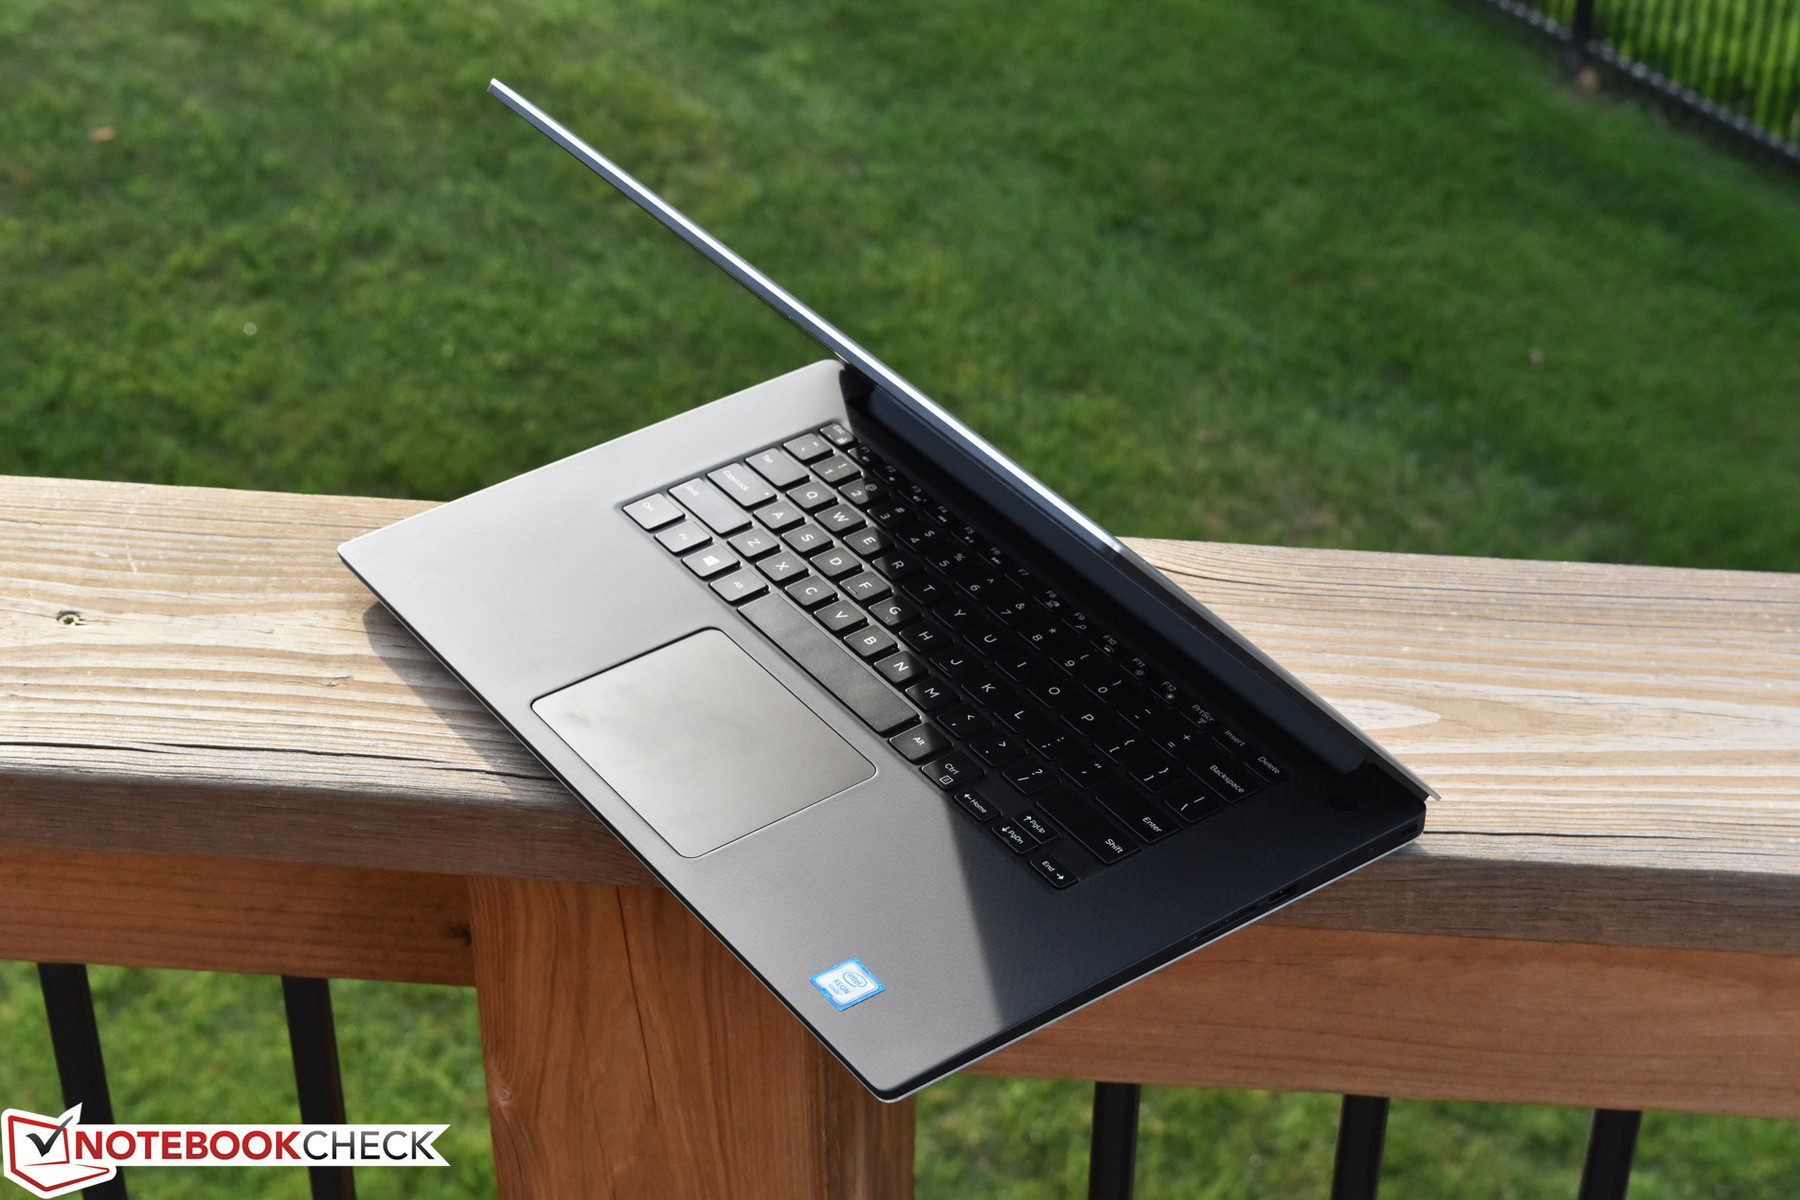
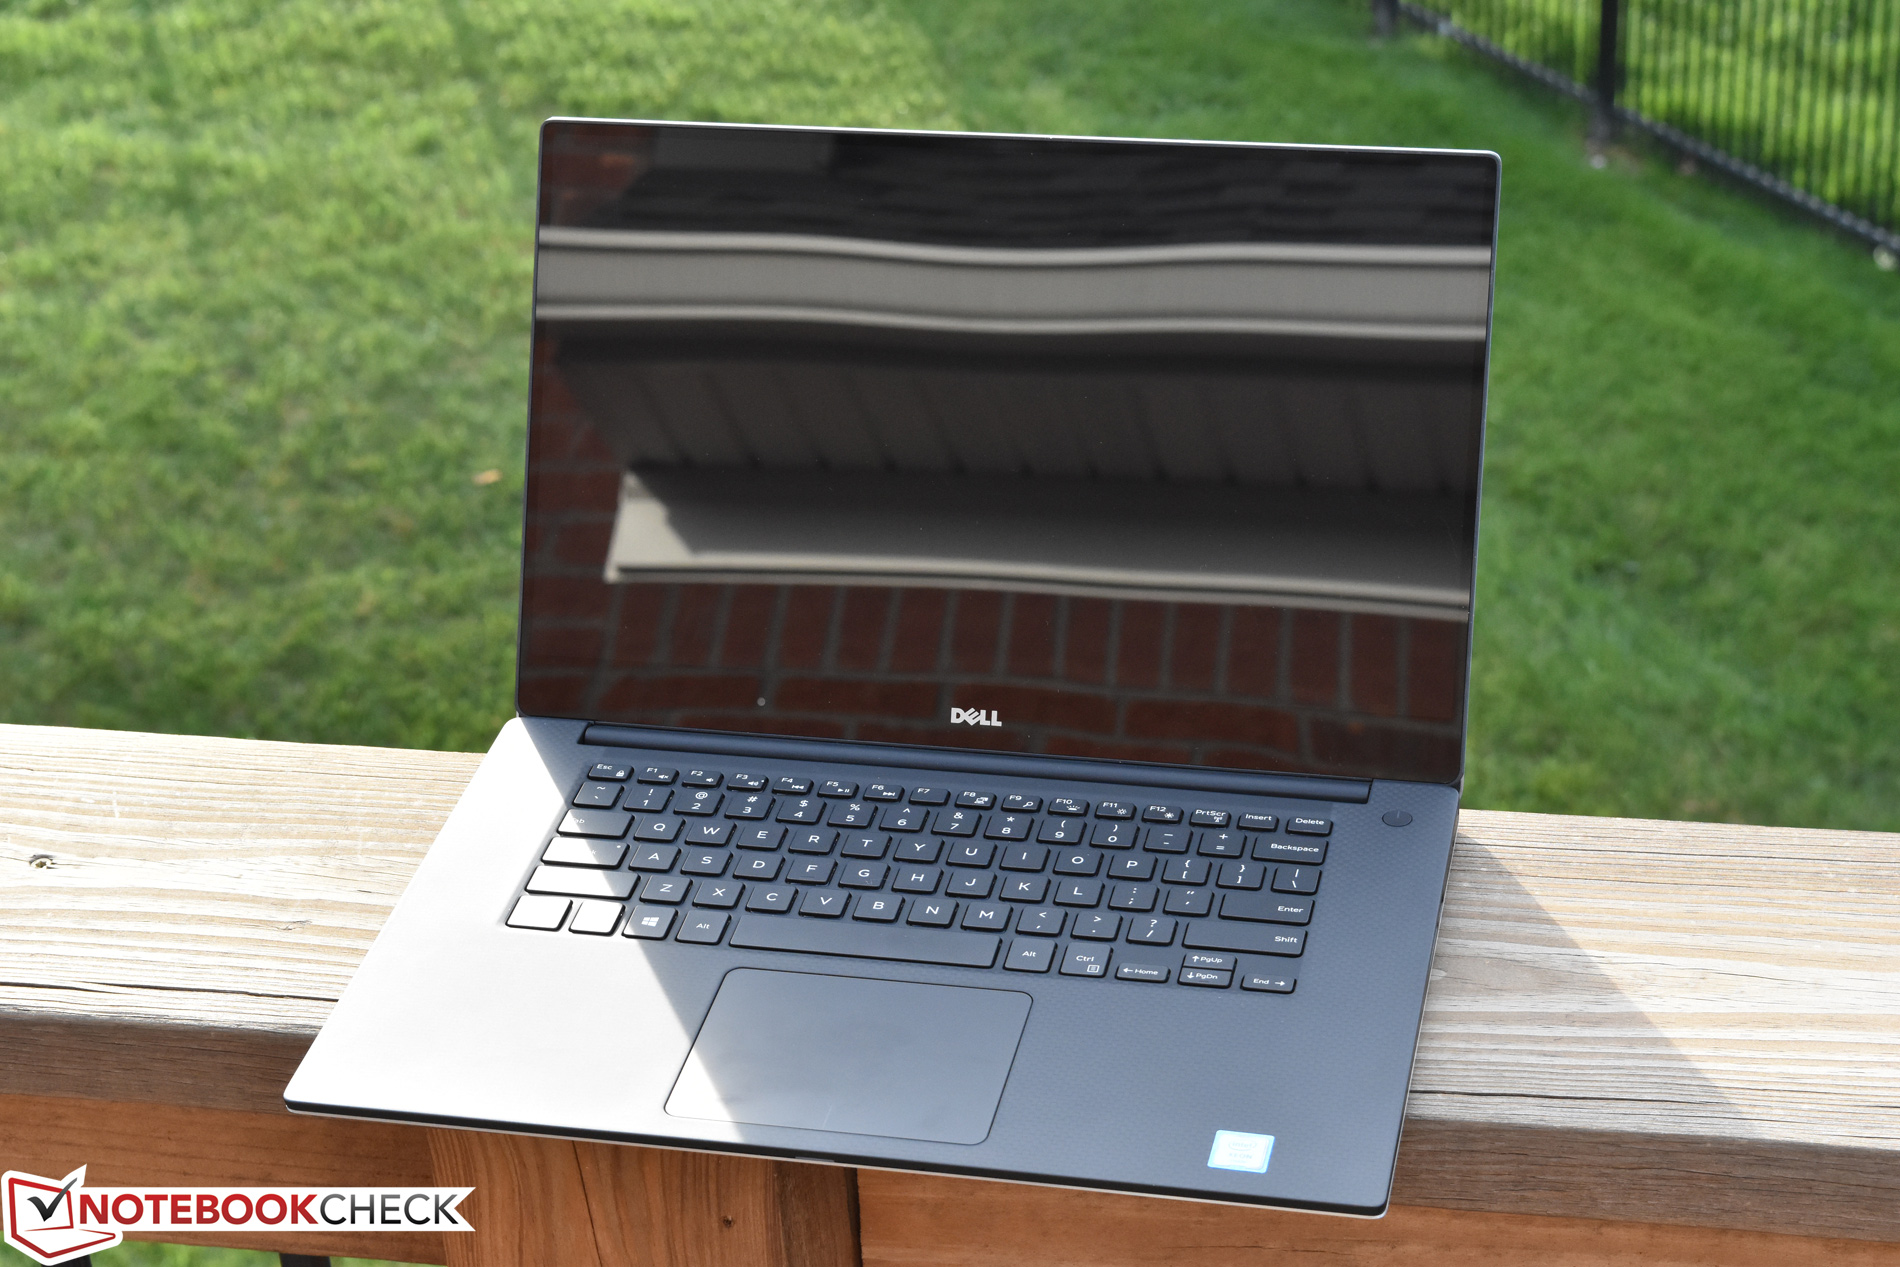
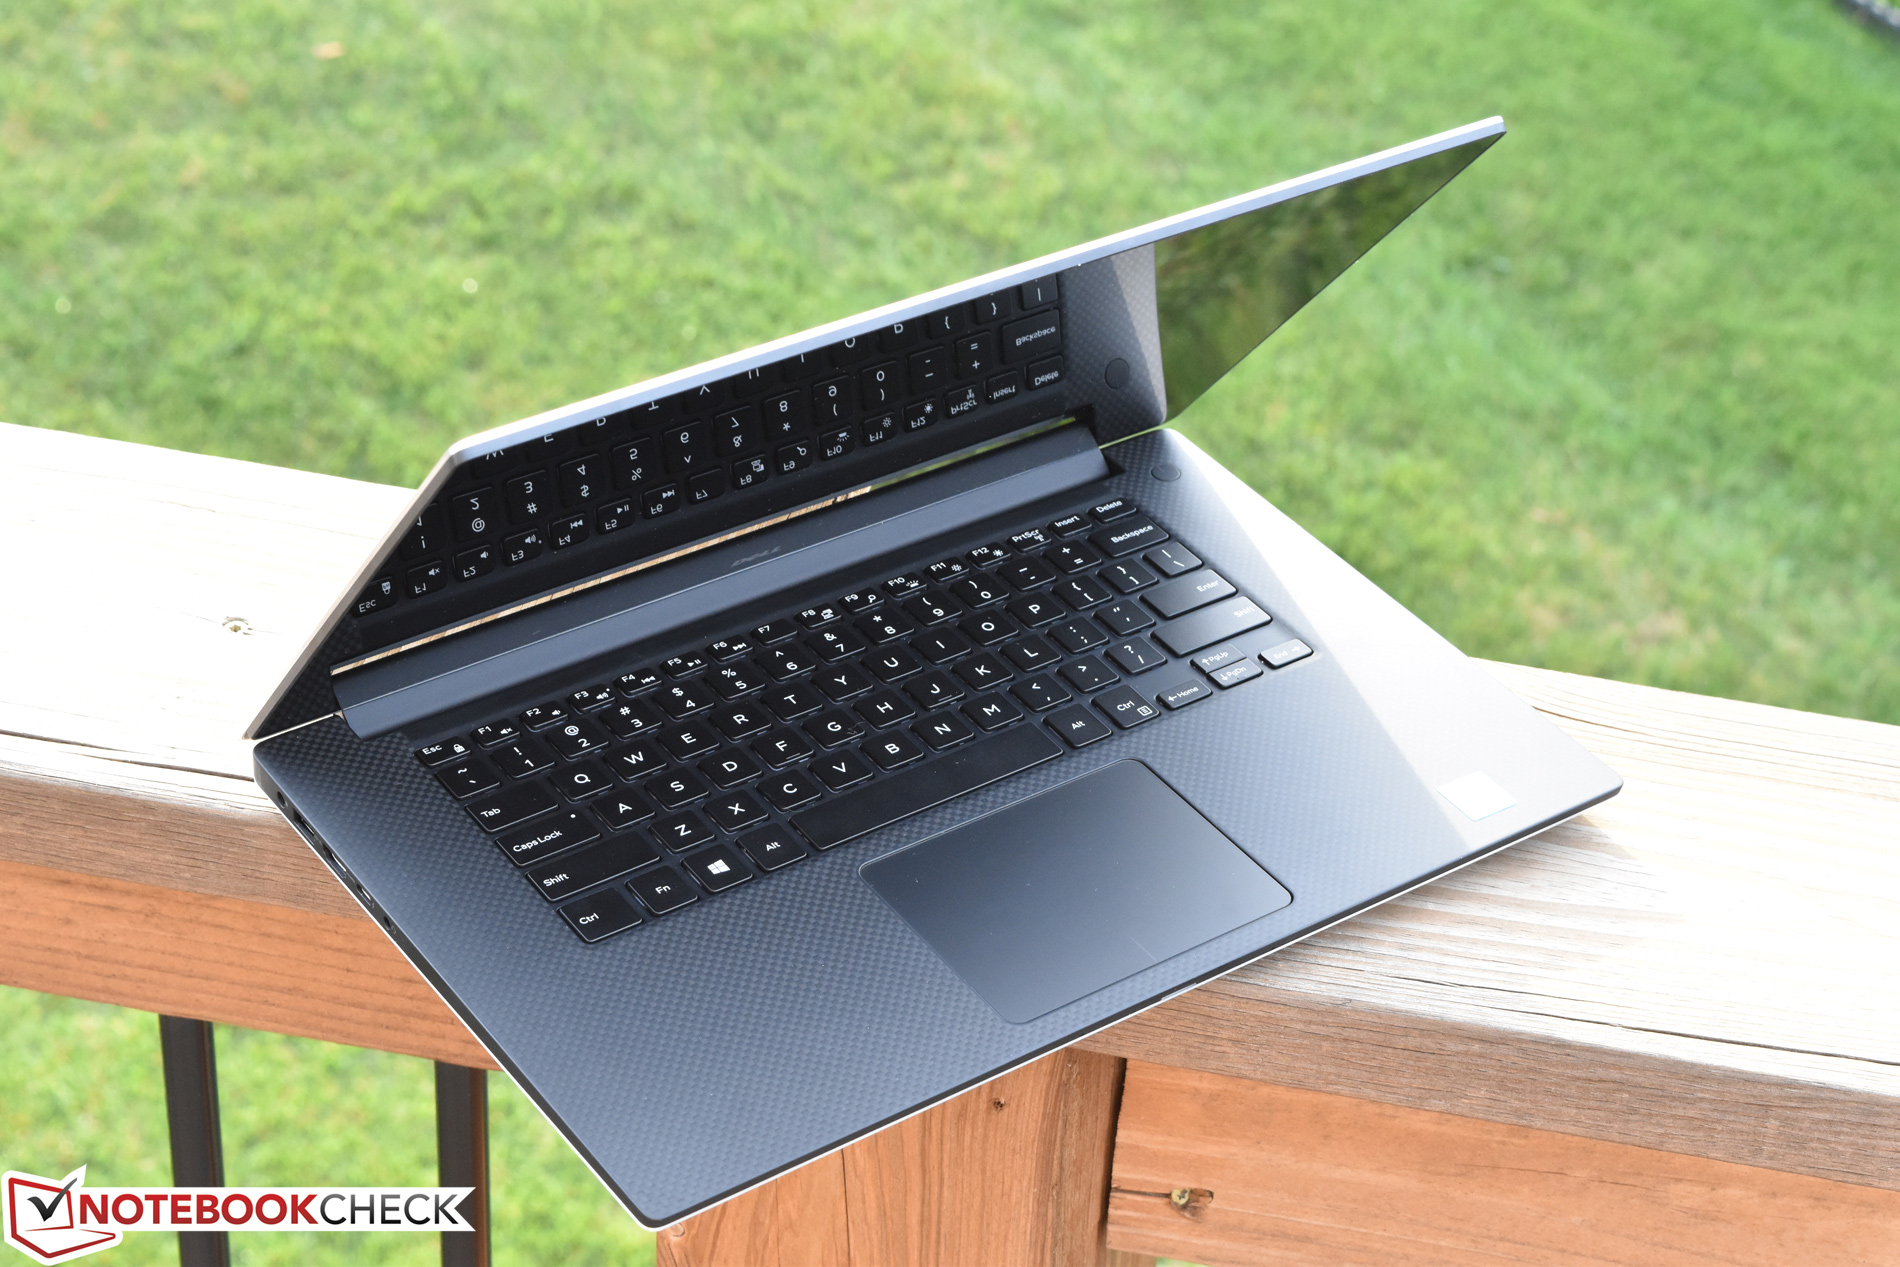
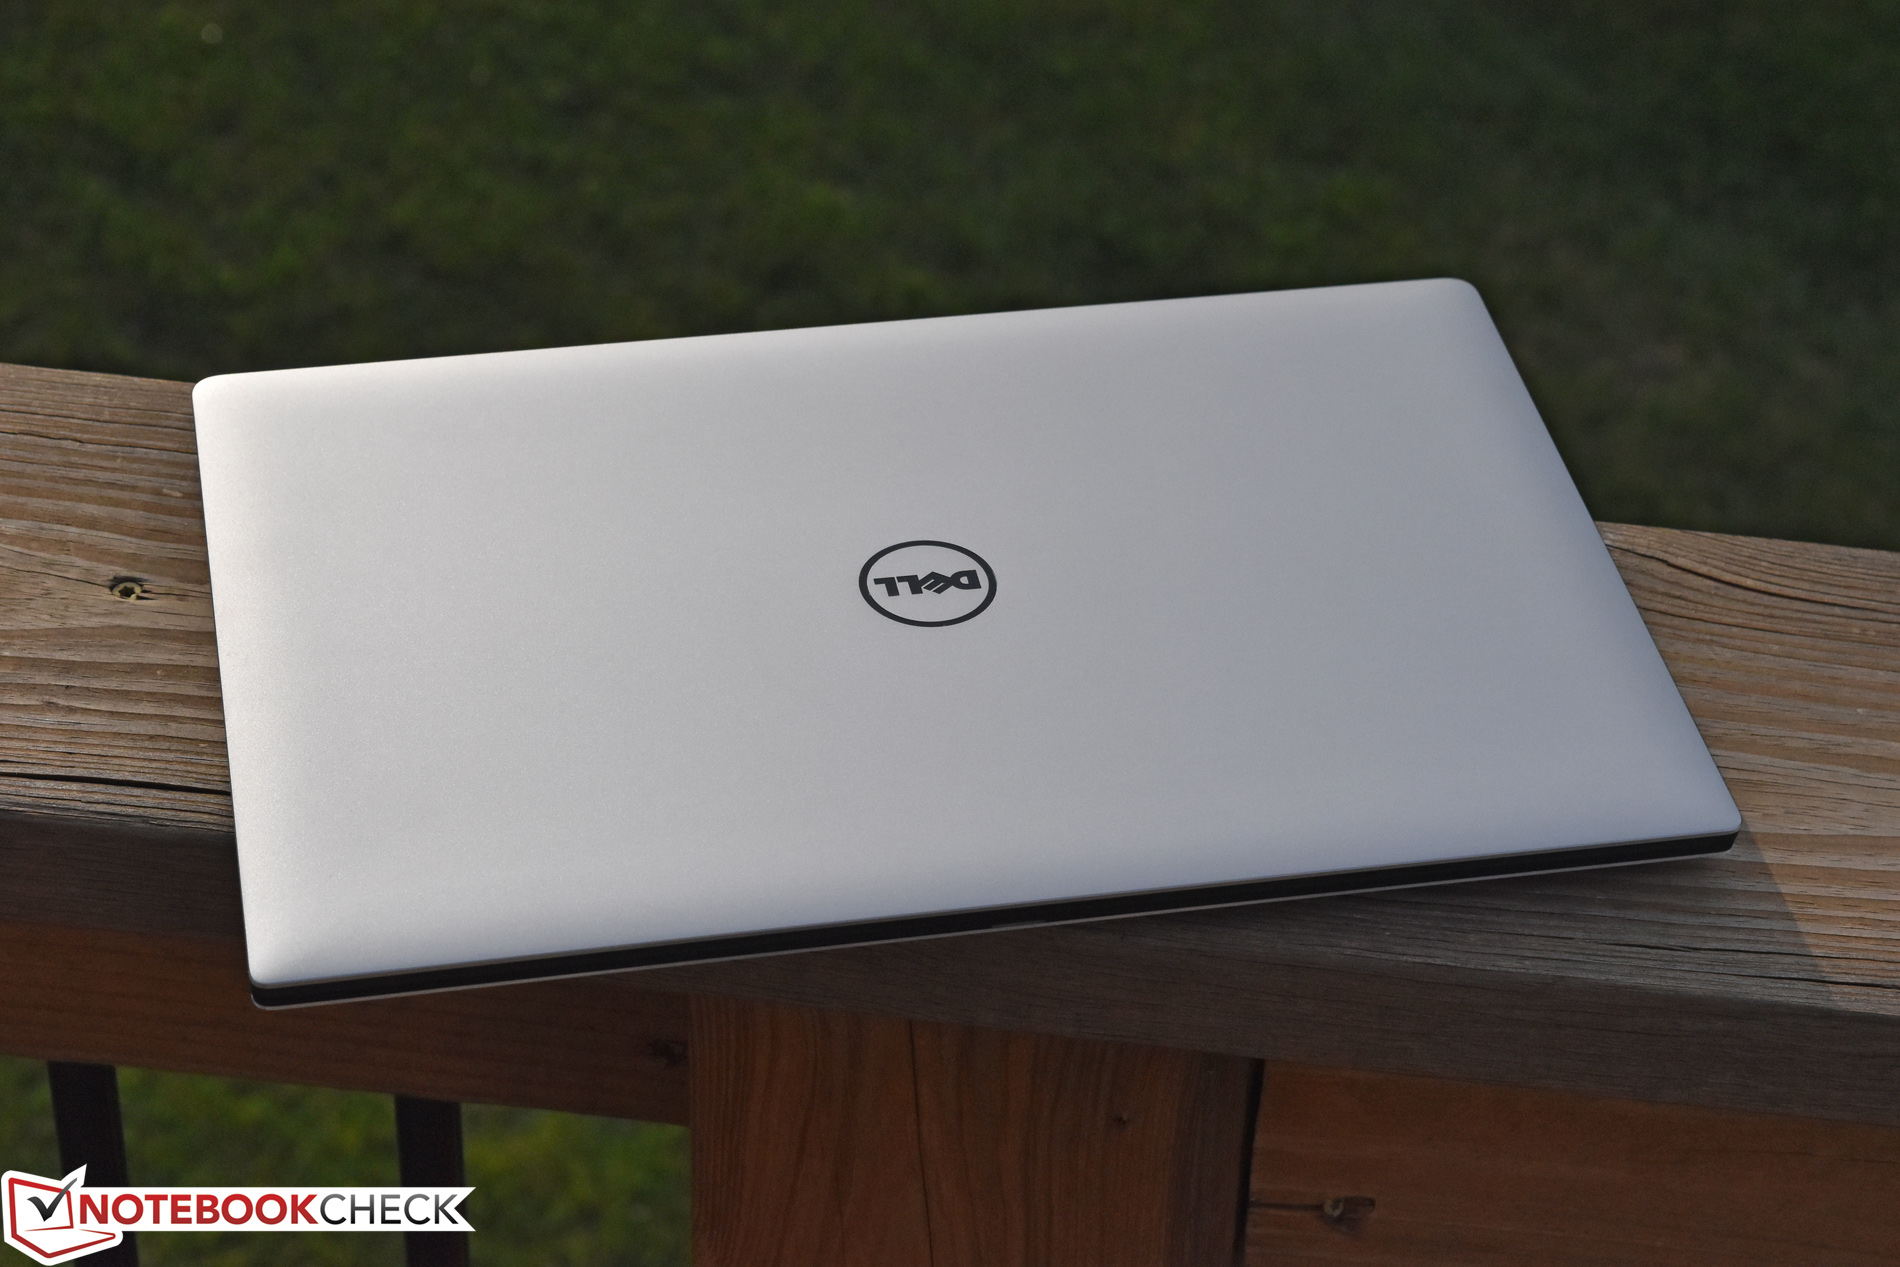
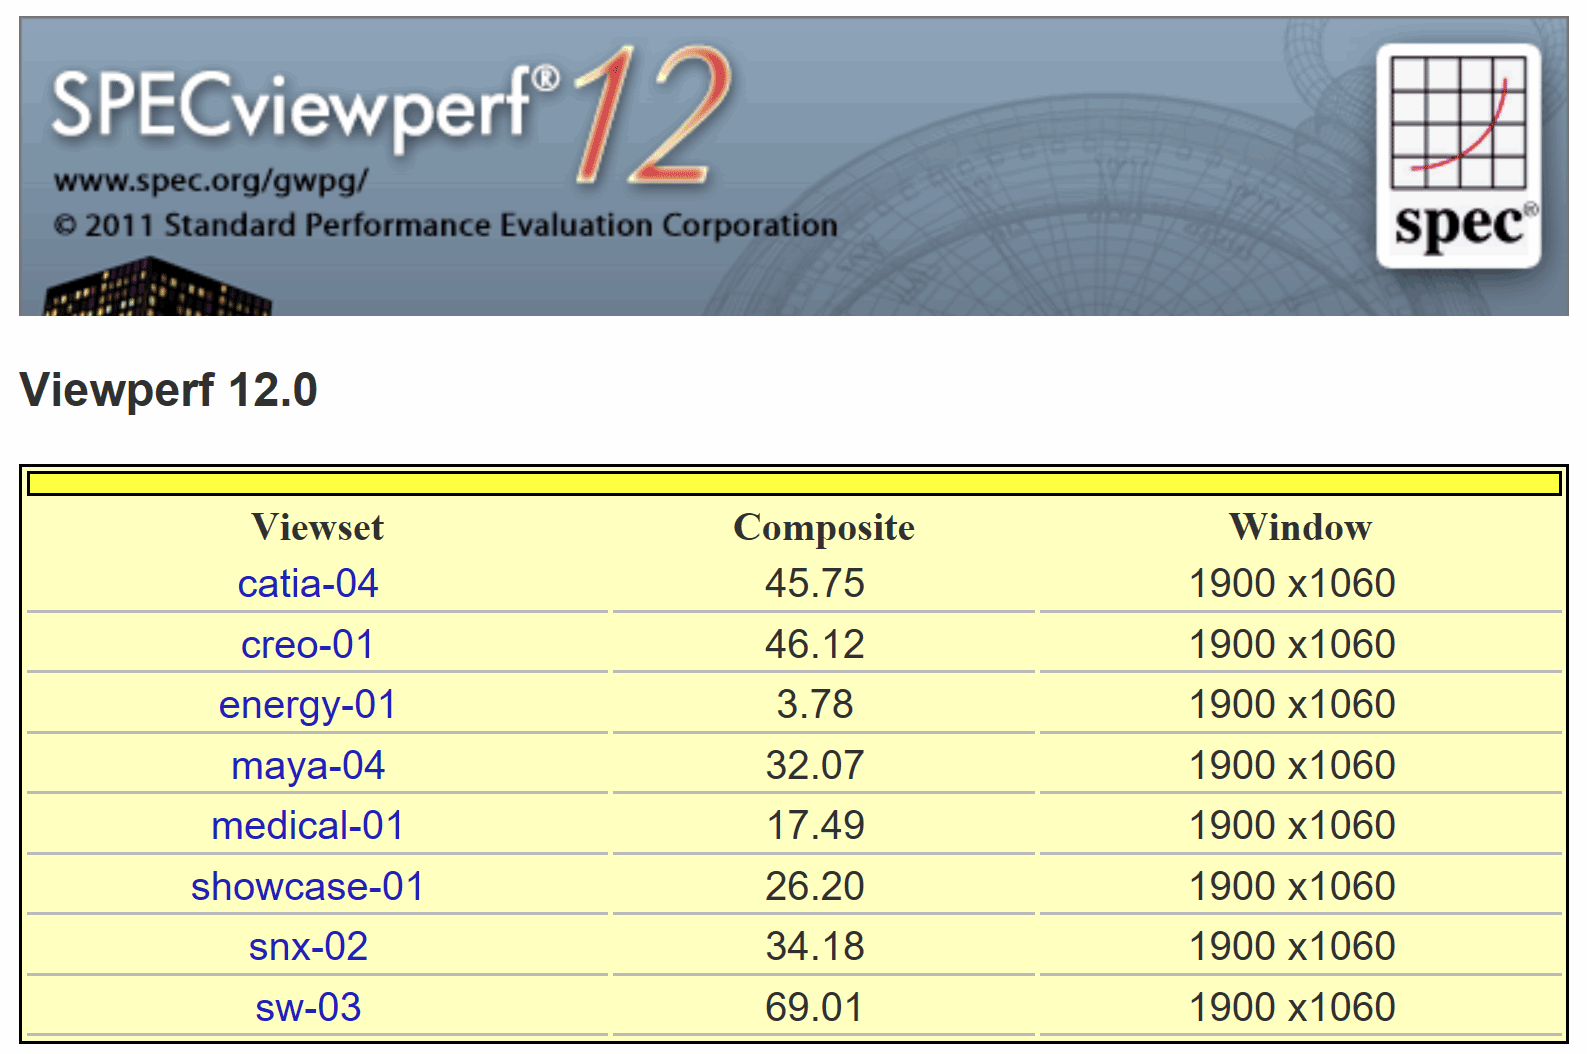
Sebbene non sia cambiato molto in termini di design rispetto al Precision 5510 di oltre un anno fa, il Dell Precision 5520 resta una delle workstations più attraenti e portatili. Il passaggio alla Kaby Lake dà risultati misti, con limiti delle prestazioni CPU con carichi di lavoro sostenuti che impediscono al dispositivo di raggiungere il potenziale massimo nelle prestazioni multi-core, anche con condizioni di stress realistiche. Ma il passaggio allo spazio di archiviazione NVMe e l'adozione della nuova NVIDIA Quadro M1200 apporta notevoli benefici alle prestazioni della workstation: abbiamo registrato risultati rispettabili nei nostri test SPECviewperf, ed in generale ben sopra quelli del 5510, per il boot. Le prestazioni GPU sembrano abbastanza stabili anche con il nostro stress test Witcher 3.
Alcuni sacrifici devono essere fatti con una workstation di queste dimensioni: dopo tutto, la 5520 pesa oltre 2 kg ed il formato si avvicina a quello di una macchina da 14". A parte le limitazioni della CPU, il Precision si scalda sotto sforzo, e l'autonomia non è nulla di speciale (almeno, con lo schermo UHD presente sul nostro modello). Quindi mentre il sogno di un ibrido Ultrabook/workstation potrebbe restare irrealizzato, per coloro che possono accettare le buone prestazioni GPU/workstation ma non si lamentano delle capacità deludenti multi-core CPU, il Precision 5520 è un compromesso attraente che ricambia con una buona portabilità e un'estetica attraente.
Per gli altri, forse l'unica soluzione sono le workstation più grandi - sebbene ci sono sempre altre opzioni ultraportatili come l'XPS 15 ed il Razer Blade. Ad esempio, sebbene il nostro XPS 15 non ha molta potenza CPU come il Precision, i clock rates e le performance sono stabili nel test Cinebench — e complessivamente, le prestazioni sono migliori.
Bisogna aspettarsi qualche sacrificio quando si prende una workstation di queste dimensioni; per coloro che sono interessati il Precision 5520 è un attraente compromesso che fornisce buona portabilità ed estetica attraente.
C'è molto spazio per miglioramenti con la prossima revisione, per il momento il Precision 5520 è un dispositivo impressionante con solide prestazioni GPU per la sua dimensione. COn un prezzo di $2,867 non è un investimento da poco ma è ancora unico nel suo genere.
Nota: si tratta di una recensione breve, con alcune sezioni non tradotte, per la versione integrale in inglese guardate qui.
Dell Precision 5520 UHD
- 04/28/2017 v6 (old)
Steve Schardein
Price comparison
