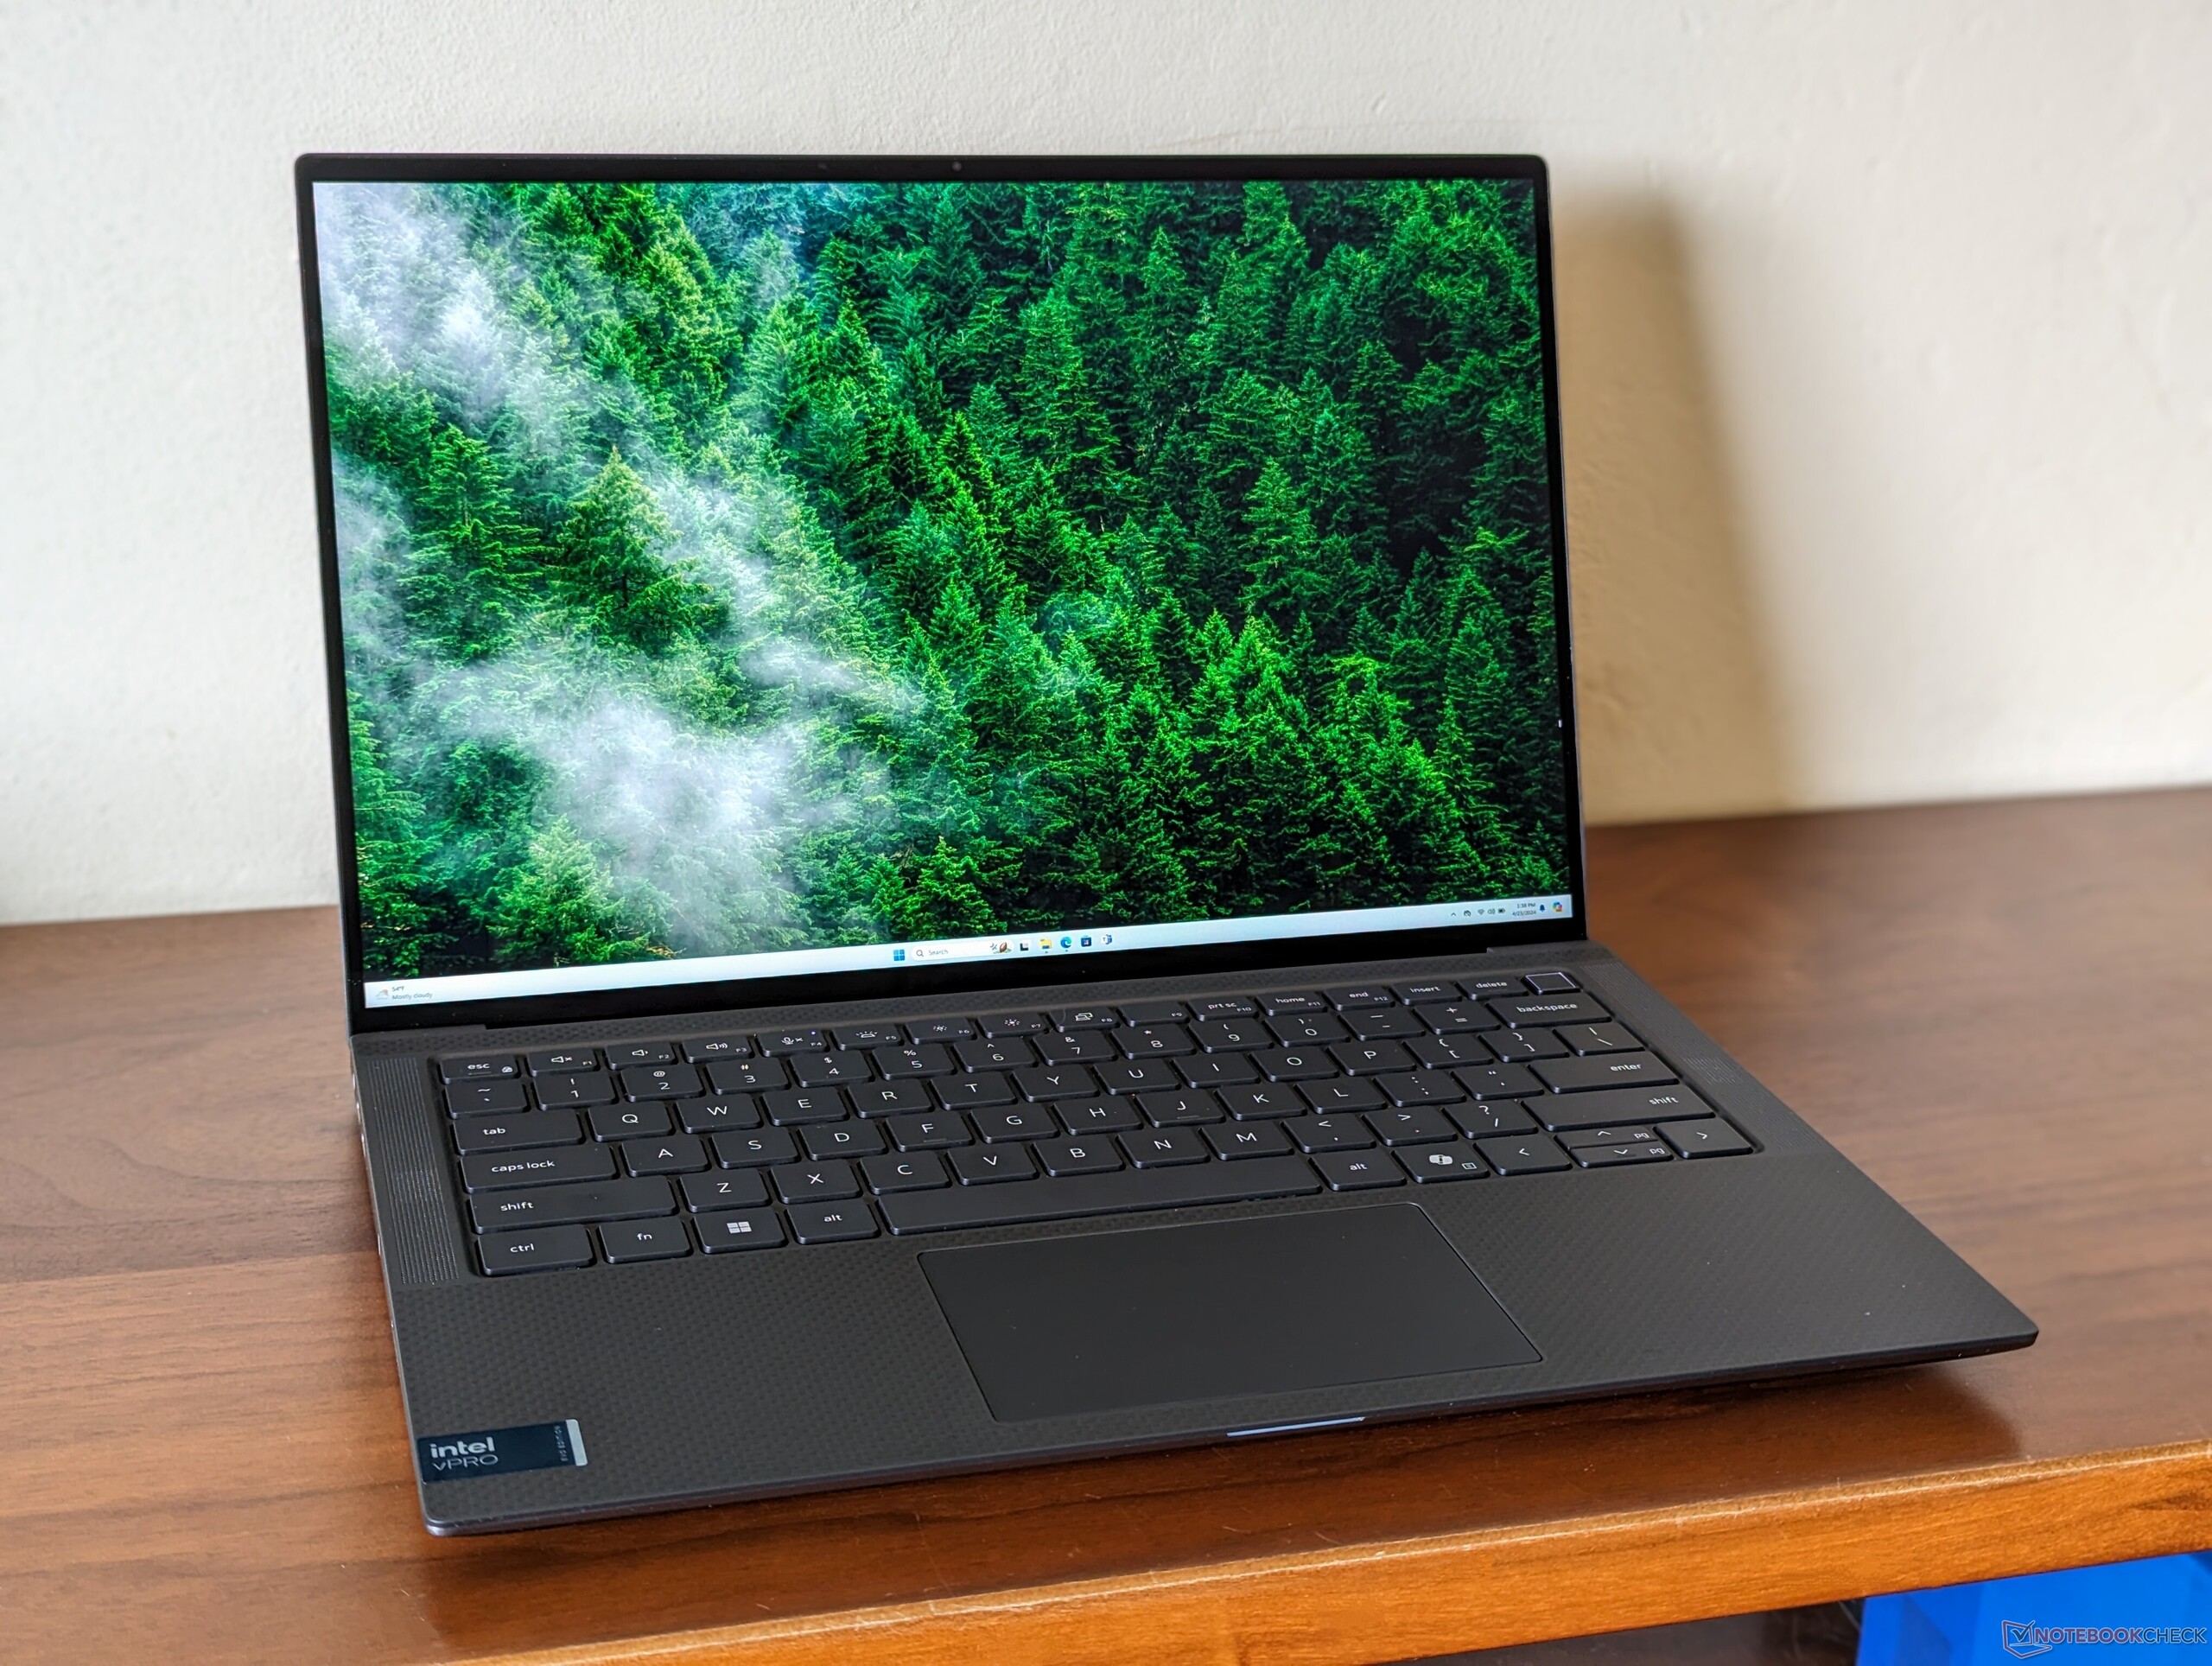
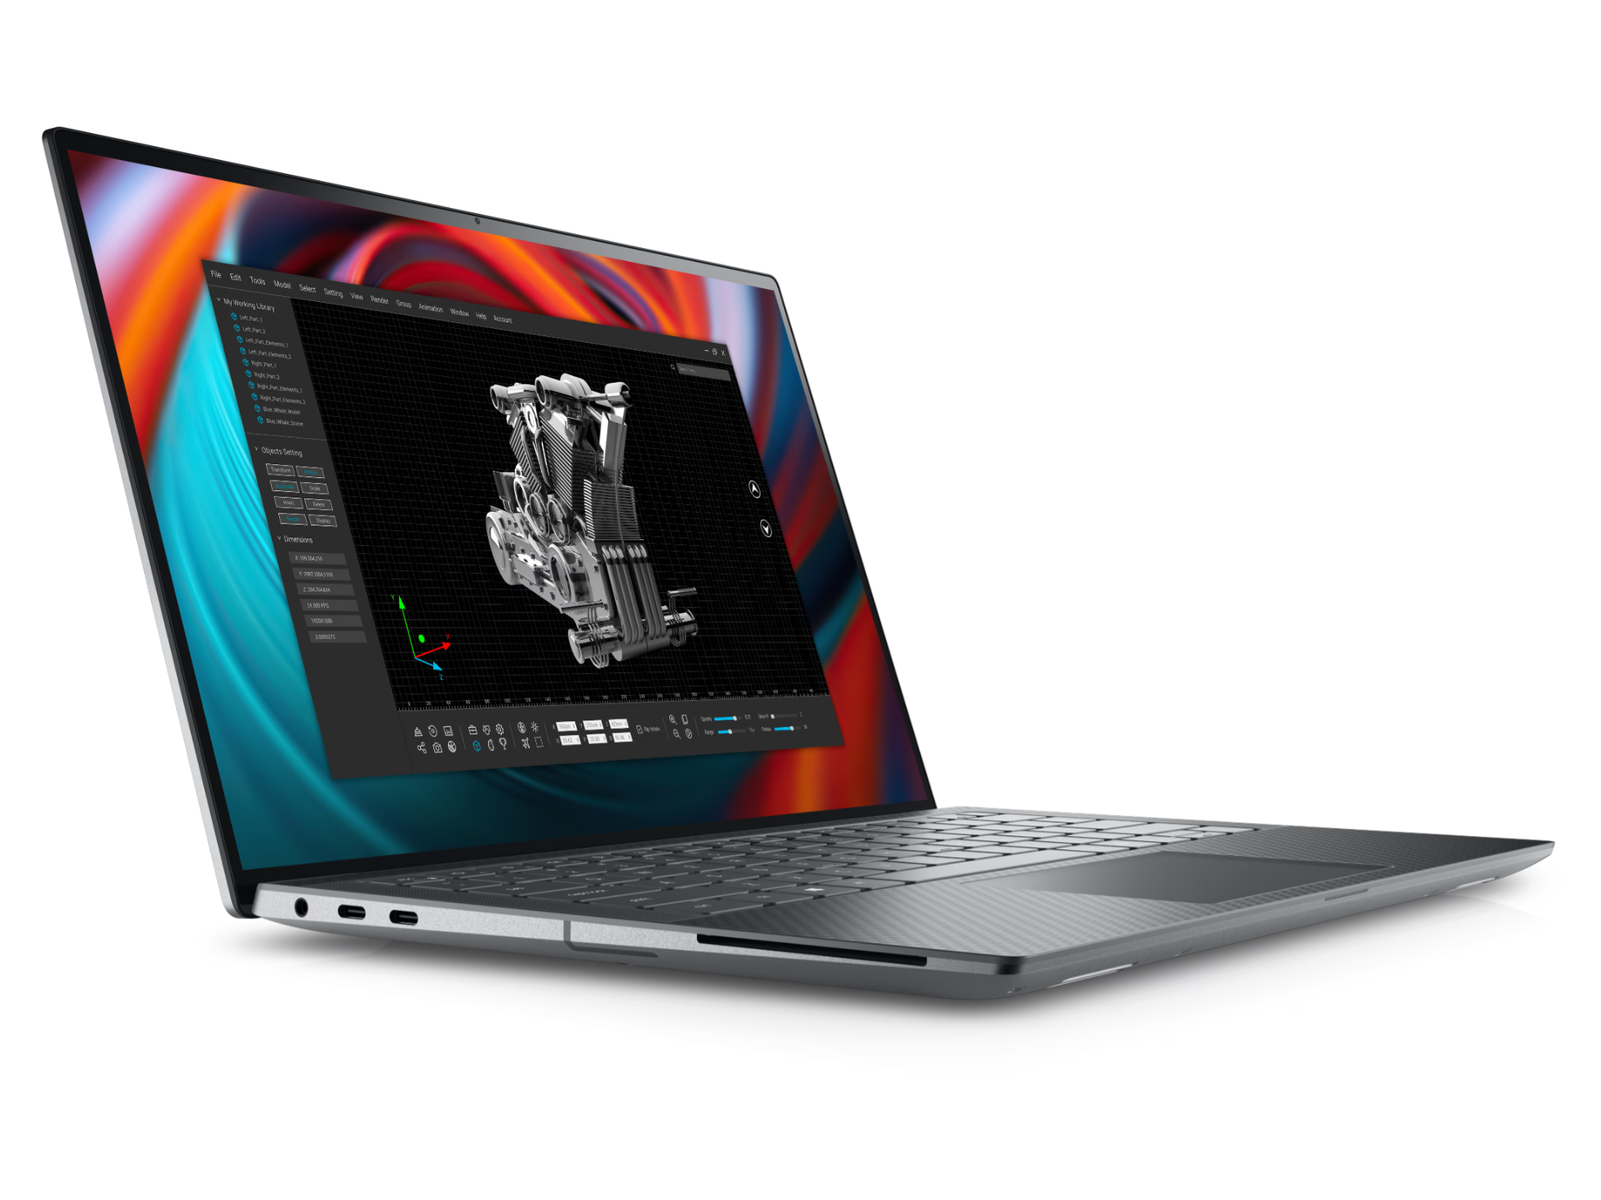
Recensione della workstation Dell Precision 5490: Ora con Intel Meteor Lake-H vPro

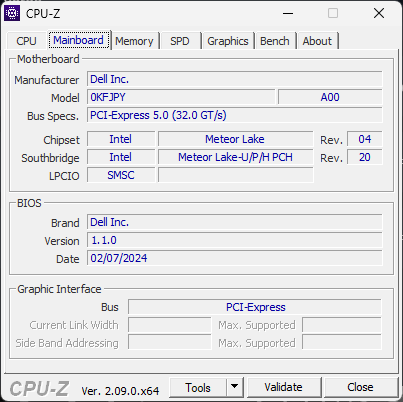
Il modello 2024 Precision 5490 è un aggiornamento del modello Precision 5480 dello scorso anno. L'ultimo modello utilizza lo stesso design del telaio di Precision 5480 e di 5470 ciò significa che tutti i nostri commenti sulle caratteristiche fisiche di Precision 5470 sono ancora validi per il 5490.
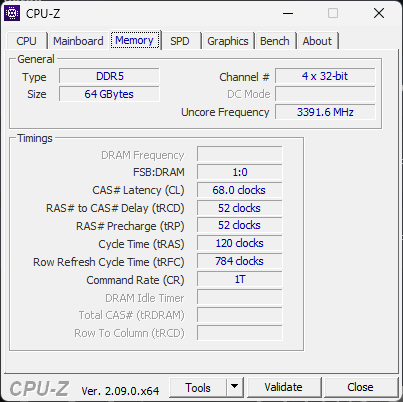
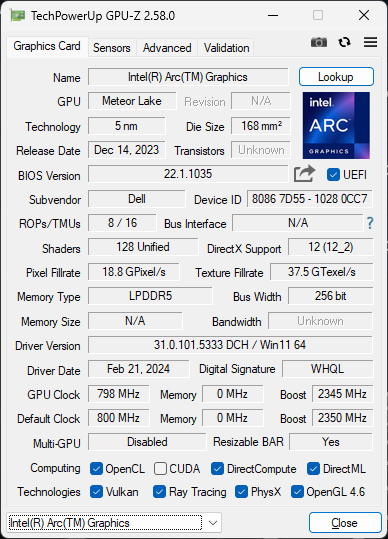
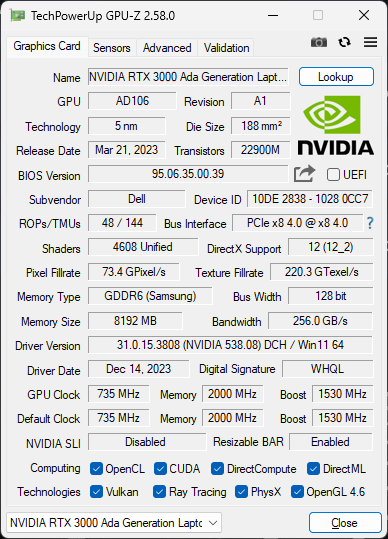
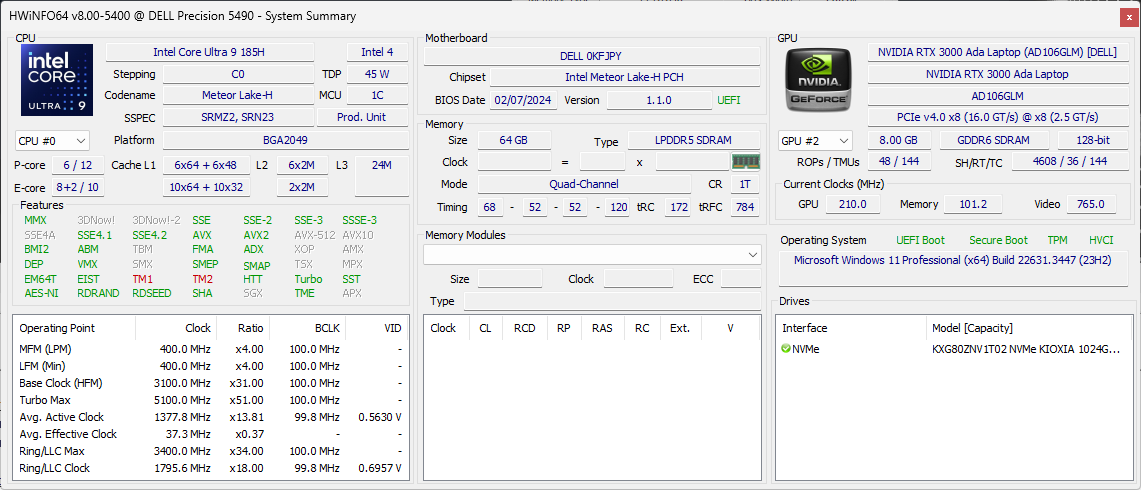
La nostra unità di prova è la configurazione top-end con la CPU Meteor Lake-H Core Ultra 9 185H, che sostituisce le opzioni Raptor Lake-H dello scorso anno. Per il resto, tutto rimane invariato, compreso il touchscreen IPS QHD+ 2560 x 1600 e la GPU Nvidia RTX 3000 Ada da 50 W. Le SKU minori potrebbero essere fornite con il Core Ultra 5 135H, il display FHD+ 1920 x 1200 e solo la grafica Arc integrata.
I concorrenti diretti di Precision 5490 includono altre workstation ultraportatili da 14 pollici come i modelli Lenovo ThinkPad P14s o HP ZBook Firefly 14 G10.
Altre recensioni di Dell:
Potenziali concorrenti a confrontos
Punteggio | Data | Modello | Peso | Altezza | Dimensione | Risoluzione | Prezzo |
|---|---|---|---|---|---|---|---|
| 89.3 % v7 (old) | 04/2024 | Dell Precision 5000 5490 Ultra 9 185H, RTX 3000 Ada Generation Laptop | 1.6 kg | 18.95 mm | 14.00" | 2560x1600 | |
| 81 % | 07/2024 | Lenovo ThinkPad P14s G4 21HF0017GE i7-1370P, RTX A500 Laptop GPU | 1.5 kg | 22.7 mm | 14.00" | 2880x1800 | |
| 87.4 % v7 (old) | 10/2023 | HP ZBook Firefly 14 G10 A R5 PRO 7640HS, Radeon 760M | 1.5 kg | 20 mm | 14.00" | 1920x1200 | |
| 87.4 % v7 (old) | HP ZBook Firefly 14 G9-6B8A2EA i7-1265U, T550 Laptop GPU | 1.5 kg | 19.9 mm | 14.00" | 1920x1200 | ||
| 89.6 % v7 (old) | 09/2023 | Dell Precision 5480 i9-13900H, RTX 3000 Ada Generation Laptop | 1.6 kg | 18.95 mm | 14.00" | 2560x1600 | |
| 87.6 % v7 (old) | 09/2022 | Dell Precision 5000 5470 i9-12900H, RTX A1000 Laptop GPU | 1.6 kg | 18.95 mm | 14.00" | 2560x1600 |
Custodia - Ispirata da XPS
Il modo più semplice per distinguere visivamente Precision 5490 da Precision 5480 o 5470 è cercare il nuovo tasto Co-Pilot sulla tastiera. Microsoft richiede questo tasto dedicato a tutti i principali produttori per supportare meglio le prossime funzioni di Windows AI. Per il resto, non ci sono altre modifiche al telaio. Consigliamo di consultare la nostra recensione di Precision 5470 per maggiori informazioni.
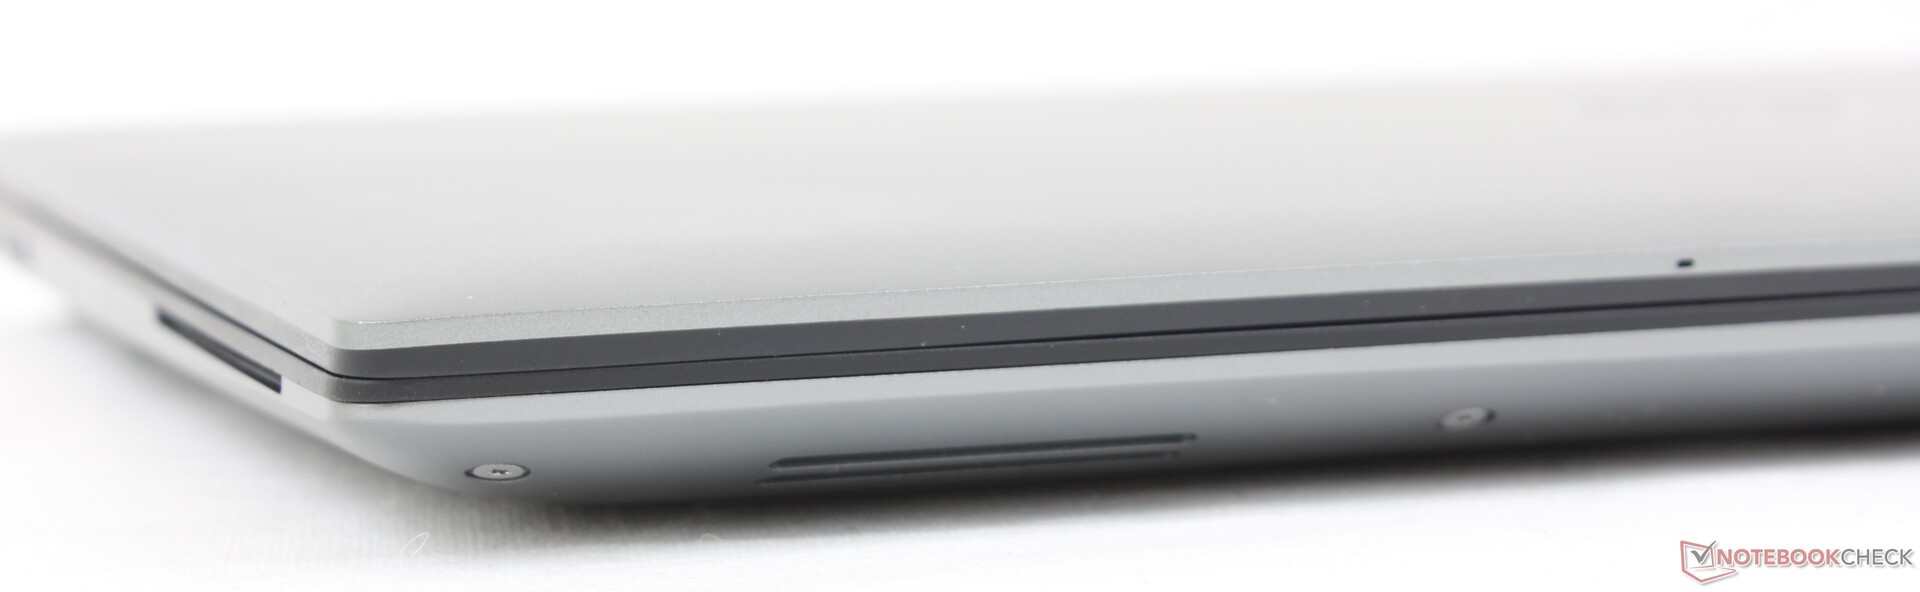
Si noti che il lettore di schede MicroSD rimane opzionale.
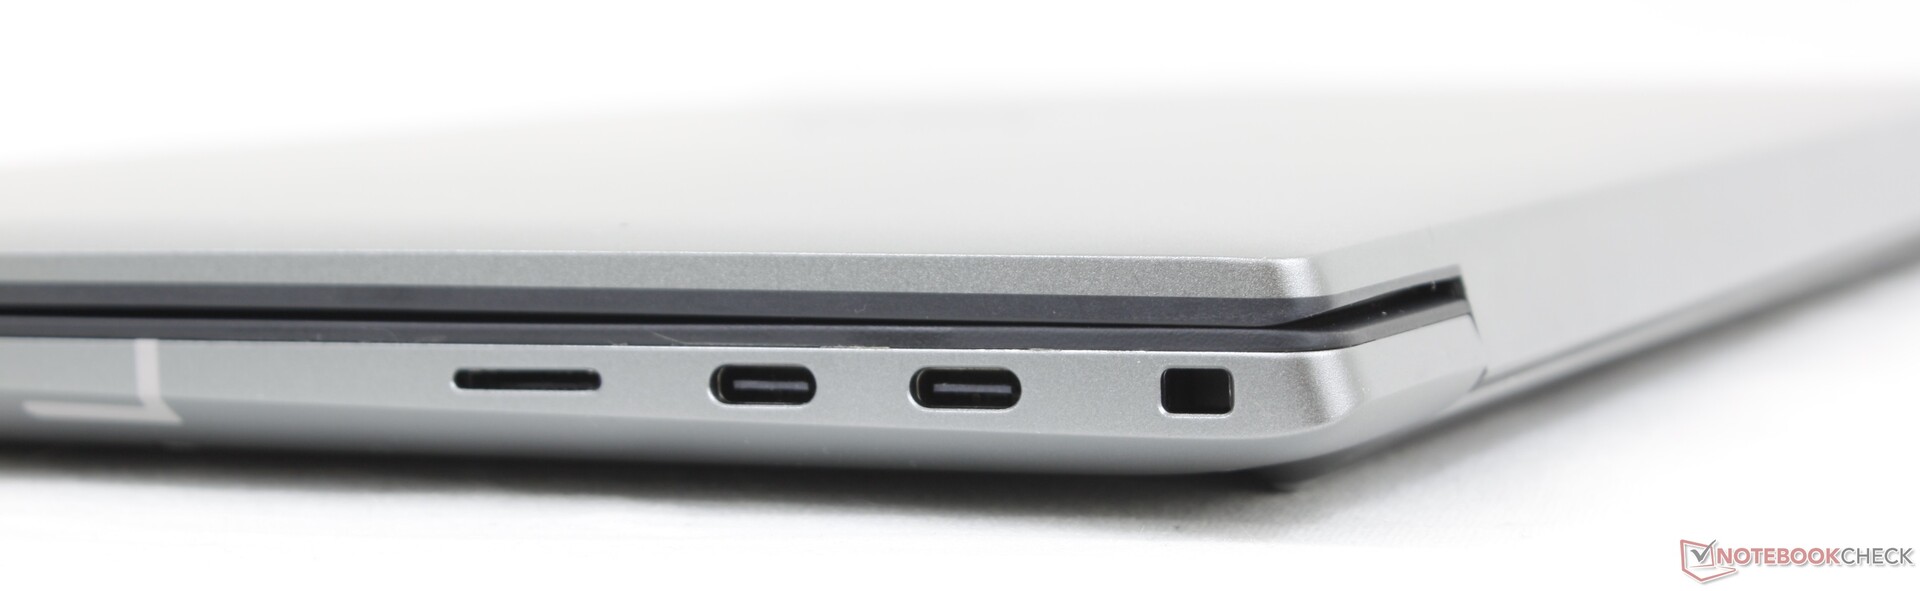
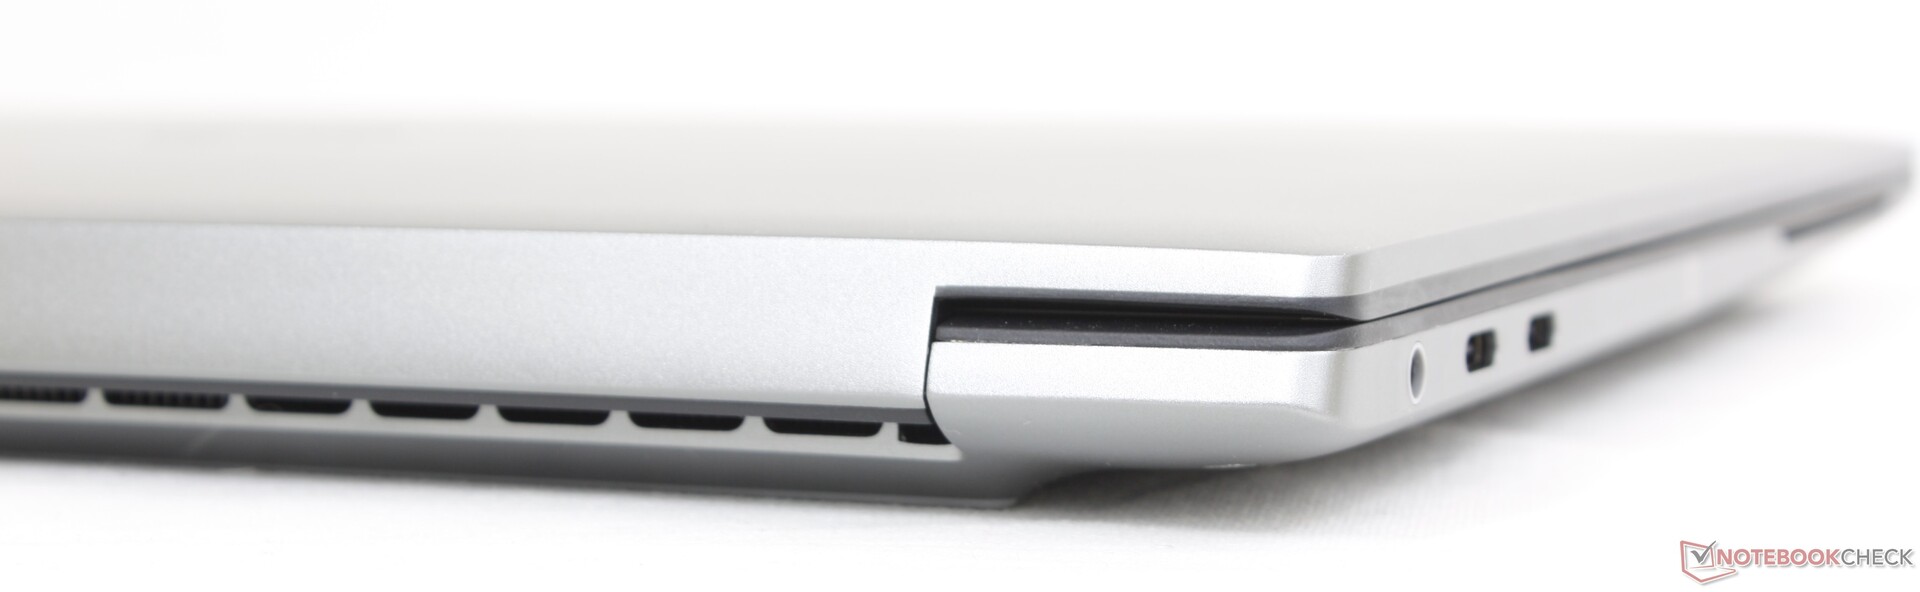
Connettività
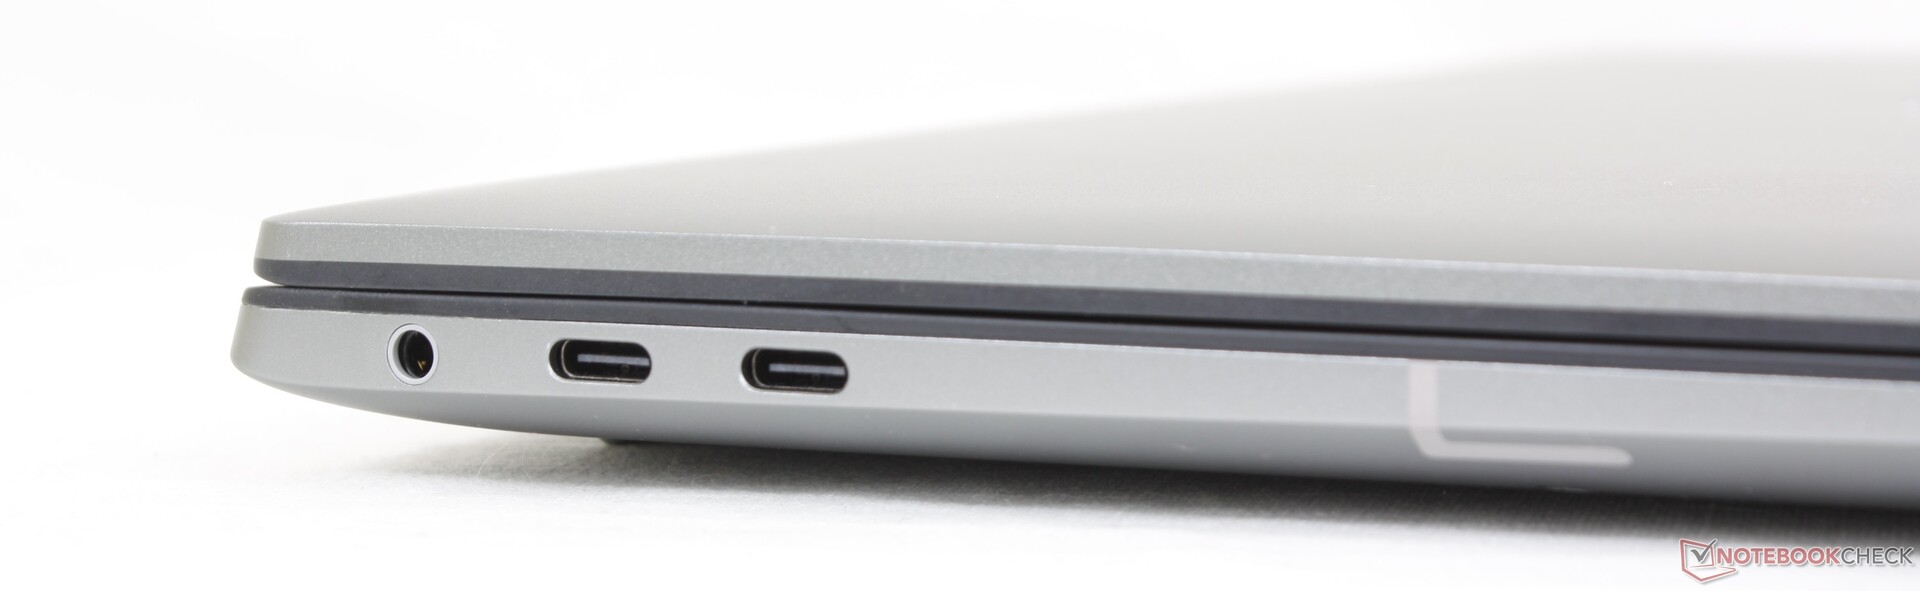
Comunicazione
Il modello di quest'anno include l'Intel BE200 per essere predisposto al Wi-Fi 7.
| Networking | |
| iperf3 transmit AXE11000 | |
| Dell Precision 5480 | |
| Dell Precision 5000 5490 | |
| HP ZBook Firefly 14 G10 A | |
| Lenovo ThinkPad P14s G4 21HF0017GE | |
| iperf3 receive AXE11000 | |
| HP ZBook Firefly 14 G10 A | |
| Lenovo ThinkPad P14s G4 21HF0017GE | |
| Dell Precision 5480 | |
| Dell Precision 5000 5490 | |
| iperf3 transmit AXE11000 6GHz | |
| Dell Precision 5000 5490 | |
| Dell Precision 5480 | |
| Dell Precision 5000 5470 | |
| Lenovo ThinkPad P14s G4 21HF0017GE | |
| iperf3 receive AXE11000 6GHz | |
| Lenovo ThinkPad P14s G4 21HF0017GE | |
| Dell Precision 5000 5490 | |
| Dell Precision 5480 | |
| Dell Precision 5000 5470 | |
Webcam


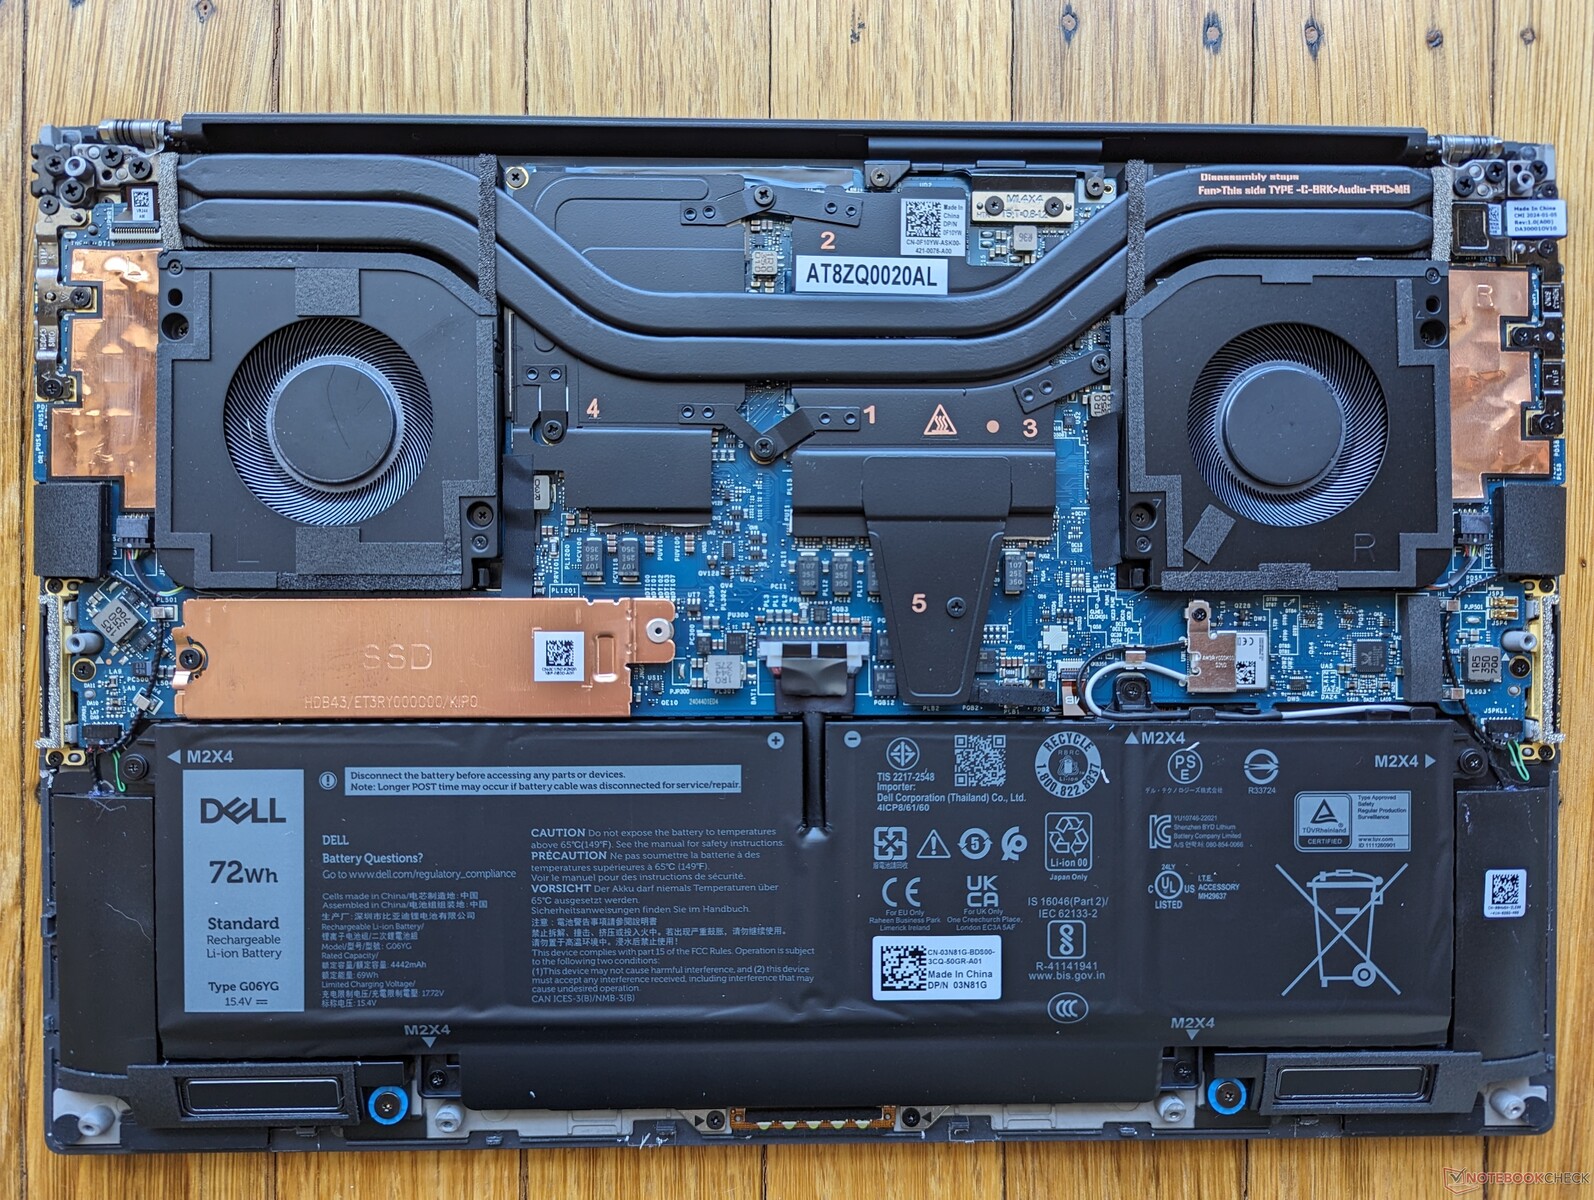
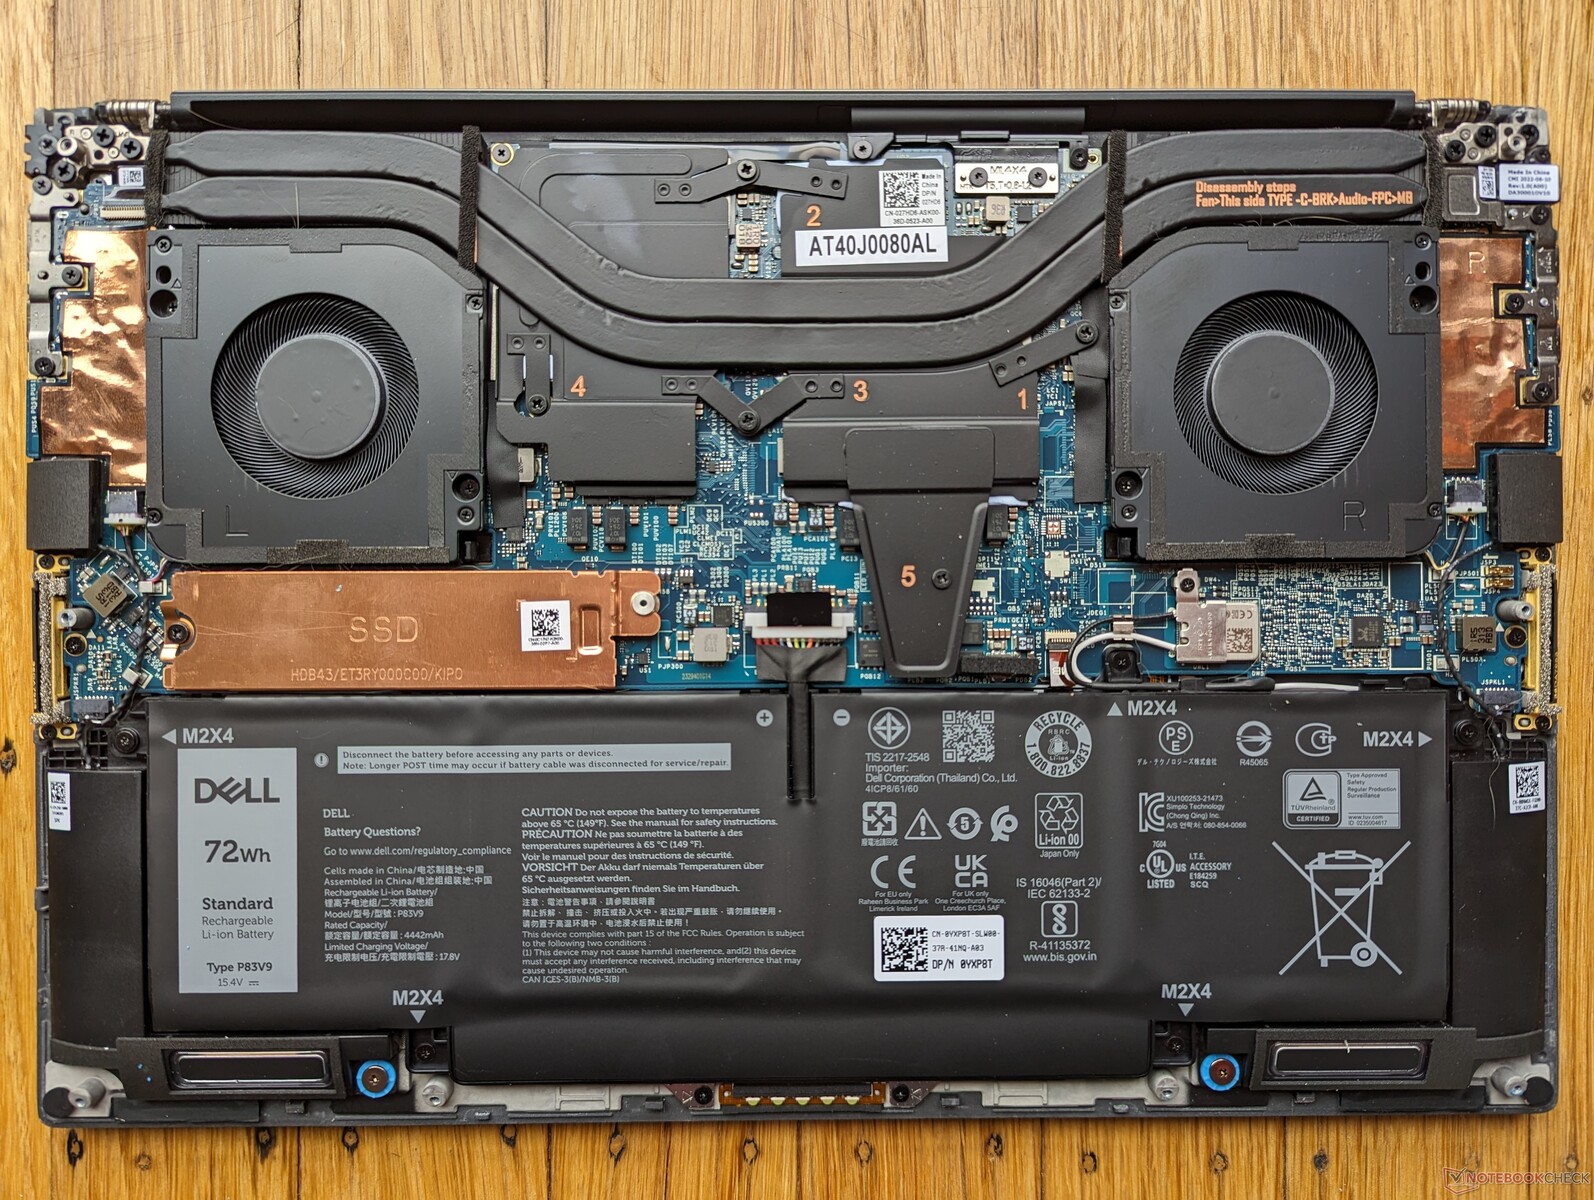
Manutenzione
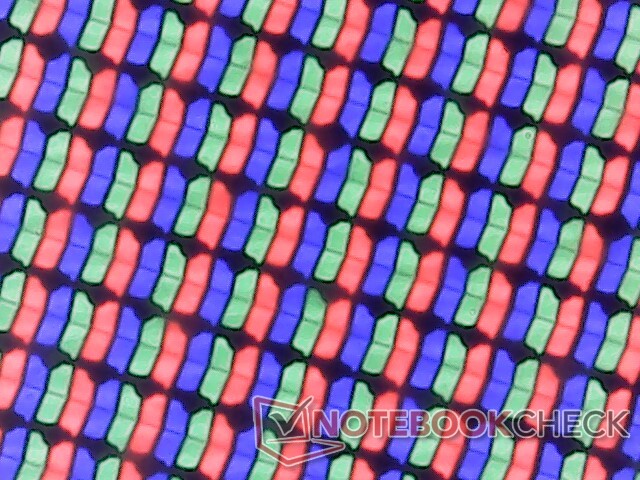
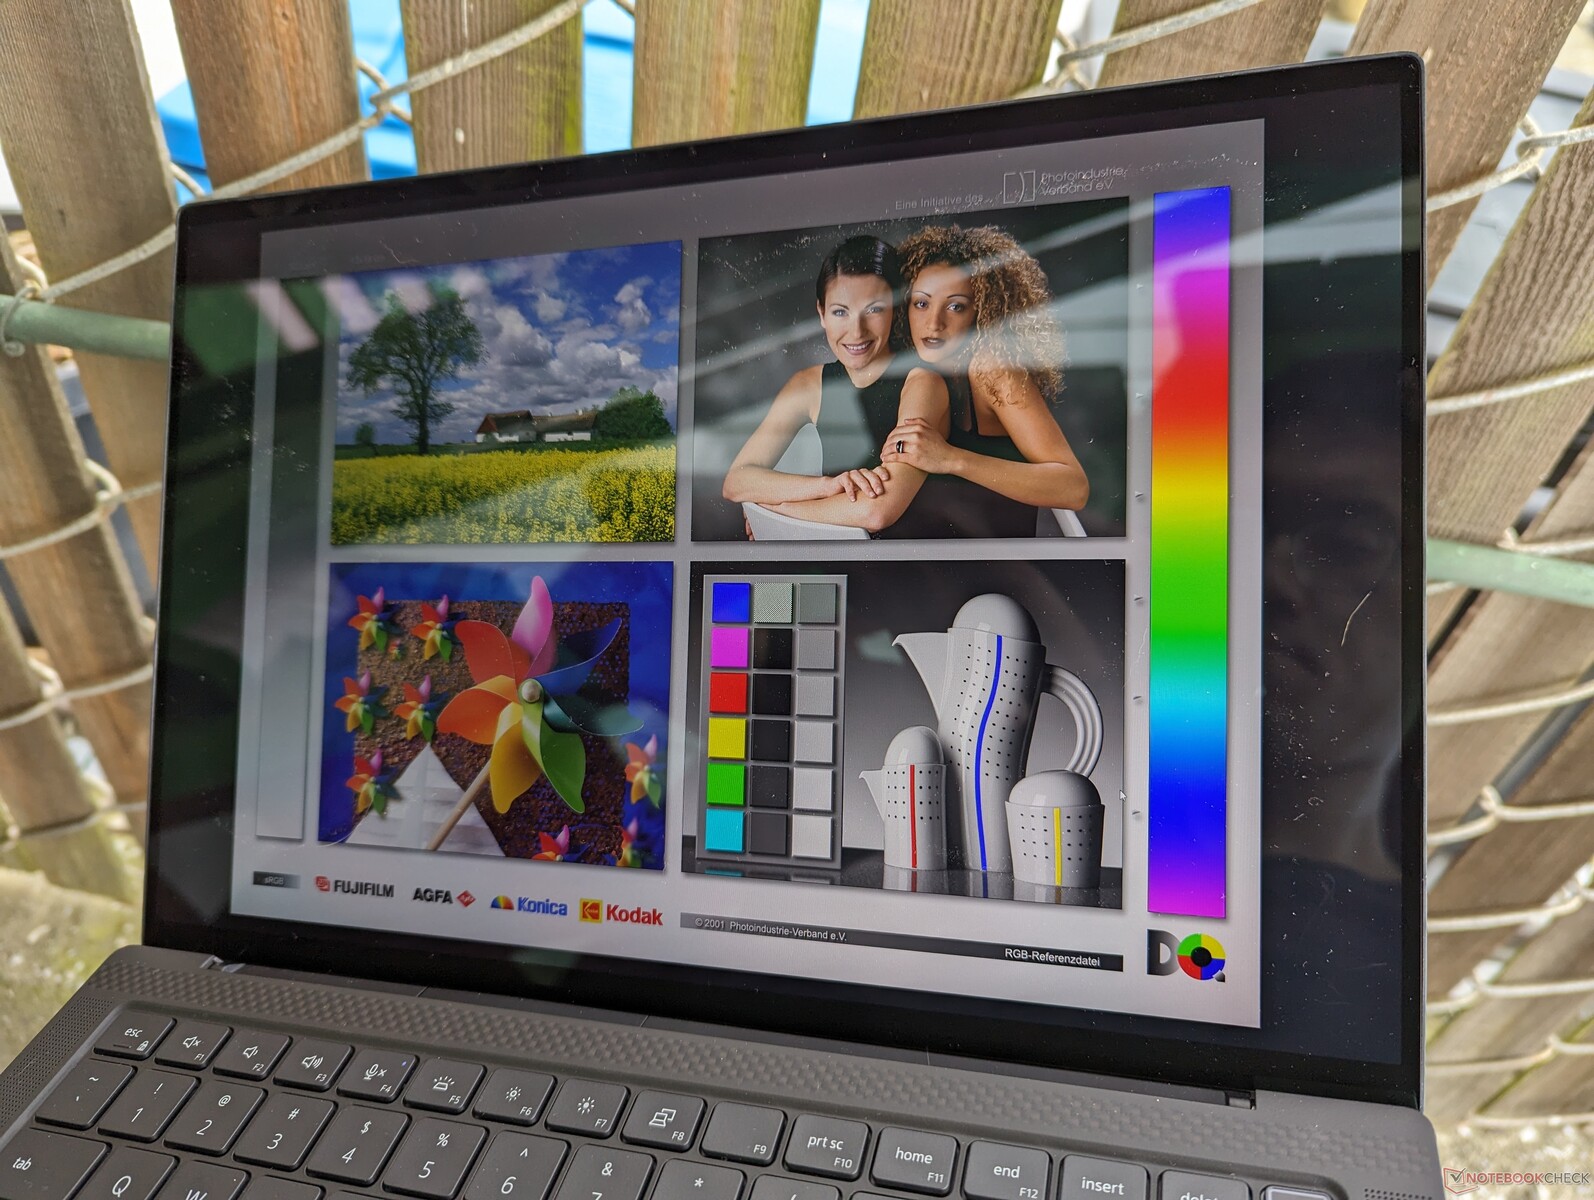
Display - Il buon vecchio IPS
AU Optronics è ancora una volta il fornitore del pannello QHD+ per il terzo anno consecutivo. Sebbene sia stato eccezionale quando è stato lanciato per la prima volta su Precision 5470, il pannello sta iniziando a mostrare la sua età di fronte alle nuove alternative OLED e a una frequenza di aggiornamento più elevata. Il Lenovo ThinkPad P14s G4ad esempio, viene fornito con un'opzione OLED a 1800p, che non è disponibile su Precision 5490.
| |||||||||||||||||||||||||
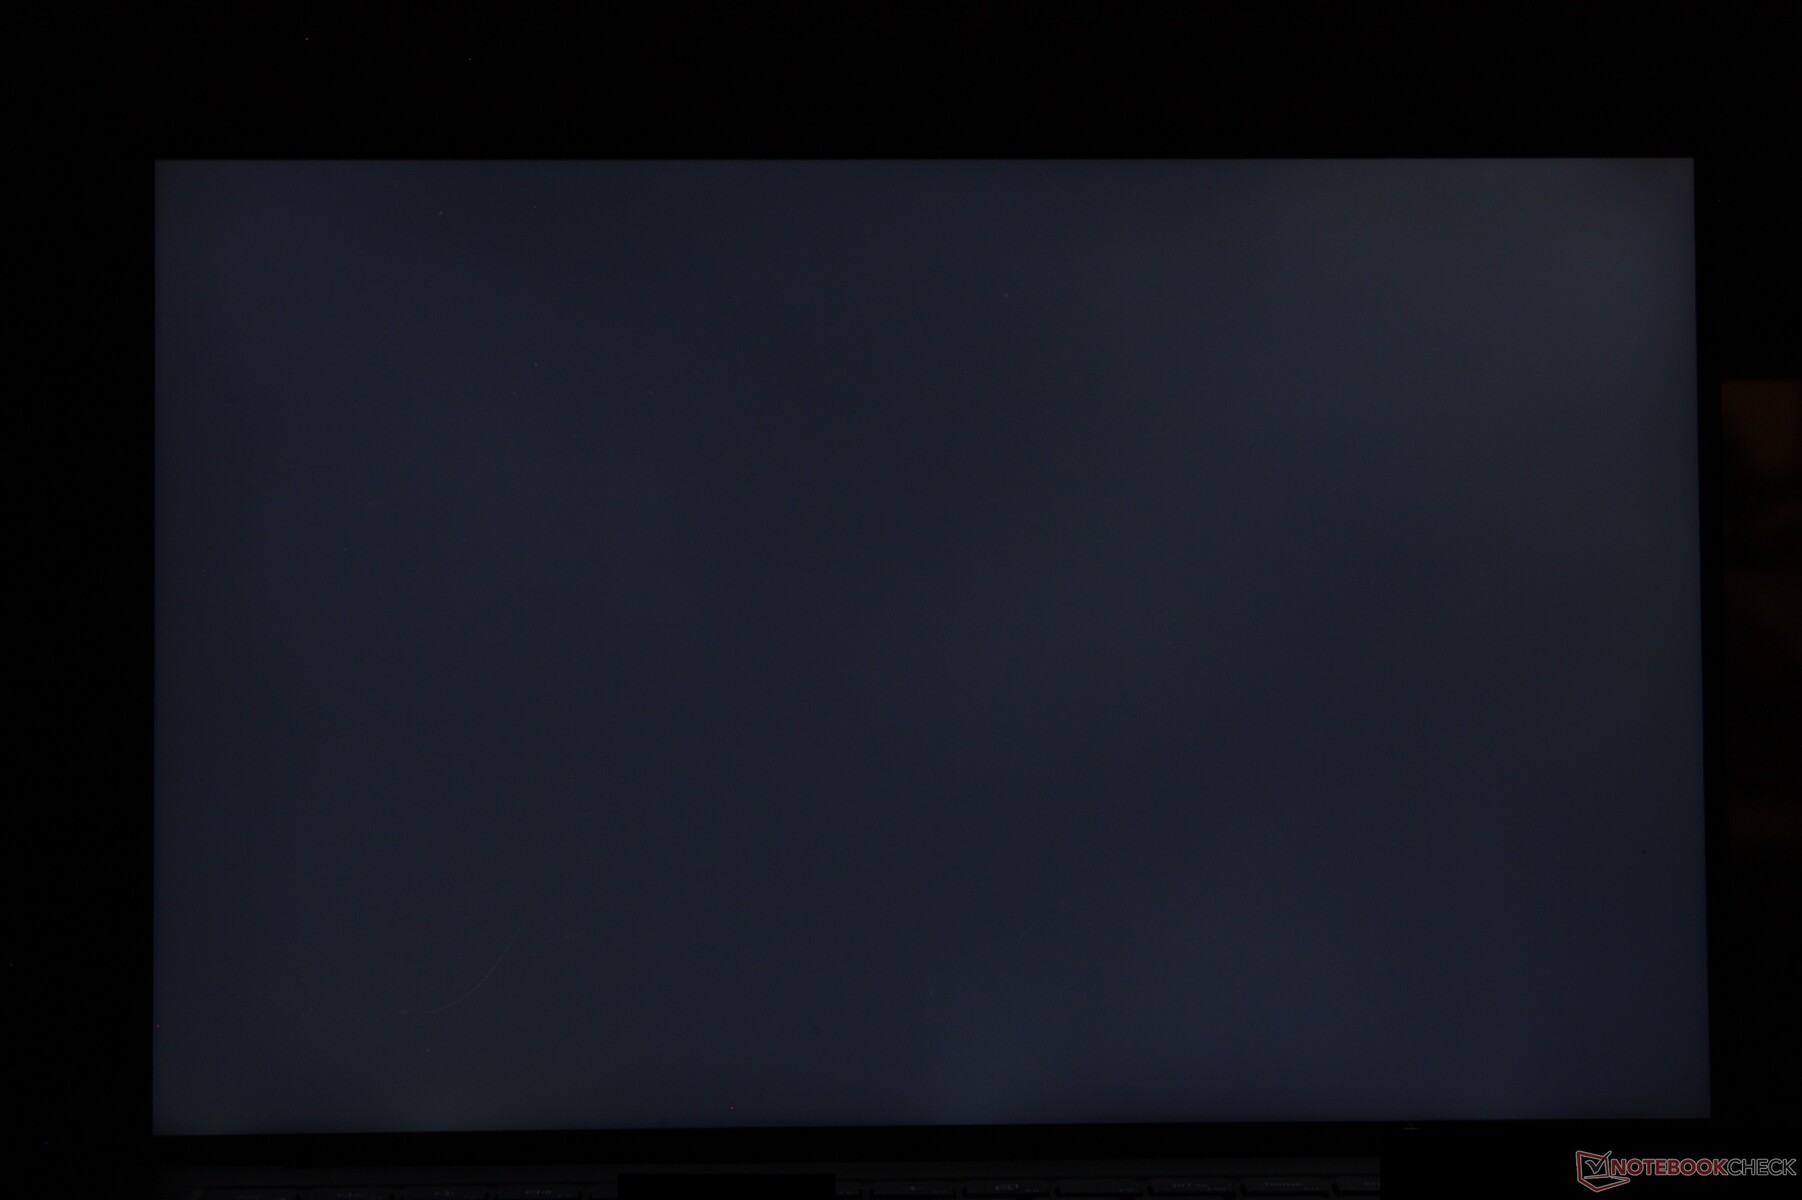
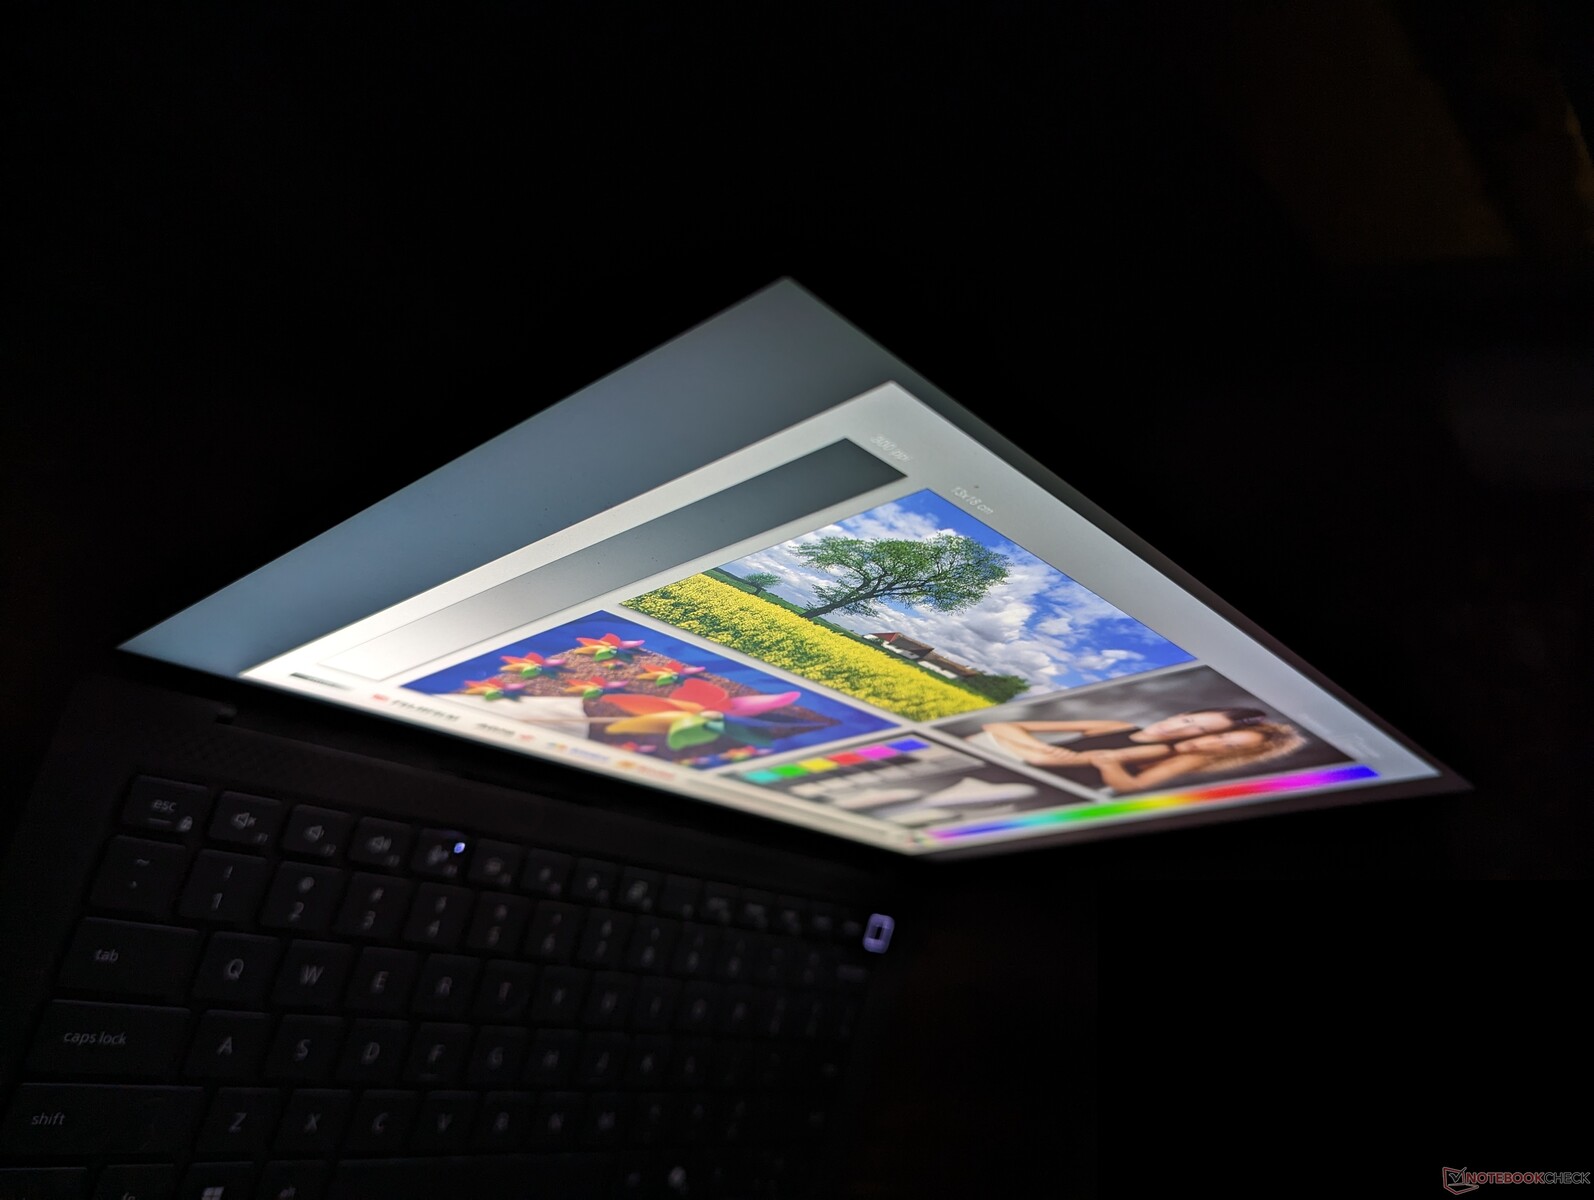
Distribuzione della luminosità: 90 %
Al centro con la batteria: 485.1 cd/m²
Contrasto: 1277:1 (Nero: 0.38 cd/m²)
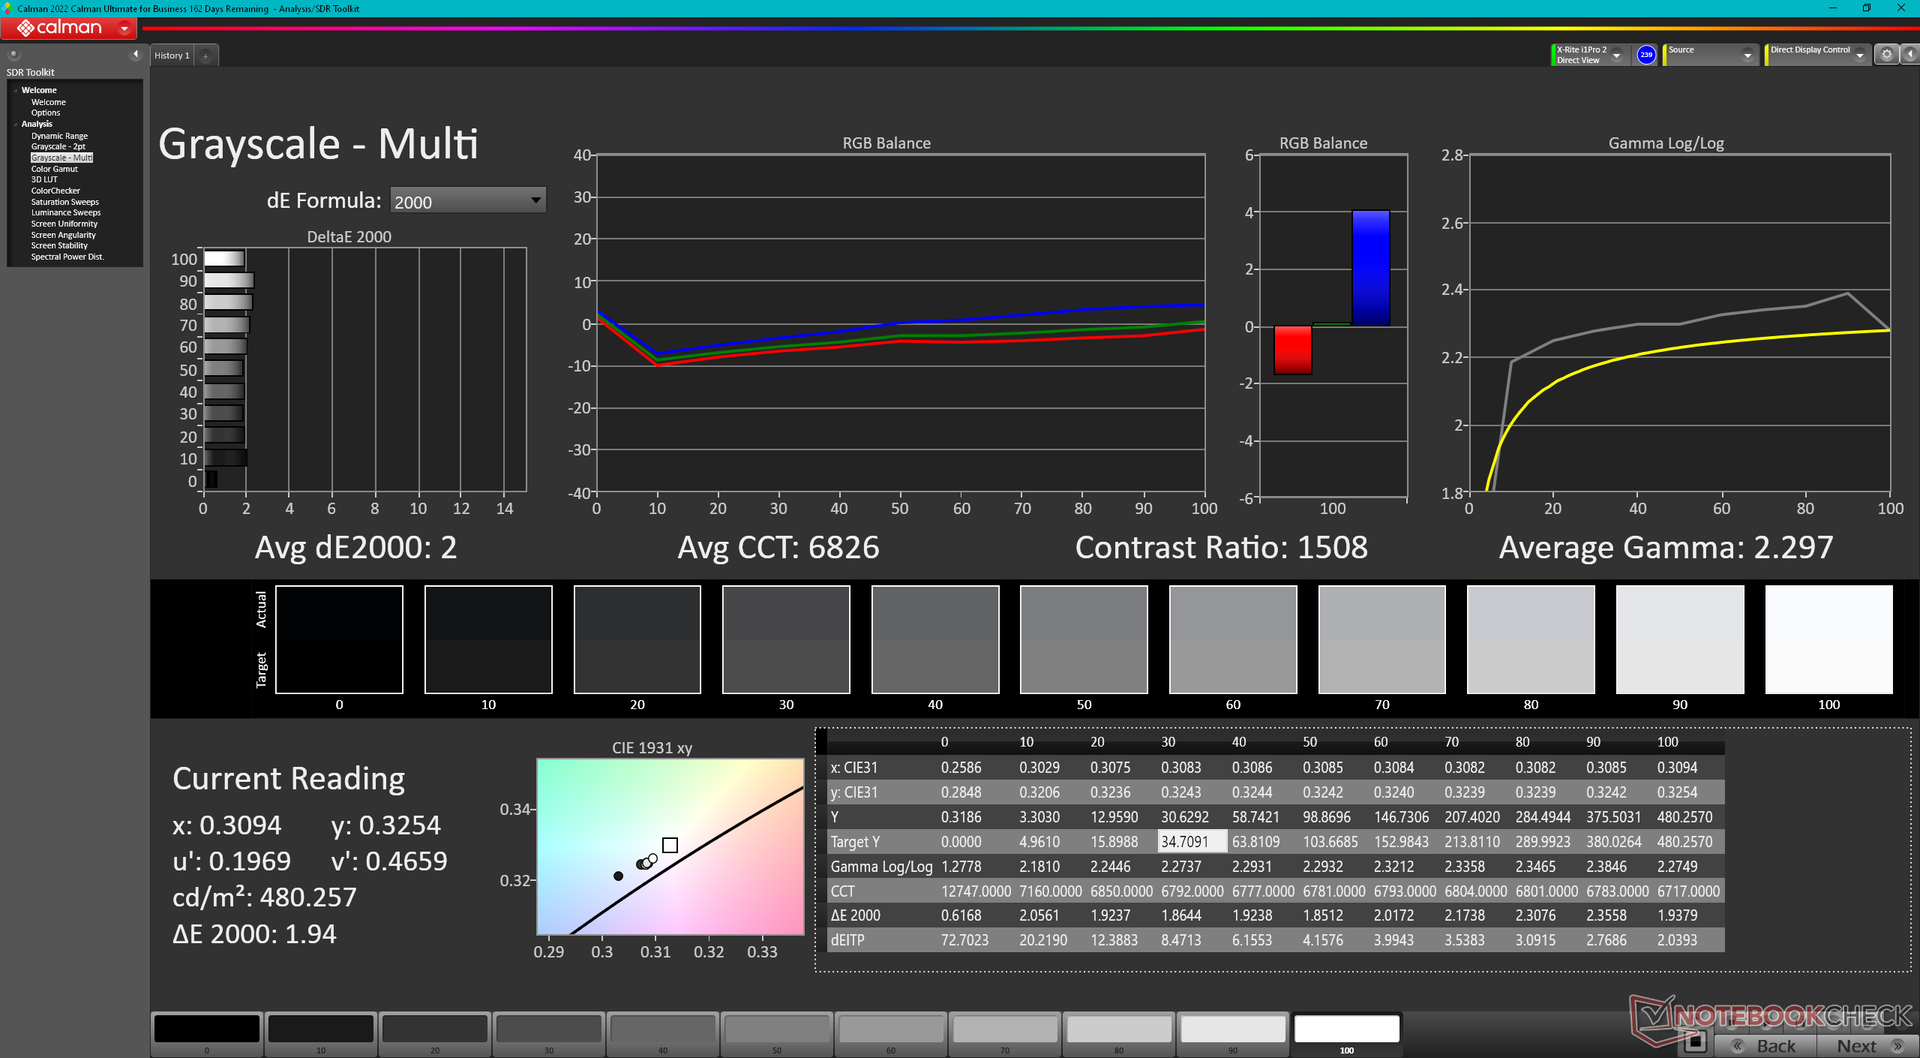
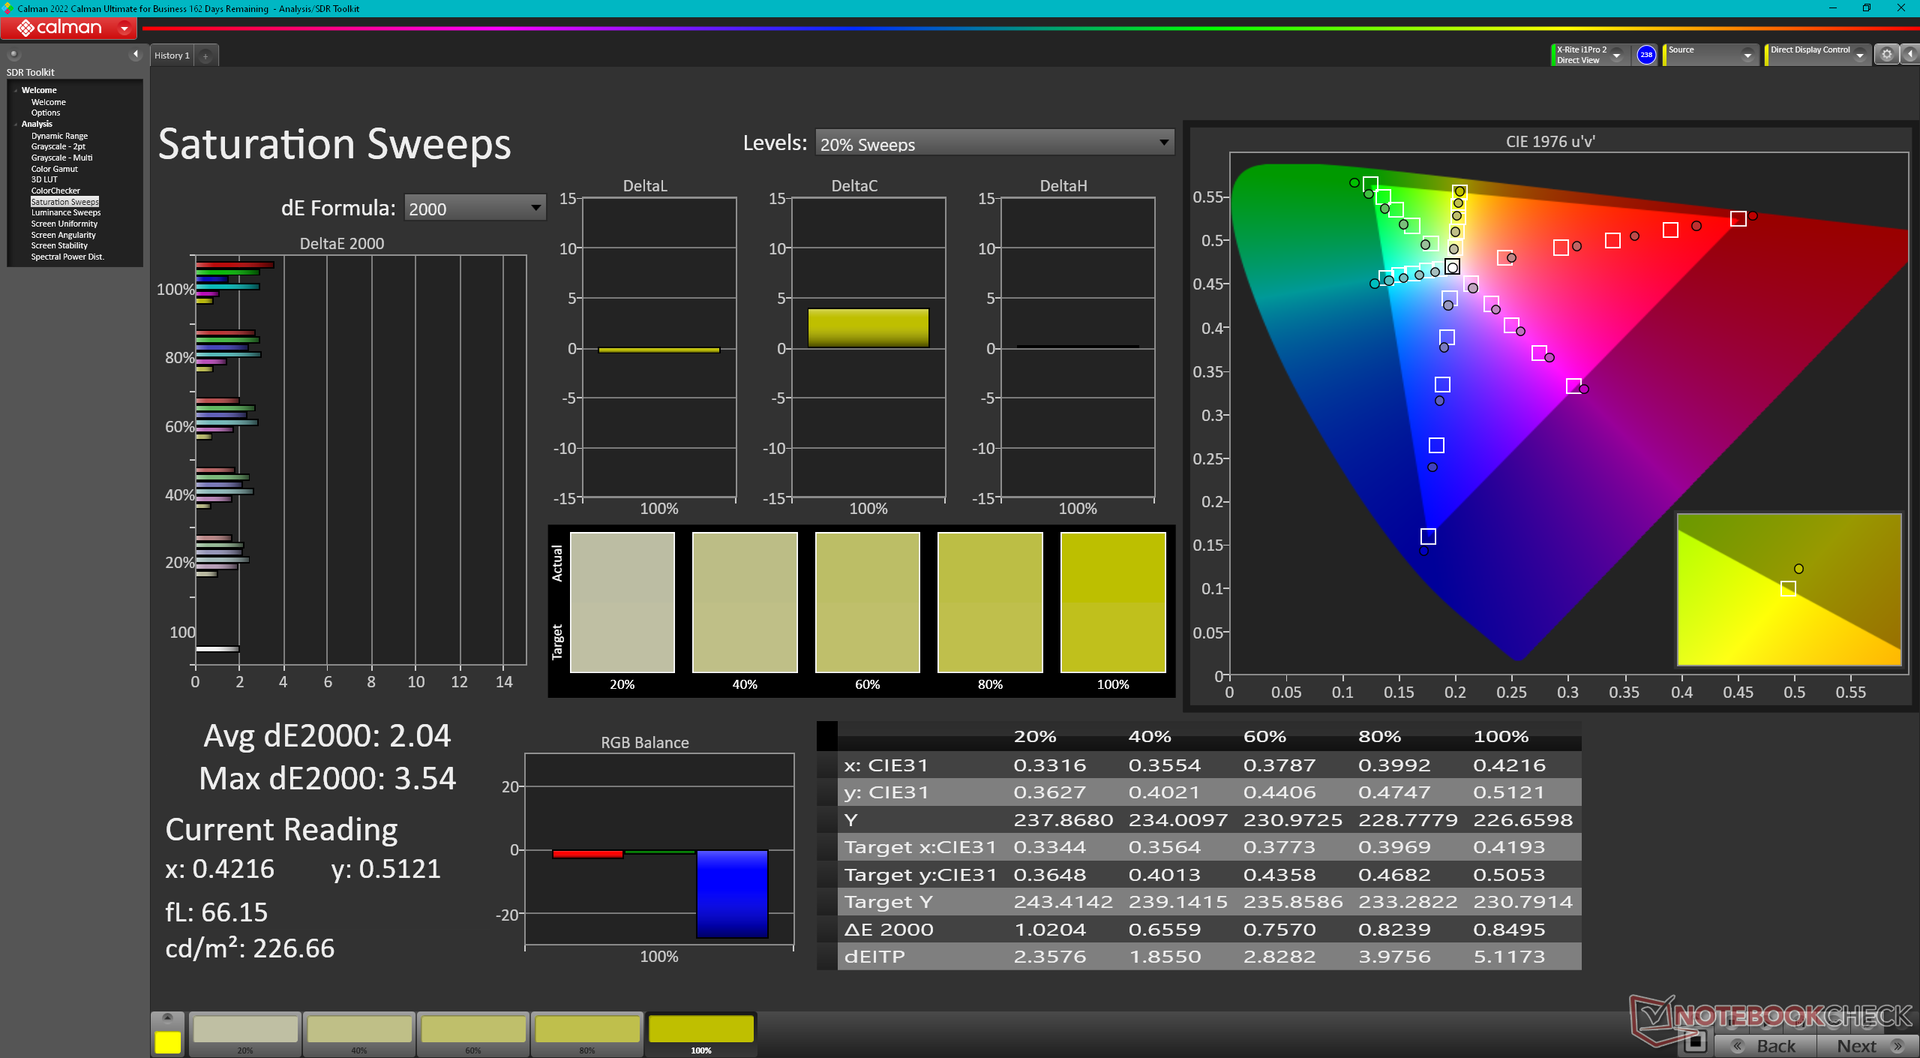
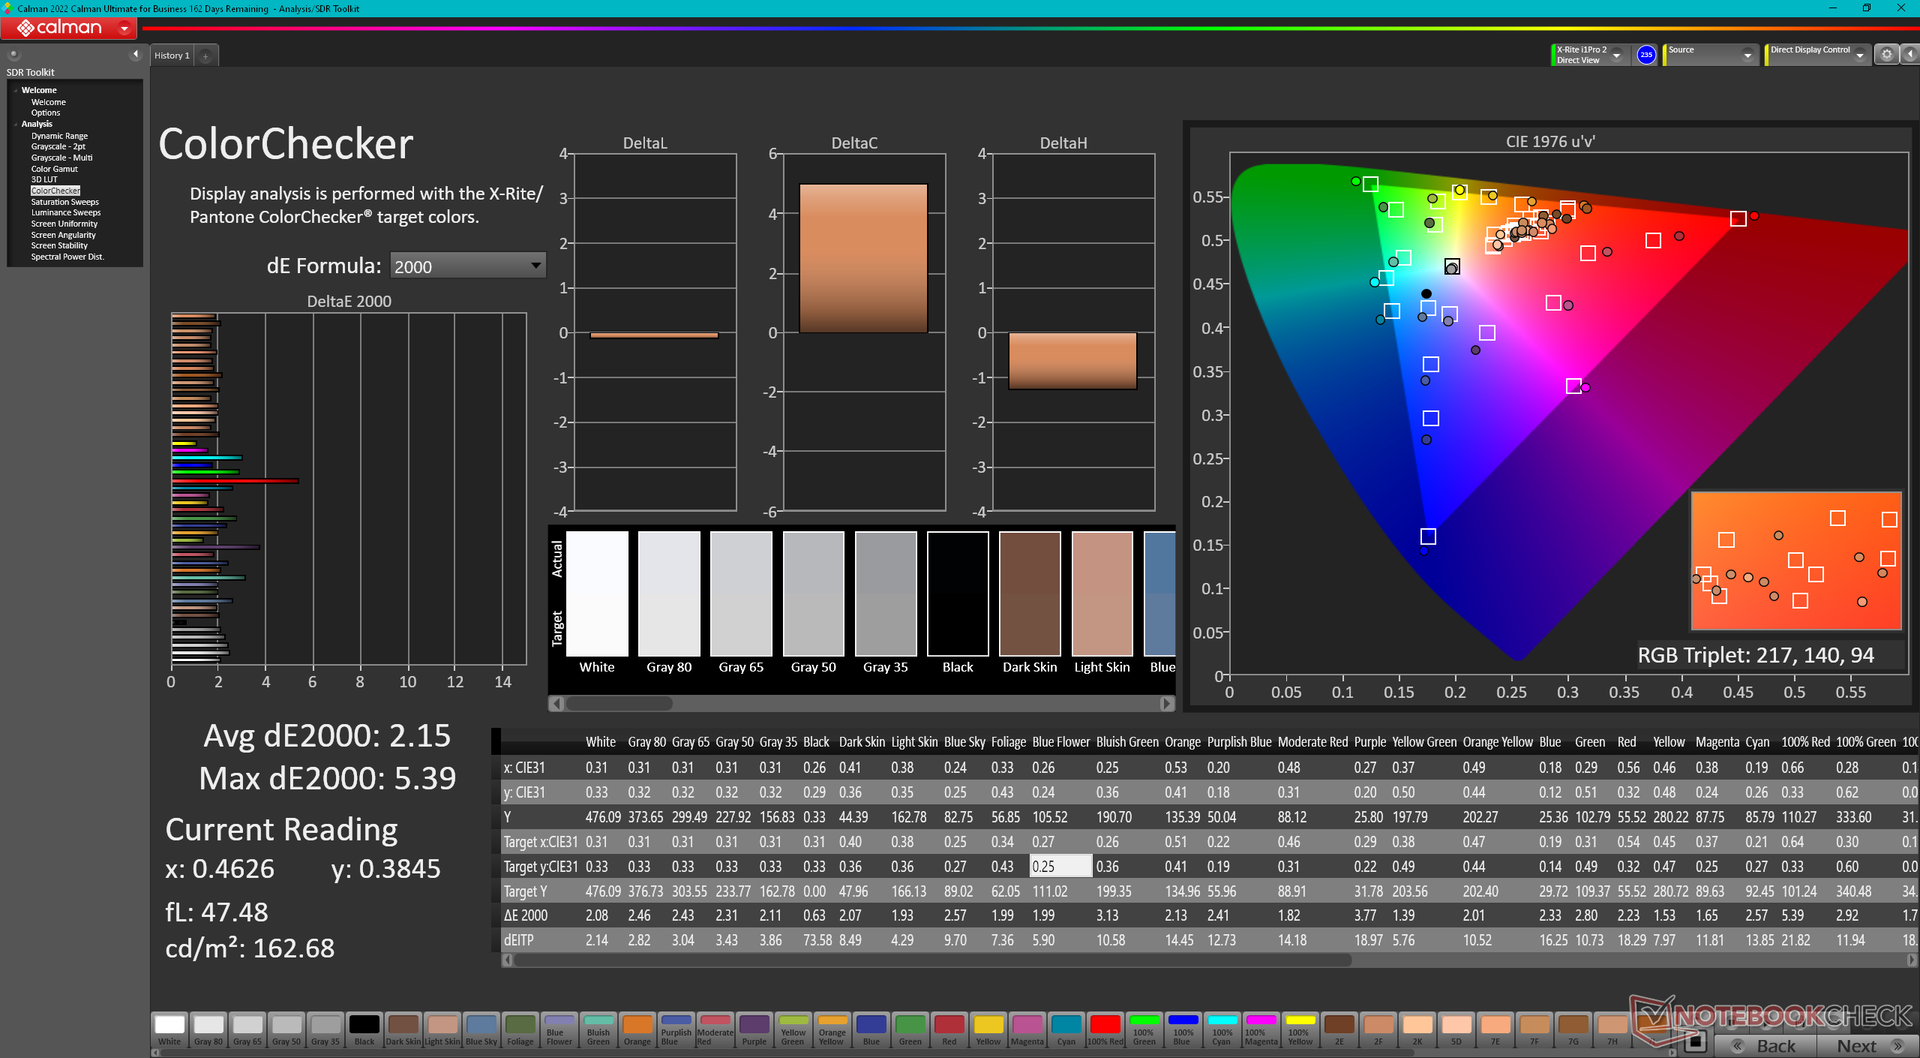
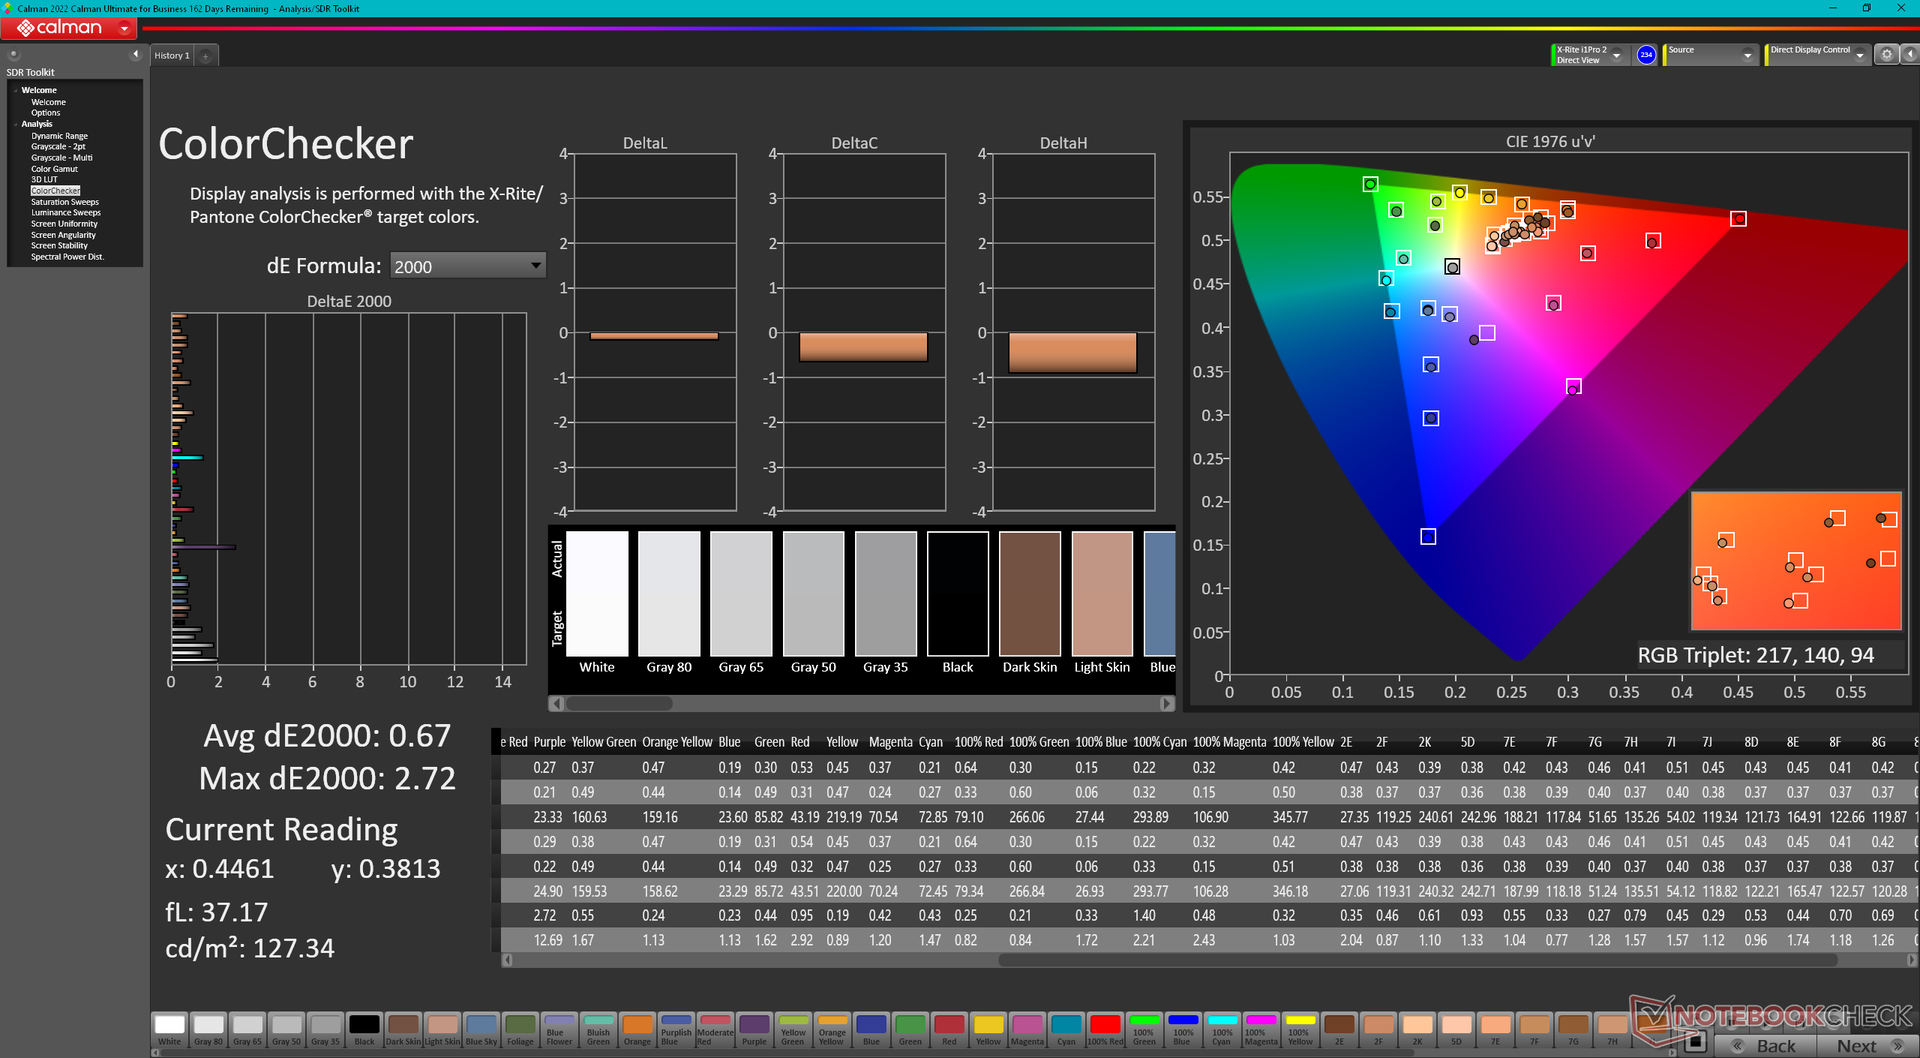
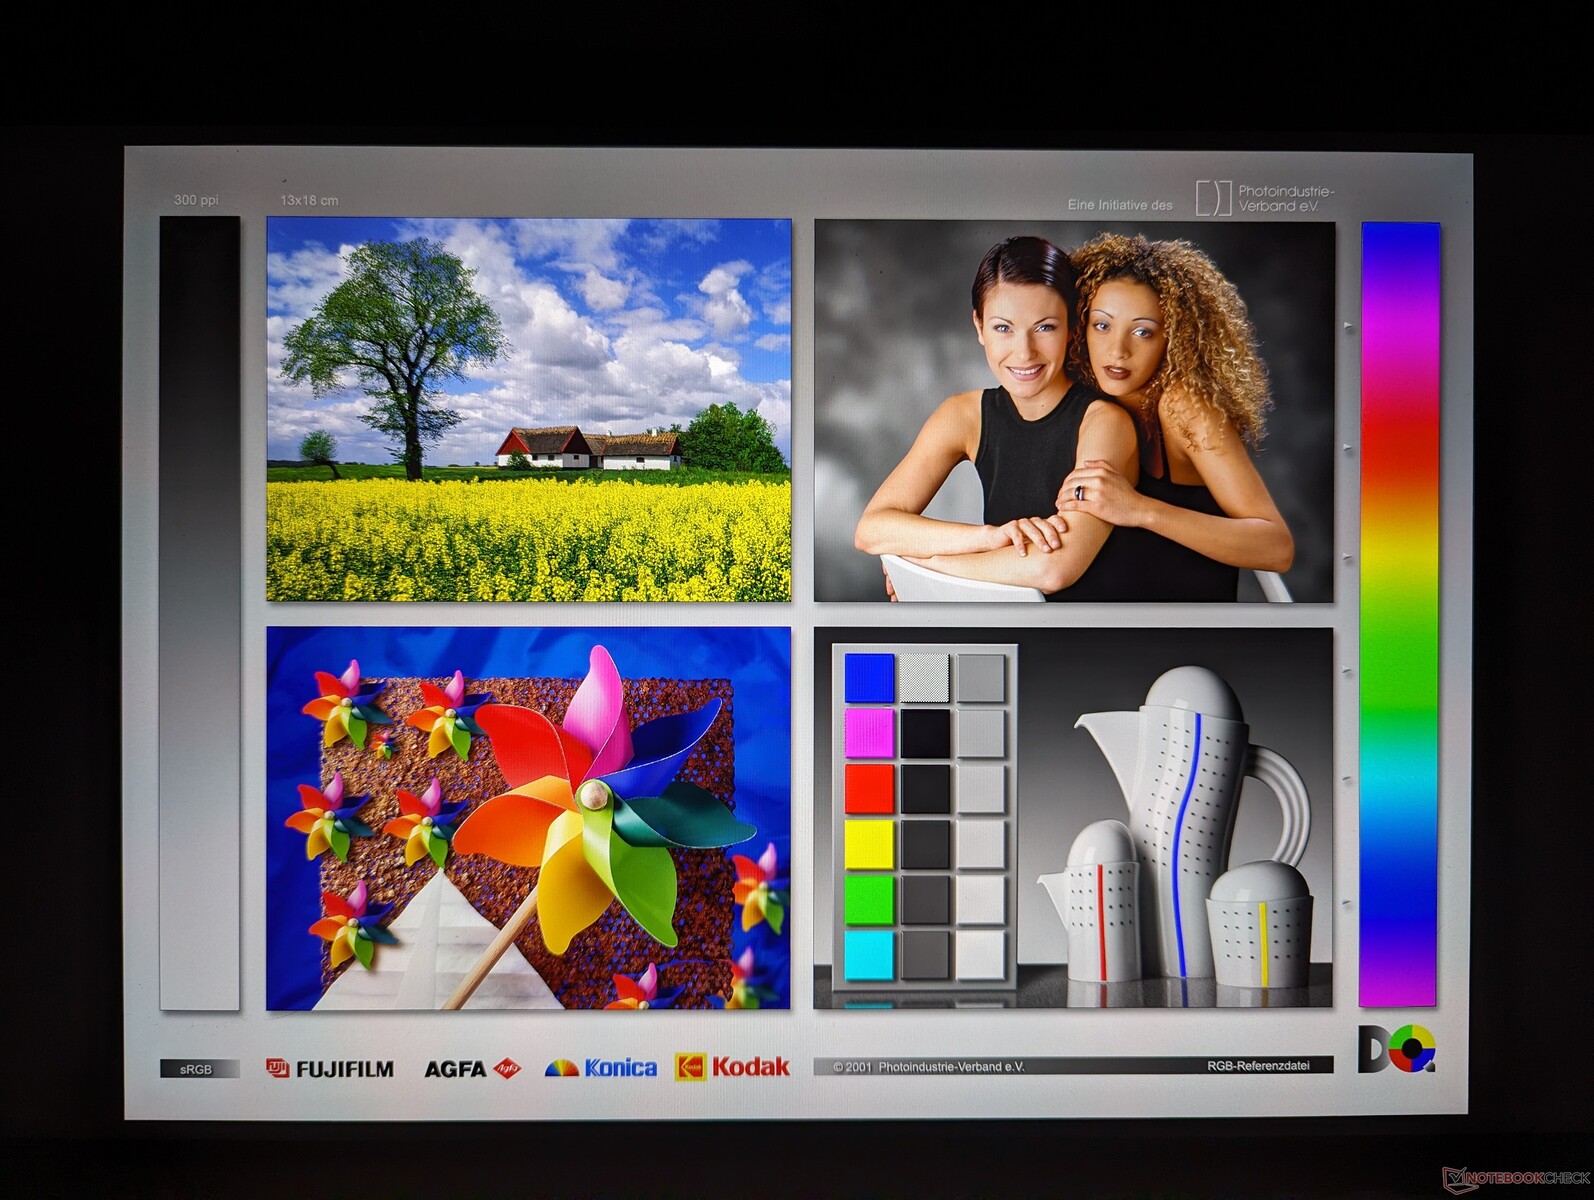
ΔE ColorChecker Calman: 2.15 | ∀{0.5-29.43 Ø4.72}
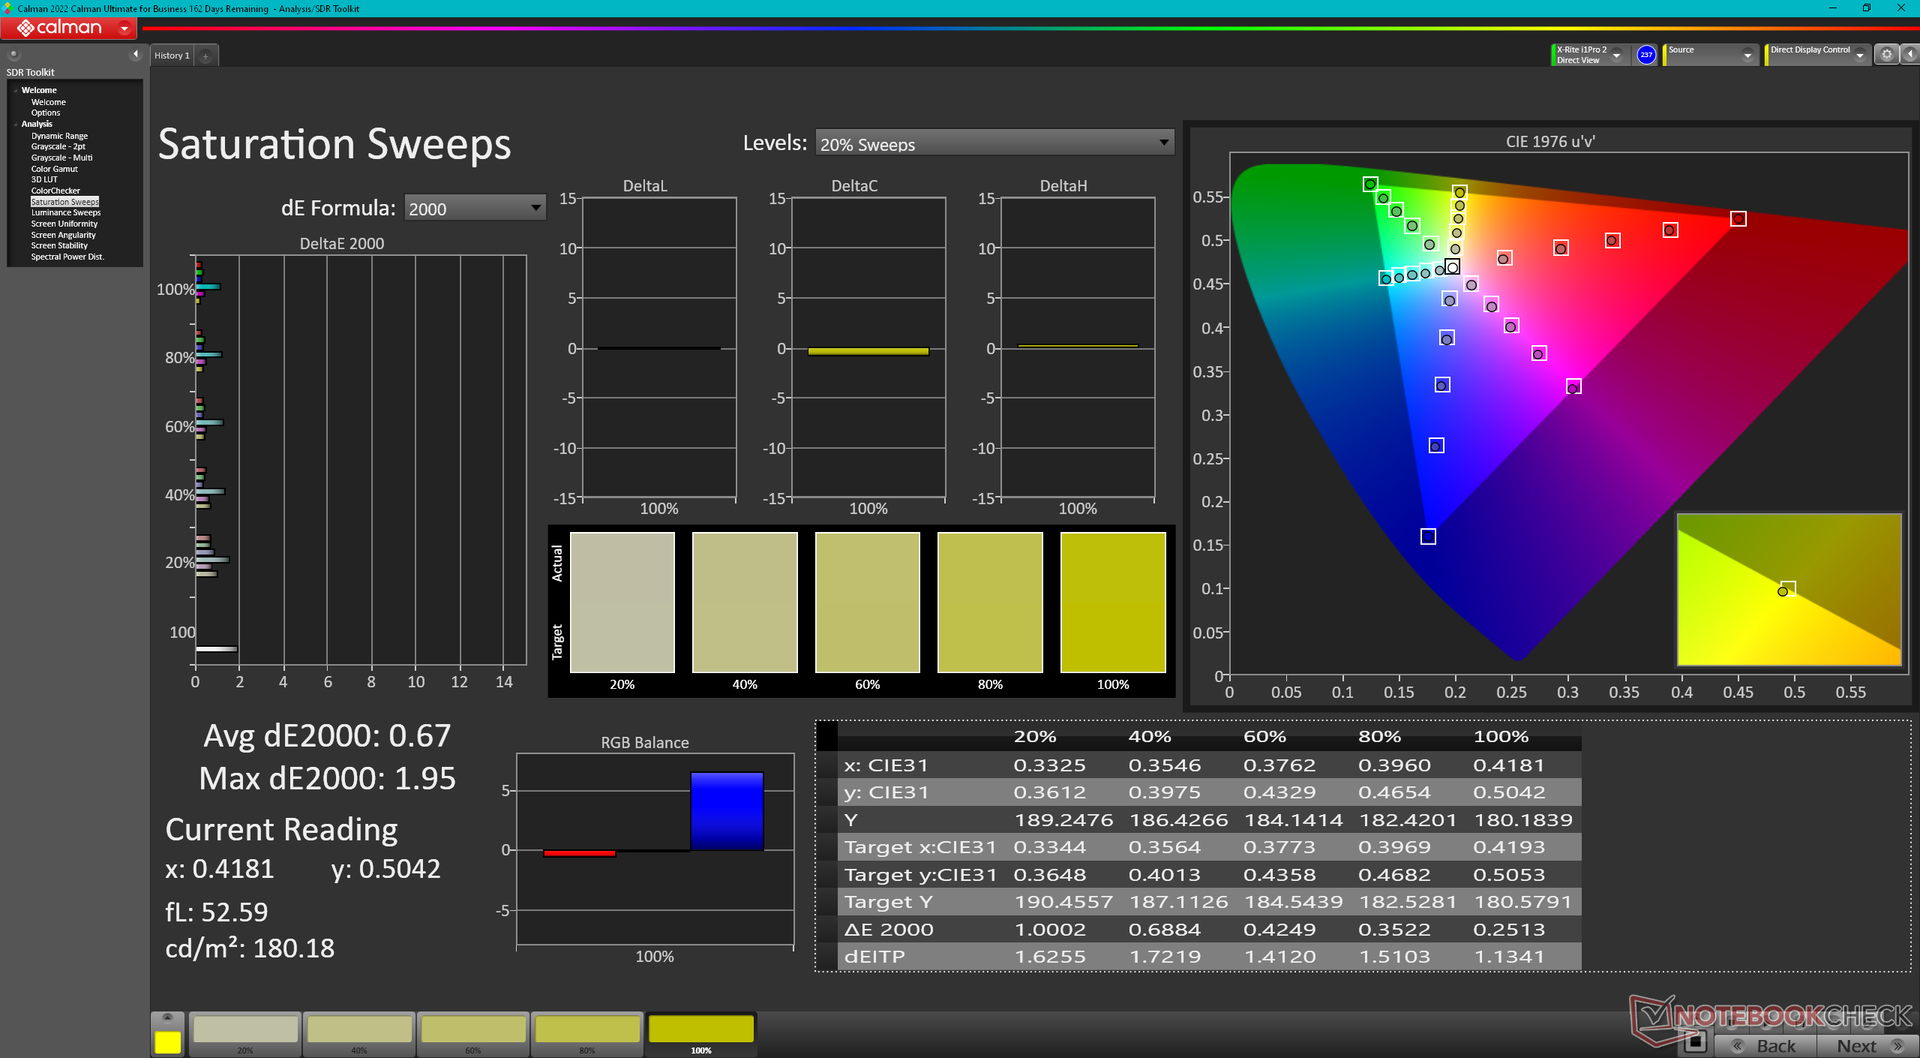
calibrated: 0.67
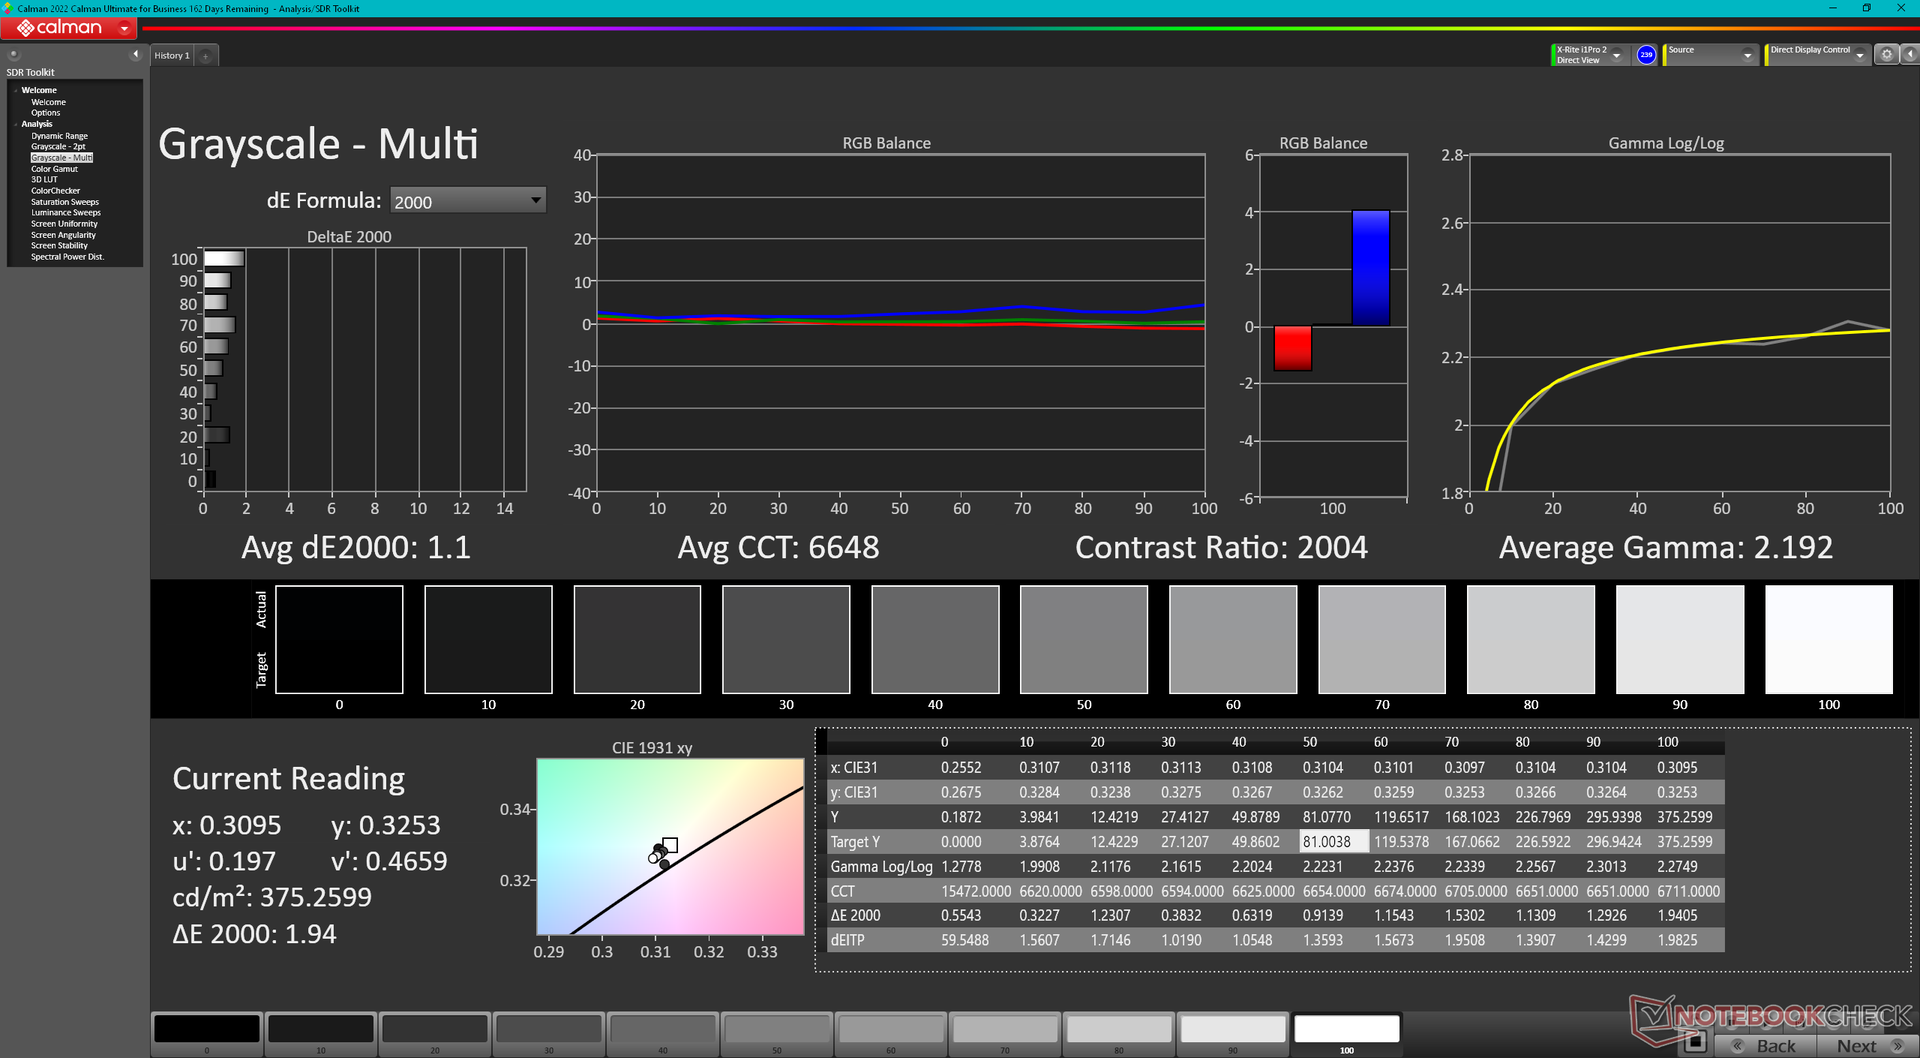
ΔE Greyscale Calman: 2 | ∀{0.09-98 Ø4.97}
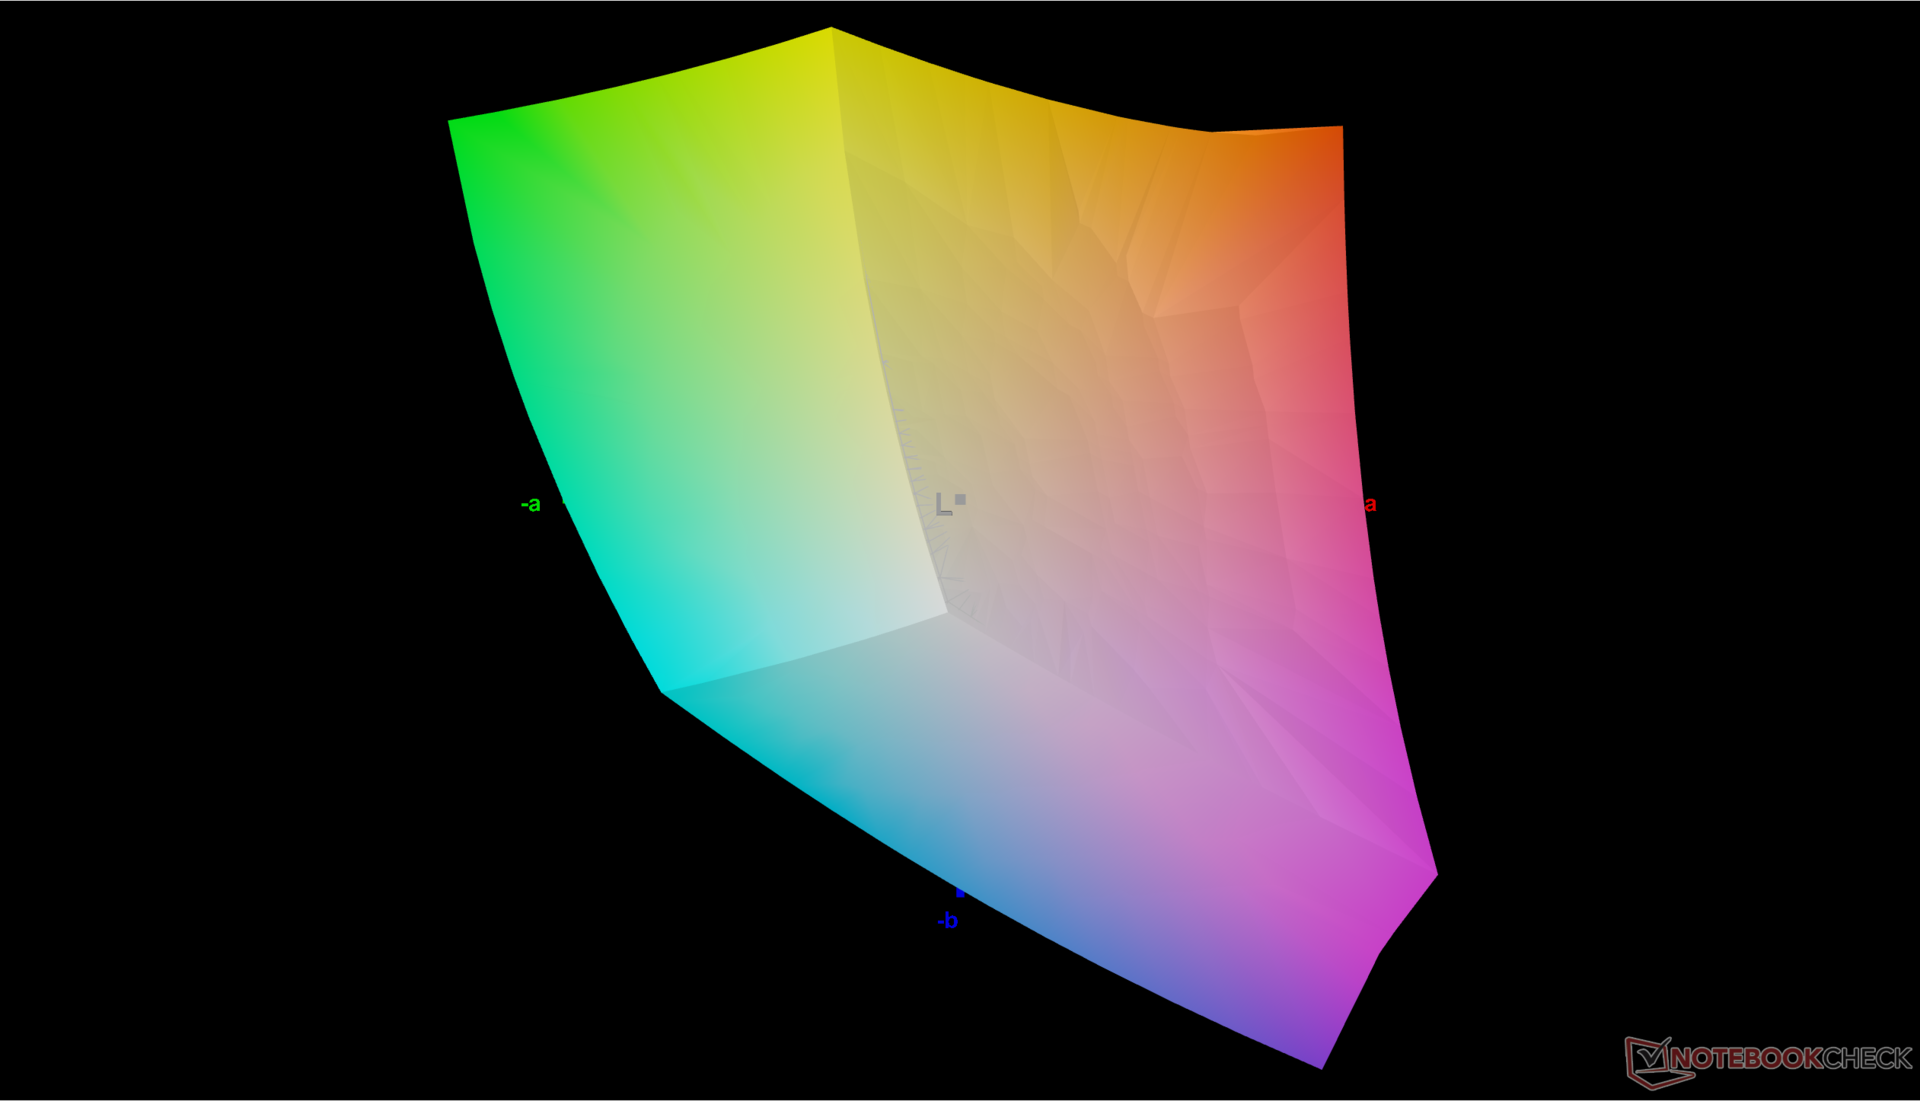
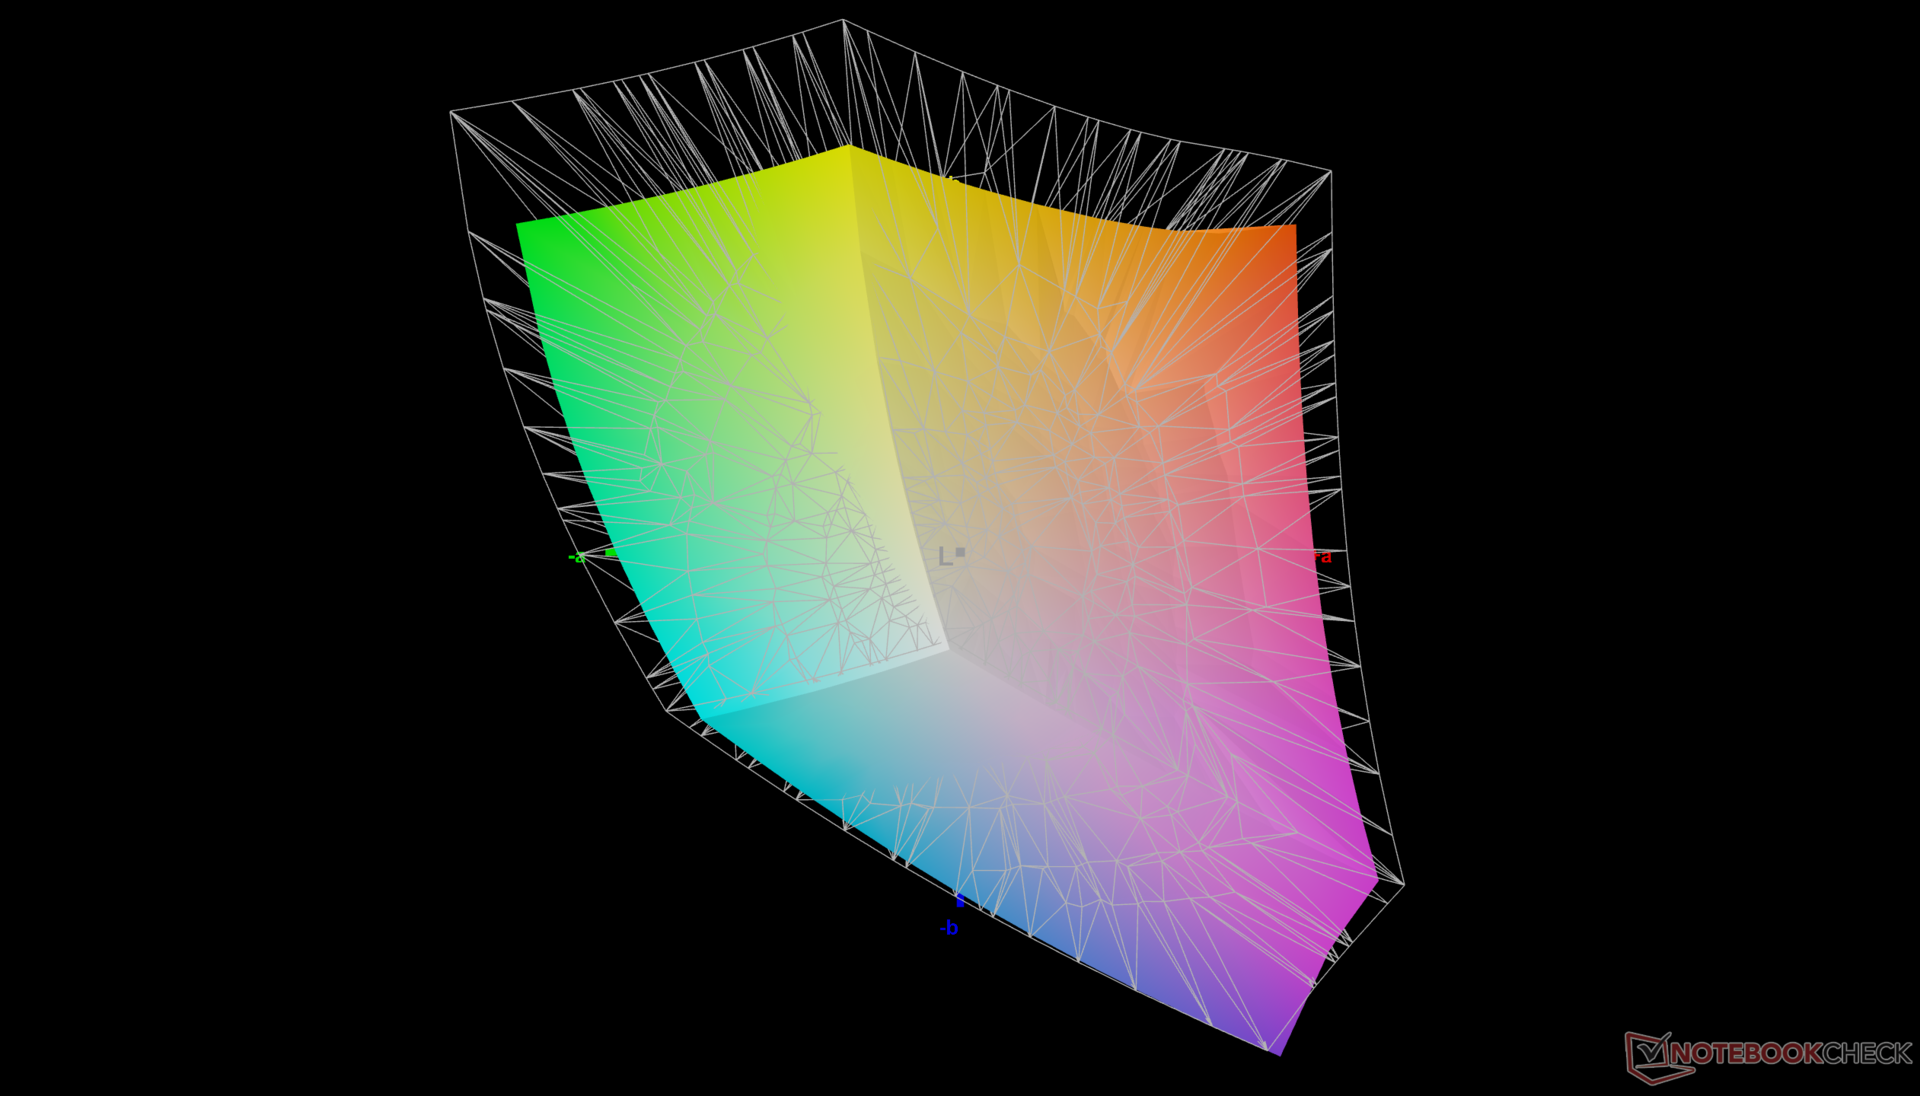
79.5% AdobeRGB 1998 (Argyll 3D)
100% sRGB (Argyll 3D)
79.7% Display P3 (Argyll 3D)
Gamma: 2.3
CCT: 6826 K
| Dell Precision 5000 5490 AU Optronics B140QAN, IPS, 2560x1600, 14" | Lenovo ThinkPad P14s G4 21HF0017GE ATNA40YK15-0, OLED, 2880x1800, 14" | HP ZBook Firefly 14 G10 A CMN1435, IPS, 1920x1200, 14" | HP ZBook Firefly 14 G9-6B8A2EA CMN1435, IPS, 1920x1200, 14" | Dell Precision 5480 AU Optronics B140QAN, IPS, 2560x1600, 14" | Dell Precision 5000 5470 AU Optronics B140QAN, IPS, 2560x1600, 14" | |
|---|---|---|---|---|---|---|
| Display | 16% | -9% | -8% | -2% | -1% | |
| Display P3 Coverage (%) | 79.7 | 99.9 25% | 68.7 -14% | 69.6 -13% | 77.6 -3% | 79.3 -1% |
| sRGB Coverage (%) | 100 | 100 0% | 98.2 -2% | 99.9 0% | 99.8 0% | 100 0% |
| AdobeRGB 1998 Coverage (%) | 79.5 | 97 22% | 70.8 -11% | 71.1 -11% | 78 -2% | 78.7 -1% |
| Response Times | 94% | 9% | 7% | 20% | 2% | |
| Response Time Grey 50% / Grey 80% * (ms) | 52.3 ? | 3 ? 94% | 56.2 ? -7% | 56.3 ? -8% | 43.9 ? 16% | 52.4 ? -0% |
| Response Time Black / White * (ms) | 33.3 ? | 2.2 ? 93% | 25.2 ? 24% | 26.2 ? 21% | 25.3 ? 24% | 32.4 ? 3% |
| PWM Frequency (Hz) | 360 ? | |||||
| PWM Amplitude * (%) | 25 | |||||
| Screen | -121% | -8% | -19% | 4% | -3% | |
| Brightness middle (cd/m²) | 485.1 | 432 -11% | 397 -18% | 432 -11% | 472.8 -3% | 537 11% |
| Brightness (cd/m²) | 471 | 432 -8% | 367 -22% | 407 -14% | 469 0% | 518 10% |
| Brightness Distribution (%) | 90 | 98 9% | 86 -4% | 91 1% | 87 -3% | 94 4% |
| Black Level * (cd/m²) | 0.38 | 0.25 34% | 0.28 26% | 0.35 8% | 0.33 13% | |
| Contrast (:1) | 1277 | 1588 24% | 1543 21% | 1351 6% | 1627 27% | |
| Colorchecker dE 2000 * | 2.15 | 4.8 -123% | 2.35 -9% | 3.1 -44% | 2.1 2% | 2.97 -38% |
| Colorchecker dE 2000 max. * | 5.39 | 9.2 -71% | 4.68 13% | 5.6 -4% | 5.54 -3% | 5.33 1% |
| Colorchecker dE 2000 calibrated * | 0.67 | 4.9 -631% | 1.15 -72% | 0.8 -19% | 0.59 12% | 0.88 -31% |
| Greyscale dE 2000 * | 2 | 2.3 -15% | 2.4 -20% | 4.5 -125% | 1.7 15% | 2.4 -20% |
| Gamma | 2.3 96% | 2.23 99% | 2.067 106% | 2 110% | 2.26 97% | 2.06 107% |
| CCT | 6826 95% | 6391 102% | 6409 101% | 6528 100% | 6493 100% | 6668 97% |
| Media totale (Programma / Settaggio) | -4% /
-51% | -3% /
-6% | -7% /
-13% | 7% /
5% | -1% /
-2% |
* ... Meglio usare valori piccoli
Il display è ben calibrato, con valori medi di deltaE della scala di grigi e del colore di appena 2 e 2,15, rispettivamente. Solo sRGB è pienamente supportato su tutte le configurazioni.
Tempi di risposta del Display
| ↔ Tempi di risposta dal Nero al Bianco | ||
|---|---|---|
| 33.3 ms ... aumenta ↗ e diminuisce ↘ combinato | ↗ 16.2 ms Incremento | 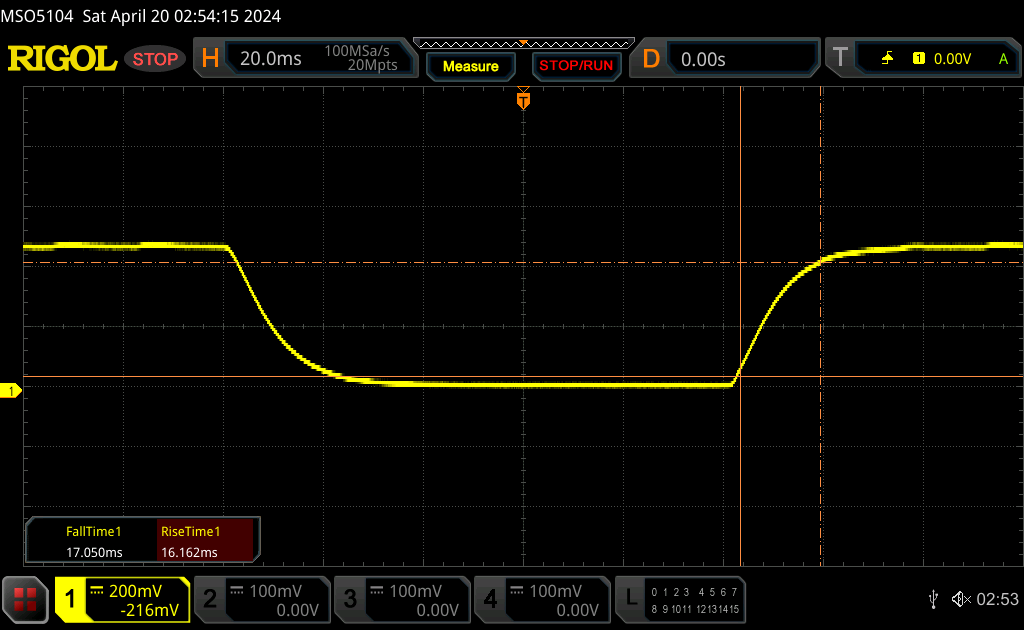 |
| ↘ 17.1 ms Calo | ||
| Lo schermo mostra tempi di risposta lenti nei nostri tests e sarà insoddisfacente per i gamers. In confronto, tutti i dispositivi di test variano da 0.1 (minimo) a 240 (massimo) ms. » 90 % di tutti i dispositivi è migliore. Questo significa che i tempi di risposta rilevati sono peggiori rispetto alla media di tutti i dispositivi testati (19.8 ms). | ||
| ↔ Tempo di risposta dal 50% Grigio all'80% Grigio | ||
| 52.3 ms ... aumenta ↗ e diminuisce ↘ combinato | ↗ 23.6 ms Incremento | 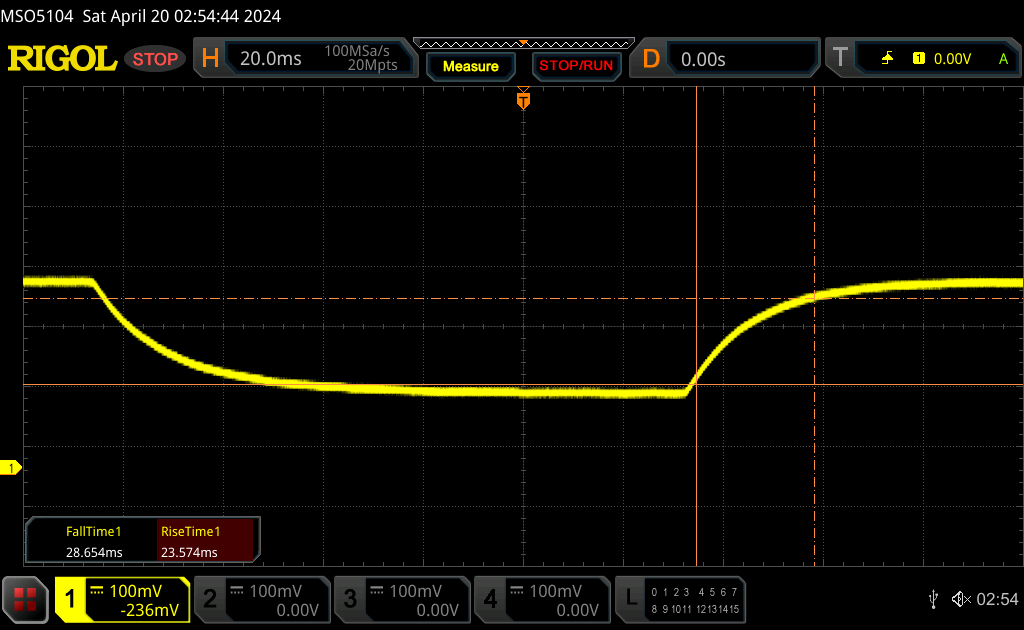 |
| ↘ 28.7 ms Calo | ||
| Lo schermo mostra tempi di risposta lenti nei nostri tests e sarà insoddisfacente per i gamers. In confronto, tutti i dispositivi di test variano da 0.165 (minimo) a 636 (massimo) ms. » 89 % di tutti i dispositivi è migliore. Questo significa che i tempi di risposta rilevati sono peggiori rispetto alla media di tutti i dispositivi testati (31 ms). | ||
Sfarfallio dello schermo / PWM (Pulse-Width Modulation)
| flickering dello schermo / PWM non rilevato | 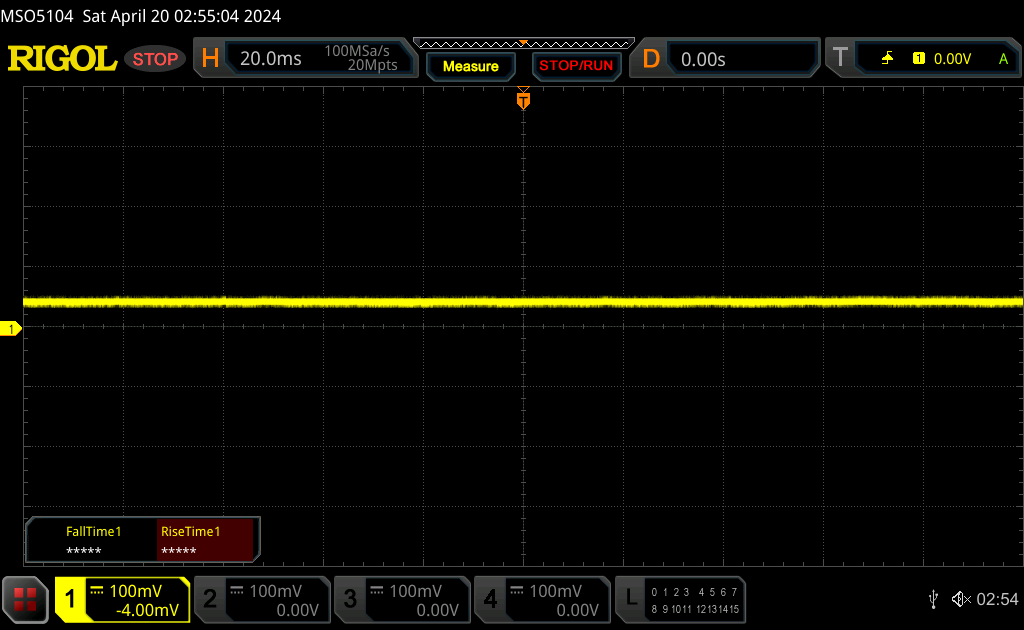 | ||
In confronto: 52 % di tutti i dispositivi testati non utilizza PWM per ridurre la luminosita' del display. Se è rilevato PWM, una media di 7772 (minimo: 5 - massimo: 343500) Hz è stata rilevata. | |||


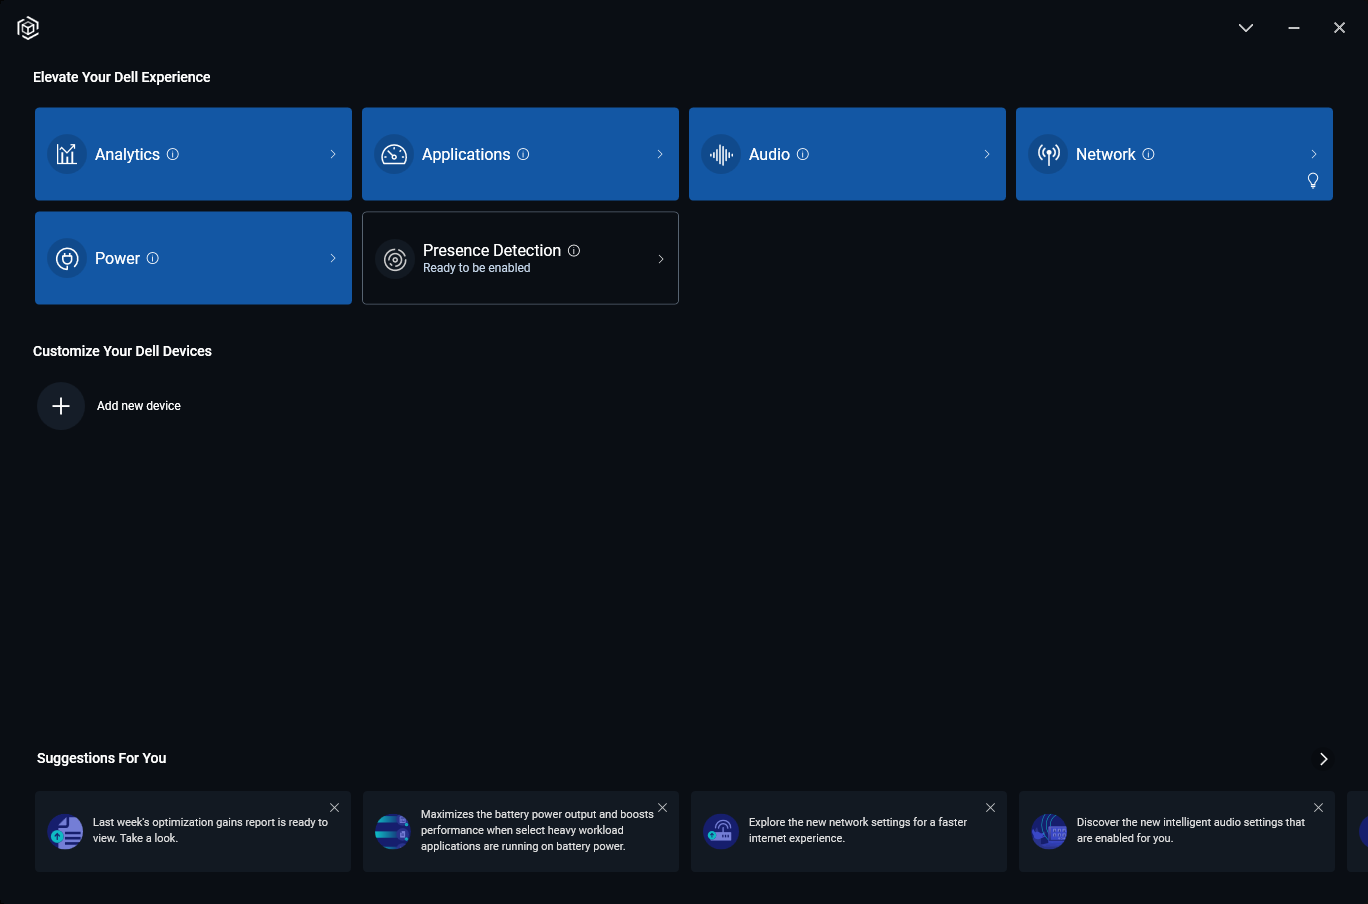
Prestazioni - Tutto sull'AI
Condizioni del test
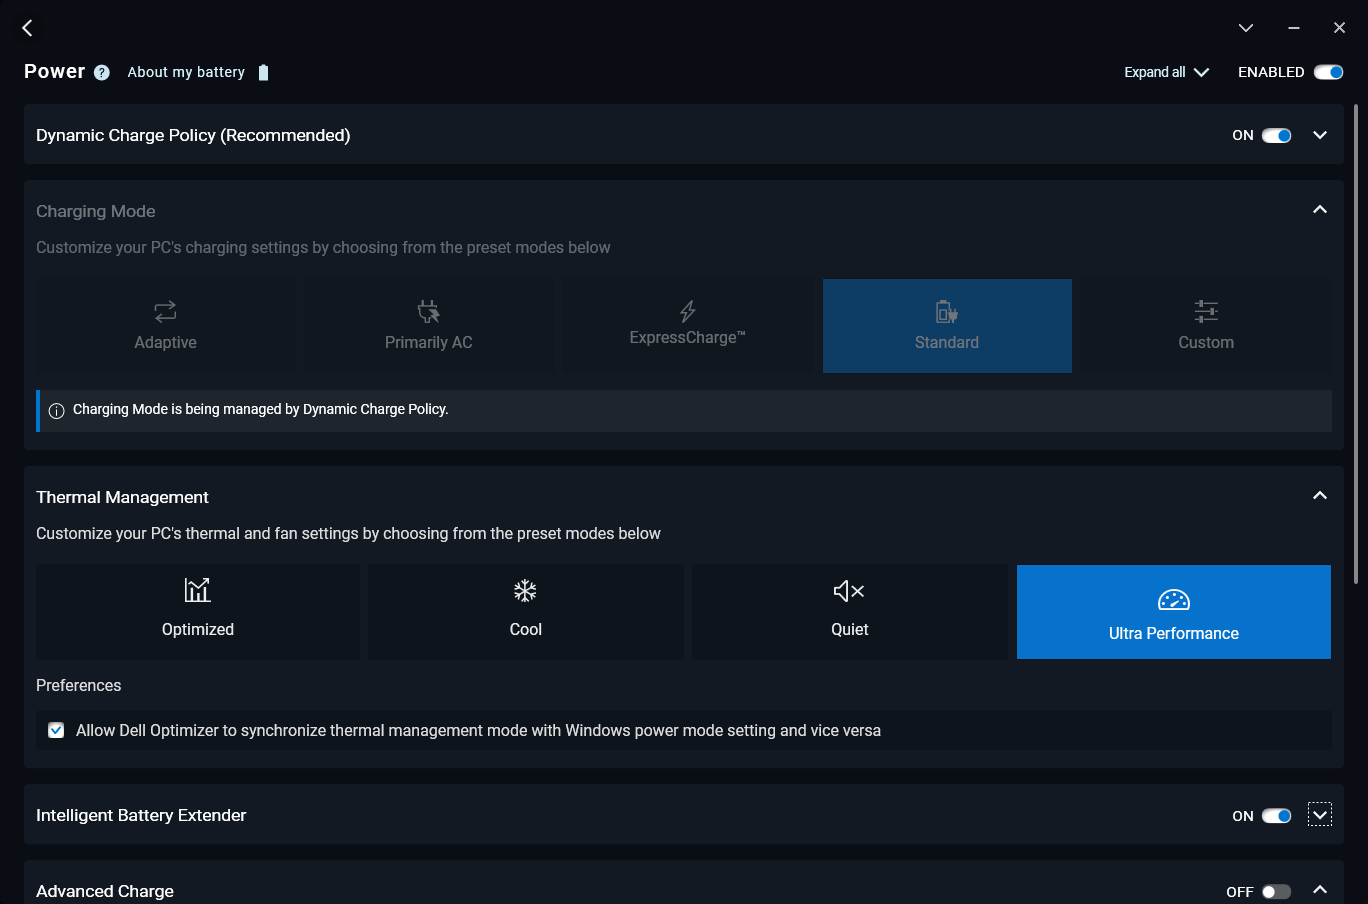
Abbiamo impostato Dell Optimizer sulla modalità Ultra Performance e la GPU su Nvidia prima di eseguire i benchmark qui sotto.
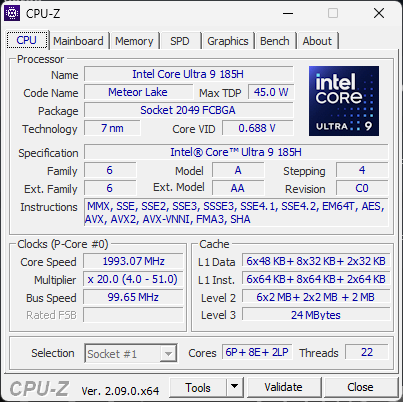
Processore
Le prestazioni grezze della CPU rimangono piatte rispetto al Core i9-13900H nel modello Precision 5480 dello scorso anno. Gli eventuali vantaggi sono marginali, nella migliore delle ipotesi, fino al 5 percento, ma anche questo piccolo delta può ridursi una volta che si tiene conto delle limitazioni di Turbo Boost, come dimostrano i risultati del nostro ciclo CineBench R15 xT qui sotto.
Se le funzioni AI integrate non sono importanti, allora il meno costoso Ryzen 7 Pro 7840HS su modelli concorrenti come la serie HP Firefly 14 possono fornire essenzialmente le stesse prestazioni del più recente Core Ultra 9 185H.
Il downgrade al Core Ultra 5 135H dovrebbe avere un impatto sulle prestazioni del processore del 15-20%, in base alla nostra esperienza con il Core i5-13500H laptop.
Cinebench R15 Multi Loop
Cinebench R23: Multi Core | Single Core
Cinebench R20: CPU (Multi Core) | CPU (Single Core)
Cinebench R15: CPU Multi 64Bit | CPU Single 64Bit
Blender: v2.79 BMW27 CPU
7-Zip 18.03: 7z b 4 | 7z b 4 -mmt1
Geekbench 6.7: Multi-Core | Single-Core
Geekbench 5.5: Multi-Core | Single-Core
HWBOT x265 Benchmark v2.2: 4k Preset
LibreOffice : 20 Documents To PDF
R Benchmark 2.5: Overall mean
| CPU Performance rating | |
| Dell Precision 5480 | |
| HP ZBook Power 15 G10 | |
| Media Intel Core Ultra 9 185H | |
| Dell Precision 5000 5490 | |
| Lenovo ThinkPad P14s G4 21HF0017GE | |
| Lenovo ThinkPad P14s G4 21K5000LGE | |
| HP ZBook Power 15 G9 6B8C4EA -2! | |
| Dell Precision 5000 5470 -2! | |
| Asus VivoBook 14X K3405 -2! | |
| HP ZBook Firefly 14 G10 A | |
| Lenovo ThinkPad P14s G3 AMD 21J6S05000 -2! | |
| HP ZBook Firefly 14 G9-6B8A2EA -2! | |
| Lenovo ThinkPad P15v G3 21EM001AGE -2! | |
| Dell Precision 5000 5560 -4! | |
| Lenovo ThinkPad P15v G2 21A9000XGE -3! | |
| Lenovo ThinkPad P14s Gen1-20Y10002GE -2! | |
| Geekbench 6.7 / Multi-Core | |
| Dell Precision 5480 | |
| Dell Precision 5000 5490 | |
| Media Intel Core Ultra 9 185H (9140 - 14540, n=20) | |
| HP ZBook Power 15 G10 | |
| Lenovo ThinkPad P14s G4 21HF0017GE | |
| Lenovo ThinkPad P14s G4 21K5000LGE | |
| HP ZBook Firefly 14 G10 A | |
| Geekbench 6.7 / Single-Core | |
| Dell Precision 5480 | |
| Lenovo ThinkPad P14s G4 21HF0017GE | |
| HP ZBook Power 15 G10 | |
| Lenovo ThinkPad P14s G4 21K5000LGE | |
| Media Intel Core Ultra 9 185H (1490 - 2573, n=20) | |
| Dell Precision 5000 5490 | |
| HP ZBook Firefly 14 G10 A | |
Cinebench R23: Multi Core | Single Core
Cinebench R20: CPU (Multi Core) | CPU (Single Core)
Cinebench R15: CPU Multi 64Bit | CPU Single 64Bit
Blender: v2.79 BMW27 CPU
7-Zip 18.03: 7z b 4 | 7z b 4 -mmt1
Geekbench 6.7: Multi-Core | Single-Core
Geekbench 5.5: Multi-Core | Single-Core
HWBOT x265 Benchmark v2.2: 4k Preset
LibreOffice : 20 Documents To PDF
R Benchmark 2.5: Overall mean
* ... Meglio usare valori piccoli
AIDA64: FP32 Ray-Trace | FPU Julia | CPU SHA3 | CPU Queen | FPU SinJulia | FPU Mandel | CPU AES | CPU ZLib | FP64 Ray-Trace | CPU PhotoWorxx
| Performance rating | |
| Media Intel Core Ultra 9 185H | |
| Dell Precision 5480 | |
| Dell Precision 5000 5490 | |
| HP ZBook Firefly 14 G10 A | |
| Dell Precision 5000 5470 | |
| Lenovo ThinkPad P14s G4 21HF0017GE | |
| HP ZBook Firefly 14 G9-6B8A2EA | |
| AIDA64 / FP32 Ray-Trace | |
| HP ZBook Firefly 14 G10 A | |
| Media Intel Core Ultra 9 185H (9220 - 18676, n=20) | |
| Dell Precision 5480 | |
| Dell Precision 5000 5490 | |
| Dell Precision 5000 5470 | |
| Lenovo ThinkPad P14s G4 21HF0017GE | |
| HP ZBook Firefly 14 G9-6B8A2EA | |
| AIDA64 / FPU Julia | |
| Media Intel Core Ultra 9 185H (48865 - 96463, n=20) | |
| HP ZBook Firefly 14 G10 A | |
| Dell Precision 5000 5490 | |
| Dell Precision 5480 | |
| Dell Precision 5000 5470 | |
| Lenovo ThinkPad P14s G4 21HF0017GE | |
| HP ZBook Firefly 14 G9-6B8A2EA | |
| AIDA64 / CPU SHA3 | |
| Media Intel Core Ultra 9 185H (2394 - 4534, n=20) | |
| Dell Precision 5000 5490 | |
| Dell Precision 5480 | |
| HP ZBook Firefly 14 G10 A | |
| Dell Precision 5000 5470 | |
| Lenovo ThinkPad P14s G4 21HF0017GE | |
| HP ZBook Firefly 14 G9-6B8A2EA | |
| AIDA64 / CPU Queen | |
| Dell Precision 5480 | |
| Dell Precision 5000 5470 | |
| Lenovo ThinkPad P14s G4 21HF0017GE | |
| Dell Precision 5000 5490 | |
| Media Intel Core Ultra 9 185H (66785 - 95241, n=20) | |
| HP ZBook Firefly 14 G10 A | |
| HP ZBook Firefly 14 G9-6B8A2EA | |
| AIDA64 / FPU SinJulia | |
| HP ZBook Firefly 14 G10 A | |
| Media Intel Core Ultra 9 185H (7255 - 11392, n=20) | |
| Dell Precision 5000 5490 | |
| Dell Precision 5480 | |
| Dell Precision 5000 5470 | |
| Lenovo ThinkPad P14s G4 21HF0017GE | |
| HP ZBook Firefly 14 G9-6B8A2EA | |
| AIDA64 / FPU Mandel | |
| HP ZBook Firefly 14 G10 A | |
| Media Intel Core Ultra 9 185H (24004 - 48020, n=20) | |
| Dell Precision 5480 | |
| Dell Precision 5000 5490 | |
| Dell Precision 5000 5470 | |
| Lenovo ThinkPad P14s G4 21HF0017GE | |
| HP ZBook Firefly 14 G9-6B8A2EA | |
| AIDA64 / CPU AES | |
| Media Intel Core Ultra 9 185H (53116 - 154066, n=20) | |
| Dell Precision 5000 5490 | |
| Dell Precision 5480 | |
| HP ZBook Firefly 14 G10 A | |
| Lenovo ThinkPad P14s G4 21HF0017GE | |
| HP ZBook Firefly 14 G9-6B8A2EA | |
| Dell Precision 5000 5470 | |
| AIDA64 / CPU ZLib | |
| Media Intel Core Ultra 9 185H (678 - 1341, n=20) | |
| Dell Precision 5000 5490 | |
| Dell Precision 5480 | |
| Lenovo ThinkPad P14s G4 21HF0017GE | |
| HP ZBook Firefly 14 G10 A | |
| HP ZBook Firefly 14 G9-6B8A2EA | |
| Dell Precision 5000 5470 | |
| AIDA64 / FP64 Ray-Trace | |
| HP ZBook Firefly 14 G10 A | |
| Media Intel Core Ultra 9 185H (4428 - 10078, n=20) | |
| Dell Precision 5480 | |
| Dell Precision 5000 5490 | |
| Dell Precision 5000 5470 | |
| Lenovo ThinkPad P14s G4 21HF0017GE | |
| HP ZBook Firefly 14 G9-6B8A2EA | |
| AIDA64 / CPU PhotoWorxx | |
| Dell Precision 5000 5490 | |
| Media Intel Core Ultra 9 185H (44547 - 53918, n=20) | |
| Dell Precision 5480 | |
| Dell Precision 5000 5470 | |
| HP ZBook Firefly 14 G9-6B8A2EA | |
| Lenovo ThinkPad P14s G4 21HF0017GE | |
| HP ZBook Firefly 14 G10 A | |
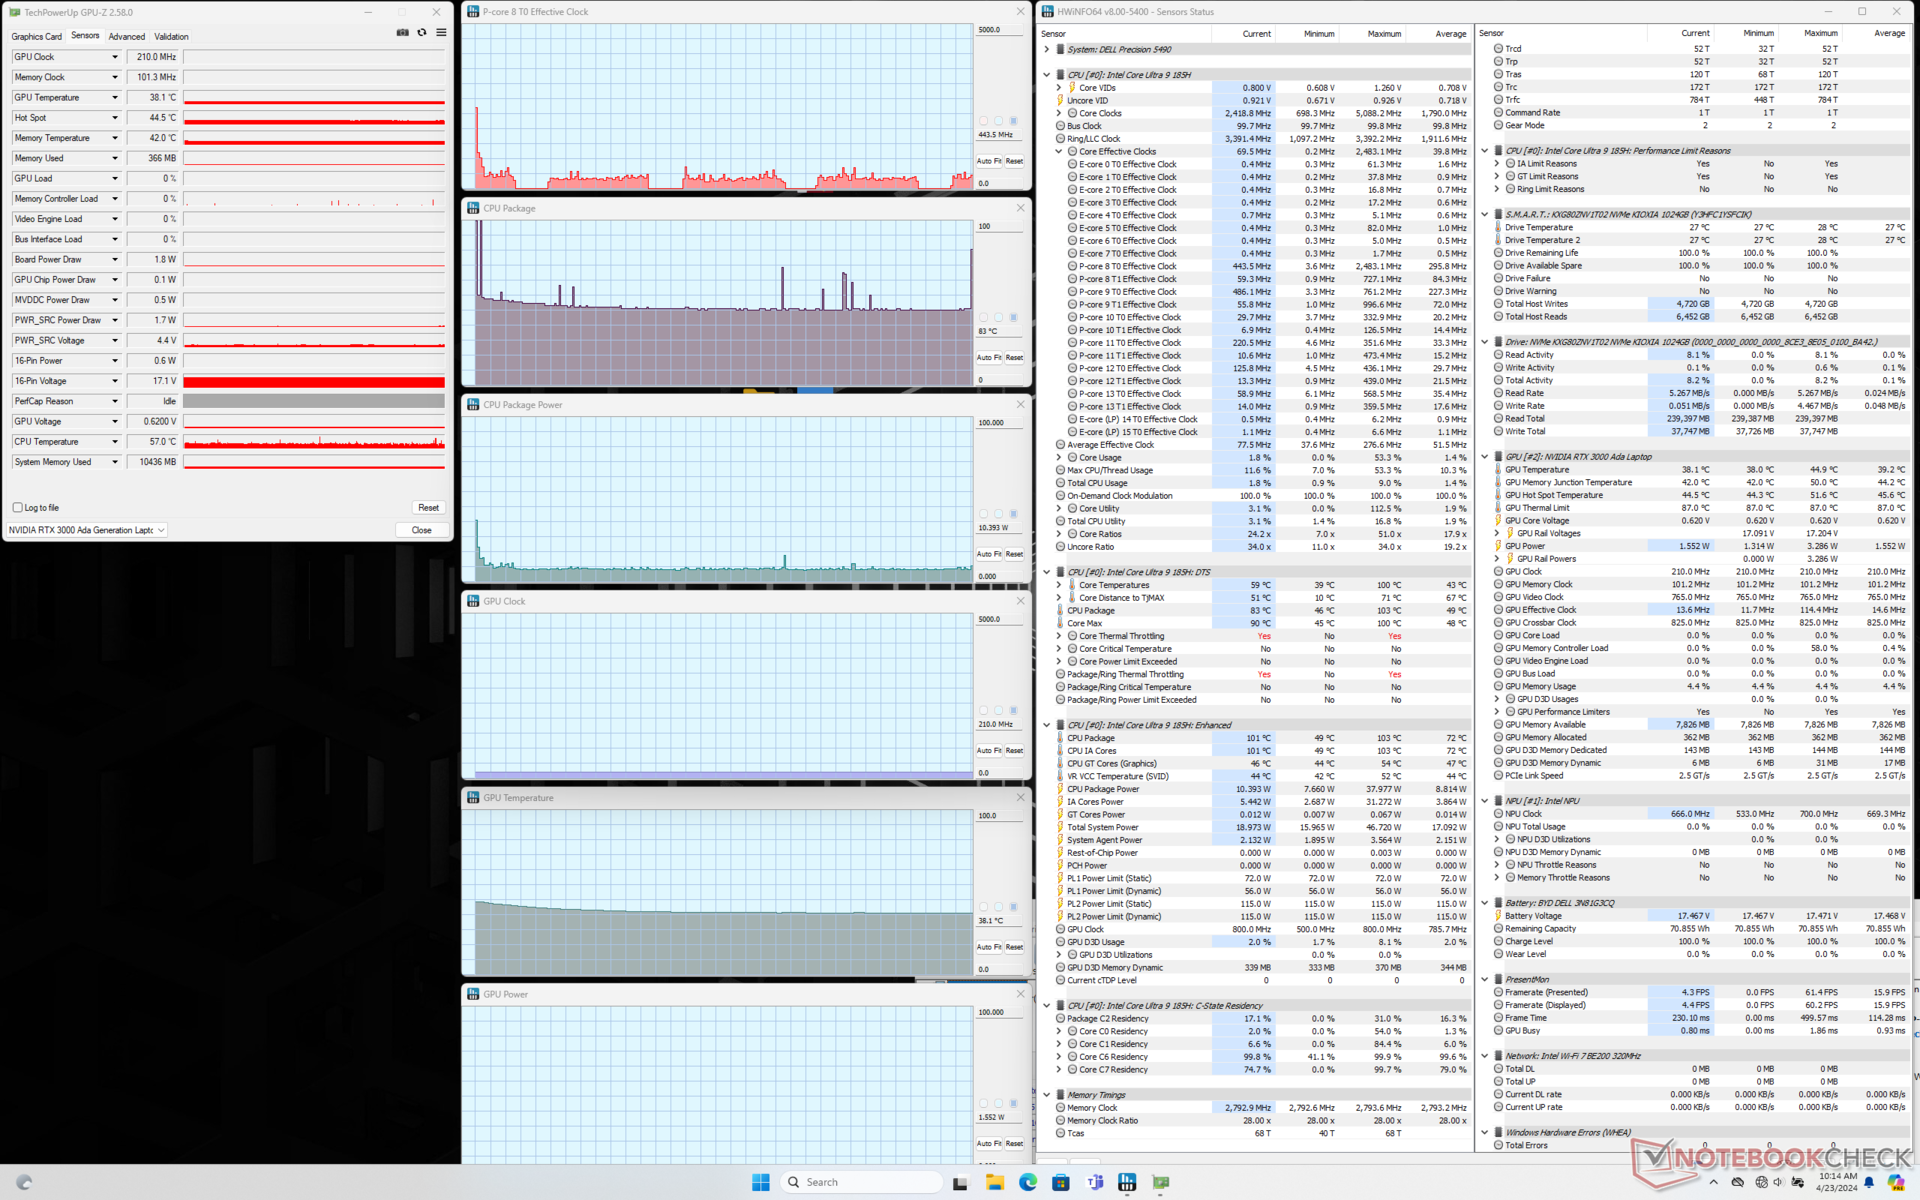
Test da sforzo
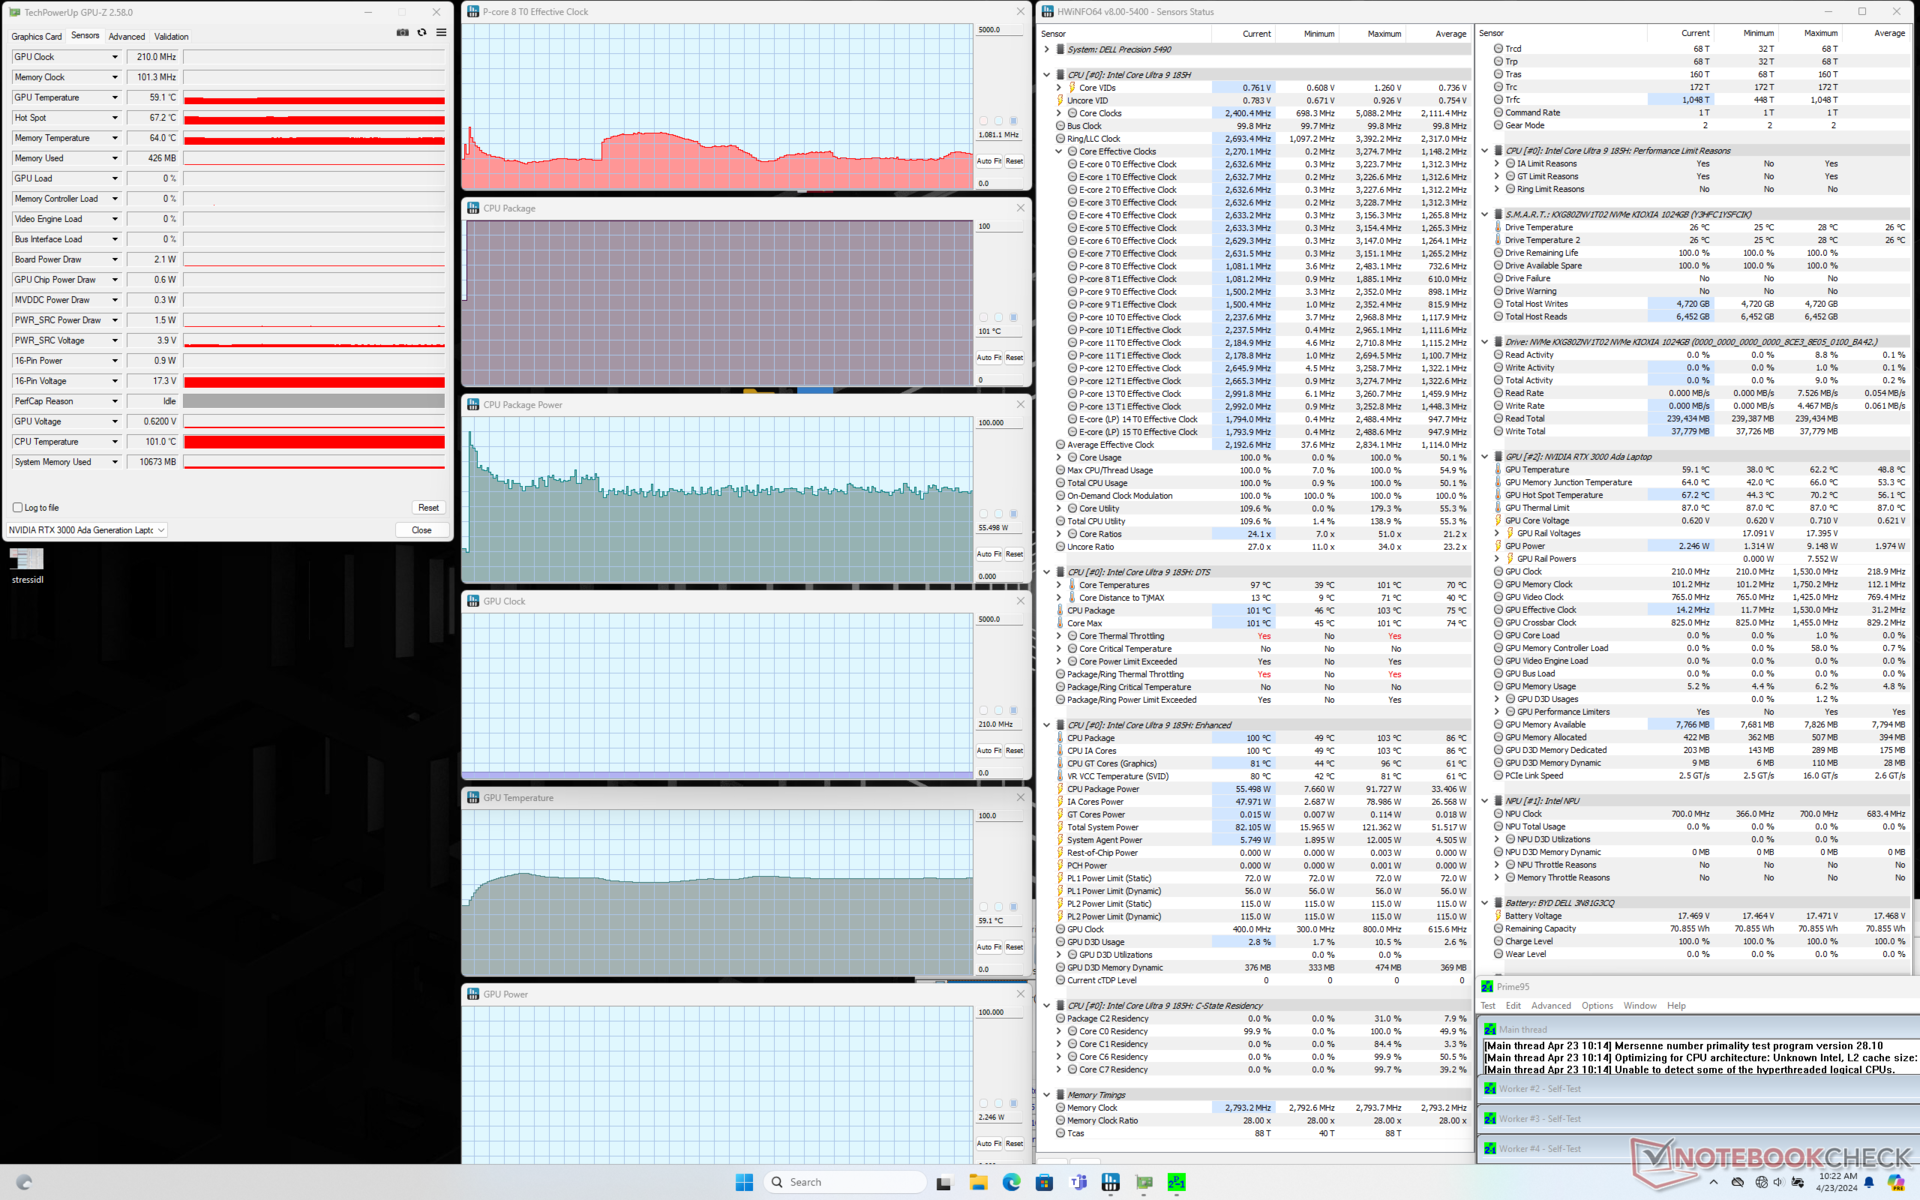
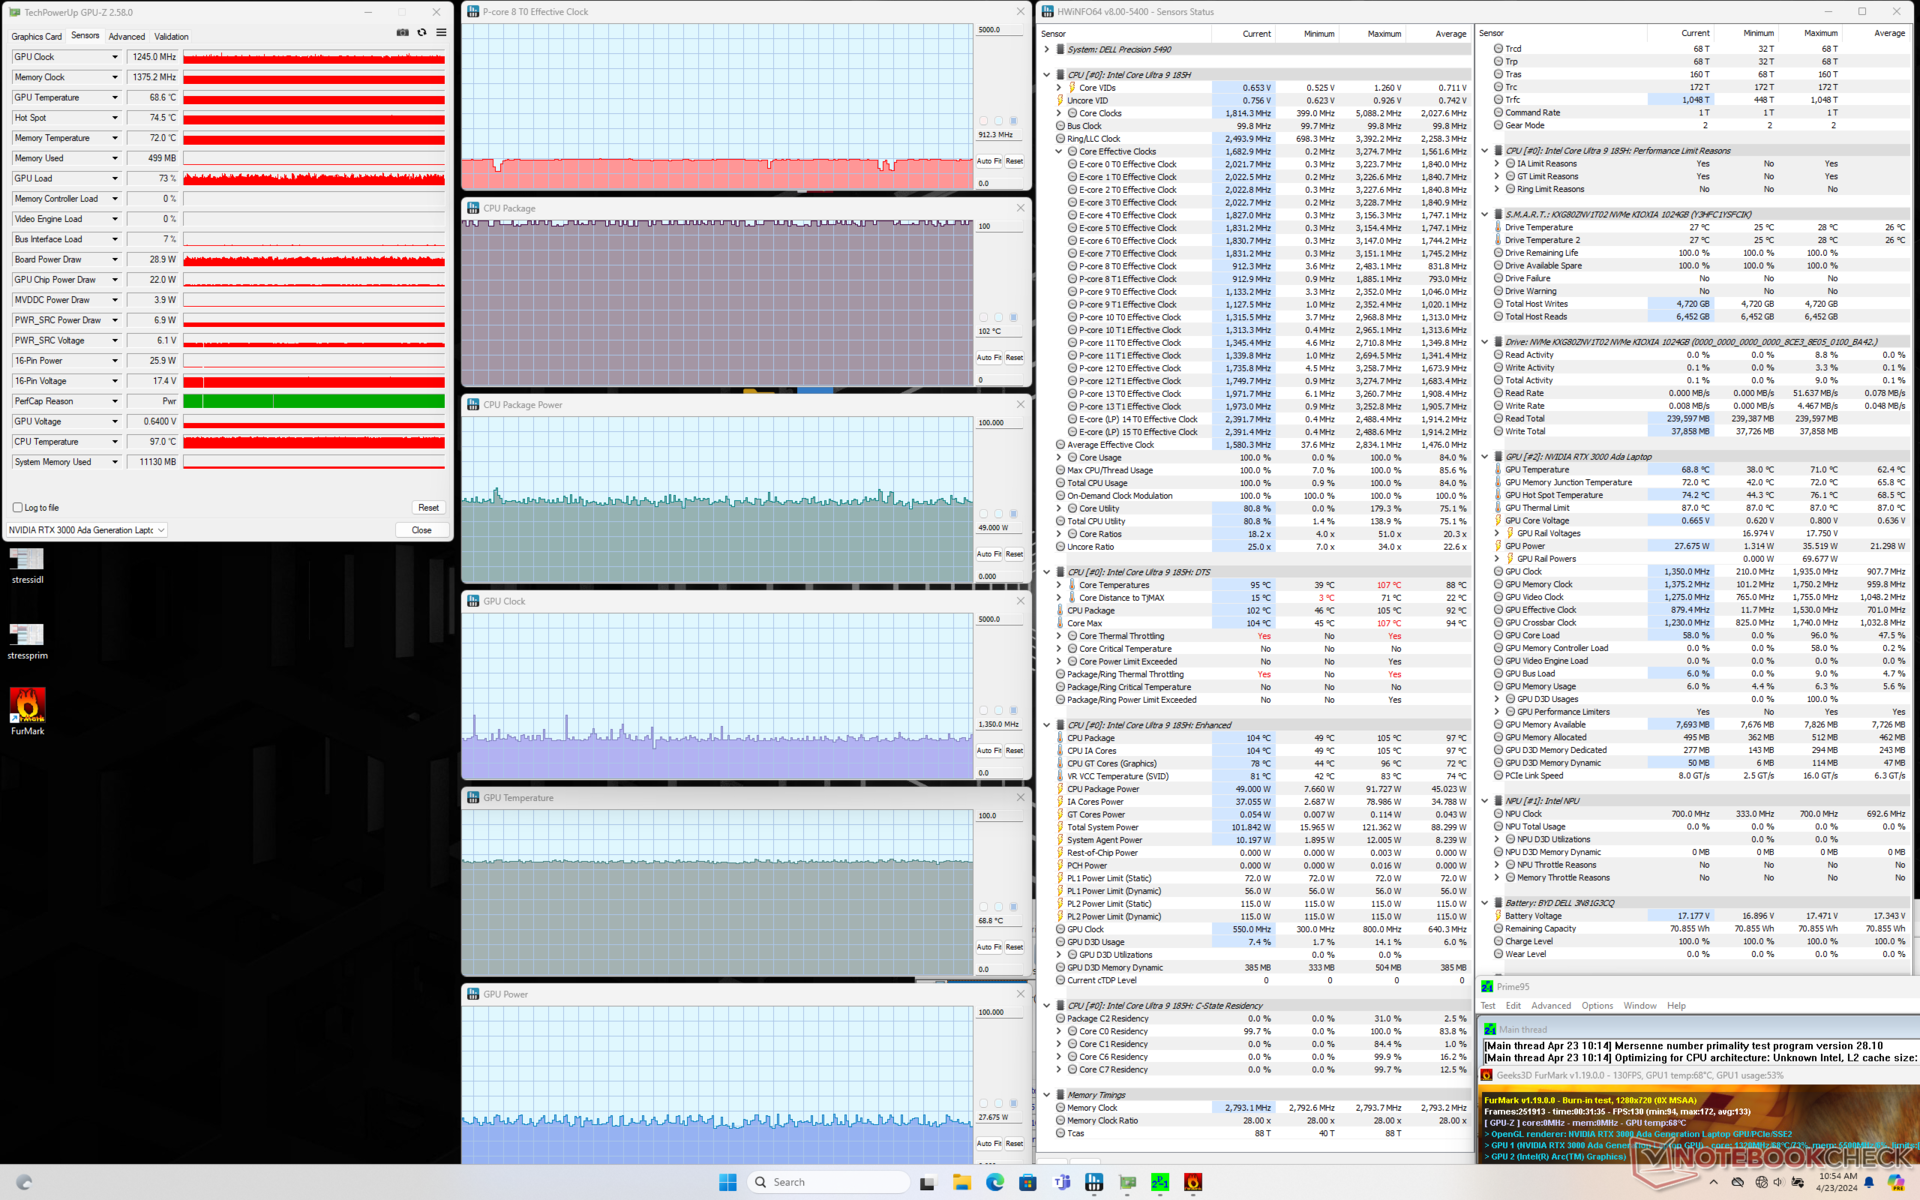
La velocità di clock del core e l'assorbimento di potenza della scheda raggiungevano un picco di 3,3 GHz e 92 W, rispettivamente, quando si avviava lo stress Prime95. Tuttavia, questo scendeva molto rapidamente a 2,2 GHz e 55 W in media per mantenere una temperatura del core molto elevata di 101 C. I risultati sono simili a quelli che abbiamo registrato su Precision 5480 dello scorso anno, se non leggermente più caldi.
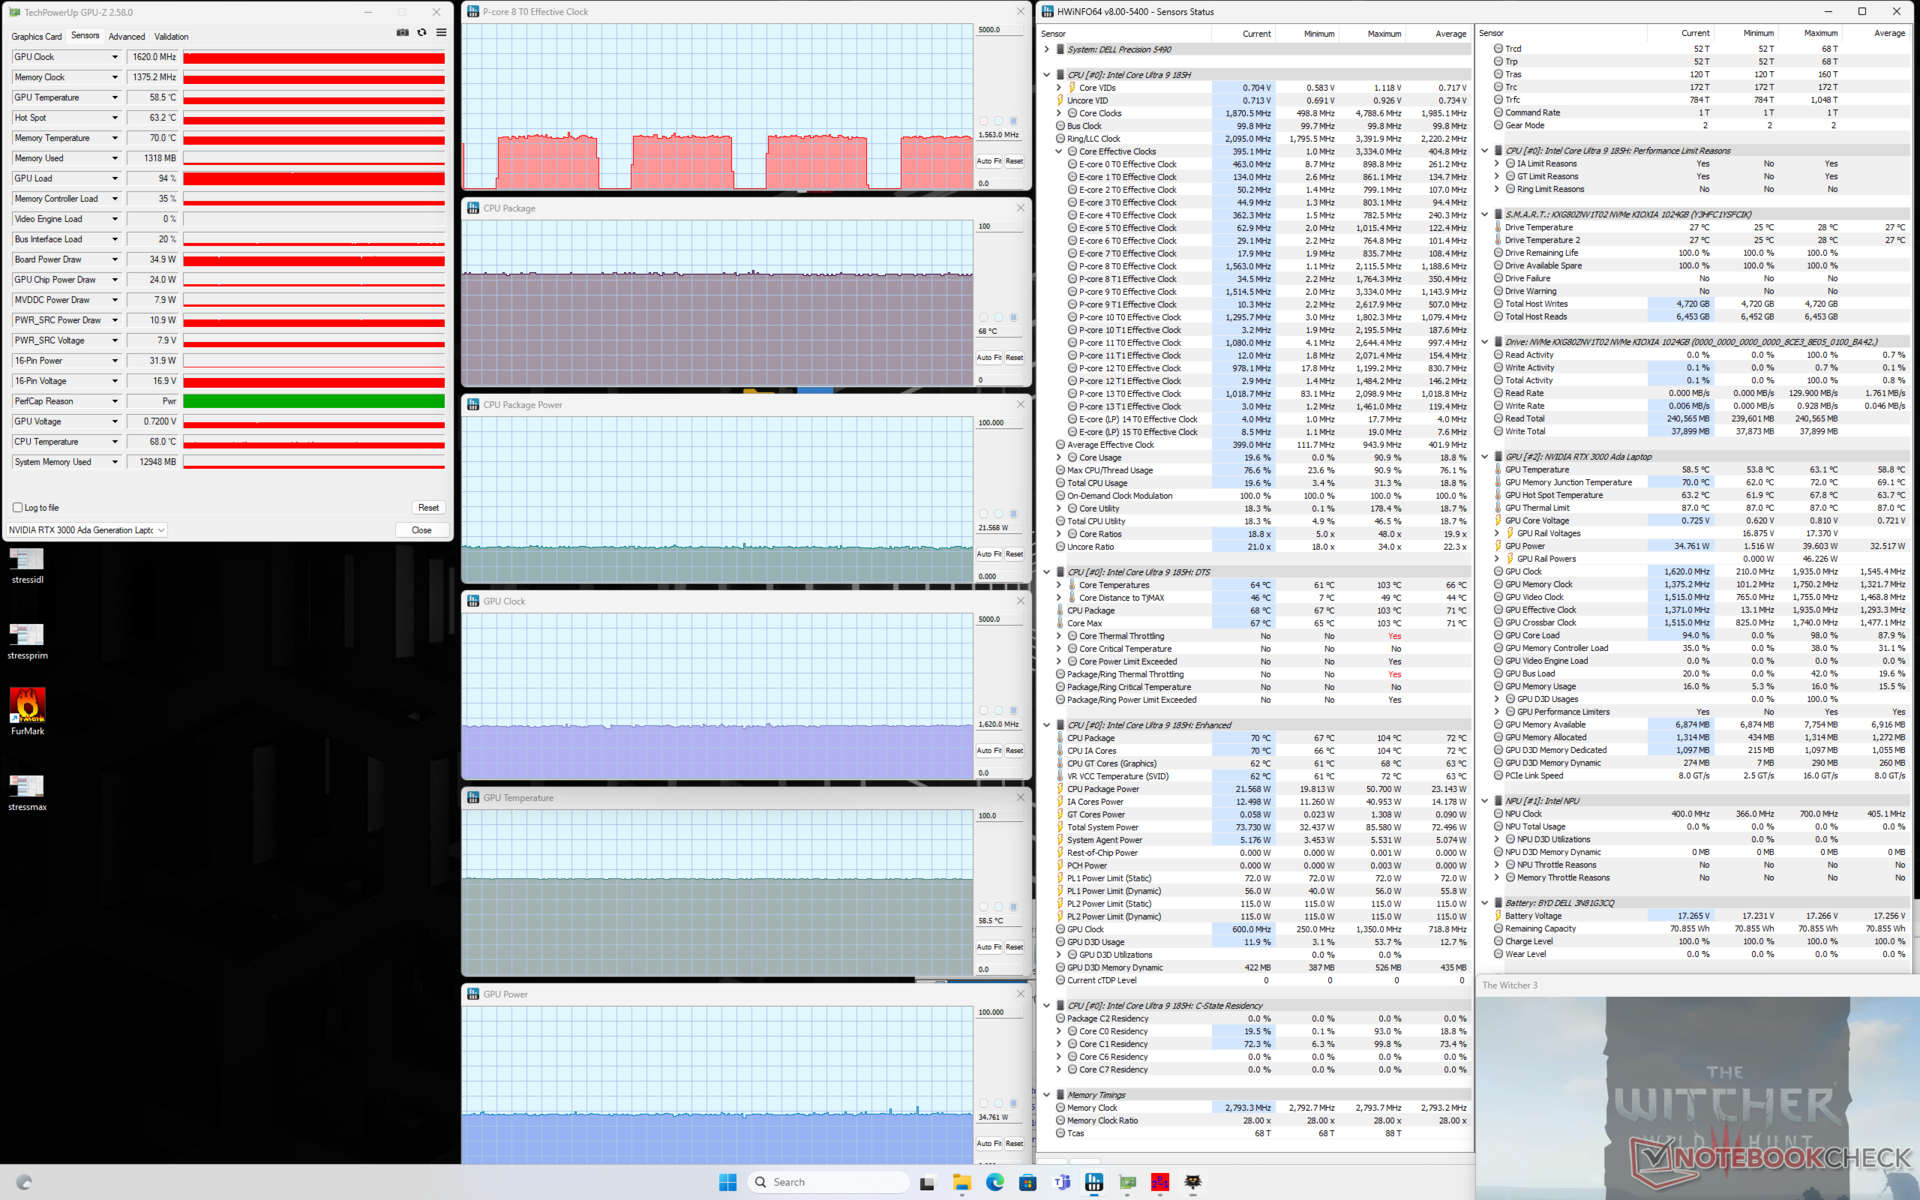
È interessante notare che l'assorbimento di potenza della scheda GPU quando si esegue Witcher 3 si stabilizza a 35 W, mentre la GPU di Precision 5480 dello scorso anno si stabilizza a 45 W anche quando è impostata sulla modalità Ultra Performance. L'assorbimento di potenza della scheda può spiegare in parte le prestazioni grafiche leggermente più lente nella sezione Prestazioni della GPU.
| Clock della CPU (GHz) | Clock della GPU (MHz) | Temperatura media della CPU (°C) | Temperatura media della GPU (°C) | |
| Sistema inattivo | -- | -- | 45 | 38 |
| Stress Prime95 | 2,2 | -- | 101 | 59 |
| Prime95 + FurMark Stress | 1,6 | ~1350 | 101 | 69 |
| Witcher 3 Stress | 0,4 | 1620 | 68 | 59 |
Prestazioni del sistema
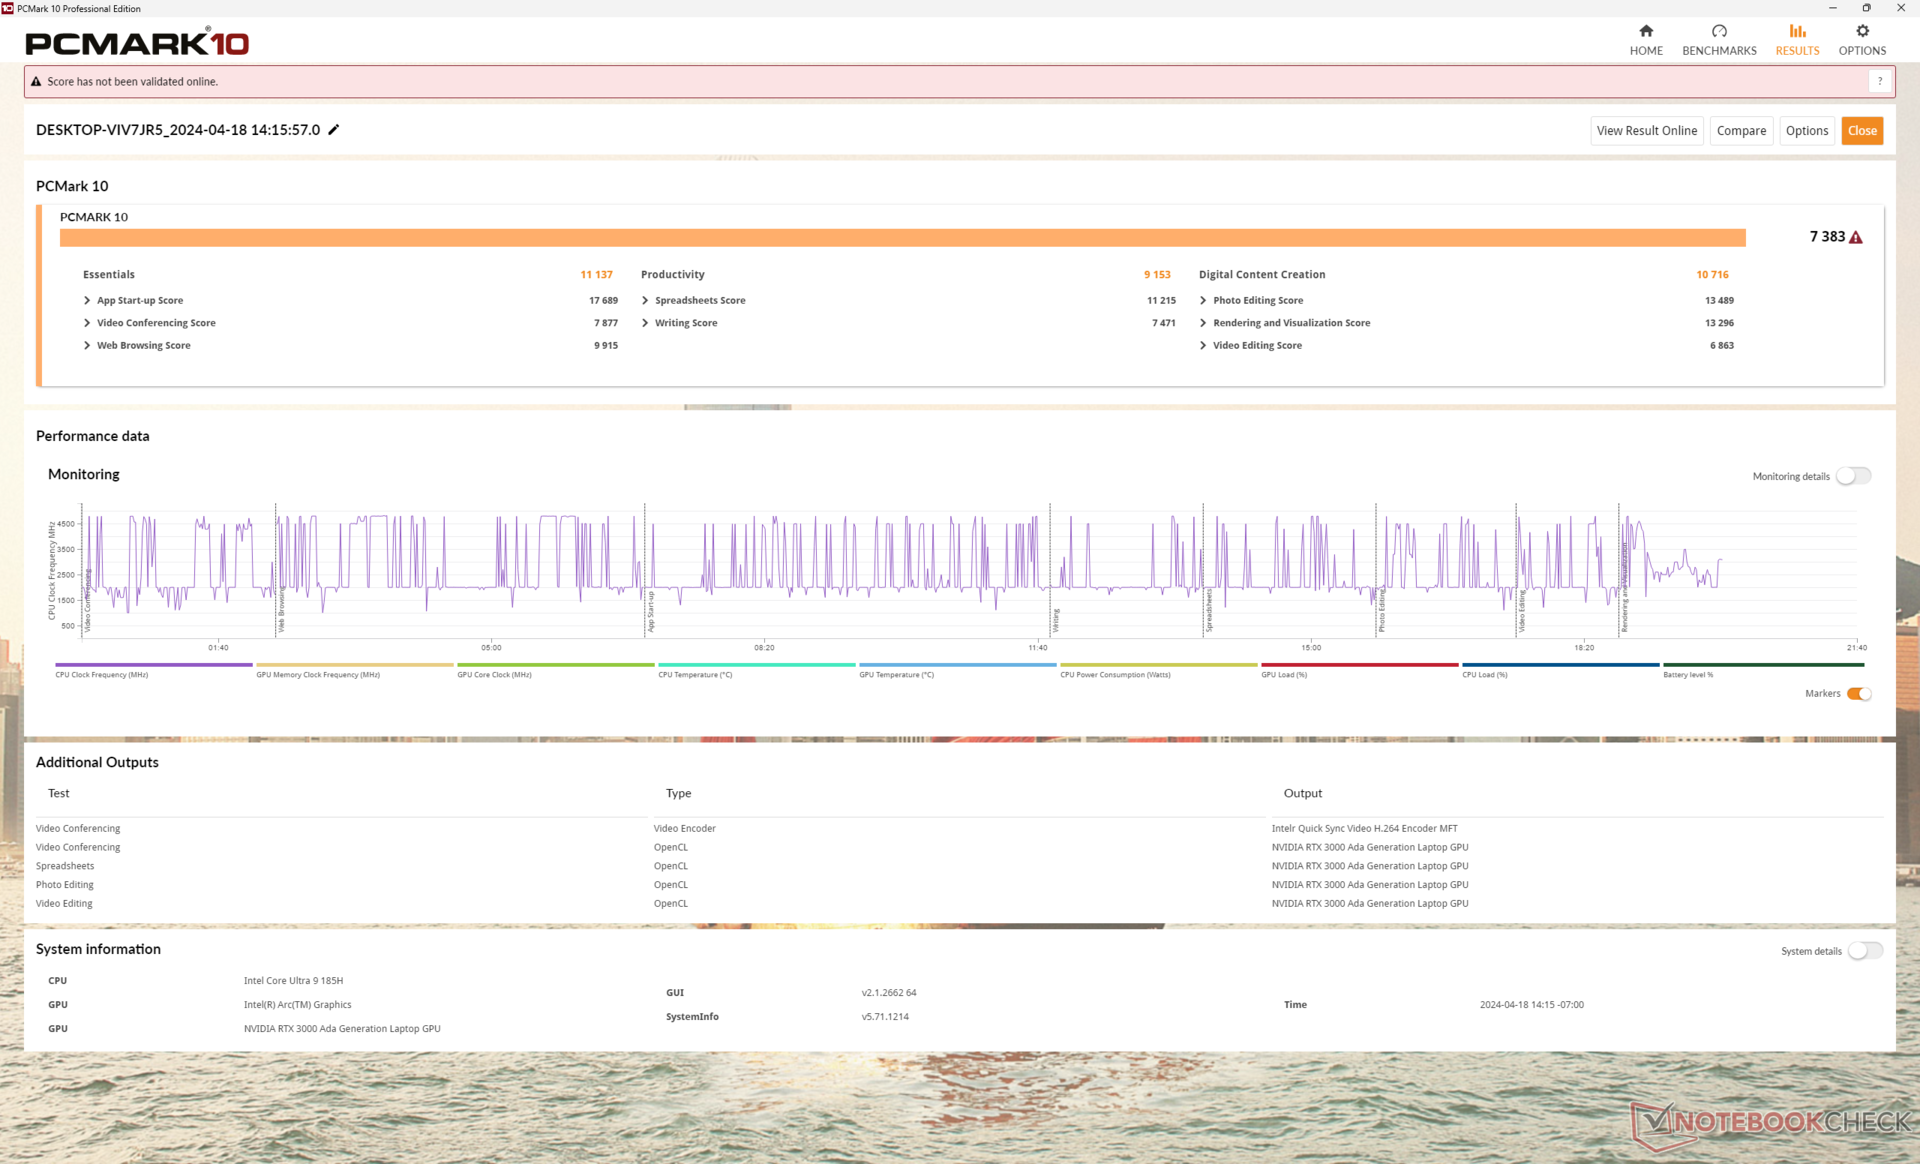
I risultati di PCMark sono quasi identici a quelli che abbiamo registrato su Precision 5480 dell'anno scorso e non suggeriscono grandi vantaggi in termini di prestazioni per quanto riguarda il multitasking generale o le attività di editing video. I benchmark PCMark AI, che non abbiamo ancora eseguito, possono differenziare meglio i computer portatili con NPU integrata come il nostro Precision 5490 dai modelli più vecchi.
CrossMark: Overall | Productivity | Creativity | Responsiveness
WebXPRT 3: Overall
WebXPRT 4: Overall
Mozilla Kraken 1.1: Total
| PCMark 10 / Score | |
| Dell Precision 5480 | |
| Media Intel Core Ultra 9 185H, NVIDIA RTX 3000 Ada Generation Laptop (7383 - 7537, n=2) | |
| Dell Precision 5000 5490 | |
| Lenovo ThinkPad P14s G4 21HF0017GE | |
| Dell Precision 5000 5470 | |
| HP ZBook Firefly 14 G10 A | |
| HP ZBook Firefly 14 G9-6B8A2EA | |
| PCMark 10 / Essentials | |
| Dell Precision 5480 | |
| Dell Precision 5000 5490 | |
| Dell Precision 5000 5470 | |
| Media Intel Core Ultra 9 185H, NVIDIA RTX 3000 Ada Generation Laptop (10514 - 11137, n=2) | |
| Lenovo ThinkPad P14s G4 21HF0017GE | |
| HP ZBook Firefly 14 G9-6B8A2EA | |
| HP ZBook Firefly 14 G10 A | |
| PCMark 10 / Productivity | |
| Lenovo ThinkPad P14s G4 21HF0017GE | |
| HP ZBook Firefly 14 G9-6B8A2EA | |
| Dell Precision 5480 | |
| Media Intel Core Ultra 9 185H, NVIDIA RTX 3000 Ada Generation Laptop (9153 - 9356, n=2) | |
| HP ZBook Firefly 14 G10 A | |
| Dell Precision 5000 5490 | |
| Dell Precision 5000 5470 | |
| PCMark 10 / Digital Content Creation | |
| Dell Precision 5480 | |
| Media Intel Core Ultra 9 185H, NVIDIA RTX 3000 Ada Generation Laptop (10716 - 11811, n=2) | |
| Dell Precision 5000 5490 | |
| Dell Precision 5000 5470 | |
| Lenovo ThinkPad P14s G4 21HF0017GE | |
| HP ZBook Firefly 14 G10 A | |
| HP ZBook Firefly 14 G9-6B8A2EA | |
| CrossMark / Overall | |
| Dell Precision 5480 | |
| Lenovo ThinkPad P14s G4 21HF0017GE | |
| Dell Precision 5000 5470 | |
| Media Intel Core Ultra 9 185H, NVIDIA RTX 3000 Ada Generation Laptop (1754 - 1770, n=2) | |
| Dell Precision 5000 5490 | |
| HP ZBook Firefly 14 G9-6B8A2EA | |
| CrossMark / Productivity | |
| Dell Precision 5480 | |
| Lenovo ThinkPad P14s G4 21HF0017GE | |
| Dell Precision 5000 5470 | |
| Media Intel Core Ultra 9 185H, NVIDIA RTX 3000 Ada Generation Laptop (1643 - 1686, n=2) | |
| Dell Precision 5000 5490 | |
| HP ZBook Firefly 14 G9-6B8A2EA | |
| CrossMark / Creativity | |
| Dell Precision 5480 | |
| Dell Precision 5000 5470 | |
| Lenovo ThinkPad P14s G4 21HF0017GE | |
| Dell Precision 5000 5490 | |
| Media Intel Core Ultra 9 185H, NVIDIA RTX 3000 Ada Generation Laptop (1981 - 2001, n=2) | |
| HP ZBook Firefly 14 G9-6B8A2EA | |
| CrossMark / Responsiveness | |
| Dell Precision 5480 | |
| Lenovo ThinkPad P14s G4 21HF0017GE | |
| Dell Precision 5000 5470 | |
| Media Intel Core Ultra 9 185H, NVIDIA RTX 3000 Ada Generation Laptop (1438 - 1458, n=2) | |
| Dell Precision 5000 5490 | |
| HP ZBook Firefly 14 G9-6B8A2EA | |
| WebXPRT 3 / Overall | |
| Dell Precision 5480 | |
| Dell Precision 5000 5470 | |
| Lenovo ThinkPad P14s G4 21HF0017GE | |
| Media Intel Core Ultra 9 185H, NVIDIA RTX 3000 Ada Generation Laptop (286 - 295, n=2) | |
| Dell Precision 5000 5490 | |
| HP ZBook Firefly 14 G9-6B8A2EA | |
| HP ZBook Firefly 14 G10 A | |
| HP ZBook Firefly 14 G10 A | |
| WebXPRT 4 / Overall | |
| Dell Precision 5480 | |
| Lenovo ThinkPad P14s G4 21HF0017GE | |
| Lenovo ThinkPad P14s G4 21HF0017GE | |
| Dell Precision 5000 5470 | |
| Dell Precision 5000 5490 | |
| Media Intel Core Ultra 9 185H, NVIDIA RTX 3000 Ada Generation Laptop (261 - 268, n=2) | |
| HP ZBook Firefly 14 G9-6B8A2EA | |
| Mozilla Kraken 1.1 / Total | |
| HP ZBook Firefly 14 G10 A | |
| HP ZBook Firefly 14 G10 A | |
| HP ZBook Firefly 14 G9-6B8A2EA | |
| Dell Precision 5000 5470 | |
| Dell Precision 5000 5490 | |
| Media Intel Core Ultra 9 185H, NVIDIA RTX 3000 Ada Generation Laptop (515 - 522, n=2) | |
| Dell Precision 5480 | |
| Lenovo ThinkPad P14s G4 21HF0017GE | |
* ... Meglio usare valori piccoli
| PCMark 10 Score | 7383 punti | |
Aiuto | ||
| AIDA64 / Memory Copy | |
| Dell Precision 5000 5490 | |
| Media Intel Core Ultra 9 185H (69929 - 95718, n=20) | |
| Dell Precision 5480 | |
| Dell Precision 5000 5470 | |
| HP ZBook Firefly 14 G10 A | |
| Lenovo ThinkPad P14s G4 21HF0017GE | |
| HP ZBook Firefly 14 G9-6B8A2EA | |
| AIDA64 / Memory Read | |
| Dell Precision 5000 5490 | |
| Media Intel Core Ultra 9 185H (64619 - 87768, n=20) | |
| Dell Precision 5000 5470 | |
| Dell Precision 5480 | |
| HP ZBook Firefly 14 G9-6B8A2EA | |
| HP ZBook Firefly 14 G10 A | |
| Lenovo ThinkPad P14s G4 21HF0017GE | |
| AIDA64 / Memory Write | |
| Dell Precision 5000 5490 | |
| Dell Precision 5480 | |
| HP ZBook Firefly 14 G10 A | |
| Media Intel Core Ultra 9 185H (51114 - 93871, n=20) | |
| Lenovo ThinkPad P14s G4 21HF0017GE | |
| HP ZBook Firefly 14 G9-6B8A2EA | |
| Dell Precision 5000 5470 | |
| AIDA64 / Memory Latency | |
| Media Intel Core Ultra 9 185H (121.4 - 259, n=20) | |
| Dell Precision 5000 5490 | |
| Dell Precision 5000 5470 | |
| HP ZBook Firefly 14 G10 A | |
| Lenovo ThinkPad P14s G4 21HF0017GE | |
| Dell Precision 5480 | |
| HP ZBook Firefly 14 G9-6B8A2EA | |
* ... Meglio usare valori piccoli
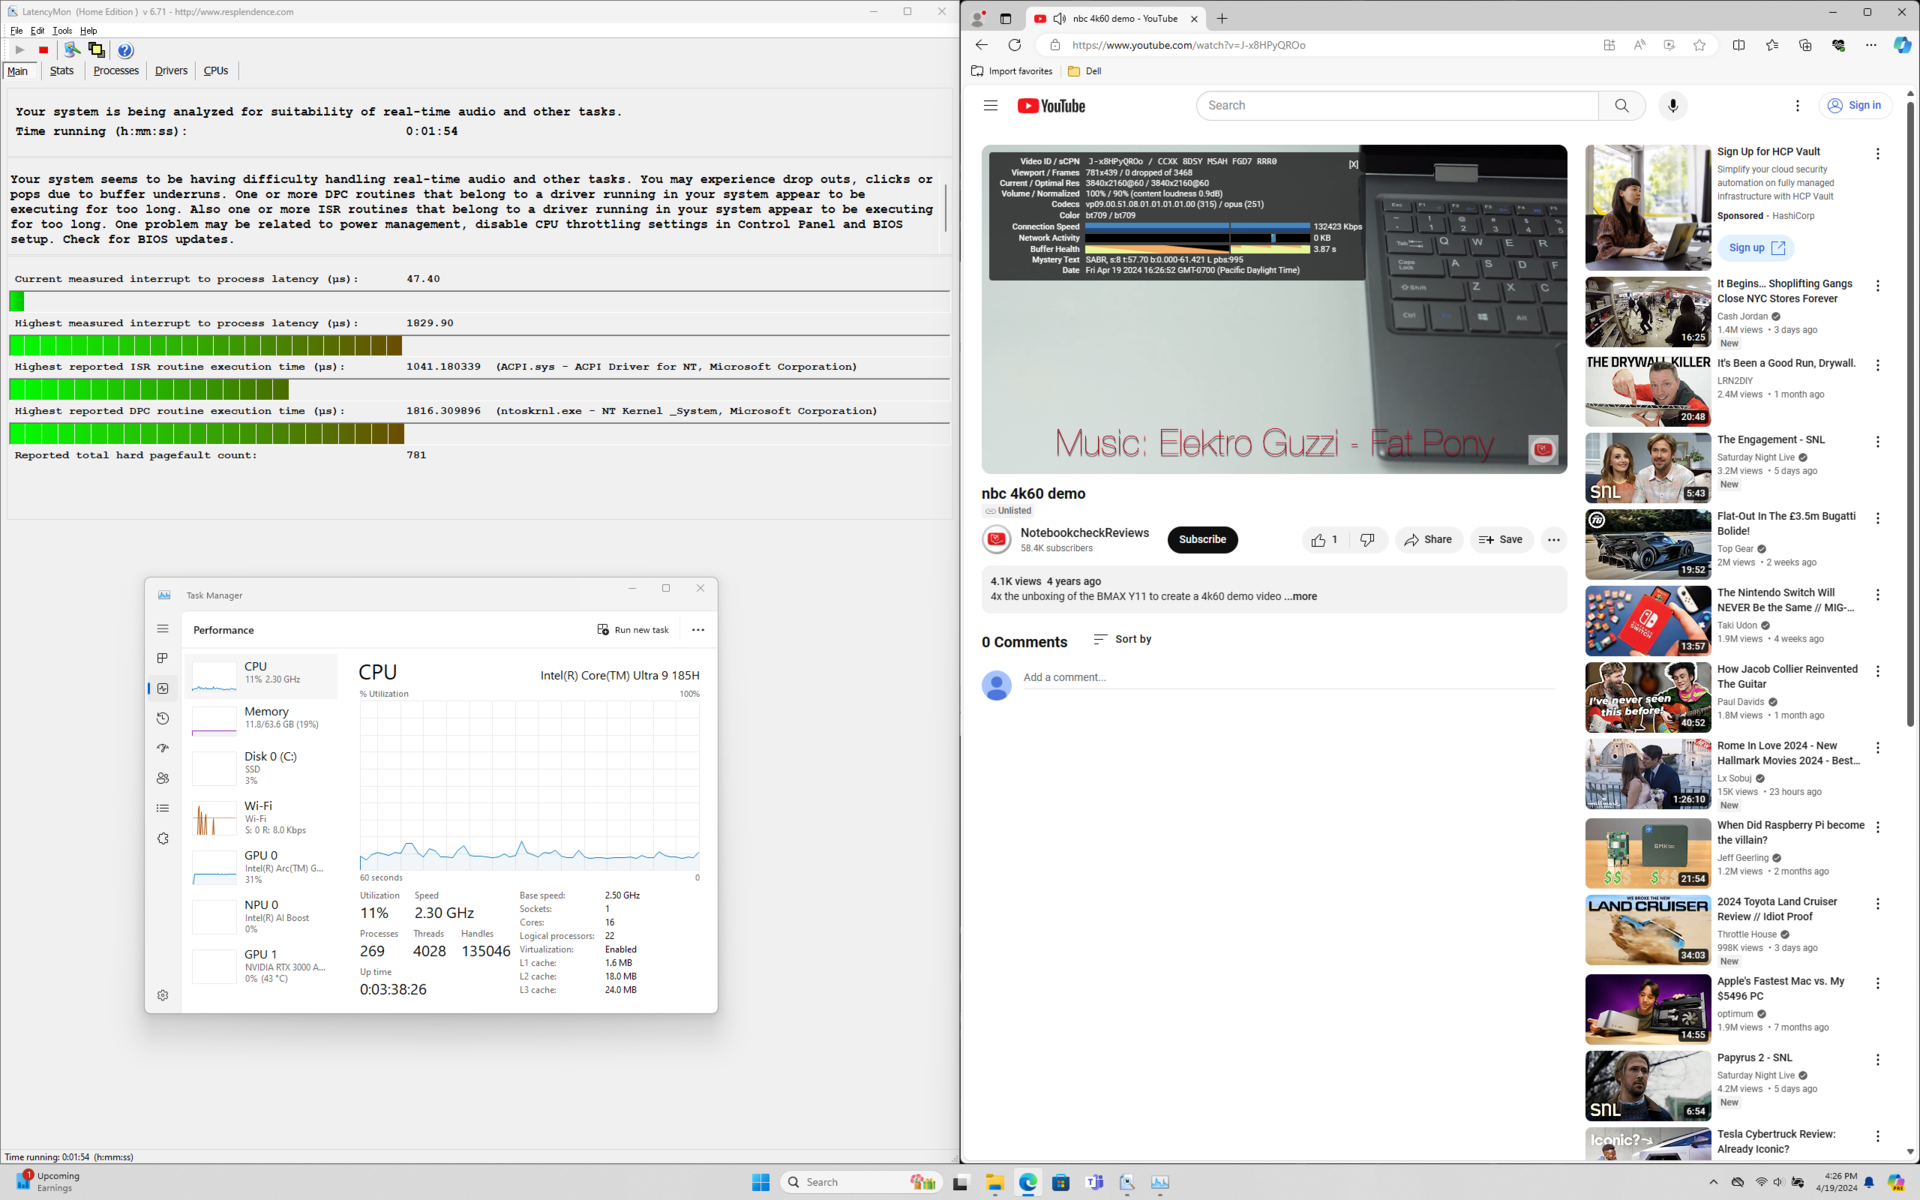
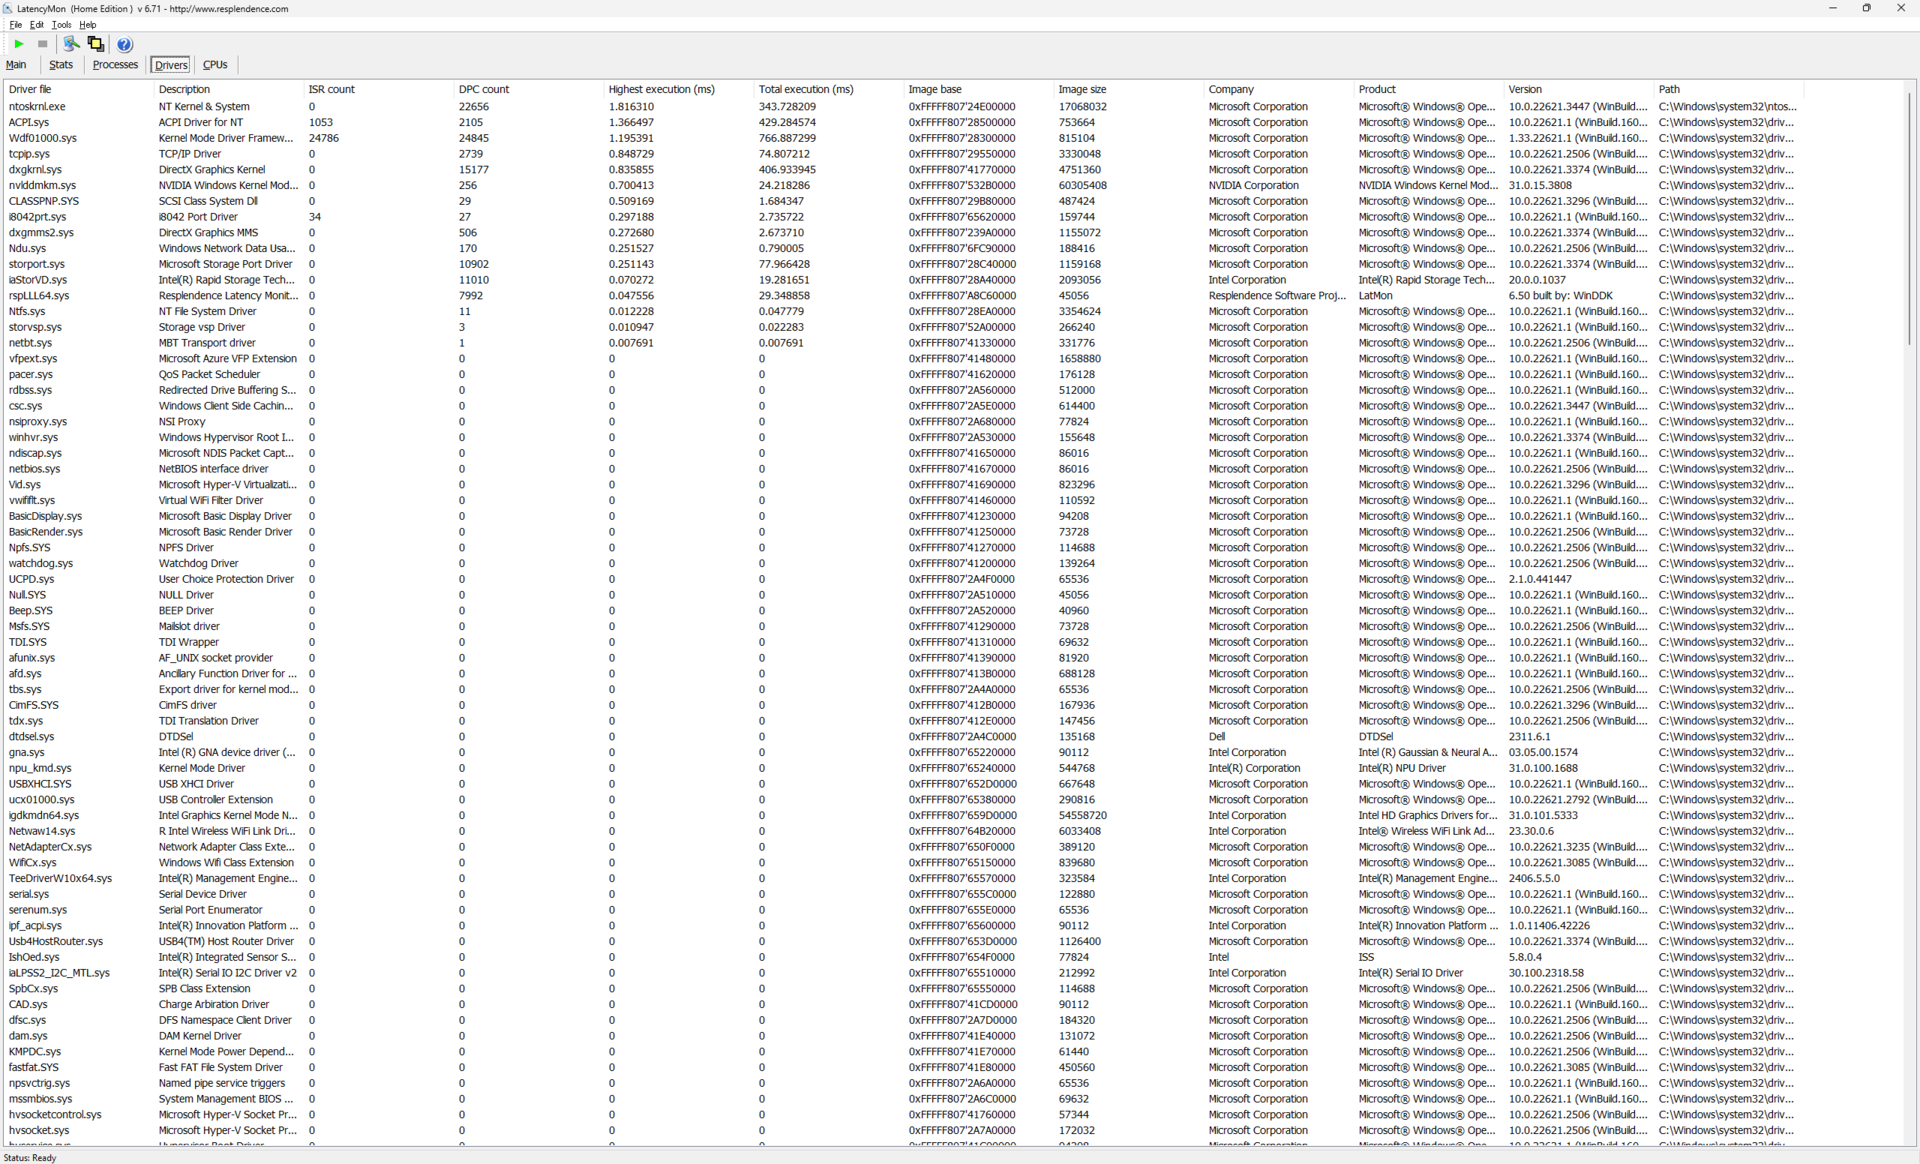
Latenza DPC
LatencyMon mostra di nuovo solo piccoli problemi di DPC quando si aprono più schede della nostra homepage. la riproduzione di video 4K a 60 FPS è invece perfetta, senza alcuna perdita di fotogrammi.
| DPC Latencies / LatencyMon - interrupt to process latency (max), Web, Youtube, Prime95 | |
| Dell Precision 5000 5490 | |
| Lenovo ThinkPad P14s G4 21HF0017GE | |
| Dell Precision 5480 | |
| HP ZBook Firefly 14 G10 A | |
| Dell Precision 5000 5470 | |
* ... Meglio usare valori piccoli
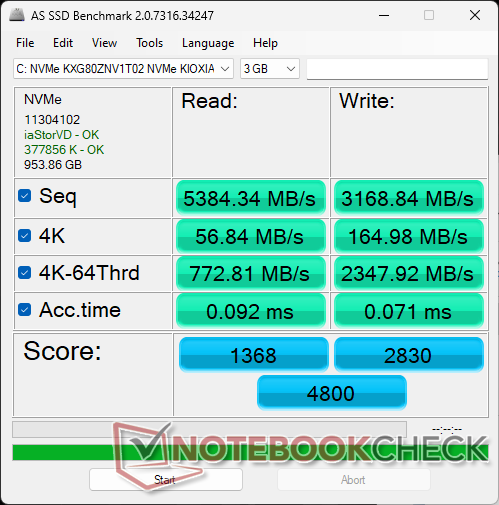
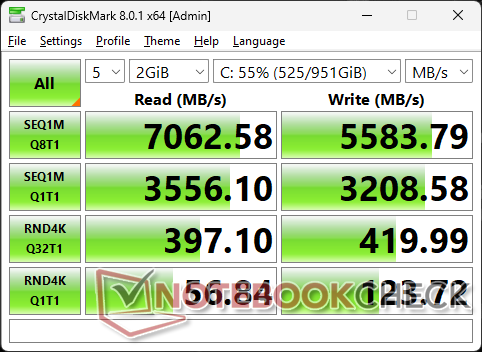
Dispositivi di archiviazione
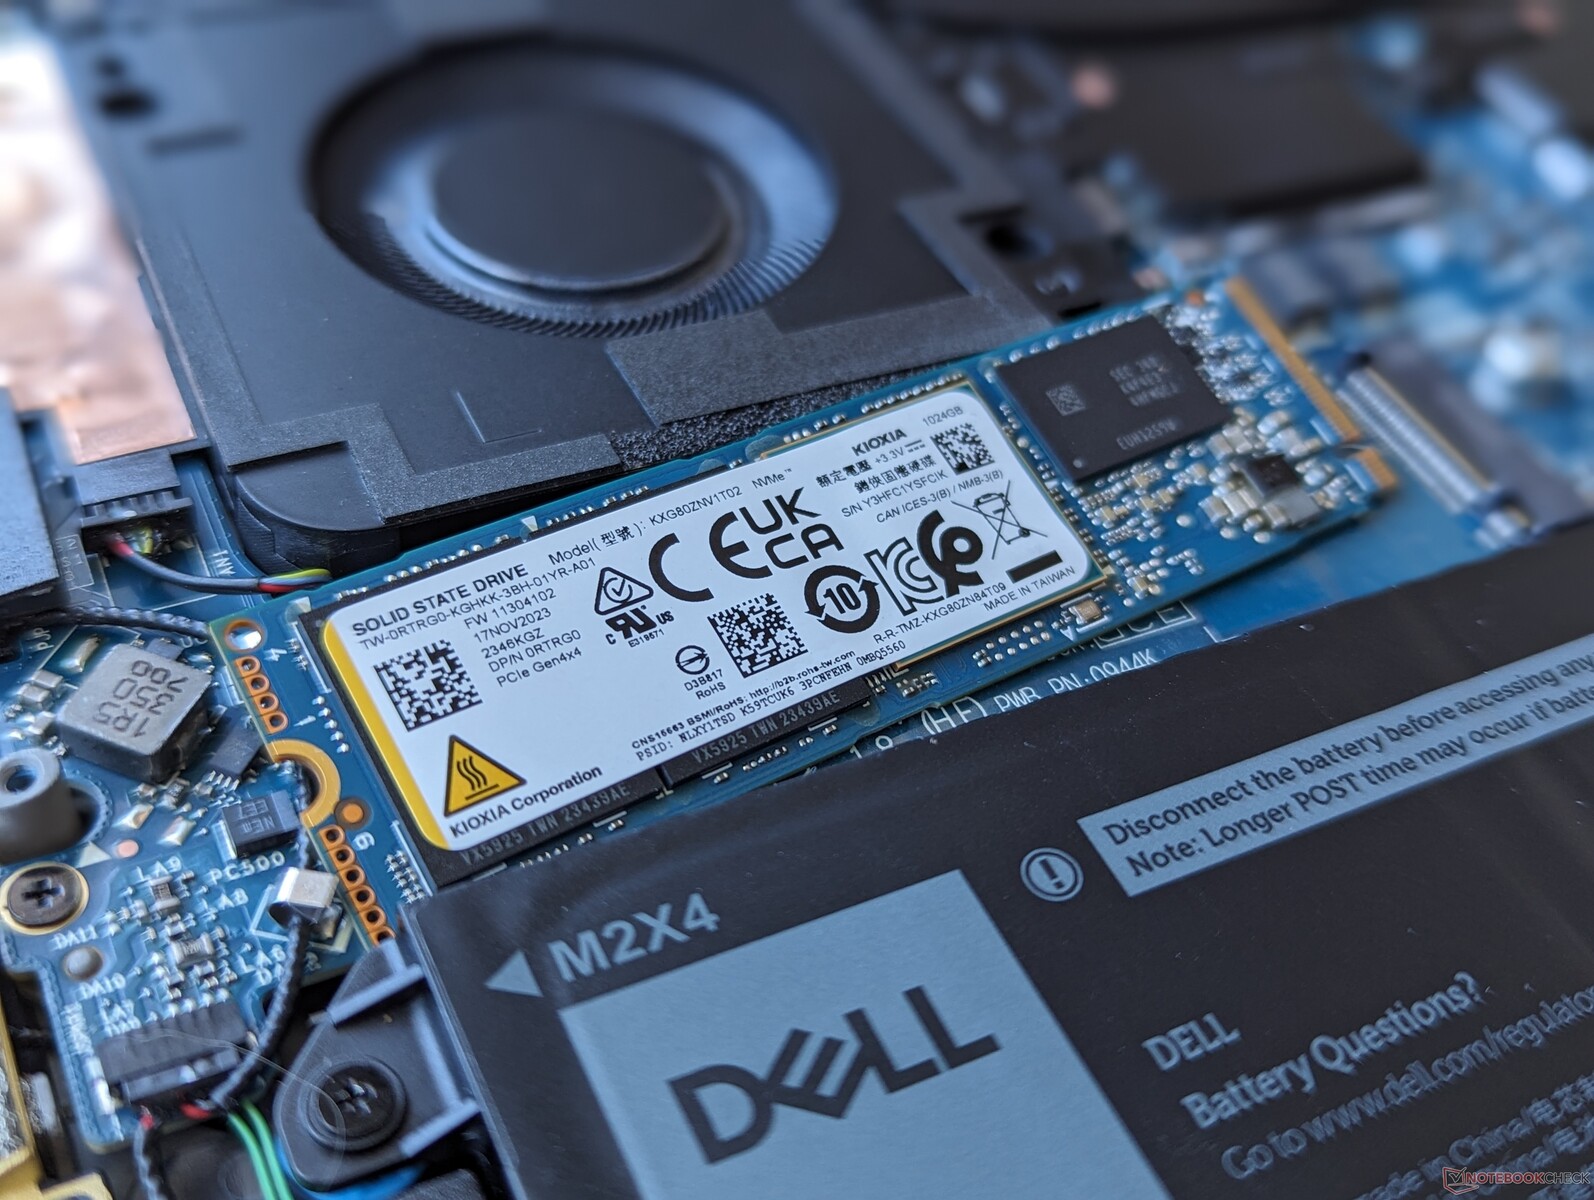
La nostra unità viene fornita con il Kioxia KXG80ZNV1T02 invece del Samsung PM9A1 del modello dello scorso anno. Le prestazioni complessive sono all'incirca le stesse, anche se con velocità di lettura leggermente inferiori per i blocchi 4K più piccoli.

| Drive Performance rating - Percent | |
| Lenovo ThinkPad P14s G4 21HF0017GE | |
| Dell Precision 5480 | |
| Dell Precision 5000 5470 | |
| HP ZBook Firefly 14 G9-6B8A2EA | |
| Dell Precision 5000 5490 | |
| HP ZBook Firefly 14 G10 A | |
* ... Meglio usare valori piccoli
Disk Throttling: DiskSpd Read Loop, Queue Depth 8
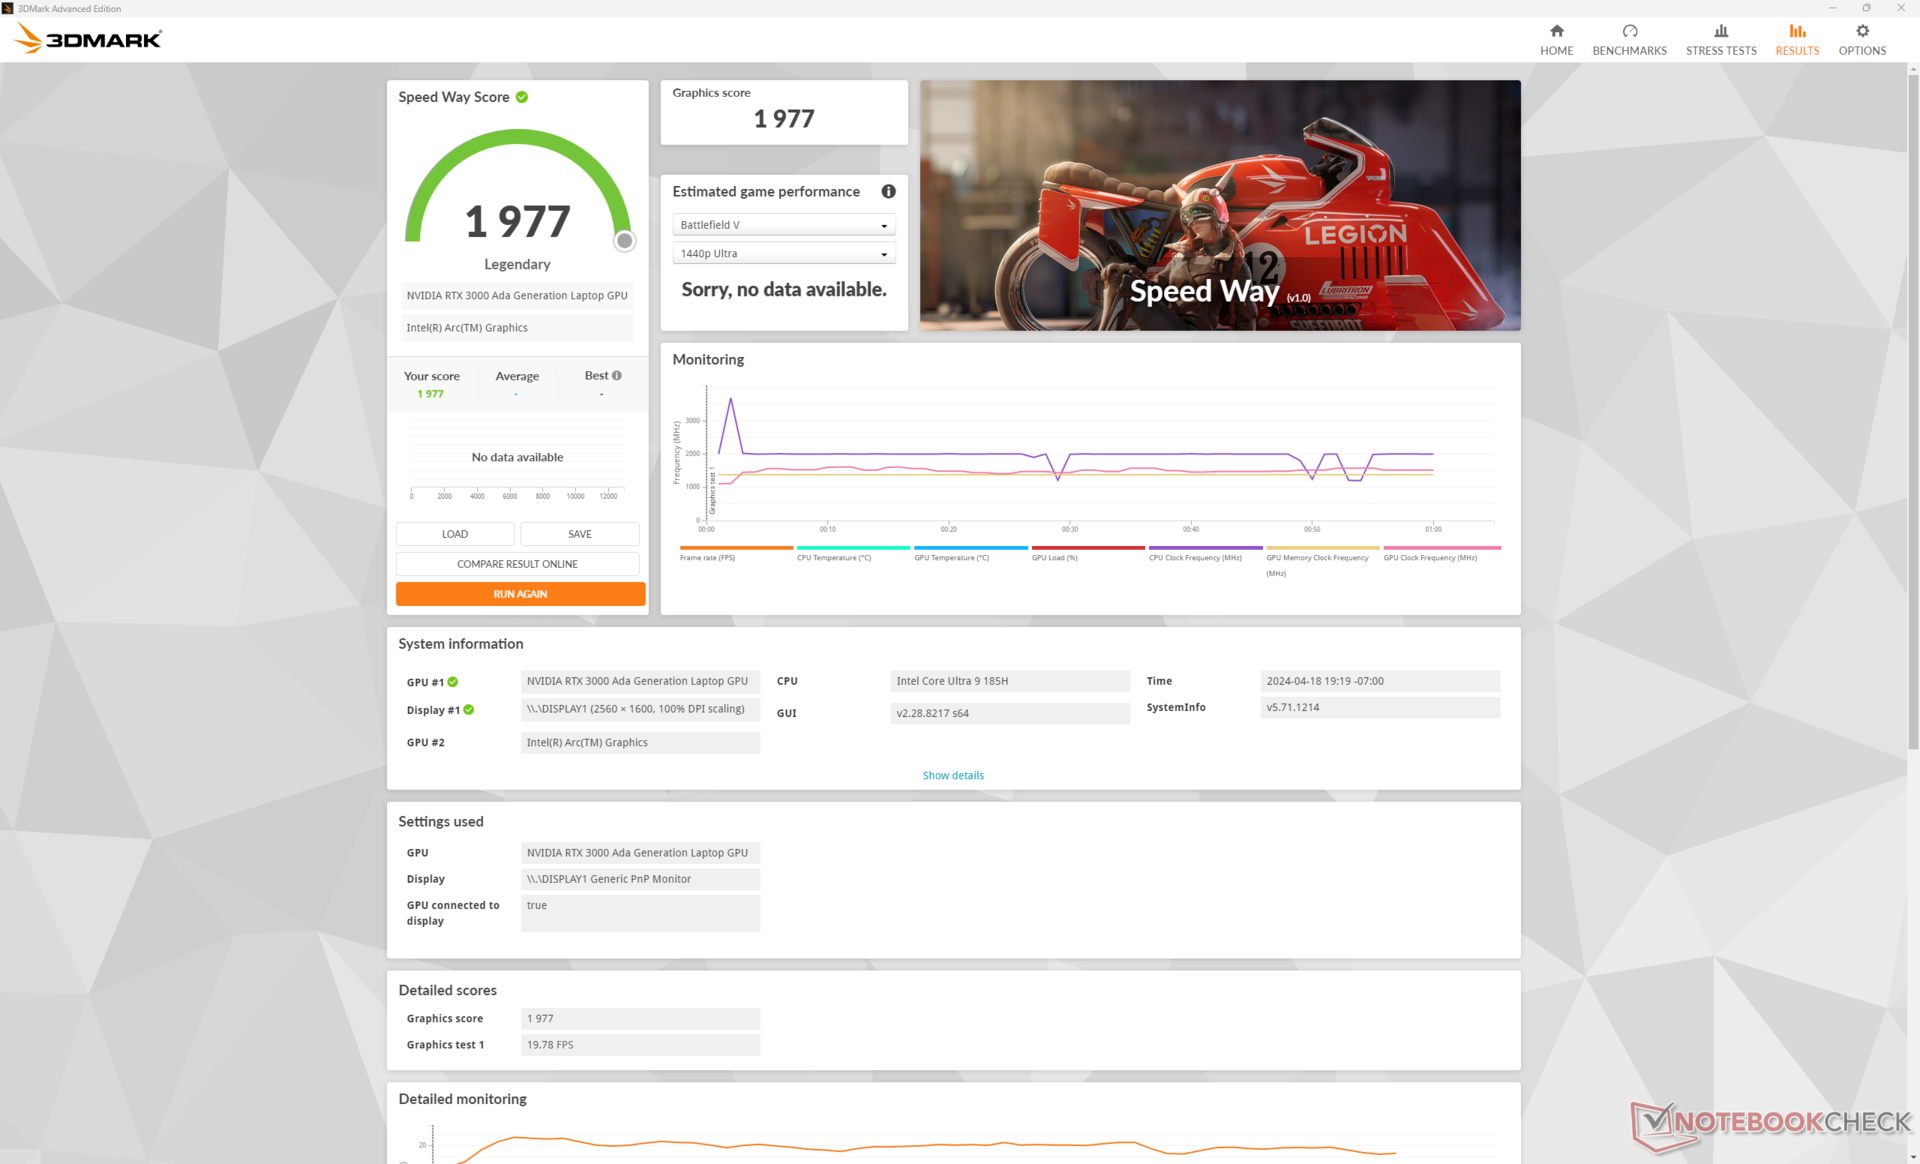
Prestazioni della GPU - RTX 3000 Ada
RTX 3000 Ada è tornata senza cambiamenti e senza vantaggi in termini di prestazioni rispetto a Precision 5480. In effetti, le prestazioni medie possono essere leggermente inferiori in molti casi, compresi alcuni giochi e benchmark 3DMark. Nonostante ciò, Precision 5490 rimane una delle workstation da 14 pollici più veloci.
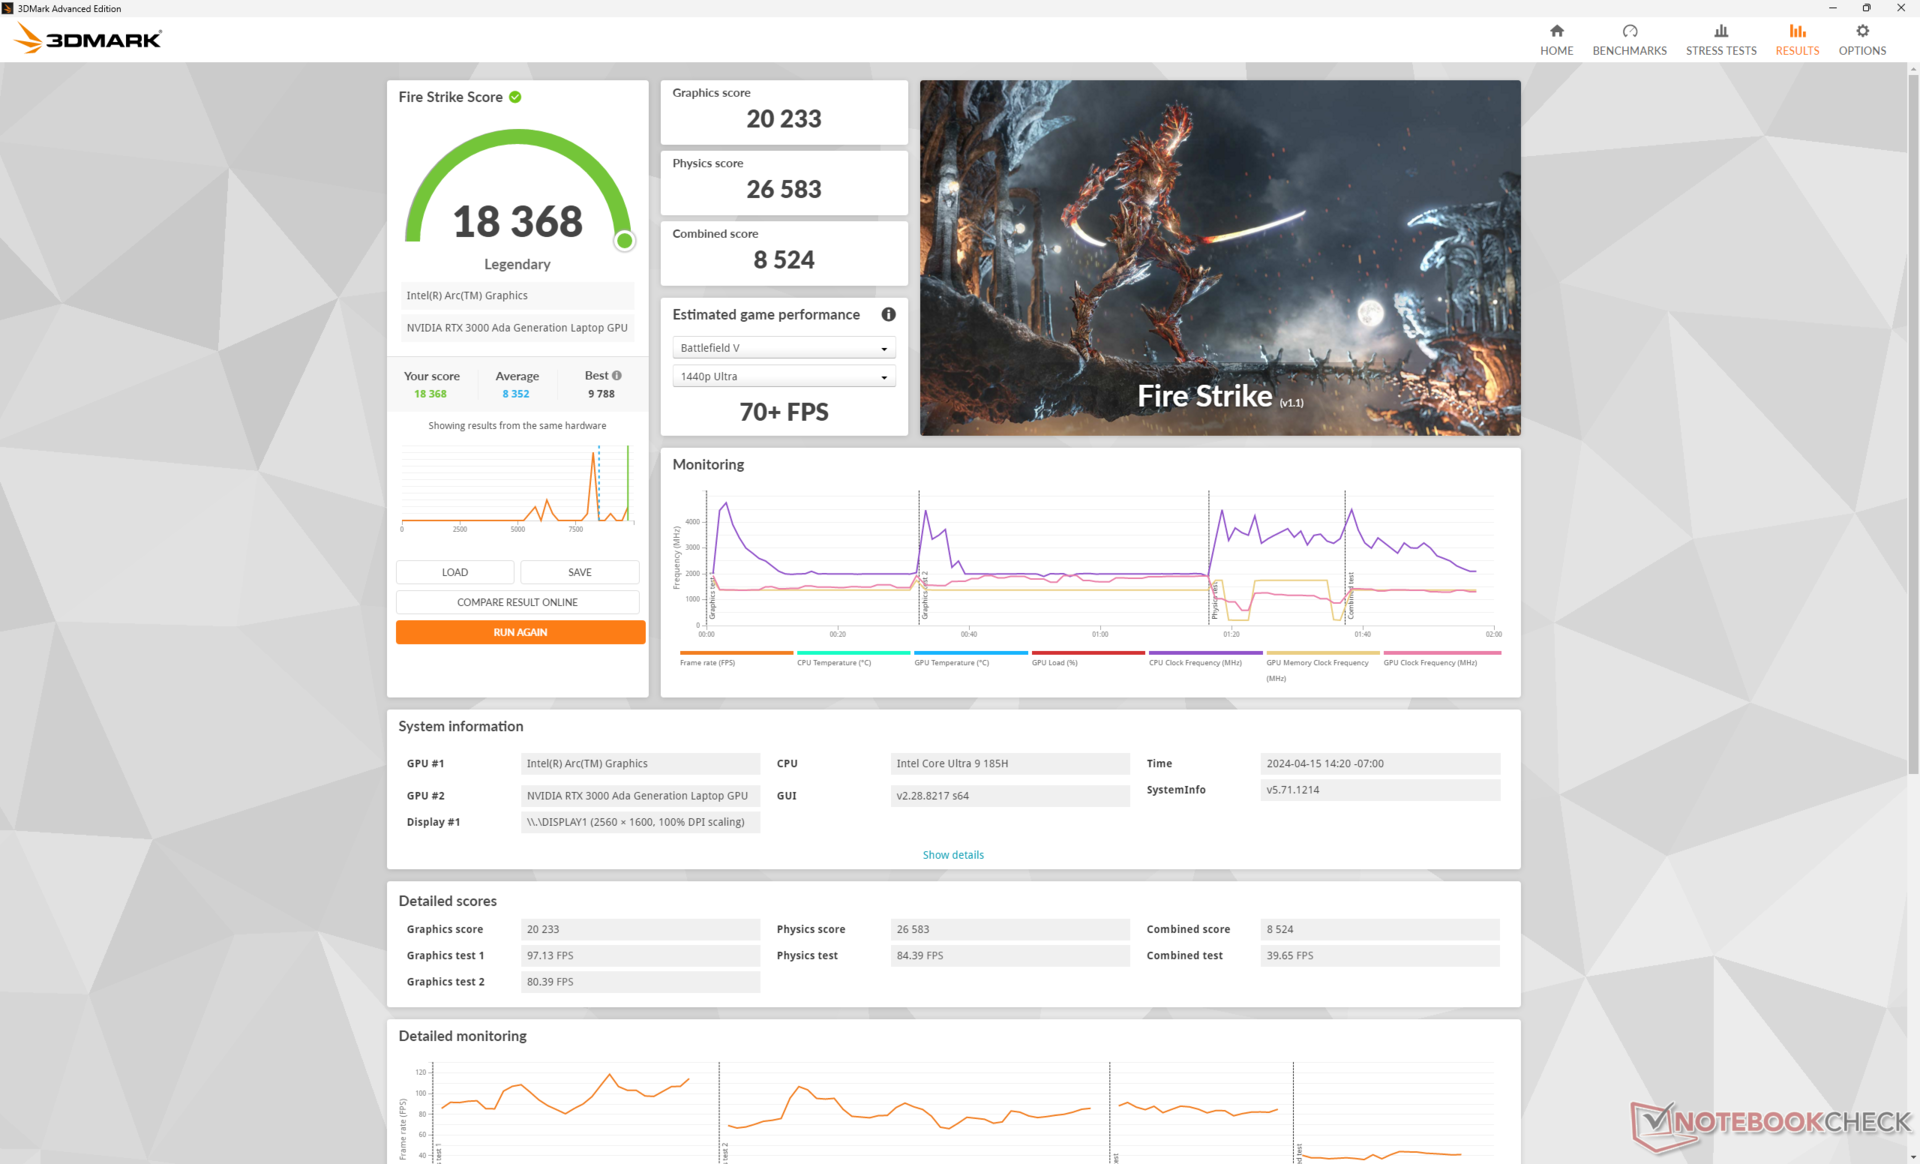
| Profilo di potenza | Punteggio grafico | Punteggio Fisica | Punteggio combinato |
| Modalità Prestazioni | 20233 | 26583 | 8524 |
| Modalità equilibrata | 19308 (-5%) | 25981 (-2%) | 7568 (-11%) |
| Alimentazione a batteria | 19040 (-6%) | 20532 (-23%) | 7331 (-14%) |
L'esecuzione in modalità Bilanciata invece che in modalità Prestazioni ha un impatto solo marginale sulle prestazioni, come dimostrano i risultati di Fire Strike. La batteria riduce le prestazioni del processore in modo più significativo rispetto alle prestazioni grafiche.
| 3DMark Performance rating - Percent | |
| Media NVIDIA RTX 3000 Ada Generation Laptop -1! | |
| Dell Precision 5000 5490 -3! | |
| Dell Precision 5480 -5! | |
| HP ZBook Power 15 G10 -11! | |
| HP ZBook Power 15 G9 6B8C4EA -18! | |
| Dell Precision 5000 5560 -4! | |
| Dell Precision 5000 5470 -11! | |
| Lenovo ThinkPad P15v G3 21EM001AGE -12! | |
| Lenovo ThinkPad P15v G2 21A9000XGE -19! | |
| Lenovo ThinkPad P14s G4 21HF0017GE -19! | |
| Lenovo ThinkPad P14s G4 21K5000LGE -21! | |
| Lenovo ThinkPad P14s G3 AMD 21J6S05000 -19! | |
| HP ZBook Firefly 14 G9-6B8A2EA -19! | |
| HP ZBook Firefly 14 G10 A -35! | |
| Lenovo ThinkPad P14s Gen1-20Y10002GE -19! | |
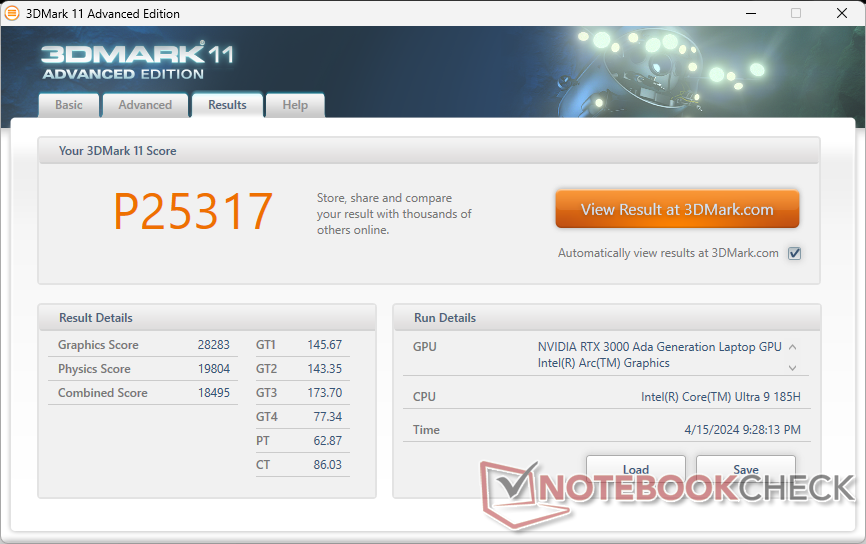
| 3DMark 11 Performance | 25317 punti | |
| 3DMark Cloud Gate Standard Score | 45774 punti | |
| 3DMark Fire Strike Score | 18368 punti | |
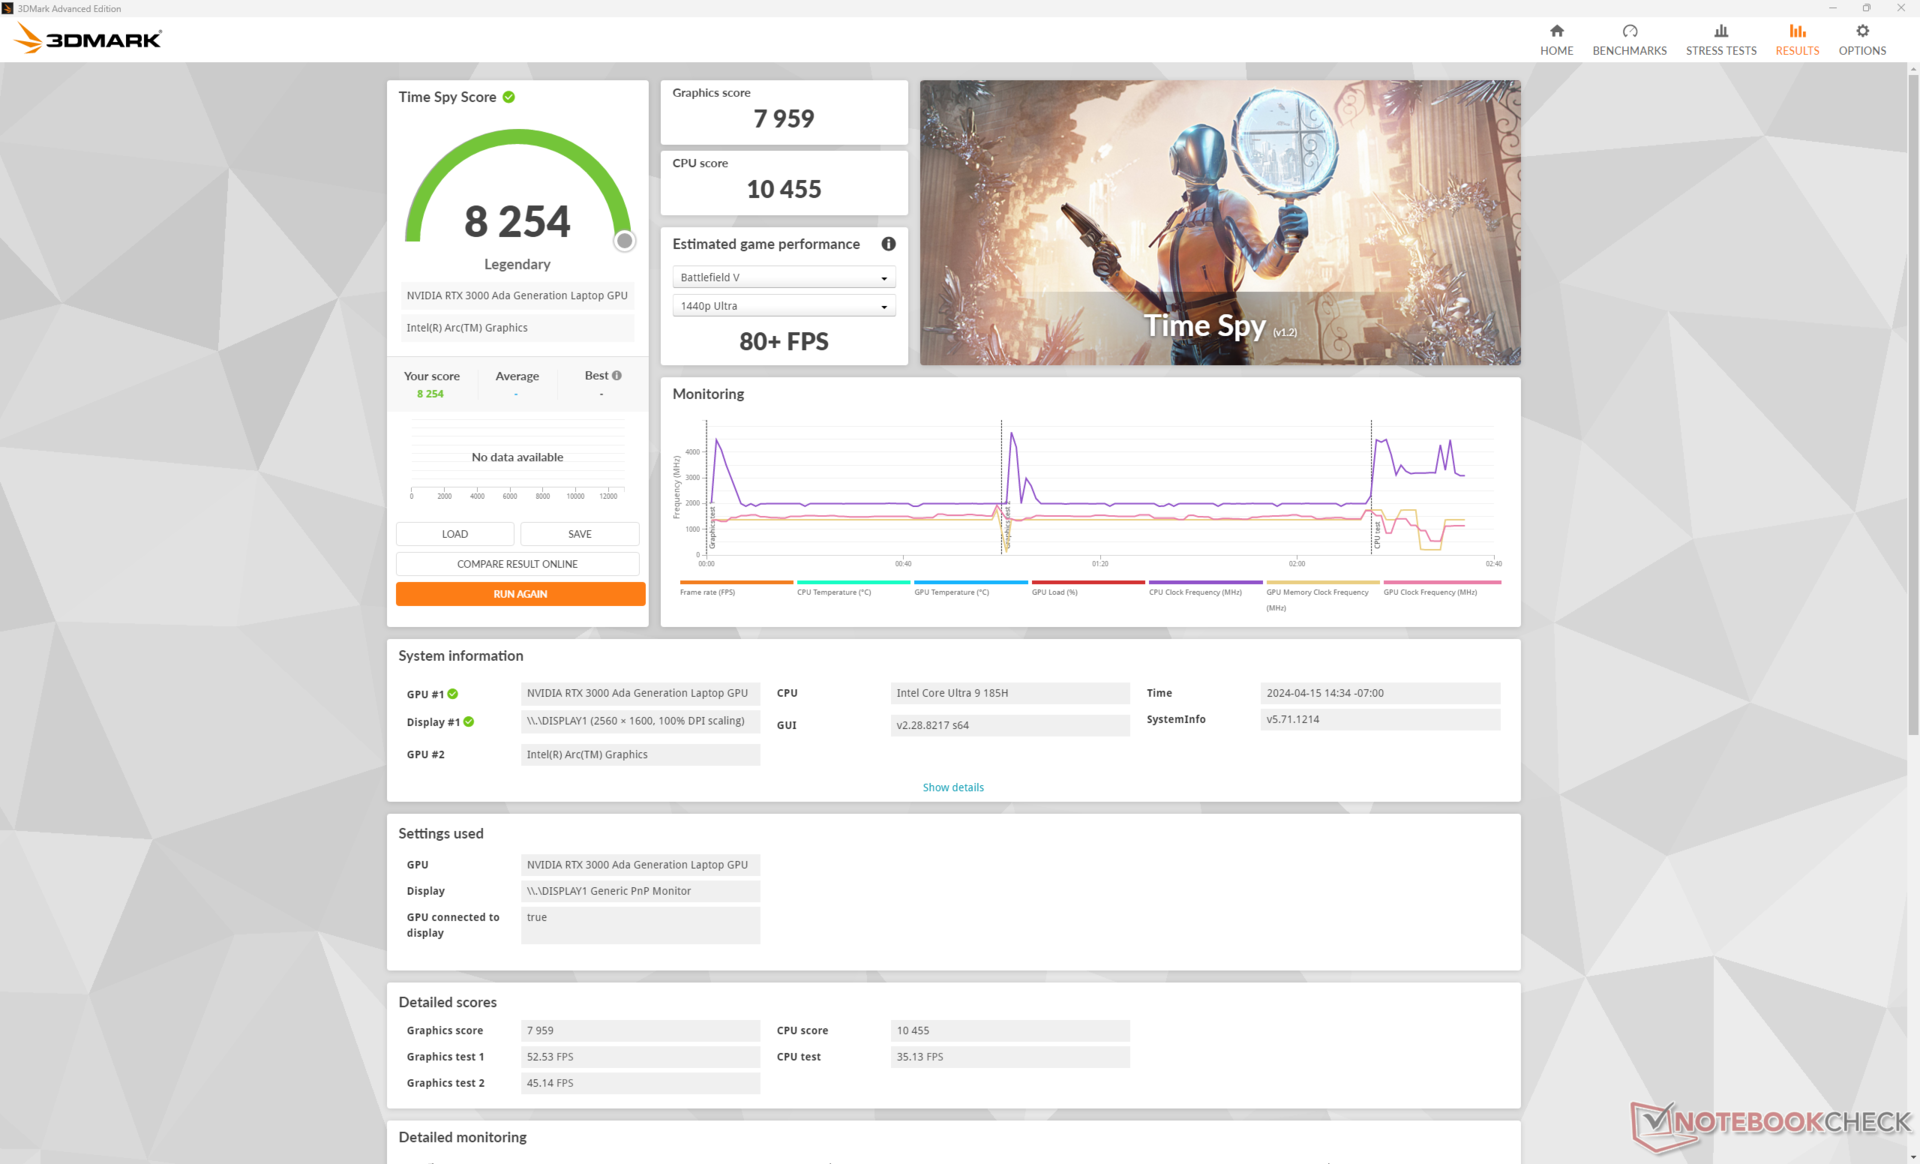
| 3DMark Time Spy Score | 8254 punti | |
Aiuto | ||
* ... Meglio usare valori piccoli
| The Witcher 3 - 1920x1080 Ultra Graphics & Postprocessing (HBAO+) | |
| Dell Precision 5000 5490 | |
| Dell Precision 5480 | |
| HP ZBook Power 15 G10 | |
| Dell Precision 5000 5560 | |
| HP ZBook Power 15 G9 6B8C4EA | |
| Lenovo ThinkPad P15v G3 21EM001AGE | |
| Dell Precision 5000 5470 | |
| Lenovo ThinkPad P15v G2 21A9000XGE | |
| Lenovo ThinkPad P14s G4 21HF0017GE | |
| Lenovo ThinkPad P14s G4 21K5000LGE | |
| Lenovo ThinkPad P14s G3 AMD 21J6S05000 | |
| HP ZBook Firefly 14 G10 A | |
| HP ZBook Firefly 14 G9-6B8A2EA | |
| Strange Brigade - 1920x1080 ultra AA:ultra AF:16 | |
| Dell Precision 5480 | |
| HP ZBook Power 15 G10 | |
| Dell Precision 5000 5490 | |
| HP ZBook Power 15 G9 6B8C4EA | |
| Lenovo ThinkPad P15v G3 21EM001AGE | |
| Dell Precision 5000 5470 | |
| Lenovo ThinkPad P15v G2 21A9000XGE | |
| Lenovo ThinkPad P14s G4 21HF0017GE | |
| Lenovo ThinkPad P14s G4 21K5000LGE | |
| HP ZBook Firefly 14 G9-6B8A2EA | |
| HP ZBook Firefly 14 G10 A | |
| Lenovo ThinkPad P14s G3 AMD 21J6S05000 | |
| Cyberpunk 2077 | |
| 1920x1080 Low Preset (FSR off) | |
| Media NVIDIA RTX 3000 Ada Generation Laptop (87.2 - 104.6, n=2) | |
| Dell Precision 5000 5490 | |
| HP ZBook Power 15 G10 | |
| Lenovo ThinkPad P14s G4 21HF0017GE | |
| 1920x1080 Medium Preset (FSR off) | |
| Media NVIDIA RTX 3000 Ada Generation Laptop (72.7 - 87.9, n=2) | |
| Dell Precision 5000 5490 | |
| HP ZBook Power 15 G10 | |
| Lenovo ThinkPad P14s G4 21HF0017GE | |
| 1920x1080 High Preset (FSR off) | |
| Media NVIDIA RTX 3000 Ada Generation Laptop (60.7 - 74.2, n=2) | |
| Dell Precision 5000 5490 | |
| HP ZBook Power 15 G10 | |
| Lenovo ThinkPad P14s G4 21HF0017GE | |
| 1920x1080 Ultra Preset (FSR off) | |
| Media NVIDIA RTX 3000 Ada Generation Laptop (52.1 - 64.3, n=2) | |
| Dell Precision 5000 5490 | |
| HP ZBook Power 15 G10 | |
| Lenovo ThinkPad P14s G4 21HF0017GE | |
| 1920x1080 Ray Tracing Ultra Preset (DLSS off) | |
| Media NVIDIA RTX 3000 Ada Generation Laptop (26.2 - 33.2, n=2) | |
| Dell Precision 5000 5490 | |
| HP ZBook Power 15 G10 | |
| Lenovo ThinkPad P14s G4 21HF0017GE | |
| Tiny Tina's Wonderlands | |
| 1920x1080 Low Preset (DX12) | |
| Media NVIDIA RTX 3000 Ada Generation Laptop (153.9 - 194, n=3) | |
| Dell Precision 5480 | |
| Dell Precision 5000 5490 | |
| HP ZBook Power 15 G10 | |
| 1920x1080 Medium Preset (DX12) | |
| Media NVIDIA RTX 3000 Ada Generation Laptop (125.4 - 157.7, n=3) | |
| Dell Precision 5480 | |
| Dell Precision 5000 5490 | |
| HP ZBook Power 15 G10 | |
| 1920x1080 High Preset (DX12) | |
| Media NVIDIA RTX 3000 Ada Generation Laptop (88 - 110, n=3) | |
| Dell Precision 5000 5490 | |
| Dell Precision 5480 | |
| HP ZBook Power 15 G10 | |
| 1920x1080 Badass Preset (DX12) | |
| Media NVIDIA RTX 3000 Ada Generation Laptop (69 - 87.9, n=3) | |
| Dell Precision 5000 5490 | |
| Dell Precision 5480 | |
| HP ZBook Power 15 G10 | |
Witcher 3 FPS Chart
| basso | medio | alto | ultra | |
|---|---|---|---|---|
| The Witcher 3 (2015) | 344 | 249.5 | 145.8 | 79.5 |
| Dota 2 Reborn (2015) | 168 | 151.3 | 136 | 123.3 |
| Final Fantasy XV Benchmark (2018) | 128.8 | 91.9 | 72.9 | |
| X-Plane 11.11 (2018) | 109.9 | 102.1 | 76.7 | |
| Far Cry 5 (2018) | 115 | 105 | 104 | 96 |
| Strange Brigade (2018) | 282 | 182.4 | 151.4 | 132.5 |
| Tiny Tina's Wonderlands (2022) | 153.9 | 125.4 | 88.5 | 70.2 |
| F1 22 (2022) | 183.6 | 168 | 127.5 | 50.4 |
| Baldur's Gate 3 (2023) | 92 | 78.8 | 70.1 | 68.8 |
| Cyberpunk 2077 (2023) | 87.2 | 72.7 | 60.7 | 52.1 |
Emissioni
Rumore del sistema
Il rumore della ventola e del soffitto è sostanzialmente identico a quello che abbiamo registrato su Precision 5480. In particolare, il limite massimo continua ad essere più alto o più rumoroso rispetto ad altre workstation da 14 pollici, soprattutto a causa della GPU più veloce del sistema Dell. Per quest'anno, Precision 5490 può almeno funzionare in modo più silenzioso per periodi più lunghi prima che le ventole inizino a salire.
Rumorosità
| Idle |
| 23.8 / 23.8 / 24.7 dB(A) |
| Sotto carico |
| 38.9 / 51.4 dB(A) |
 | ||
30 dB silenzioso 40 dB(A) udibile 50 dB(A) rumoroso |
||
min: | ||
| Dell Precision 5000 5490 RTX 3000 Ada Generation Laptop, Ultra 9 185H, Kioxia XG8 KXG80ZNV1T02 | Lenovo ThinkPad P14s G4 21HF0017GE RTX A500 Laptop GPU, i7-1370P, SK Hynix HFS002TEJ9X162N | HP ZBook Firefly 14 G10 A Radeon 760M, R5 PRO 7640HS, Samsung PM9B1 512GB MZVL4512HBLU | HP ZBook Firefly 14 G9-6B8A2EA T550 Laptop GPU, i7-1265U, Micron 3400 1TB MTFDKBA1T0TFH | Dell Precision 5480 RTX 3000 Ada Generation Laptop, i9-13900H, Samsung PM9A1 MZVL21T0HCLR | Dell Precision 5000 5470 RTX A1000 Laptop GPU, i9-12900H, Samsung PM9A1 MZVL21T0HCLR | |
|---|---|---|---|---|---|---|
| Noise | -1% | -4% | 4% | 0% | -2% | |
| off /ambiente * (dB) | 22.8 | 24.6 -8% | 25 -10% | 23.6 -4% | 23.5 -3% | 23 -1% |
| Idle Minimum * (dB) | 23.8 | 24.6 -3% | 25 -5% | 23.6 1% | 23.5 1% | 23.3 2% |
| Idle Average * (dB) | 23.8 | 24.6 -3% | 26 -9% | 23.6 1% | 23.5 1% | 23.3 2% |
| Idle Maximum * (dB) | 24.7 | 25.9 -5% | 27 -9% | 23.6 4% | 23.5 5% | 23.3 6% |
| Load Average * (dB) | 38.9 | 41.3 -6% | 45 -16% | 42.5 -9% | 39.9 -3% | 48.5 -25% |
| Witcher 3 ultra * (dB) | 49.9 | 46 8% | 45 10% | 42.5 15% | 50.1 -0% | 48.6 3% |
| Load Maximum * (dB) | 51.4 | 46.2 10% | 46 11% | 42.5 17% | 51 1% | 50.4 2% |
| Cyberpunk 2077 ultra * (dB) | 44.2 |
* ... Meglio usare valori piccoli
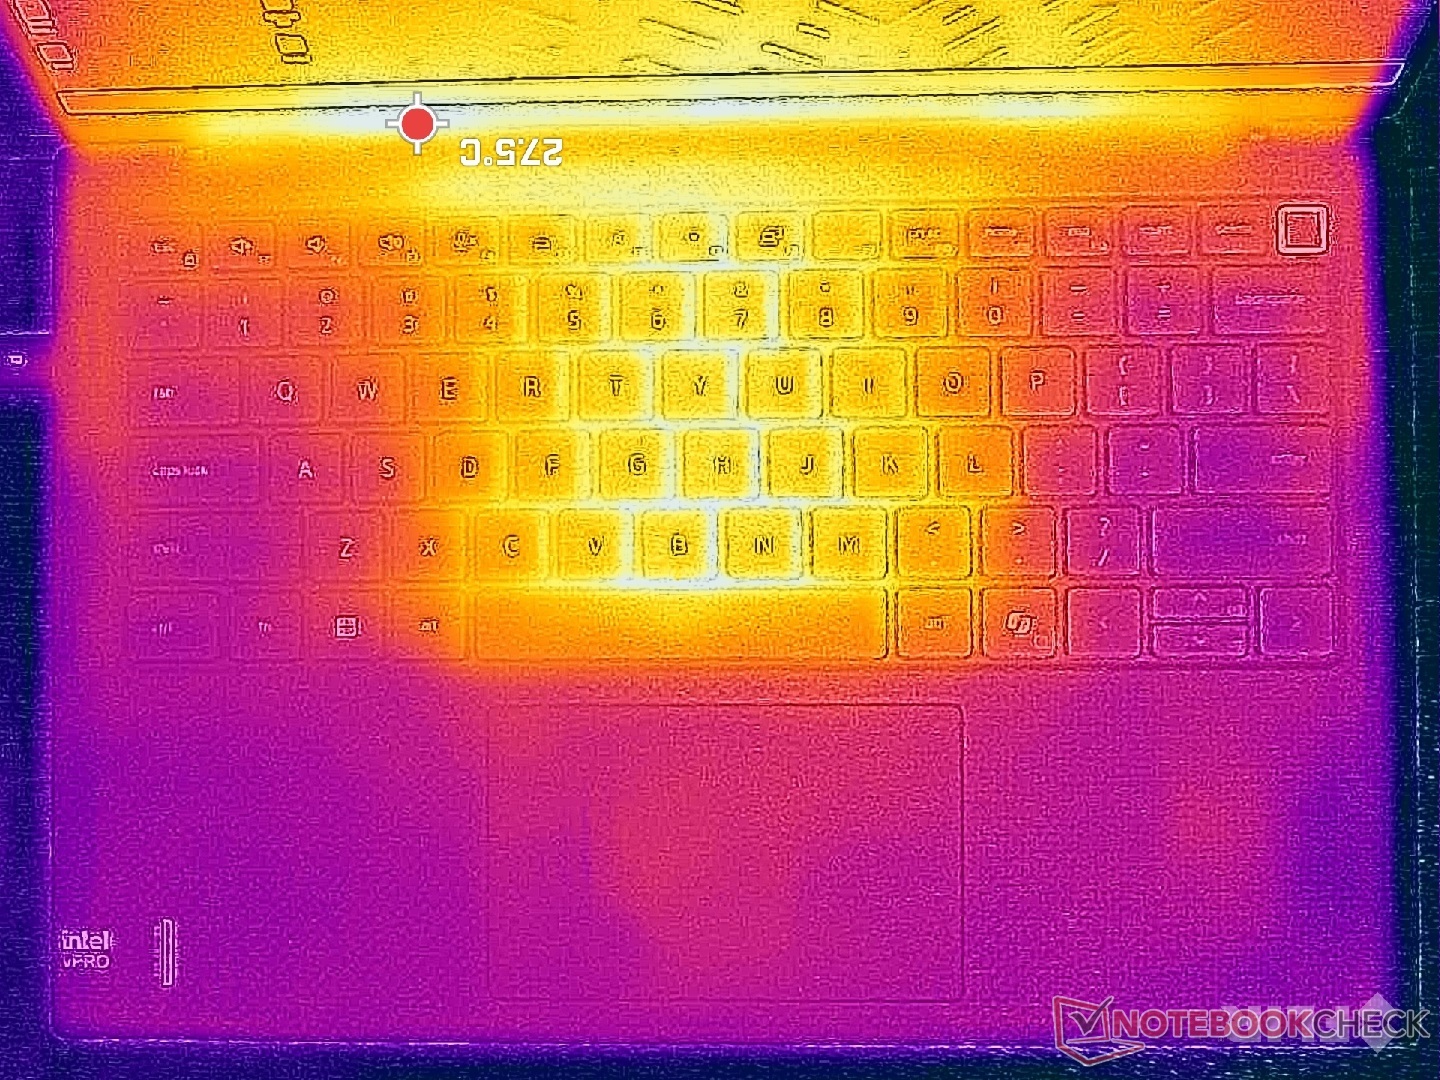
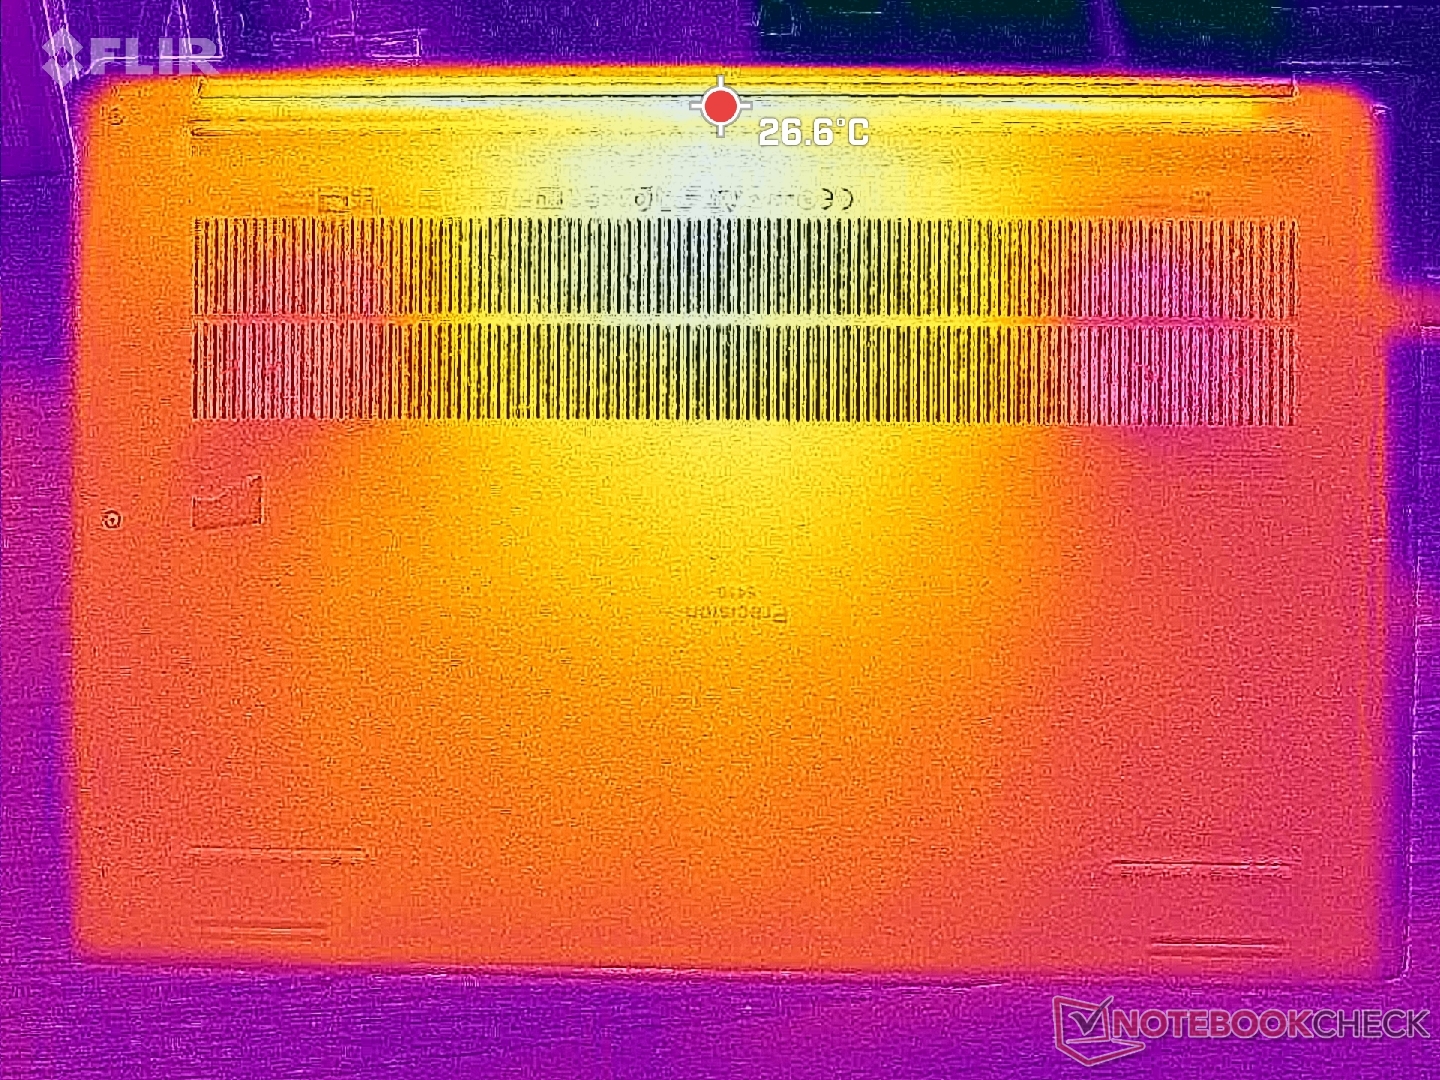
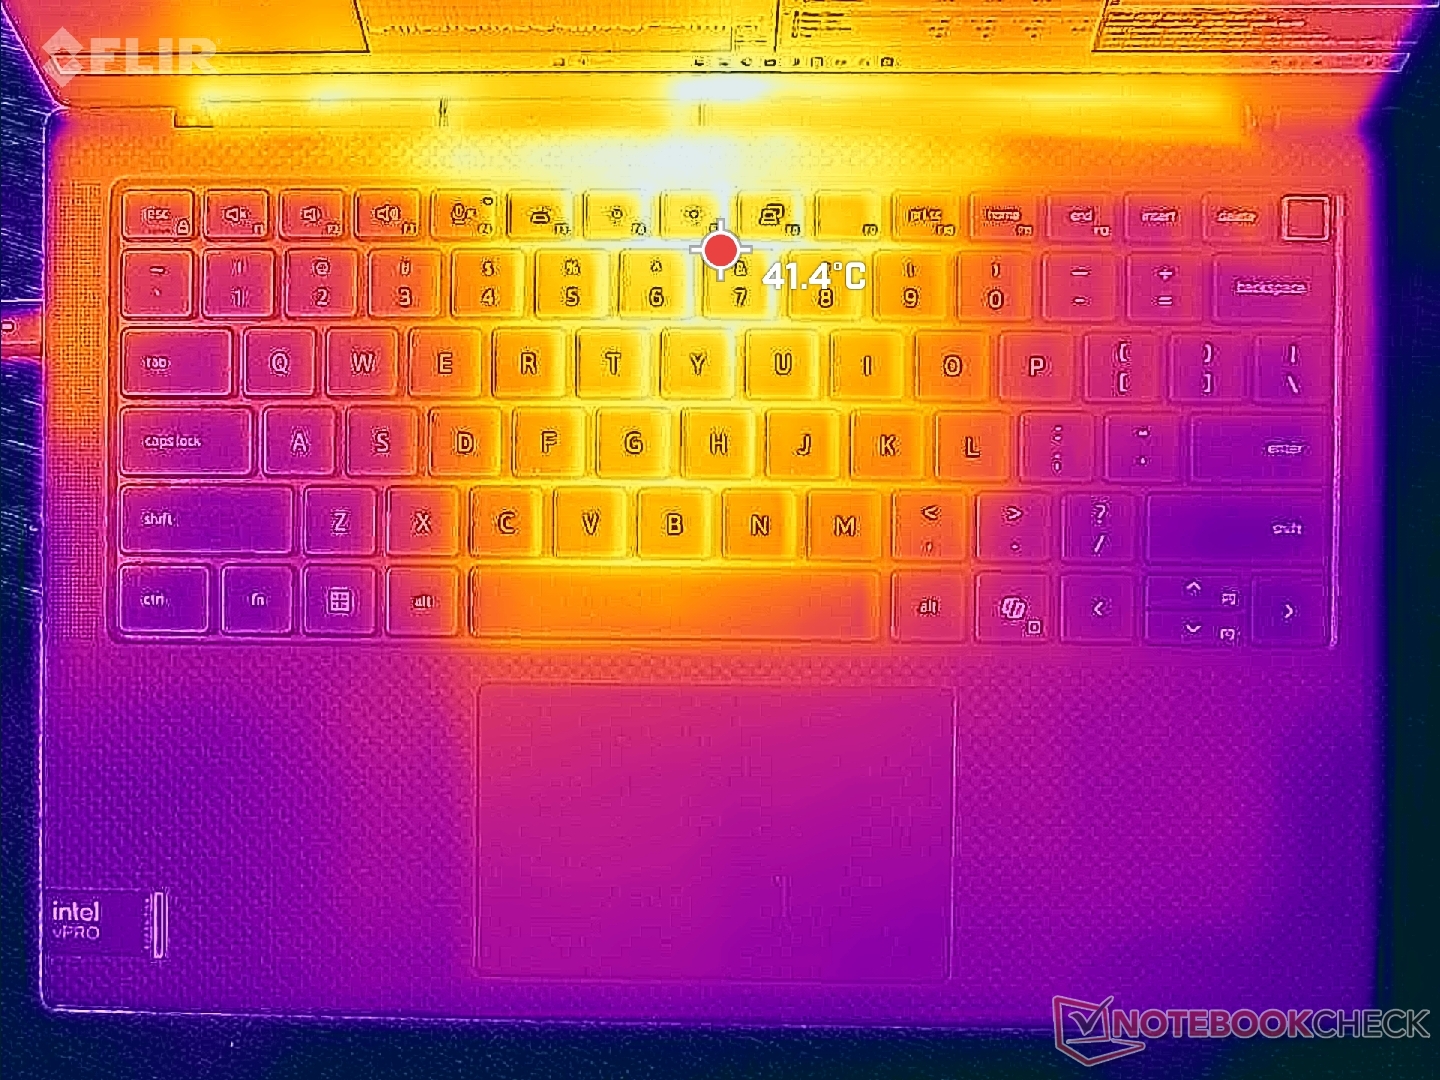
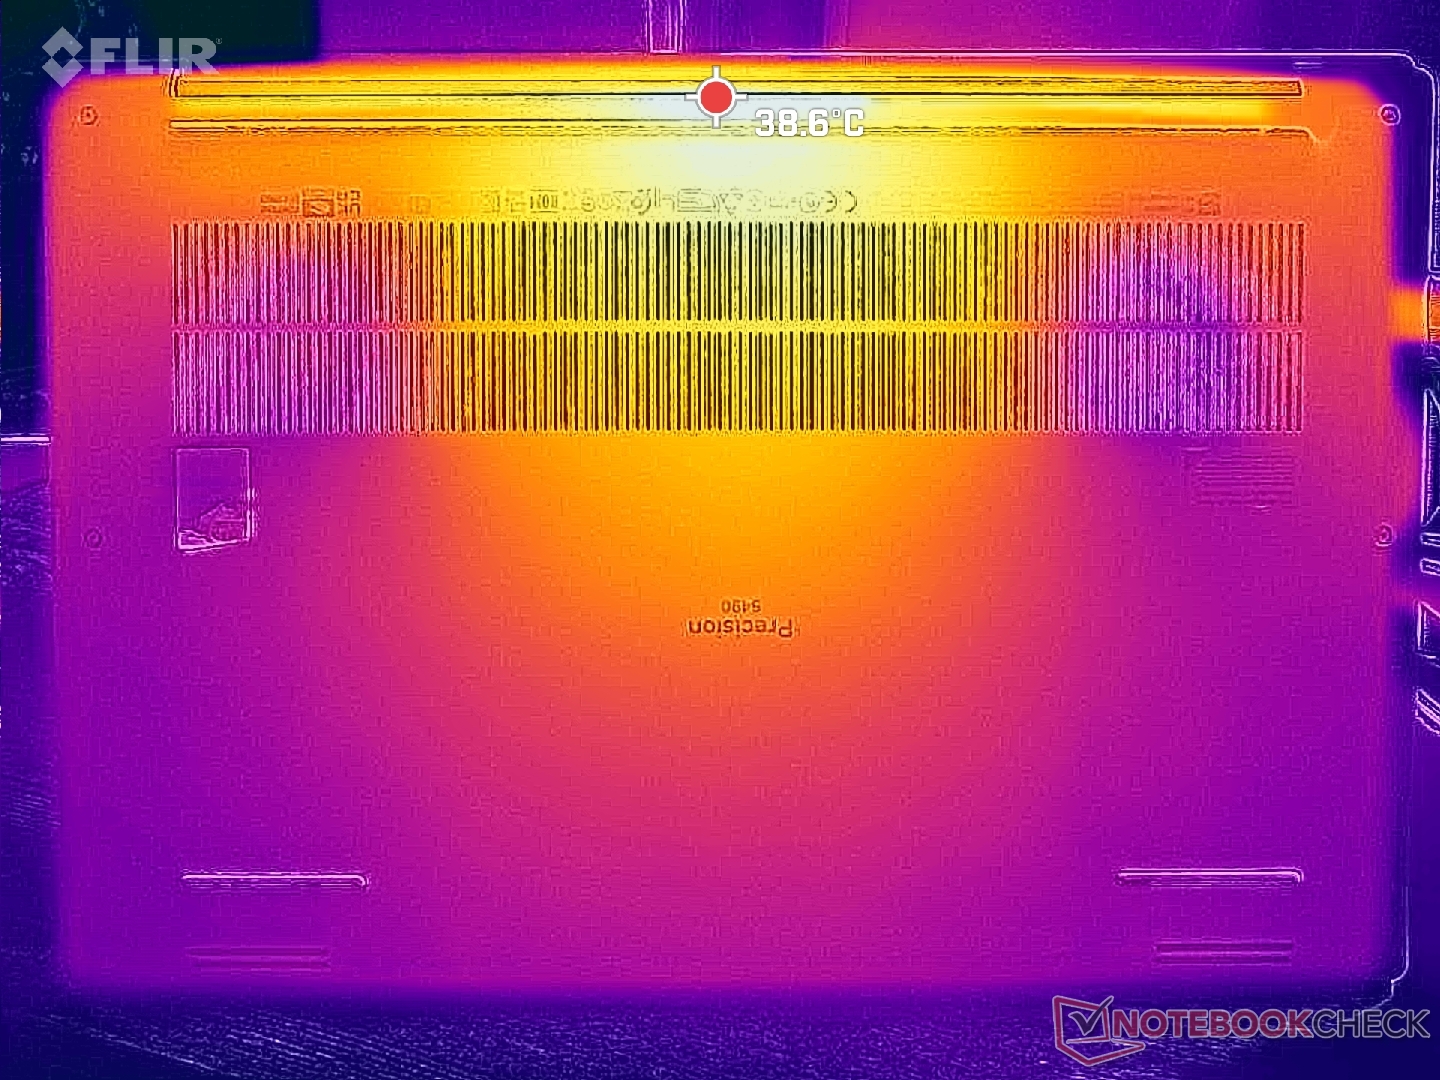
Temperatura
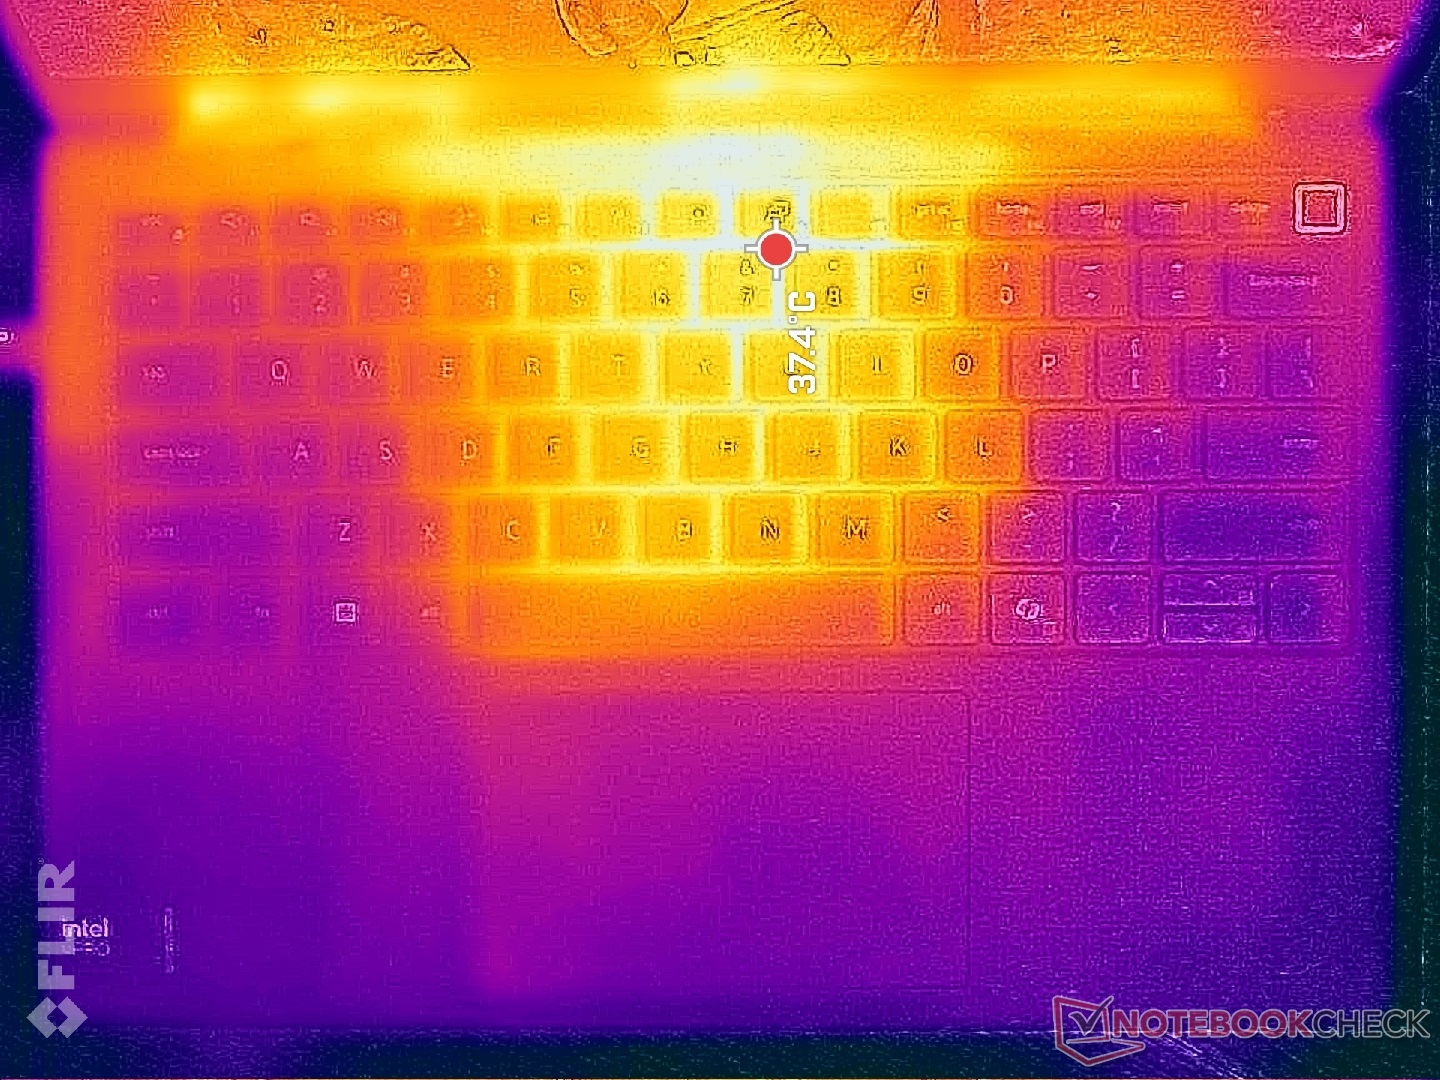
Lo sviluppo della temperatura è simmetrico e quindi i punti caldi sono più vicini al centro della tastiera, mentre i lati e i poggiapolsi sono molto più freddi. I punti caldi sono comunque sensibilmente più freddi rispetto al modello HP ZBook Firefly 14 G10 di diversi gradi C.
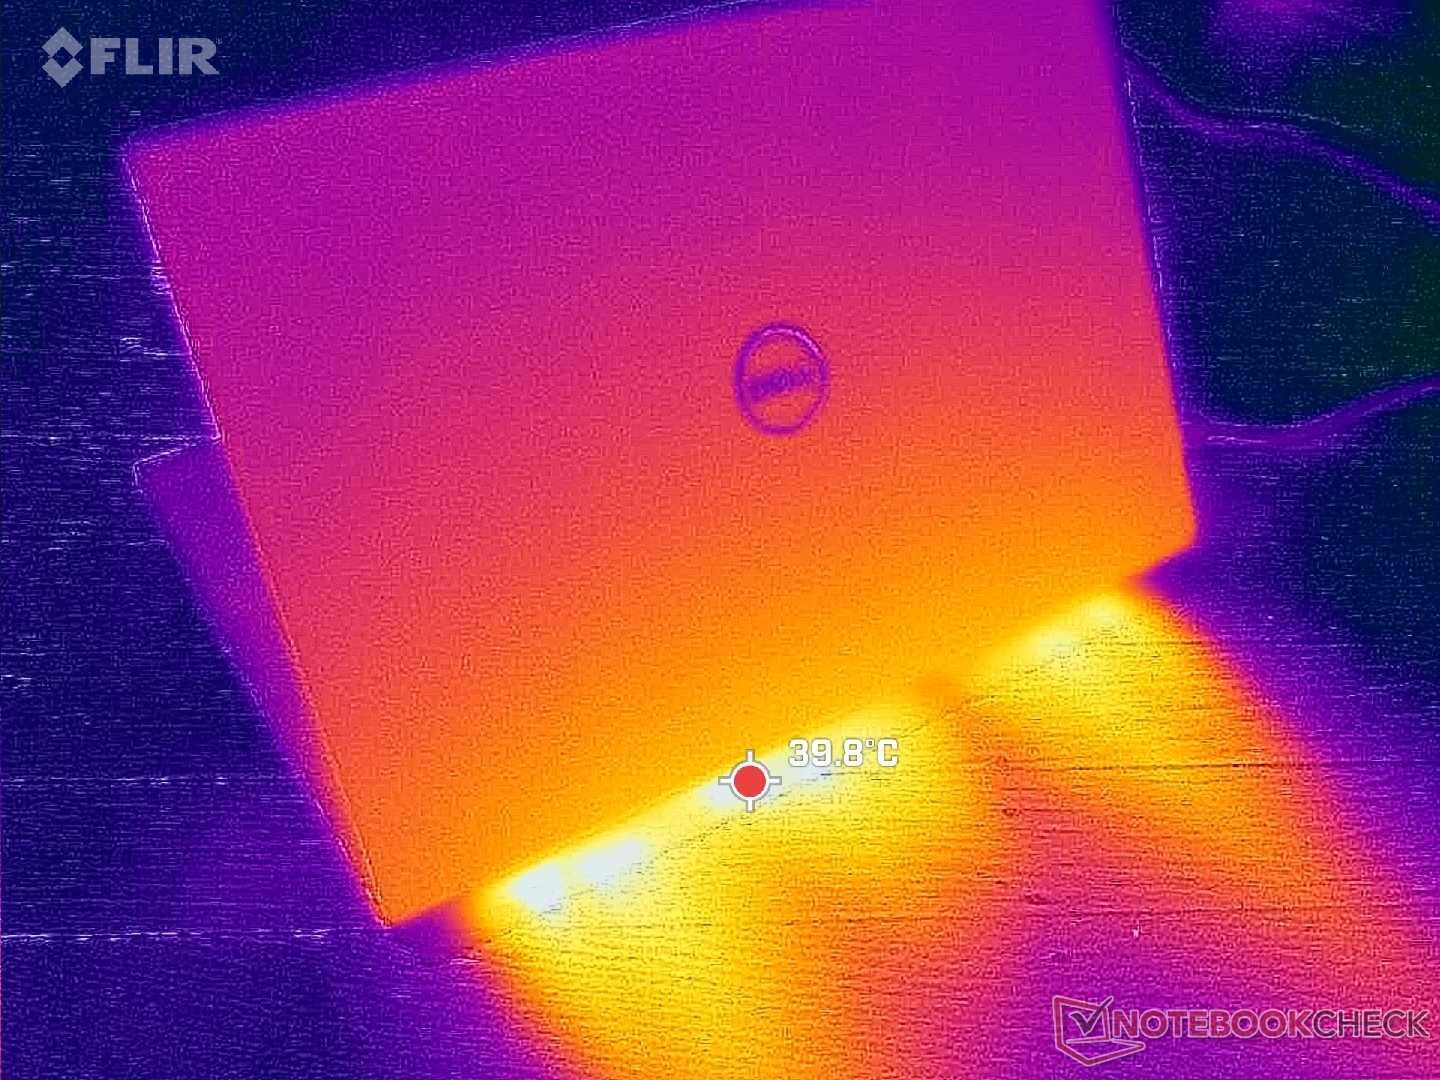
(±) La temperatura massima sul lato superiore è di 43.2 °C / 110 F, rispetto alla media di 38.2 °C / 101 F, che varia da 22.2 a 69.8 °C per questa classe Workstation.
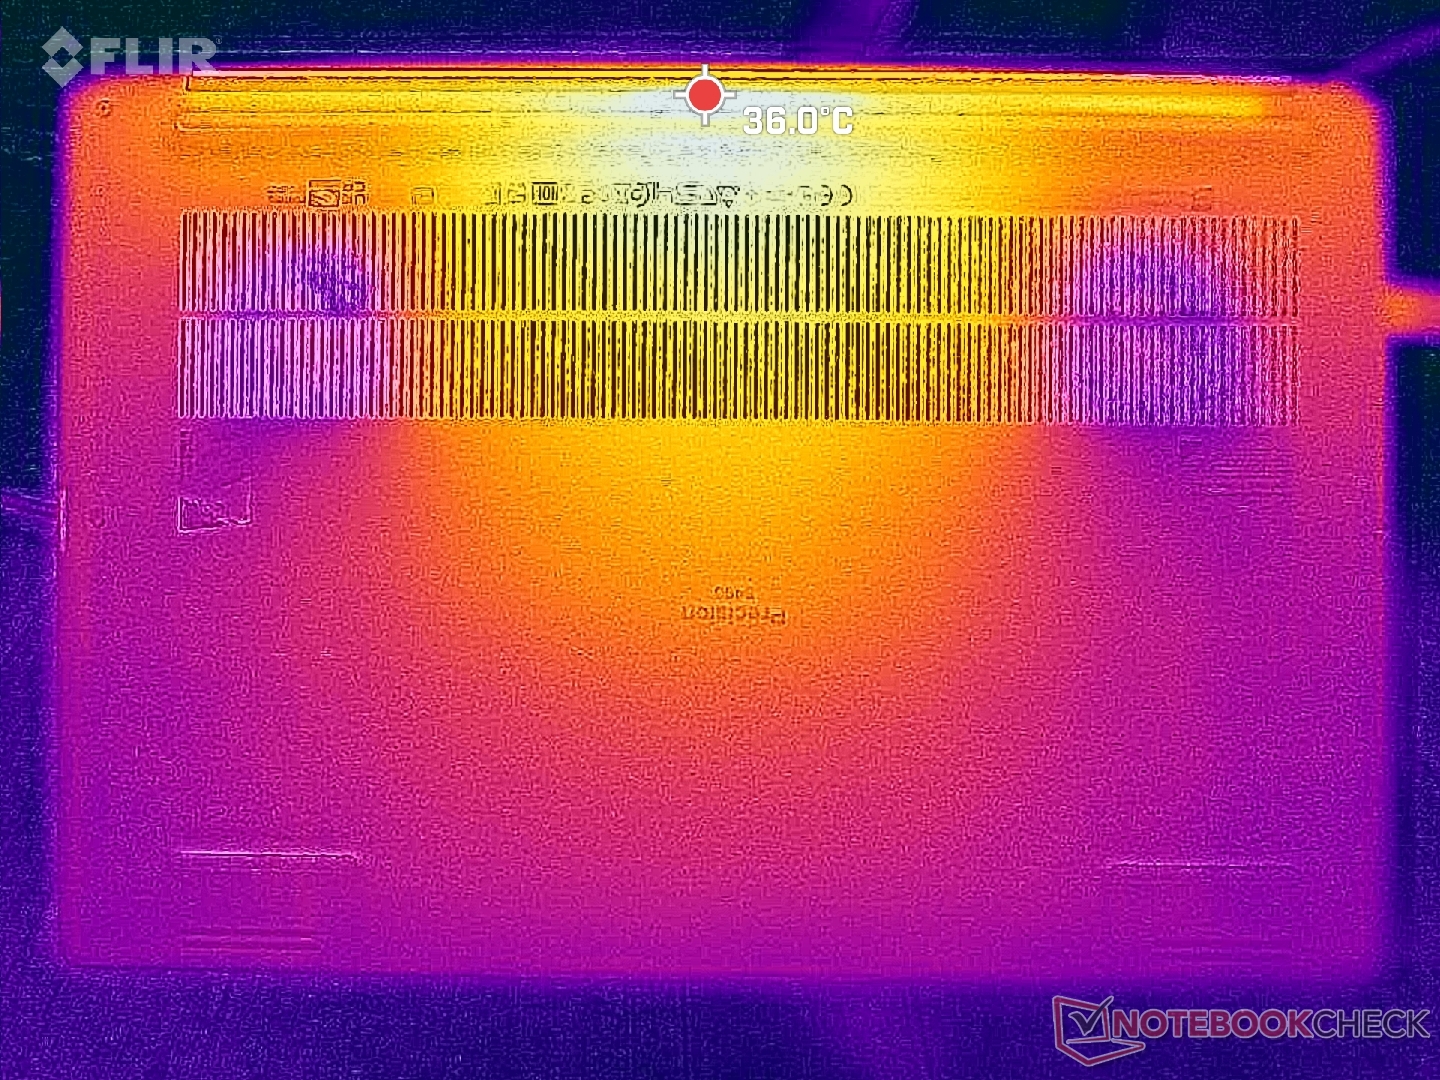
(+) Il lato inferiore si riscalda fino ad un massimo di 38.4 °C / 101 F, rispetto alla media di 41.1 °C / 106 F
(+) In idle, la temperatura media del lato superiore è di 29 °C / 84 F, rispetto alla media deld ispositivo di 32 °C / 90 F.
(+) Riproducendo The Witcher 3, la temperatura media per il lato superiore e' di 31.7 °C / 89 F, rispetto alla media del dispositivo di 32 °C / 90 F.
(+) I poggiapolsi e il touchpad sono piu' freddi della temperatura della pelle con un massimo di 27.6 °C / 81.7 F e sono quindi freddi al tatto.
(±) La temperatura media della zona del palmo della mano di dispositivi simili e'stata di 27.8 °C / 82 F (+0.2 °C / 0.3 F).
| Dell Precision 5000 5490 Intel Core Ultra 9 185H, NVIDIA RTX 3000 Ada Generation Laptop | Lenovo ThinkPad P14s G4 21HF0017GE Intel Core i7-1370P, NVIDIA RTX A500 Laptop GPU | HP ZBook Firefly 14 G10 A AMD Ryzen 5 PRO 7640HS, AMD Radeon 760M | HP ZBook Firefly 14 G9-6B8A2EA Intel Core i7-1265U, NVIDIA T550 Laptop GPU | Dell Precision 5480 Intel Core i9-13900H, NVIDIA RTX 3000 Ada Generation Laptop | Dell Precision 5000 5470 Intel Core i9-12900H, NVIDIA RTX A1000 Laptop GPU | |
|---|---|---|---|---|---|---|
| Heat | -13% | -4% | 2% | -13% | -3% | |
| Maximum Upper Side * (°C) | 43.2 | 55.3 -28% | 50 -16% | 41.2 5% | 44 -2% | 41.8 3% |
| Maximum Bottom * (°C) | 38.4 | 48.7 -27% | 51 -33% | 47.9 -25% | 38.2 1% | 36 6% |
| Idle Upper Side * (°C) | 31.6 | 31 2% | 25 21% | 26.5 16% | 38.8 -23% | 34.6 -9% |
| Idle Bottom * (°C) | 30.6 | 29.9 2% | 27 12% | 27 12% | 38.6 -26% | 33.6 -10% |
* ... Meglio usare valori piccoli
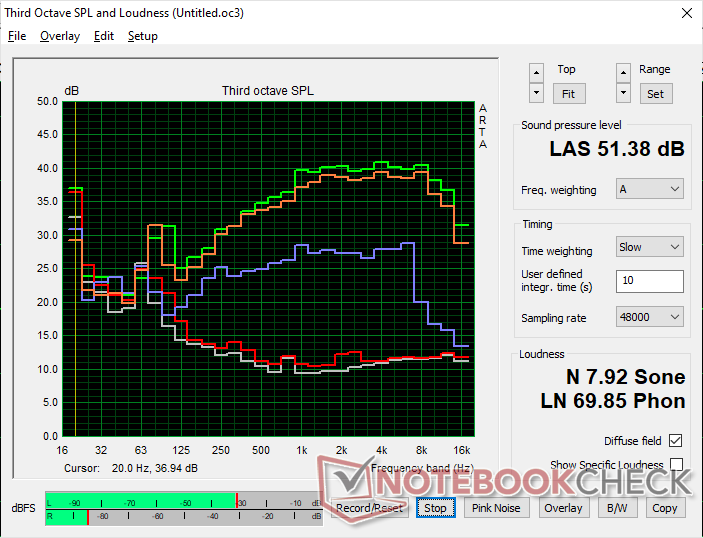
Altoparlanti
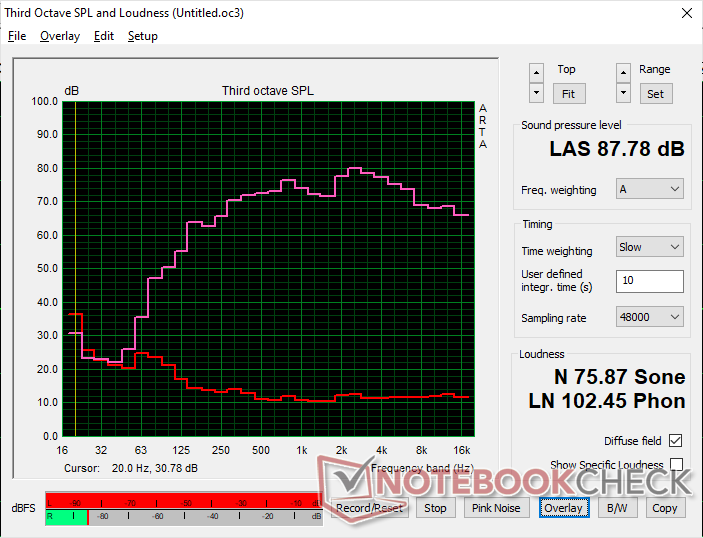
Dell Precision 5000 5490 analisi audio
(+) | gli altoparlanti sono relativamente potenti (87.8 dB)
Bassi 100 - 315 Hz
(±) | bassi ridotti - in media 10.9% inferiori alla media
(±) | la linearità dei bassi è media (7.2% delta rispetto alla precedente frequenza)
Medi 400 - 2000 Hz
(+) | medi bilanciati - solo only 1.7% rispetto alla media
(+) | medi lineari (3.5% delta rispetto alla precedente frequenza)
Alti 2 - 16 kHz
(+) | Alti bilanciati - appena 4.4% dalla media
(+) | alti lineari (3.4% delta rispetto alla precedente frequenza)
Nel complesso 100 - 16.000 Hz
(+) | suono nel complesso lineare (9.2% differenza dalla media)
Rispetto alla stessa classe
» 4% di tutti i dispositivi testati in questa classe è stato migliore, 2% simile, 94% peggiore
» Il migliore ha avuto un delta di 7%, medio di 17%, peggiore di 35%
Rispetto a tutti i dispositivi testati
» 3% di tutti i dispositivi testati in questa classe è stato migliore, 1% similare, 96% peggiore
» Il migliore ha avuto un delta di 4%, medio di 24%, peggiore di 134%
Apple MacBook Pro 16 2021 M1 Pro analisi audio
(+) | gli altoparlanti sono relativamente potenti (84.7 dB)
Bassi 100 - 315 Hz
(+) | bassi buoni - solo 3.8% dalla media
(+) | bassi in lineaa (5.2% delta rispetto alla precedente frequenza)
Medi 400 - 2000 Hz
(+) | medi bilanciati - solo only 1.3% rispetto alla media
(+) | medi lineari (2.1% delta rispetto alla precedente frequenza)
Alti 2 - 16 kHz
(+) | Alti bilanciati - appena 1.9% dalla media
(+) | alti lineari (2.7% delta rispetto alla precedente frequenza)
Nel complesso 100 - 16.000 Hz
(+) | suono nel complesso lineare (4.6% differenza dalla media)
Rispetto alla stessa classe
» 0% di tutti i dispositivi testati in questa classe è stato migliore, 0% simile, 100% peggiore
» Il migliore ha avuto un delta di 5%, medio di 17%, peggiore di 45%
Rispetto a tutti i dispositivi testati
» 0% di tutti i dispositivi testati in questa classe è stato migliore, 0% similare, 100% peggiore
» Il migliore ha avuto un delta di 4%, medio di 24%, peggiore di 134%
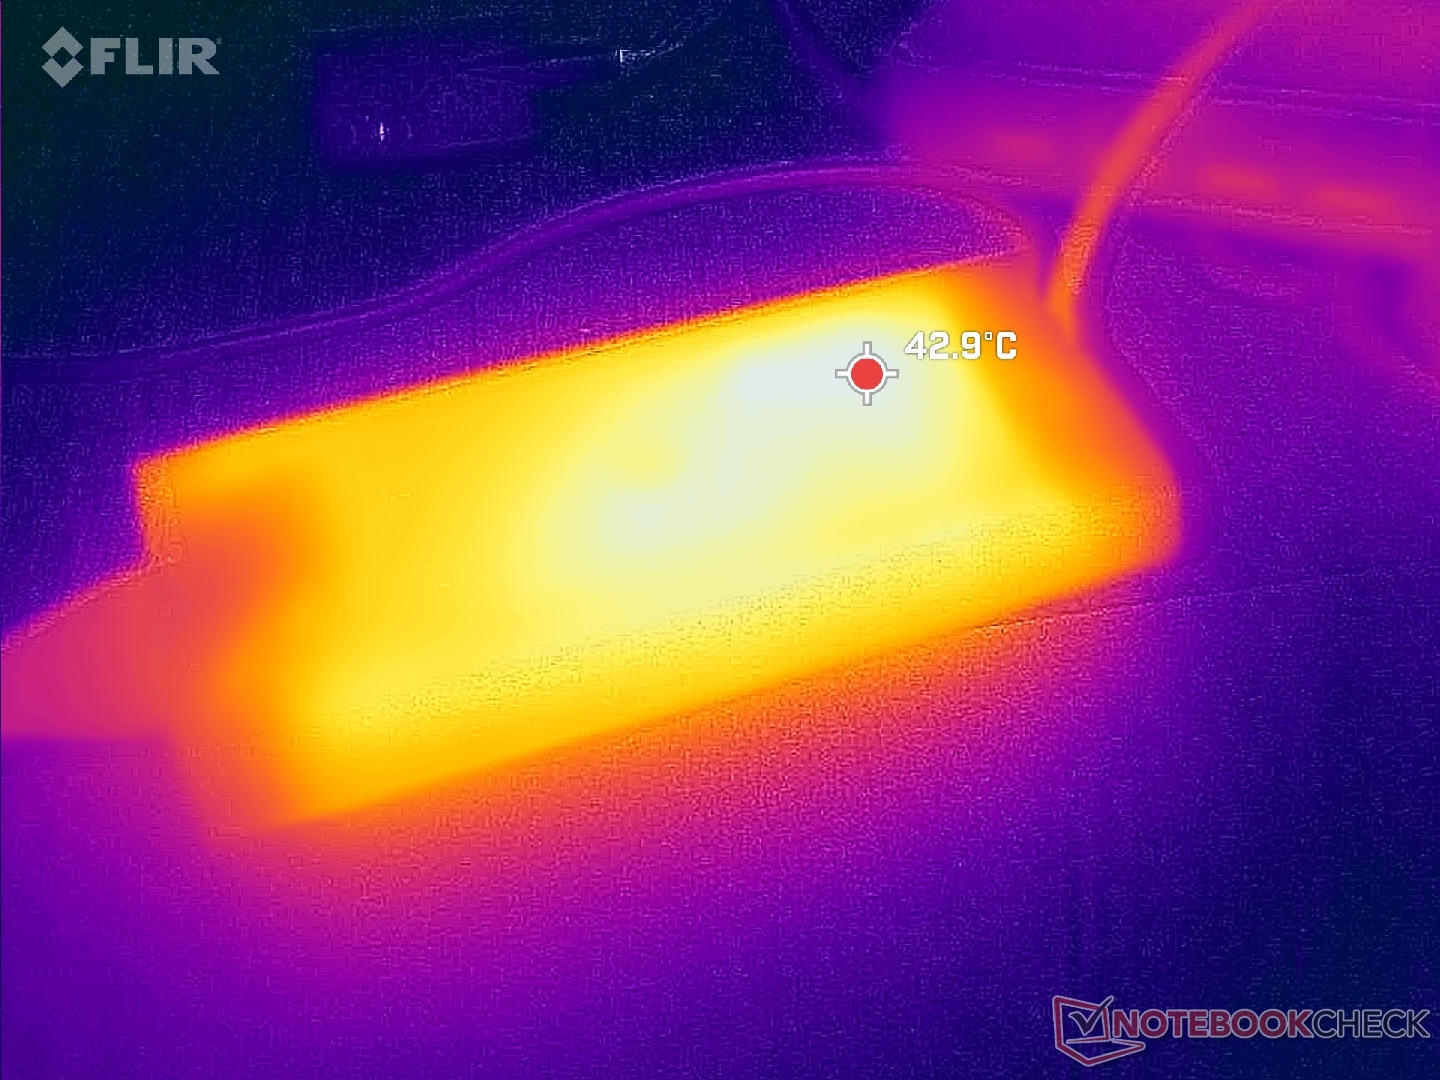
Gestione dell'energia
Consumo di energia
In esecuzione Witcher 3 richiede una media di 88 W per avvicinarsi a quanto abbiamo registrato su Precision 5480, nonostante le differenze di CPU. Rispetto ad altre workstation da 14 pollici, Precision 5490 è una delle più esigenti, il che si allinea alle sue prestazioni relativamente veloci.
Un adattatore USB-C da 100 W viene fornito con le configurazioni che non utilizzano grafica discreta. Altrimenti, un adattatore USB-C da 130 W viene fornito di serie.
(Nota dell'editore: questa sezione sarà aggiornata quando le riparazioni del nostro multimetro Metrahit Energy saranno completate alla fine del mese. Ci scusiamo per l'inconveniente)
| Off / Standby | |
| Idle | |
| Sotto carico |
|
Leggenda:
min: | |
| Dell Precision 5000 5490 Ultra 9 185H, RTX 3000 Ada Generation Laptop, Kioxia XG8 KXG80ZNV1T02, IPS, 2560x1600, 14" | Lenovo ThinkPad P14s G4 21HF0017GE i7-1370P, RTX A500 Laptop GPU, SK Hynix HFS002TEJ9X162N, OLED, 2880x1800, 14" | HP ZBook Firefly 14 G10 A R5 PRO 7640HS, Radeon 760M, Samsung PM9B1 512GB MZVL4512HBLU, IPS, 1920x1200, 14" | HP ZBook Firefly 14 G9-6B8A2EA i7-1265U, T550 Laptop GPU, Micron 3400 1TB MTFDKBA1T0TFH, IPS, 1920x1200, 14" | Dell Precision 5480 i9-13900H, RTX 3000 Ada Generation Laptop, Samsung PM9A1 MZVL21T0HCLR, IPS, 2560x1600, 14" | Dell Precision 5000 5470 i9-12900H, RTX A1000 Laptop GPU, Samsung PM9A1 MZVL21T0HCLR, IPS, 2560x1600, 14" | |
|---|---|---|---|---|---|---|
| Power Consumption | 32% | 51% | 52% | -24% | 11% | |
| Idle Minimum * (Watt) | 11.1 | 6.3 43% | 3 73% | 4.2 62% | 14.9 -34% | 4.3 61% |
| Idle Average * (Watt) | 14.8 | 7 53% | 4 73% | 6.5 56% | 19.5 -32% | 8.9 40% |
| Idle Maximum * (Watt) | 16.5 | 8.1 51% | 8 52% | 7.2 56% | 27.2 -65% | 18.9 -15% |
| Load Average * (Watt) | 70.1 | 84.6 -21% | 56 20% | 47.7 32% | 81.6 -16% | 94 -34% |
| Witcher 3 ultra * (Watt) | 93.1 | 56.5 39% | 58.2 37% | 42.9 54% | 90.4 3% | 83.2 11% |
| Load Maximum * (Watt) | 137.5 | 98.3 29% | 66 52% | 68.2 50% | 137.8 -0% | 137.5 -0% |
* ... Meglio usare valori piccoli
Power Consumption Witcher 3 / Stresstest
Power Consumption external Monitor
Durata della batteria
La durata della batteria è quasi identica a quella che abbiamo registrato su Precision 5480, poiché i due modelli condividono componenti e livelli di prestazioni simili.
| Dell Precision 5000 5490 Ultra 9 185H, RTX 3000 Ada Generation Laptop, 72 Wh | Lenovo ThinkPad P14s G4 21HF0017GE i7-1370P, RTX A500 Laptop GPU, 52.5 Wh | HP ZBook Firefly 14 G10 A R5 PRO 7640HS, Radeon 760M, 51 Wh | HP ZBook Firefly 14 G9-6B8A2EA i7-1265U, T550 Laptop GPU, 51 Wh | Dell Precision 5480 i9-13900H, RTX 3000 Ada Generation Laptop, 72 Wh | Dell Precision 5000 5470 i9-12900H, RTX A1000 Laptop GPU, 72 Wh | |
|---|---|---|---|---|---|---|
| Autonomia della batteria | -45% | 18% | -20% | -1% | -13% | |
| WiFi v1.3 (h) | 11 | 6.1 -45% | 13 18% | 8.8 -20% | 10.9 -1% | 9.6 -13% |
| Load (h) | 1 | 0.9 | 1.1 | |||
| Reader / Idle (h) | 14.7 |
Pro
Contro
Verdetto - Quasi indistinguibile da Precision 5480
Il Precision 5480 ha fornito un notevole incremento della GPU rispetto alla Precision 5470 grazie al salto di generazione della GPU, anche se i loro telai erano identici. Per Precision 5490, tuttavia, il modello non introduce nuove opzioni di GPU e quindi la RTX 3000 Ada rimane la configurazione top-end. Se le prestazioni della GPU sono prioritarie, il modello Precision 5490 funzionerà in modo identico al modello Precision 5480.
Le prestazioni della CPU e le prestazioni grafiche rimangono stagnanti tra Precision 5490 e Precision 5480. Invece, l'ultimo modello si concentra sull'accelerazione AI, che al momento della pubblicazione è ancora agli inizi.
Al di fuori della GPU, il salto della CPU da Raptor Lake-H a Meteor Lake-H non offre grandi vantaggi in termini di prestazioni grezze. La sua NPU integrata, che è il principale punto di forza di Precision 5490, ha poche applicazioni al momento in cui scriviamo. Acquistare Precision 5490 oggi significa quindi investire nell'accelerazione AI locale e nelle future funzionalità AI di Windows.
Per i modelli futuri, vorremmo vedere opzioni di visualizzazione aggiuntive, soprattutto per le applicazioni che richiedono colori P3 e tempi di risposta in bianco e nero più rapidi. Alternative come il ThinkPad P14s offrono OLED, mentre il nostro Precision è bloccato solo con IPS.
Prezzo e disponibilità
Dell distribuisce ora il modello Precision 5490 a partire da 2250 dollari per la configurazione base Core Ultra 5, RTX 1000 Ada e 1200p, fino a oltre 3900 dollari per la configurazione di fascia alta Core Ultra 9, RTX 3000 Ada e 1600p.
Dell Precision 5000 5490
- 04/25/2024 v7 (old)
Allen Ngo
Transparency
La selezione dei dispositivi da recensire viene effettuata dalla nostra redazione. Il campione di prova è stato fornito all'autore come prestito dal produttore o dal rivenditore ai fini di questa recensione. L'istituto di credito non ha avuto alcuna influenza su questa recensione, né il produttore ne ha ricevuto una copia prima della pubblicazione. Non vi era alcun obbligo di pubblicare questa recensione. In quanto società mediatica indipendente, Notebookcheck non è soggetta all'autorità di produttori, rivenditori o editori.
Ecco come Notebookcheck esegue i test
Ogni anno, Notebookcheck esamina in modo indipendente centinaia di laptop e smartphone utilizzando procedure standardizzate per garantire che tutti i risultati siano comparabili. Da circa 20 anni sviluppiamo continuamente i nostri metodi di prova e nel frattempo stabiliamo gli standard di settore. Nei nostri laboratori di prova, tecnici ed editori esperti utilizzano apparecchiature di misurazione di alta qualità. Questi test comportano un processo di validazione in più fasi. Il nostro complesso sistema di valutazione si basa su centinaia di misurazioni e parametri di riferimento ben fondati, che mantengono l'obiettività.Price comparison

