Recensione della workstation Dell Precision 5480: Debutto delle prestazioni della Nvidia RTX 3000 Ada

Il modello Precision 5480 succede direttamente al modello Precision 5470 dello scorso anno, aggiornando la CPU Alder Lake-H di 12a generazione e la GPU Nvidia Ampere con le opzioni Raptor Lake-H e Ada Lovelace di 13a generazione, rispettivamente. È anche una delle prime workstation mobili a montare la RTX 3000 Ada. Per il resto, lo chassis o lo scheletro rimane lo stesso del modello Precision 5470, per cui vi consigliamo di dare un'occhiata alla la nostra recensione del modello dello scorso anno per saperne di più sulle caratteristiche fisiche di Precision 5480.
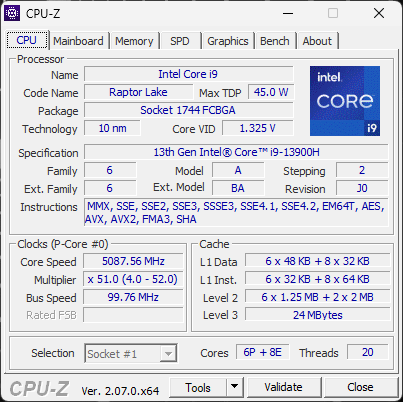
La nostra unità di prova specifica è una configurazione di fascia alta con CPU Core i9-13900H, GPU RTX 3000 Ada e touchscreen QHD+ per circa 4400 dollari. Sono disponibili anche SKU inferiori con Core i5-13500H, grafica Iris Xe integrata e display FHD+ non touch a partire da 2300 dollari.
Lo spazio dei subnotebook da 14 pollici per le workstation è relativamente piccolo, ma ci sono ancora alcune alternative, tra cui ilLenovo ThinkPad P14 e HP ZBook Firefly 14.
Altre recensioni Dell:
Potenziali concorrenti a confronto
Punteggio | Data | Modello | Peso | Altezza | Dimensione | Risoluzione | Prezzo |
|---|---|---|---|---|---|---|---|
| 89.6 % v7 (old) | 09/2023 | Dell Precision 5480 i9-13900H, RTX 3000 Ada Generation Laptop | 1.6 kg | 18.95 mm | 14.00" | 2560x1600 | |
| 87.6 % v7 (old) | 09/2022 | Dell Precision 5000 5470 i9-12900H, RTX A1000 Laptop GPU | 1.6 kg | 18.95 mm | 14.00" | 2560x1600 | |
| 88.3 % v7 (old) | 10/2021 | Dell Precision 5000 5560 i7-11850H, RTX A2000 Laptop GPU | 2 kg | 18 mm | 15.60" | 3840x2400 | |
| 86.9 % v7 (old) | 04/2023 | Lenovo ThinkPad P14s G3 AMD 21J6S05000 R7 PRO 6850U, Radeon 680M | 1.5 kg | 17.9 mm | 14.00" | 1920x1200 | |
| 87.4 % v7 (old) | HP ZBook Firefly 14 G9-6B8A2EA i7-1265U, T550 Laptop GPU | 1.5 kg | 19.9 mm | 14.00" | 1920x1200 | ||
| 87.8 % v7 (old) | 04/2023 | Lenovo ThinkPad P15v G3 21EM001AGE R7 PRO 6850H, RTX A2000 Laptop GPU | 2.2 kg | 22.7 mm | 15.60" | 3840x2160 |
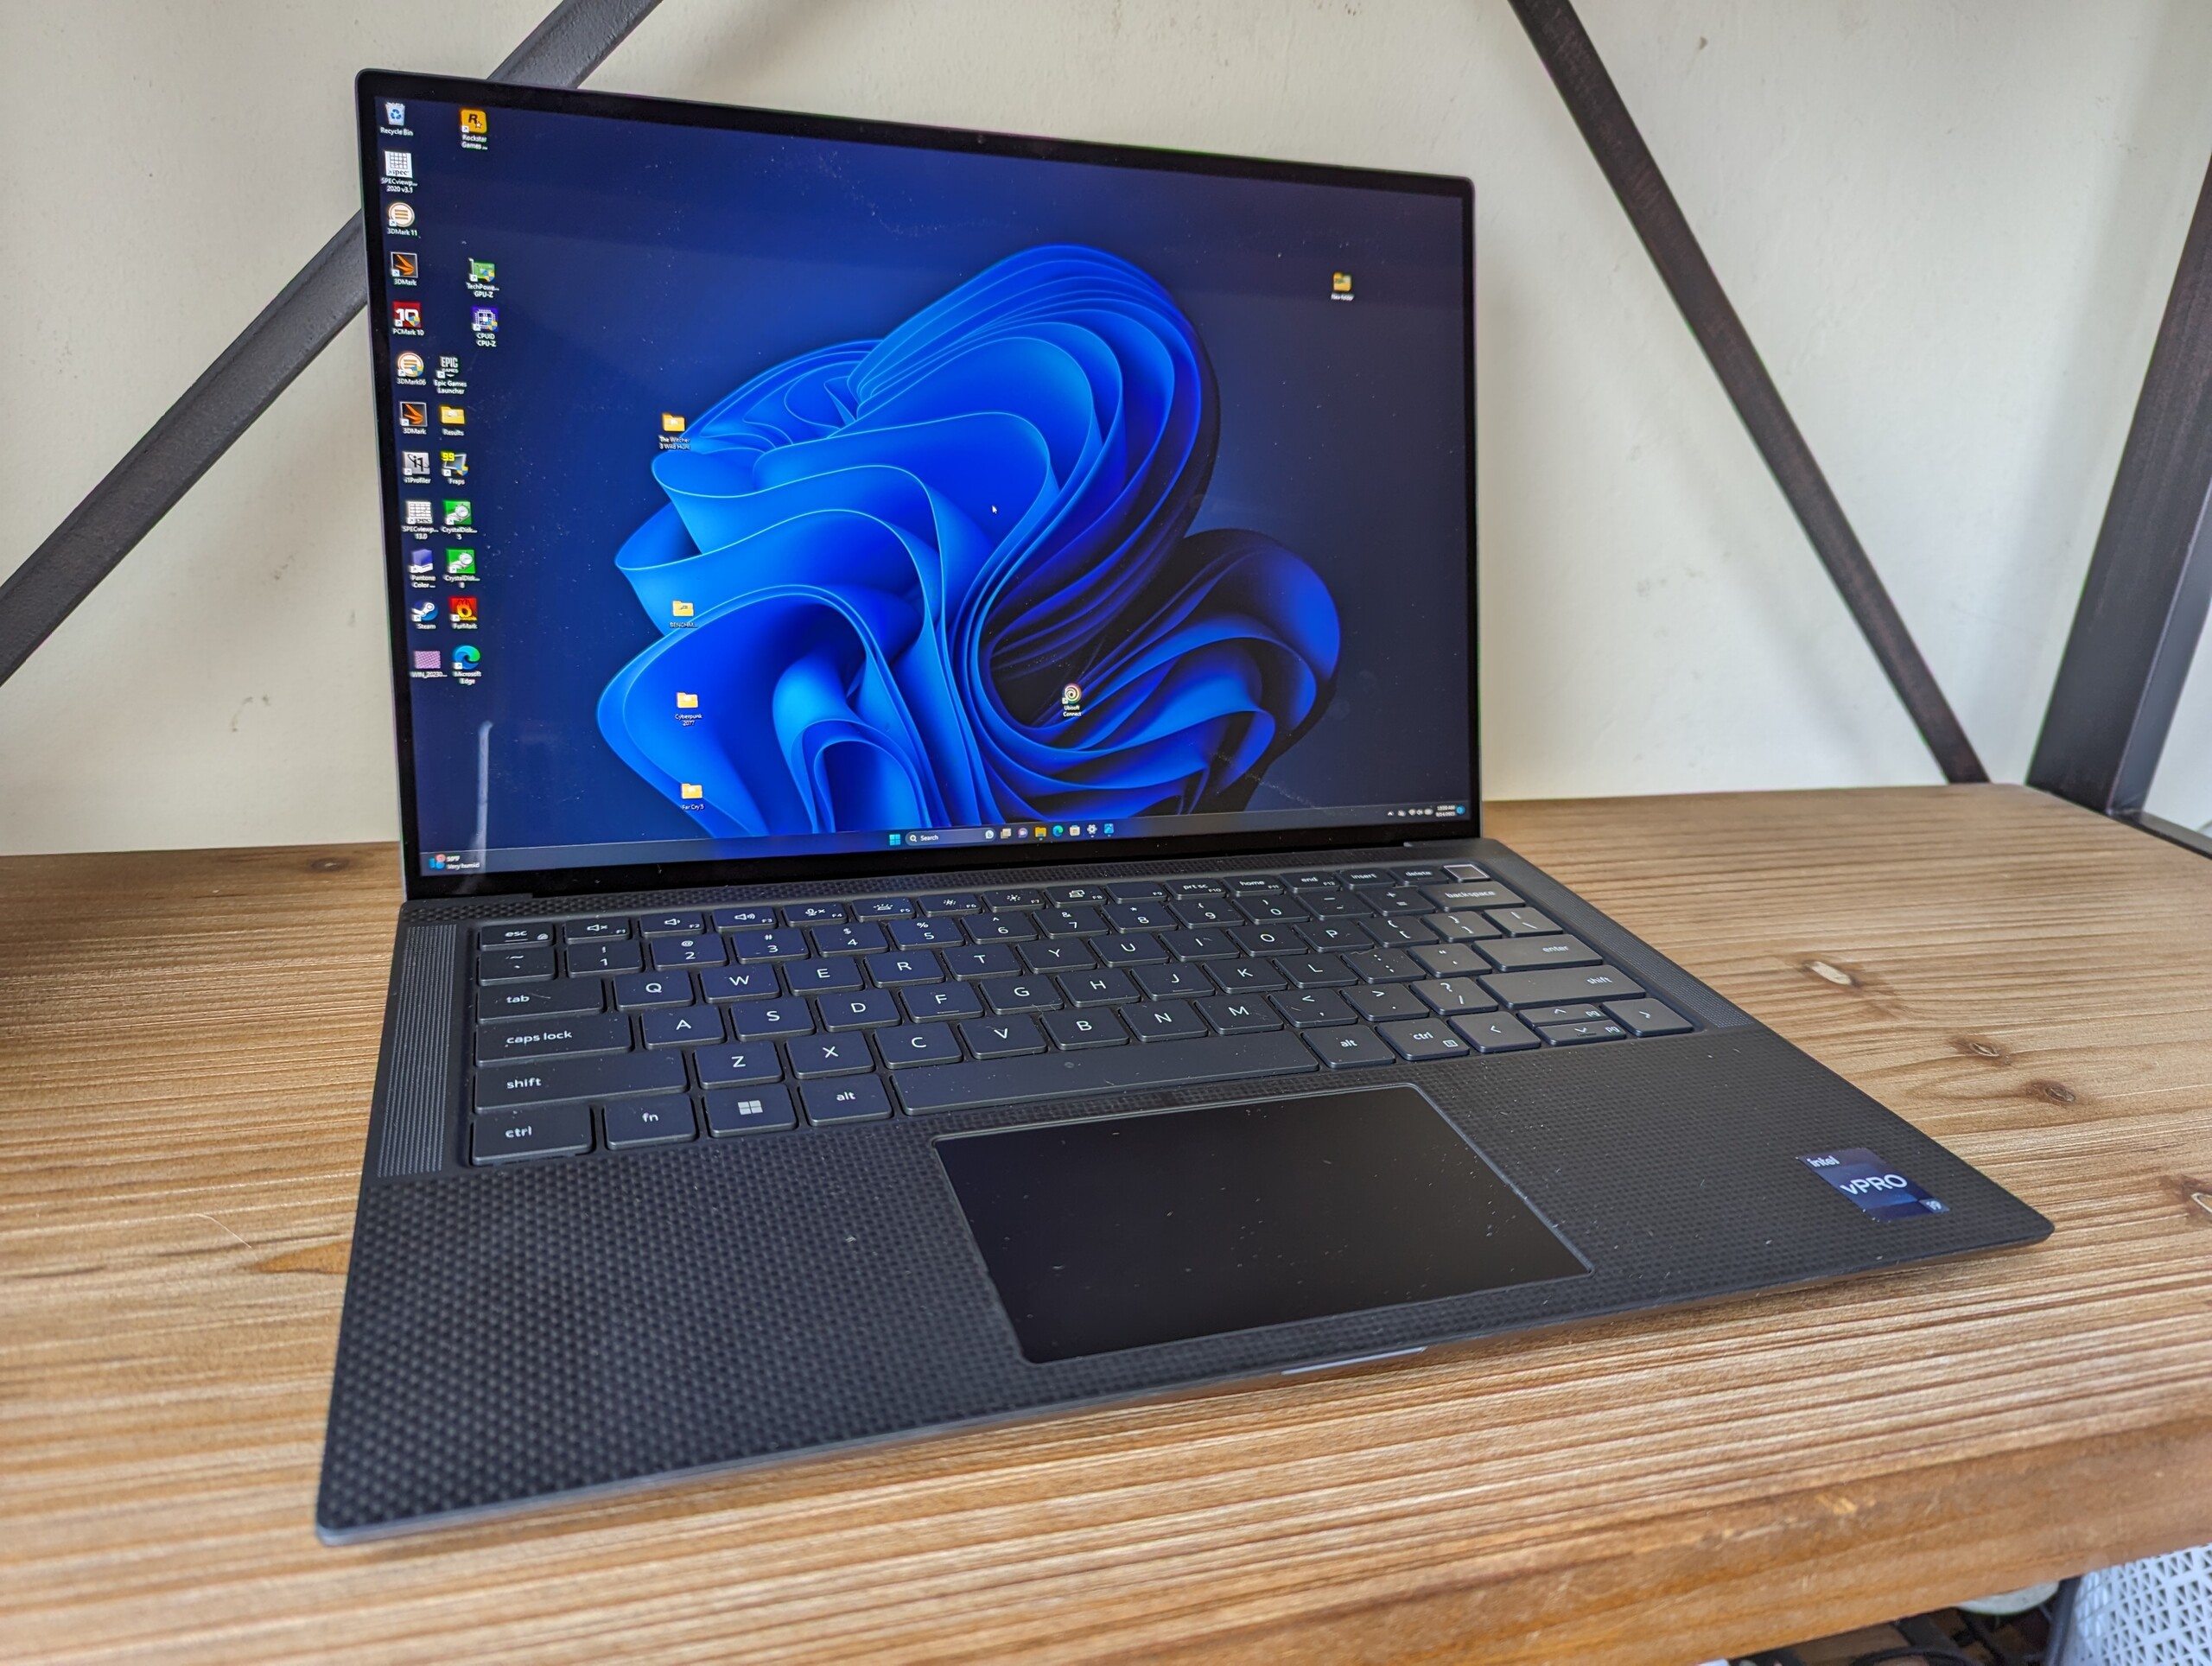
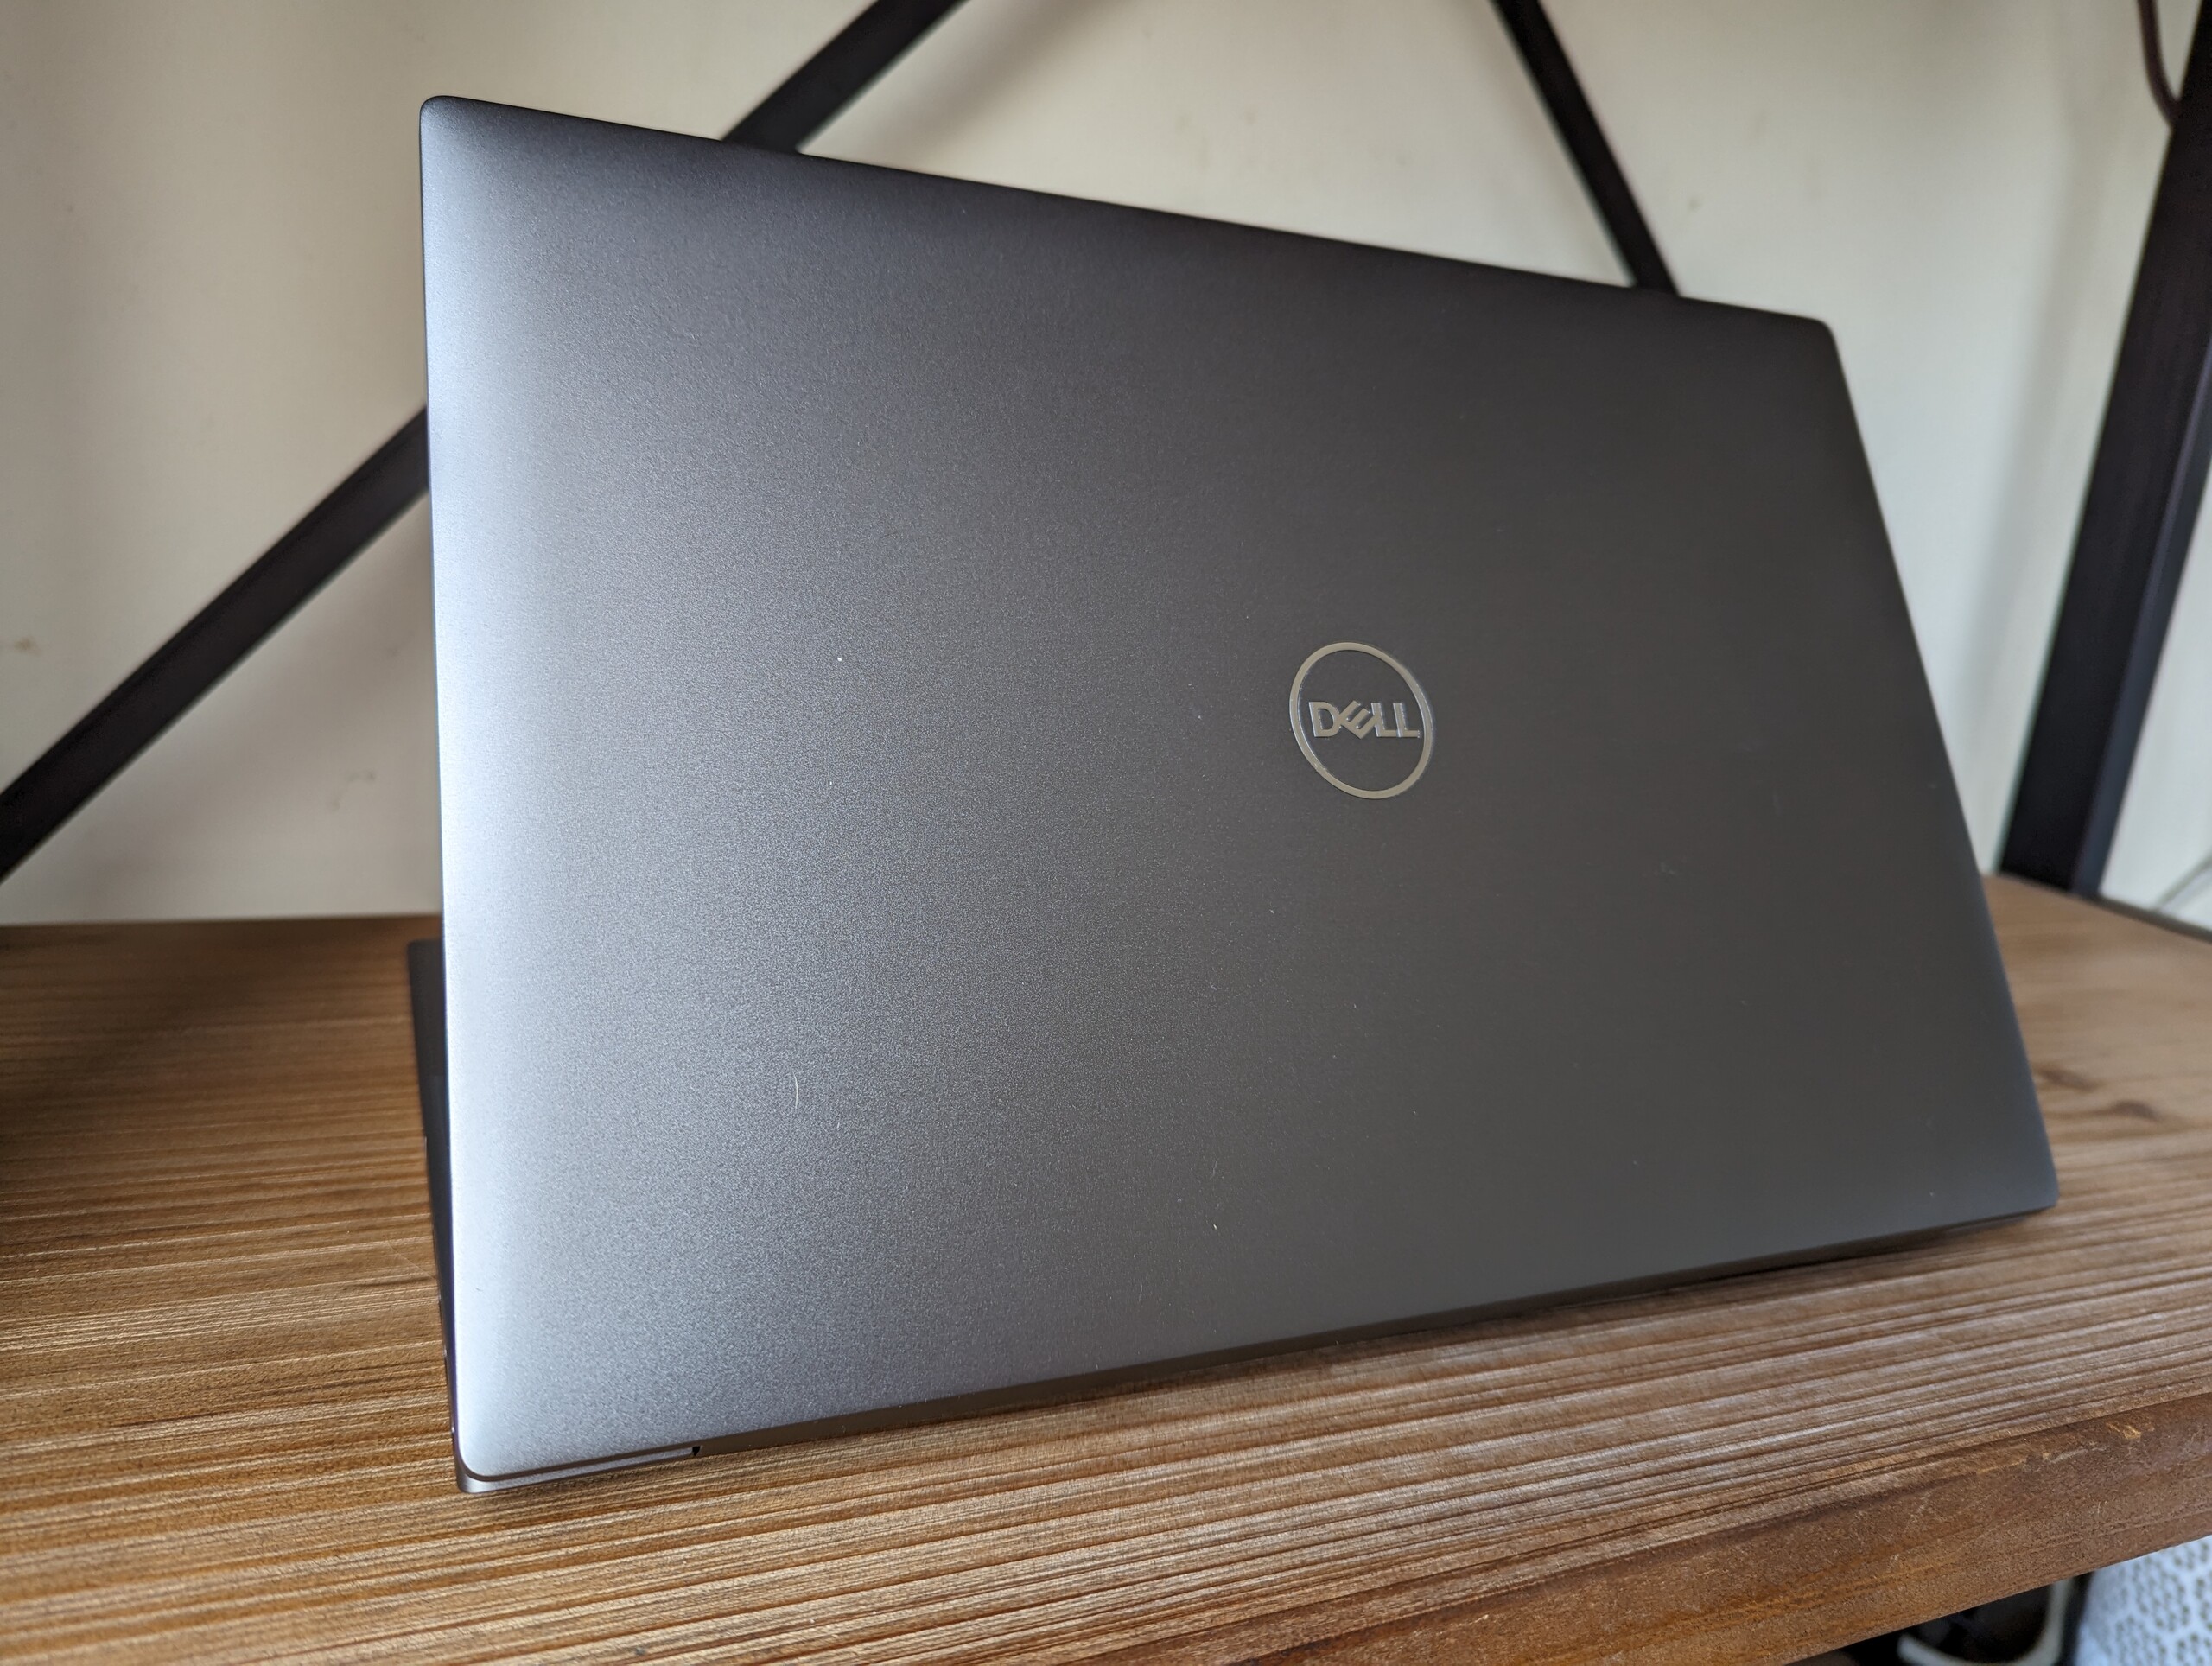
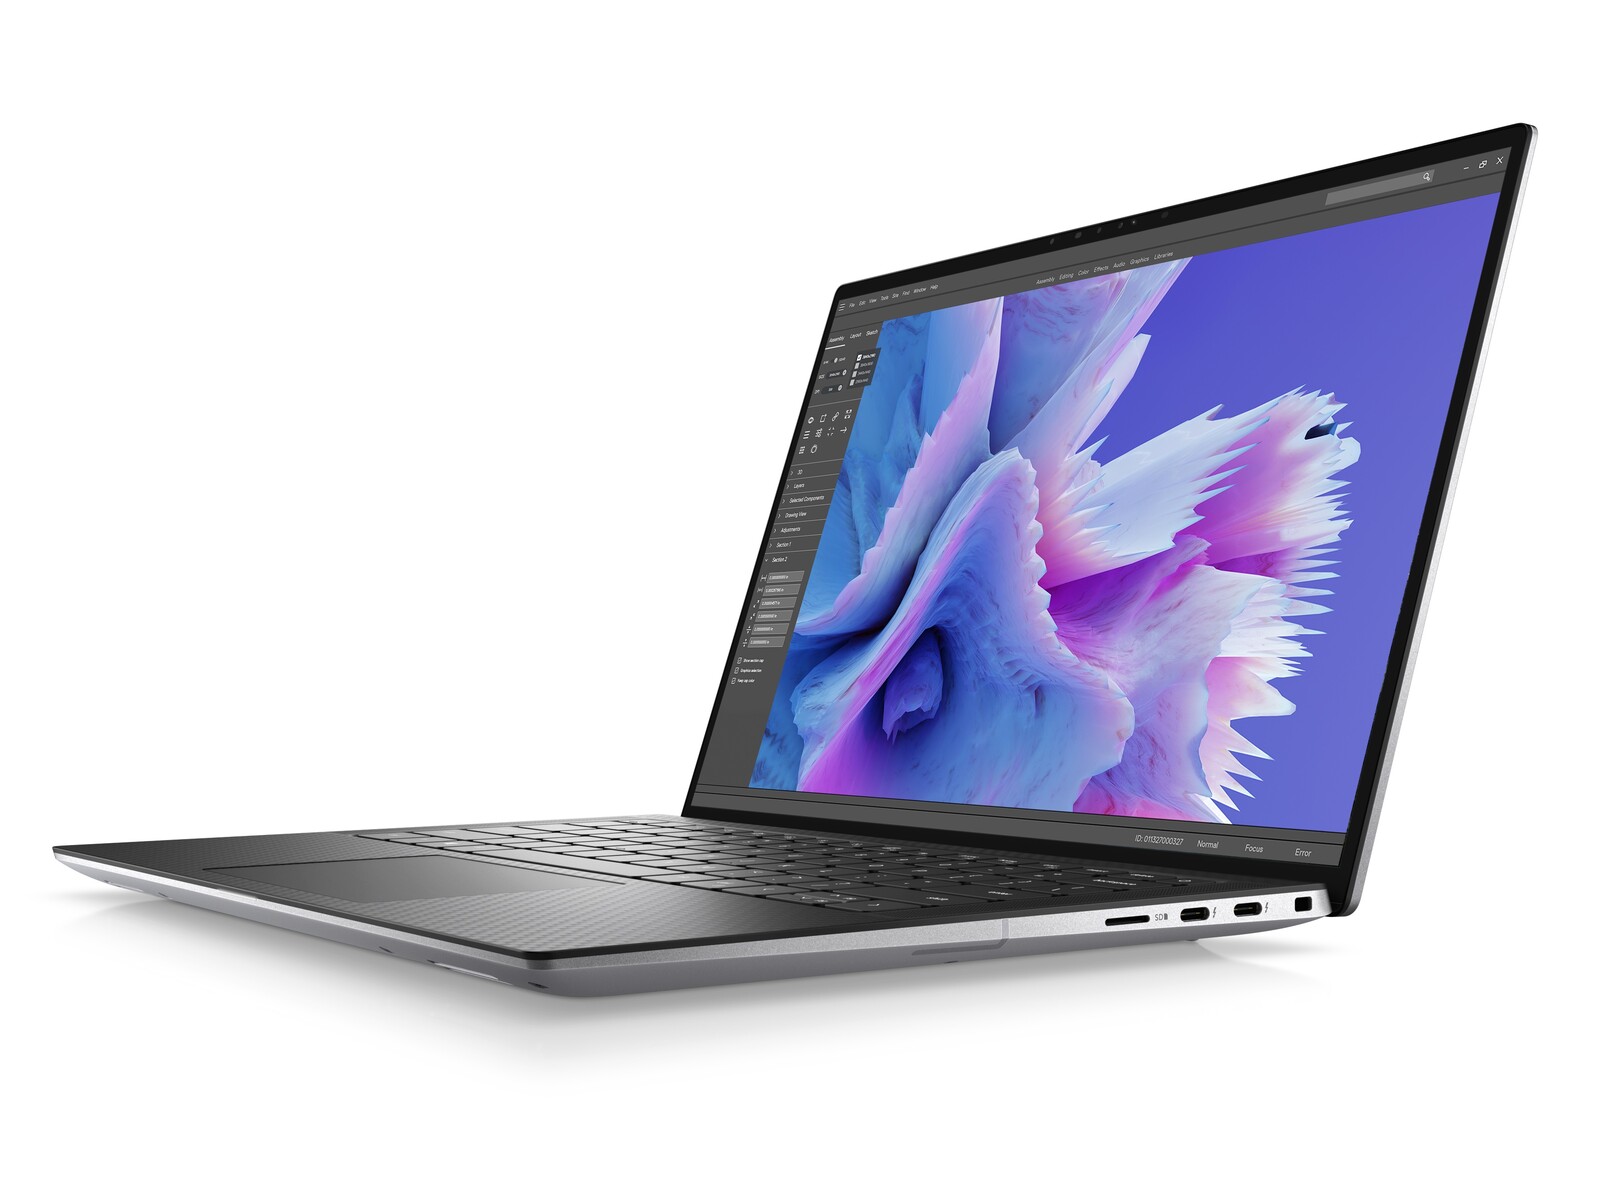
Custodia - Ispirata all'XPS
Lettore di schede SD
| SD Card Reader | |
| average JPG Copy Test (av. of 3 runs) | |
| Dell Precision 5000 5560 (AV Pro V60) | |
| Lenovo ThinkPad P15v G3 21EM001AGE (AV Pro V60) | |
| Dell Precision 5000 5470 (AV Pro V60) | |
| Dell Precision 5480 (AV Pro V60) | |
| maximum AS SSD Seq Read Test (1GB) | |
| Dell Precision 5000 5470 (AV Pro V60) | |
| Lenovo ThinkPad P15v G3 21EM001AGE (AV Pro V60) | |
| Dell Precision 5000 5560 (AV Pro V60) | |
| Dell Precision 5480 (AV Pro V60) | |
Comunicazione
| Networking | |
| iperf3 transmit AX12 | |
| Dell Precision 5000 5560 | |
| iperf3 receive AX12 | |
| Dell Precision 5000 5560 | |
| iperf3 transmit AXE11000 | |
| Dell Precision 5480 | |
| Lenovo ThinkPad P14s G3 AMD 21J6S05000 | |
| Lenovo ThinkPad P15v G3 21EM001AGE | |
| iperf3 receive AXE11000 | |
| Lenovo ThinkPad P14s G3 AMD 21J6S05000 | |
| Lenovo ThinkPad P15v G3 21EM001AGE | |
| Dell Precision 5480 | |
| iperf3 transmit AXE11000 6GHz | |
| Dell Precision 5480 | |
| Lenovo ThinkPad P14s G3 AMD 21J6S05000 | |
| Dell Precision 5000 5470 | |
| Lenovo ThinkPad P15v G3 21EM001AGE | |
| iperf3 receive AXE11000 6GHz | |
| Lenovo ThinkPad P14s G3 AMD 21J6S05000 | |
| Lenovo ThinkPad P15v G3 21EM001AGE | |
| Dell Precision 5480 | |
| Dell Precision 5000 5470 | |
Webcam
Dell distribuisce ancora webcam a 720p su molti dei suoi prodotti di punta, tra cui la serie XPS e i portatili Precision basati sul design XPS. Altri produttori sono già passati a sensori da 2 MP o 5 MP e ci aspettiamo che Dell faccia lo stesso per qualsiasi futura riprogettazione.


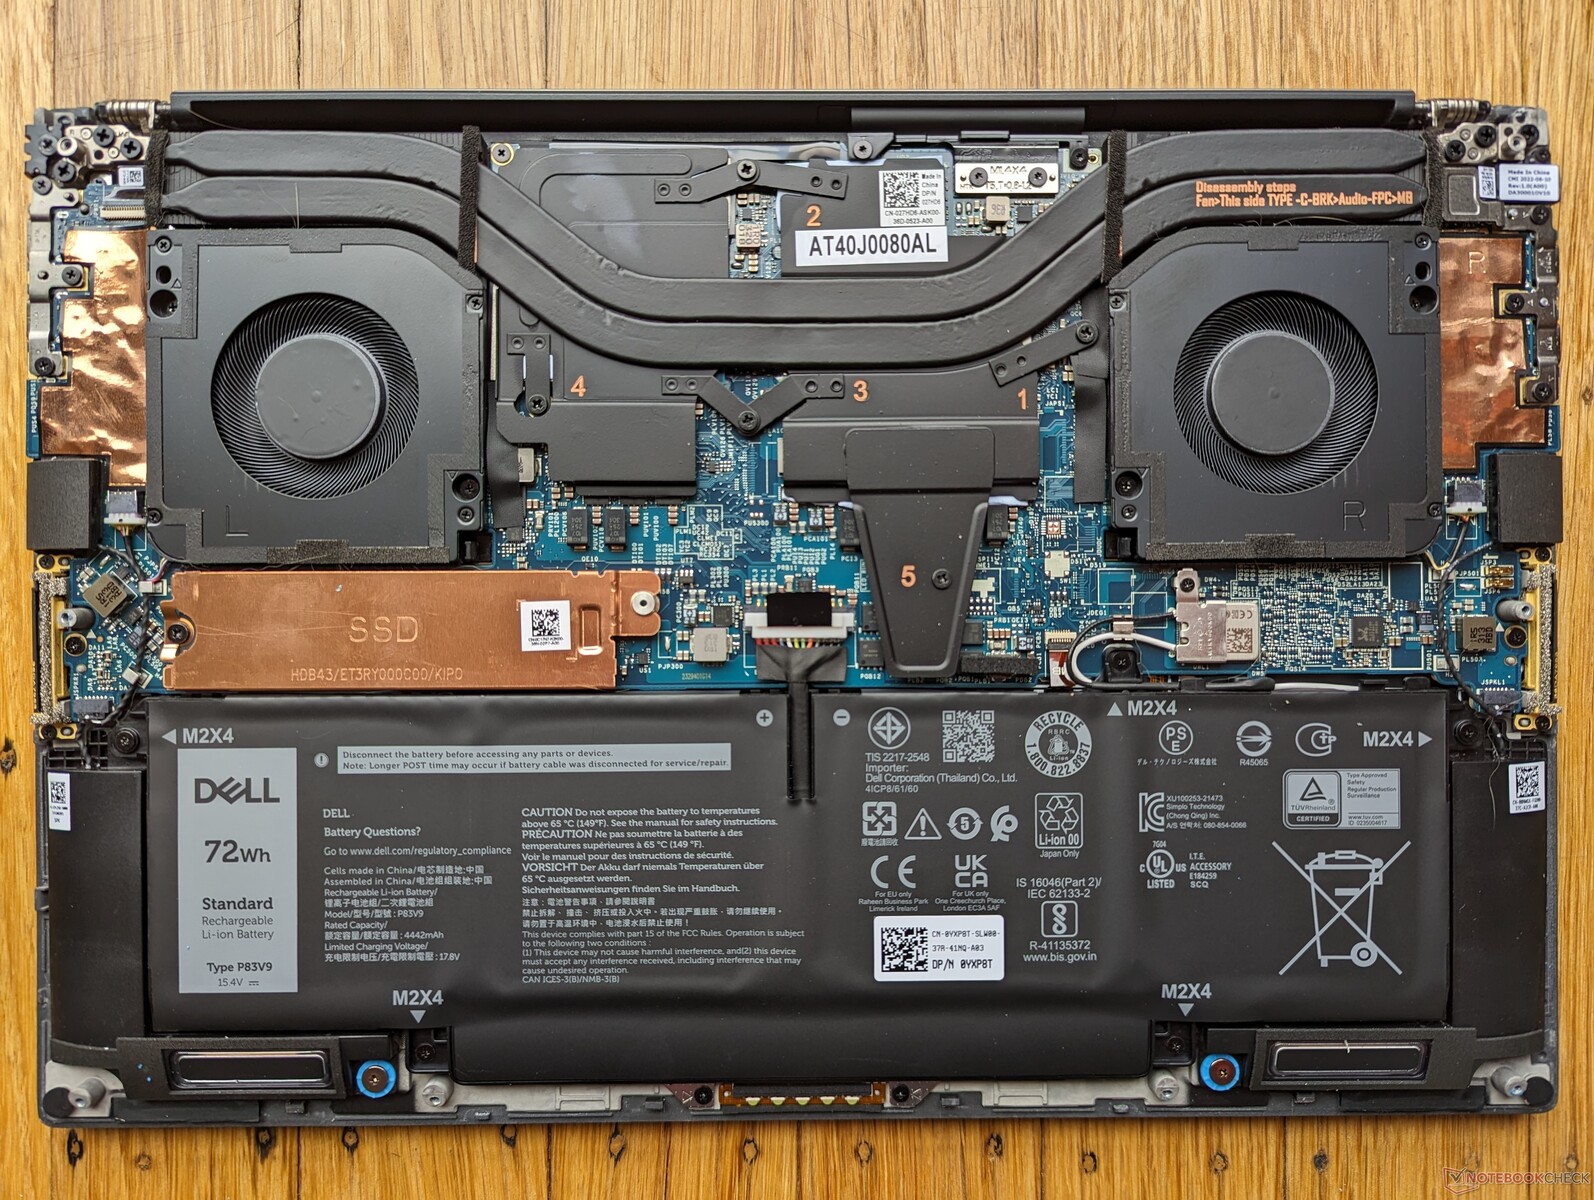
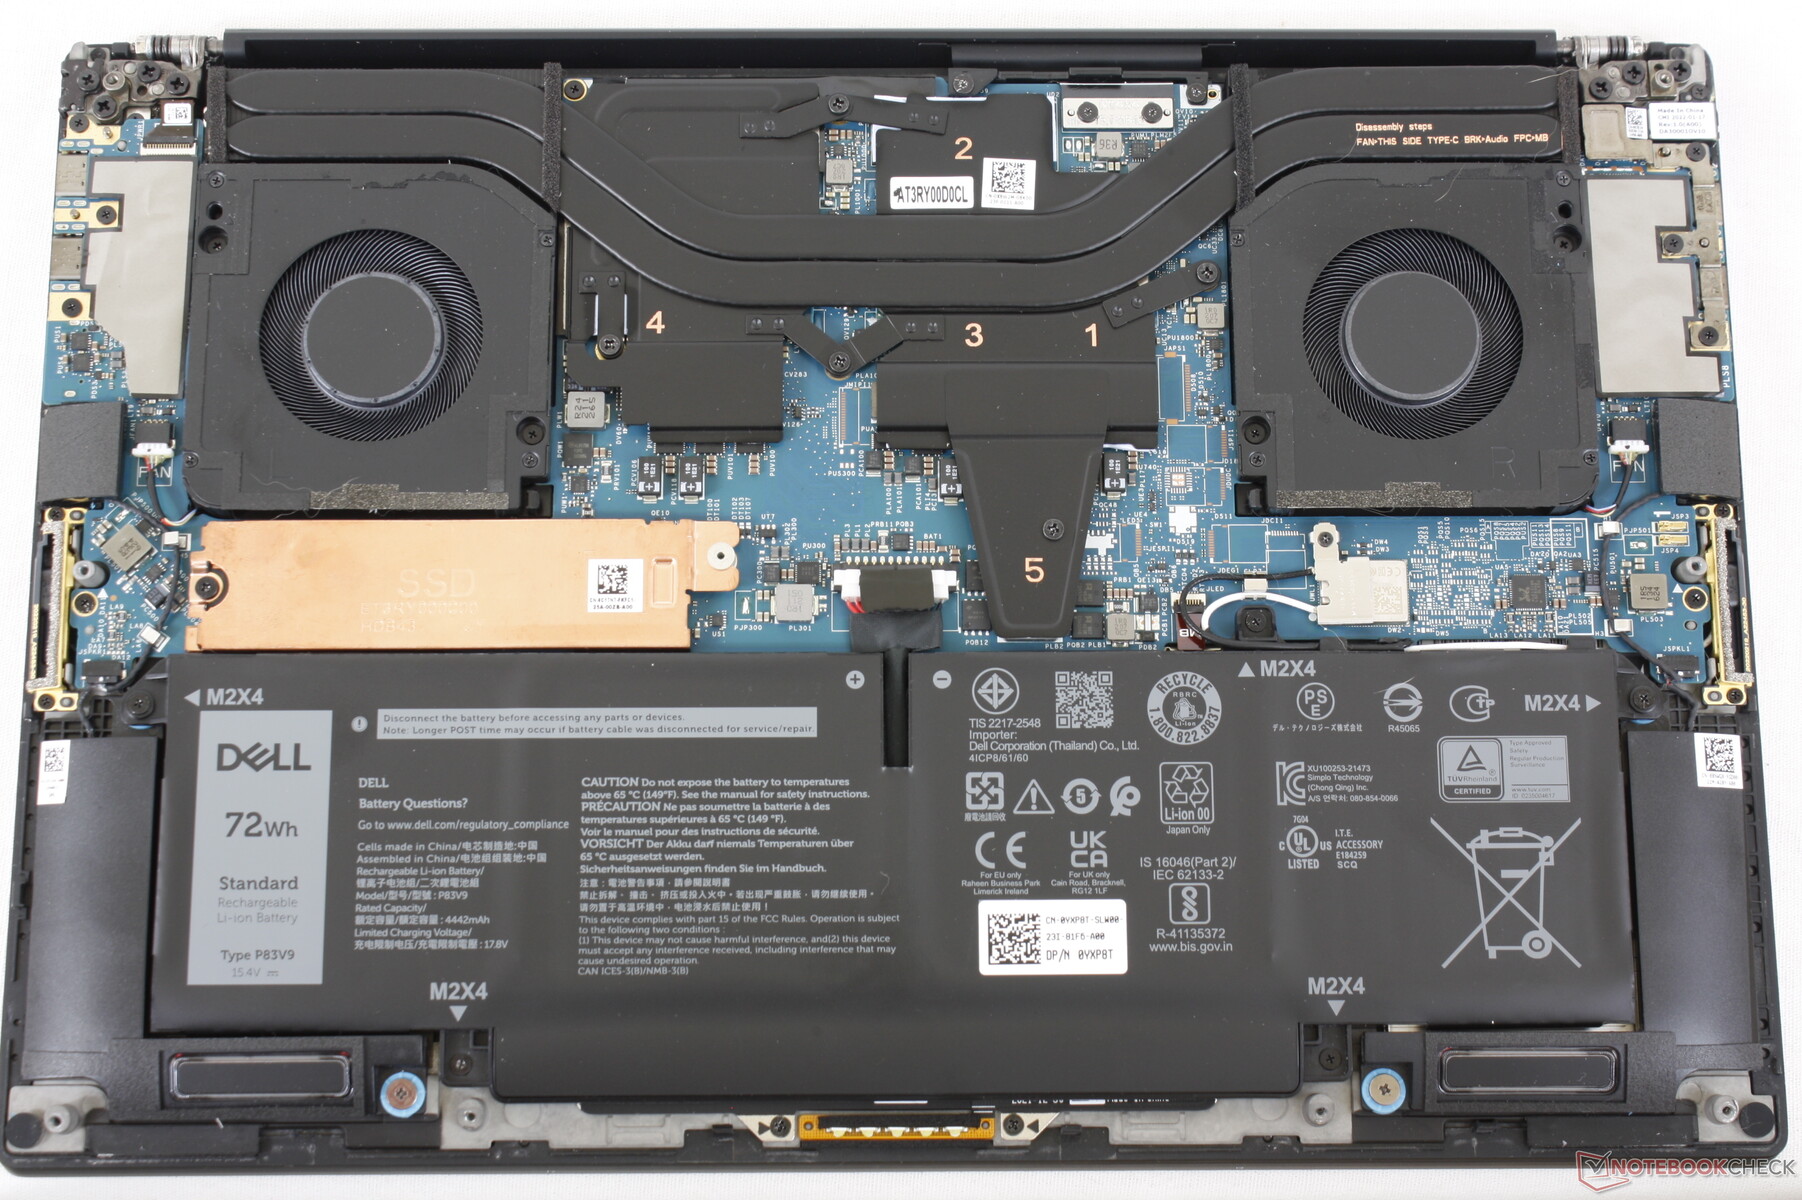
Manutenzione
Accessori e garanzia
La confezione include lo stesso adattatore da USB-C a HDMI e USB-A del modello dello scorso anno, oltre alla documentazione e all'adattatore USB-C da 130 W. Dell offre anche un adattatore USB-C da 100 W, che dovrebbe essere sufficiente per le configurazioni senza grafica discreta Nvidia.
La garanzia di tre anni è standard se acquistata da Dell negli Stati Uniti, come per la serie Precision 7000.
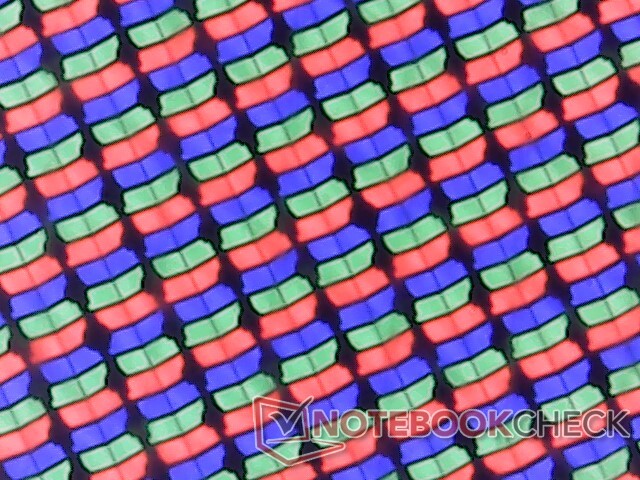
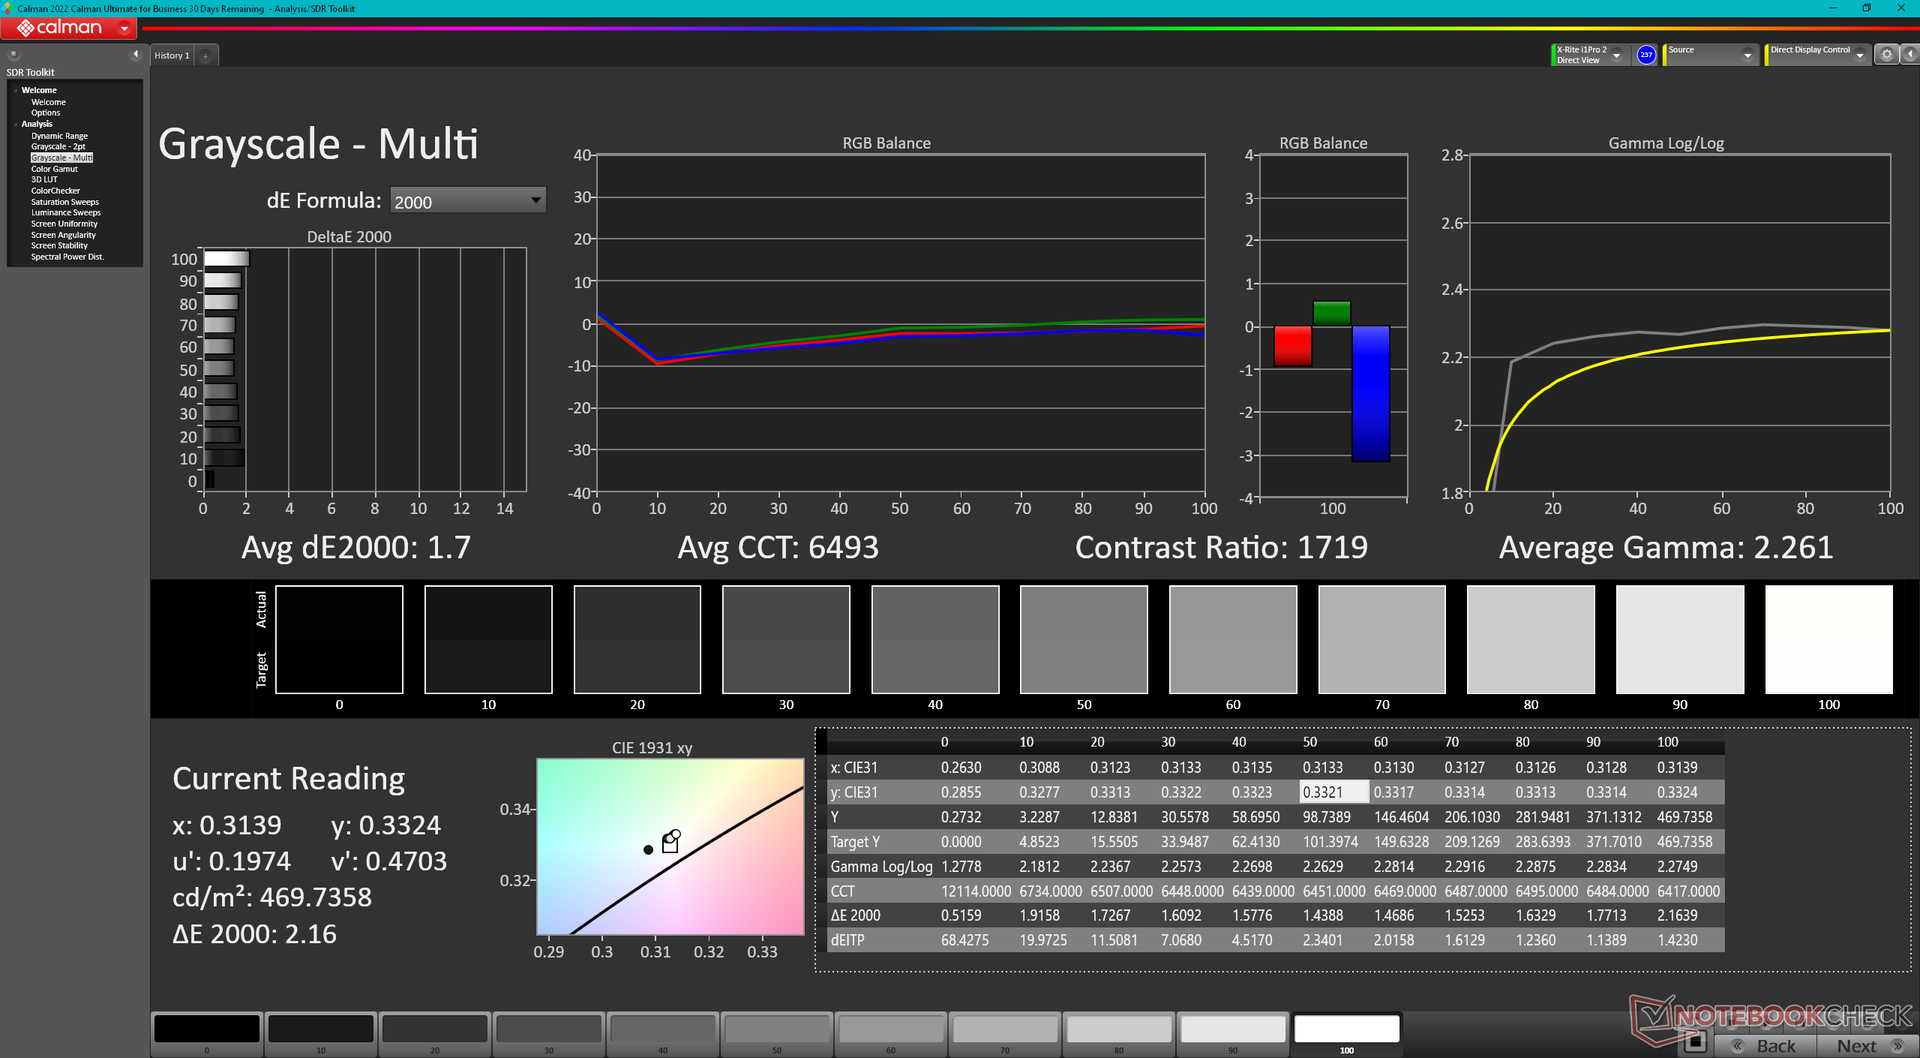
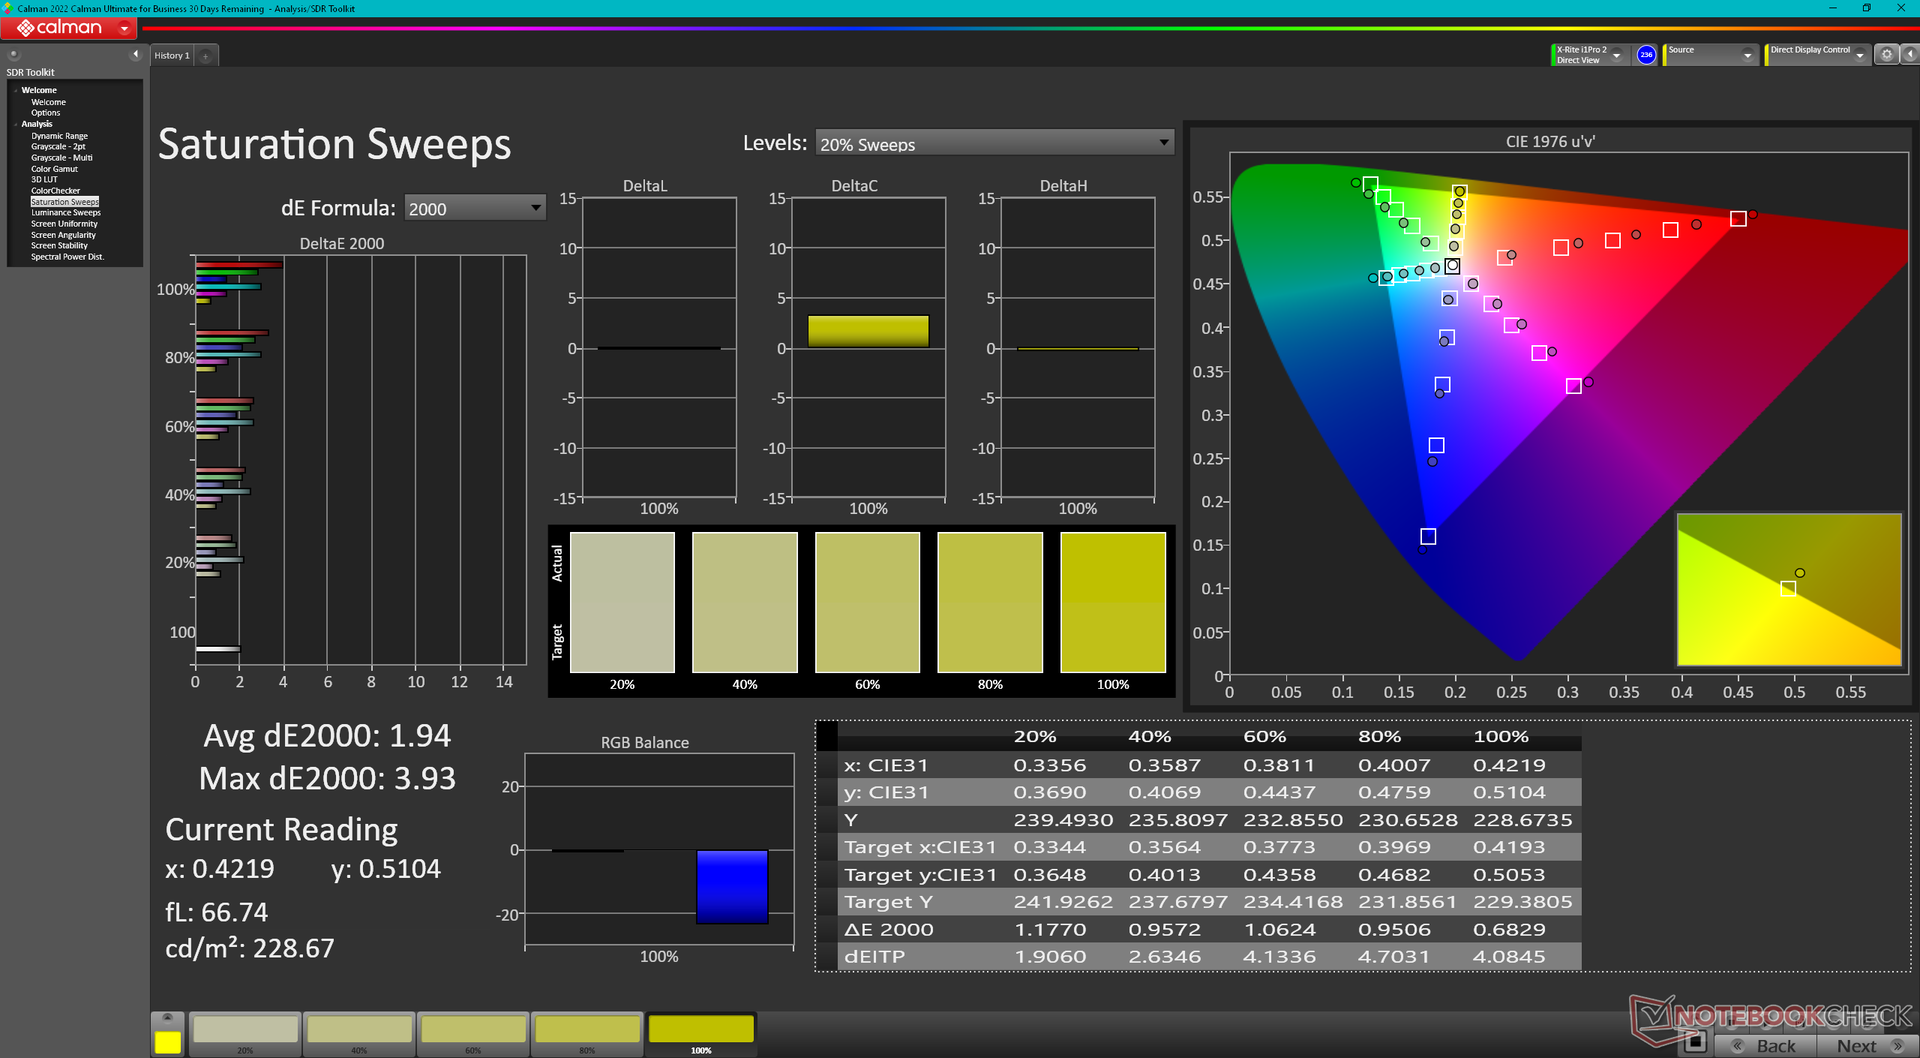
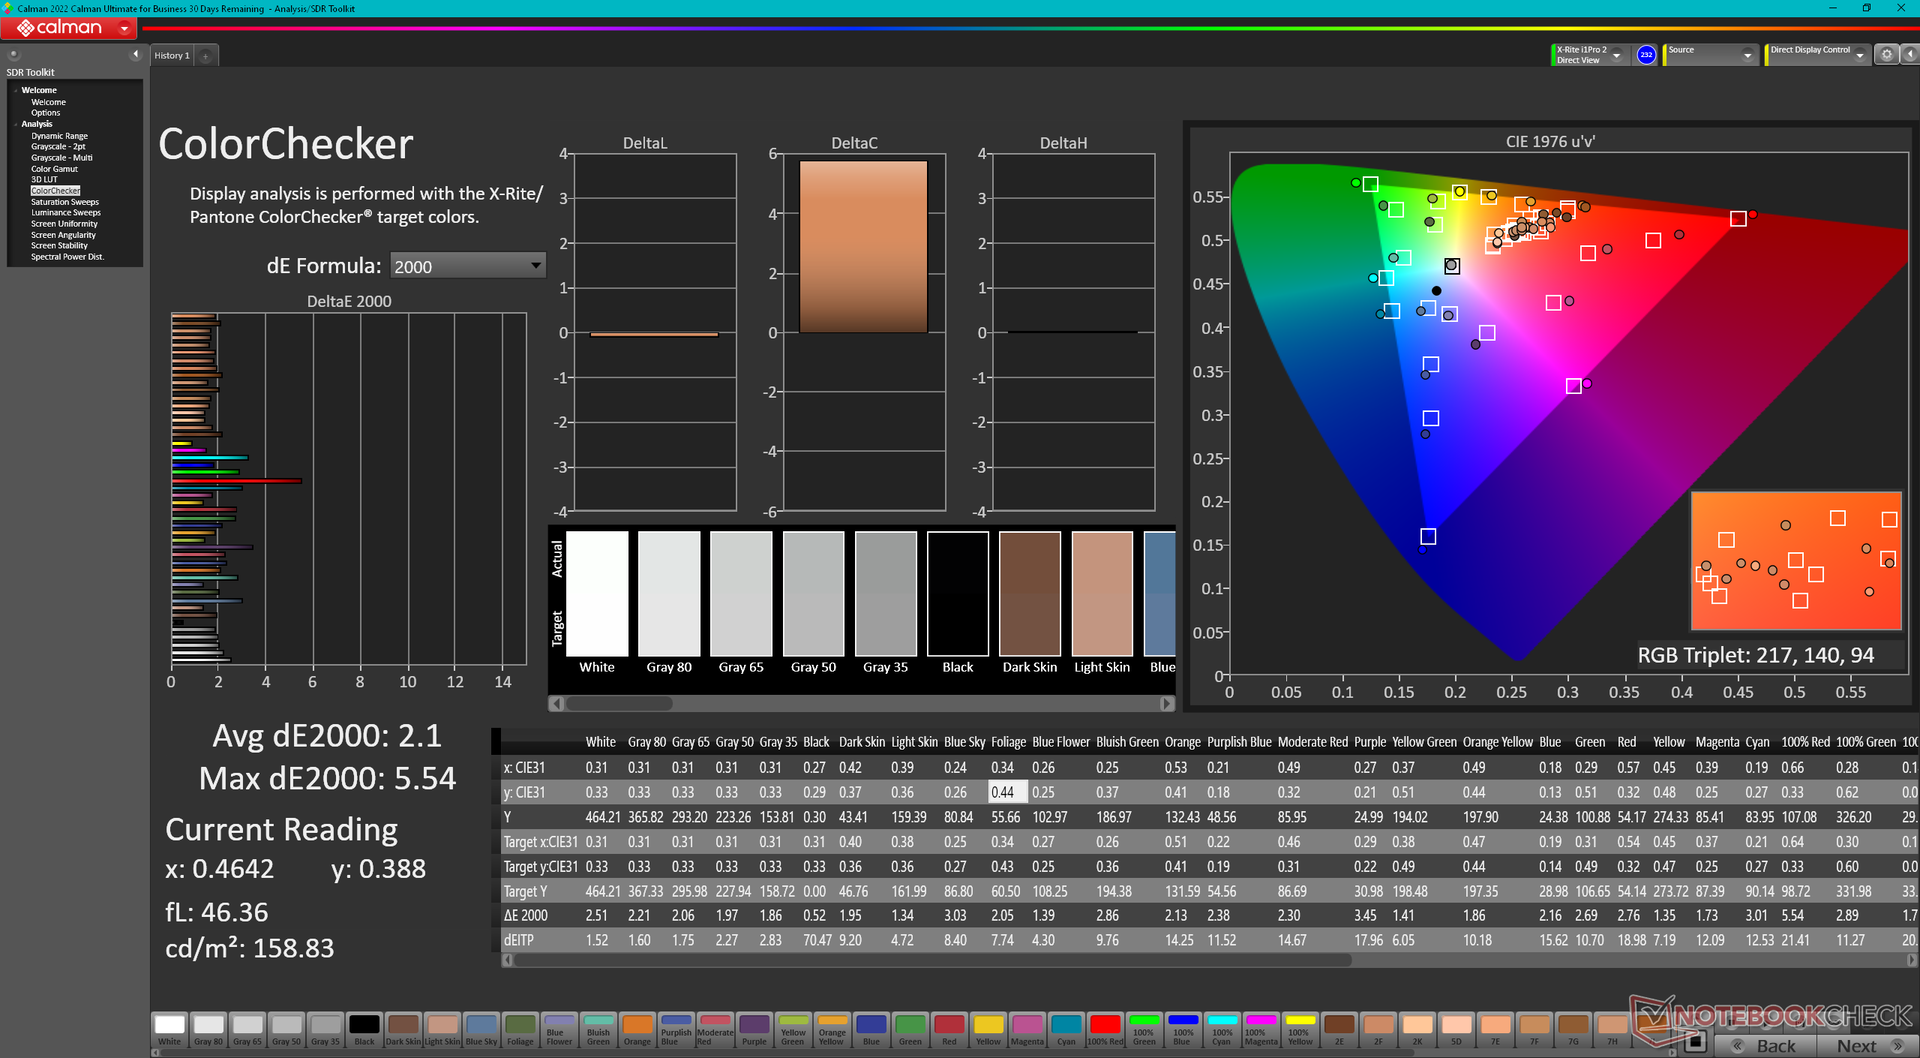
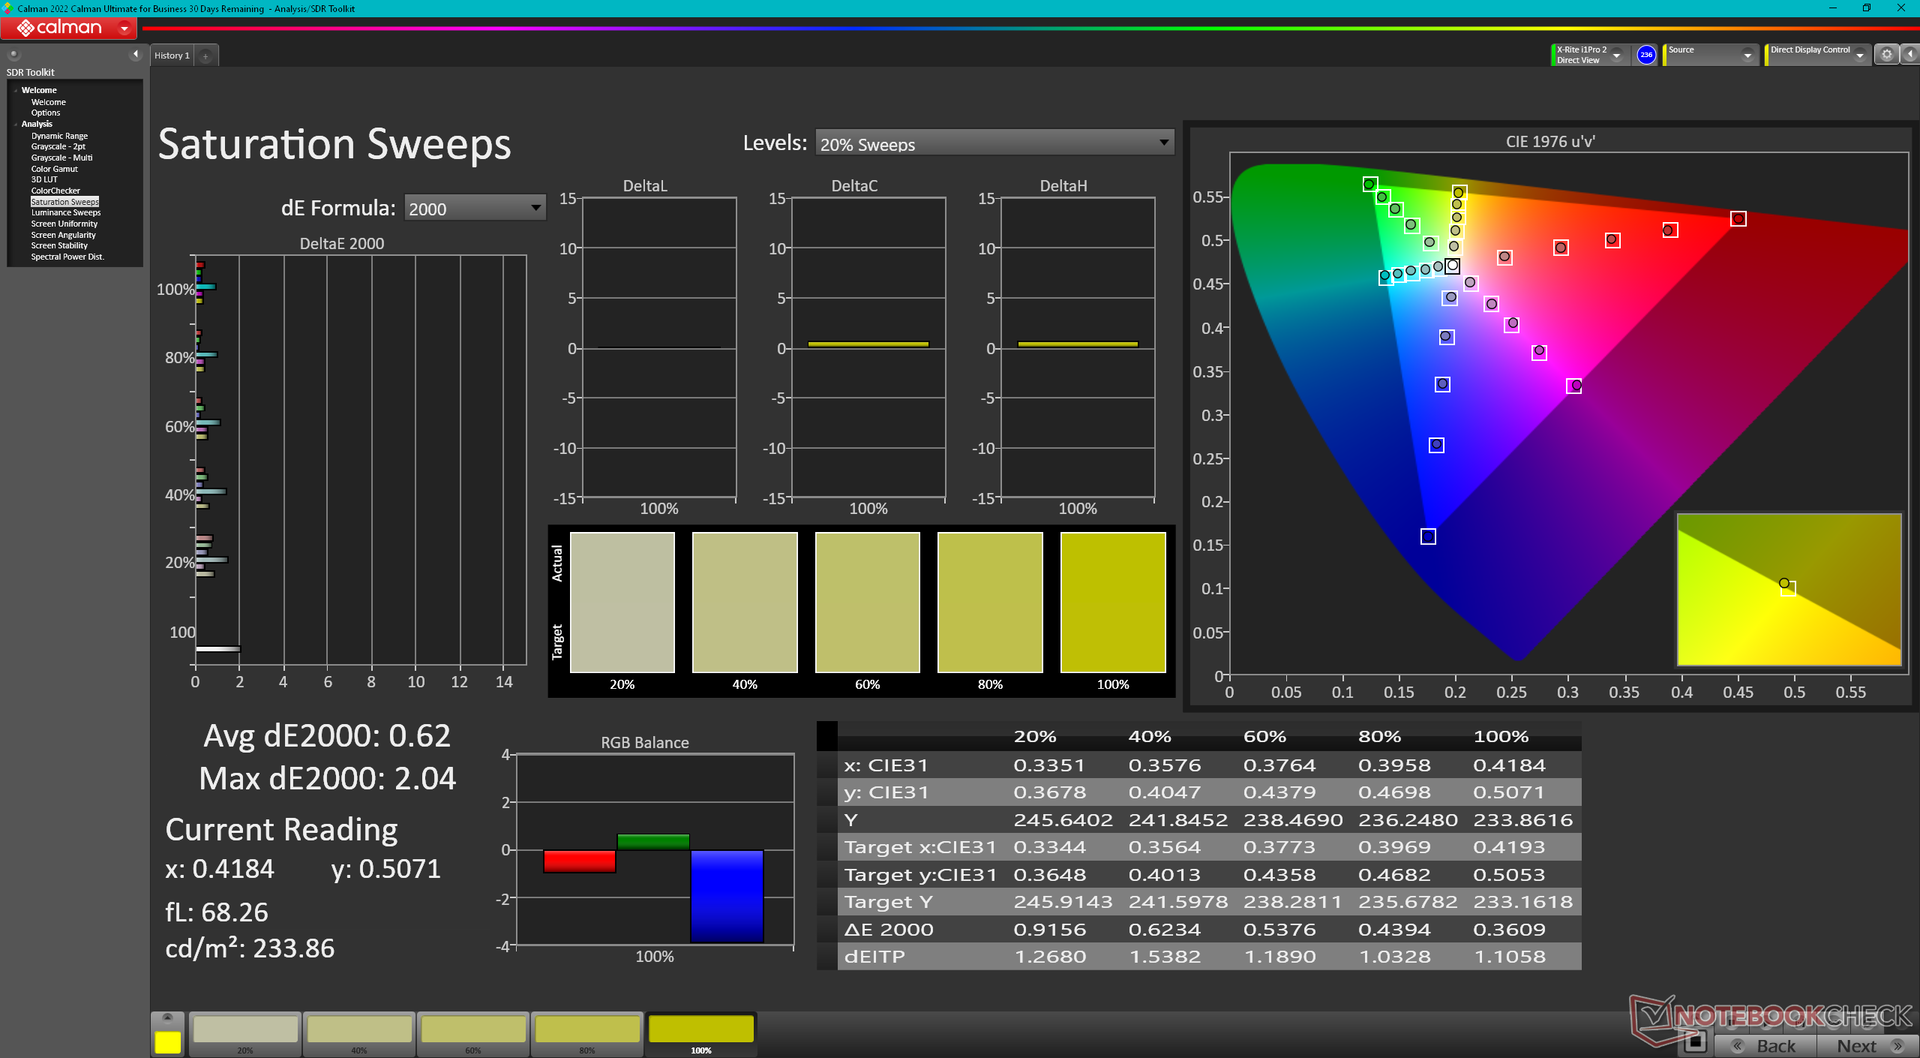
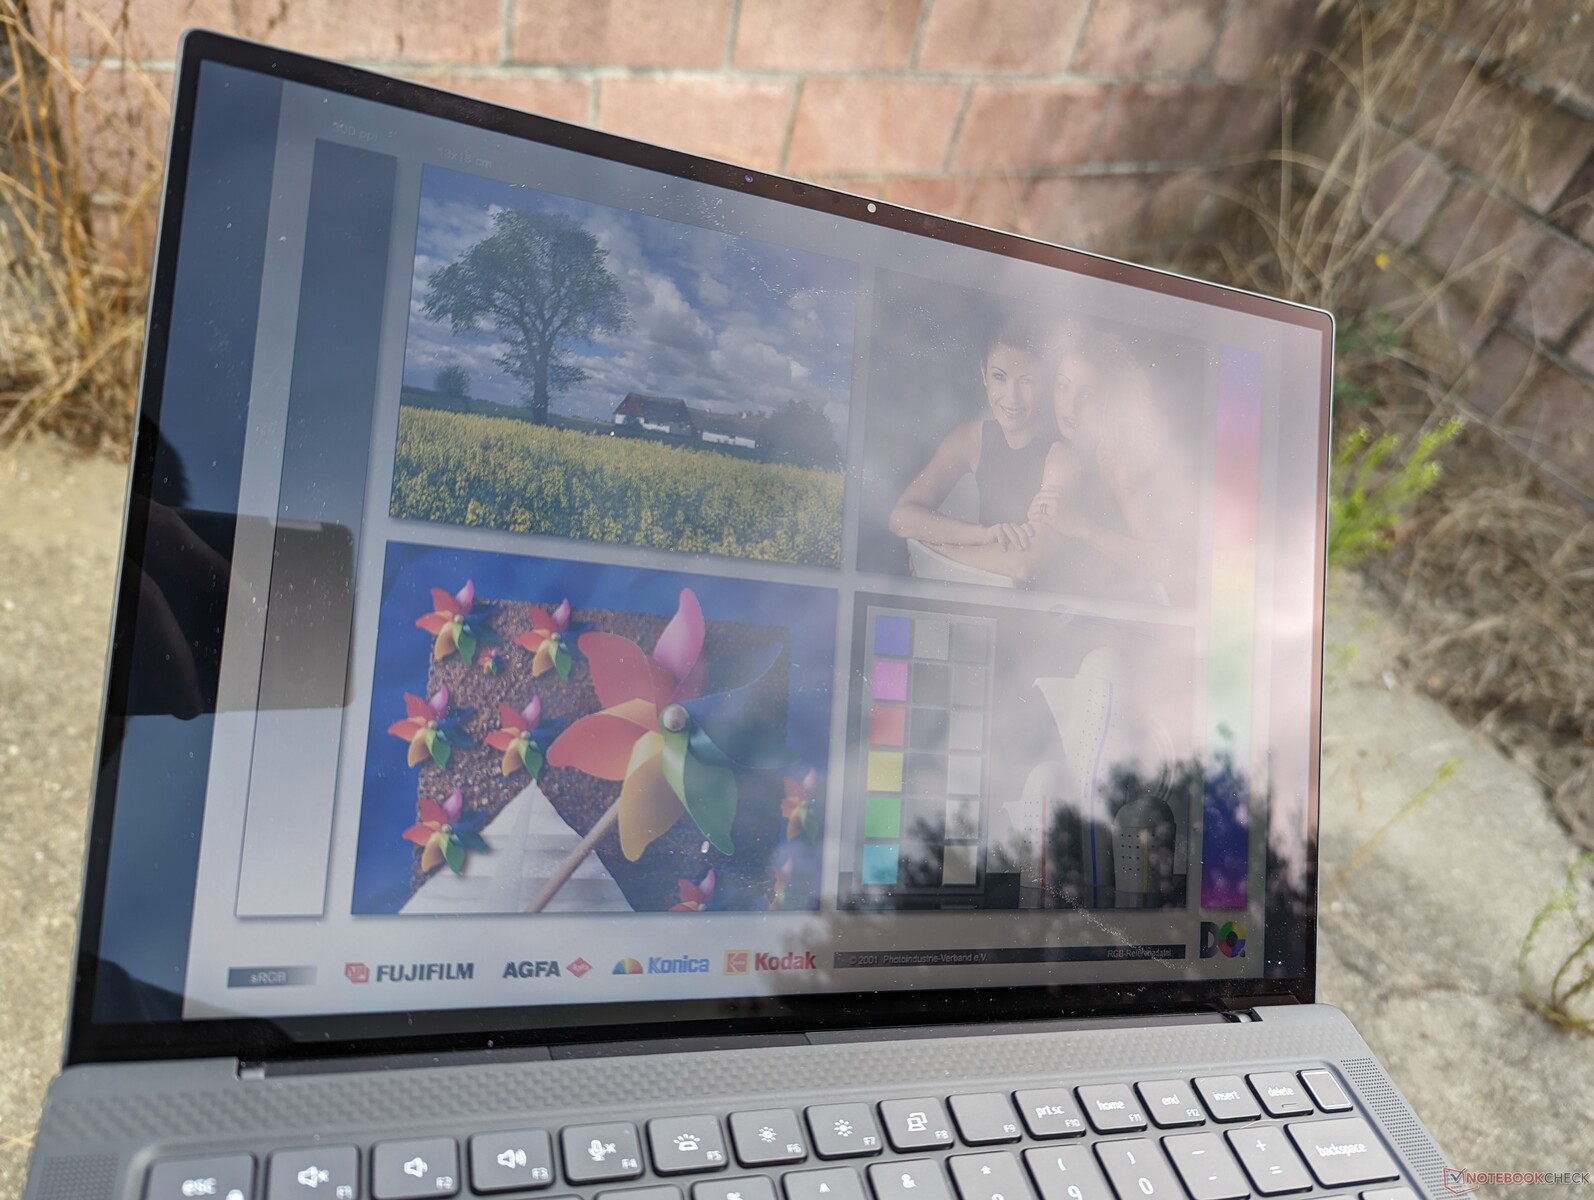
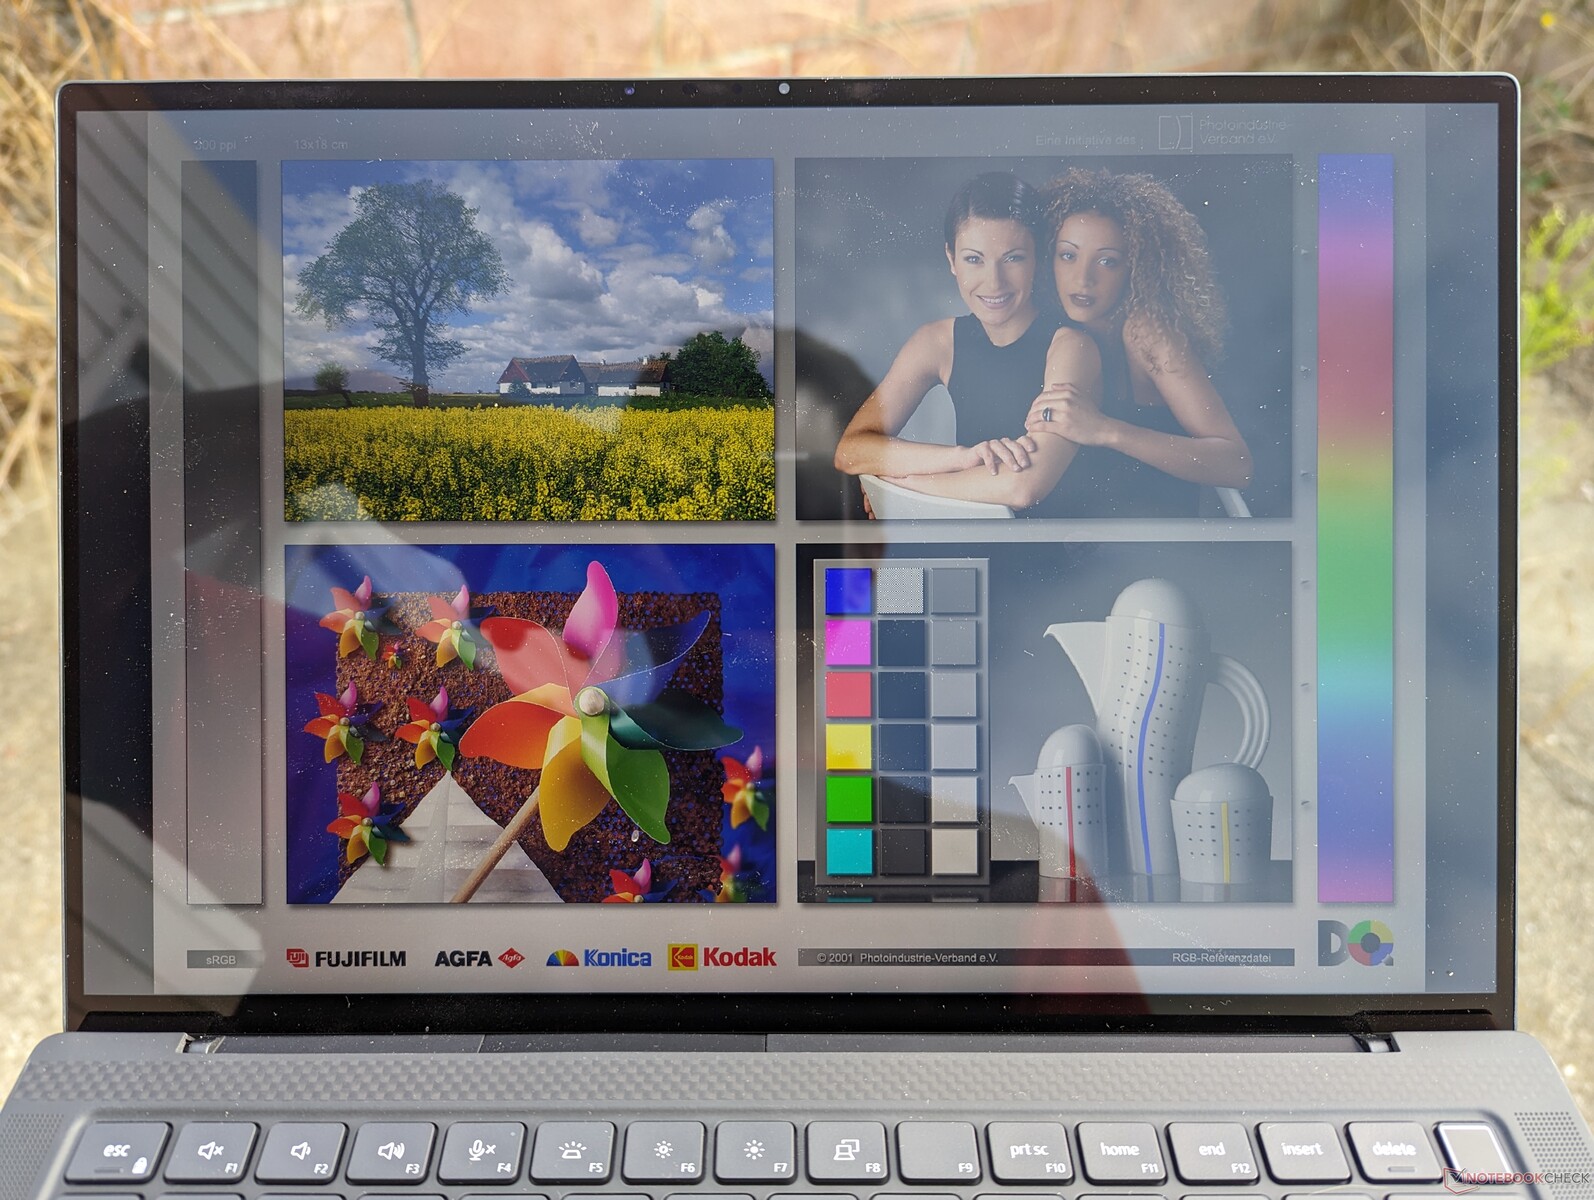
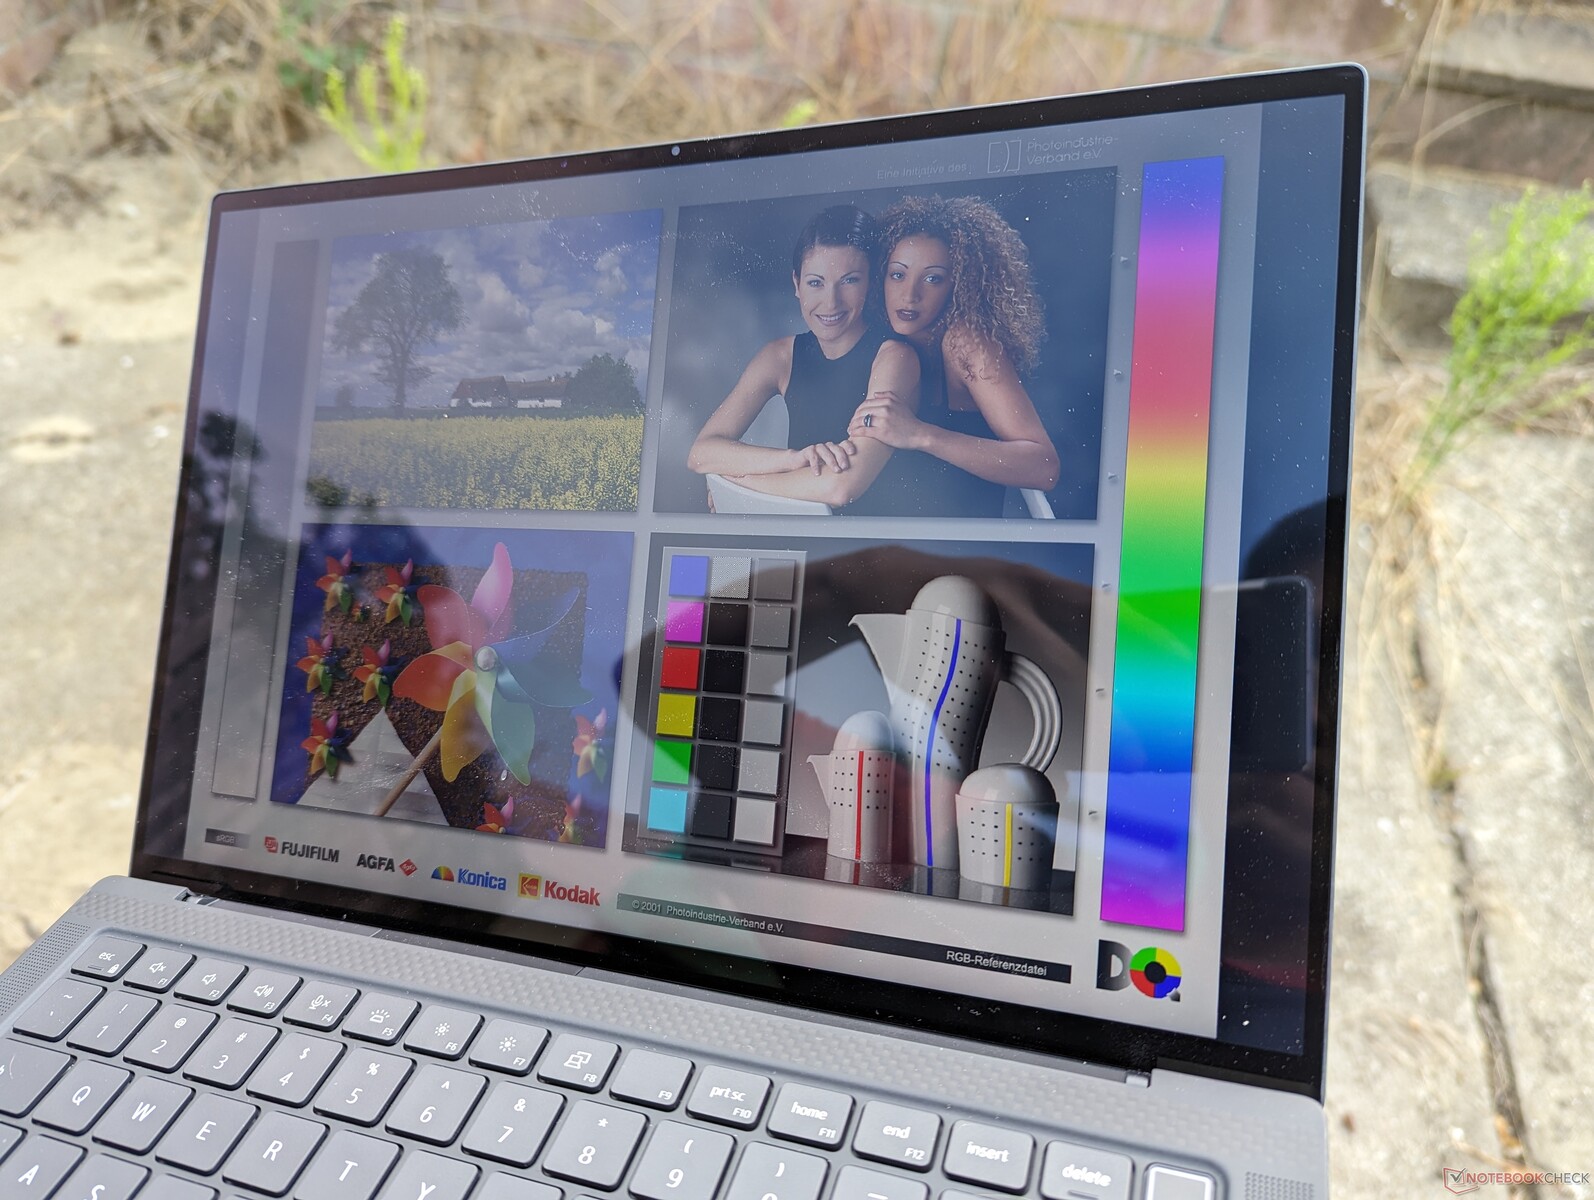
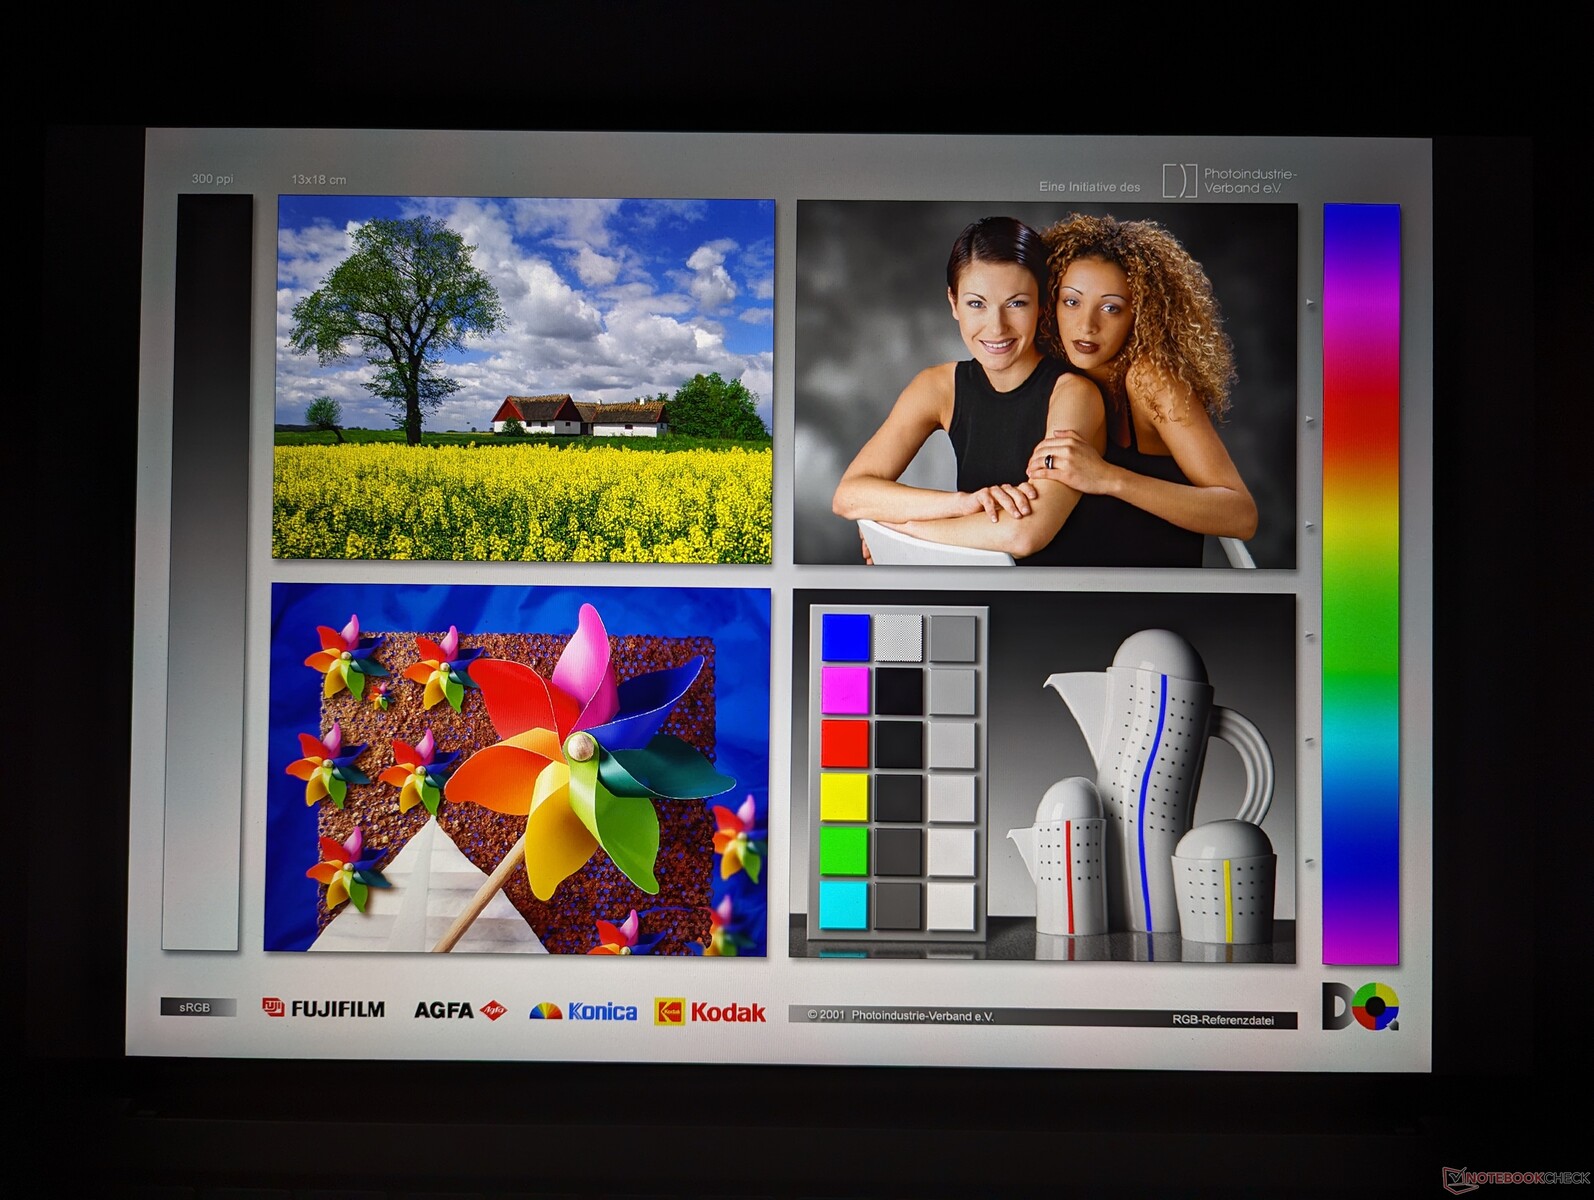
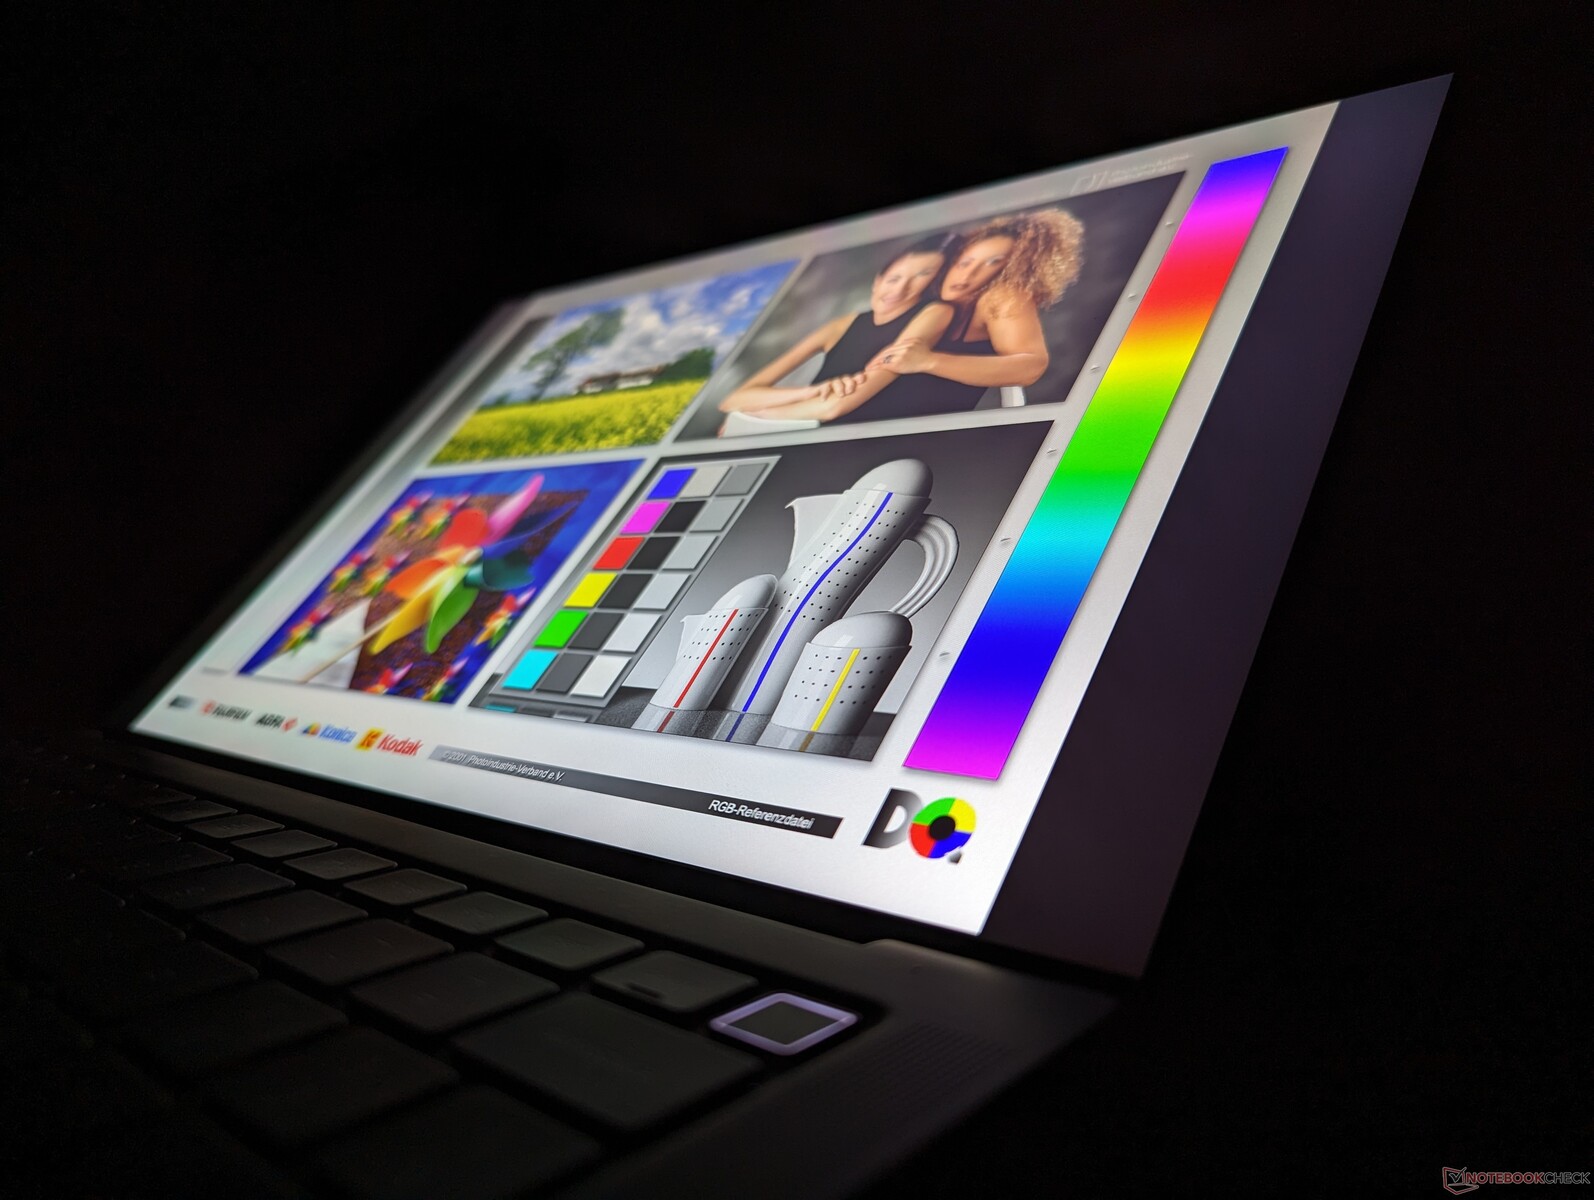
Display - QHD+ con colori full sRGB
La nostra unità di prova viene fornita con lo stesso pannello IPS B140QAN di AU Optronics presente sul modello dello scorso anno. Dell non offre alcuna nuova opzione di pannello per il refresh di quest'anno, il che significa che i colori DCi-P3 o OLED sono ancora fuori portata.
| |||||||||||||||||||||||||
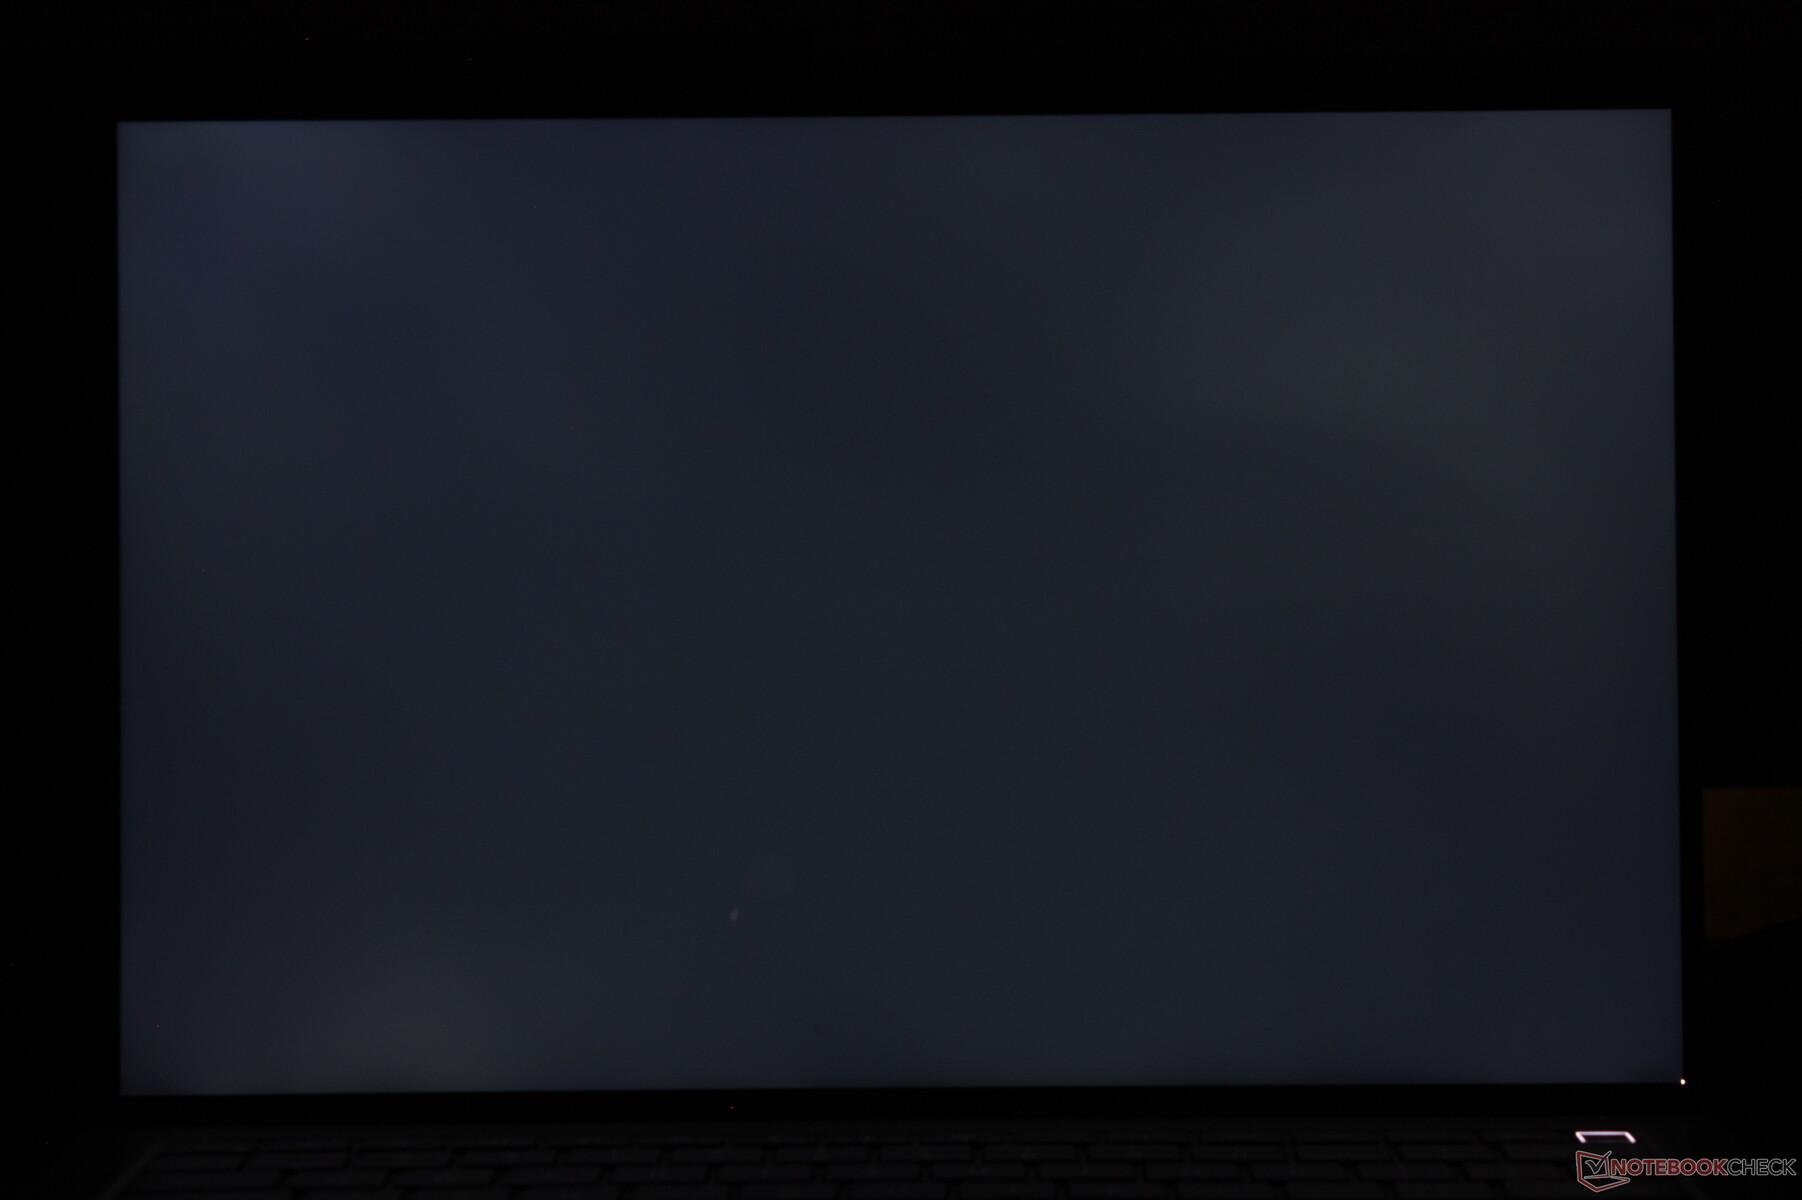
Distribuzione della luminosità: 87 %
Al centro con la batteria: 472.8 cd/m²
Contrasto: 1351:1 (Nero: 0.35 cd/m²)
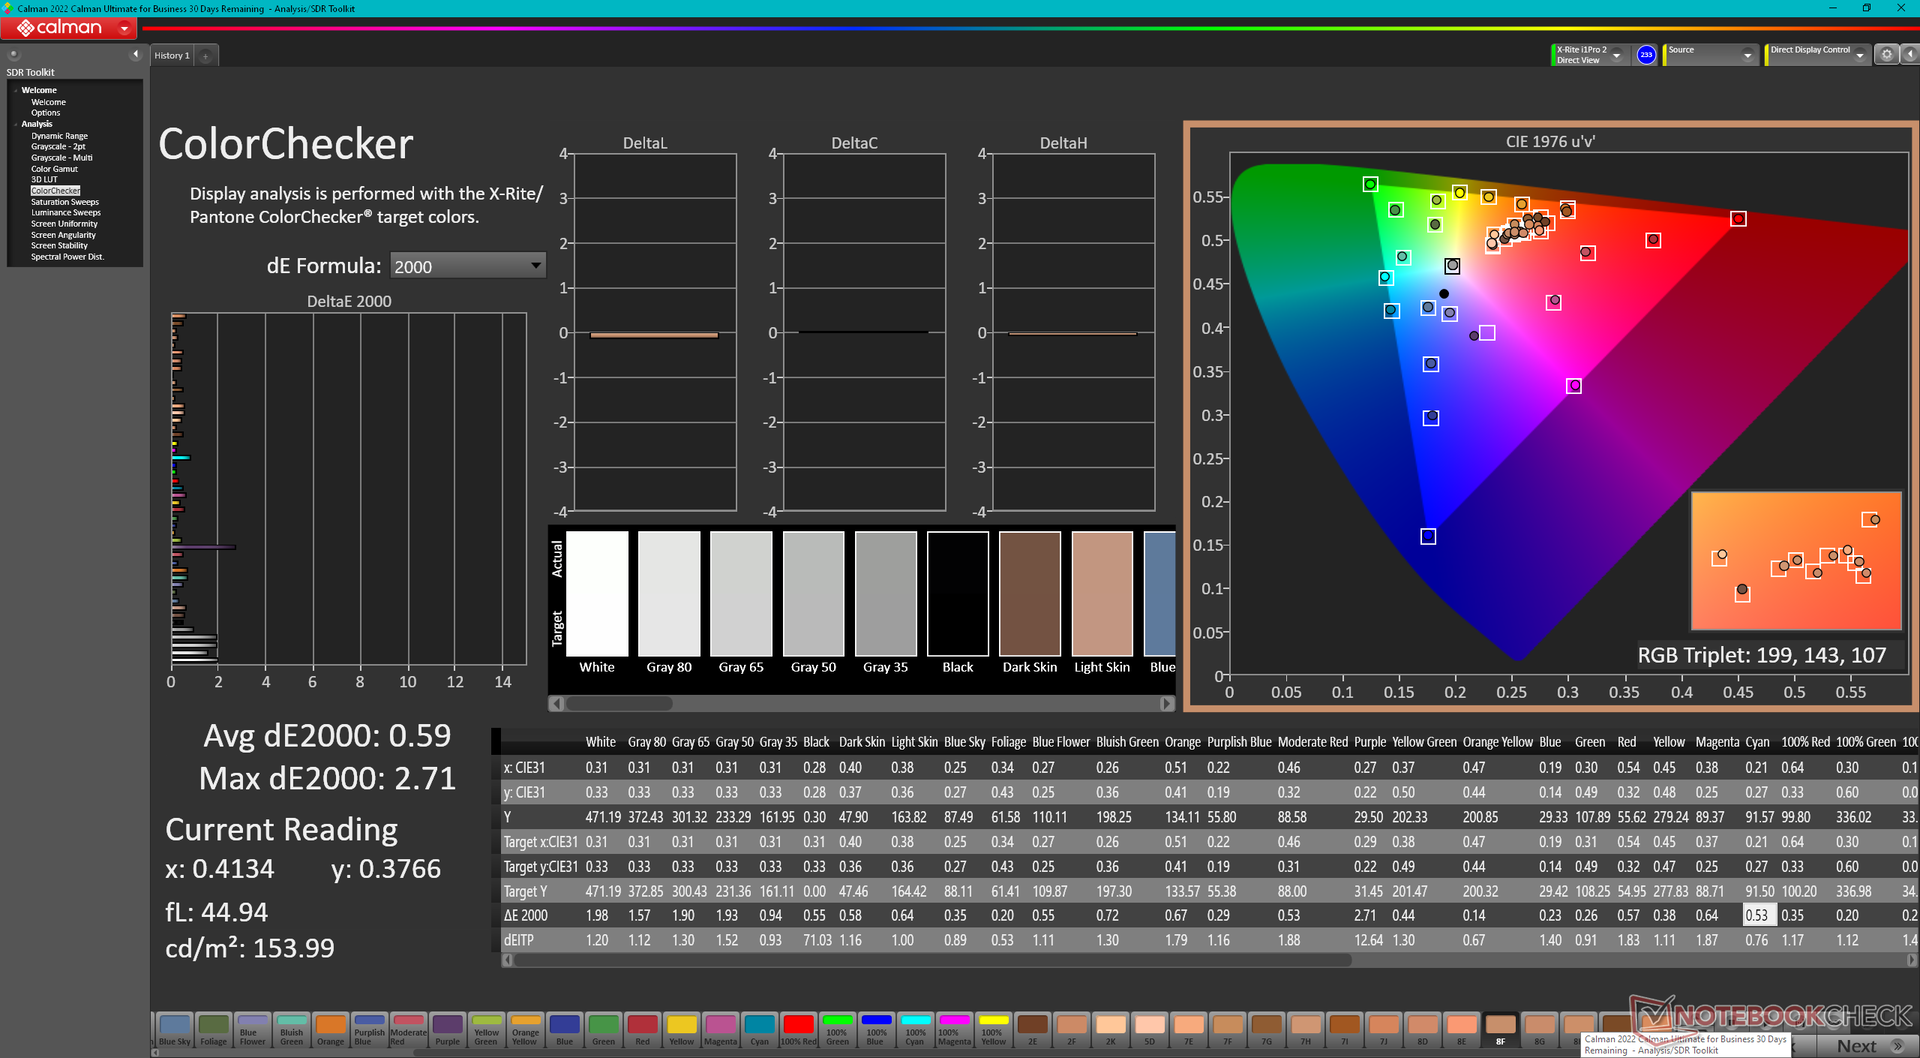
ΔE ColorChecker Calman: 2.1 | ∀{0.5-29.43 Ø4.71}
calibrated: 0.59
ΔE Greyscale Calman: 1.7 | ∀{0.09-98 Ø4.96}
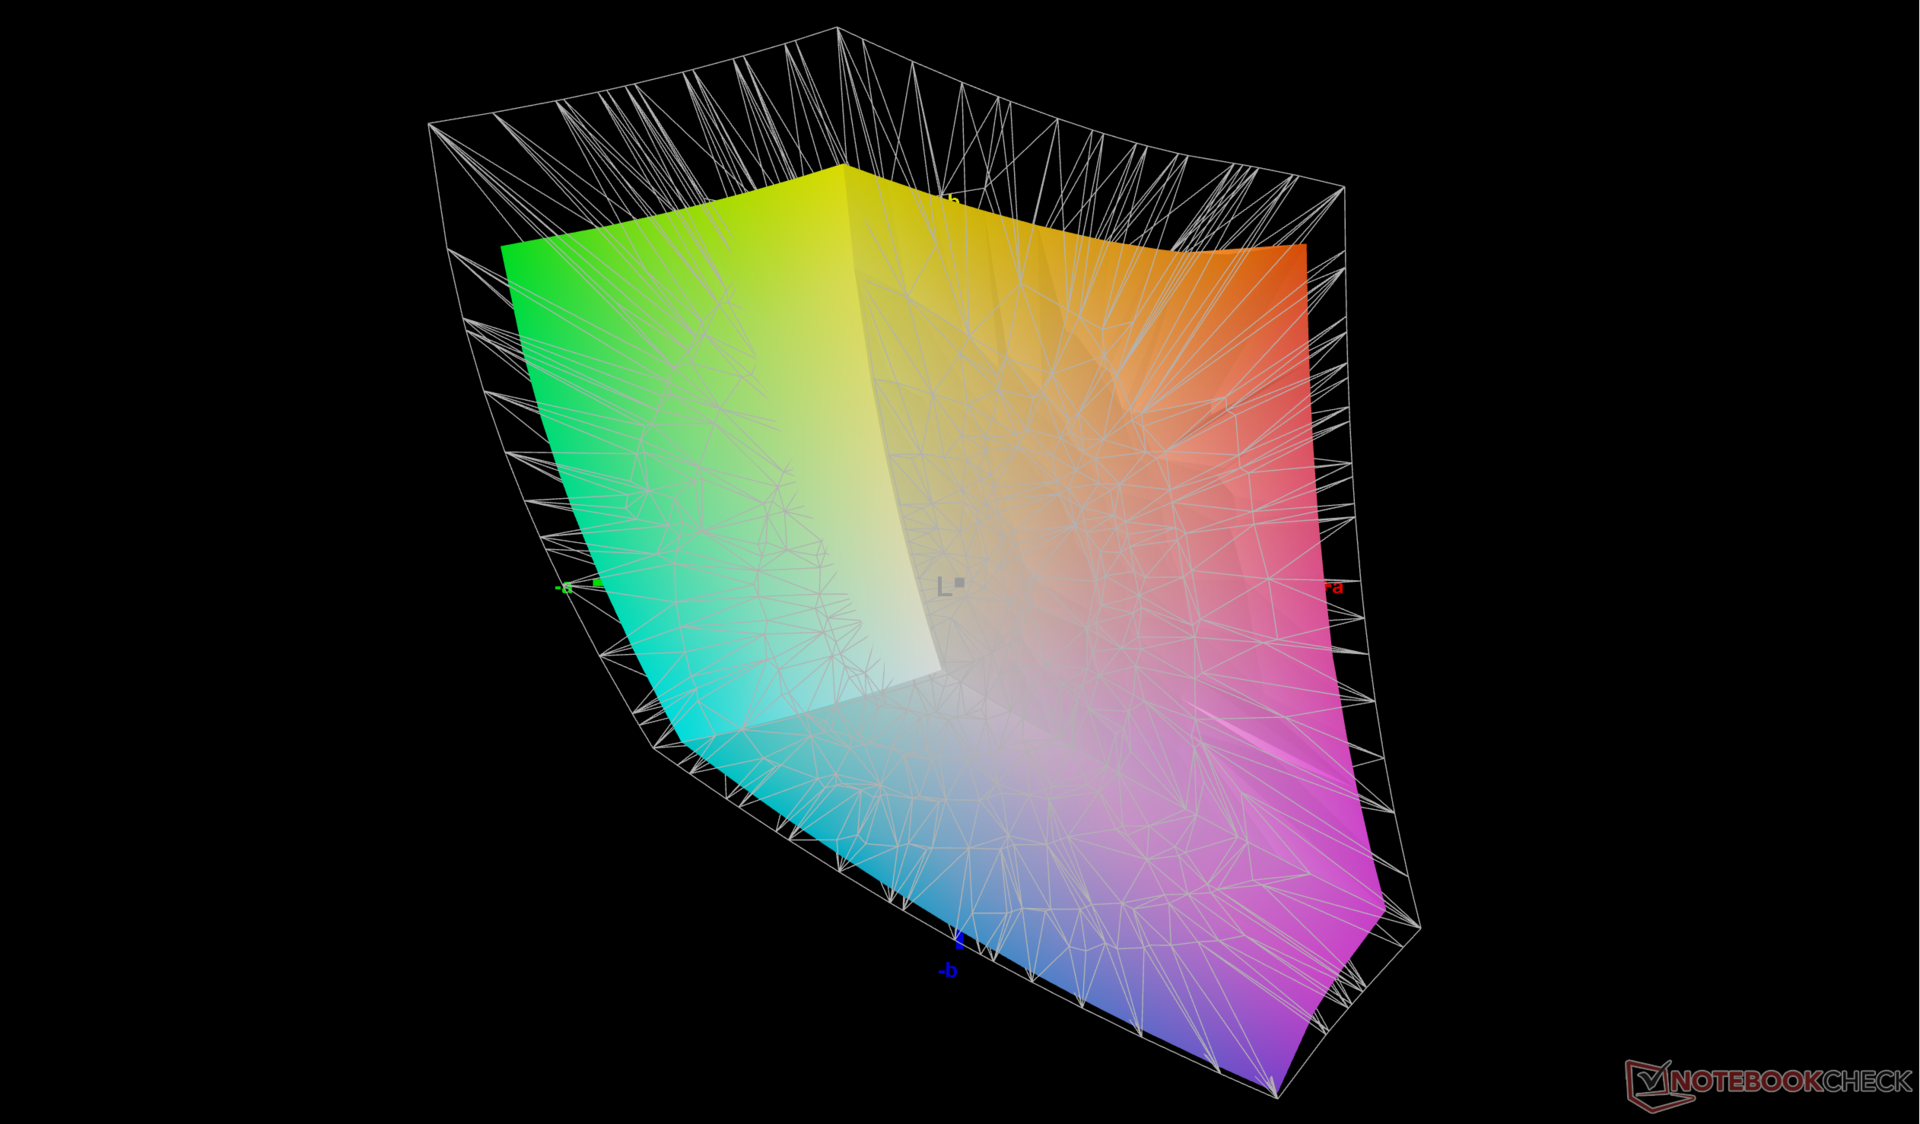
78% AdobeRGB 1998 (Argyll 3D)
99.8% sRGB (Argyll 3D)
77.6% Display P3 (Argyll 3D)
Gamma: 2.26
CCT: 6493 K
| Dell Precision 5480 AU Optronics B140QAN, IPS, 2560x1600, 14" | Dell Precision 5000 5470 AU Optronics B140QAN, IPS, 2560x1600, 14" | Dell Precision 5000 5560 Sharp LQ156R1, IPS, 3840x2400, 15.6" | Lenovo ThinkPad P14s G3 AMD 21J6S05000 LP140WU1-SPB2, IPS LED, 1920x1200, 14" | Lenovo ThinkPad P15v G3 21EM001AGE NE156QUM-N6C, IPS LED, 3840x2160, 15.6" | HP ZBook Firefly 14 G9-6B8A2EA CMN1435, IPS, 1920x1200, 14" | |
|---|---|---|---|---|---|---|
| Display | 1% | 17% | -11% | 15% | -6% | |
| Display P3 Coverage (%) | 77.6 | 79.3 2% | 94.9 22% | 65.9 -15% | 89.9 16% | 69.6 -10% |
| sRGB Coverage (%) | 99.8 | 100 0% | 100 0% | 94.3 -6% | 100 0% | 99.9 0% |
| AdobeRGB 1998 Coverage (%) | 78 | 78.7 1% | 100 28% | 68.2 -13% | 99.9 28% | 71.1 -9% |
| Response Times | -24% | -14% | 13% | -7% | -16% | |
| Response Time Grey 50% / Grey 80% * (ms) | 43.9 ? | 52.4 ? -19% | 47.2 ? -8% | 33.5 ? 24% | 46.7 ? -6% | 56.3 ? -28% |
| Response Time Black / White * (ms) | 25.3 ? | 32.4 ? -28% | 30.4 ? -20% | 24.9 ? 2% | 27.3 ? -8% | 26.2 ? -4% |
| PWM Frequency (Hz) | ||||||
| Screen | -8% | -35% | -13% | -55% | -26% | |
| Brightness middle (cd/m²) | 472.8 | 537 14% | 501.5 6% | 448 -5% | 588 24% | 432 -9% |
| Brightness (cd/m²) | 469 | 518 10% | 467 0% | 422 -10% | 536 14% | 407 -13% |
| Brightness Distribution (%) | 87 | 94 8% | 83 -5% | 85 -2% | 83 -5% | 91 5% |
| Black Level * (cd/m²) | 0.35 | 0.33 6% | 0.44 -26% | 0.23 34% | 0.38 -9% | 0.28 20% |
| Contrast (:1) | 1351 | 1627 20% | 1140 -16% | 1948 44% | 1547 15% | 1543 14% |
| Colorchecker dE 2000 * | 2.1 | 2.97 -41% | 4.73 -125% | 2.5 -19% | 3.9 -86% | 3.1 -48% |
| Colorchecker dE 2000 max. * | 5.54 | 5.33 4% | 8.45 -53% | 3.7 33% | 8.8 -59% | 5.6 -1% |
| Colorchecker dE 2000 calibrated * | 0.59 | 0.88 -49% | 0.51 14% | 1.3 -120% | 1 -69% | 0.8 -36% |
| Greyscale dE 2000 * | 1.7 | 2.4 -41% | 3.6 -112% | 2.9 -71% | 7.1 -318% | 4.5 -165% |
| Gamma | 2.26 97% | 2.06 107% | 2.08 106% | 2.03 108% | 2.12 104% | 2 110% |
| CCT | 6493 100% | 6668 97% | 6447 101% | 6840 95% | 7268 89% | 6528 100% |
| Media totale (Programma / Settaggio) | -10% /
-8% | -11% /
-21% | -4% /
-9% | -16% /
-33% | -16% /
-20% |
* ... Meglio usare valori piccoli
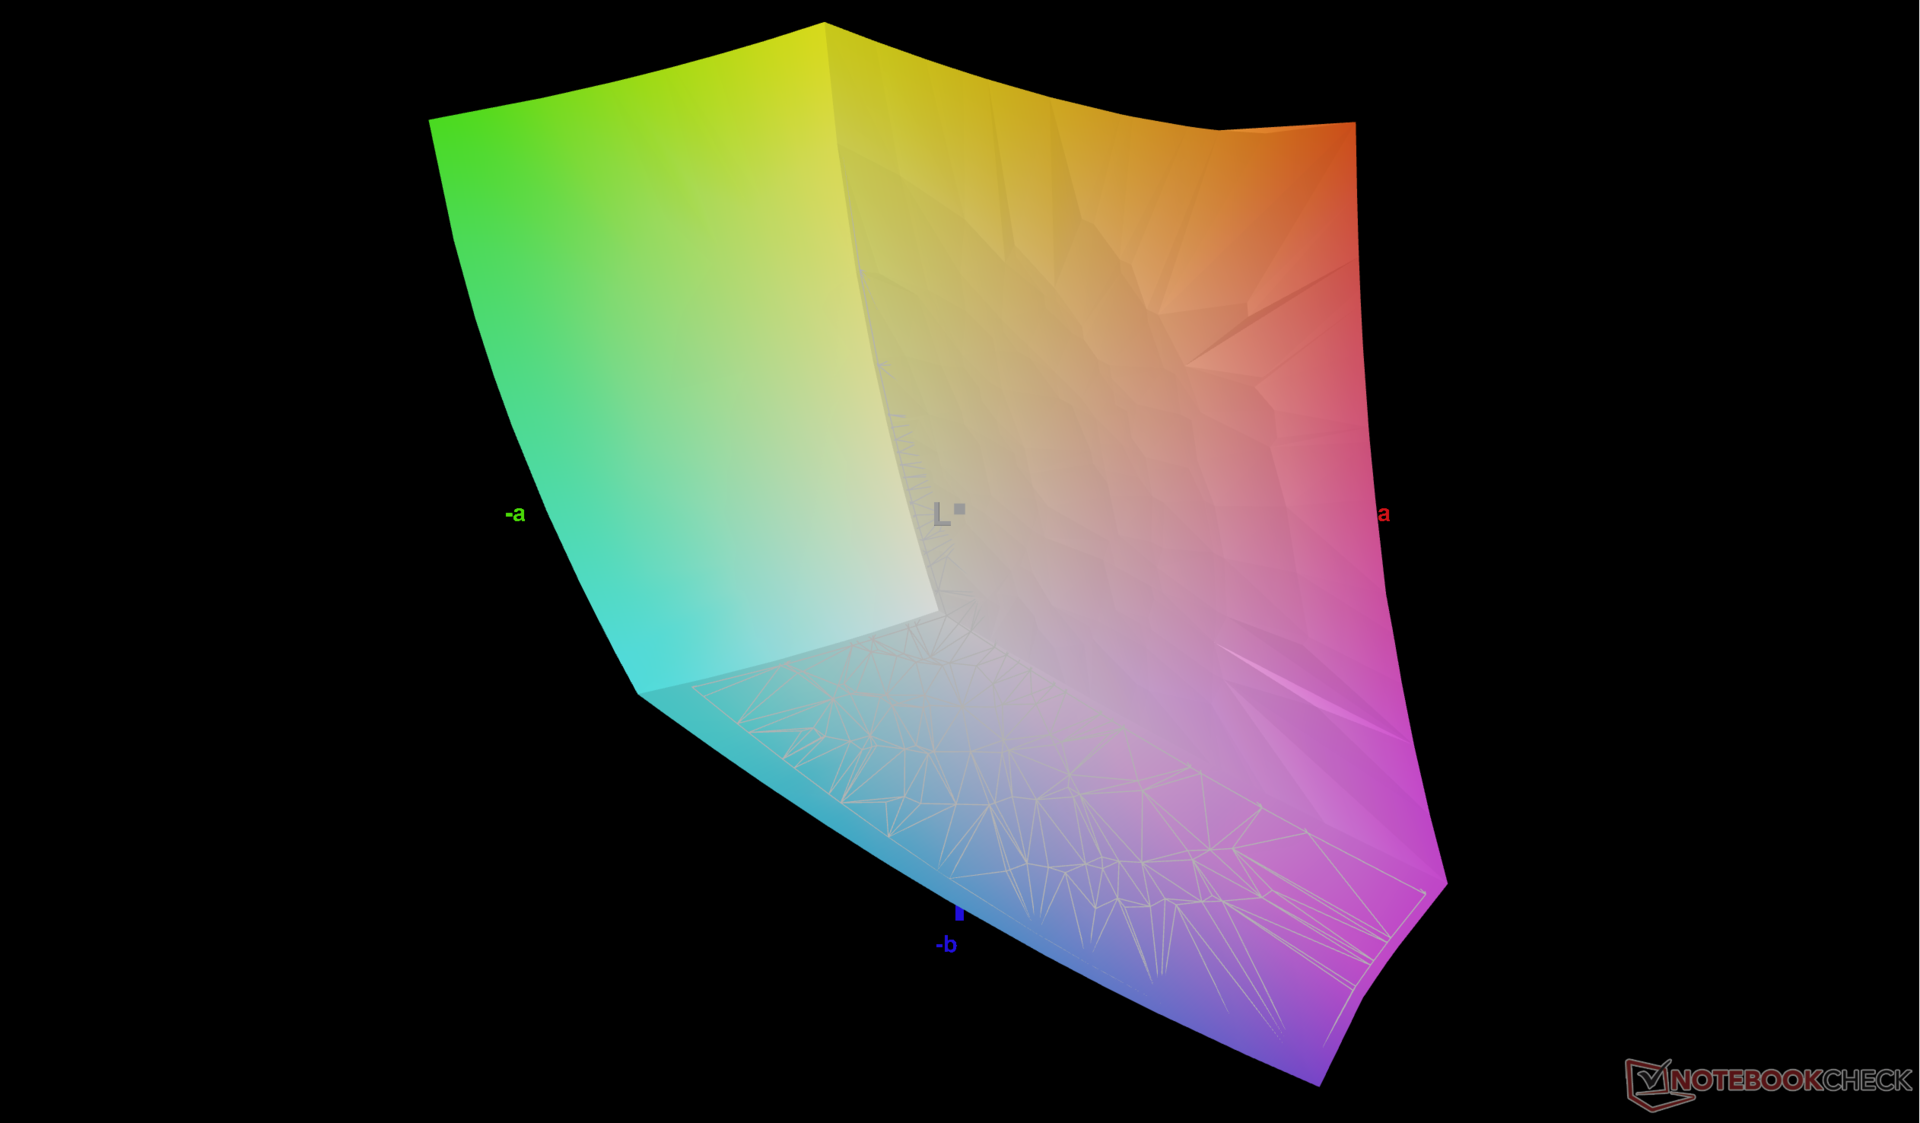
Il display viene comunque fornito ben calibrato, con valori medi di deltaE della scala di grigi e del colore di appena 1,7 e 2,1, rispettivamente. La calibrazione da parte dell'utente finale è possibile ma non necessaria.

Tempi di risposta del Display
| ↔ Tempi di risposta dal Nero al Bianco | ||
|---|---|---|
| 25.3 ms ... aumenta ↗ e diminuisce ↘ combinato | ↗ 12.6 ms Incremento | 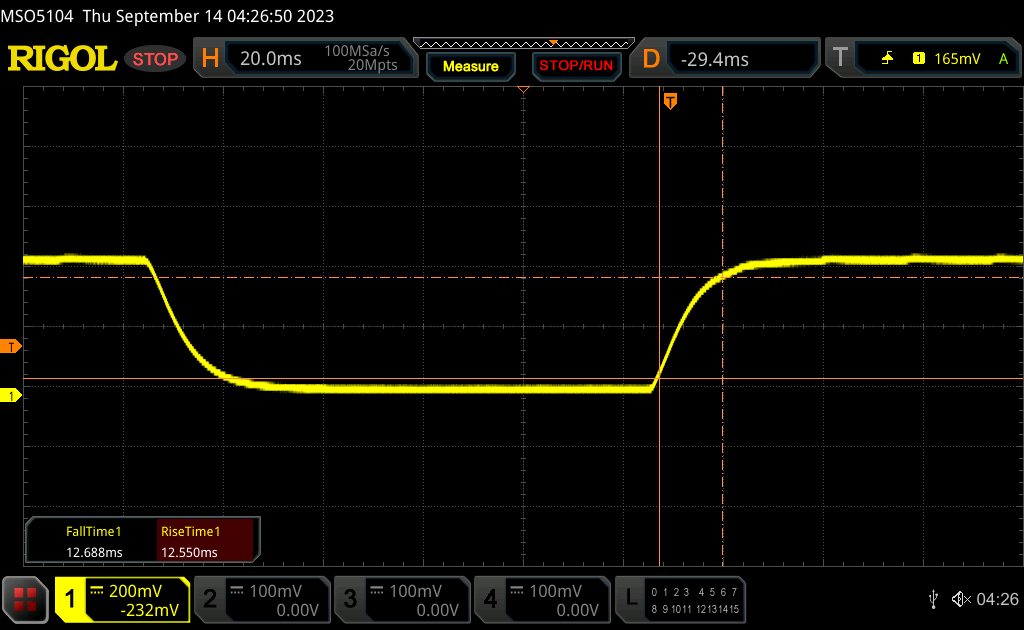 |
| ↘ 12.7 ms Calo | ||
| Lo schermo mostra tempi di risposta relativamente lenti nei nostri tests e potrebbe essere troppo lento per i gamers. In confronto, tutti i dispositivi di test variano da 0.1 (minimo) a 240 (massimo) ms. » 61 % di tutti i dispositivi è migliore. Questo significa che i tempi di risposta rilevati sono peggiori rispetto alla media di tutti i dispositivi testati (19.8 ms). | ||
| ↔ Tempo di risposta dal 50% Grigio all'80% Grigio | ||
| 43.9 ms ... aumenta ↗ e diminuisce ↘ combinato | ↗ 19.2 ms Incremento | 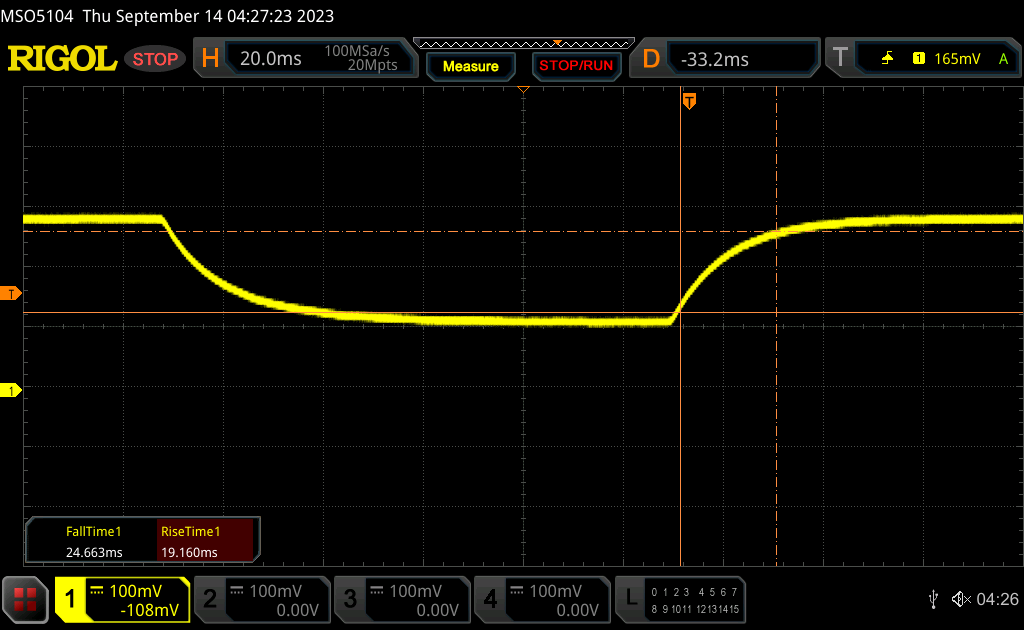 |
| ↘ 24.7 ms Calo | ||
| Lo schermo mostra tempi di risposta lenti nei nostri tests e sarà insoddisfacente per i gamers. In confronto, tutti i dispositivi di test variano da 0.165 (minimo) a 636 (massimo) ms. » 73 % di tutti i dispositivi è migliore. Questo significa che i tempi di risposta rilevati sono peggiori rispetto alla media di tutti i dispositivi testati (31 ms). | ||
Sfarfallio dello schermo / PWM (Pulse-Width Modulation)
| flickering dello schermo / PWM non rilevato | 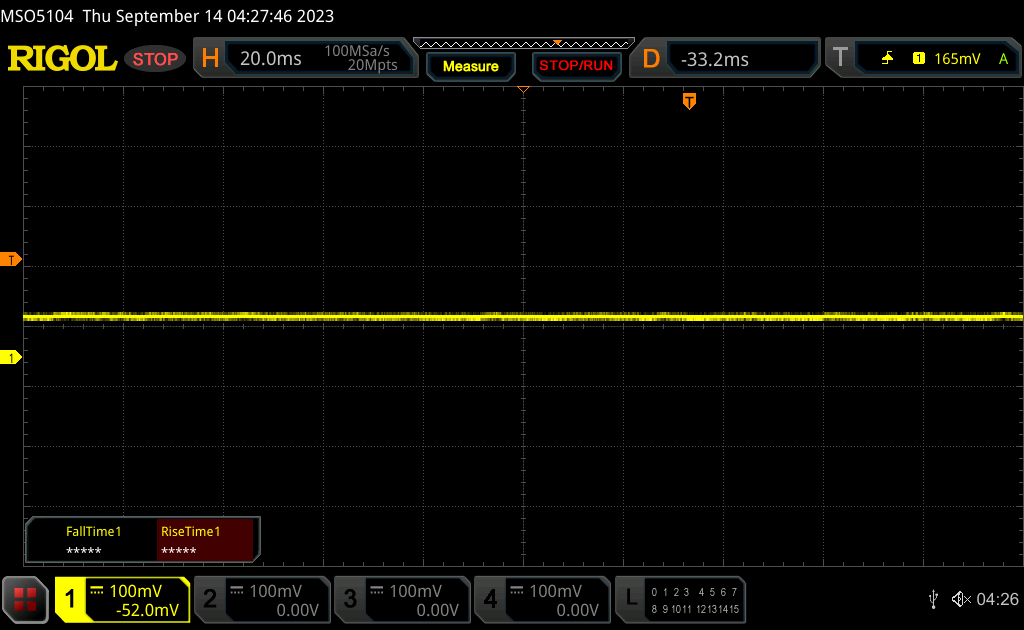 | ||
In confronto: 52 % di tutti i dispositivi testati non utilizza PWM per ridurre la luminosita' del display. Se è rilevato PWM, una media di 7747 (minimo: 5 - massimo: 343500) Hz è stata rilevata. | |||
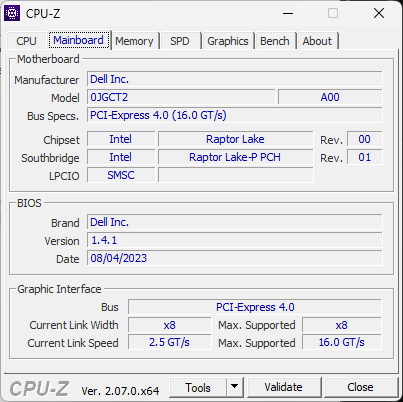
Prestazioni - Raptor Lake-H di 13a generazione
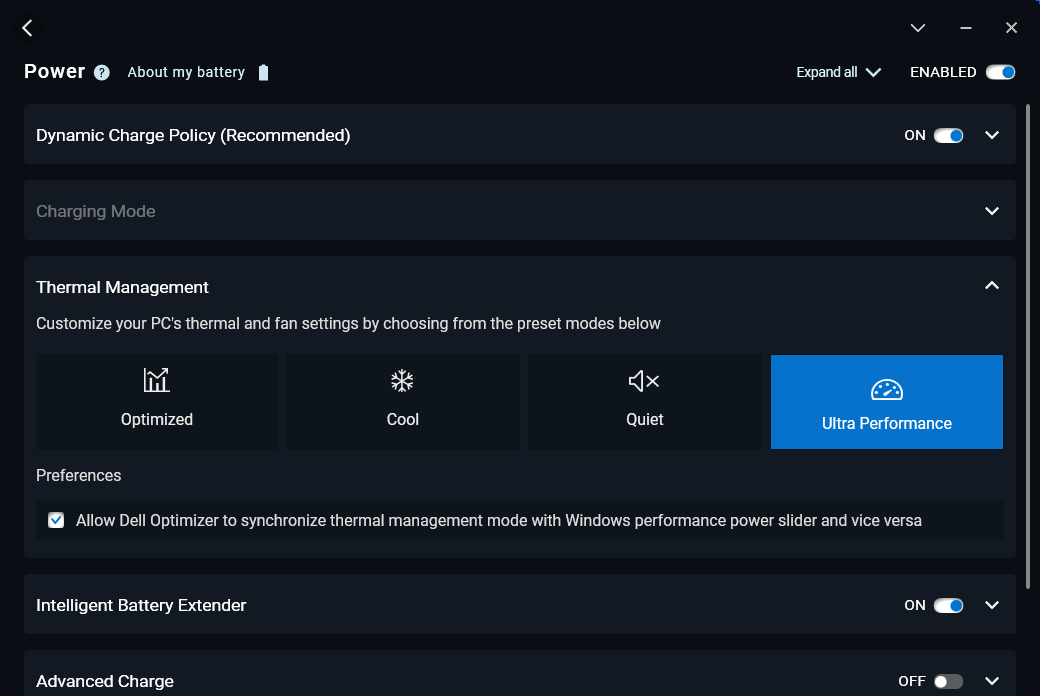
Condizioni di test
Abbiamo impostato la nostra unità in modalità Ultra Performance tramite Dell Optimizer prima di eseguire i benchmark qui sotto. I profili energetici di Optimizer possono sincronizzarsi con i profili energetici di Windows, a differenza della maggior parte degli altri portatili.
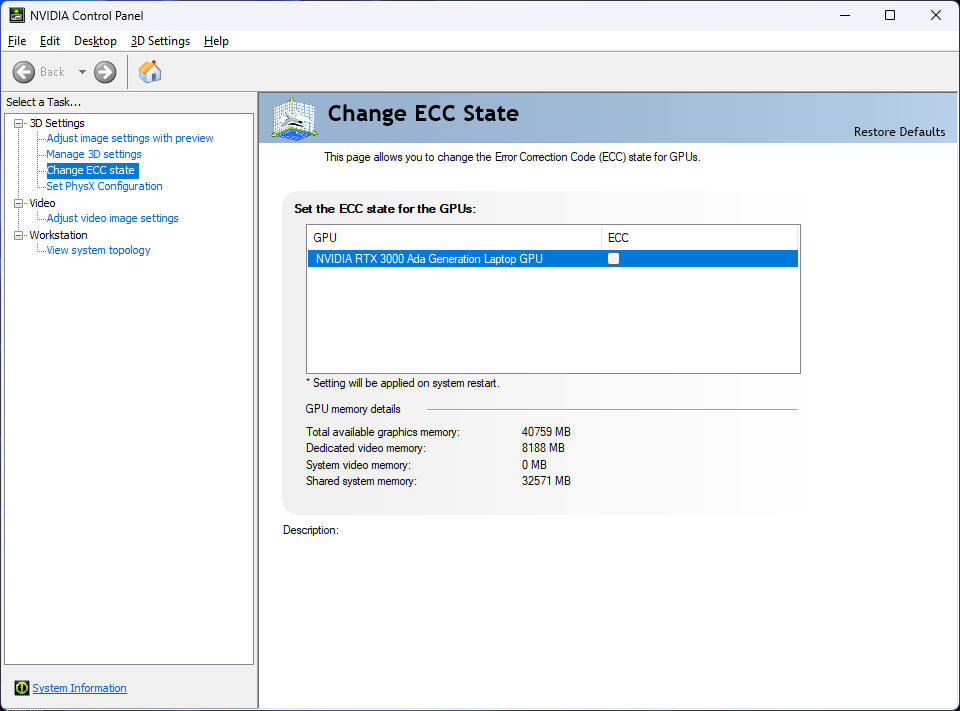
Advanced Optimus, MUX e G-Sync non sono supportati sul display interno. La modalità VRAM ECC può essere attivata o disattivata tramite il pannello di controllo Nvidia, come in altre GPU RTX di classe workstation della generazione Ada Lovelace.
Processore
Il nostro Core i9-13900H offre prestazioni multi-thread superiori del 25-35% rispetto al modello Core i9-12900H del modello Precision 5470 dello scorso anno. Il notevole incremento può essere attribuito alle prestazioni Turbo Boost più stabili di Precision 5480 rispetto a Precision 5470, come dimostrano i risultati del test CineBench R15 xT qui sotto.
Le prestazioni medie sono ancora più lente di quanto ci si aspetti da un portatile con Core i9-13900H, probabilmente a causa delle dimensioni ridotte di Precision 5480. Il più grande Precision 5680ad esempio, ha la stessa CPU, ma le prestazioni sono più veloci di circa il 15 percento.
Cinebench R15 Multi Loop
Cinebench R23: Multi Core | Single Core
Cinebench R20: CPU (Multi Core) | CPU (Single Core)
Cinebench R15: CPU Multi 64Bit | CPU Single 64Bit
Blender: v2.79 BMW27 CPU
7-Zip 18.03: 7z b 4 | 7z b 4 -mmt1
Geekbench 5.5: Multi-Core | Single-Core
HWBOT x265 Benchmark v2.2: 4k Preset
LibreOffice : 20 Documents To PDF
R Benchmark 2.5: Overall mean
| CPU Performance rating | |
| Asus ExpertBook B6 Flip B6602FC2 | |
| Dell Precision 5000 5680 | |
| HP ZBook Fury 16 G9 | |
| Dell Precision 5480 | |
| Media Intel Core i9-13900H | |
| Dell Precision 5000 5470 | |
| Lenovo ThinkPad P1 G4-20Y4Z9DVUS | |
| Lenovo ThinkPad P14s G3 AMD 21J6S05000 | |
| HP ZBook Firefly 14 G9-6B8A2EA | |
| Dell Precision 5000 5560 -2! | |
| Lenovo ThinkPad P15v G3 21EM001AGE | |
| Lenovo ThinkPad P15v G2 21A9000XGE -1! | |
| Cinebench R23 / Multi Core | |
| Asus ExpertBook B6 Flip B6602FC2 | |
| HP ZBook Fury 16 G9 | |
| Dell Precision 5000 5680 | |
| Media Intel Core i9-13900H (11997 - 20385, n=28) | |
| Dell Precision 5480 | |
| Dell Precision 5000 5470 | |
| Lenovo ThinkPad P15v G3 21EM001AGE | |
| Lenovo ThinkPad P1 G4-20Y4Z9DVUS | |
| Lenovo ThinkPad P14s G3 AMD 21J6S05000 | |
| Lenovo ThinkPad P15v G2 21A9000XGE | |
| Dell Precision 5000 5560 | |
| HP ZBook Firefly 14 G9-6B8A2EA | |
| Cinebench R23 / Single Core | |
| Dell Precision 5000 5680 | |
| Dell Precision 5480 | |
| HP ZBook Fury 16 G9 | |
| Media Intel Core i9-13900H (1297 - 2054, n=26) | |
| Asus ExpertBook B6 Flip B6602FC2 | |
| Dell Precision 5000 5470 | |
| HP ZBook Firefly 14 G9-6B8A2EA | |
| Lenovo ThinkPad P14s G3 AMD 21J6S05000 | |
| Dell Precision 5000 5560 | |
| Lenovo ThinkPad P1 G4-20Y4Z9DVUS | |
| Lenovo ThinkPad P15v G3 21EM001AGE | |
| Cinebench R20 / CPU (Multi Core) | |
| Asus ExpertBook B6 Flip B6602FC2 | |
| HP ZBook Fury 16 G9 | |
| Dell Precision 5000 5680 | |
| Media Intel Core i9-13900H (4935 - 7716, n=25) | |
| Dell Precision 5480 | |
| Lenovo ThinkPad P15v G3 21EM001AGE | |
| Lenovo ThinkPad P15v G3 21EM001AGE | |
| Lenovo ThinkPad P1 G4-20Y4Z9DVUS | |
| Dell Precision 5000 5470 | |
| Lenovo ThinkPad P14s G3 AMD 21J6S05000 | |
| Dell Precision 5000 5560 | |
| Lenovo ThinkPad P15v G2 21A9000XGE | |
| HP ZBook Firefly 14 G9-6B8A2EA | |
| Cinebench R20 / CPU (Single Core) | |
| Dell Precision 5000 5680 | |
| Dell Precision 5480 | |
| HP ZBook Fury 16 G9 | |
| Asus ExpertBook B6 Flip B6602FC2 | |
| Media Intel Core i9-13900H (428 - 792, n=25) | |
| Dell Precision 5000 5470 | |
| HP ZBook Firefly 14 G9-6B8A2EA | |
| Lenovo ThinkPad P14s G3 AMD 21J6S05000 | |
| Lenovo ThinkPad P1 G4-20Y4Z9DVUS | |
| Dell Precision 5000 5560 | |
| Lenovo ThinkPad P15v G3 21EM001AGE | |
| Lenovo ThinkPad P15v G3 21EM001AGE | |
| Lenovo ThinkPad P15v G2 21A9000XGE | |
| Cinebench R15 / CPU Multi 64Bit | |
| Asus ExpertBook B6 Flip B6602FC2 | |
| Media Intel Core i9-13900H (2061 - 3100, n=26) | |
| HP ZBook Fury 16 G9 | |
| Dell Precision 5480 | |
| Dell Precision 5000 5680 | |
| Dell Precision 5000 5470 | |
| Lenovo ThinkPad P1 G4-20Y4Z9DVUS | |
| Lenovo ThinkPad P15v G3 21EM001AGE | |
| Lenovo ThinkPad P14s G3 AMD 21J6S05000 | |
| Lenovo ThinkPad P15v G2 21A9000XGE | |
| Dell Precision 5000 5560 | |
| HP ZBook Firefly 14 G9-6B8A2EA | |
| Cinebench R15 / CPU Single 64Bit | |
| Dell Precision 5000 5680 | |
| Dell Precision 5480 | |
| Asus ExpertBook B6 Flip B6602FC2 | |
| Media Intel Core i9-13900H (211 - 297, n=26) | |
| HP ZBook Firefly 14 G9-6B8A2EA | |
| Dell Precision 5000 5470 | |
| Lenovo ThinkPad P14s G3 AMD 21J6S05000 | |
| Dell Precision 5000 5560 | |
| Lenovo ThinkPad P1 G4-20Y4Z9DVUS | |
| Lenovo ThinkPad P15v G2 21A9000XGE | |
| HP ZBook Fury 16 G9 | |
| Lenovo ThinkPad P15v G3 21EM001AGE | |
| Blender / v2.79 BMW27 CPU | |
| HP ZBook Firefly 14 G9-6B8A2EA | |
| Lenovo ThinkPad P15v G2 21A9000XGE | |
| Dell Precision 5000 5560 | |
| Lenovo ThinkPad P14s G3 AMD 21J6S05000 | |
| Lenovo ThinkPad P1 G4-20Y4Z9DVUS | |
| Dell Precision 5000 5470 | |
| Lenovo ThinkPad P15v G3 21EM001AGE | |
| Dell Precision 5480 | |
| Media Intel Core i9-13900H (166 - 268, n=24) | |
| Dell Precision 5000 5680 | |
| Asus ExpertBook B6 Flip B6602FC2 | |
| HP ZBook Fury 16 G9 | |
| 7-Zip 18.03 / 7z b 4 | |
| HP ZBook Fury 16 G9 | |
| Asus ExpertBook B6 Flip B6602FC2 | |
| Dell Precision 5000 5680 | |
| Media Intel Core i9-13900H (45045 - 79032, n=25) | |
| Dell Precision 5480 | |
| Lenovo ThinkPad P15v G3 21EM001AGE | |
| Dell Precision 5000 5470 | |
| Lenovo ThinkPad P1 G4-20Y4Z9DVUS | |
| Lenovo ThinkPad P14s G3 AMD 21J6S05000 | |
| Dell Precision 5000 5560 | |
| Lenovo ThinkPad P15v G2 21A9000XGE | |
| HP ZBook Firefly 14 G9-6B8A2EA | |
| 7-Zip 18.03 / 7z b 4 -mmt1 | |
| Asus ExpertBook B6 Flip B6602FC2 | |
| Dell Precision 5000 5680 | |
| Dell Precision 5480 | |
| Media Intel Core i9-13900H (3665 - 6600, n=25) | |
| HP ZBook Fury 16 G9 | |
| Dell Precision 5000 5560 | |
| HP ZBook Firefly 14 G9-6B8A2EA | |
| Lenovo ThinkPad P1 G4-20Y4Z9DVUS | |
| Dell Precision 5000 5470 | |
| Lenovo ThinkPad P15v G3 21EM001AGE | |
| Lenovo ThinkPad P15v G2 21A9000XGE | |
| Lenovo ThinkPad P14s G3 AMD 21J6S05000 | |
| Geekbench 5.5 / Multi-Core | |
| Asus ExpertBook B6 Flip B6602FC2 | |
| Dell Precision 5000 5680 | |
| HP ZBook Fury 16 G9 | |
| Dell Precision 5480 | |
| Media Intel Core i9-13900H (9094 - 15410, n=26) | |
| Dell Precision 5000 5470 | |
| HP ZBook Firefly 14 G9-6B8A2EA | |
| Lenovo ThinkPad P1 G4-20Y4Z9DVUS | |
| Lenovo ThinkPad P15v G3 21EM001AGE | |
| Lenovo ThinkPad P14s G3 AMD 21J6S05000 | |
| Lenovo ThinkPad P15v G2 21A9000XGE | |
| Geekbench 5.5 / Single-Core | |
| Dell Precision 5000 5680 | |
| HP ZBook Fury 16 G9 | |
| Dell Precision 5480 | |
| Media Intel Core i9-13900H (1140 - 2043, n=26) | |
| Asus ExpertBook B6 Flip B6602FC2 | |
| Dell Precision 5000 5470 | |
| HP ZBook Firefly 14 G9-6B8A2EA | |
| Lenovo ThinkPad P1 G4-20Y4Z9DVUS | |
| Lenovo ThinkPad P14s G3 AMD 21J6S05000 | |
| Lenovo ThinkPad P15v G2 21A9000XGE | |
| Lenovo ThinkPad P15v G3 21EM001AGE | |
| HWBOT x265 Benchmark v2.2 / 4k Preset | |
| Asus ExpertBook B6 Flip B6602FC2 | |
| Dell Precision 5000 5680 | |
| HP ZBook Fury 16 G9 | |
| Media Intel Core i9-13900H (14.1 - 22.3, n=25) | |
| Dell Precision 5480 | |
| Lenovo ThinkPad P1 G4-20Y4Z9DVUS | |
| Dell Precision 5000 5470 | |
| Lenovo ThinkPad P14s G3 AMD 21J6S05000 | |
| Lenovo ThinkPad P15v G3 21EM001AGE | |
| Dell Precision 5000 5560 | |
| Lenovo ThinkPad P15v G2 21A9000XGE | |
| HP ZBook Firefly 14 G9-6B8A2EA | |
| LibreOffice / 20 Documents To PDF | |
| Lenovo ThinkPad P15v G3 21EM001AGE | |
| Lenovo ThinkPad P14s G3 AMD 21J6S05000 | |
| Lenovo ThinkPad P15v G2 21A9000XGE | |
| Lenovo ThinkPad P1 G4-20Y4Z9DVUS | |
| Dell Precision 5000 5560 | |
| Media Intel Core i9-13900H (34.4 - 82.8, n=25) | |
| Dell Precision 5000 5470 | |
| Dell Precision 5480 | |
| HP ZBook Firefly 14 G9-6B8A2EA | |
| Asus ExpertBook B6 Flip B6602FC2 | |
| Dell Precision 5000 5680 | |
| HP ZBook Fury 16 G9 | |
| R Benchmark 2.5 / Overall mean | |
| Lenovo ThinkPad P15v G2 21A9000XGE | |
| Lenovo ThinkPad P1 G4-20Y4Z9DVUS | |
| Dell Precision 5000 5560 | |
| Lenovo ThinkPad P14s G3 AMD 21J6S05000 | |
| Lenovo ThinkPad P15v G3 21EM001AGE | |
| HP ZBook Firefly 14 G9-6B8A2EA | |
| Dell Precision 5000 5470 | |
| Dell Precision 5480 | |
| Asus ExpertBook B6 Flip B6602FC2 | |
| Media Intel Core i9-13900H (0.4052 - 0.723, n=25) | |
| HP ZBook Fury 16 G9 | |
| Dell Precision 5000 5680 | |
* ... Meglio usare valori piccoli
AIDA64: FP32 Ray-Trace | FPU Julia | CPU SHA3 | CPU Queen | FPU SinJulia | FPU Mandel | CPU AES | CPU ZLib | FP64 Ray-Trace | CPU PhotoWorxx
| Performance rating | |
| Lenovo ThinkPad P15v G3 21EM001AGE | |
| Dell Precision 5480 | |
| Media Intel Core i9-13900H | |
| Lenovo ThinkPad P14s G3 AMD 21J6S05000 | |
| Dell Precision 5000 5470 | |
| HP ZBook Firefly 14 G9-6B8A2EA | |
| AIDA64 / FP32 Ray-Trace | |
| Dell Precision 5480 | |
| Media Intel Core i9-13900H (6788 - 19557, n=25) | |
| Lenovo ThinkPad P15v G3 21EM001AGE | |
| Dell Precision 5000 5470 | |
| Lenovo ThinkPad P14s G3 AMD 21J6S05000 | |
| HP ZBook Firefly 14 G9-6B8A2EA | |
| AIDA64 / FPU Julia | |
| Lenovo ThinkPad P15v G3 21EM001AGE | |
| Lenovo ThinkPad P14s G3 AMD 21J6S05000 | |
| Dell Precision 5480 | |
| Media Intel Core i9-13900H (22551 - 95579, n=25) | |
| Dell Precision 5000 5470 | |
| HP ZBook Firefly 14 G9-6B8A2EA | |
| AIDA64 / CPU SHA3 | |
| Media Intel Core i9-13900H (2491 - 4270, n=25) | |
| Dell Precision 5480 | |
| Lenovo ThinkPad P15v G3 21EM001AGE | |
| Dell Precision 5000 5470 | |
| Lenovo ThinkPad P14s G3 AMD 21J6S05000 | |
| HP ZBook Firefly 14 G9-6B8A2EA | |
| AIDA64 / CPU Queen | |
| Dell Precision 5480 | |
| Dell Precision 5000 5470 | |
| Media Intel Core i9-13900H (65121 - 120936, n=25) | |
| Lenovo ThinkPad P15v G3 21EM001AGE | |
| Lenovo ThinkPad P14s G3 AMD 21J6S05000 | |
| HP ZBook Firefly 14 G9-6B8A2EA | |
| AIDA64 / FPU SinJulia | |
| Lenovo ThinkPad P15v G3 21EM001AGE | |
| Lenovo ThinkPad P14s G3 AMD 21J6S05000 | |
| Dell Precision 5480 | |
| Media Intel Core i9-13900H (6108 - 11631, n=25) | |
| Dell Precision 5000 5470 | |
| HP ZBook Firefly 14 G9-6B8A2EA | |
| AIDA64 / FPU Mandel | |
| Lenovo ThinkPad P15v G3 21EM001AGE | |
| Lenovo ThinkPad P14s G3 AMD 21J6S05000 | |
| Dell Precision 5480 | |
| Media Intel Core i9-13900H (11283 - 48474, n=25) | |
| Dell Precision 5000 5470 | |
| HP ZBook Firefly 14 G9-6B8A2EA | |
| AIDA64 / CPU AES | |
| Lenovo ThinkPad P15v G3 21EM001AGE | |
| Media Intel Core i9-13900H (3691 - 149377, n=25) | |
| Dell Precision 5480 | |
| Lenovo ThinkPad P14s G3 AMD 21J6S05000 | |
| HP ZBook Firefly 14 G9-6B8A2EA | |
| Dell Precision 5000 5470 | |
| AIDA64 / CPU ZLib | |
| Media Intel Core i9-13900H (789 - 1254, n=25) | |
| Dell Precision 5480 | |
| Lenovo ThinkPad P15v G3 21EM001AGE | |
| Lenovo ThinkPad P14s G3 AMD 21J6S05000 | |
| HP ZBook Firefly 14 G9-6B8A2EA | |
| Dell Precision 5000 5470 | |
| AIDA64 / FP64 Ray-Trace | |
| Media Intel Core i9-13900H (3655 - 10716, n=25) | |
| Dell Precision 5480 | |
| Lenovo ThinkPad P15v G3 21EM001AGE | |
| Dell Precision 5000 5470 | |
| Lenovo ThinkPad P14s G3 AMD 21J6S05000 | |
| HP ZBook Firefly 14 G9-6B8A2EA | |
| AIDA64 / CPU PhotoWorxx | |
| Dell Precision 5480 | |
| Dell Precision 5000 5470 | |
| HP ZBook Firefly 14 G9-6B8A2EA | |
| Media Intel Core i9-13900H (10871 - 50488, n=25) | |
| Lenovo ThinkPad P14s G3 AMD 21J6S05000 | |
| Lenovo ThinkPad P15v G3 21EM001AGE | |
Prestazioni del sistema
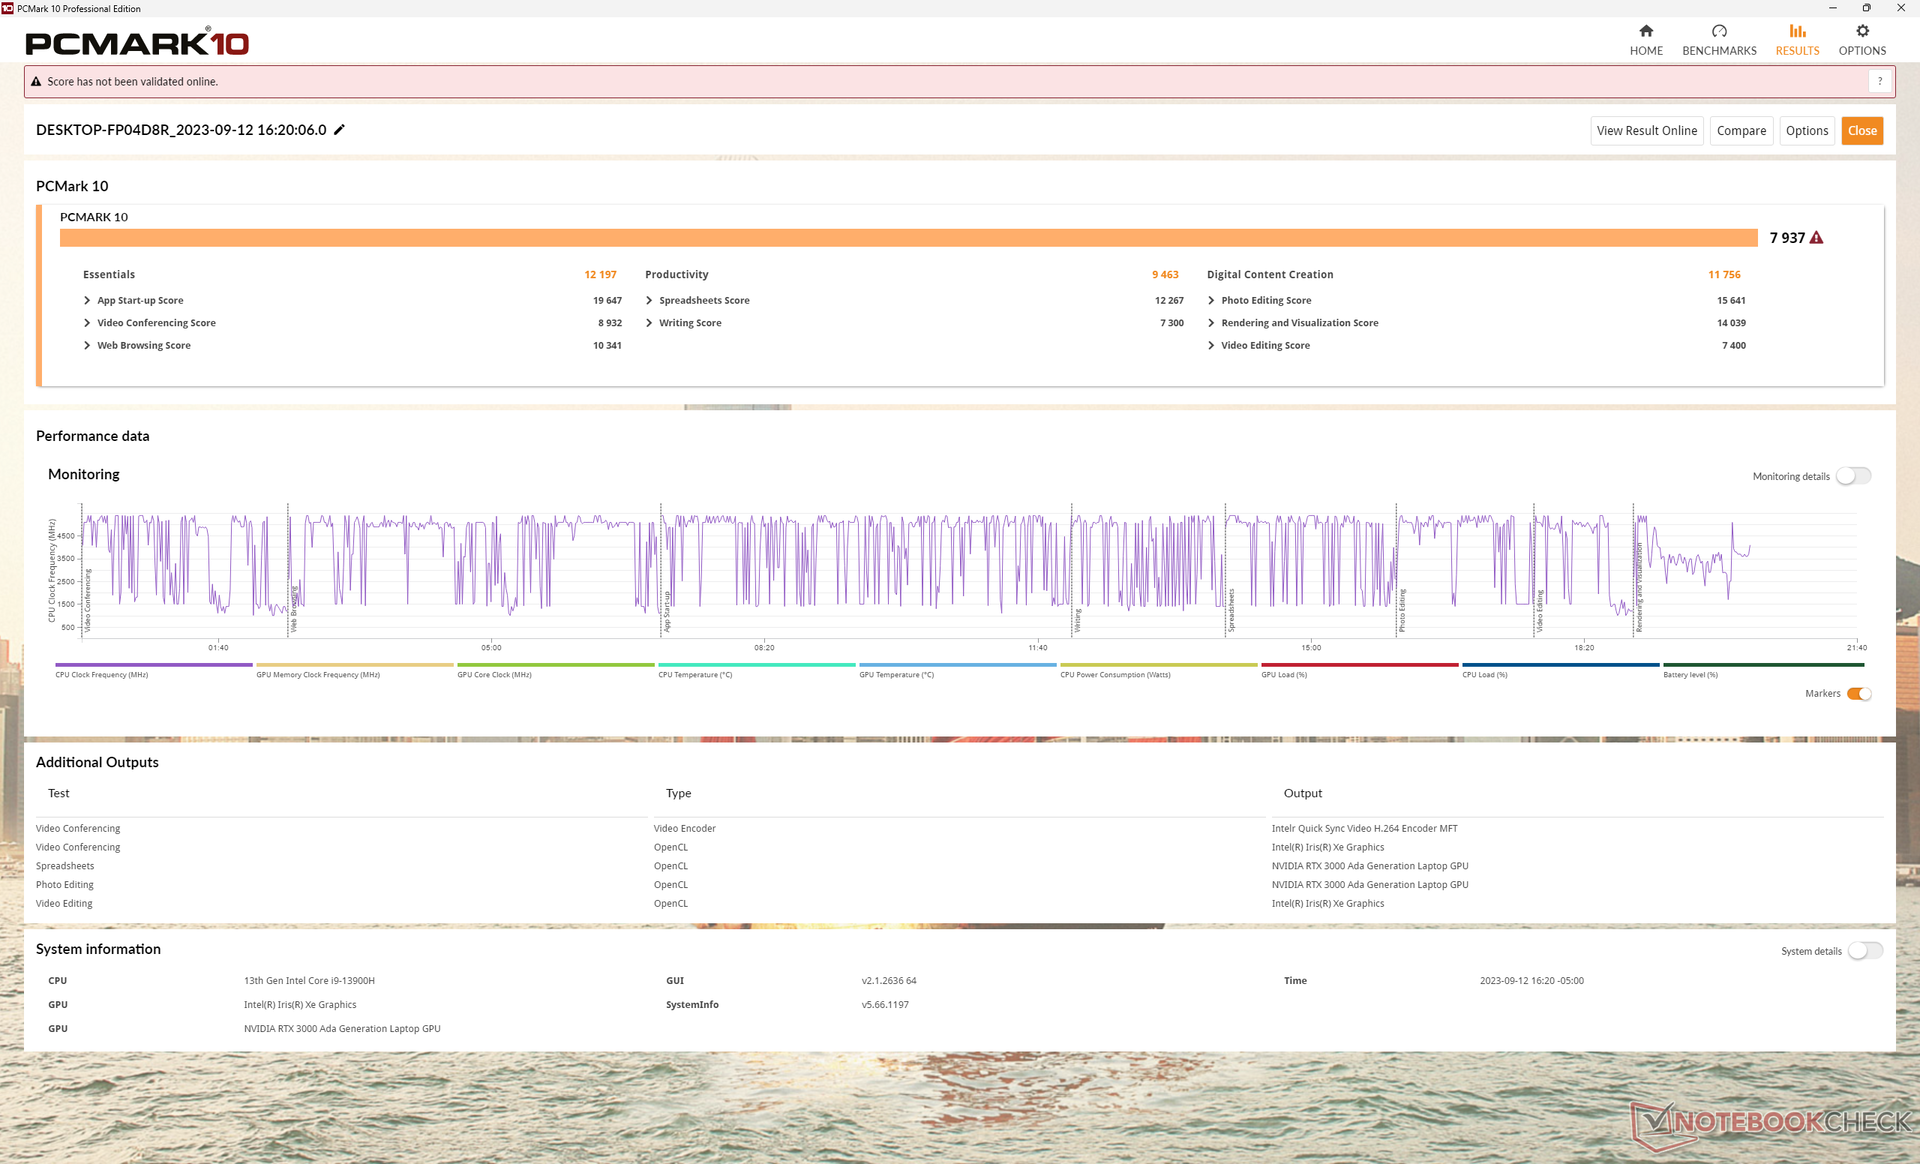
I punteggi di PCMark sono superiori a quelli delle altre workstation da 14 pollici che abbiamo testato finora. Gran parte del guadagno può essere attribuito alla nuova GPU RTX 3000 Ada, che offre vantaggi significativi in termini di prestazioni rispetto alle opzioni Ampere dello scorso anno, come dimostra la nostra sezione sulle prestazioni della GPU.
CrossMark: Overall | Productivity | Creativity | Responsiveness
| PCMark 10 / Score | |
| Dell Precision 5480 | |
| Dell Precision 5000 5470 | |
| Dell Precision 5000 5560 | |
| Lenovo ThinkPad P15 G2-20YQ001JGE | |
| Lenovo ThinkPad P15v G3 21EM001AGE | |
| HP ZBook Firefly 14 G9-6B8A2EA | |
| Lenovo ThinkPad P14s G3 AMD 21J6S05000 | |
| PCMark 10 / Essentials | |
| Dell Precision 5480 | |
| Dell Precision 5000 5470 | |
| Dell Precision 5000 5560 | |
| Lenovo ThinkPad P15 G2-20YQ001JGE | |
| HP ZBook Firefly 14 G9-6B8A2EA | |
| Lenovo ThinkPad P15v G3 21EM001AGE | |
| Lenovo ThinkPad P14s G3 AMD 21J6S05000 | |
| PCMark 10 / Productivity | |
| HP ZBook Firefly 14 G9-6B8A2EA | |
| Dell Precision 5480 | |
| Dell Precision 5000 5560 | |
| Lenovo ThinkPad P15v G3 21EM001AGE | |
| Dell Precision 5000 5470 | |
| Lenovo ThinkPad P14s G3 AMD 21J6S05000 | |
| Lenovo ThinkPad P15 G2-20YQ001JGE | |
| PCMark 10 / Digital Content Creation | |
| Dell Precision 5480 | |
| Dell Precision 5000 5470 | |
| Lenovo ThinkPad P15 G2-20YQ001JGE | |
| Lenovo ThinkPad P15v G3 21EM001AGE | |
| Dell Precision 5000 5560 | |
| Lenovo ThinkPad P14s G3 AMD 21J6S05000 | |
| HP ZBook Firefly 14 G9-6B8A2EA | |
| CrossMark / Overall | |
| Dell Precision 5480 | |
| Dell Precision 5000 5470 | |
| HP ZBook Firefly 14 G9-6B8A2EA | |
| Lenovo ThinkPad P15v G3 21EM001AGE | |
| Lenovo ThinkPad P14s G3 AMD 21J6S05000 | |
| CrossMark / Productivity | |
| Dell Precision 5480 | |
| Dell Precision 5000 5470 | |
| HP ZBook Firefly 14 G9-6B8A2EA | |
| Lenovo ThinkPad P15v G3 21EM001AGE | |
| Lenovo ThinkPad P14s G3 AMD 21J6S05000 | |
| CrossMark / Creativity | |
| Dell Precision 5480 | |
| Dell Precision 5000 5470 | |
| HP ZBook Firefly 14 G9-6B8A2EA | |
| Lenovo ThinkPad P15v G3 21EM001AGE | |
| Lenovo ThinkPad P14s G3 AMD 21J6S05000 | |
| CrossMark / Responsiveness | |
| Dell Precision 5480 | |
| Dell Precision 5000 5470 | |
| HP ZBook Firefly 14 G9-6B8A2EA | |
| Lenovo ThinkPad P15v G3 21EM001AGE | |
| Lenovo ThinkPad P14s G3 AMD 21J6S05000 | |
| PCMark 10 Score | 7937 punti | |
Aiuto | ||
| AIDA64 / Memory Copy | |
| Dell Precision 5480 | |
| Dell Precision 5000 5470 | |
| Media Intel Core i9-13900H (37448 - 74486, n=25) | |
| HP ZBook Firefly 14 G9-6B8A2EA | |
| Lenovo ThinkPad P14s G3 AMD 21J6S05000 | |
| Lenovo ThinkPad P15v G3 21EM001AGE | |
| AIDA64 / Memory Read | |
| Dell Precision 5000 5470 | |
| Dell Precision 5480 | |
| HP ZBook Firefly 14 G9-6B8A2EA | |
| Media Intel Core i9-13900H (41599 - 75433, n=25) | |
| Lenovo ThinkPad P14s G3 AMD 21J6S05000 | |
| Lenovo ThinkPad P15v G3 21EM001AGE | |
| AIDA64 / Memory Write | |
| Dell Precision 5480 | |
| Media Intel Core i9-13900H (36152 - 88505, n=25) | |
| HP ZBook Firefly 14 G9-6B8A2EA | |
| Dell Precision 5000 5470 | |
| Lenovo ThinkPad P14s G3 AMD 21J6S05000 | |
| Lenovo ThinkPad P15v G3 21EM001AGE | |
| AIDA64 / Memory Latency | |
| Lenovo ThinkPad P14s G3 AMD 21J6S05000 | |
| Dell Precision 5000 5470 | |
| Lenovo ThinkPad P15v G3 21EM001AGE | |
| Dell Precision 5480 | |
| Media Intel Core i9-13900H (75.8 - 102.3, n=25) | |
| HP ZBook Firefly 14 G9-6B8A2EA | |
* ... Meglio usare valori piccoli
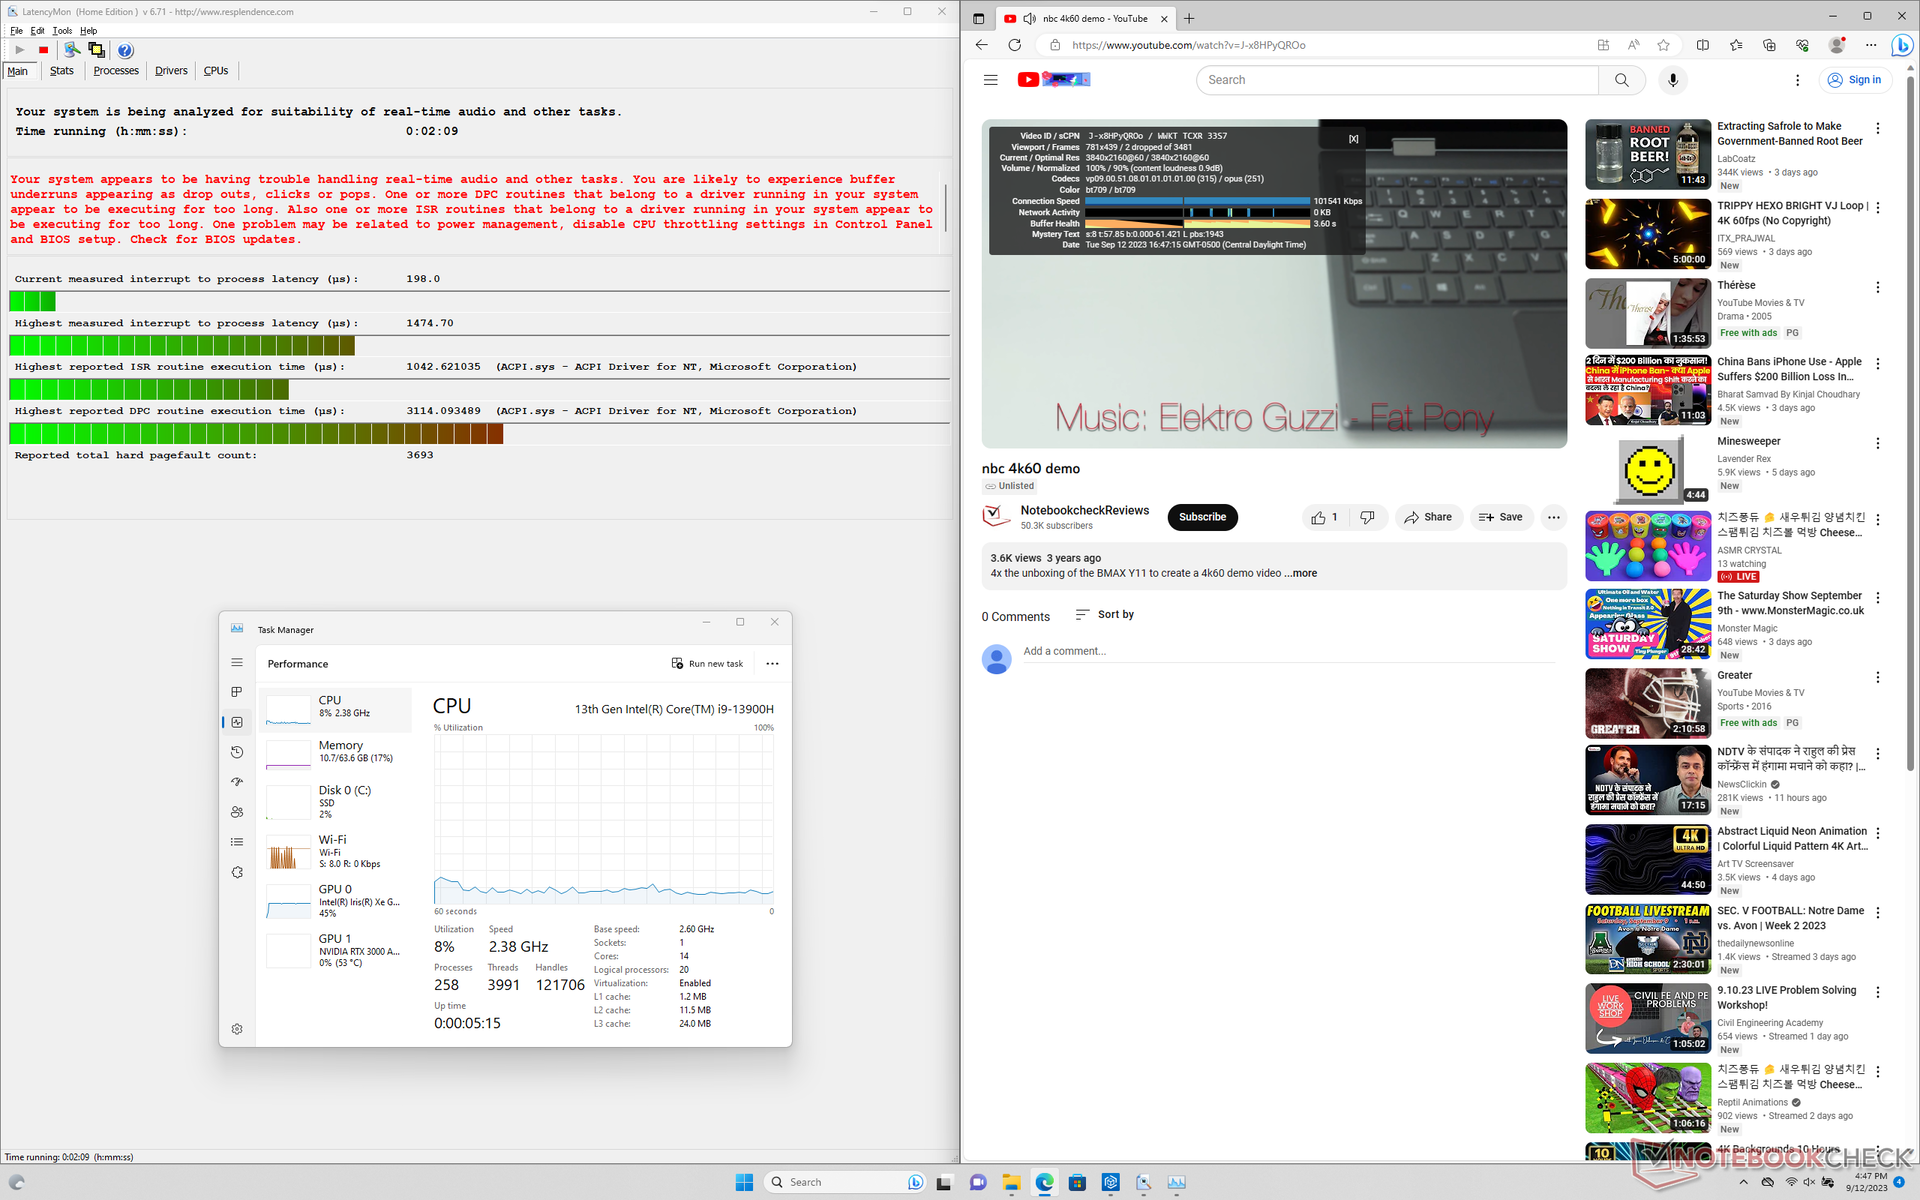
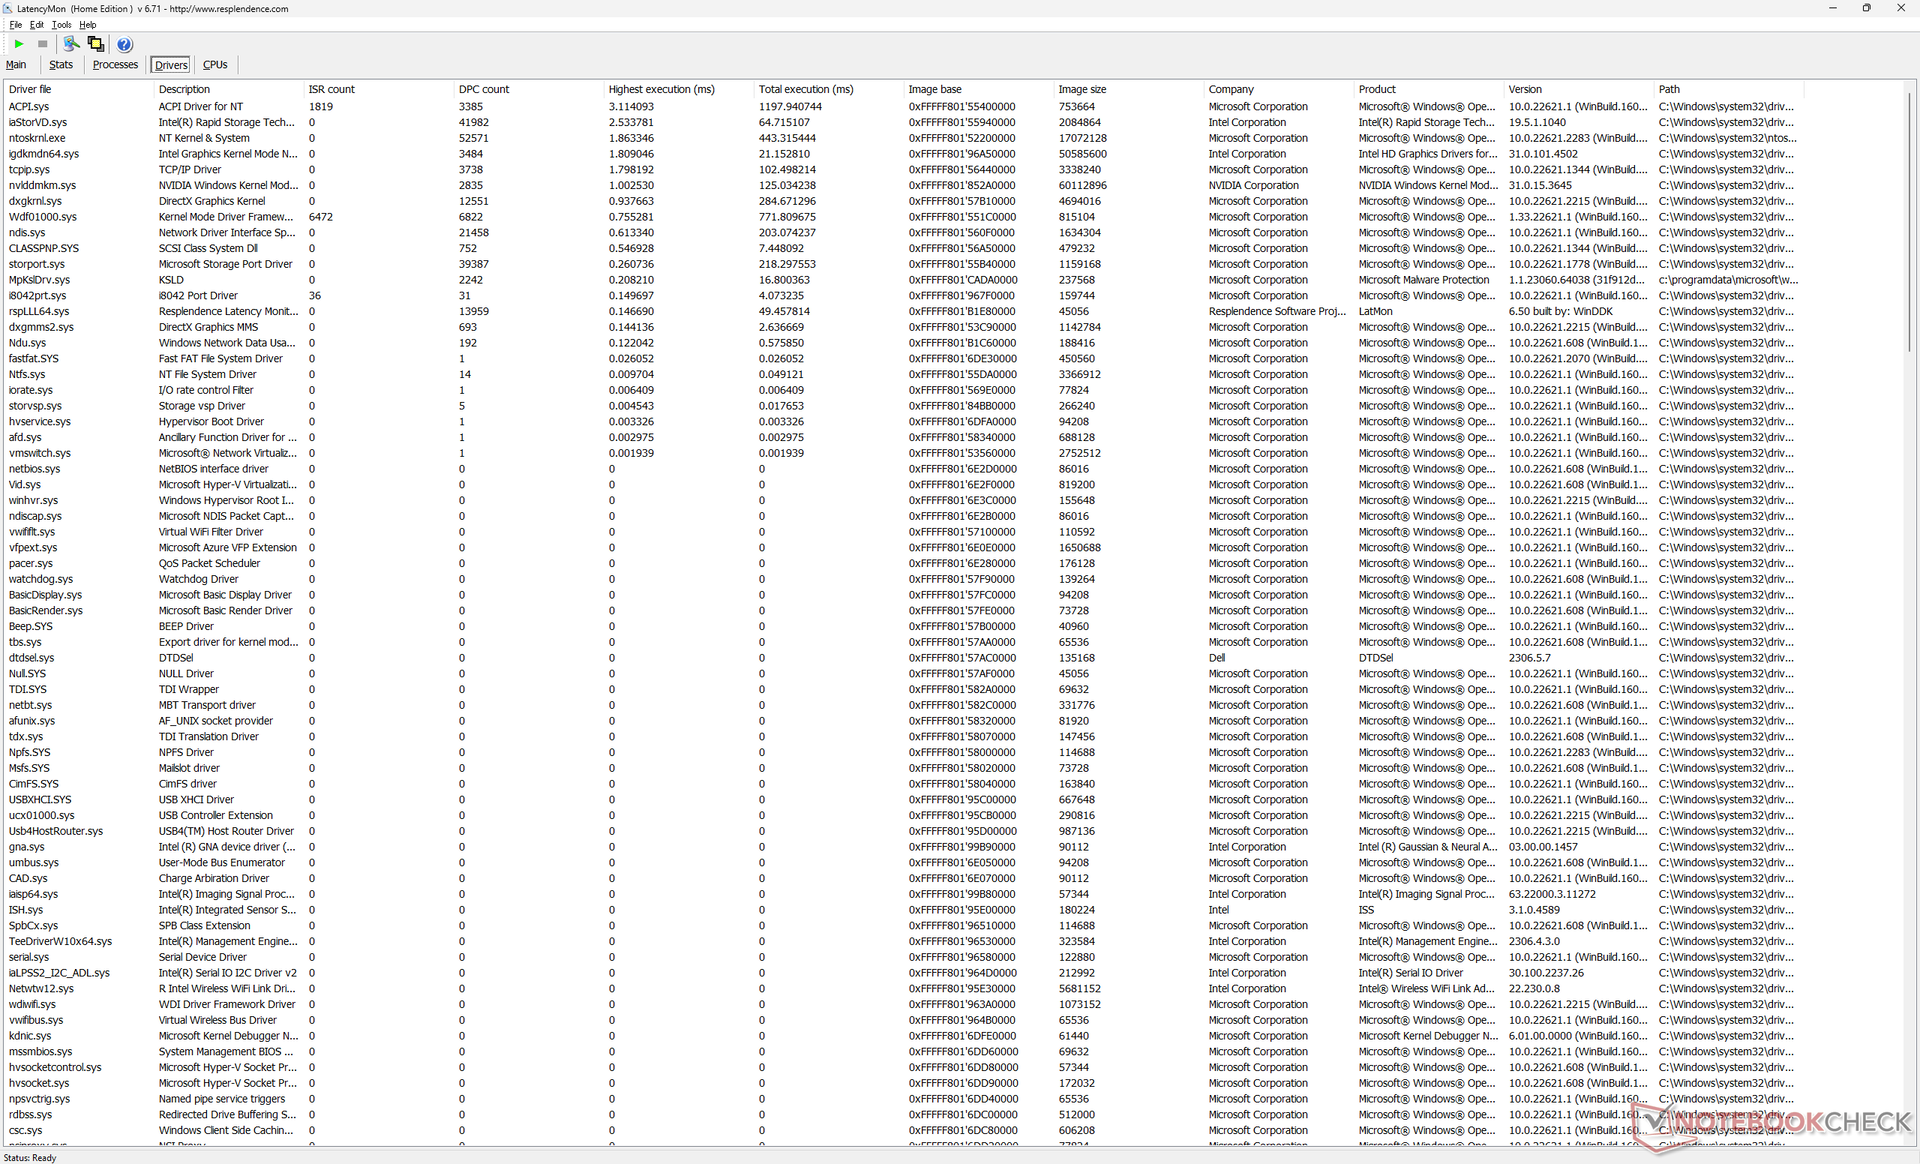
Latenza DPC
LatencyMon rivela problemi di DPC quando si aprono più schede del browser della nostra homepage. Abbiamo anche registrato 2 fotogrammi caduti durante un video 4K60 della durata di un minuto, il che è spiacevole da vedere su una workstation mobile.
| DPC Latencies / LatencyMon - interrupt to process latency (max), Web, Youtube, Prime95 | |
| Dell Precision 5480 | |
| Dell Precision 5000 5470 | |
| Lenovo ThinkPad P14s G3 AMD 21J6S05000 | |
| Dell Precision 5000 5560 | |
| Lenovo ThinkPad P15v G3 21EM001AGE | |
* ... Meglio usare valori piccoli
Dispositivi di archiviazione
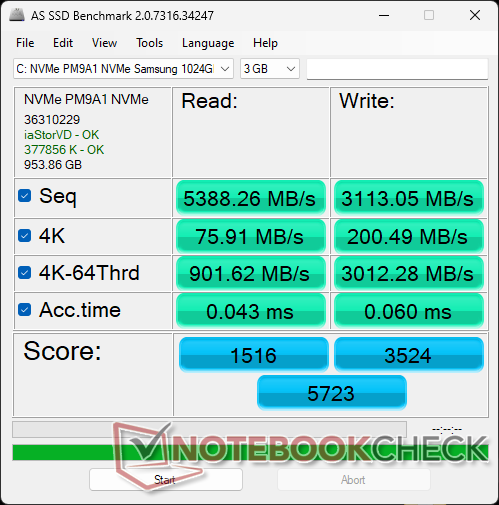
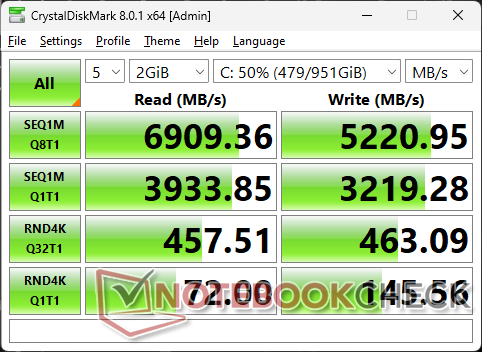
Dell sembra utilizzare Samsung PM9A1 Per la maggior parte dei suoi modelli Precision, compresi i modelli Precision 5470 e 5560 5560. Le velocità di trasferimento massime sono stabili a circa 6900 MB/s senza problemi di throttling.
Le unità con crittografia automatica sono opzionali per Dell, ma il modello può supportare solo un'unità SSD interna.

| Drive Performance rating - Percent | |
| Lenovo ThinkPad P14s G3 AMD 21J6S05000 | |
| Media Samsung PM9A1 MZVL21T0HCLR | |
| Dell Precision 5000 5560 | |
| Dell Precision 5480 | |
| Lenovo ThinkPad P15v G3 21EM001AGE | |
| Dell Precision 5000 5470 | |
| HP ZBook Firefly 14 G9-6B8A2EA -11! | |
* ... Meglio usare valori piccoli
Disk Throttling: DiskSpd Read Loop, Queue Depth 8
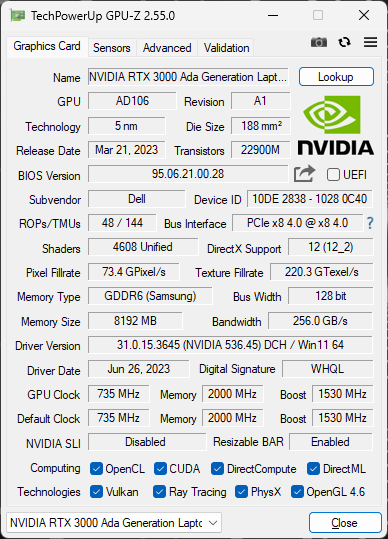
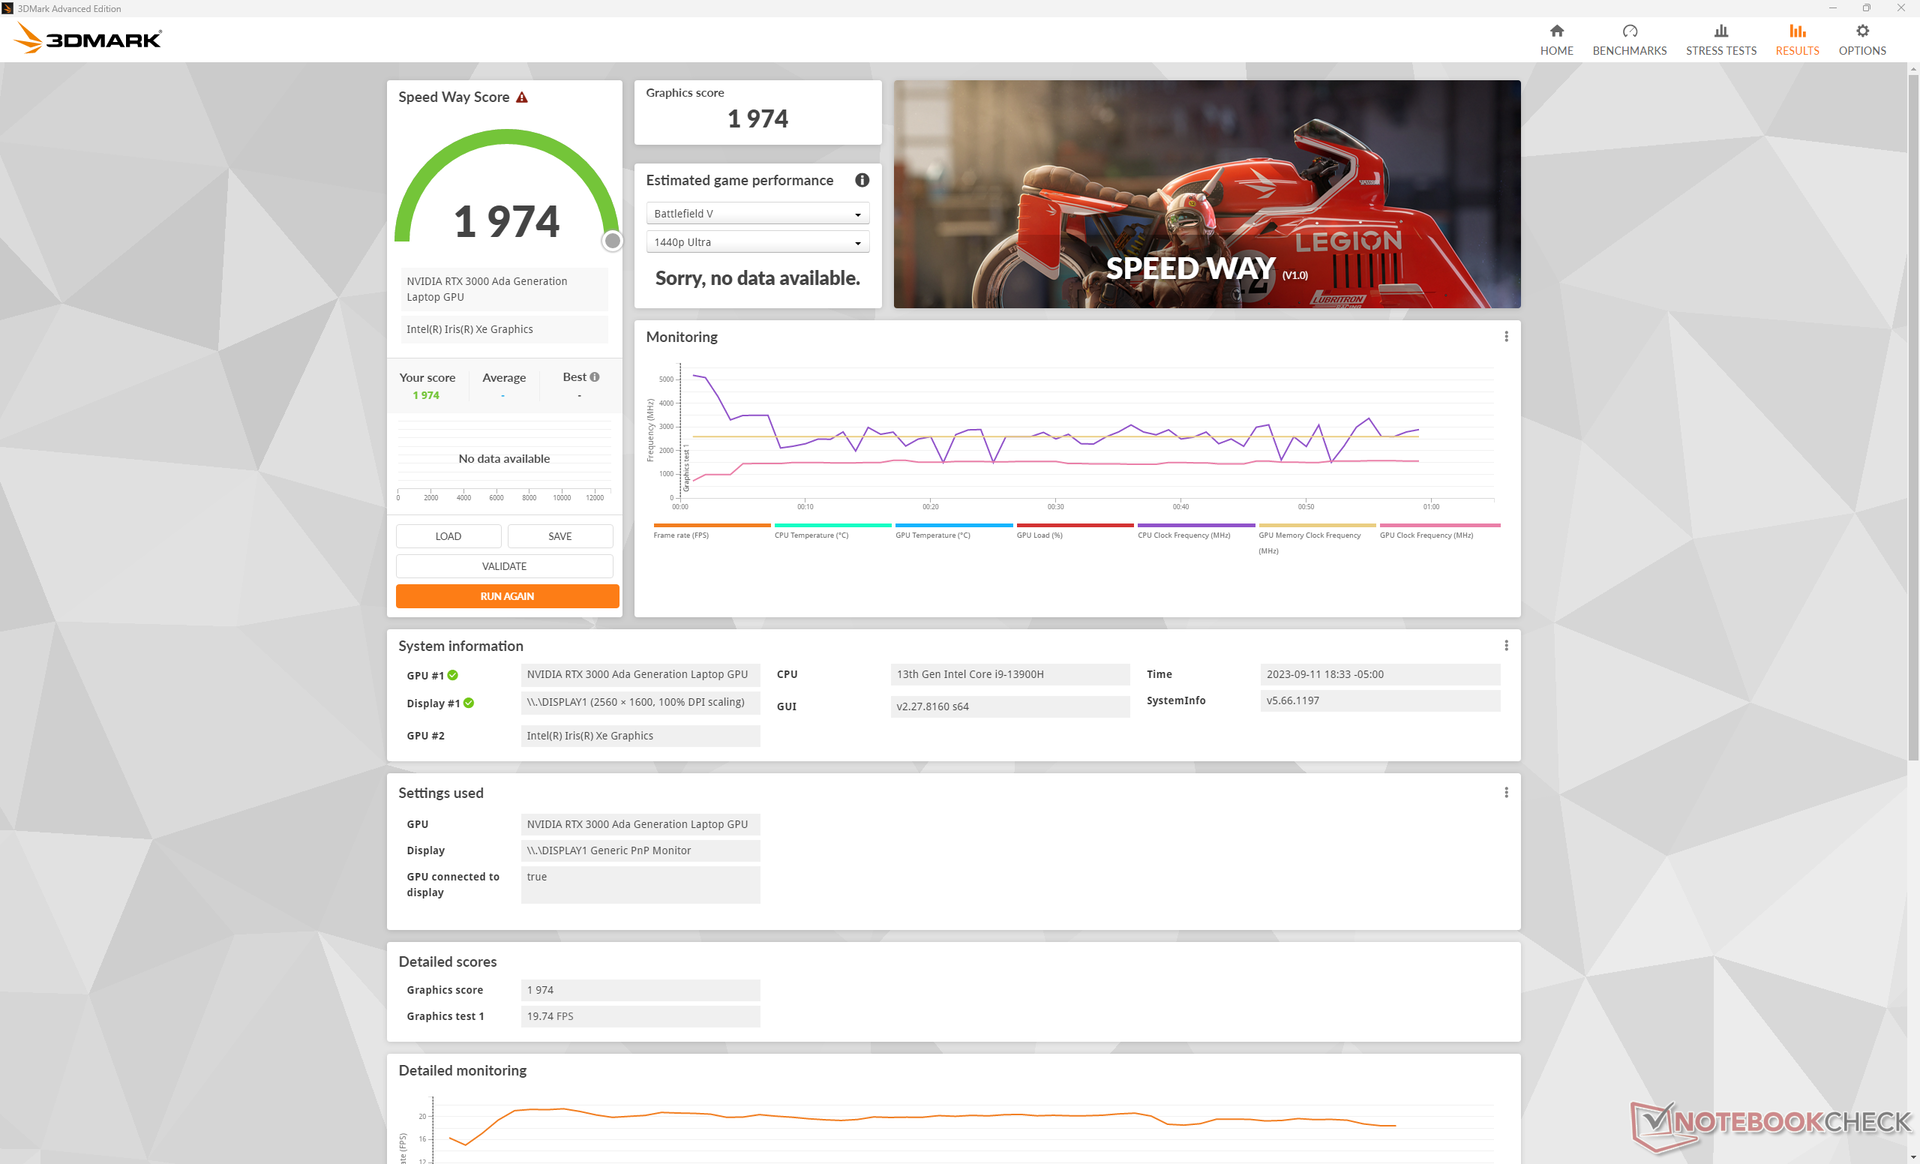
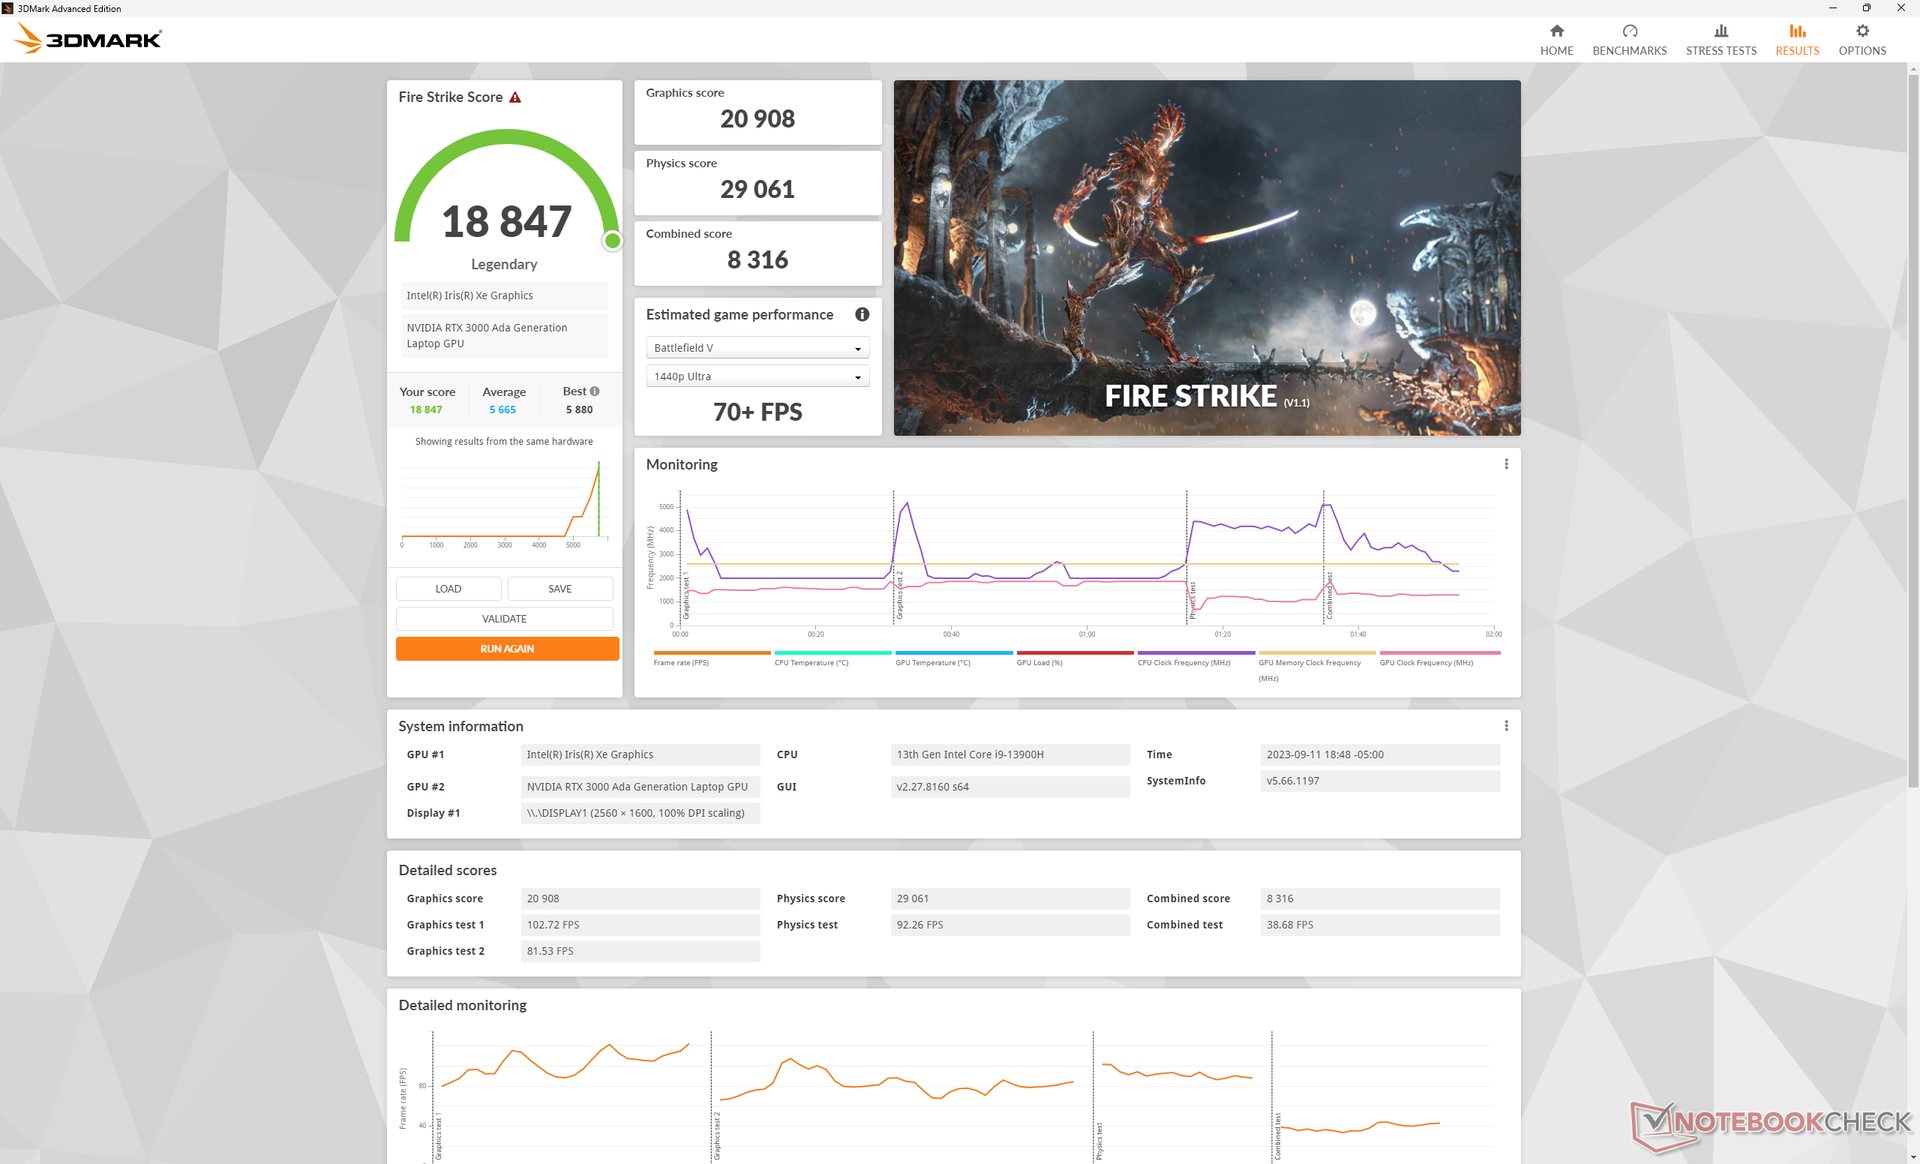
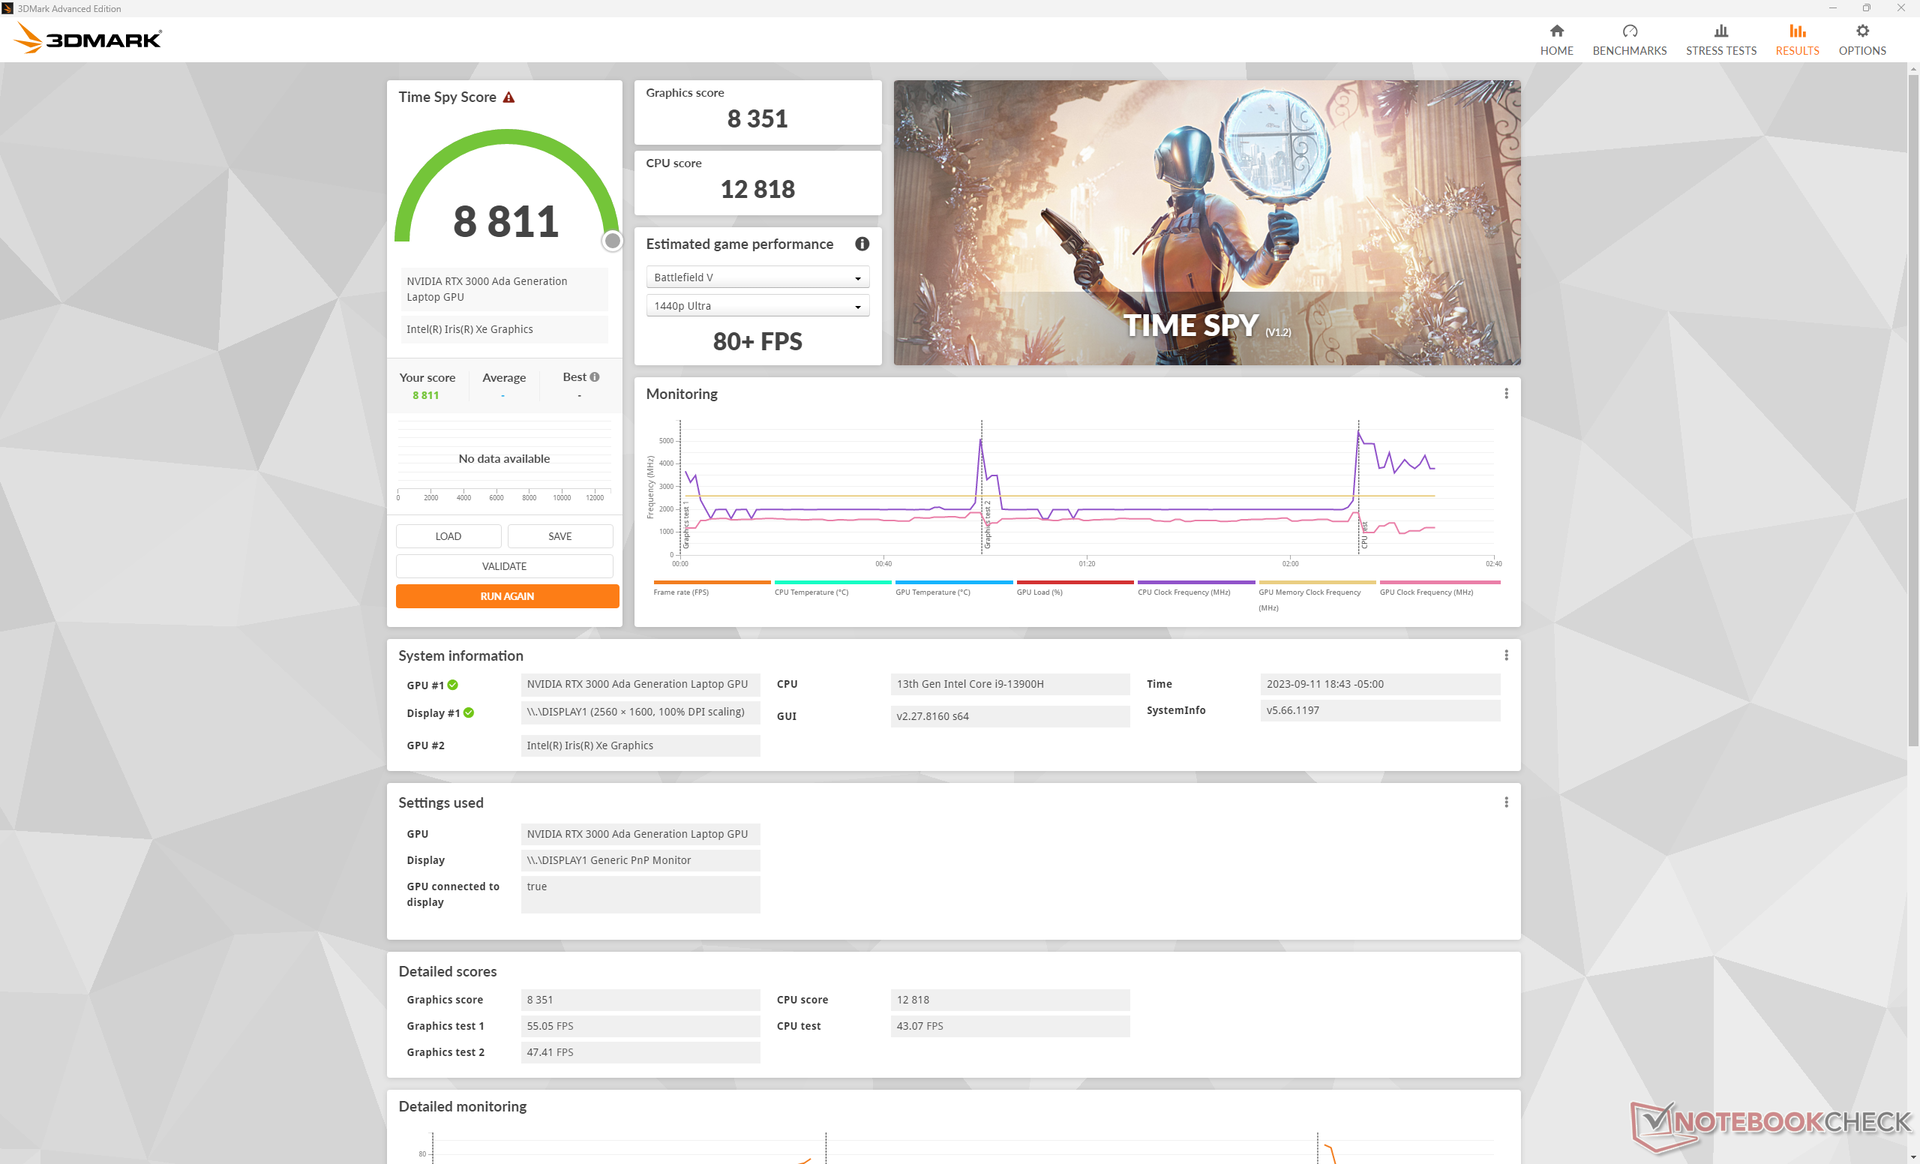
Prestazioni della GPU
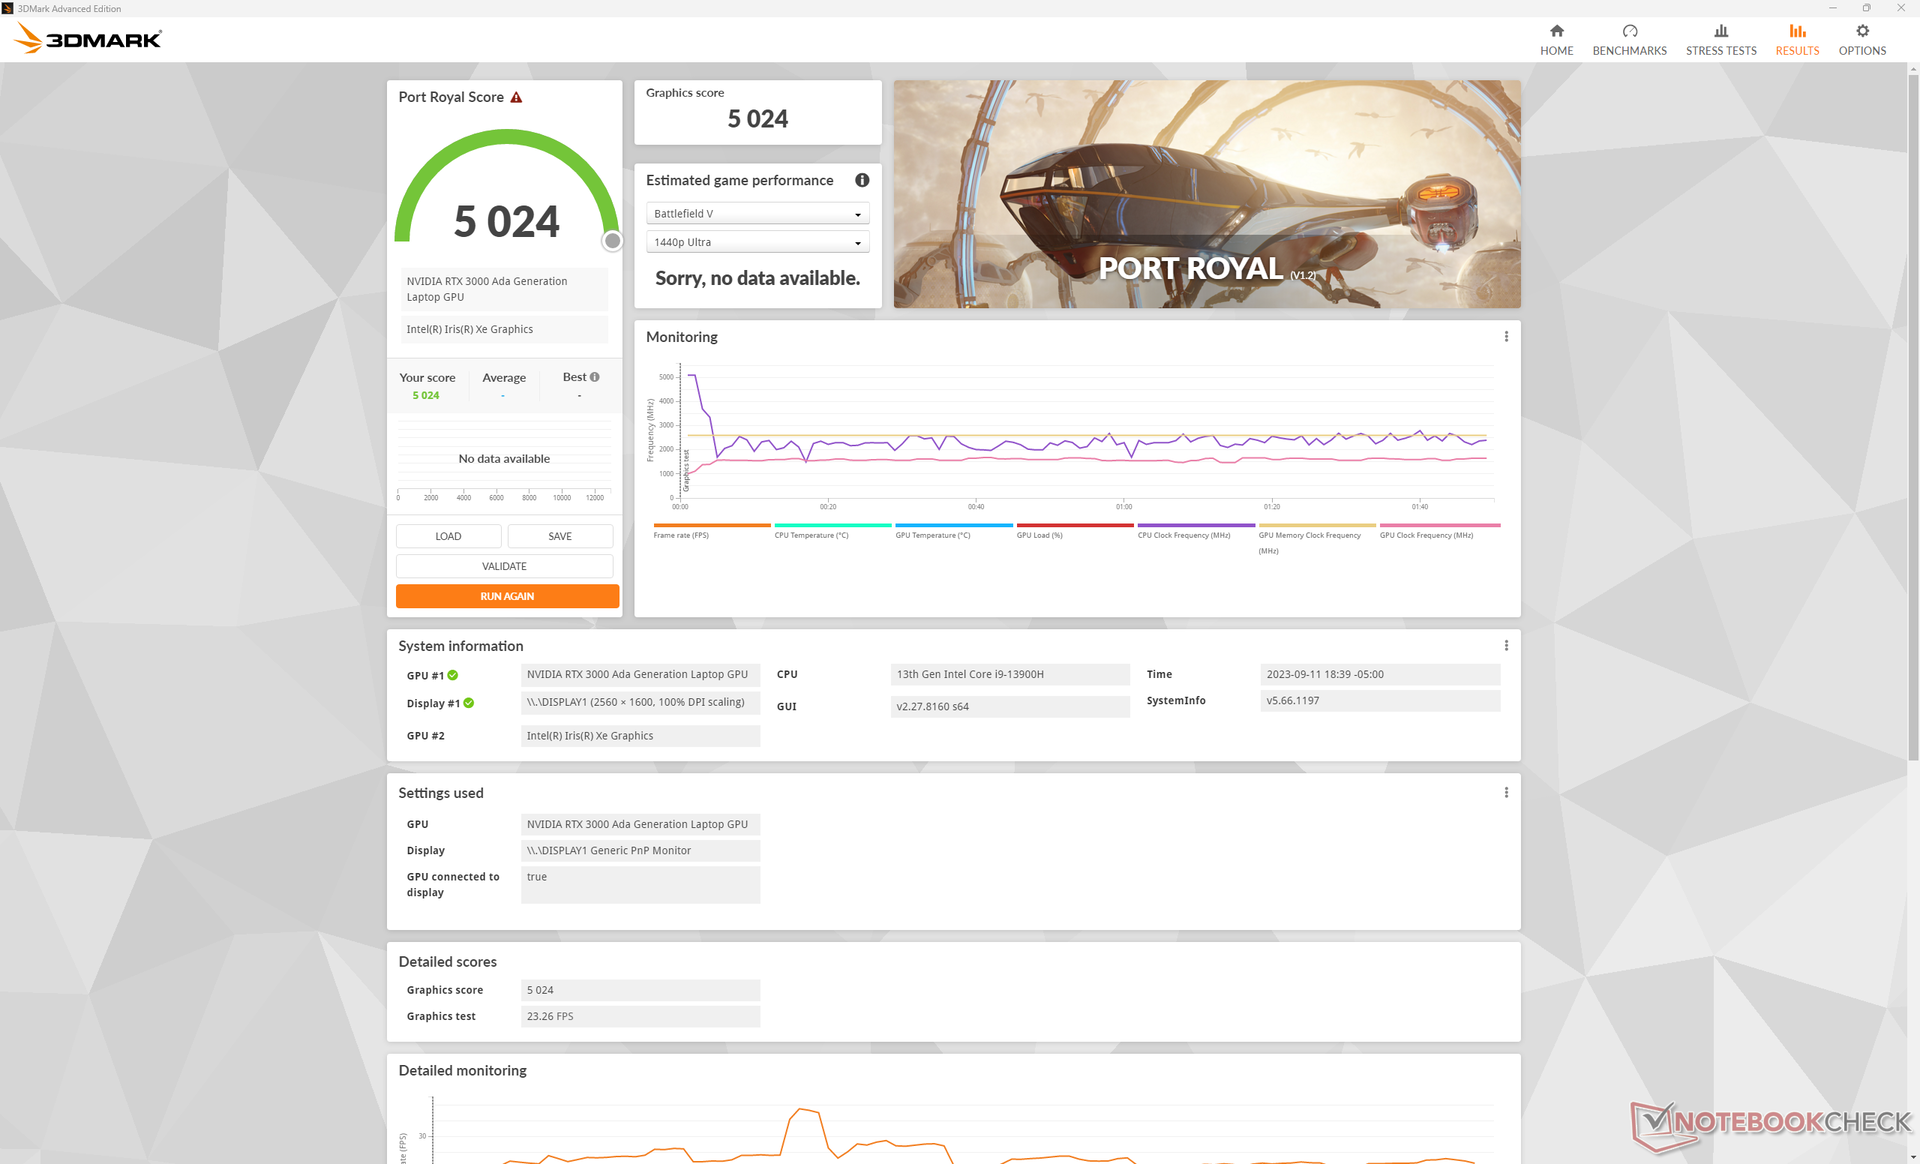
Il RTX 3000 Ada è circa il 60-80% più veloce della RTX A1000 su Precision 5470 dello scorso anno o circa il 10-15% più veloce della RTX A3000 che sostituisce direttamente. La nuova GPU punta a un TGP leggermente più alto, pari a 50 W, mentre la GPU di Precision 5470 era limitata a 40 W.
La RTX A1000 di ultima generazione è ancora configurabile su Precision 5480, ma la RTX 3000 Ada è altamente raccomandata per i suoi significativi incrementi di prestazioni. La più recente GPU Ada è solo un po' indietro rispetto alla più vecchia ampere RTX A5500 che si trova su workstation molto più grandi come l'HP ZBook Fury 16 G9.
L'esecuzione in modalità Balanced ha un impatto maggiore sulle prestazioni della CPU rispetto a quelle della GPU, come dimostrano i risultati di Fire Strike nella tabella seguente. I deficit sono relativamente minori e si attestano su una sola cifra percentuale anche se si utilizza la modalità a batteria.
È interessante notare che due sottotest di SpecViewPerf 12 (energia e medicina) si bloccavano sempre sulla nostra unità e quindi questi punteggi sono stati omessi dai grafici qui sotto.
| Profilo energetico | Punteggio di fisica | Punteggio grafico | Punteggio combinato |
| Modalità prestazioni | 29061 | 20908 | 8316 |
| Modalità equilibrata | 26880 (-8%) | 20411 (-2%) | 7633 (-8%) |
| Modalità batteria | 27852 (-4%) | 19755 (-6%) | 7569 (-9%) |
| 3DMark 11 - 1280x720 Performance GPU | |
| Dell Precision 5000 5680 | |
| HP ZBook Fury 16 G9 | |
| Media NVIDIA RTX 3000 Ada Generation Laptop (28283 - 33802, n=3) | |
| Dell Precision 5480 | |
| Lenovo ThinkPad P15 G2-20YQ001JGE | |
| Asus ExpertBook B6 Flip B6602FC2 | |
| Dell Precision 5000 5560 | |
| Lenovo ThinkPad P15v G3 21EM001AGE | |
| Dell Precision 5000 5470 | |
| Lenovo ThinkPad P1 G4-20Y4Z9DVUS | |
| Lenovo ThinkPad P15v G2 21A9000XGE | |
| Lenovo ThinkPad P14s G3 AMD 21J6S05000 | |
| HP ZBook Firefly 14 G9-6B8A2EA | |
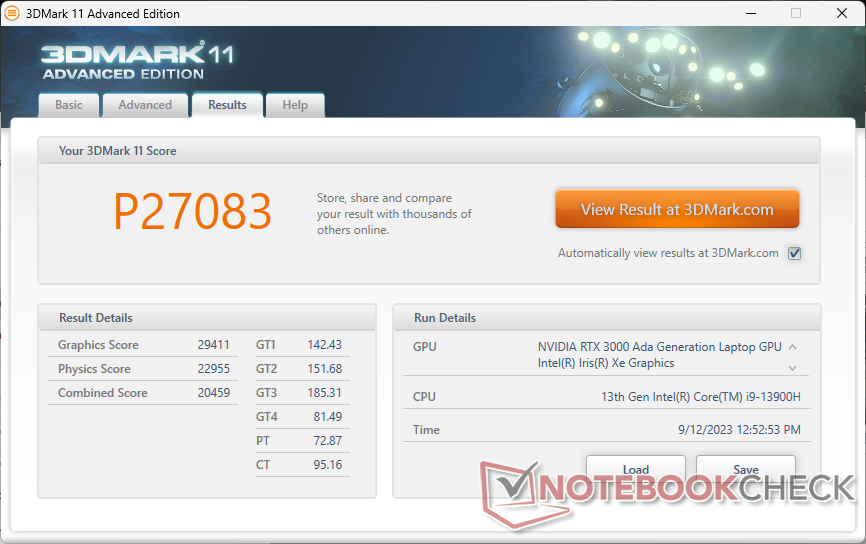
| 3DMark 11 Performance | 27083 punti | |
| 3DMark Fire Strike Score | 18847 punti | |
| 3DMark Time Spy Score | 8811 punti | |
Aiuto | ||
| Blender | |
| v3.3 Classroom HIP/AMD | |
| Lenovo ThinkPad P15v G3 21EM001AGE | |
| Lenovo ThinkPad P14s G3 AMD 21J6S05000 | |
| Lenovo ThinkPad P14s G3 AMD 21J6S05000 | |
| v3.3 Classroom OPTIX/RTX | |
| HP ZBook Firefly 14 G9-6B8A2EA | |
| Dell Precision 5000 5470 | |
| Lenovo ThinkPad P15v G3 21EM001AGE | |
| Asus ExpertBook B6 Flip B6602FC2 | |
| Dell Precision 5480 | |
| Media NVIDIA RTX 3000 Ada Generation Laptop (23 - 28, n=3) | |
| HP ZBook Fury 16 G9 | |
| Dell Precision 5000 5680 | |
| v3.3 Classroom CUDA | |
| HP ZBook Firefly 14 G9-6B8A2EA | |
| Dell Precision 5000 5470 | |
| Lenovo ThinkPad P15v G3 21EM001AGE | |
| Asus ExpertBook B6 Flip B6602FC2 | |
| Dell Precision 5480 | |
| Media NVIDIA RTX 3000 Ada Generation Laptop (40 - 48, n=3) | |
| HP ZBook Fury 16 G9 | |
| Dell Precision 5000 5680 | |
| v3.3 Classroom CPU | |
| HP ZBook Firefly 14 G9-6B8A2EA | |
| Lenovo ThinkPad P14s G3 AMD 21J6S05000 | |
| Dell Precision 5000 5470 | |
| Lenovo ThinkPad P15v G3 21EM001AGE | |
| Dell Precision 5480 | |
| Dell Precision 5000 5680 | |
| Media NVIDIA RTX 3000 Ada Generation Laptop (312 - 363, n=3) | |
| Asus ExpertBook B6 Flip B6602FC2 | |
| HP ZBook Fury 16 G9 | |
* ... Meglio usare valori piccoli
Prestazioni di gioco
Le prestazioni di gioco sono più simili a quelle dei laptop che utilizzano la RTX 4060 di GeForce, come il recente Inspiron 16 Plus 7630. La nostra workstation è in grado di far girare molto bene titoli impegnativi come Cyberpunk 2077 a 1080p, mentre il QHD+ nativo richiederà impostazioni più basse o il DLSS per mantenere i frame rate a galla.
Witcher 3 FPS Chart
| basso | medio | alto | ultra | |
|---|---|---|---|---|
| GTA V (2015) | 183.2 | 177 | 164.1 | 88.2 |
| The Witcher 3 (2015) | 364.1 | 242.5 | 150.1 | 78.7 |
| Dota 2 Reborn (2015) | 175.7 | 160.8 | 151.5 | 142.9 |
| Final Fantasy XV Benchmark (2018) | 155.1 | 108 | 78.9 | |
| X-Plane 11.11 (2018) | 152 | 126.8 | 102 | |
| Far Cry 5 (2018) | 155 | 116 | 106 | 101 |
| Strange Brigade (2018) | 400 | 191.3 | 160.1 | 140.7 |
| Cyberpunk 2077 1.6 (2022) | 92.3 | 72.4 | 61.2 | 56.2 |
| Tiny Tina's Wonderlands (2022) | 156 | 131.4 | 88 | 69 |
| F1 22 (2022) | 162.7 | 159.6 | 133.4 | 51.1 |
Emissioni
Rumore del sistema
Il rumore e il comportamento della ventola non sono cambiati rispetto al modello dell'anno scorso. Carichi più elevati, equivalenti a quelli dei giochi, inducono una rumorosità della ventola di poco superiore a 50 dB(A), risultando una delle workstation da 14 pollici più rumorose del mercato. È interessante notare che questo valore massimo rimane invariato tra le modalità Bilanciata e Prestazioni, per cui il funzionamento in modalità Bilanciata non comporta alcun vantaggio in termini di rumore.
Rumorosità
| Idle |
| 23.5 / 23.5 / 23.5 dB(A) |
| Sotto carico |
| 39.9 / 51 dB(A) |
 | ||
30 dB silenzioso 40 dB(A) udibile 50 dB(A) rumoroso |
||
min: | ||
| Dell Precision 5480 RTX 3000 Ada Generation Laptop, i9-13900H, Samsung PM9A1 MZVL21T0HCLR | Dell Precision 5000 5470 RTX A1000 Laptop GPU, i9-12900H, Samsung PM9A1 MZVL21T0HCLR | Dell Precision 5000 5560 RTX A2000 Laptop GPU, i7-11850H, Samsung PM9A1 MZVL22T0HBLB | Lenovo ThinkPad P14s G3 AMD 21J6S05000 Radeon 680M, R7 PRO 6850U, Samsung PM9A1 MZVL21T0HCLR | HP ZBook Firefly 14 G9-6B8A2EA T550 Laptop GPU, i7-1265U, Micron 3400 1TB MTFDKBA1T0TFH | Lenovo ThinkPad P15v G3 21EM001AGE RTX A2000 Laptop GPU, R7 PRO 6850H, SK Hynix PC711 1TB HFS001TDE9X081N | |
|---|---|---|---|---|---|---|
| Noise | -2% | 11% | 11% | 4% | 9% | |
| off /ambiente * (dB) | 23.5 | 23 2% | 23.4 -0% | 22.9 3% | 23.6 -0% | 23.2 1% |
| Idle Minimum * (dB) | 23.5 | 23.3 1% | 23.6 -0% | 22.9 3% | 23.6 -0% | 23.2 1% |
| Idle Average * (dB) | 23.5 | 23.3 1% | 23.6 -0% | 22.9 3% | 23.6 -0% | 23.2 1% |
| Idle Maximum * (dB) | 23.5 | 23.3 1% | 23.6 -0% | 22.9 3% | 23.6 -0% | 23.2 1% |
| Load Average * (dB) | 39.9 | 48.5 -22% | 25.8 35% | 30.8 23% | 42.5 -7% | 35 12% |
| Witcher 3 ultra * (dB) | 50.1 | 48.6 3% | 40.1 20% | 39.4 21% | 42.5 15% | 37.9 24% |
| Load Maximum * (dB) | 51 | 50.4 1% | 41.4 19% | 39.5 23% | 42.5 17% | 37.5 26% |
* ... Meglio usare valori piccoli
Temperatura
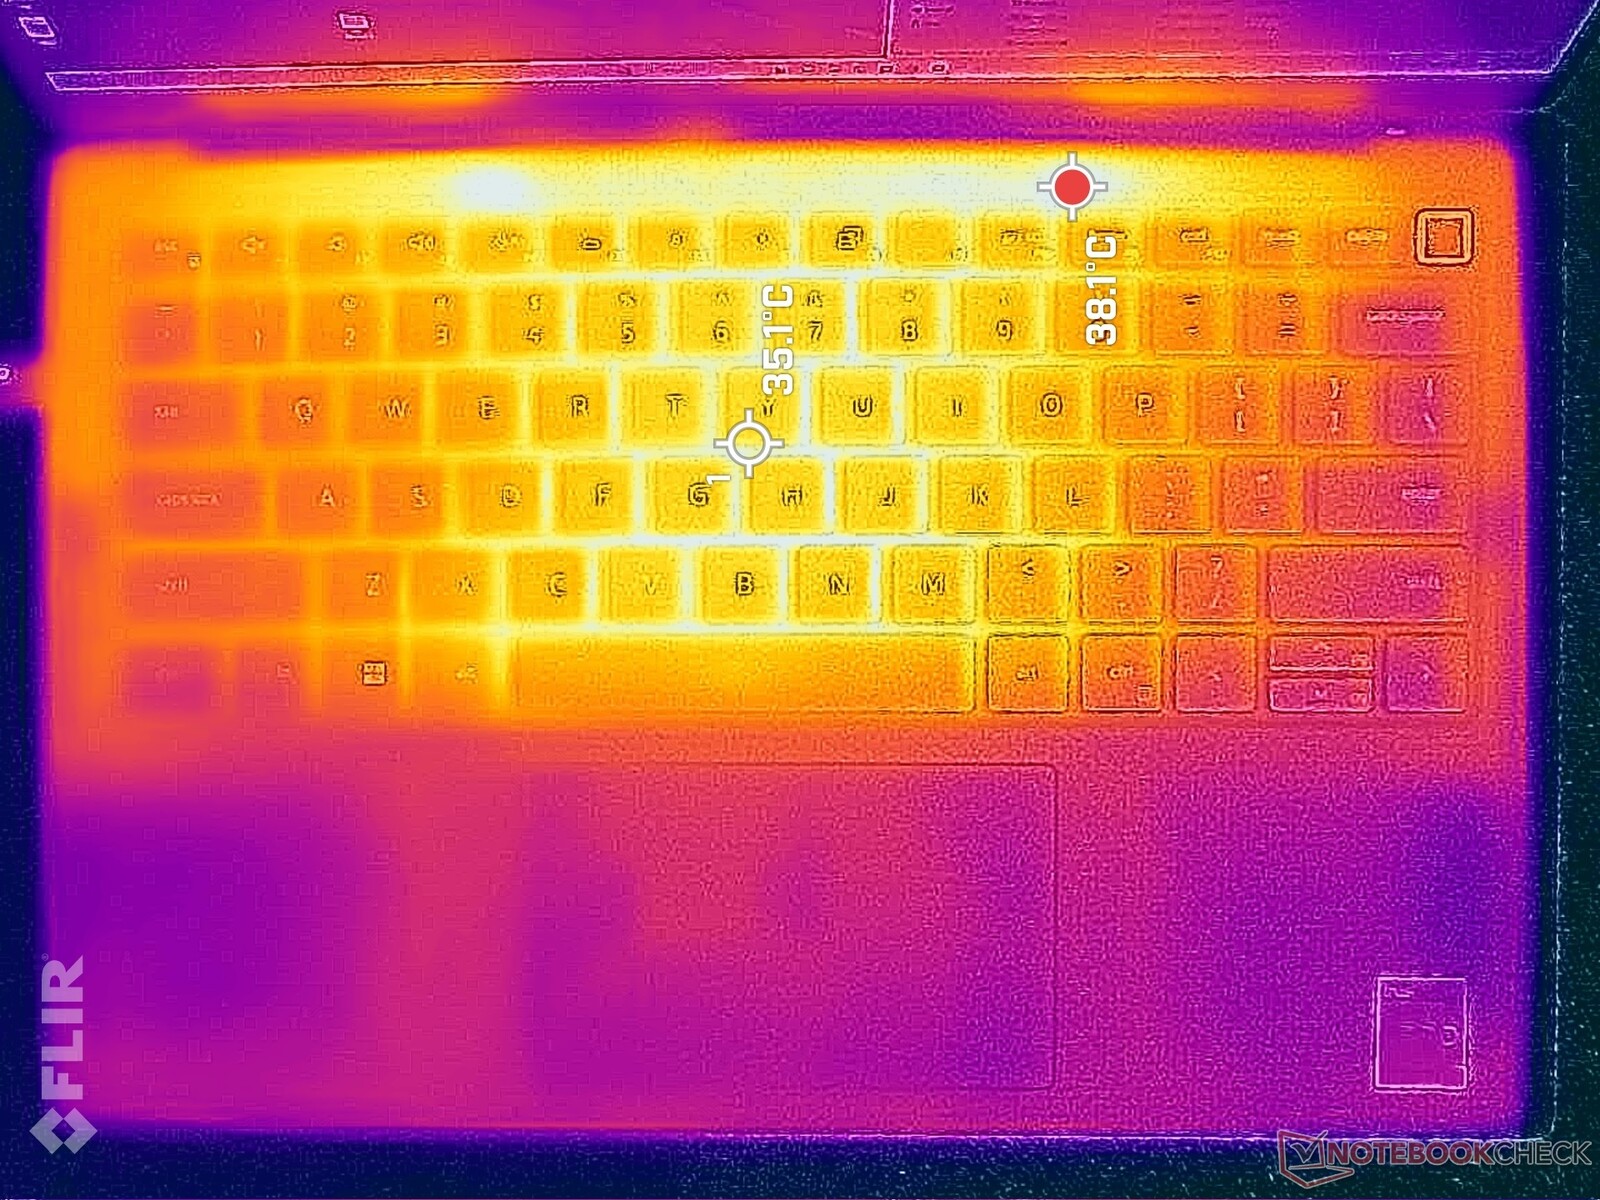
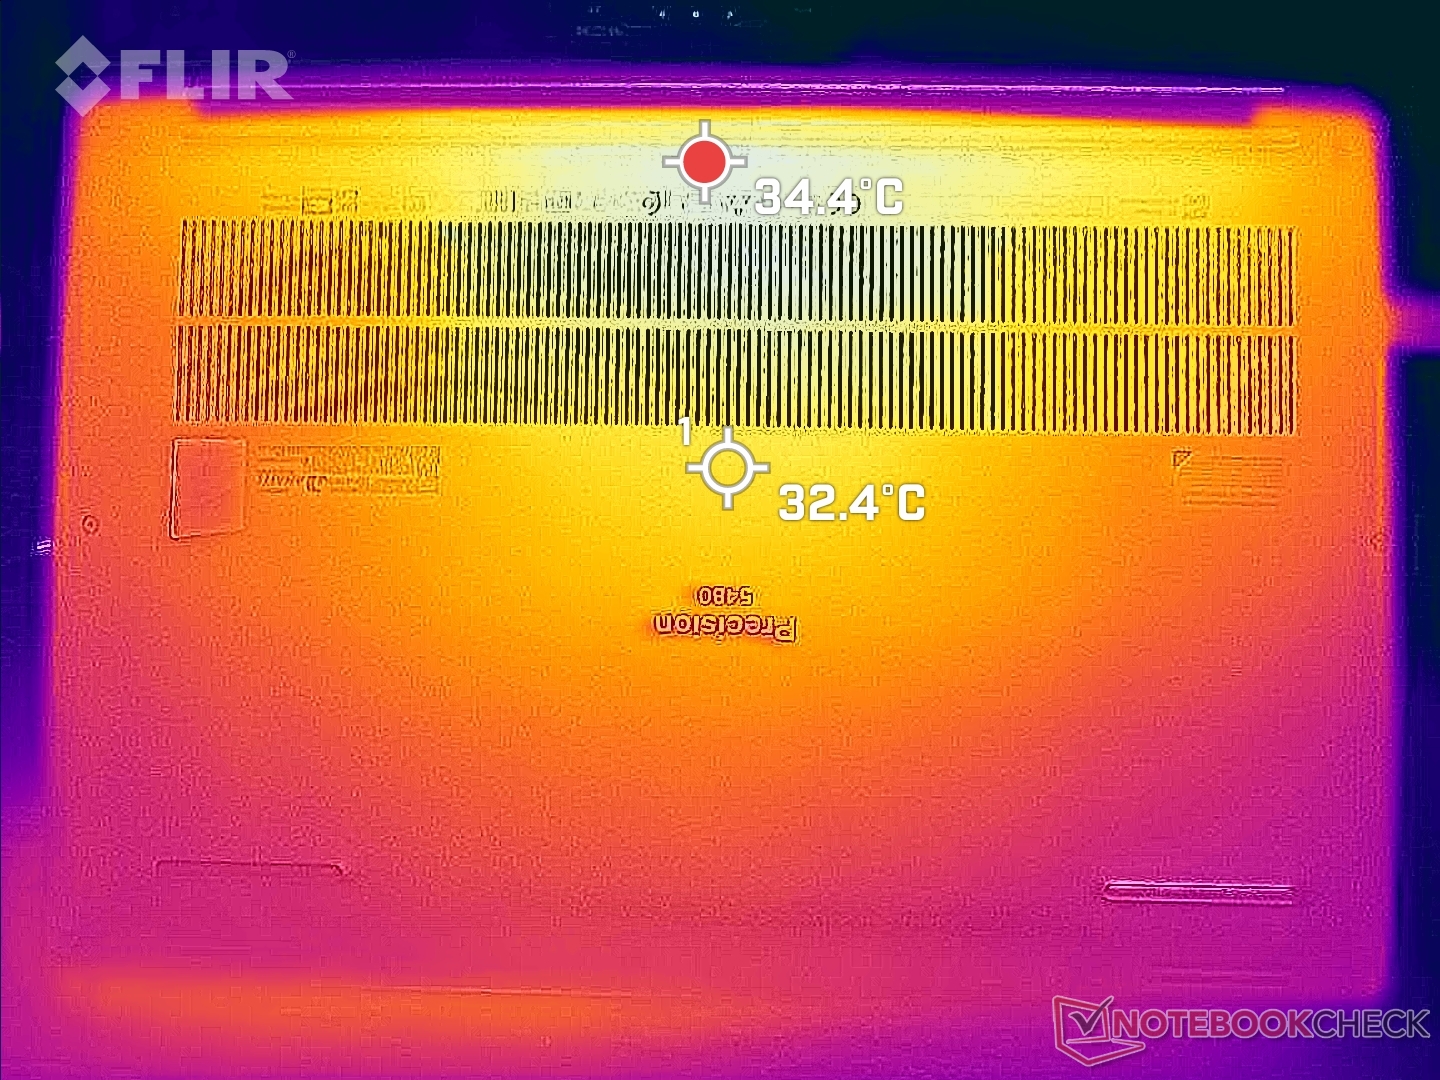
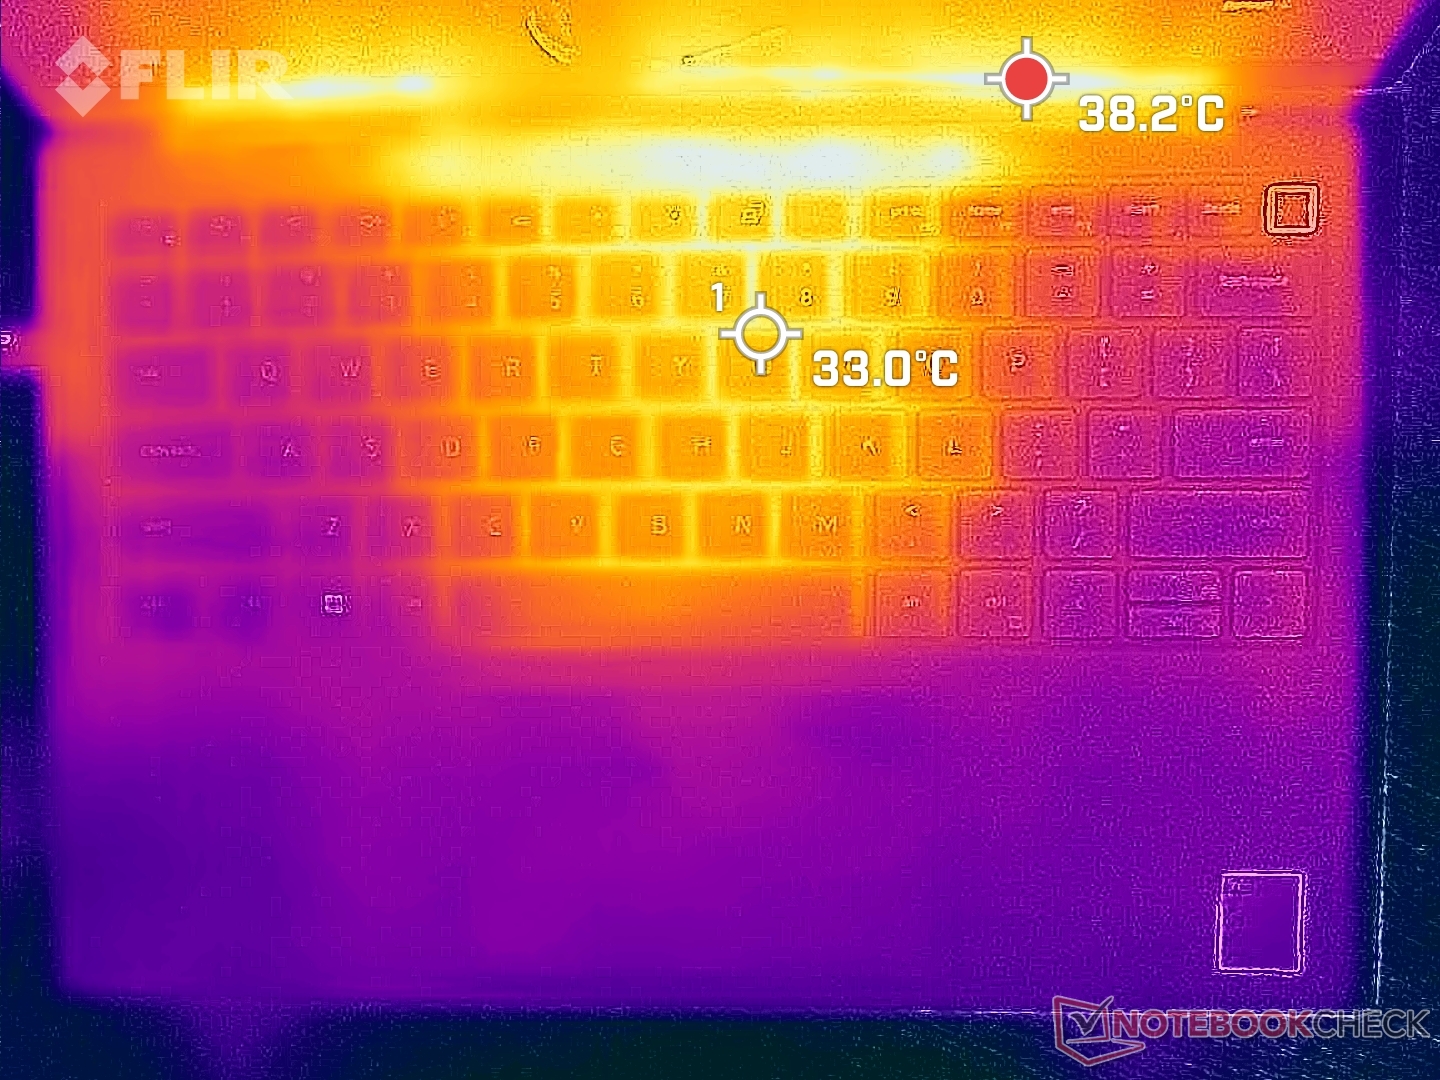
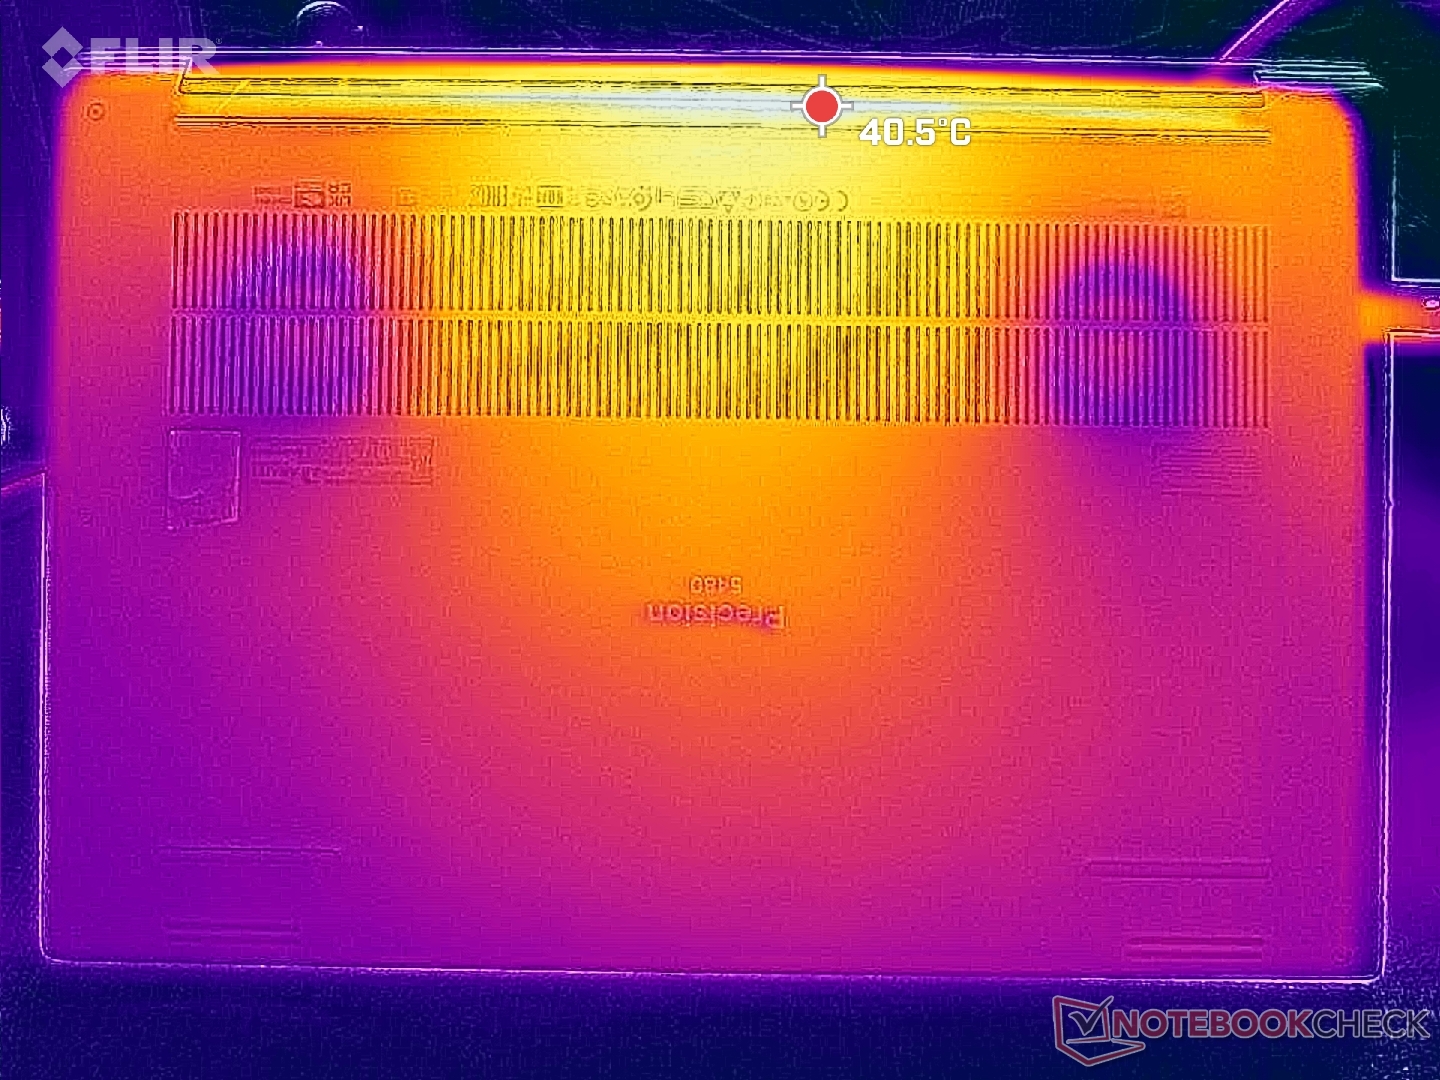
Le temperature superficiali sono più calde del solito vicino al centro dell'unità quando è al minimo sulla scrivania, a causa delle ventole inerti. Pertanto, il costo del silenzio quando si eseguono carichi non impegnativi è rappresentato da temperature superficiali calde che possono o meno infastidire alcuni utenti.
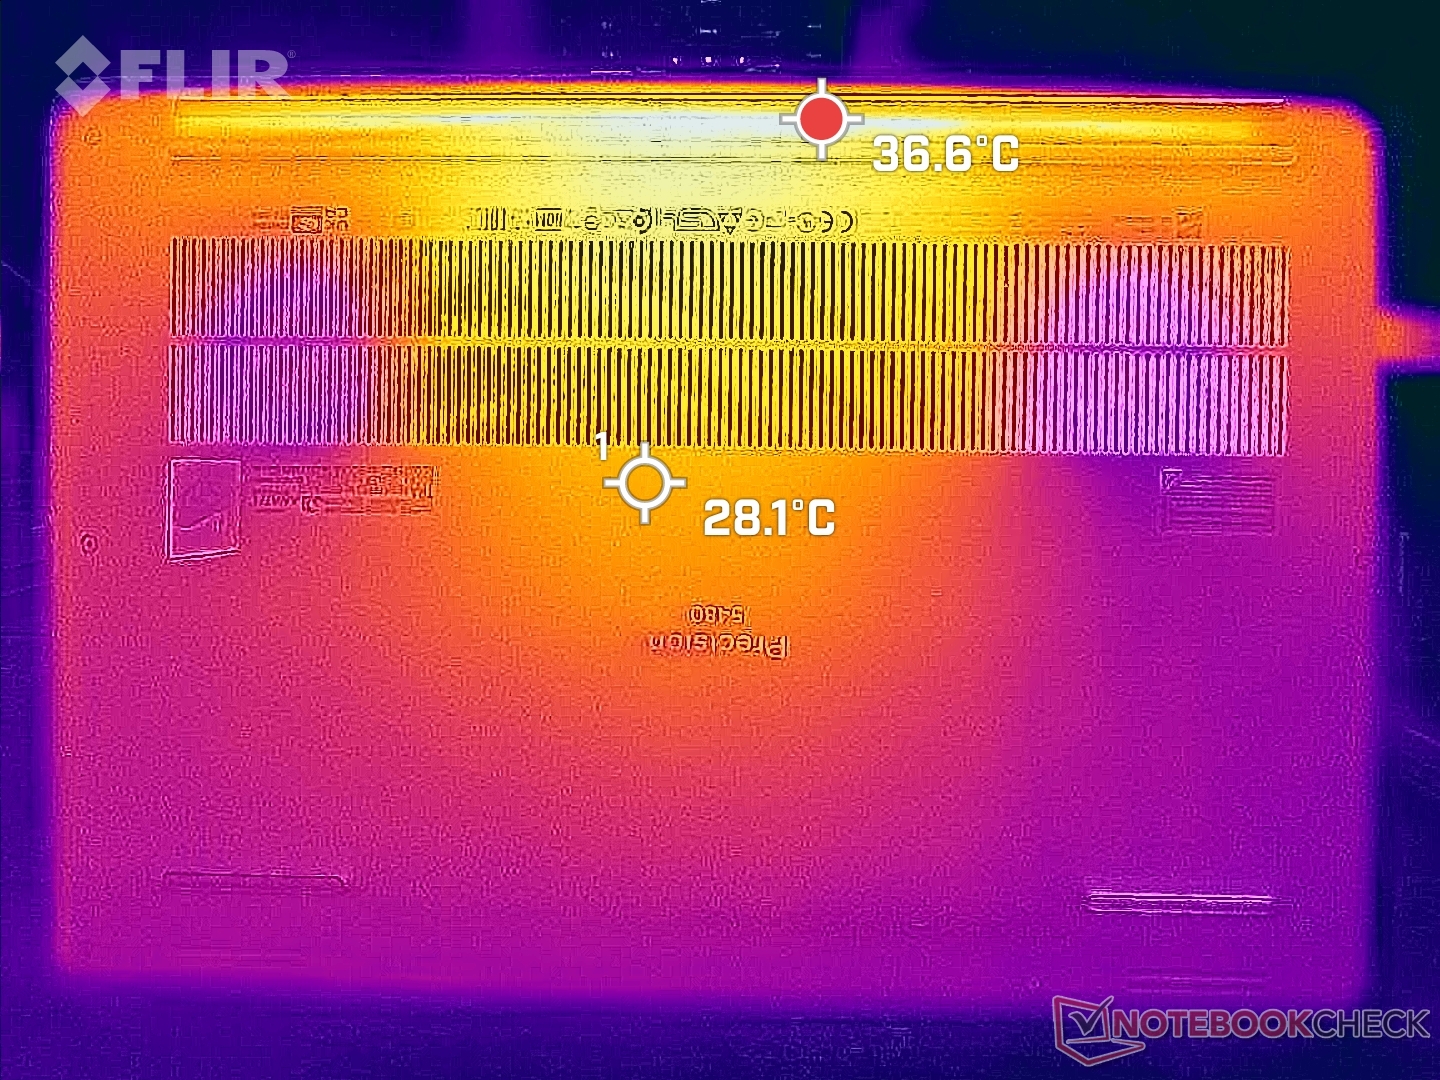
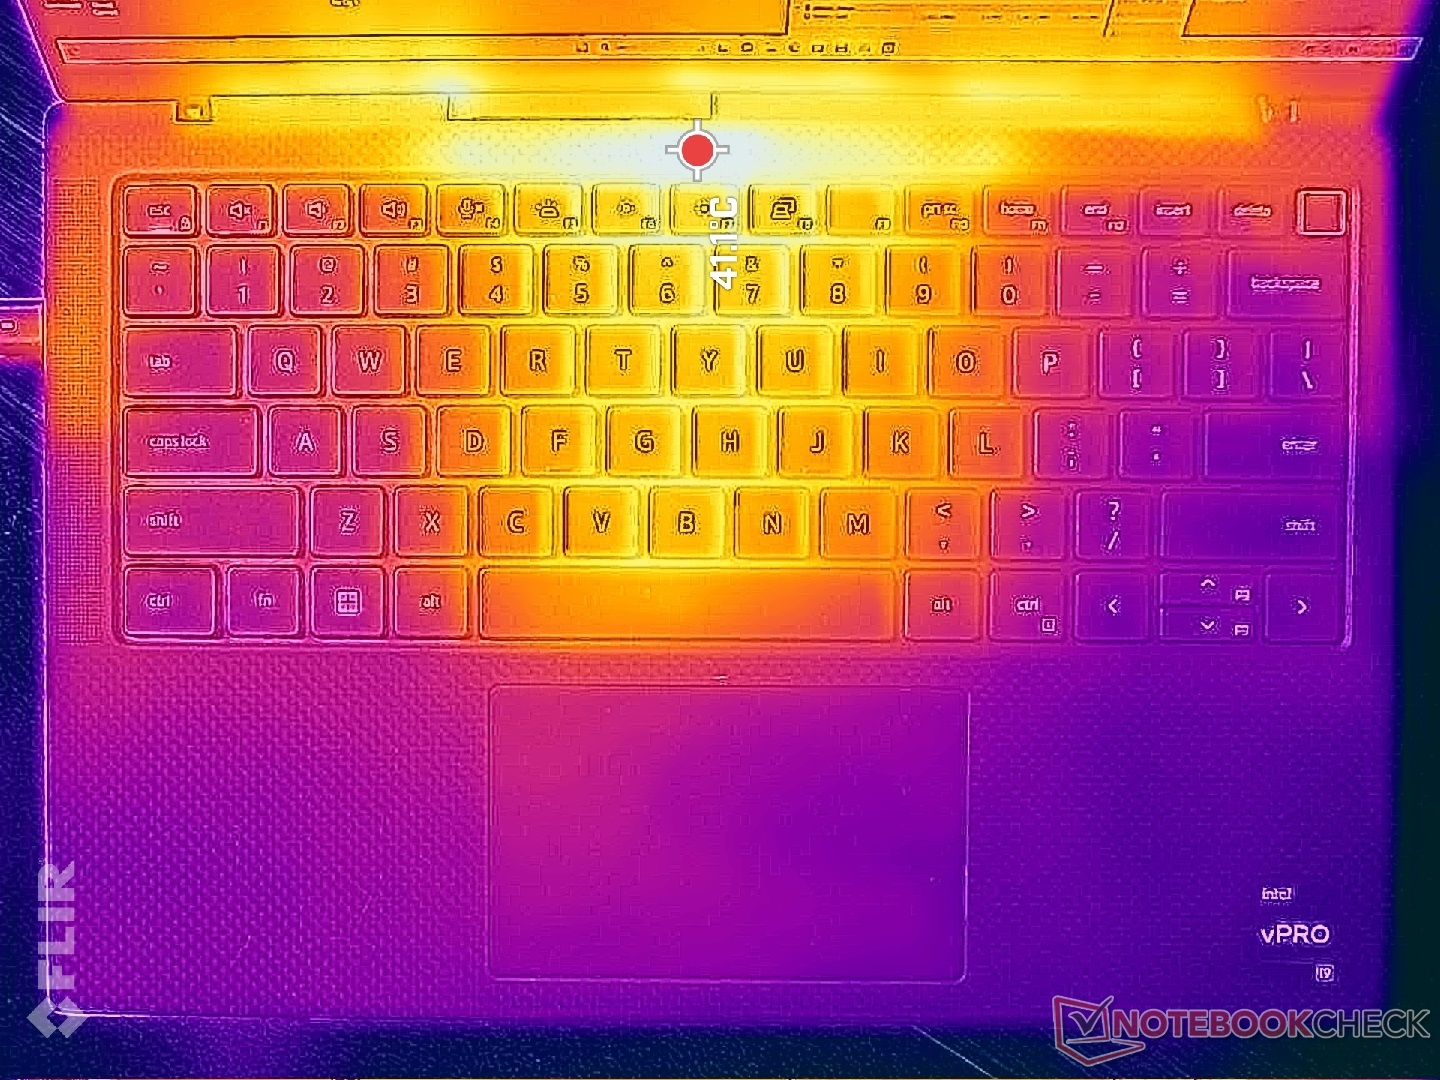
I punti caldi possono raggiungere oltre 40 C sui lati superiore e inferiore dello chassis quando si eseguono contemporaneamente Prime95 e FurMark. Sono concentrati vicino alla parte posteriore dell'unità e quindi i poggiapolsi in fibra di carbonio rimangono confortevoli al tatto, ma la maggior parte del fondo in metallo sarà molto calda.
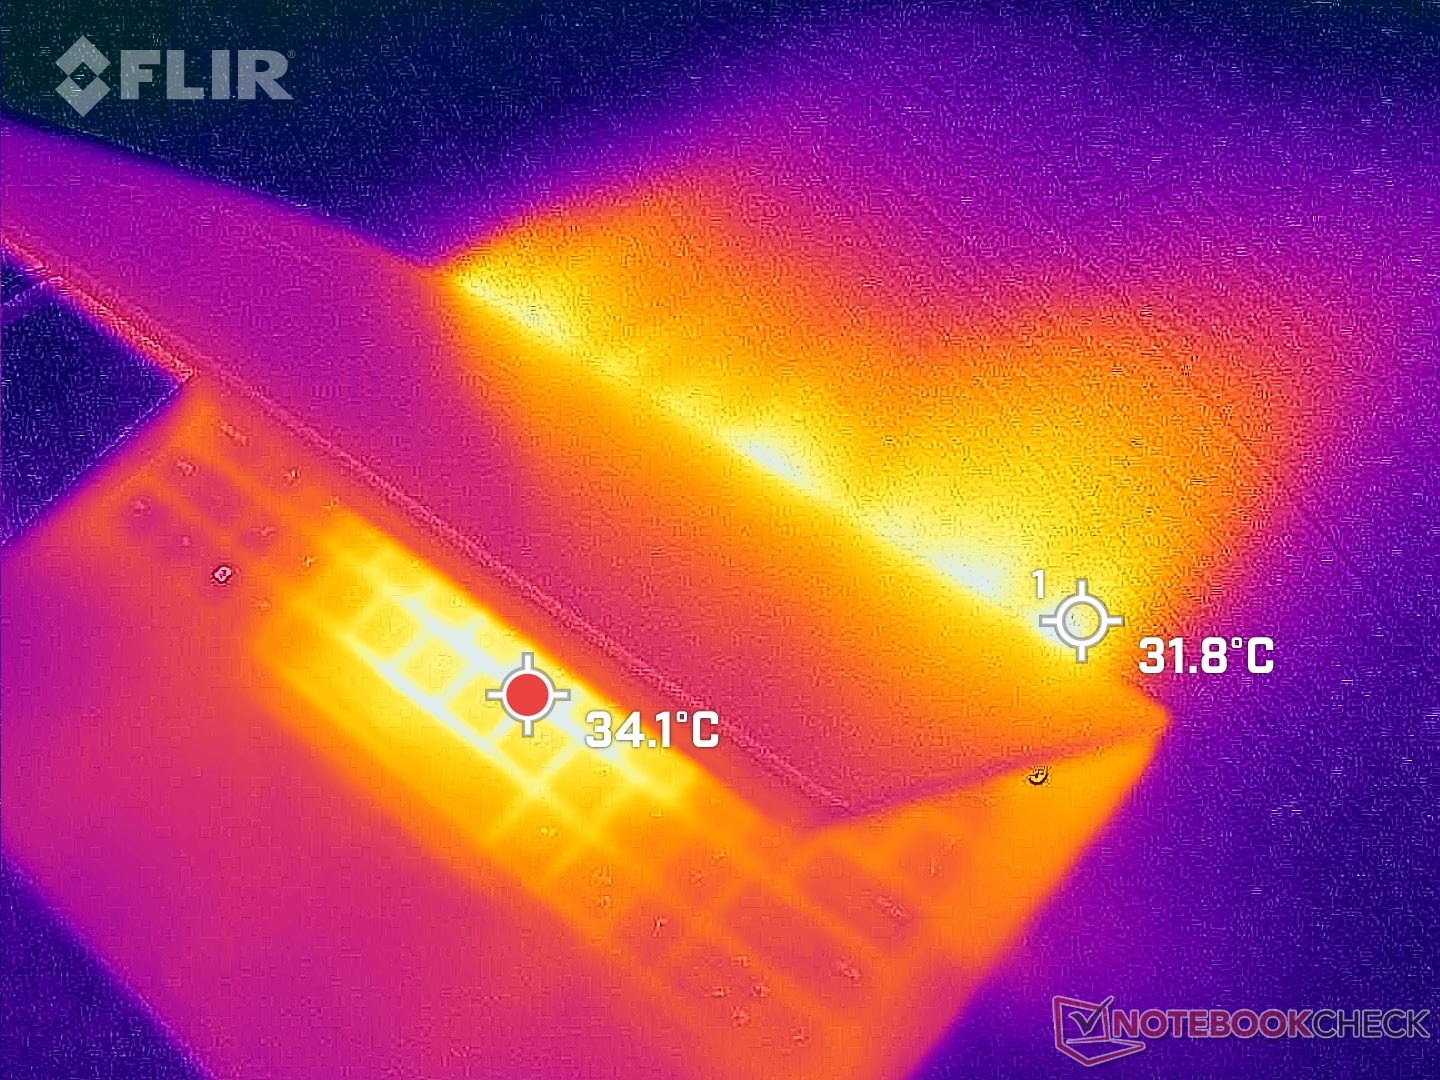
(±) La temperatura massima sul lato superiore è di 44 °C / 111 F, rispetto alla media di 38.2 °C / 101 F, che varia da 22.2 a 69.8 °C per questa classe Workstation.
(+) Il lato inferiore si riscalda fino ad un massimo di 38.2 °C / 101 F, rispetto alla media di 41.1 °C / 106 F
(±) In idle, la temperatura media del lato superiore è di 34.2 °C / 94 F, rispetto alla media deld ispositivo di 32 °C / 90 F.
(±) Riproducendo The Witcher 3, la temperatura media per il lato superiore e' di 32 °C / 90 F, rispetto alla media del dispositivo di 32 °C / 90 F.
(+) I poggiapolsi e il touchpad sono piu' freddi della temperatura della pelle con un massimo di 29.6 °C / 85.3 F e sono quindi freddi al tatto.
(±) La temperatura media della zona del palmo della mano di dispositivi simili e'stata di 27.8 °C / 82 F (-1.8 °C / -3.3 F).
| Dell Precision 5480 Intel Core i9-13900H, NVIDIA RTX 3000 Ada Generation Laptop | Dell Precision 5000 5470 Intel Core i9-12900H, NVIDIA RTX A1000 Laptop GPU | Dell Precision 5000 5560 Intel Core i7-11850H, NVIDIA RTX A2000 Laptop GPU | Lenovo ThinkPad P14s G3 AMD 21J6S05000 AMD Ryzen 7 PRO 6850U, AMD Radeon 680M | Lenovo ThinkPad P15v G3 21EM001AGE AMD Ryzen 7 PRO 6850H, NVIDIA RTX A2000 Laptop GPU | HP ZBook Firefly 14 G9-6B8A2EA Intel Core i7-1265U, NVIDIA T550 Laptop GPU | |
|---|---|---|---|---|---|---|
| Heat | 9% | -1% | 14% | 7% | 11% | |
| Maximum Upper Side * (°C) | 44 | 41.8 5% | 48.2 -10% | 42.7 3% | 48.7 -11% | 41.2 6% |
| Maximum Bottom * (°C) | 38.2 | 36 6% | 42.6 -12% | 43.1 -13% | 50.5 -32% | 47.9 -25% |
| Idle Upper Side * (°C) | 38.8 | 34.6 11% | 34.8 10% | 25.7 34% | 25 36% | 26.5 32% |
| Idle Bottom * (°C) | 38.6 | 33.6 13% | 35.2 9% | 26.4 32% | 25.4 34% | 27 30% |
* ... Meglio usare valori piccoli
Stress test
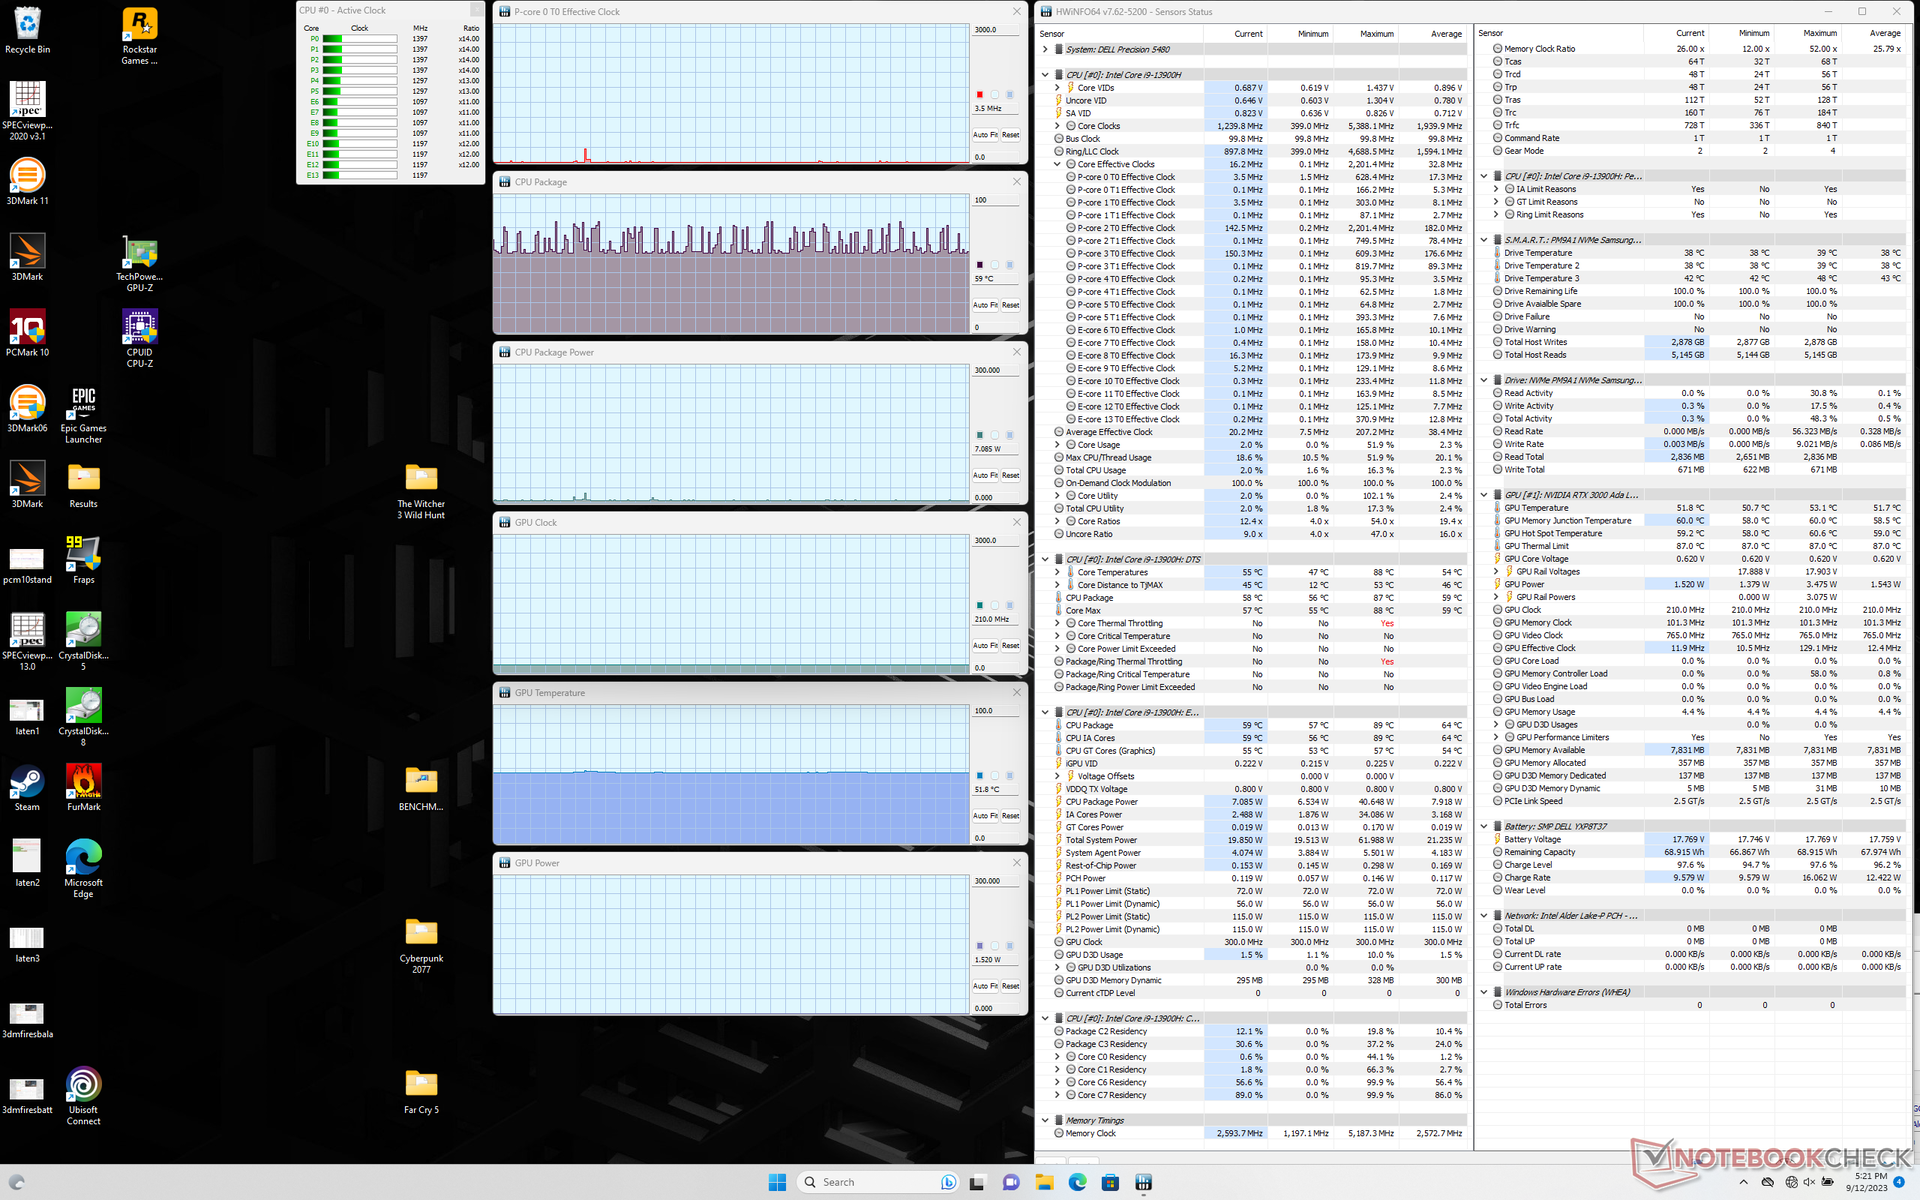
Durante l'esecuzione dello stress Prime95, la CPU raggiungeva picchi di 3,4 GHz, 88 W e 100 C per un paio di minuti. Alla fine si stabilizza a circa 2,4 GHz e 51 W per mantenere una temperatura del core leggermente più fredda ma più gestibile di 93 C. Il Turbo Boost massimo non è quindi indefinito, ma è comunque abbastanza buono considerando il piccolo fattore di forma da 14 pollici.
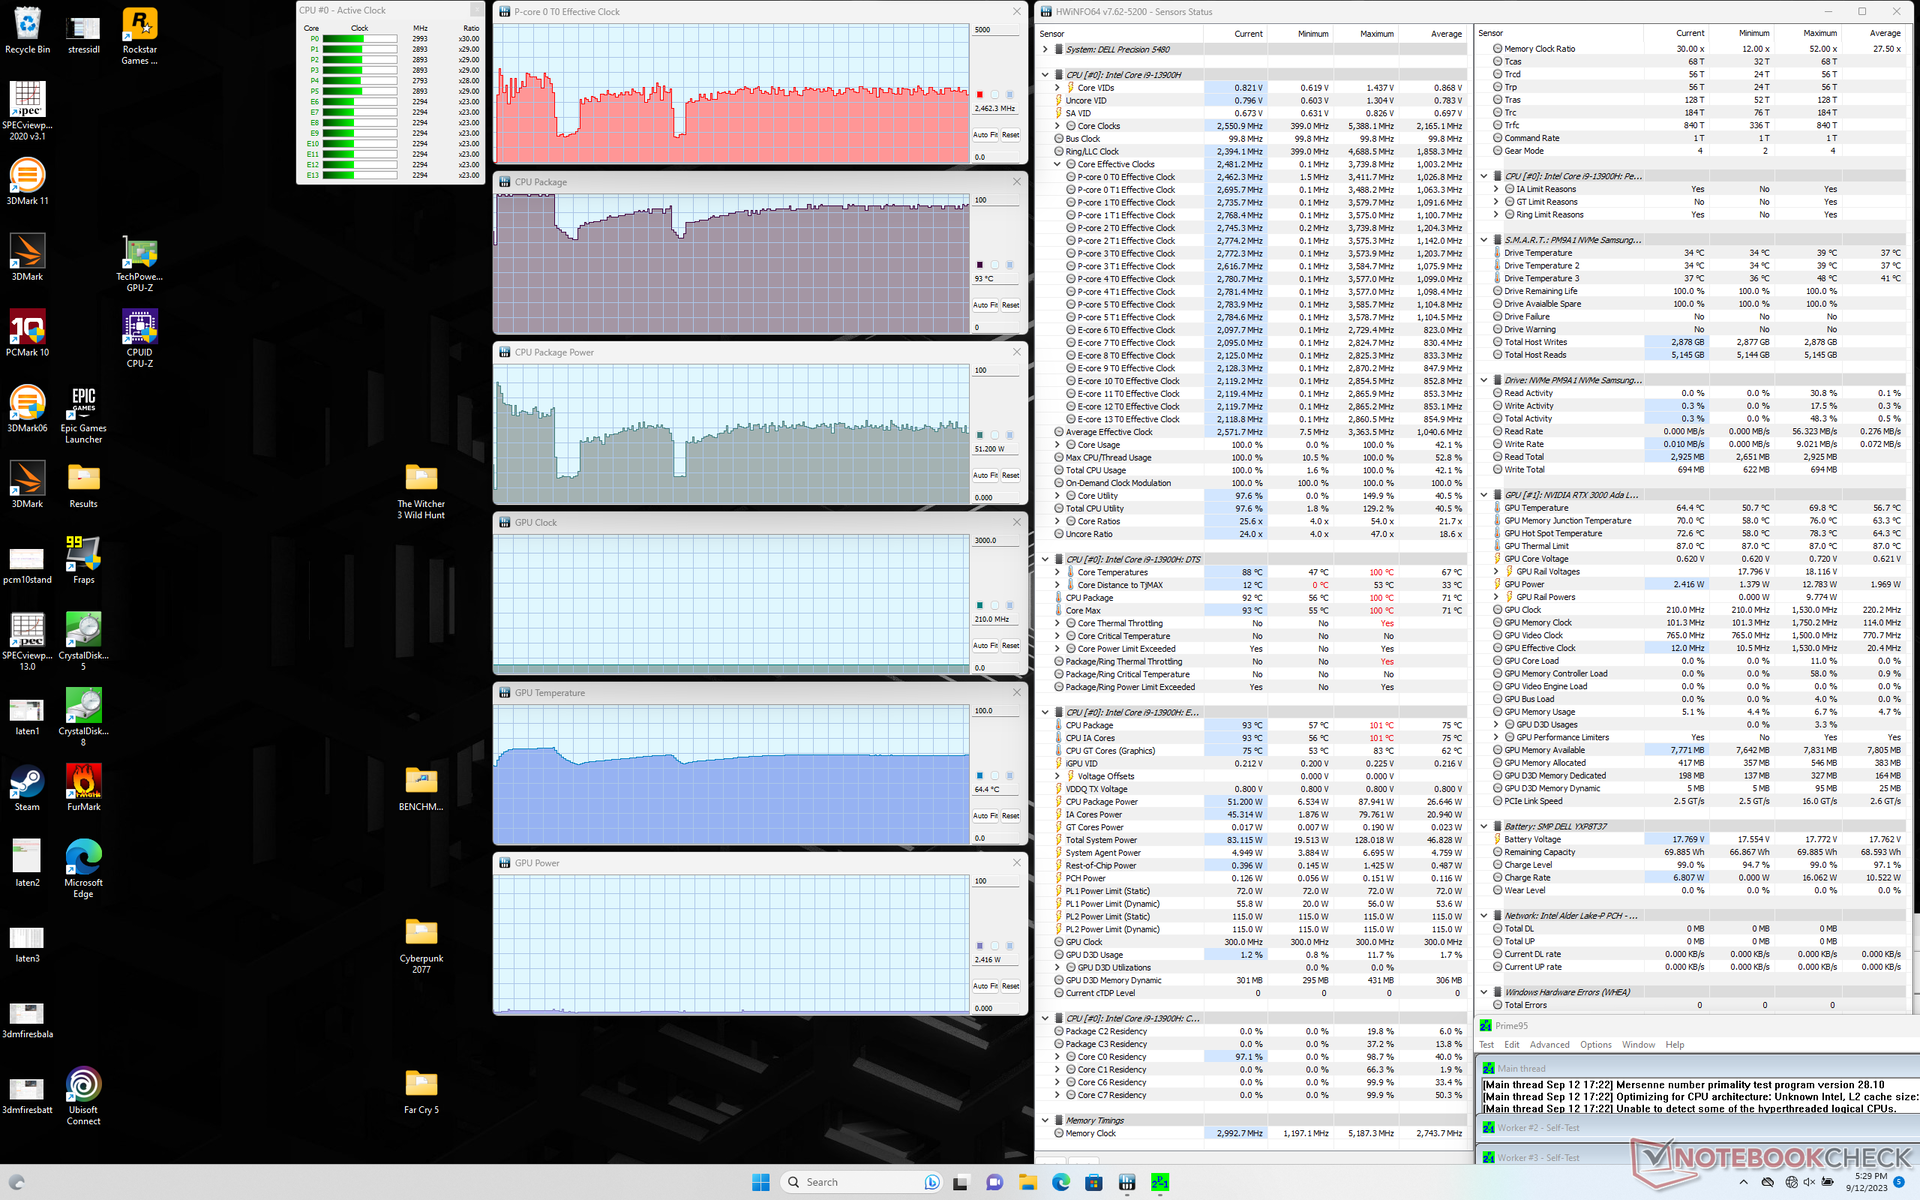
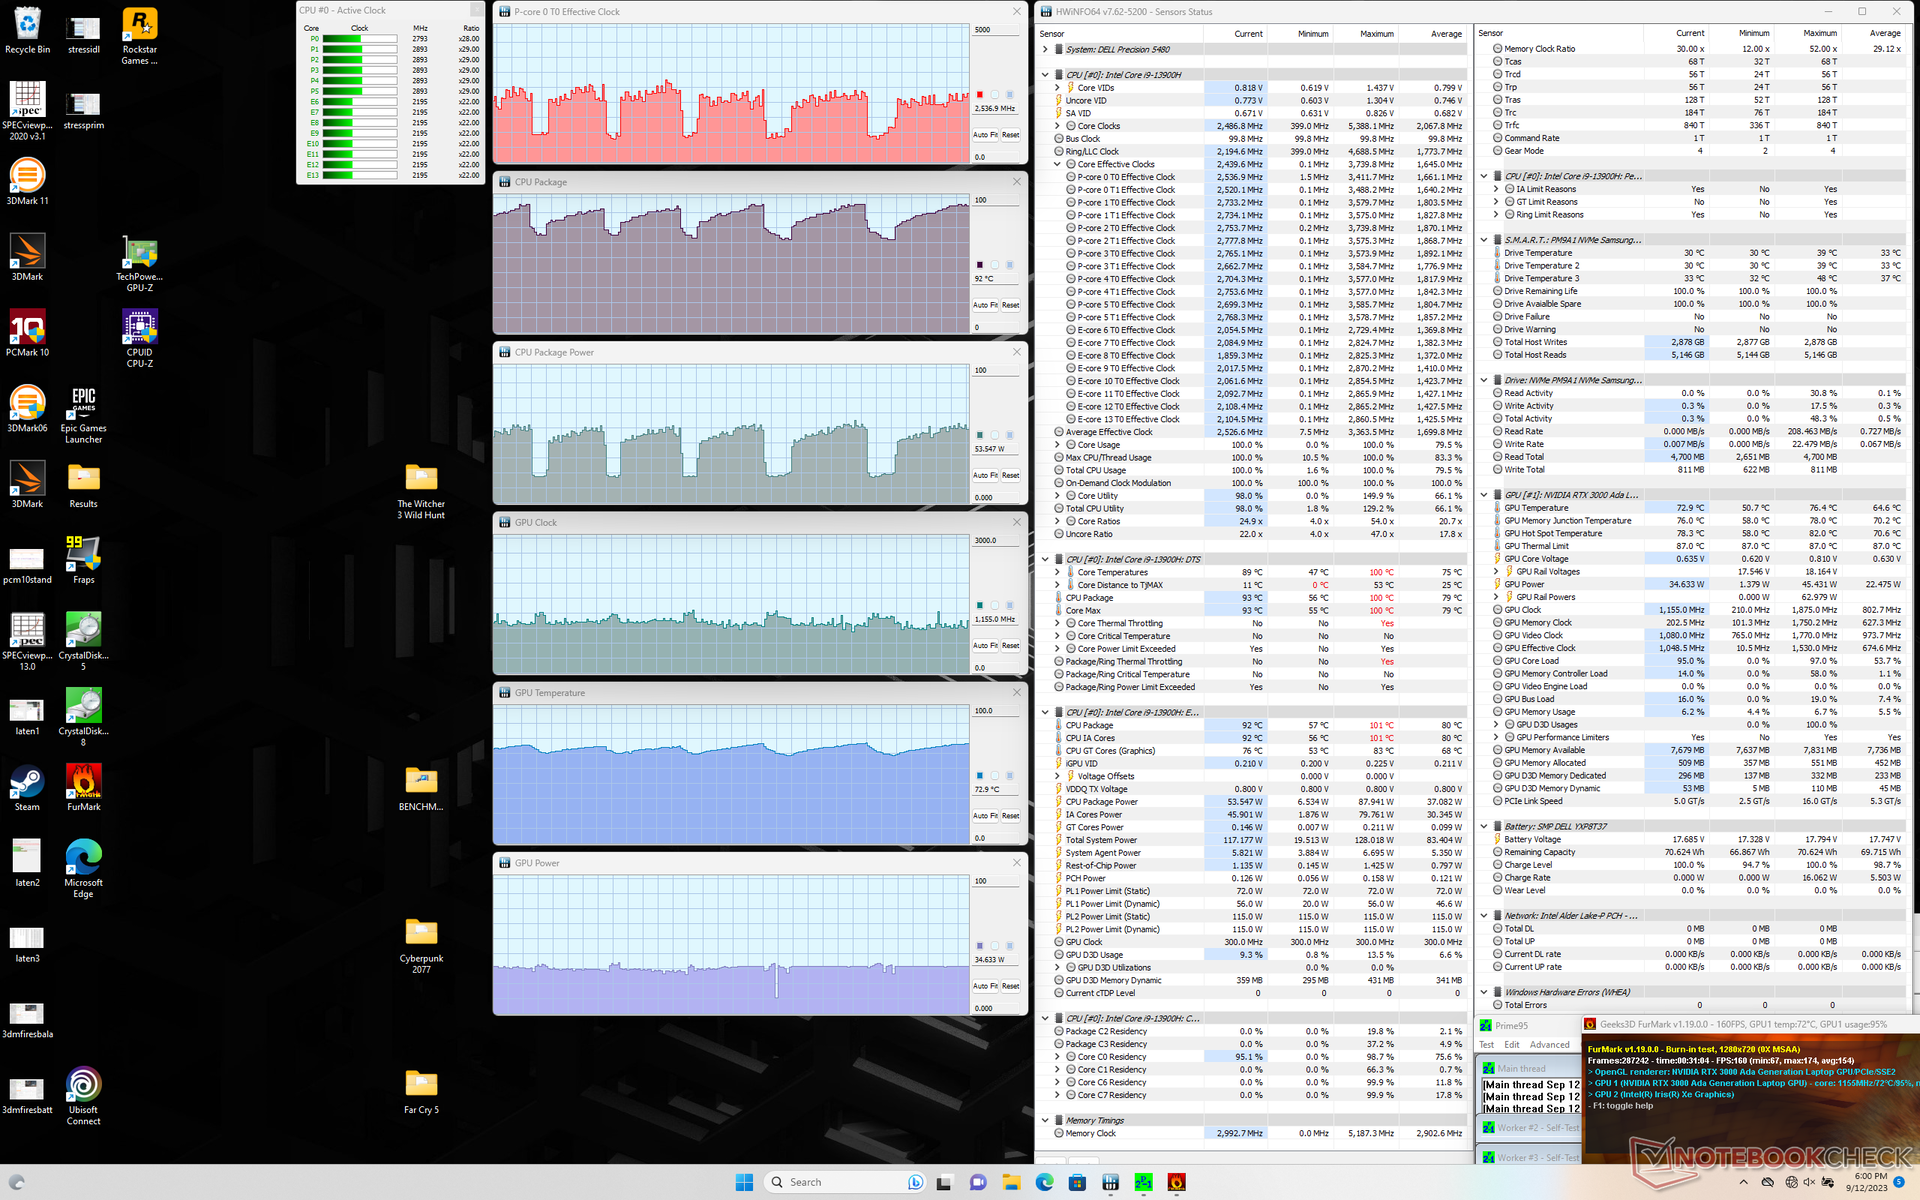
La CPU e la GPU si stabilizzano a circa 64 C ciascuna quando si utilizza Witcher 3 per rappresentare carichi elevati. È interessante notare che questo valore non cambia quando si passa dalla modalità Balanced a quella Performance, suggerendo che la modalità Balanced dovrebbe essere sufficiente per la maggior parte dei carichi di lavoro. Si noti che l'assorbimento di potenza della scheda GPU è maggiore, circa 45-50 W, rispetto ai soli 36 W del modello 5470 dello scorso anno Precision 5470. Le temperature dei core sarebbero comunque più basse rispetto al modello dell'anno scorso, se sottoposte a carichi di gioco simili.
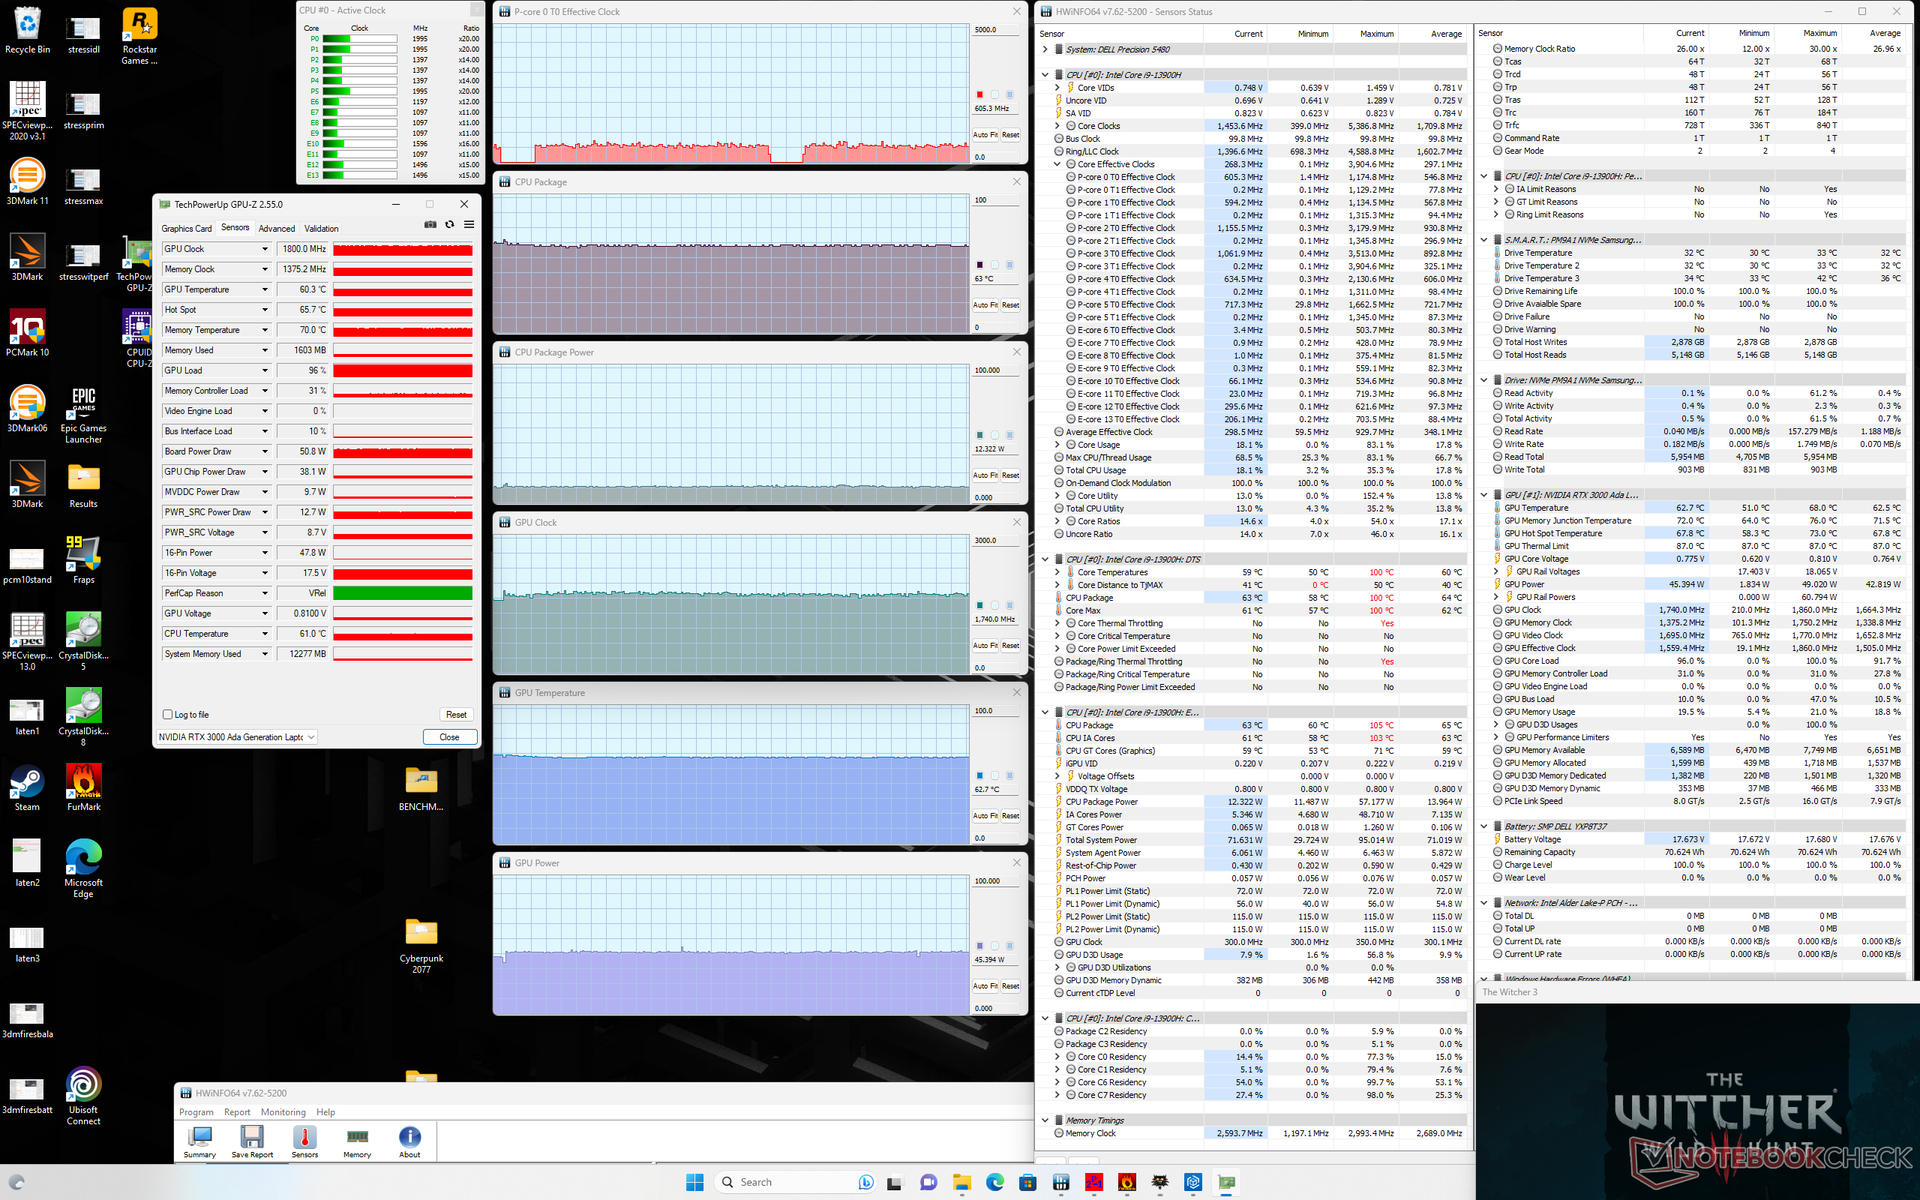
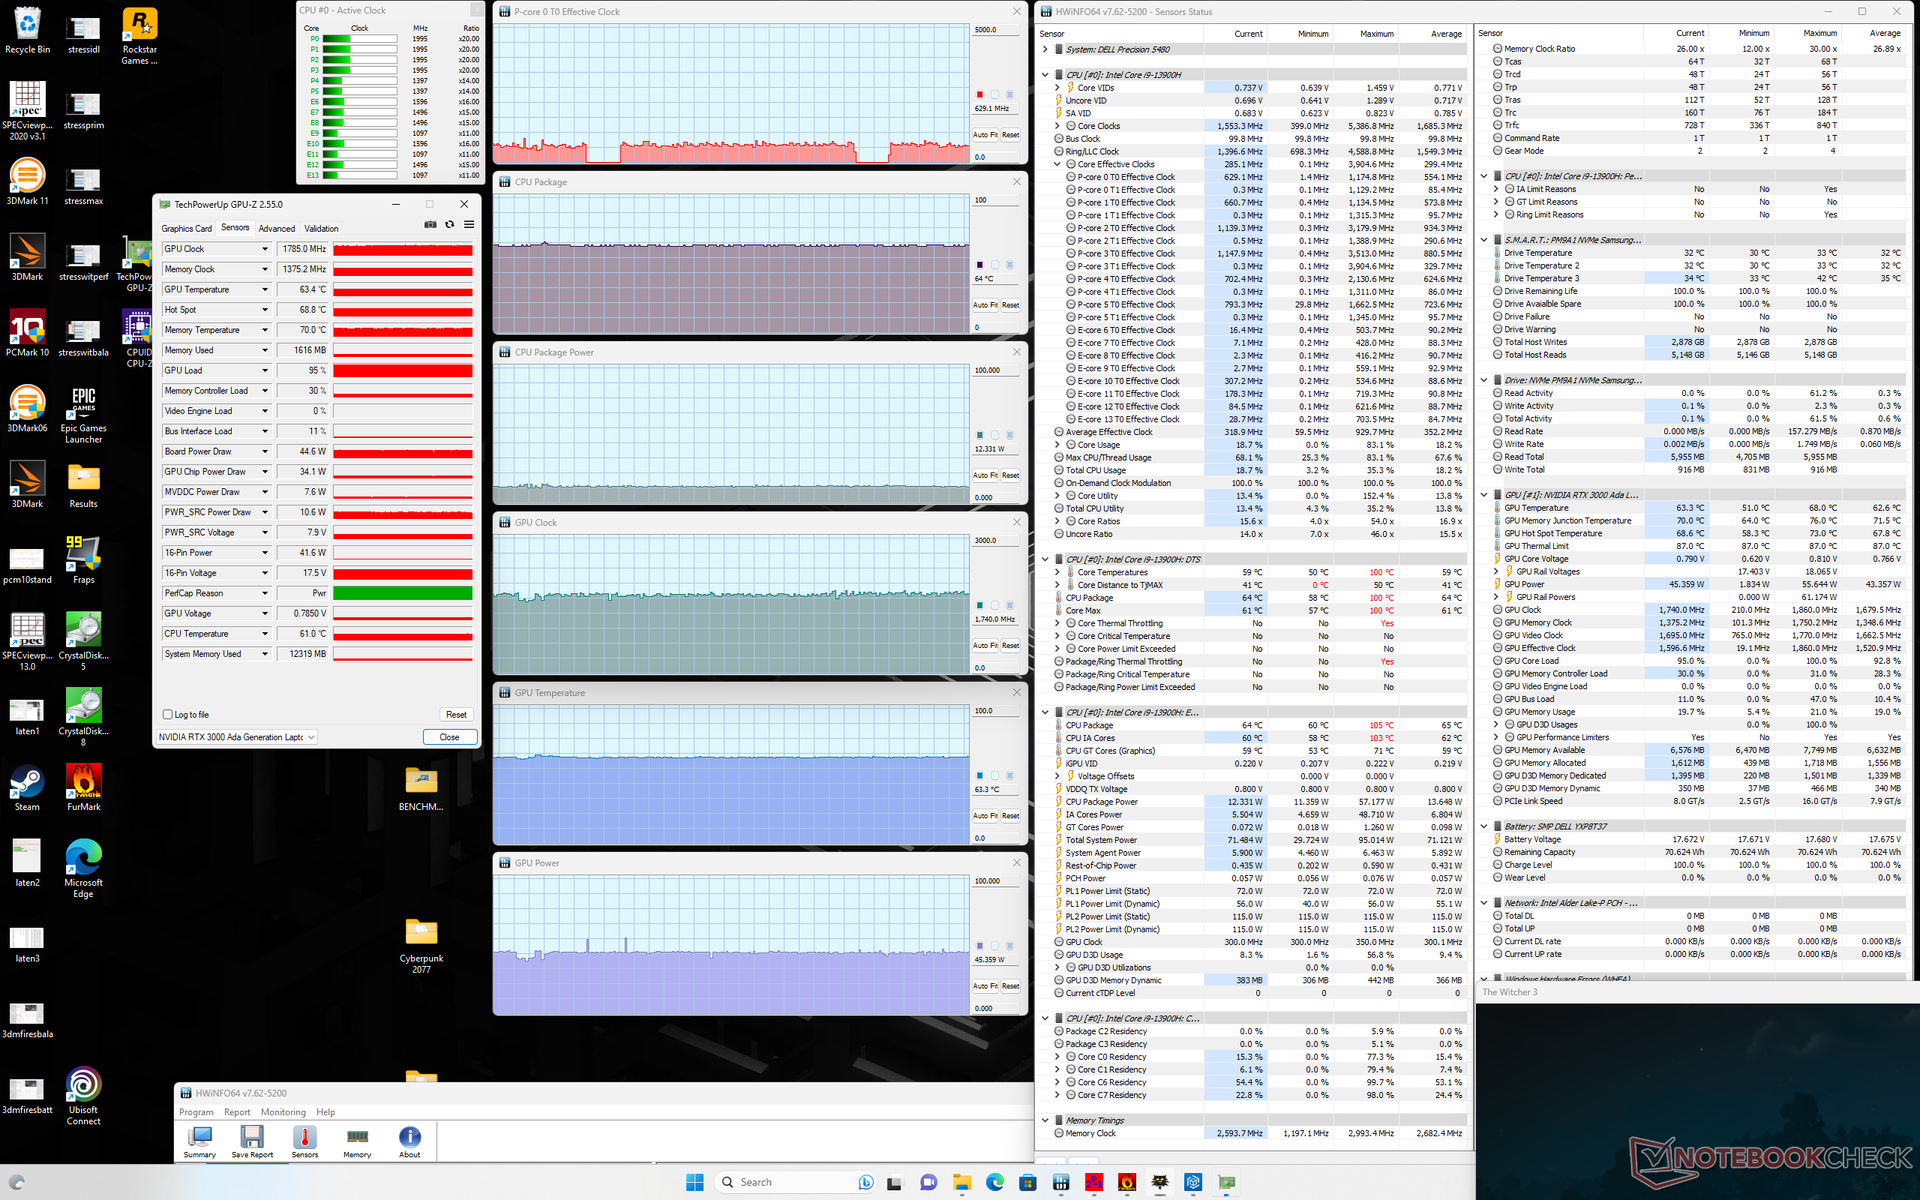
| Clock della CPU (GHz) | Clock della GPU (MHz) | Temperatura media della CPU (°C) | Temperatura media della GPU (°C) | |
| Sistema inattivo | -- | -- | 59 | 52 |
| Stress Prime95 | 2,5 | -- | 93 | 65 |
| Prime95 + FurMark Stress | 1.0 - 2.6 | 1155 | 69 - 92 | 66 - 73 |
| Witcher 3 Stress (modalità bilanciata) | 0,6 | 1740 | 63 | 63 |
| Witcher 3 Stress (modalità Performance) | 0,6 | 1740 | 64 | 63 |
Altoparlanti
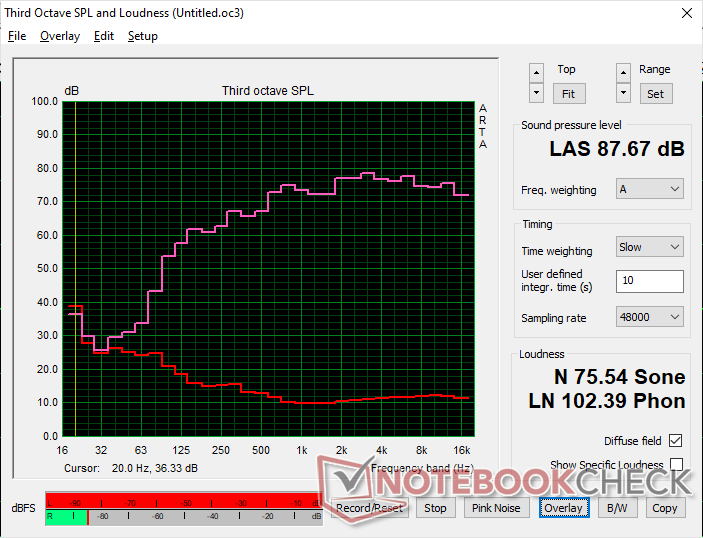
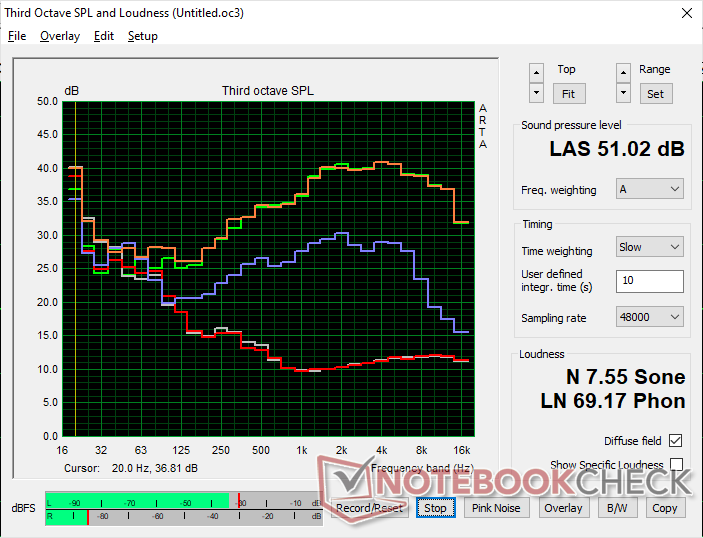
Dell Precision 5480 analisi audio
(+) | gli altoparlanti sono relativamente potenti (87.7 dB)
Bassi 100 - 315 Hz
(±) | bassi ridotti - in media 12.9% inferiori alla media
(±) | la linearità dei bassi è media (7% delta rispetto alla precedente frequenza)
Medi 400 - 2000 Hz
(+) | medi bilanciati - solo only 2.8% rispetto alla media
(+) | medi lineari (3.6% delta rispetto alla precedente frequenza)
Alti 2 - 16 kHz
(+) | Alti bilanciati - appena 2.9% dalla media
(+) | alti lineari (2% delta rispetto alla precedente frequenza)
Nel complesso 100 - 16.000 Hz
(+) | suono nel complesso lineare (9% differenza dalla media)
Rispetto alla stessa classe
» 4% di tutti i dispositivi testati in questa classe è stato migliore, 2% simile, 94% peggiore
» Il migliore ha avuto un delta di 7%, medio di 17%, peggiore di 35%
Rispetto a tutti i dispositivi testati
» 3% di tutti i dispositivi testati in questa classe è stato migliore, 1% similare, 96% peggiore
» Il migliore ha avuto un delta di 4%, medio di 23%, peggiore di 134%
Apple MacBook Pro 16 2021 M1 Pro analisi audio
(+) | gli altoparlanti sono relativamente potenti (84.7 dB)
Bassi 100 - 315 Hz
(+) | bassi buoni - solo 3.8% dalla media
(+) | bassi in lineaa (5.2% delta rispetto alla precedente frequenza)
Medi 400 - 2000 Hz
(+) | medi bilanciati - solo only 1.3% rispetto alla media
(+) | medi lineari (2.1% delta rispetto alla precedente frequenza)
Alti 2 - 16 kHz
(+) | Alti bilanciati - appena 1.9% dalla media
(+) | alti lineari (2.7% delta rispetto alla precedente frequenza)
Nel complesso 100 - 16.000 Hz
(+) | suono nel complesso lineare (4.6% differenza dalla media)
Rispetto alla stessa classe
» 0% di tutti i dispositivi testati in questa classe è stato migliore, 0% simile, 100% peggiore
» Il migliore ha avuto un delta di 5%, medio di 17%, peggiore di 45%
Rispetto a tutti i dispositivi testati
» 0% di tutti i dispositivi testati in questa classe è stato migliore, 0% similare, 100% peggiore
» Il migliore ha avuto un delta di 4%, medio di 23%, peggiore di 134%
Gestione dell'energia
Consumo di energia
Precision 5480 è più esigente del precedente Precision 5470 quando si eseguono carichi impegnativi. Witcher 3 il modello 5480, ad esempio, consuma circa 90 W rispetto agli 83 W del modello dell'anno scorso, ma il leggero aumento dei consumi è sminuito dal significativo salto di prestazioni, come già detto.
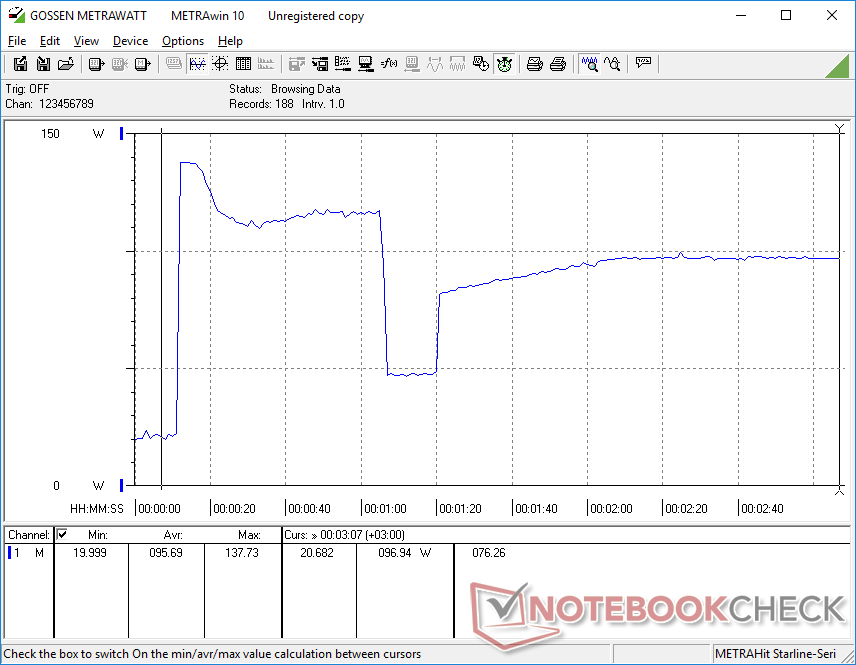
È interessante notare che il consumo di energia durante l'esecuzione di Prime95 sarebbe di oltre due volte superiore a quello del modello dell'anno scorso (98 W contro 42 W) dopo aver tenuto conto di qualsiasi strozzatura delle prestazioni, come mostrato dai grafici seguenti. L'aumento delle prestazioni del processore rispetto all'anno precedente ha quindi un prezzo molto più alto rispetto all'aumento delle prestazioni grafiche.
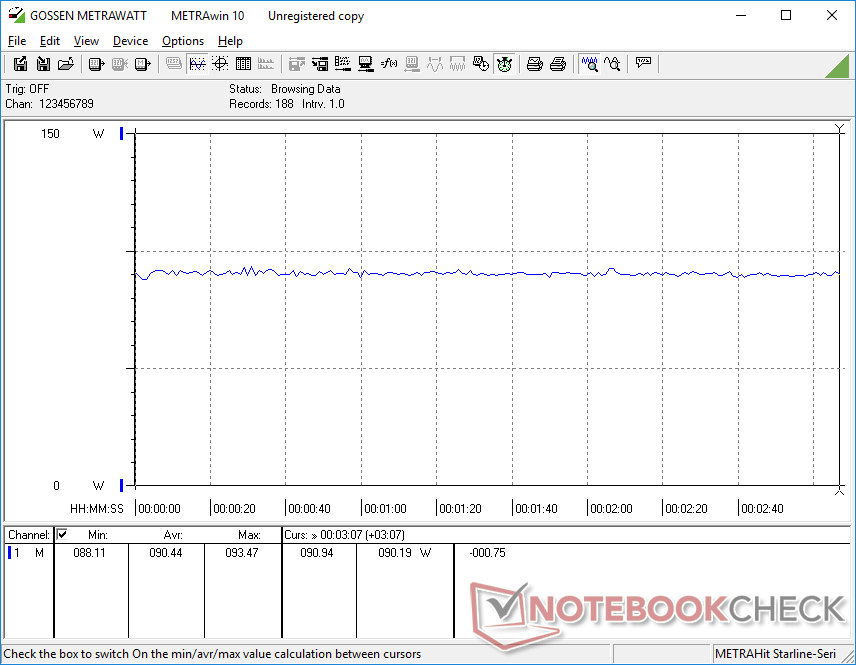
Vale anche la pena ricordare che la nostra unità assorbe più energia del previsto quando è semplicemente al minimo sul desktop senza applicazioni in esecuzione, il che potrebbe essere in parte responsabile delle temperature superficiali generalmente più calde, come notato in precedenza.
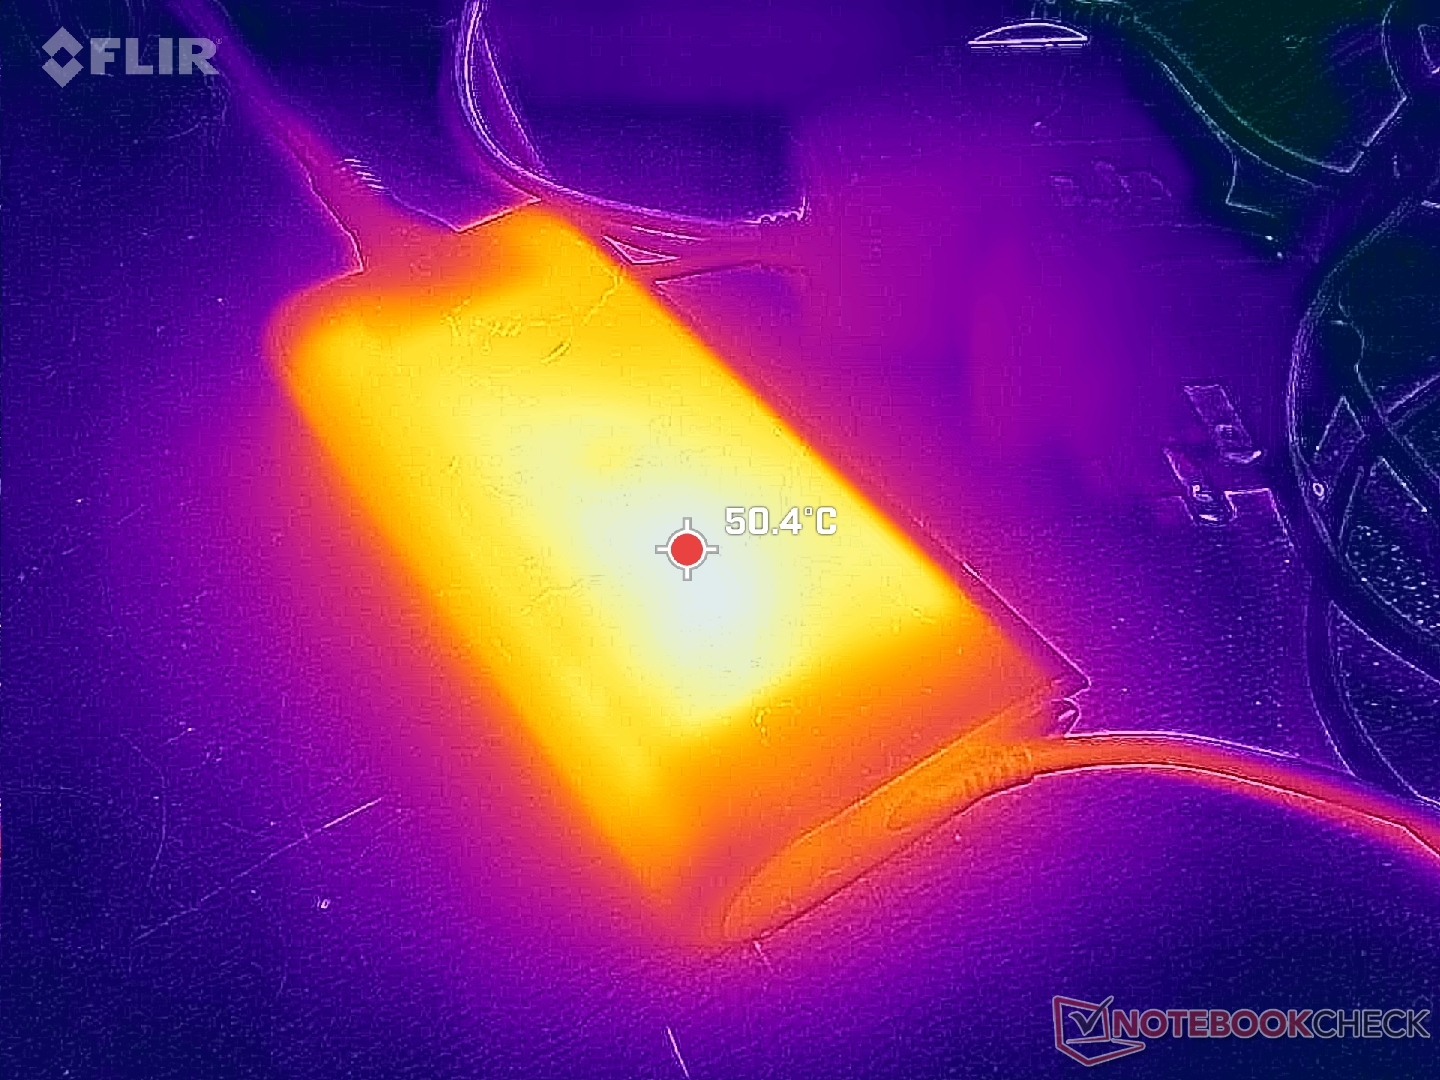
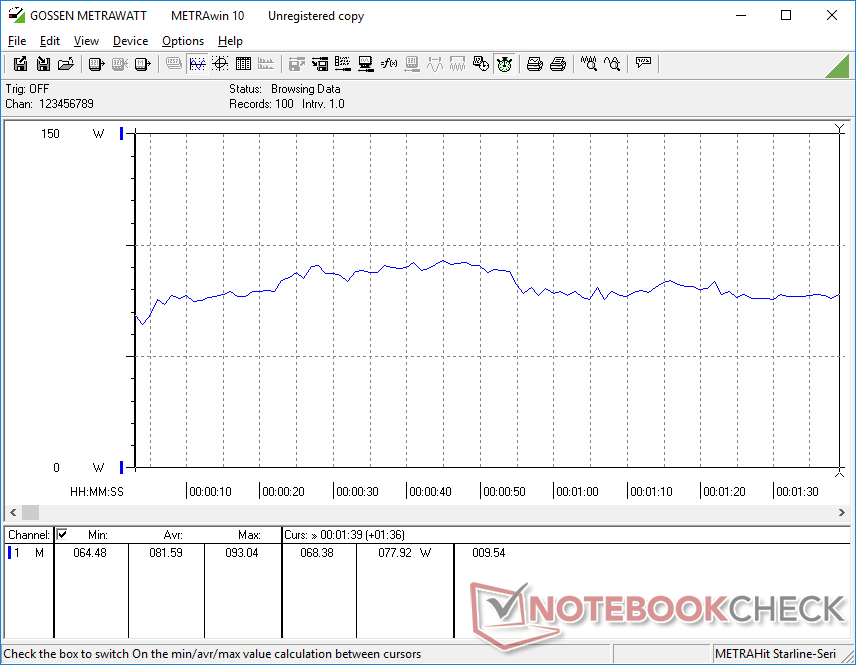
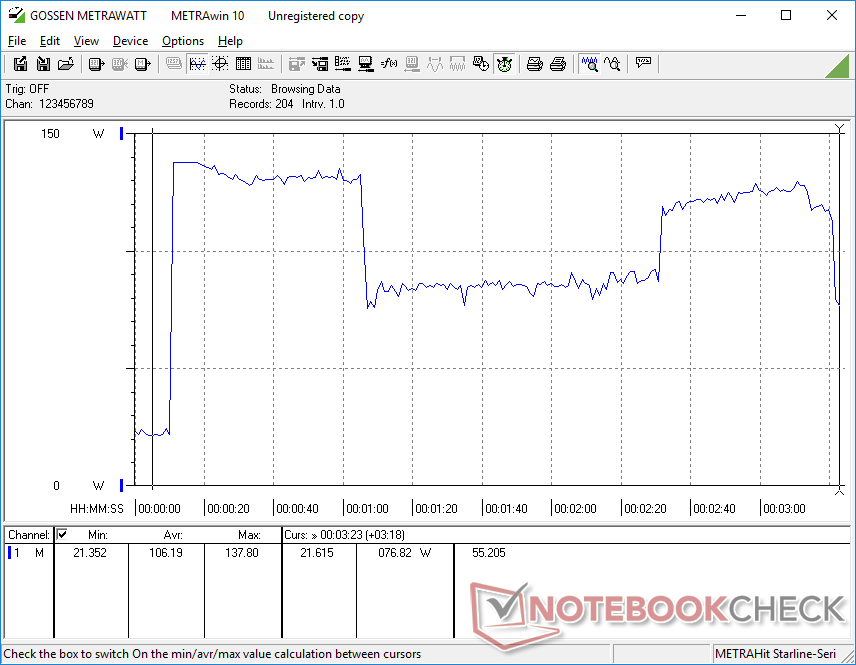
Siamo riusciti a misurare un consumo massimo temporaneo di 138 W dall'adattatore CA USB-C da 130 W di dimensioni medio-piccole (~14,3 x 6,5 x 2,1 cm) quando la CPU e la GPU sono completamente sollecitate. Questo consumo elevato non è costante, in quanto passa da 76 W a 138 W ogni minuto circa, come mostra il grafico seguente, correlato alle frequenze di clock.
| Off / Standby | |
| Idle | |
| Sotto carico |
|
Leggenda:
min: | |
| Dell Precision 5480 i9-13900H, RTX 3000 Ada Generation Laptop, Samsung PM9A1 MZVL21T0HCLR, IPS, 2560x1600, 14" | Dell Precision 5000 5470 i9-12900H, RTX A1000 Laptop GPU, Samsung PM9A1 MZVL21T0HCLR, IPS, 2560x1600, 14" | Dell Precision 5000 5560 i7-11850H, RTX A2000 Laptop GPU, Samsung PM9A1 MZVL22T0HBLB, IPS, 3840x2400, 15.6" | Lenovo ThinkPad P14s G3 AMD 21J6S05000 R7 PRO 6850U, Radeon 680M, Samsung PM9A1 MZVL21T0HCLR, IPS LED, 1920x1200, 14" | Lenovo ThinkPad P15v G3 21EM001AGE R7 PRO 6850H, RTX A2000 Laptop GPU, SK Hynix PC711 1TB HFS001TDE9X081N, IPS LED, 3840x2160, 15.6" | HP ZBook Firefly 14 G9-6B8A2EA i7-1265U, T550 Laptop GPU, Micron 3400 1TB MTFDKBA1T0TFH, IPS, 1920x1200, 14" | |
|---|---|---|---|---|---|---|
| Power Consumption | 25% | 15% | 63% | 24% | 60% | |
| Idle Minimum * (Watt) | 14.9 | 4.3 71% | 6.2 58% | 2.6 83% | 6.3 58% | 4.2 72% |
| Idle Average * (Watt) | 19.5 | 8.9 54% | 13.9 29% | 5 74% | 13.9 29% | 6.5 67% |
| Idle Maximum * (Watt) | 27.2 | 18.9 31% | 23.8 12% | 5.6 79% | 14.5 47% | 7.2 74% |
| Load Average * (Watt) | 81.6 | 94 -15% | 95.7 -17% | 49.7 39% | 82.8 -1% | 47.7 42% |
| Witcher 3 ultra * (Watt) | 90.4 | 83.2 8% | 87 4% | 50.6 44% | 88.8 2% | 42.9 53% |
| Load Maximum * (Watt) | 137.8 | 137.5 -0% | 132.6 4% | 61.1 56% | 124.8 9% | 68.2 51% |
* ... Meglio usare valori piccoli
Power Consumption Witcher 3 / Stresstest
Power Consumption external Monitor
Durata della batteria
L'autonomia della WLAN è leggermente superiore a quella del modello dell'anno scorso, di circa 1 o 2 ore, il che è abbastanza buono se si considerano i vantaggi in termini di prestazioni rispetto all'anno precedente. Nel frattempo, la ricarica da vuoto a pieno regime richiede poco più di 2 ore.
| Dell Precision 5480 i9-13900H, RTX 3000 Ada Generation Laptop, 72 Wh | Dell Precision 5000 5470 i9-12900H, RTX A1000 Laptop GPU, 72 Wh | Dell Precision 5000 5560 i7-11850H, RTX A2000 Laptop GPU, 86 Wh | Lenovo ThinkPad P14s G3 AMD 21J6S05000 R7 PRO 6850U, Radeon 680M, 52.5 Wh | Lenovo ThinkPad P15v G3 21EM001AGE R7 PRO 6850H, RTX A2000 Laptop GPU, 68 Wh | HP ZBook Firefly 14 G9-6B8A2EA i7-1265U, T550 Laptop GPU, 51 Wh | |
|---|---|---|---|---|---|---|
| Autonomia della batteria | 5% | 29% | 17% | 32% | -19% | |
| WiFi v1.3 (h) | 10.9 | 9.6 -12% | 6.3 -42% | 12.2 12% | 6.9 -37% | 8.8 -19% |
| Load (h) | 0.9 | 1.1 22% | 1.8 100% | 1.1 22% | 1.8 100% | |
| Reader / Idle (h) | 14.7 | 12 | ||||
| H.264 (h) | 12 | 10.7 |
Pro
Contro
Verdetto: la RTX 3000 Ada convince
Il modello Precision 5480 è un perfezionamento interno del modello Precision 5470 dello scorso anno. Le prestazioni della CPU sono più veloci e stabili rispetto al passato, mentre la GPU Ada è la vera star dello spettacolo e il motivo principale per acquistare il Precision 5480 rispetto al vecchio Precision 5470. Il consumo energetico potrebbe essere un po' più elevato, ma la durata della batteria non è cambiata in modo significativo e l'aumento delle prestazioni sarà ben ripagato dagli utenti più esigenti.
Forse il più grande svantaggio del sistema è il volume che può essere elevato quando si mette il pedale del freno. Sebbene le prestazioni per volume siano molto elevate, tutta questa potenza in un pacchetto così piccolo e portatile ha il prezzo del rumore della ventola. Altre workstation da 14 pollici, come il
Lenovo ThinkPad P14s oHP ZBook Firefly 14 G9 funzionano in modo molto più silenzioso, ma devono sacrificare un'enorme quantità di prestazioni grafiche.Il modello Precision 5480 da 14 pollici è destinato ai power user in movimento che sanno di poter sfruttare appieno la veloce GPU RTX 3000 Ada. Altrimenti, le alternative di Lenovo e HP tendono a funzionare in modo molto più silenzioso e discreto.
Prezzo e disponibilità
Dell distribuisce ora la workstation Precision 5480 a partire da 2070 dollari per la configurazione base Core i5 senza grafica discreta, fino a oltre 4400 dollari per la configurazione Core i7 RTX 3000 Ada.
Dell Precision 5480
- 09/15/2023 v7 (old)
Allen Ngo
Transparency
La selezione dei dispositivi da recensire viene effettuata dalla nostra redazione. Il campione di prova è stato fornito all'autore come prestito dal produttore o dal rivenditore ai fini di questa recensione. L'istituto di credito non ha avuto alcuna influenza su questa recensione, né il produttore ne ha ricevuto una copia prima della pubblicazione. Non vi era alcun obbligo di pubblicare questa recensione. In quanto società mediatica indipendente, Notebookcheck non è soggetta all'autorità di produttori, rivenditori o editori.
Ecco come Notebookcheck esegue i test
Ogni anno, Notebookcheck esamina in modo indipendente centinaia di laptop e smartphone utilizzando procedure standardizzate per garantire che tutti i risultati siano comparabili. Da circa 20 anni sviluppiamo continuamente i nostri metodi di prova e nel frattempo stabiliamo gli standard di settore. Nei nostri laboratori di prova, tecnici ed editori esperti utilizzano apparecchiature di misurazione di alta qualità. Questi test comportano un processo di validazione in più fasi. Il nostro complesso sistema di valutazione si basa su centinaia di misurazioni e parametri di riferimento ben fondati, che mantengono l'obiettività.Price comparison

