Recensione del portatile Lenovo ThinkPad P15v G2a: una economica workstation aziendale
Il Lenovo ThinkPad P15v Gen2 è una workstation da 15 pollici che si posiziona tra i ThinkPad P15 e P15 come quest'ultimo gruppo, utilizza un processore Intel Core i7-11800H Core i7-11800Hma viene fornito con l'opzione di una Nvidia GeForce RTX A2000 come GPU più potente disponibile per questa variante. Il ThinkPad T15p Gen2 utilizza la più lenta Nvidia GeForce GTX 1650che è configurata come variante professionale (Nvidia T1200) nel nostro P15v G2.
Entrambi i dispositivi possono essere dotati di un display 4K (600 nits), proprio come il T15p Gen1. Il più ingombrante ThinkPad T15g, invece, è una variante workstation del ThinkPad P15 spostata in direzione del gaming. La serie P15v offre quindi componenti potenti a un peso e a un prezzo non troppo elevati (circa 1.800 euro). Lenovo pubblicizza la sua workstation per i creativi: se questa affermazione è giustificata, in particolare per quanto riguarda il display, lo scopriremo nella recensione che segue.
Nota per i lettori internazionali: Il Lenovo ThinkPad P15v Gen2 è disponibile anche in altri Paesi in varie configurazioni e a vari prezzi (vedere "Prezzo e disponibilità" alla fine di questa recensione per gli esempi)
| Modell | Campo di applicazione |
|---|---|
| ThinkPad P15 | Workstation classica |
| ThinkPad T15g | Workstation da gioco |
| ThinkPad P15s | Workstation ultrabook |
| ThinkPad T15 | Business |
| ThinkPad P15v | Workstation entry-level |
| ThinkPad T15p | Prestazioni business |
Potenziali concorrenti a confronto
Punteggio | Data | Modello | Peso | Altezza | Dimensione | Risoluzione | Prezzo |
|---|---|---|---|---|---|---|---|
| 86.2 % v7 (old) | 06/2022 | Lenovo ThinkPad P15v G2 21A9000XGE i7-11800H, T1200 Laptop GPU | 2.3 kg | 22.7 mm | 15.60" | 1920x1080 | |
| 87.2 % v7 (old) | 10/2021 | Lenovo ThinkPad P15 G2-20YQ001JGE i7-11800H, RTX A3000 Laptop GPU | 2.9 kg | 31.5 mm | 15.60" | 1920x1080 | |
| 86.3 % v7 (old) | 03/2021 | Lenovo ThinkPad T15g-20UR000GGE i7-10750H, GeForce RTX 2070 Super Max-Q | 2.8 kg | 31.45 mm | 15.60" | 1920x1080 | |
| 86.6 % v7 (old) | 02/2021 | Lenovo ThinkPad T15p-20TN0006GE i7-10750H, GeForce GTX 1050 Mobile | 2.2 kg | 22.7 mm | 15.60" | 3840x2160 | |
| 85.3 % v7 (old) | 06/2021 | Lenovo ThinkPad P15s Gen2-20W6000GGE i7-1165G7, T500 Laptop GPU | 1.9 kg | 19.1 mm | 15.60" | 3840x2160 | |
| 87.7 % v7 (old) | 07/2022 | HP ZBook Power 15 G8 313S5EA i7-11800H, T600 Laptop GPU | 2 kg | 22.8 mm | 15.60" | 1920x1080 | |
| 88.3 % v7 (old) | 10/2021 | Dell Precision 5000 5560 i7-11850H, RTX A2000 Laptop GPU | 2 kg | 18 mm | 15.60" | 3840x2400 |
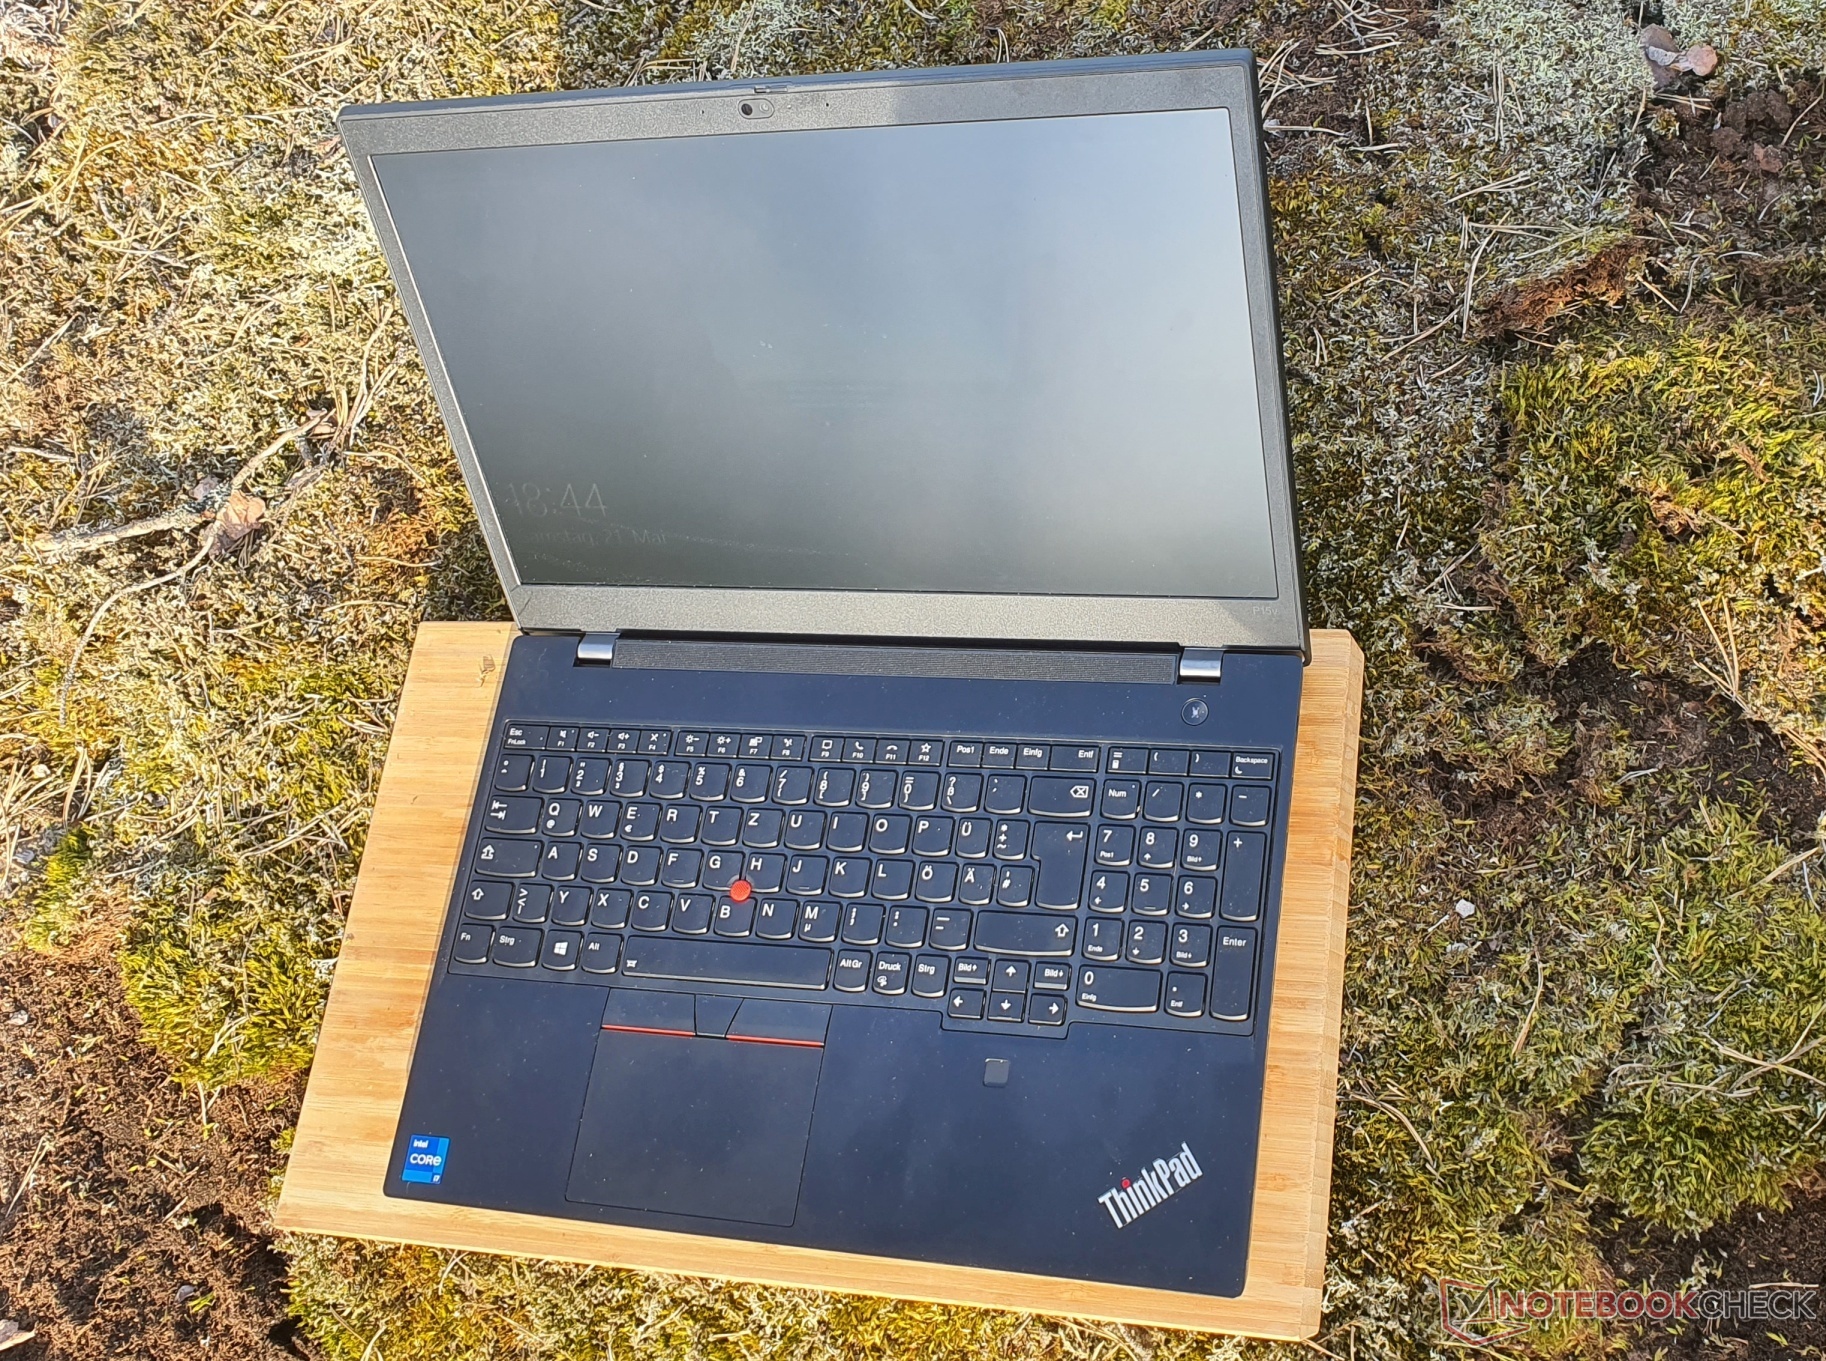
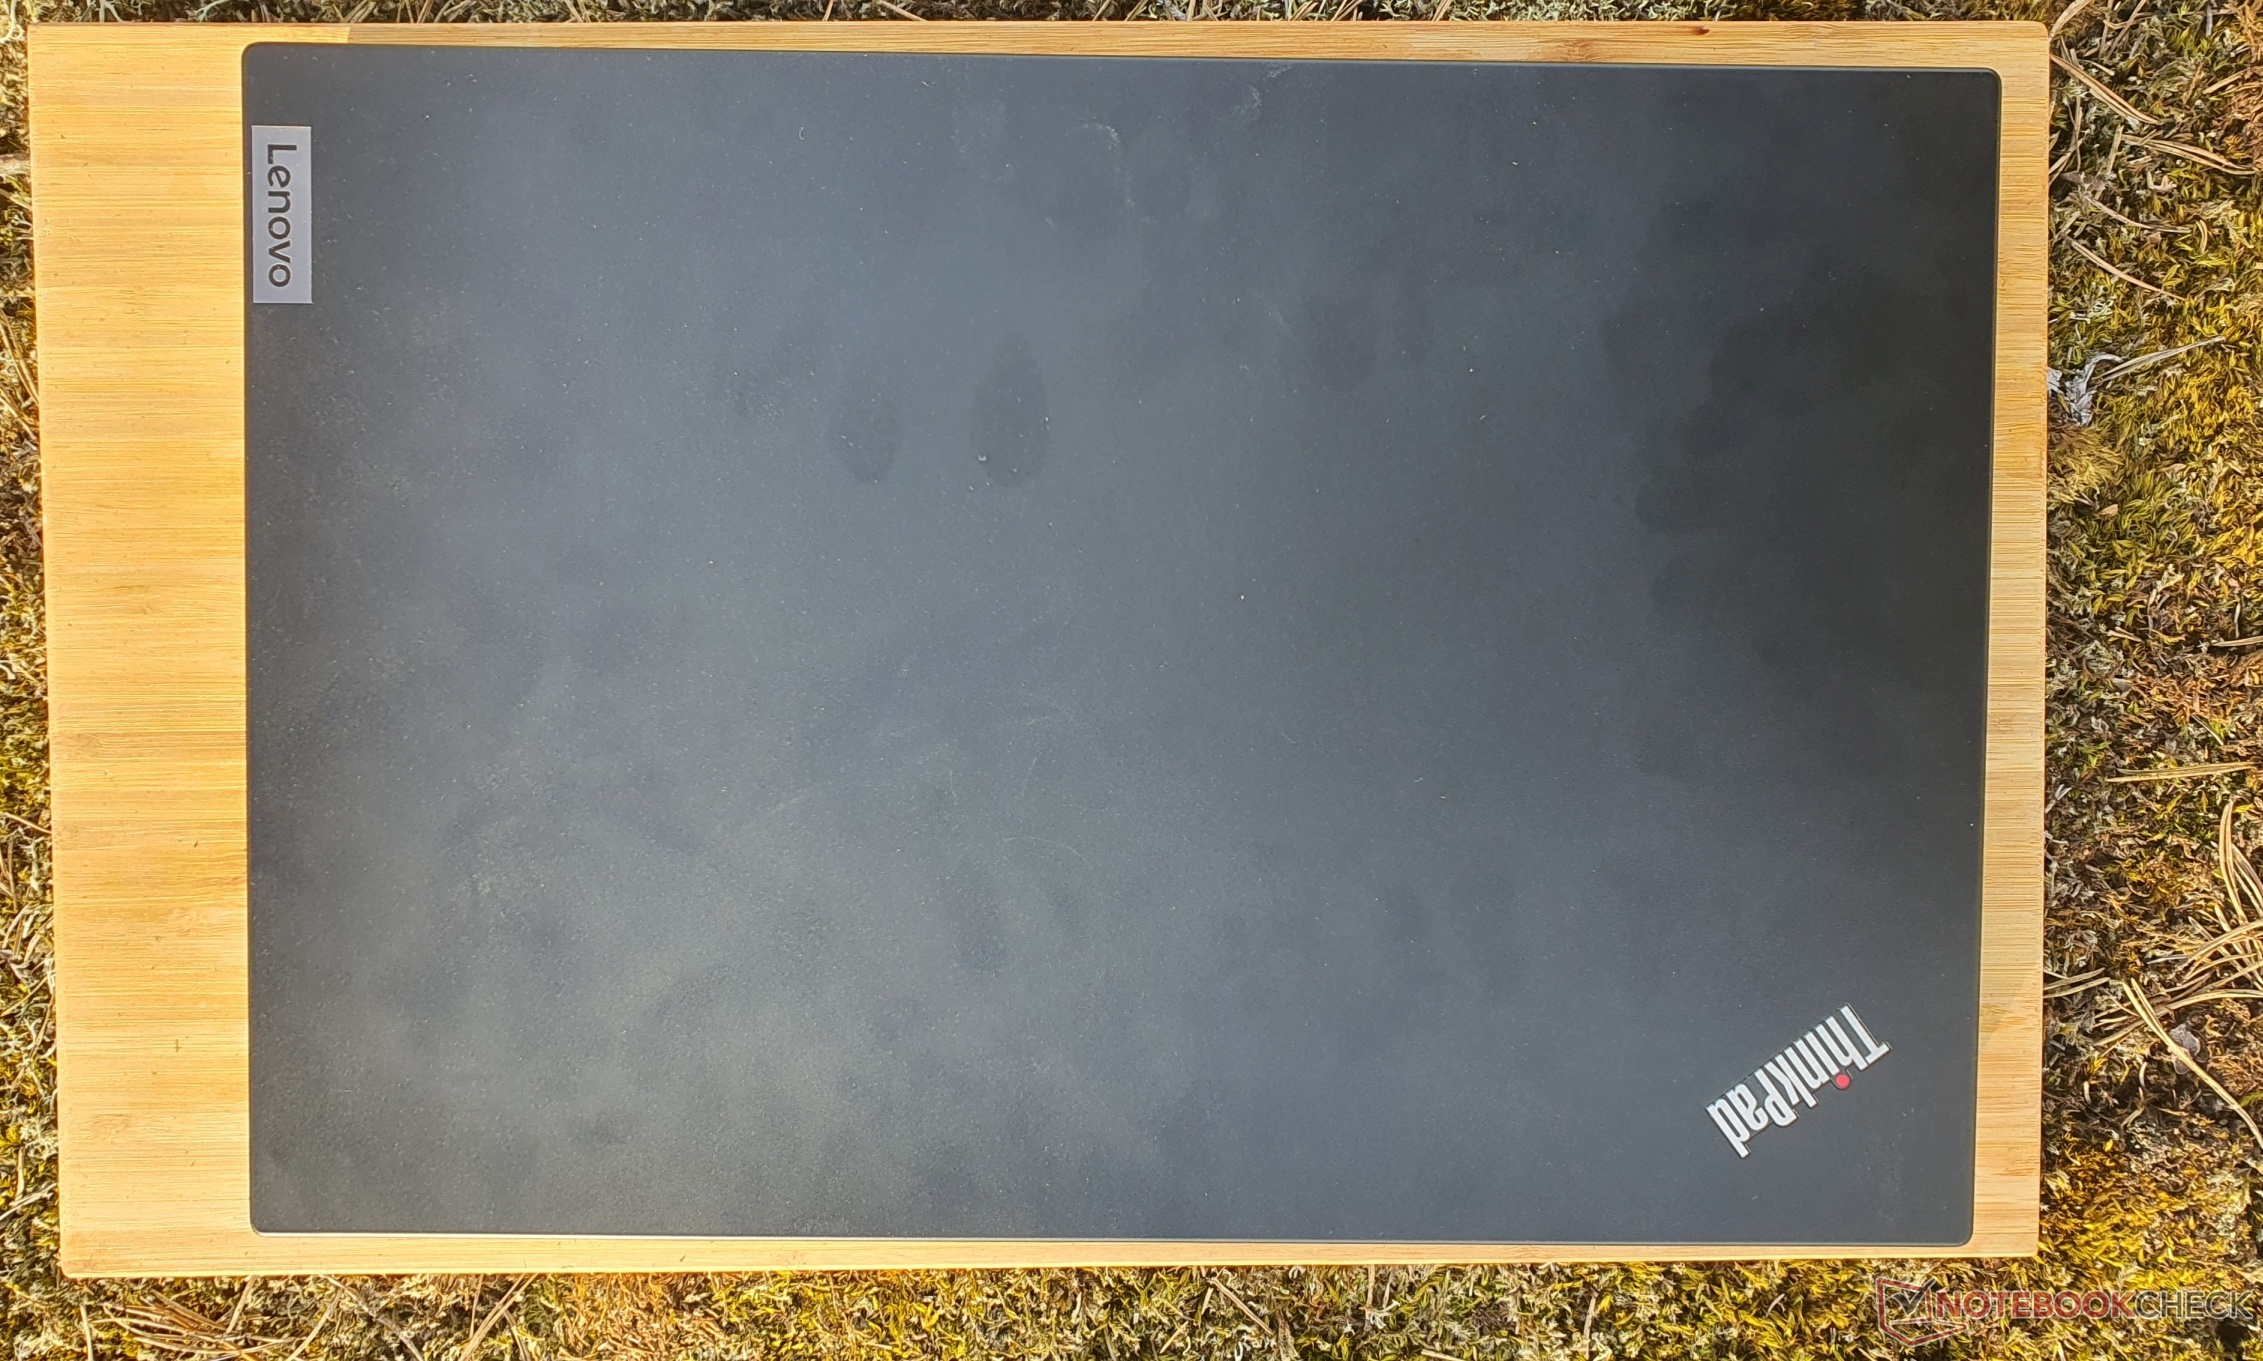
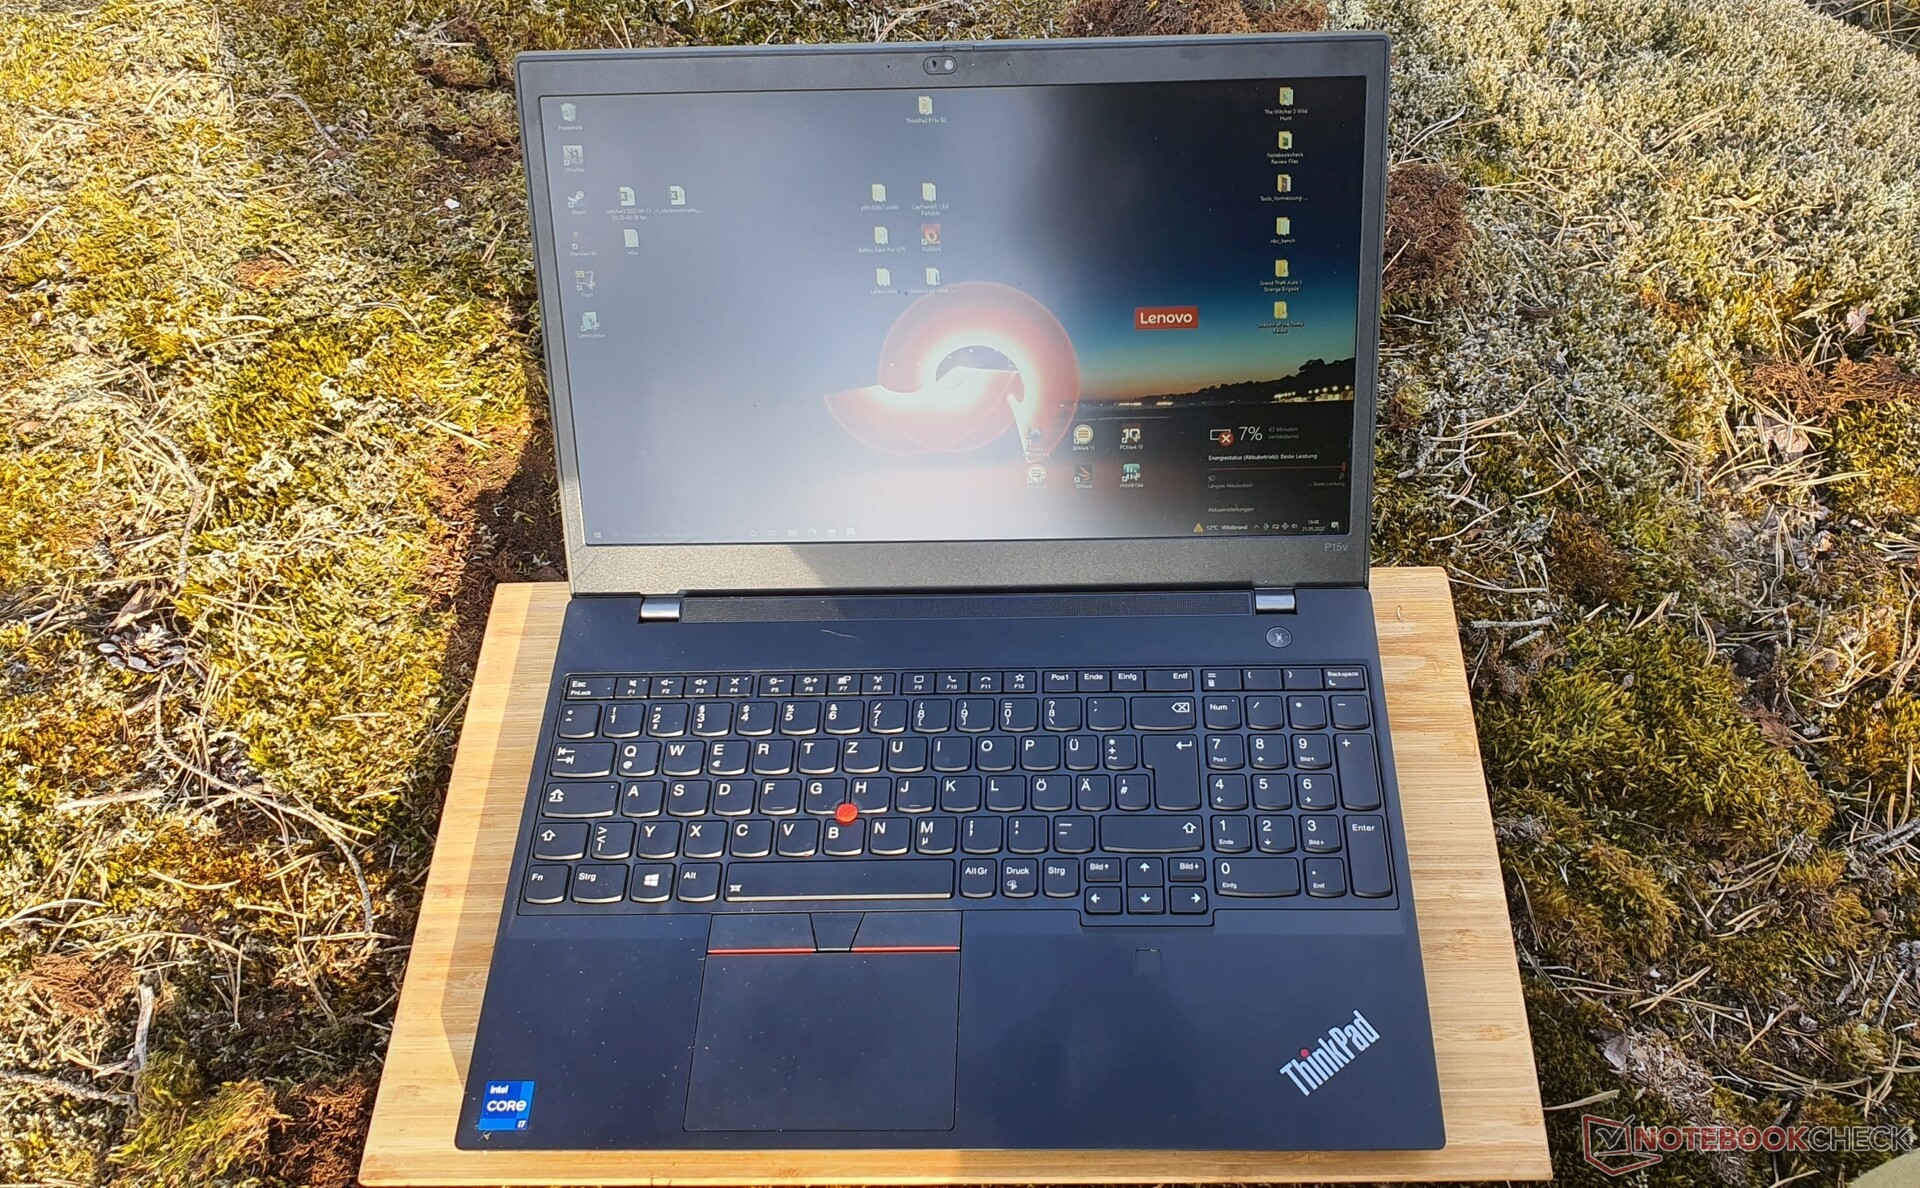
Custodia: plastica stabile per il ThinkPad opaco
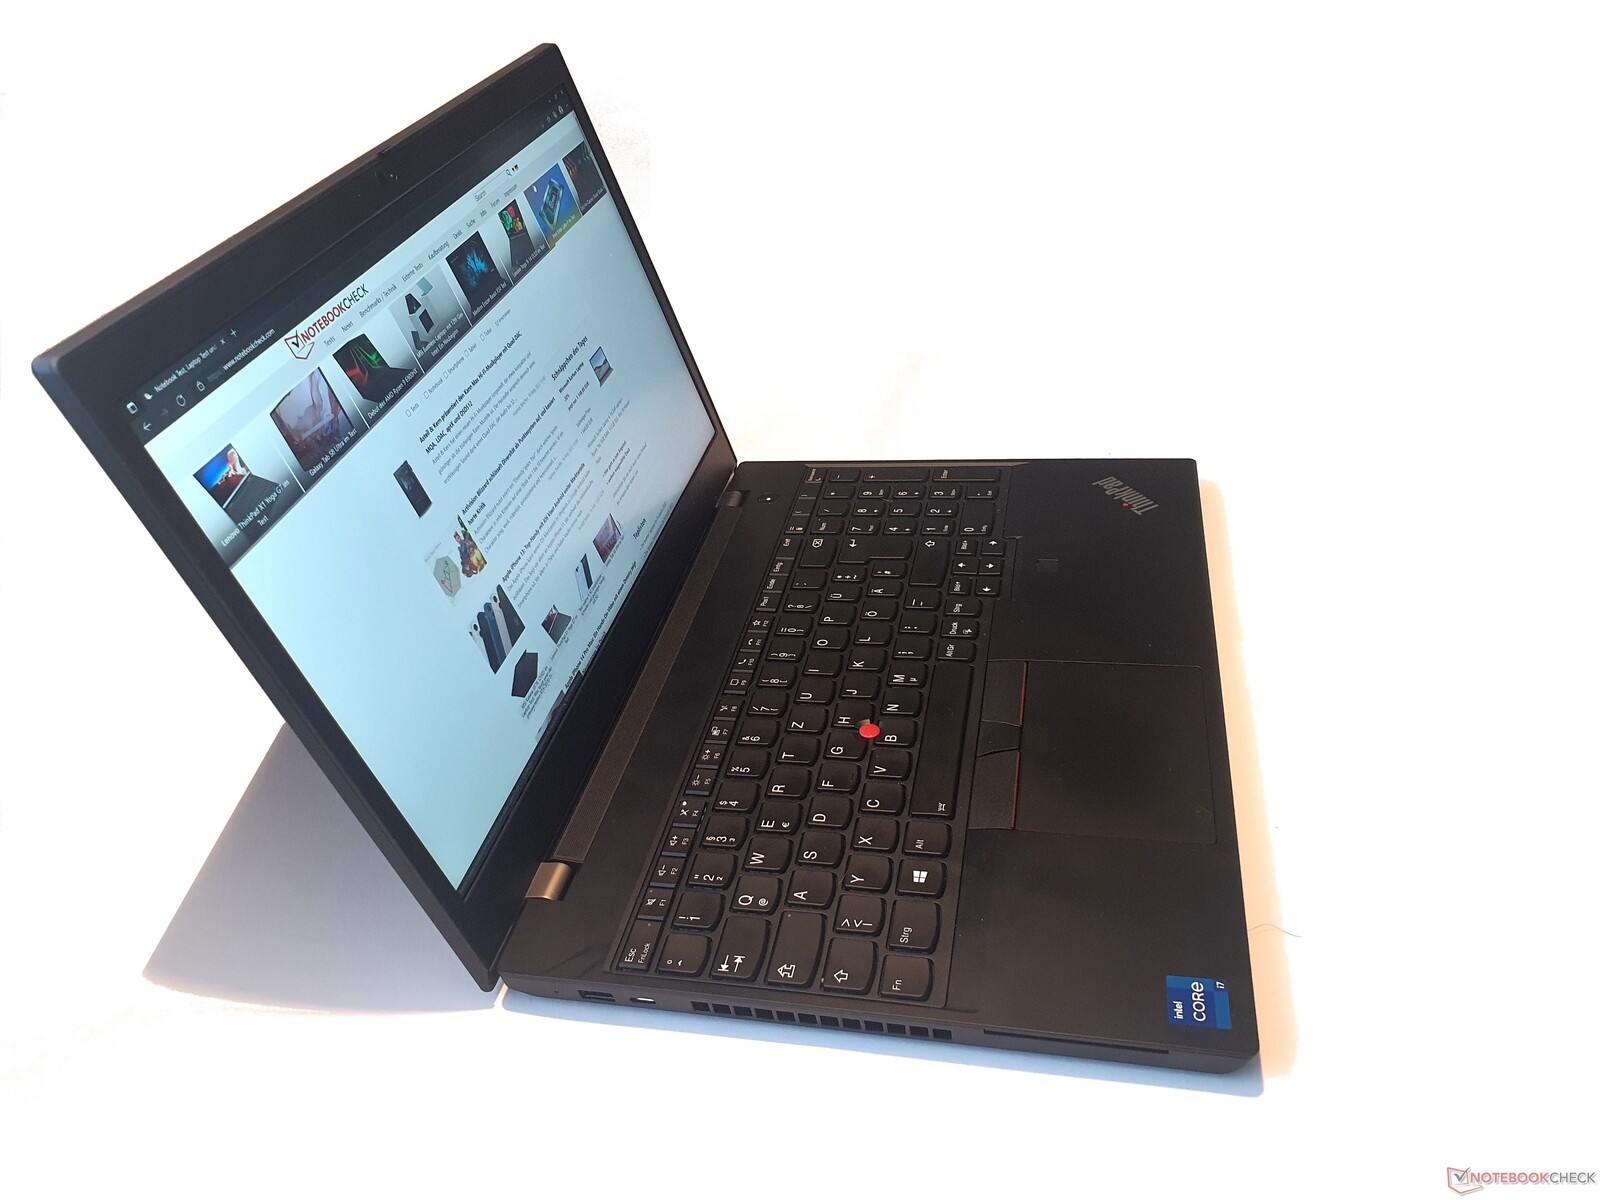
Il case del ThinkPad P15v sembra simile a quello delThinkPad P15sma è più alto (di circa 3,6 mm) e più pesante (360 grammi). Il coperchio è anche notevolmente più spesso e offre una maggiore resistenza alla torsione, ma si può comunque torcere sensibilmente.
Lo stesso case del ThinkPad T15p che significa plastica ABS stabile e opaca, ma senza i rinforzi in fibra di vetro del P15. Mancano anche i rivestimenti in gomma piacevoli alla vista, il che rende la parte inferiore molto ruvida come quella dei ThinkPad economici come l'L15p.L15o il ThinkPad R500 del lontano passato.
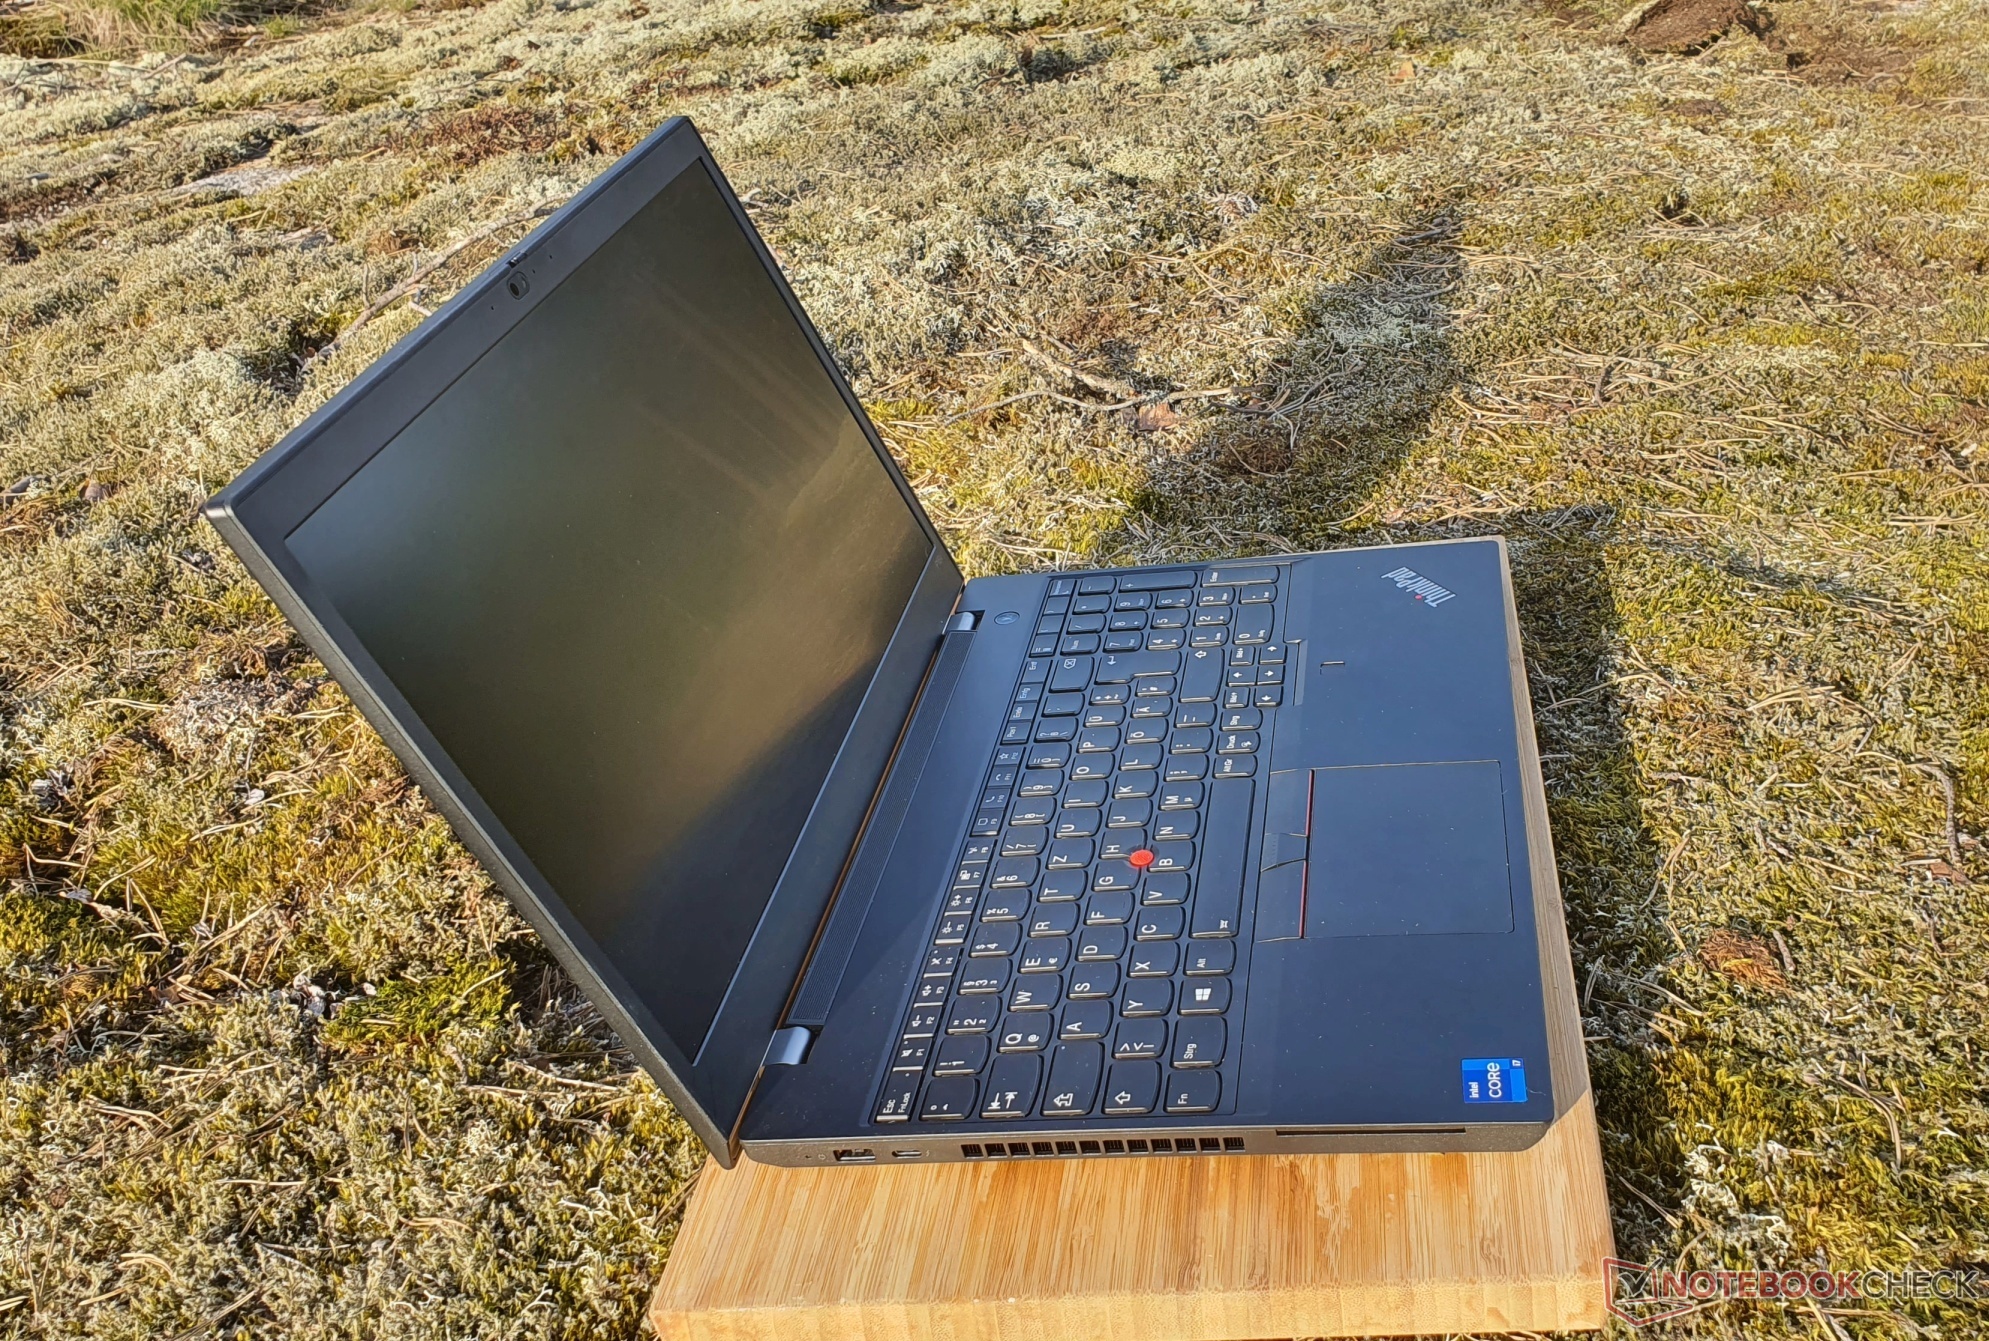
Non ci sono difetti di lavorazione e la stabilità è di alto livello. L'unità di base rinforzata in magnesio non può essere attorcigliata in alcun modo e l'unità tastiera cede solo leggermente al centro quando si applica una pressione mirata. Le cerniere sono molto rigide, ma consentono comunque l'apertura con una sola mano fino a un angolo di 180°. Purtroppo, il ThinkPad è una calamita per le impronte digitali.
Grazie alle schede grafiche più potenti e ai sistemi di raffreddamento più potenti, i ThinkPad P15 e T15g sono notebook workstation significativamente più spessi, con circa 31,5 mm rispetto al "sottile" e quindi più leggero P15v da 22,7 mm, con una differenza di peso di 600 grammi
Secondo la s-suffix (slim), il ThinkPad P15s è ancora più sottile e leggero. Precision 5560 di Dellrimane imbattibile con i suoi 14 pollici, mentre lo ZBook Power 15 di HP ha dimensioni simili al ThinkPad P15v, ma è più leggero di quasi 300 grammi, con un peso di 1,97 kg.
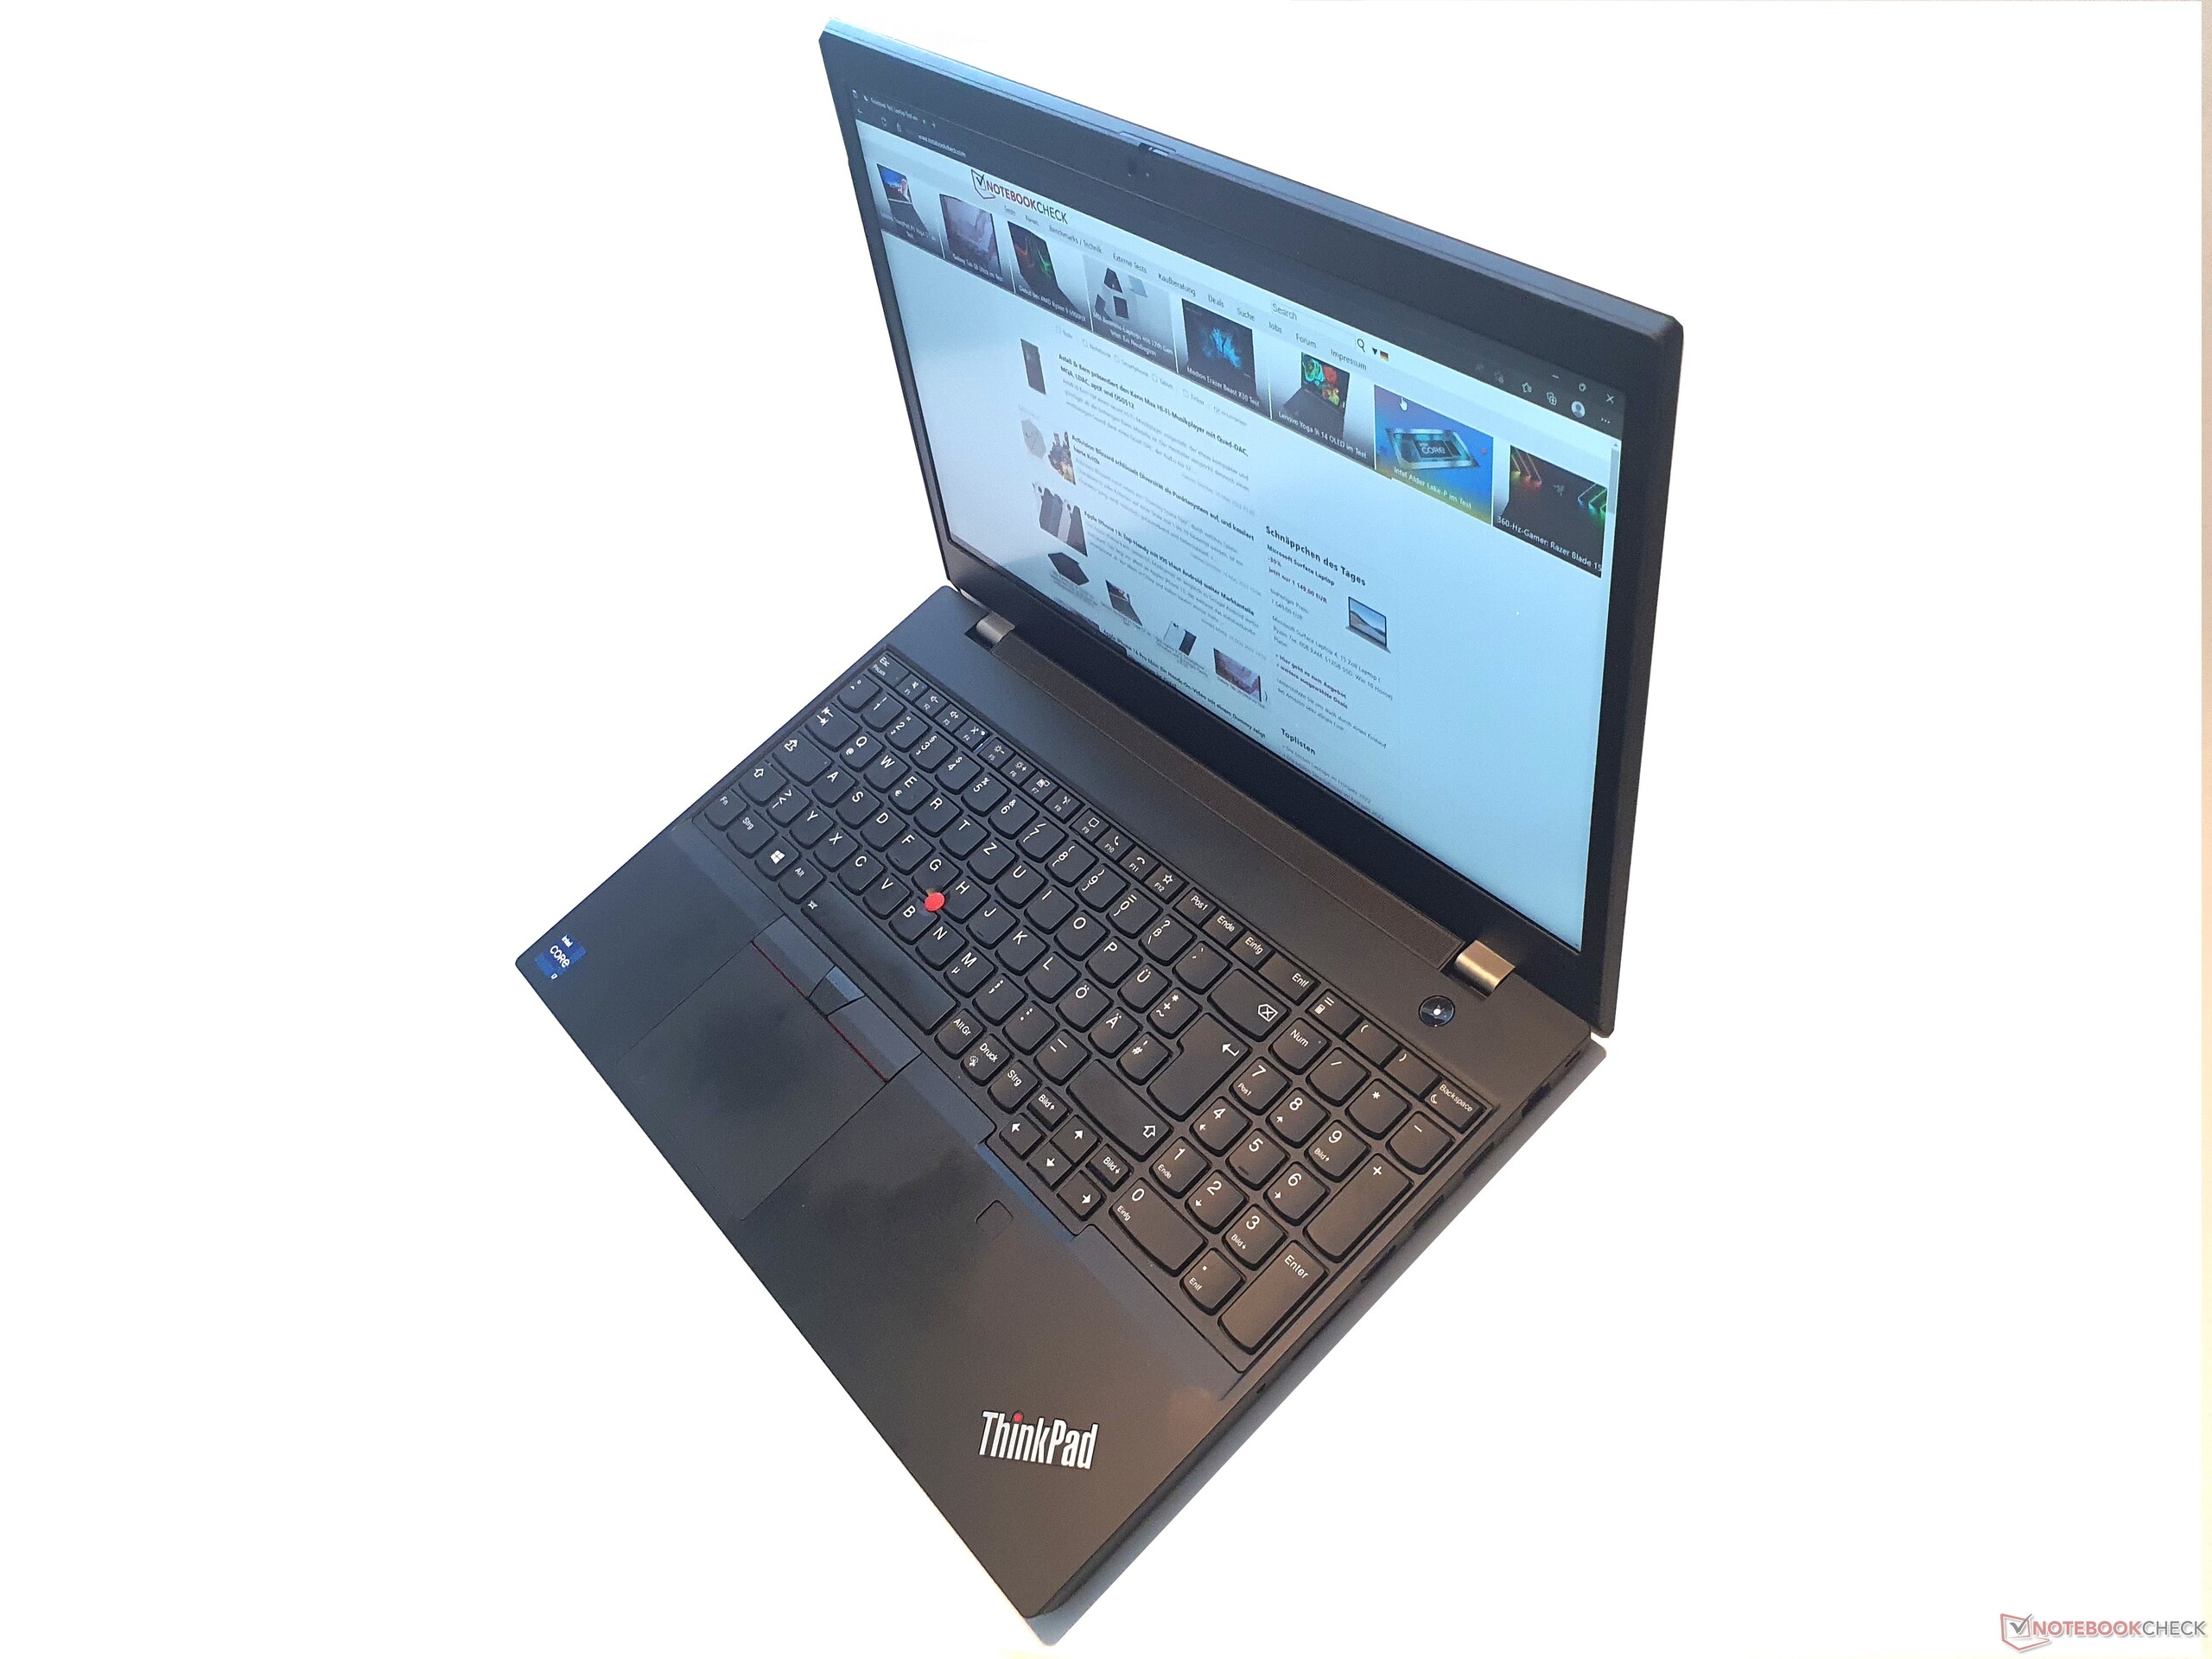
Connettività: Lenovo con Wi-Fi 6 fisso e lettore di schede SD
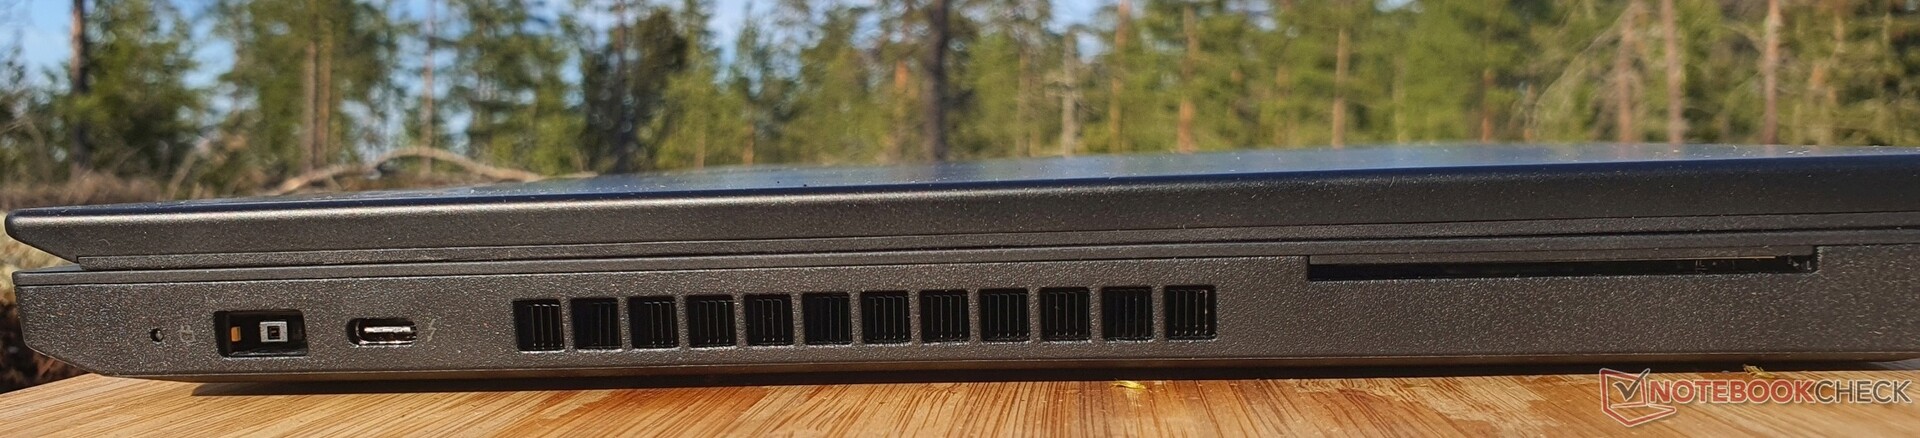
Il ThinkPad P15v G2 offre molte porte: sul lato sinistro si trova la porta di ricarica proprietaria a punta sottile e una porta Thunderbolt 4, che purtroppo non supporta la ricarica. Inoltre, sono presenti un lettore di smart card e slot di ventilazione, in modo che il calore residuo non rappresenti un problema quando si utilizza il mouse sul lato destro
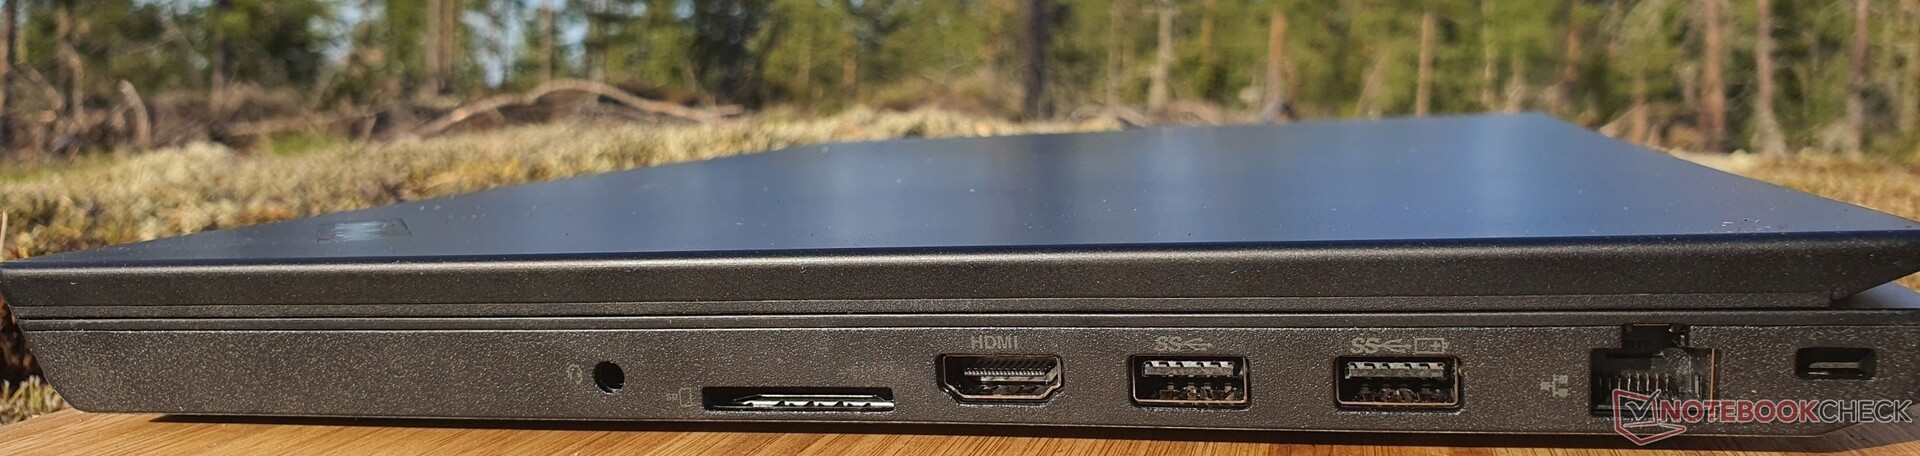
Le caratteristiche del lato destro includono due porte USB-A 3.2 Gen1 (Always On), HDMI 2.0, GBit Ethernet e un lettore di schede SD a grandezza naturale, che non sono più presenti nei ThinkPad puramente business come il P15. I modelli con WWAN dispongono di uno slot per schede SIM sul retro del dispositivo che funge da slot per schede µSD se non è stata configurata la WWAN.
Lettore di schede SD
Per quanto riguarda le velocità di lettura di file da 1 GB, il ThinkPad P15v G2 si colloca al primo posto nella sua categoria. Nel test di copia, tuttavia, si colloca ben al di sotto dei 200 MB/s del ThinkPad P15 e del ThinkPad G2 Dell Precision 5560 delle workstation Dell con circa 96 MB/s.
| SD Card Reader | |
| average JPG Copy Test (av. of 3 runs) | |
| Lenovo ThinkPad P15 G2-20YQ001JGE (AV Pro V60) | |
| Dell Precision 5000 5560 (AV Pro V60) | |
| Lenovo ThinkPad T15g-20UR000GGE (Toshiba Exceria Pro SDXC 64 GB UHS-II) | |
| Media della classe Workstation (49.6 - 681, n=14, ultimi 2 anni) | |
| Lenovo ThinkPad P15v G2 21A9000XGE | |
| Lenovo ThinkPad T15p-20TN0006GE (Toshiba Exceria Pro SDXC 64 GB UHS-II) | |
| Lenovo ThinkPad P15s Gen2-20W6000GGE (AV Pro V60) | |
| maximum AS SSD Seq Read Test (1GB) | |
| Lenovo ThinkPad P15v G2 21A9000XGE | |
| Media della classe Workstation (87.6 - 1455, n=14, ultimi 2 anni) | |
| Lenovo ThinkPad P15 G2-20YQ001JGE (AV Pro V60) | |
| Lenovo ThinkPad T15g-20UR000GGE (Toshiba Exceria Pro SDXC 64 GB UHS-II) | |
| Dell Precision 5000 5560 (AV Pro V60) | |
| Lenovo ThinkPad T15p-20TN0006GE (Toshiba Exceria Pro SDXC 64 GB UHS-II) | |
| Lenovo ThinkPad P15s Gen2-20W6000GGE (AV Pro V60) | |
Comunicazione
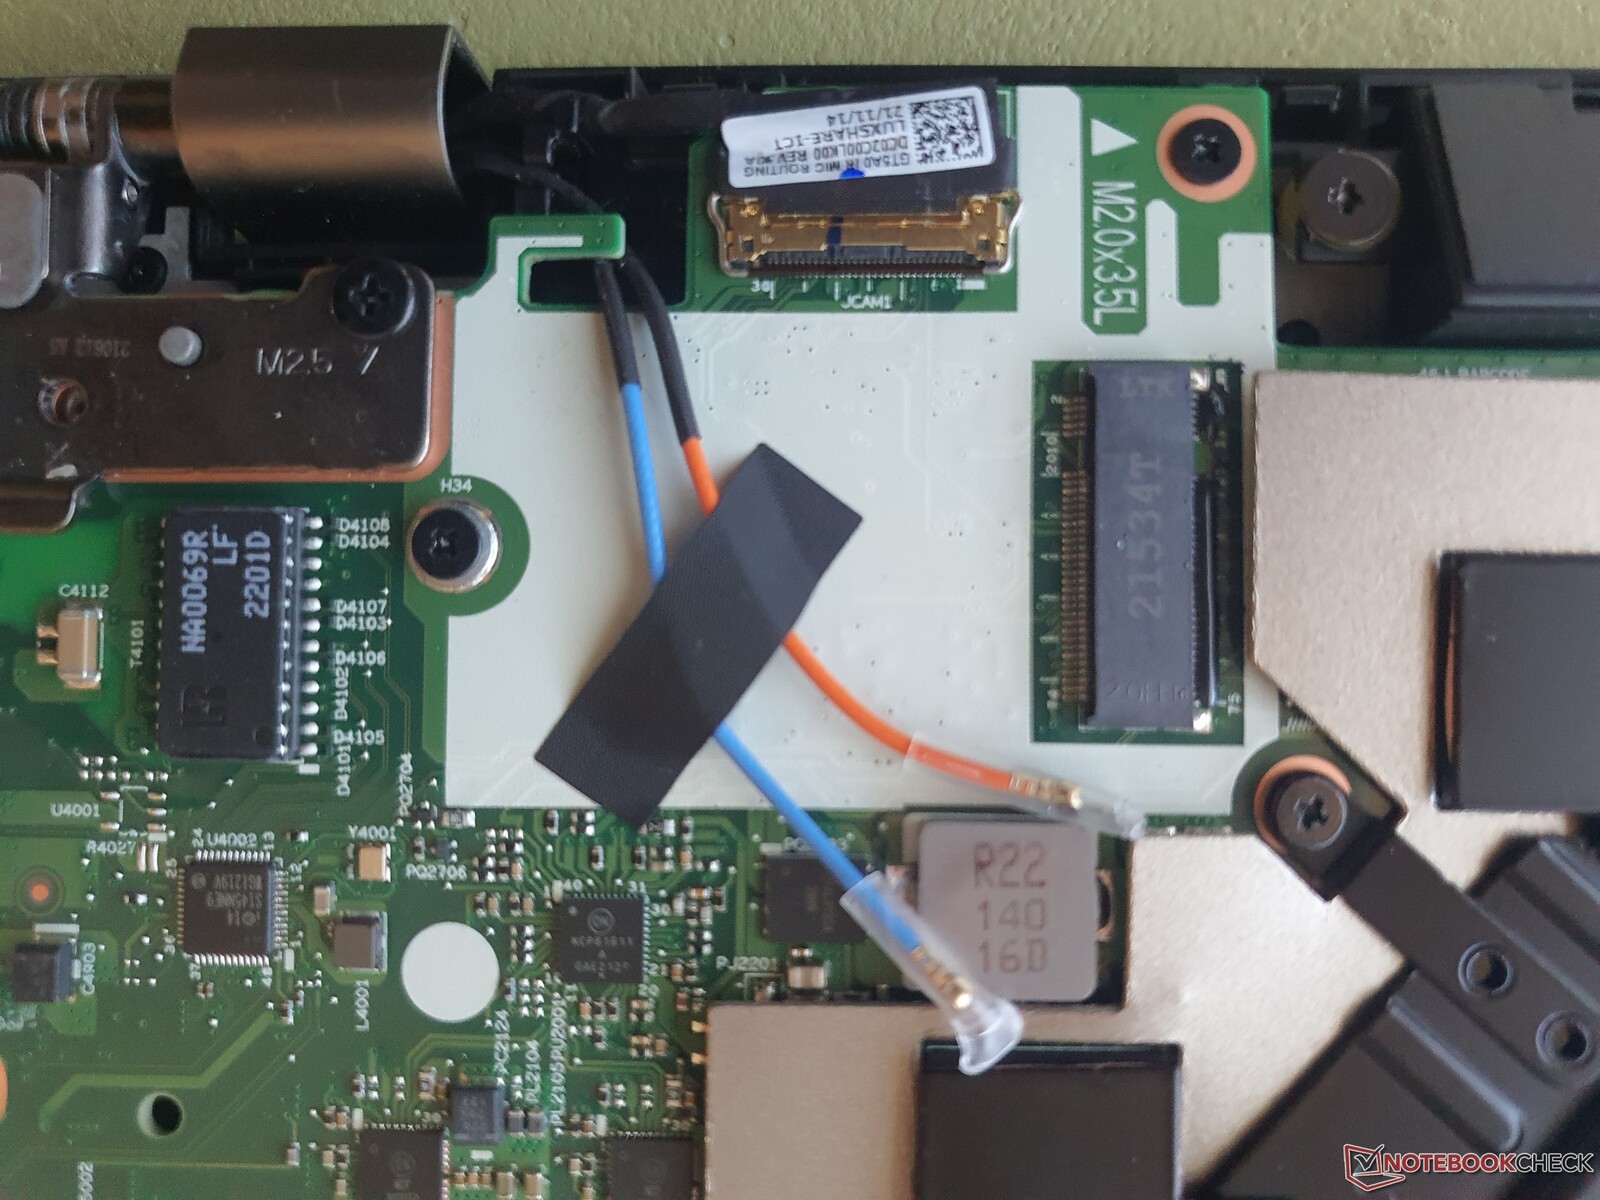
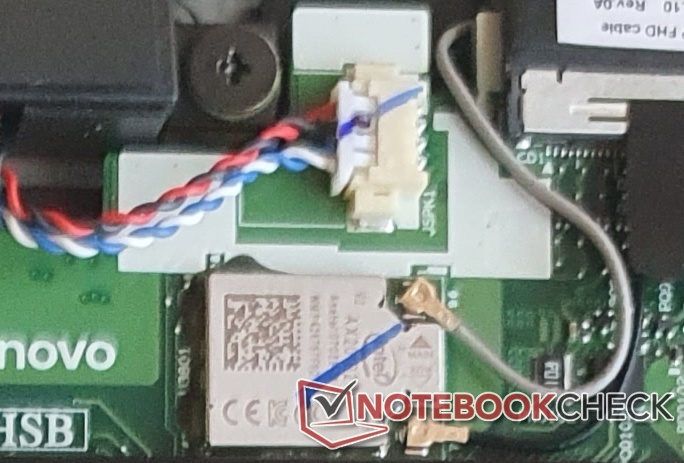
È disponibile la rete Ethernet RJ45 (1 GBit/s). È presente anche il Wi-Fi 6 AX201 di Intel (installato in modo permanente), che consente al ThinkPad P15v G2 di trasferire i dati di rete dieci volte più velocemente rispetto al cavo, un livello elevato rispetto alla concorrenza. Uno slot M.2 esistente (e i relativi cavi dell'antenna) consente l'installazione di una scheda WWAN, che può essere ordinata anche preinstallata
Webcam

Sebbene la fotocamera offra solo un pessimo 720p, le qualità del modello dell'utente sono visibili.


Sicurezza
I laptop business puri come il ThinkPad P15v offrono numerose funzioni di sicurezza come il lettore di smart card, il lettore di impronte digitali nel palm rest, il lucchetto di sicurezza Kensington, il TPM 2.0 e la fotocamera a infrarossi per Windows Hello con ThinkShutter (otturatore della webcam) integrato.
Accessori
Al di fuori dell'alimentatore sottile da 135 watt, piuttosto compatto, non sono inclusi accessori al momento dell'acquisto. È stata omessa anche una porta docking esplicita e mancano le soluzioni Thunderbolt a causa dell'impossibilità di ricarica tramite USB-C. È possibile utilizzare solo una speciale variante di docking che combina la porta di ricarica proprietaria con Thunderbolt: il ThinkPad Thunderbolt 3 Workstation Dock Gen 2 dihttps://support.lenovo.com/de/de/solutions/pd500333-thinkpad-thunderbolt-3-workstation-dock-gen-2-overview-and-service-parts.
La confezione di Lenovo non può essere definita ecologica, anche se l'imballaggio e la scatola sono molto semplici.
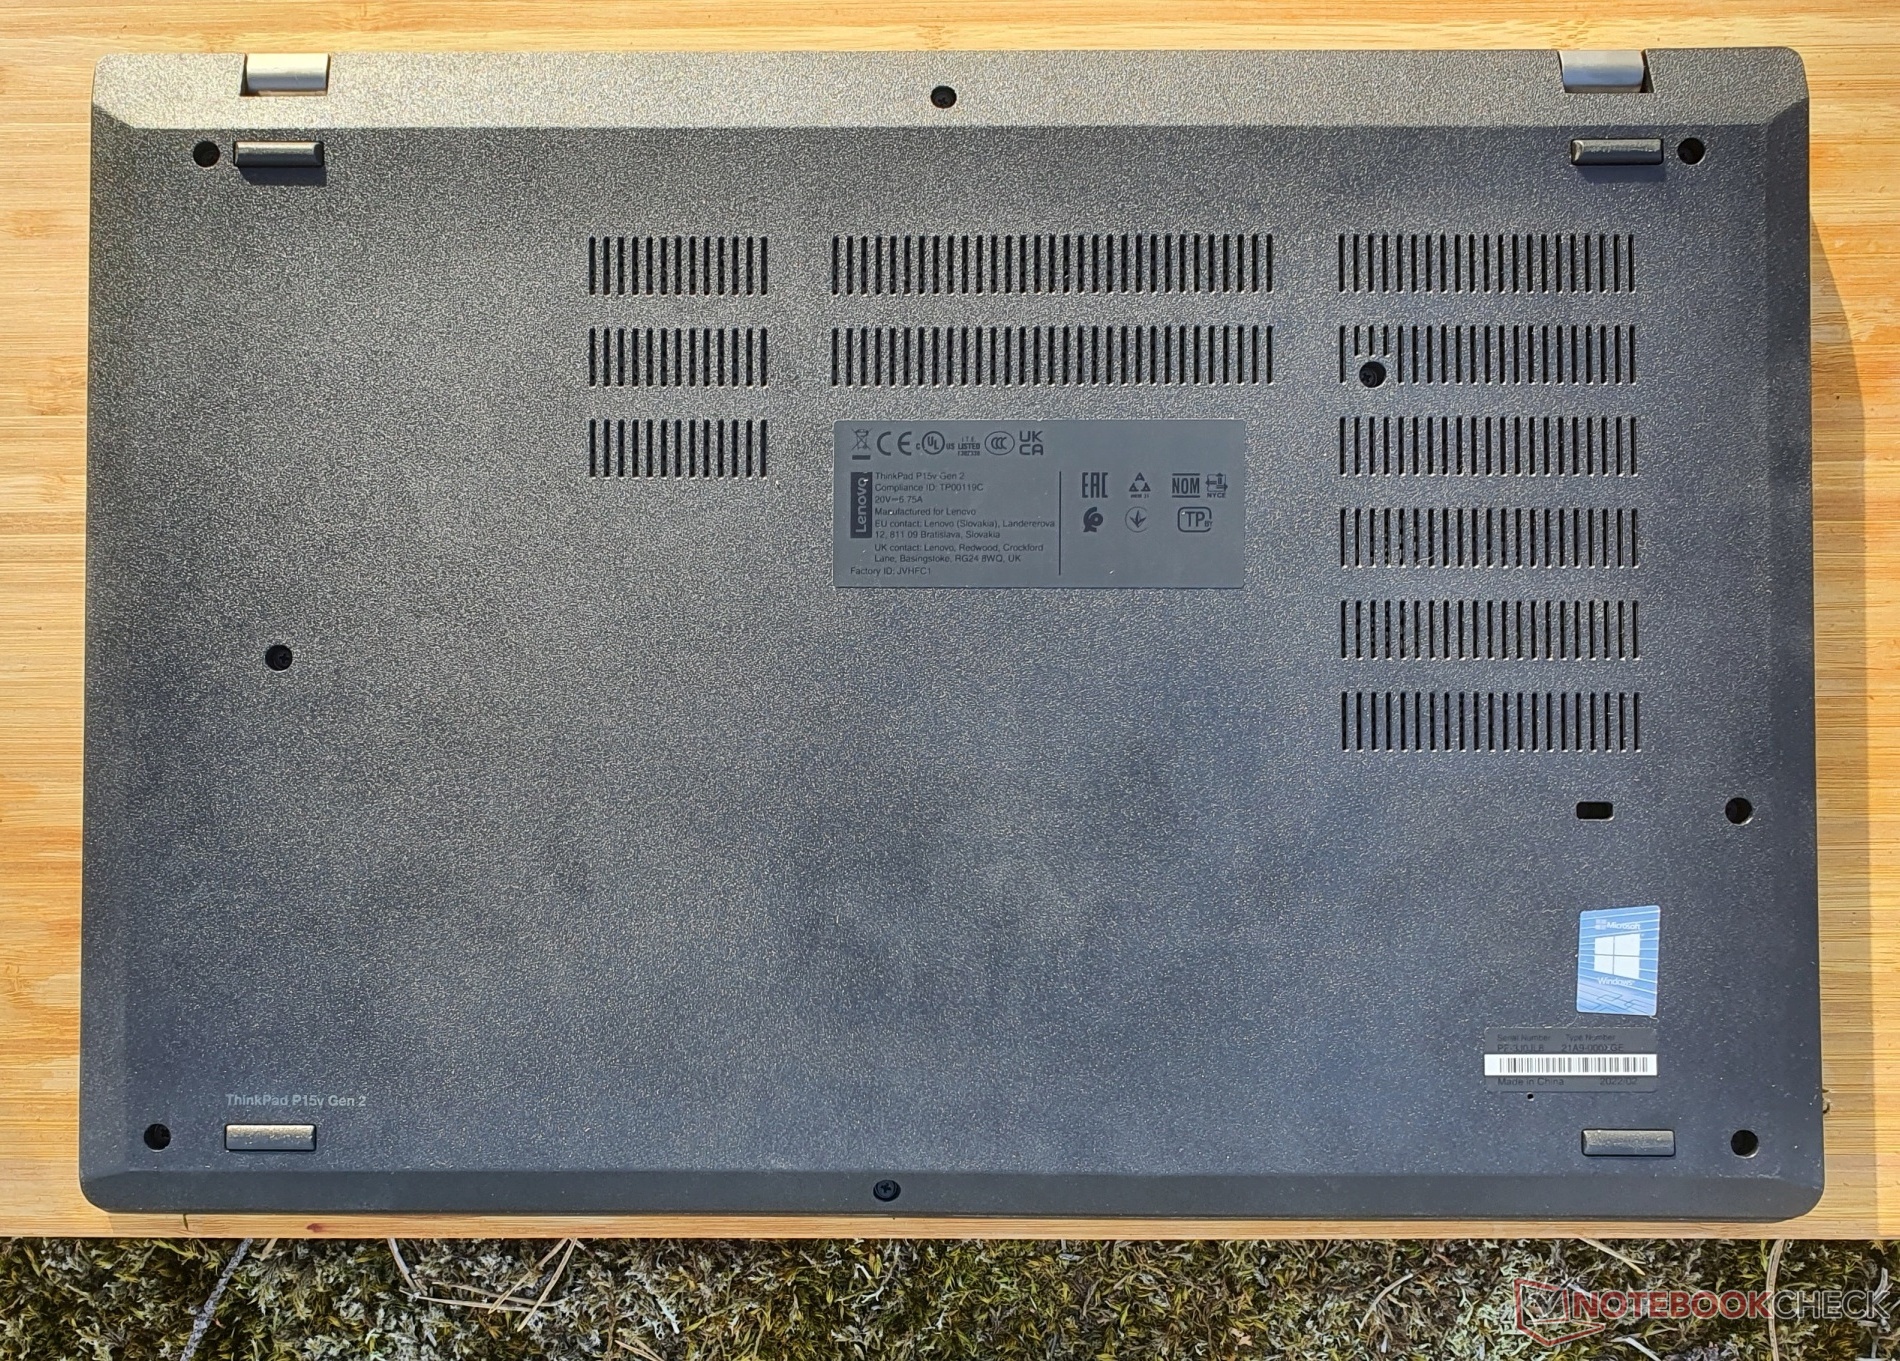
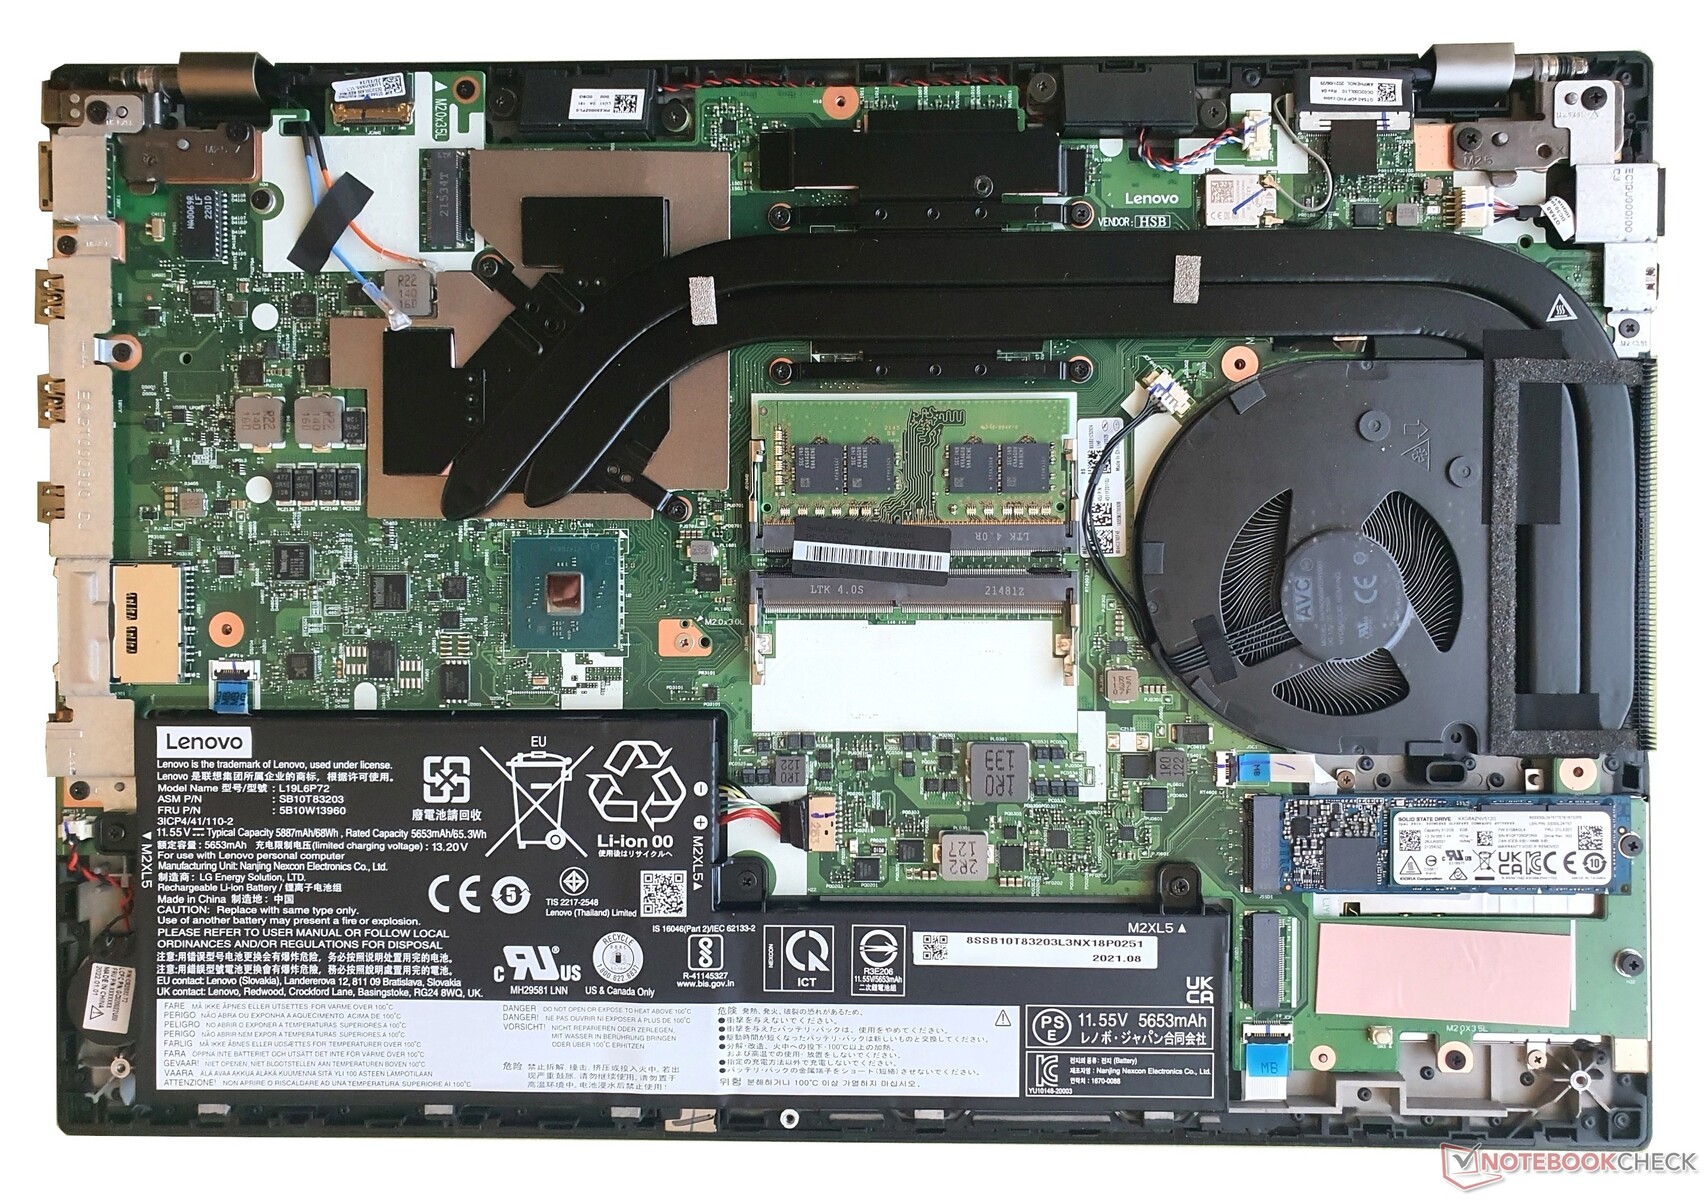
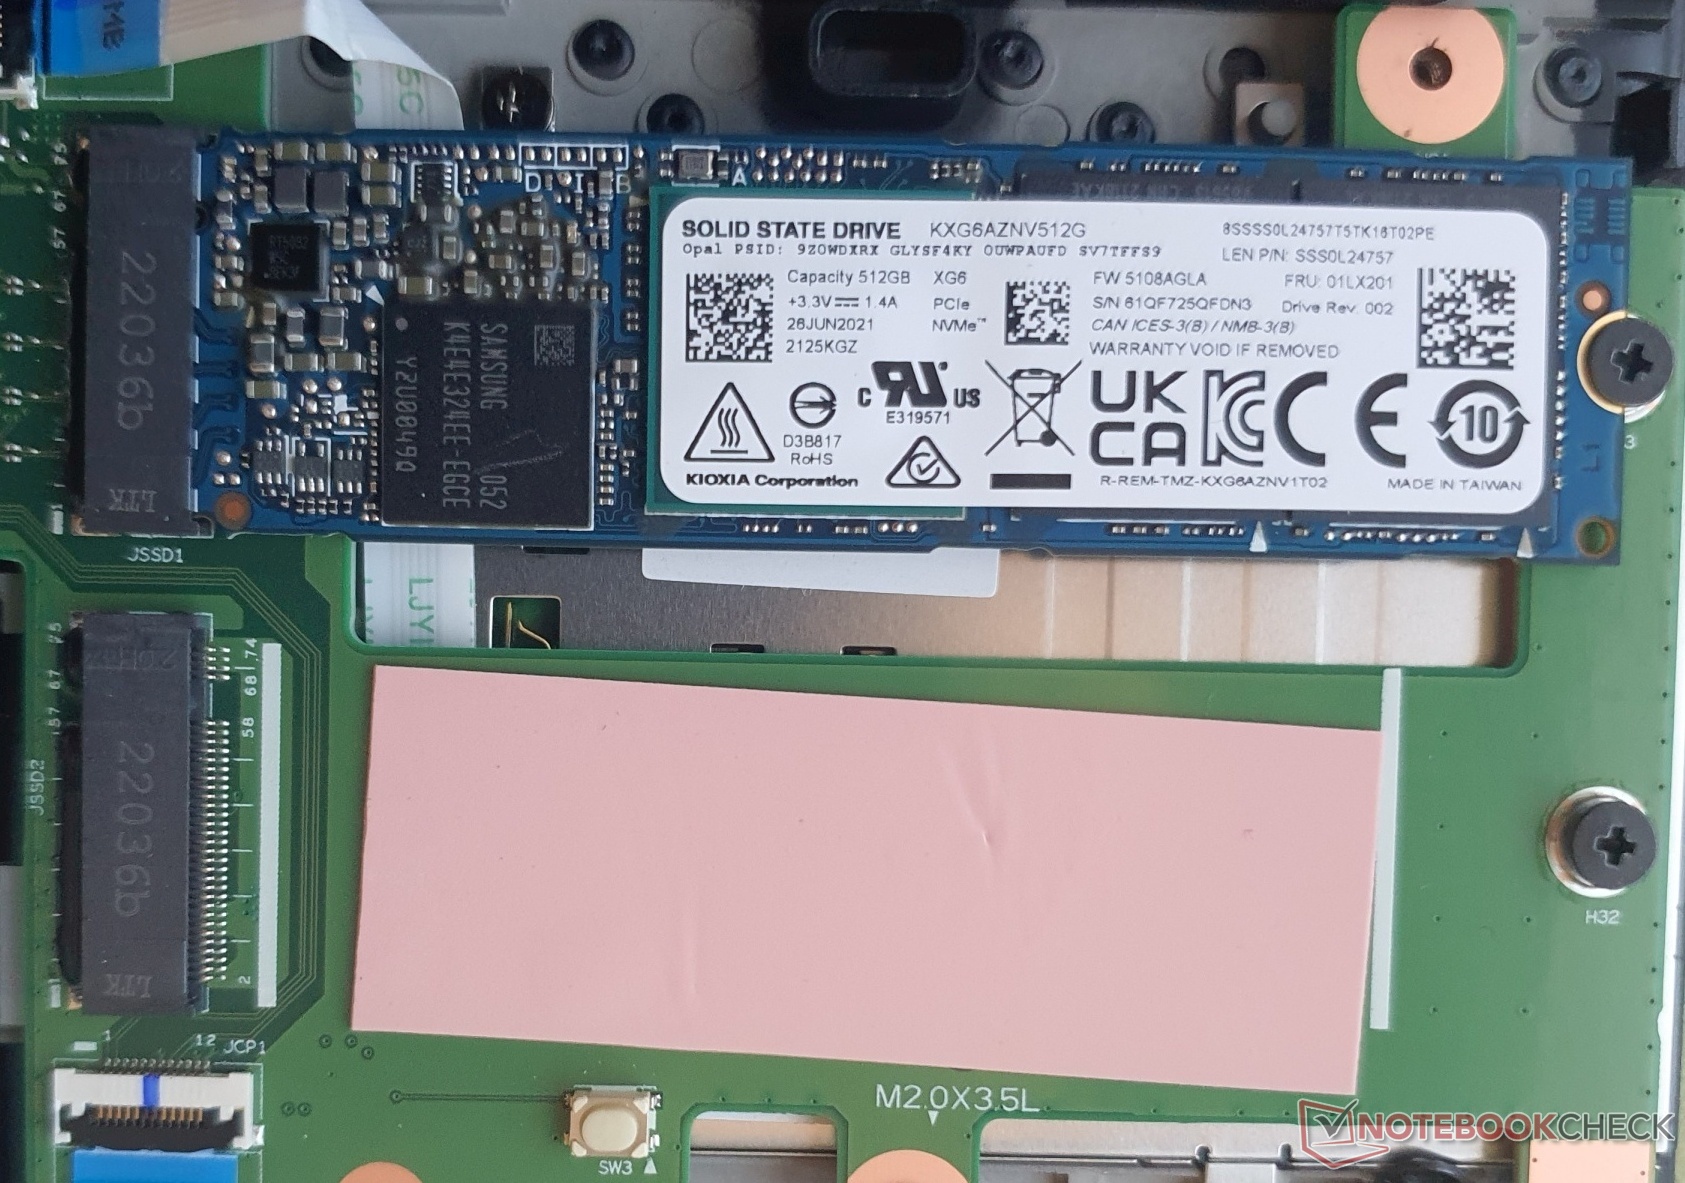
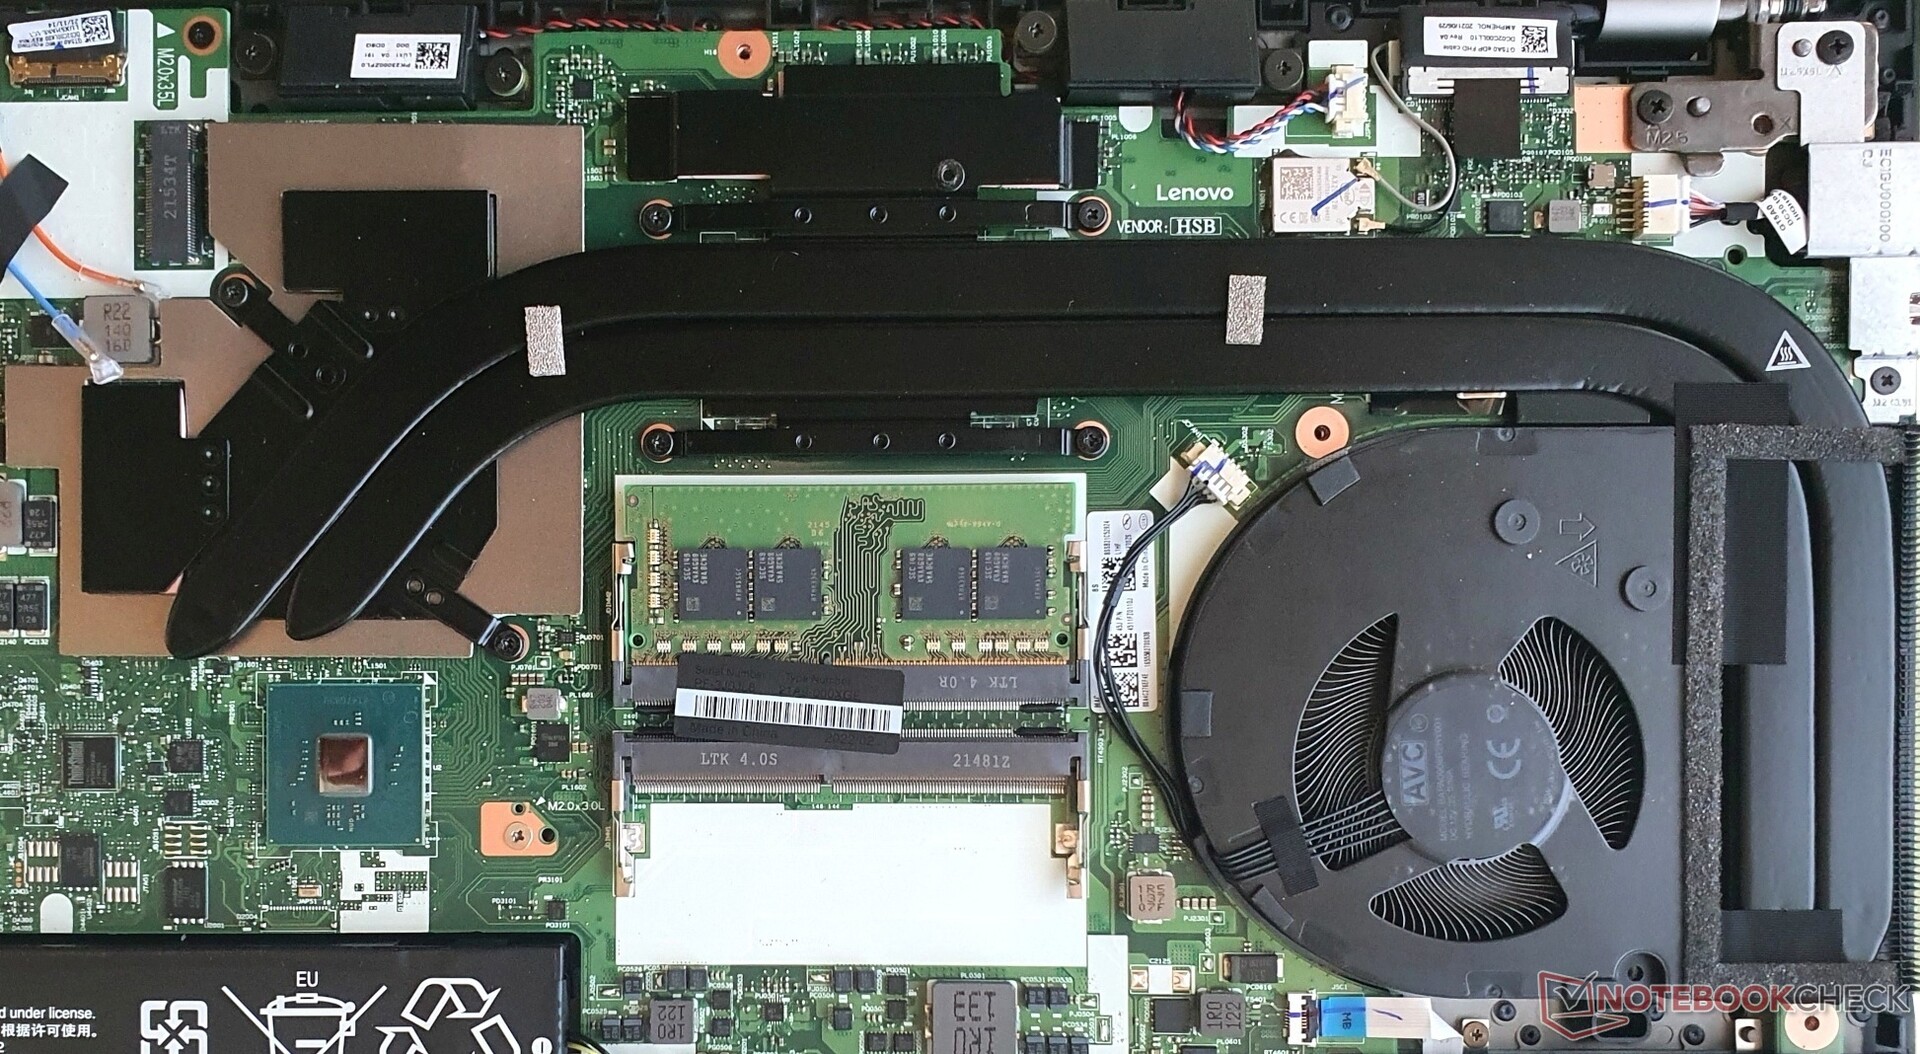
Manutenzione
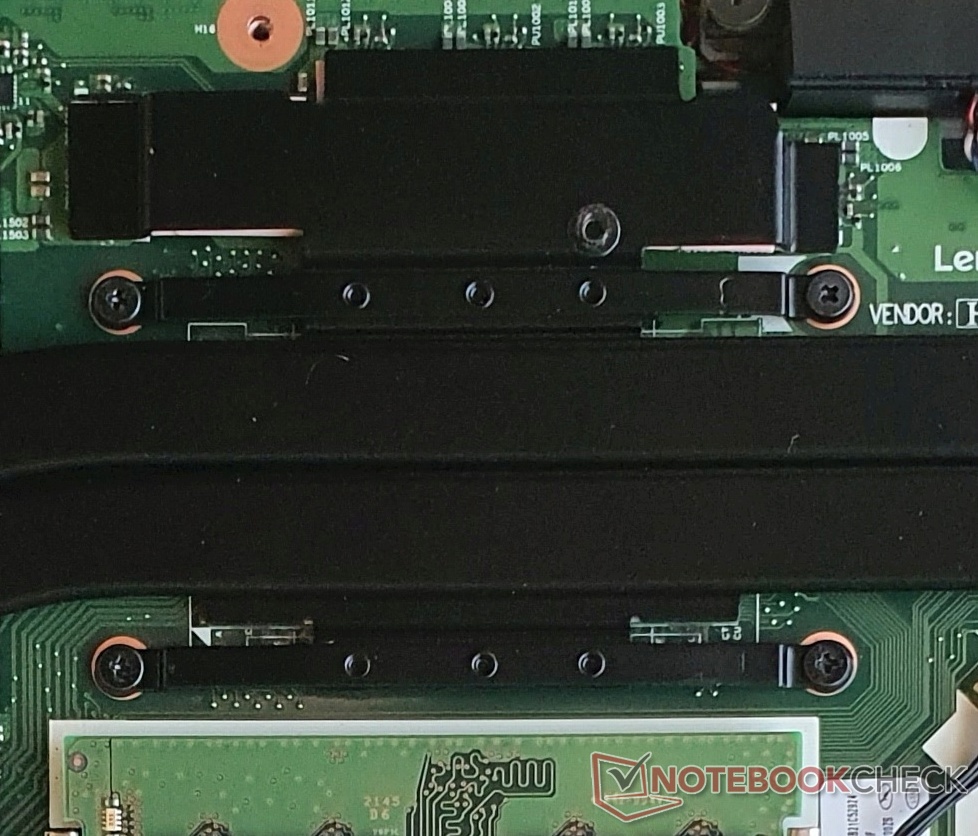
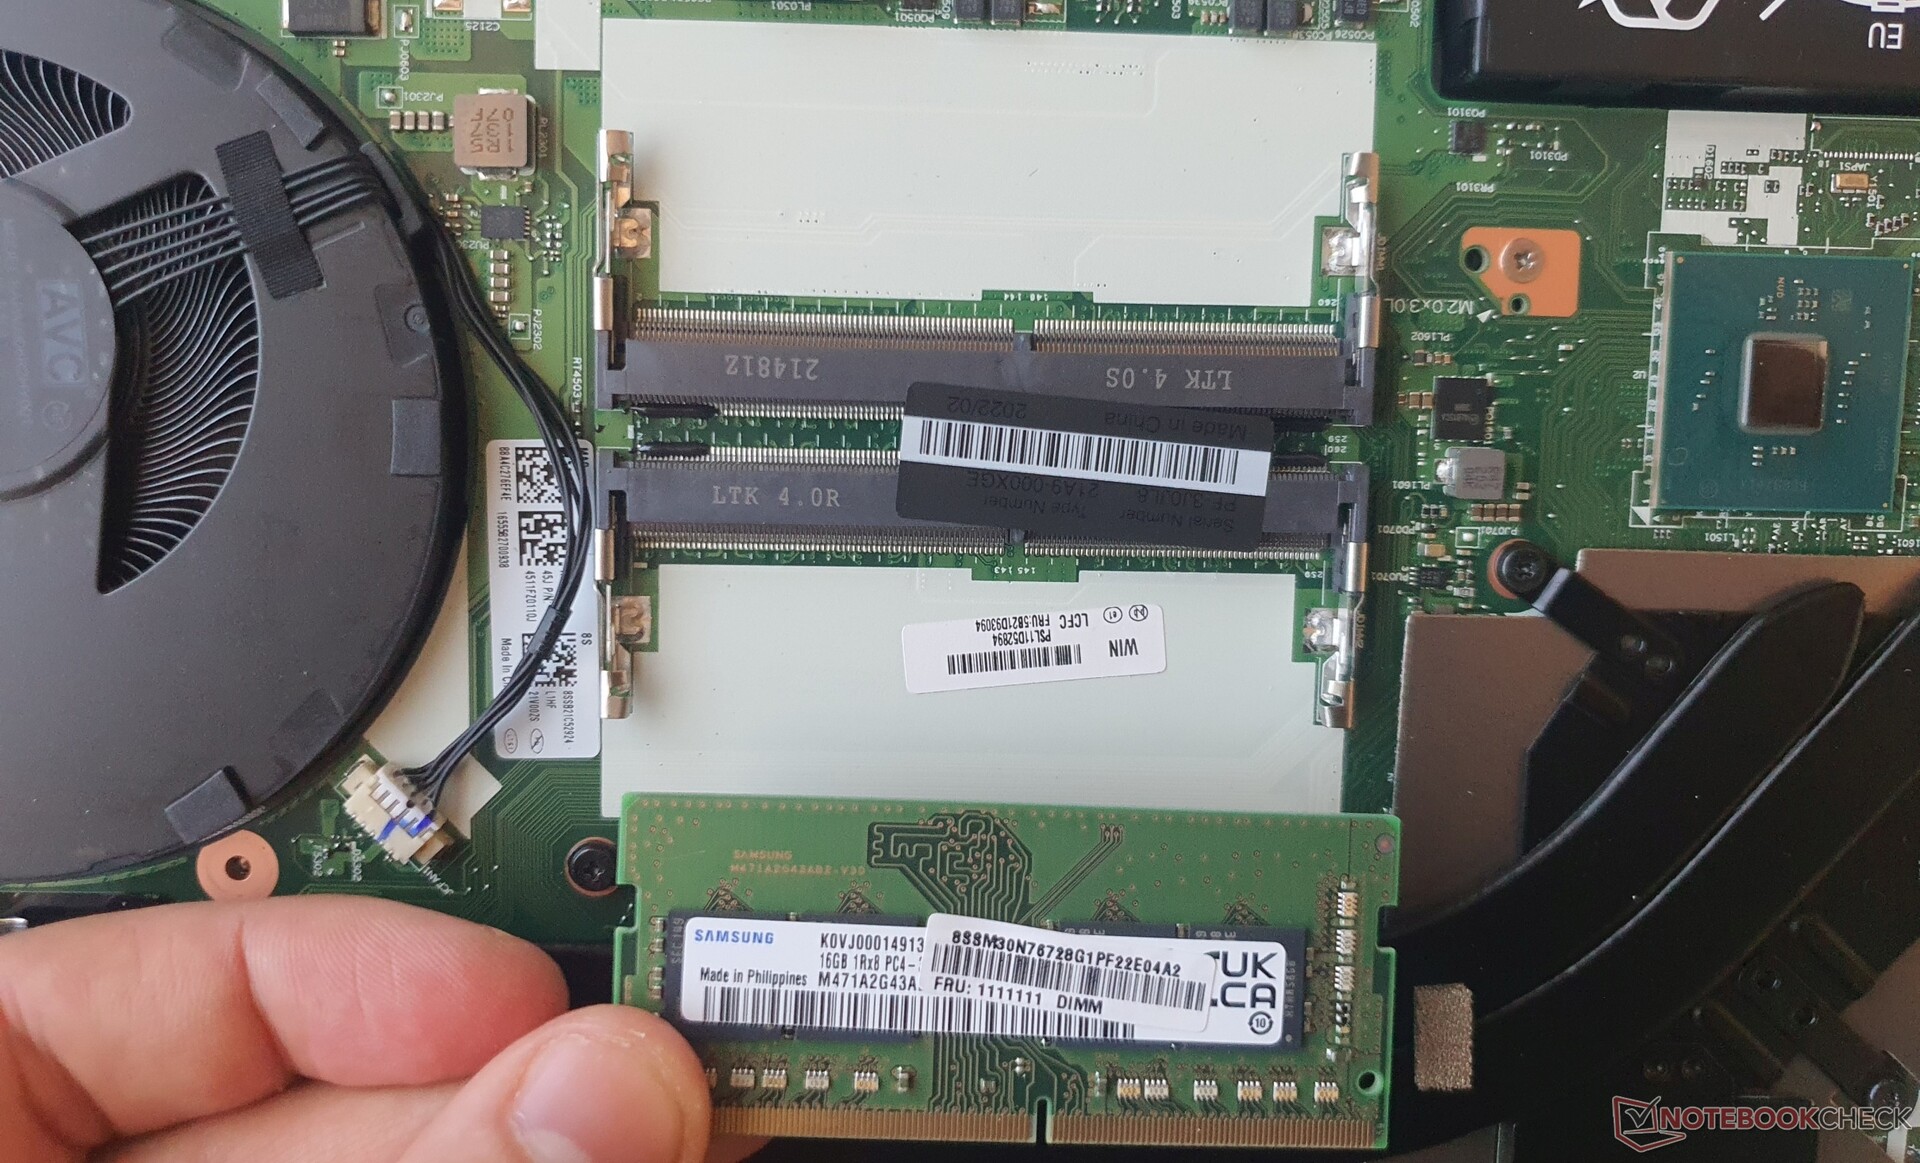
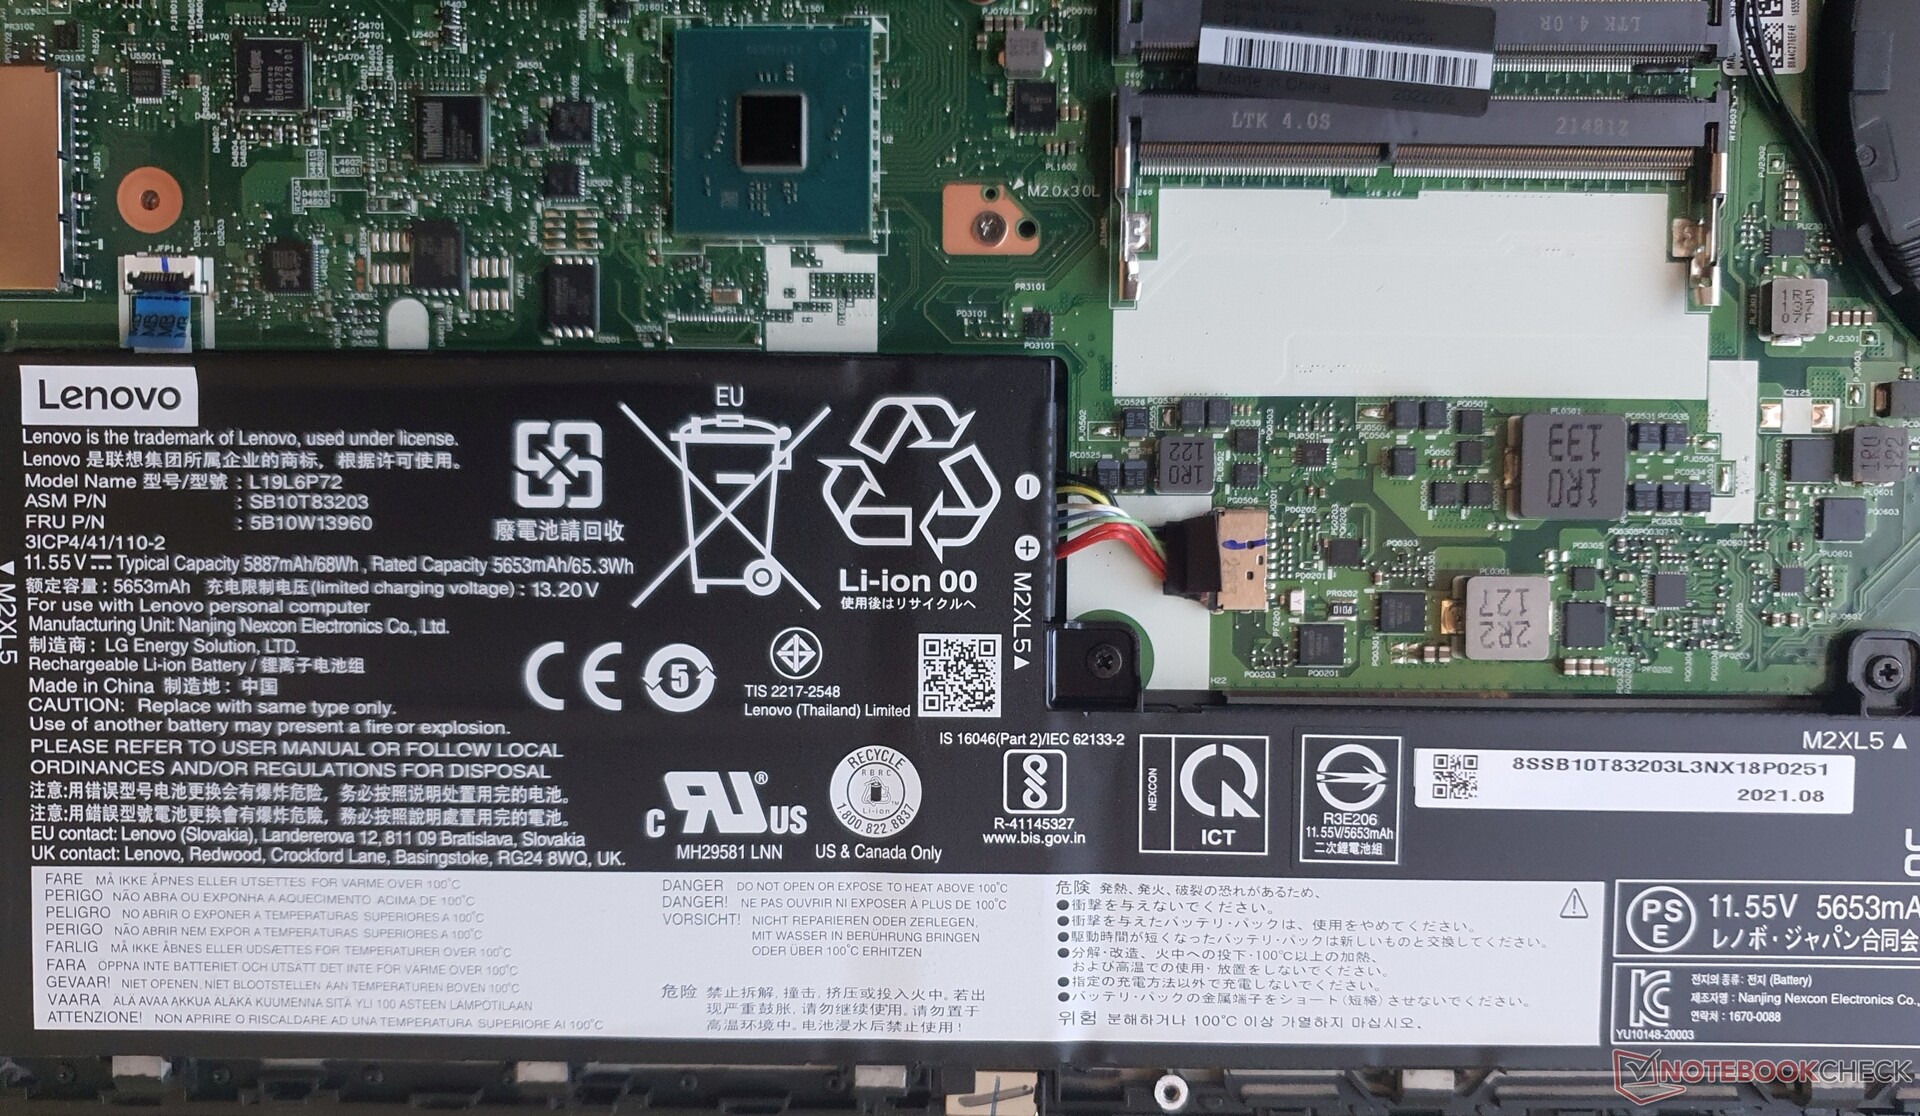
Nonostante le numerose clip di plastica, la piastra di base è abbastanza facile da rimuovere. Le nove viti si allentano rapidamente, mentre alcune rimangono incastrate nel case. Una volta aperto, è possibile accedere alla RAM (1 slot libero), alla M.2-2280-SSD (1 slot libero), alla ventola, che è sostituibile (compreso il tubo di calore), e alla batteria da 68 Wh, anch'essa sostituibile. Il modulo WLAN è installato in modo permanente
Un altro aspetto utile è che la tastiera può essere facilmente sostituita se diventa usurata o difettosa dopo anni di digitazione.
Garanzia
Come tutti i ThinkPad di fascia alta (serie T/X/P), Lenovo Germania offre una garanzia di tre anni per il notebook P15v G2, comprensiva di ritiro e restituzione. Le riparazioni in loco sono possibili con un sovrapprezzo, così come la protezione contro i danni accidentali, il supporto Premier o l'estensione della garanzia a 5 anni.
Nota per i lettori internazionali: La politica di garanzia di Lenovo può variare da regione a regione, pertanto è necessario controllare il sito Web di Lenovo (se applicabile) per il paese di acquisto
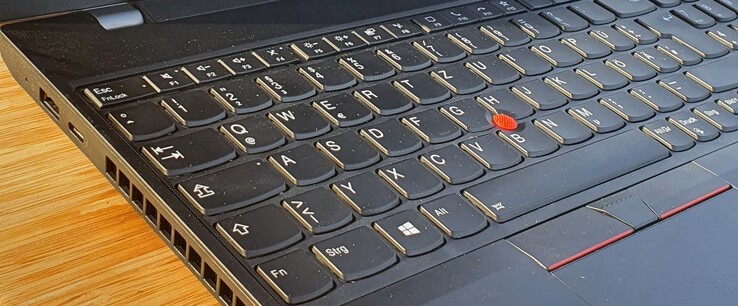
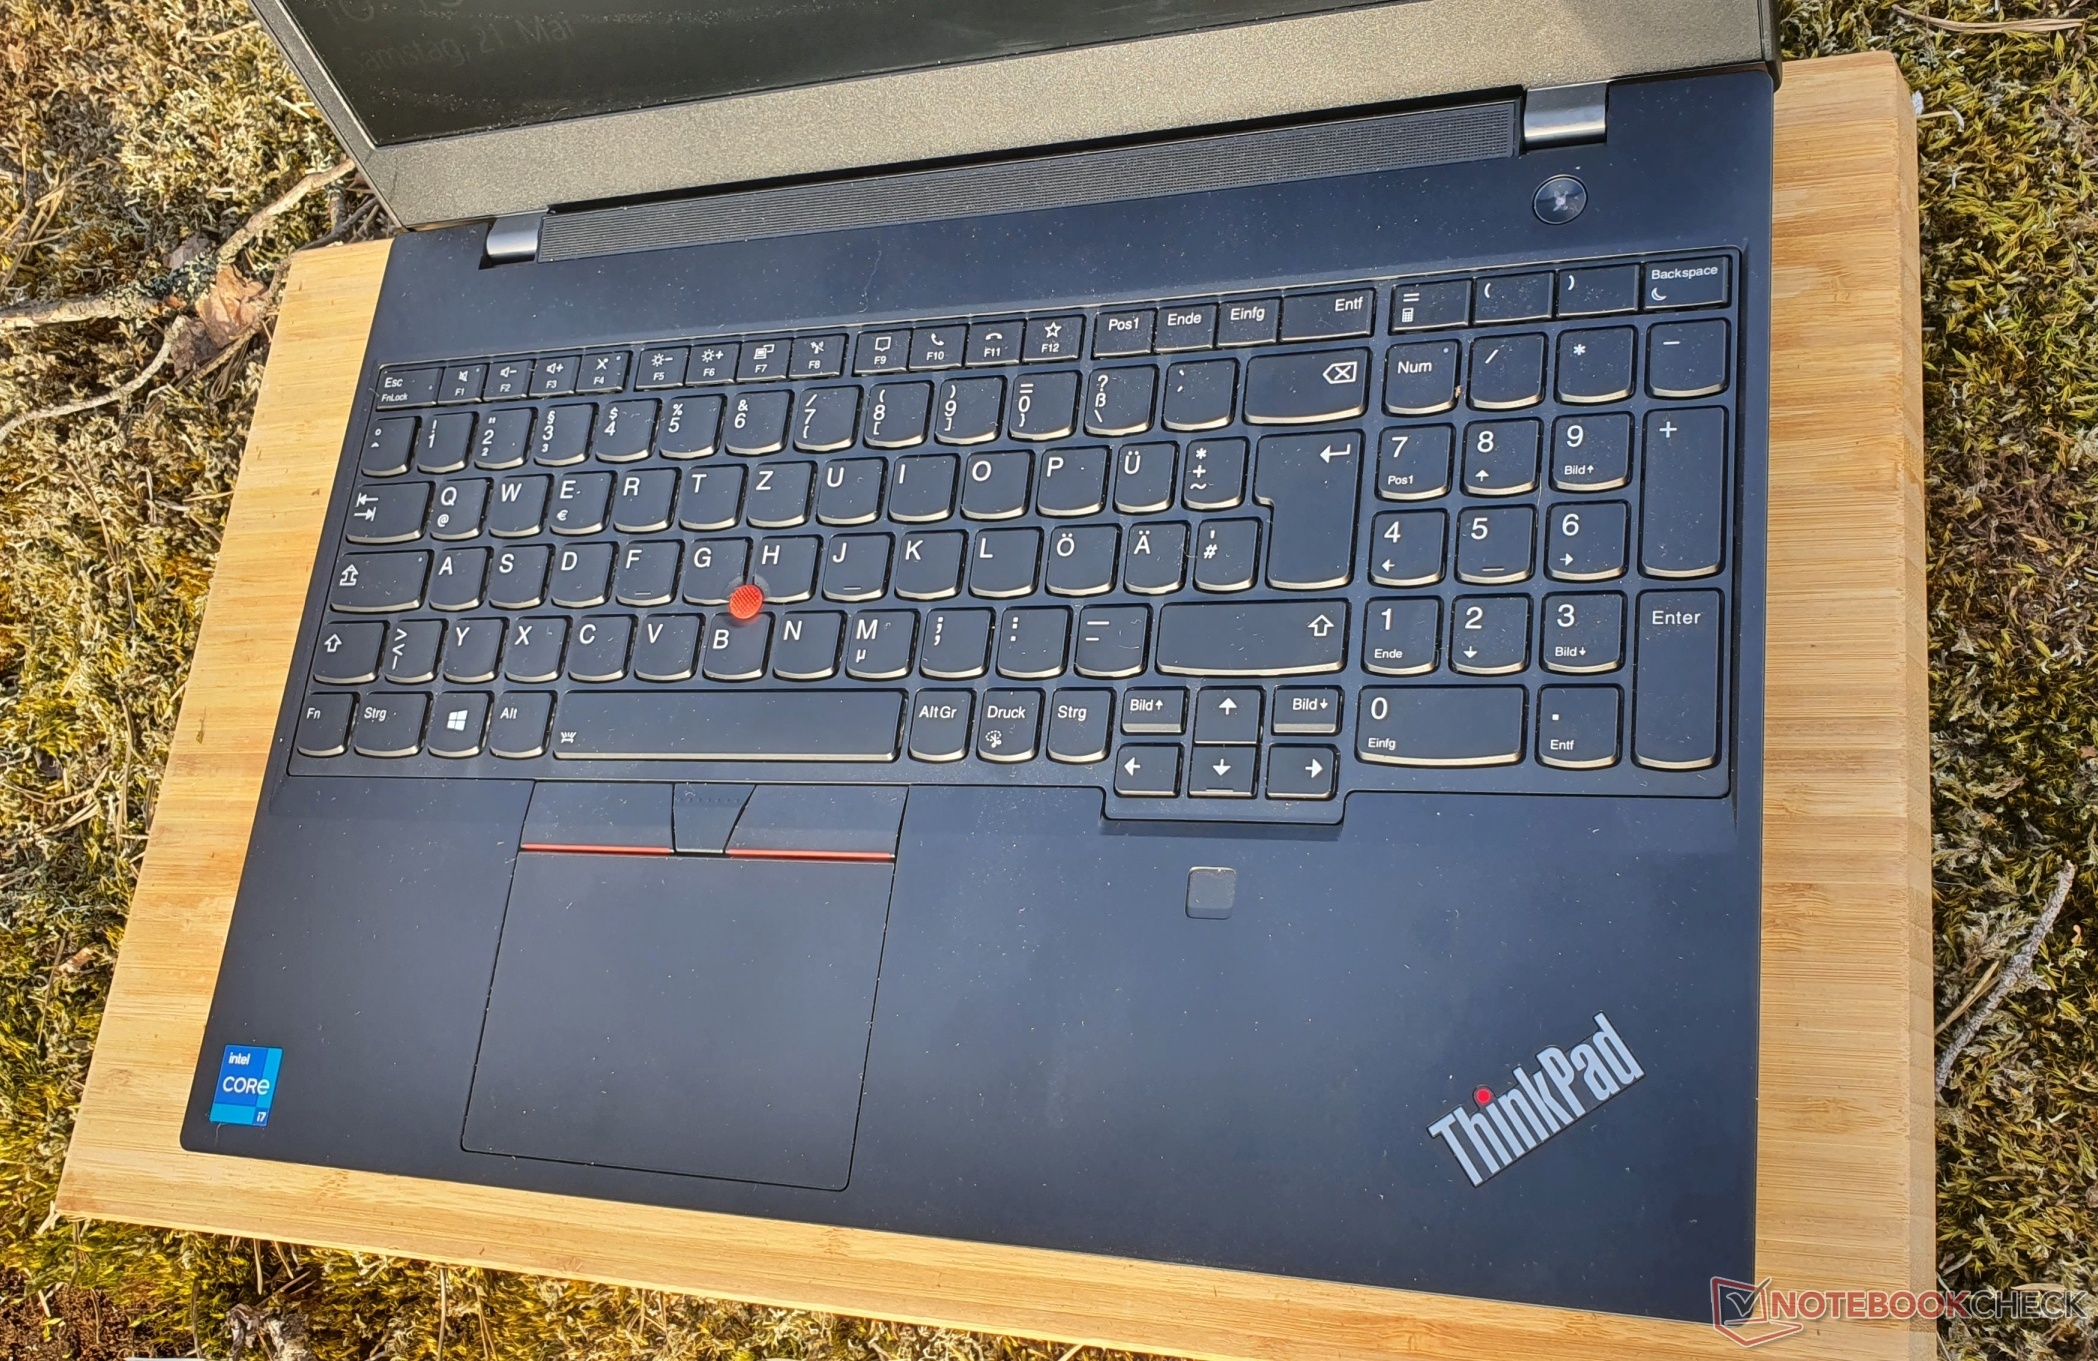
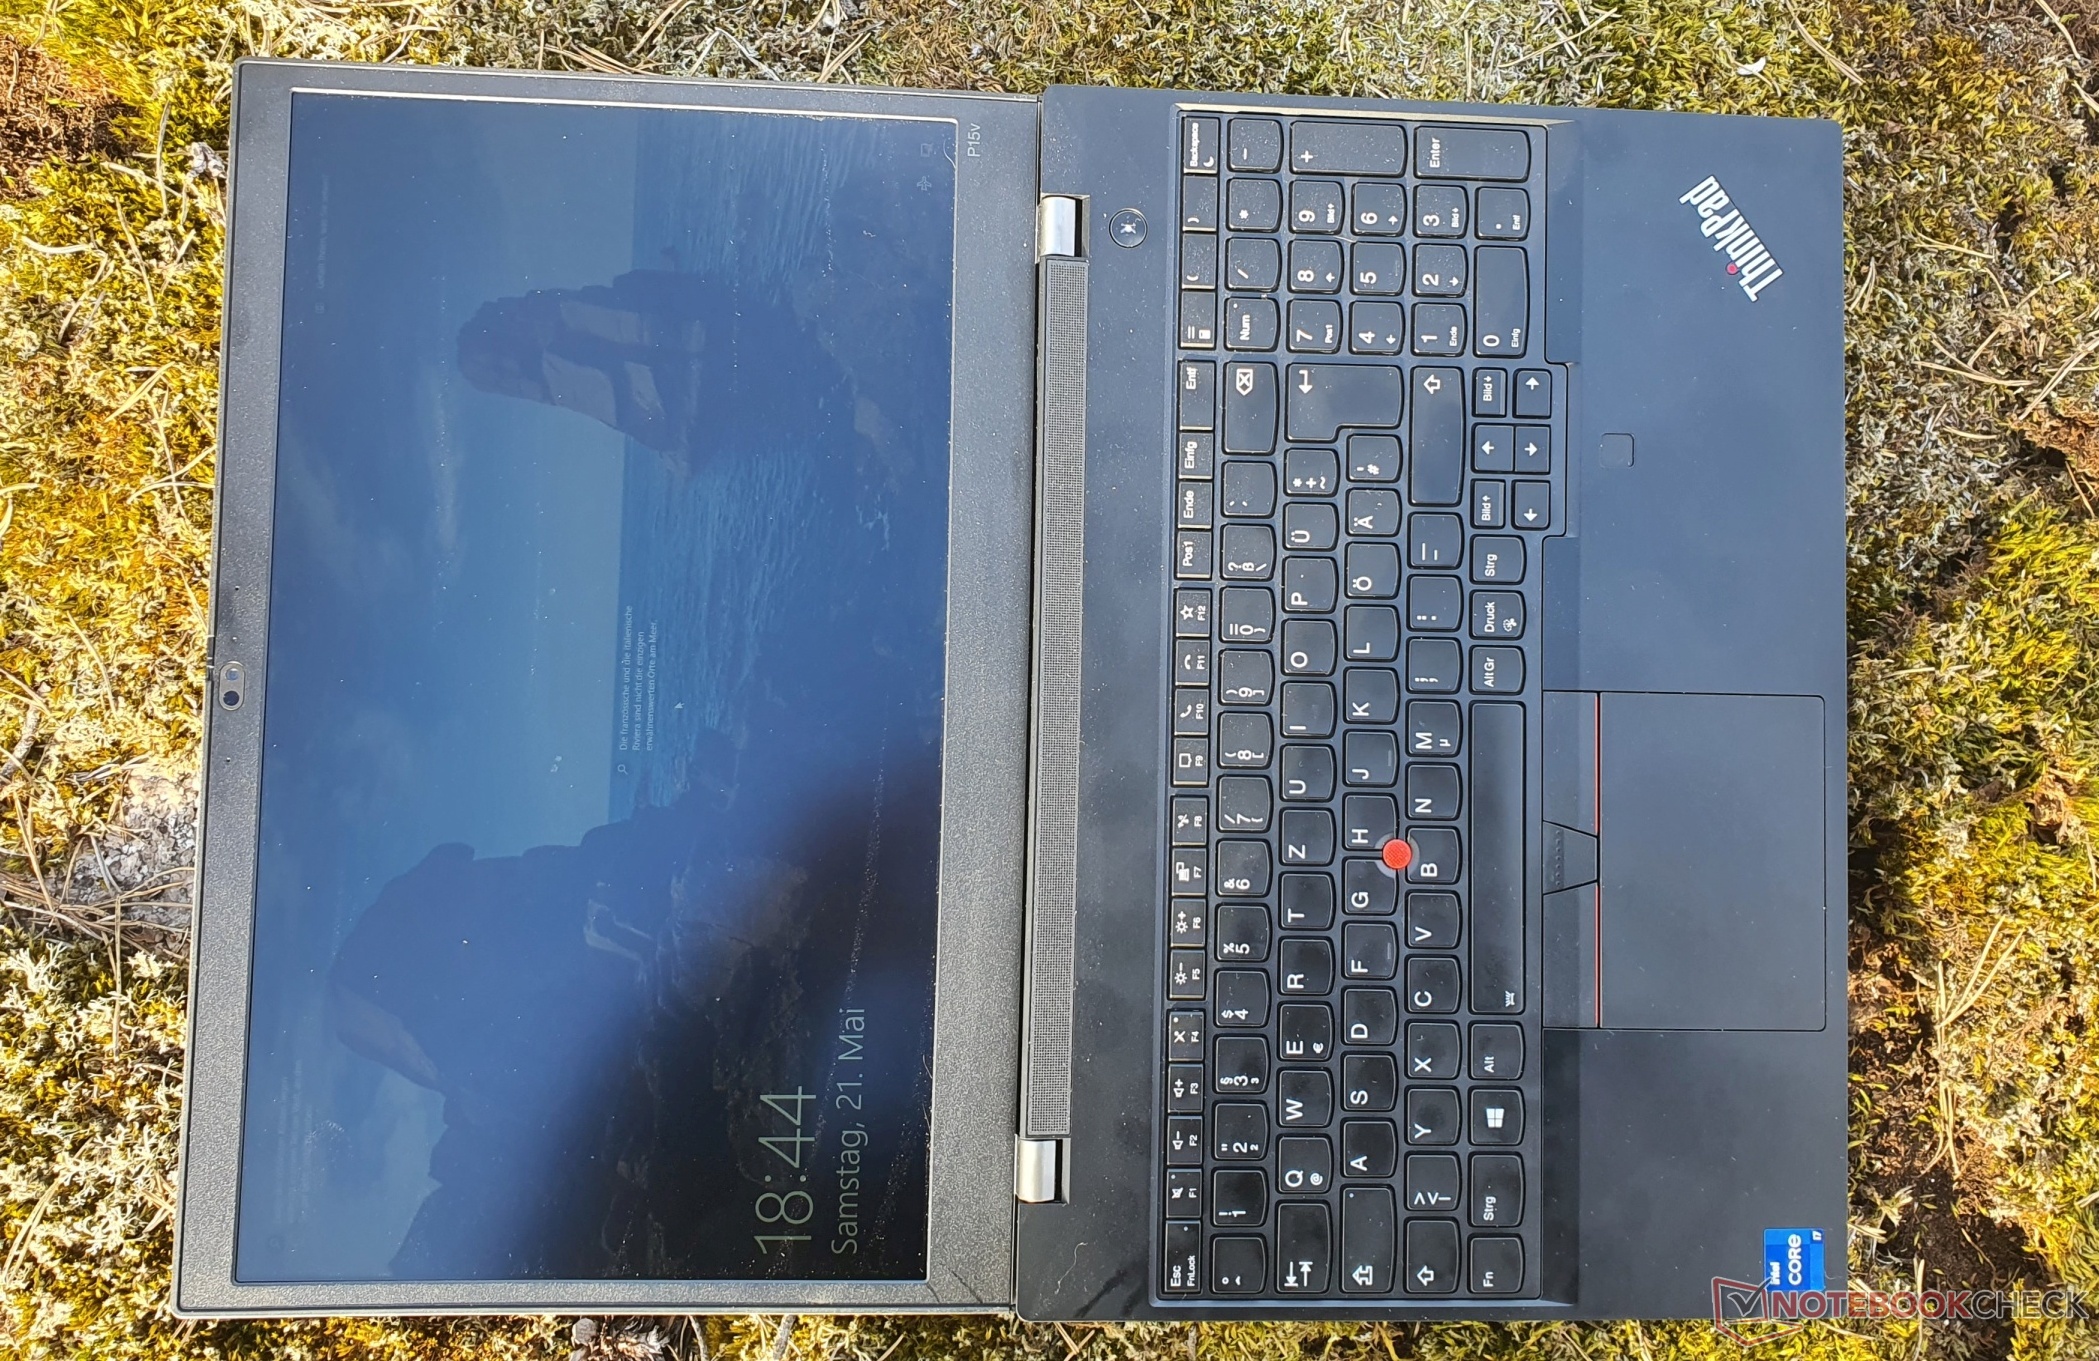
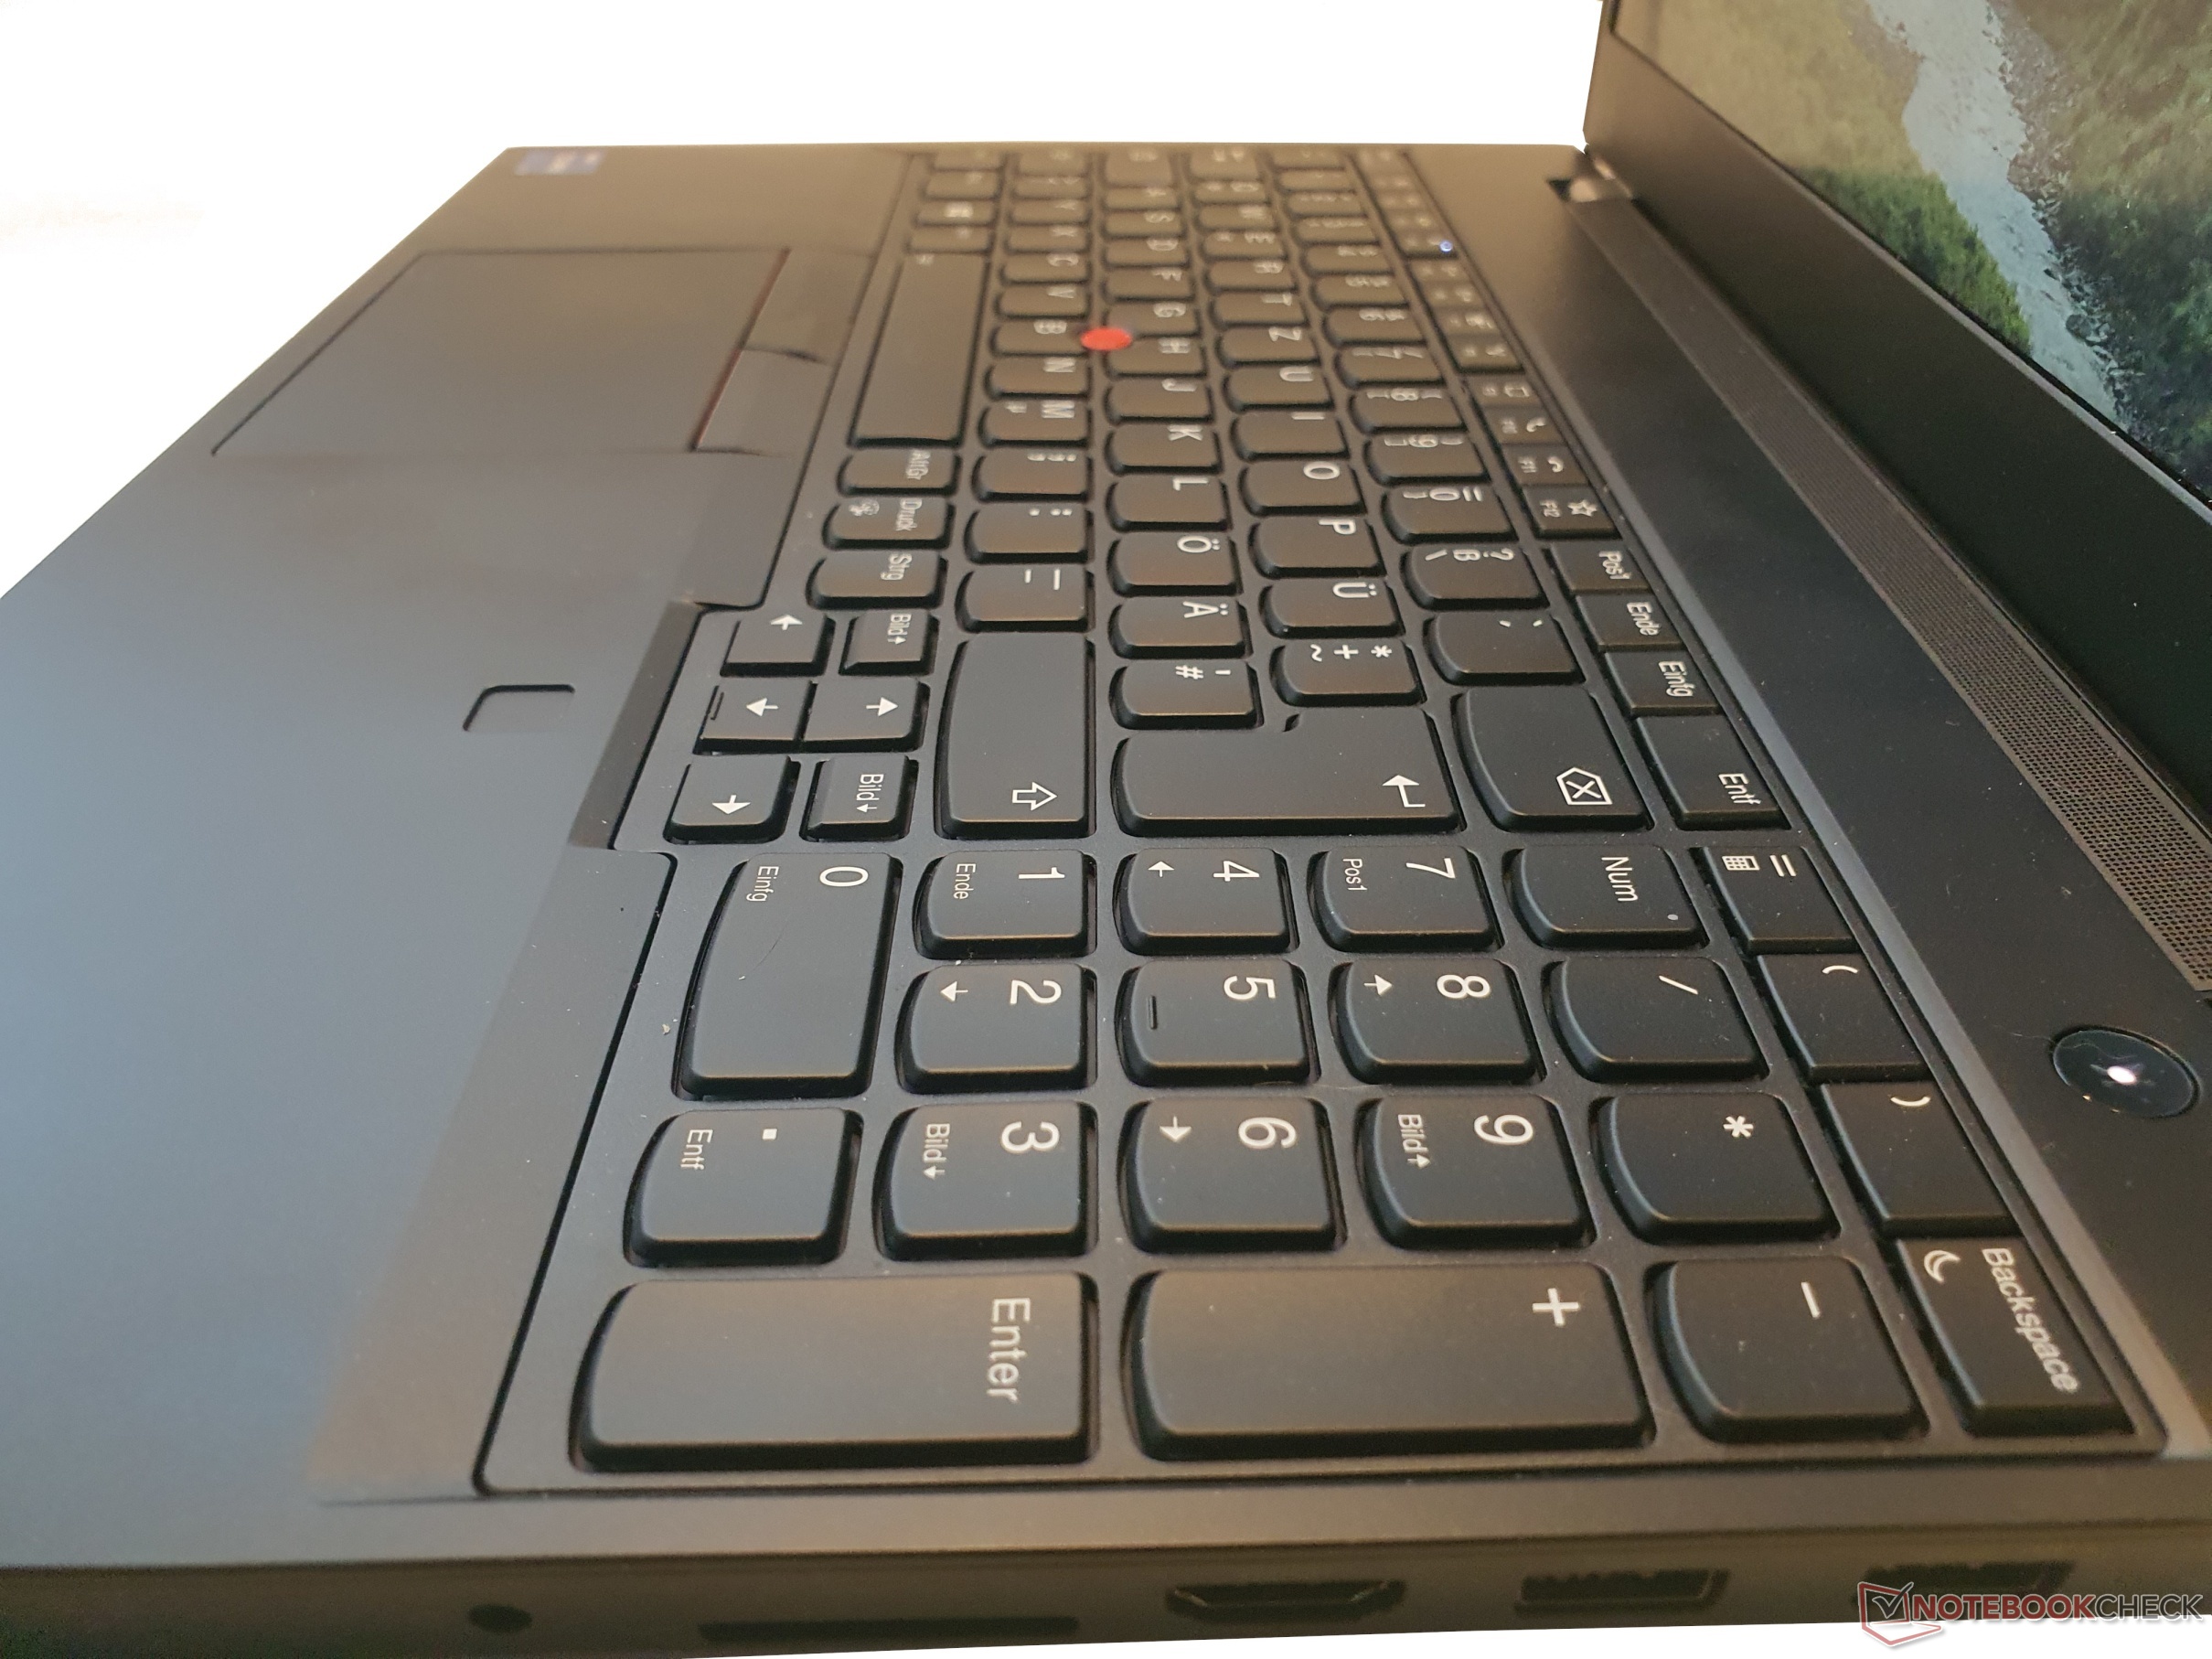
Dispositivi di input ThinkPad: Lenovo con una corsa decente di 1,8 mm
Tastiera
La tastiera a prova di schizzi di Lenovo è molto comoda da usare con i suoi tasti da 15 x 15 mm e una corsa di 1,8 mm. Questa è già stata ridotta a 1,5 mm in molti ThinkPad. Il punto di pressione dei tasti lisci e leggermente concavi è chiaramente percepibile e la corsa è molto soddisfacente. D'altra parte, la tastiera dell'HP ZBook Power 15 ha un punto di pressione ancora più nitido (secondo il tester), ma una corsa più breve. In caso di dubbio, provate le tastiere prima di acquistarle.
Nel complesso, il layout è molto buono, anche grazie alla navigazione dedicata e ai tasti freccia piuttosto grandi. Solo i quattro tasti a sinistra dell'Invio e quelli della fila superiore sono un po' più piccoli. È presente anche un tastierino numerico, che può semplificare l'inserimento di dati relativi alla workstation. Anche sotto una pressione mirata, la tastiera non cede. L'illuminazione dello sfondo ha due livelli di regolazione.
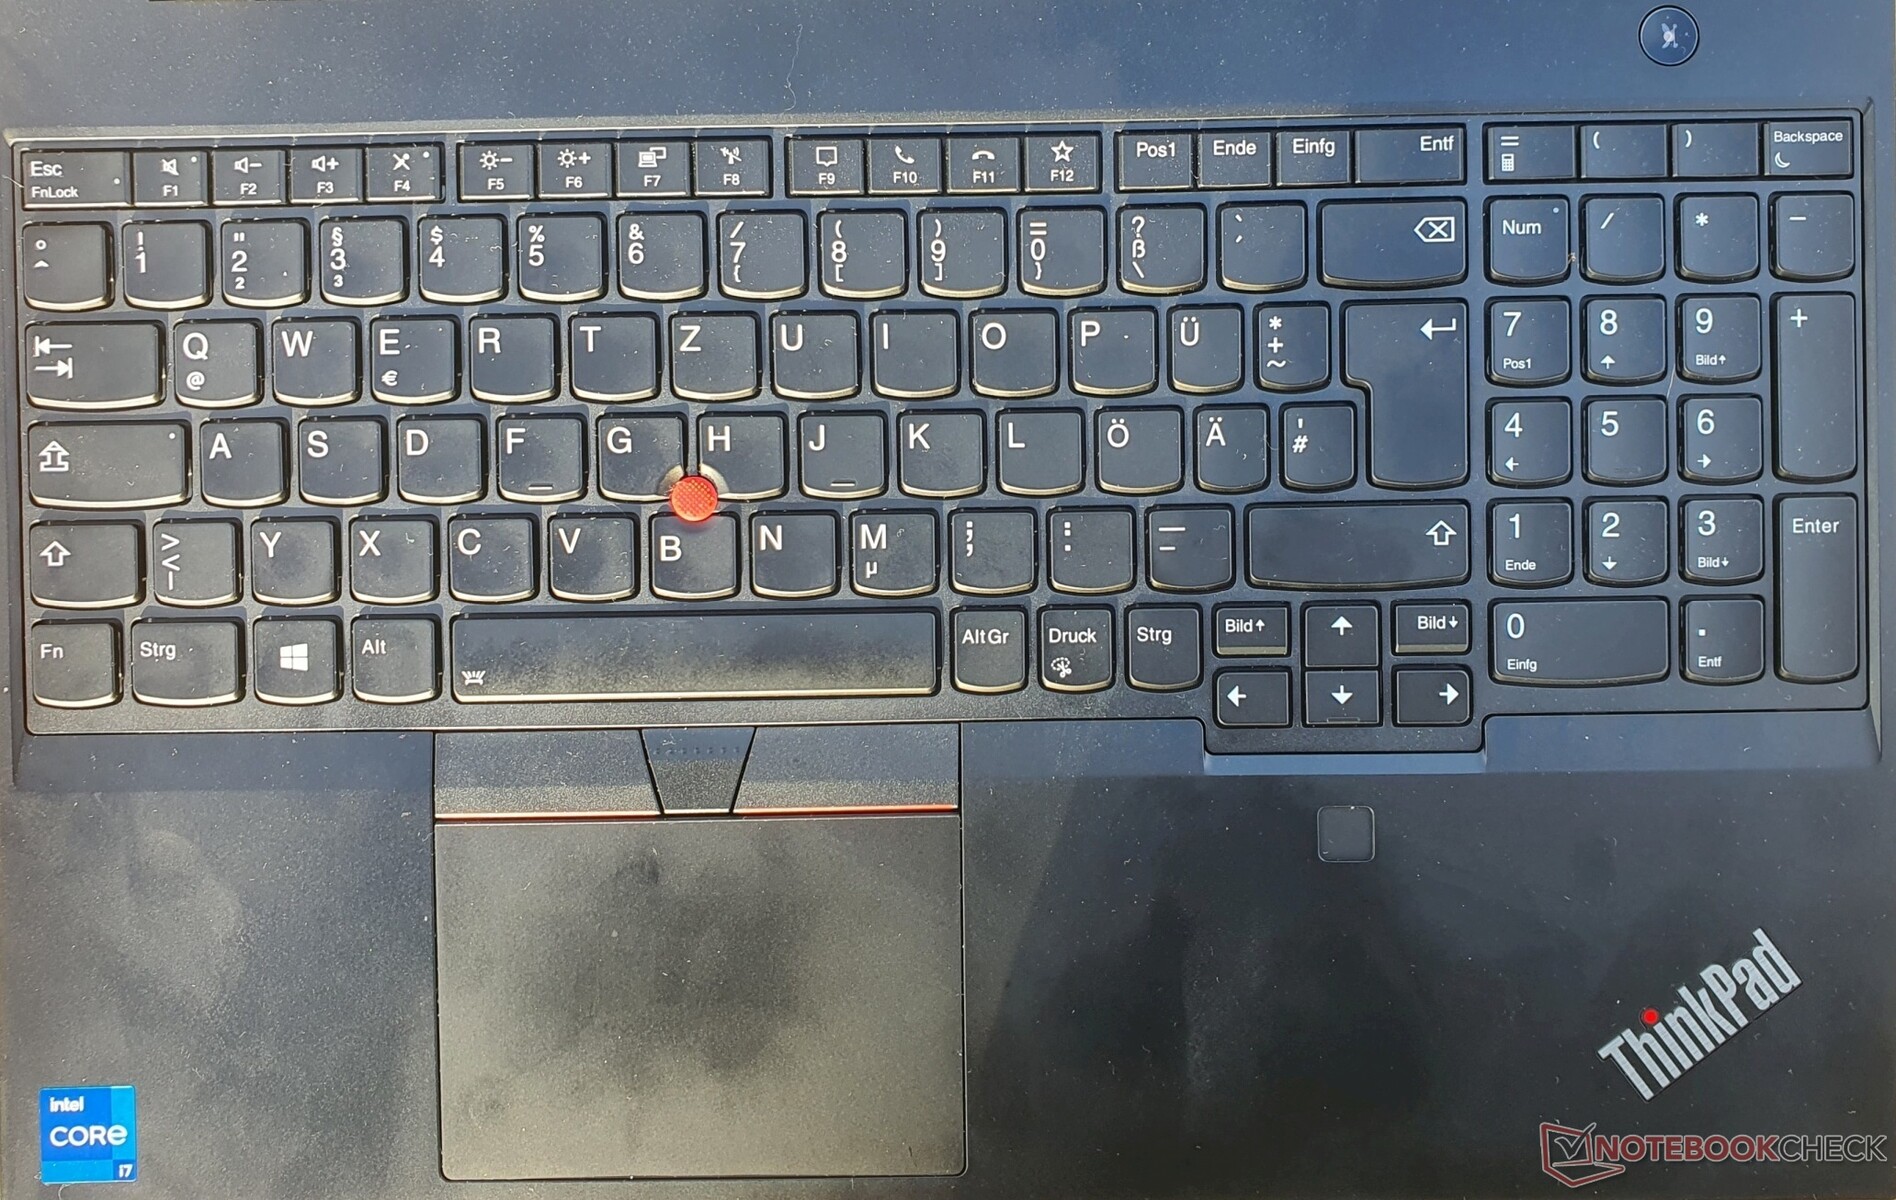
Touchpad e TrackPoint
Il touchpad di medie dimensioni misura 10 x 7 cm e presenta una superficie liscia in Mylar con discrete qualità di scorrimento. I pulsanti integrati hanno una caduta completa e un punto di pressione ben dosato.
Con un po' di pratica, il TrackPoint e i suoi tre pulsanti consentono di controllare il cursore del mouse in modo molto preciso, con il vantaggio di non dover staccare la mano dalla tastiera. È utile anche lo scorrimento in combinazione con il pulsante centrale.
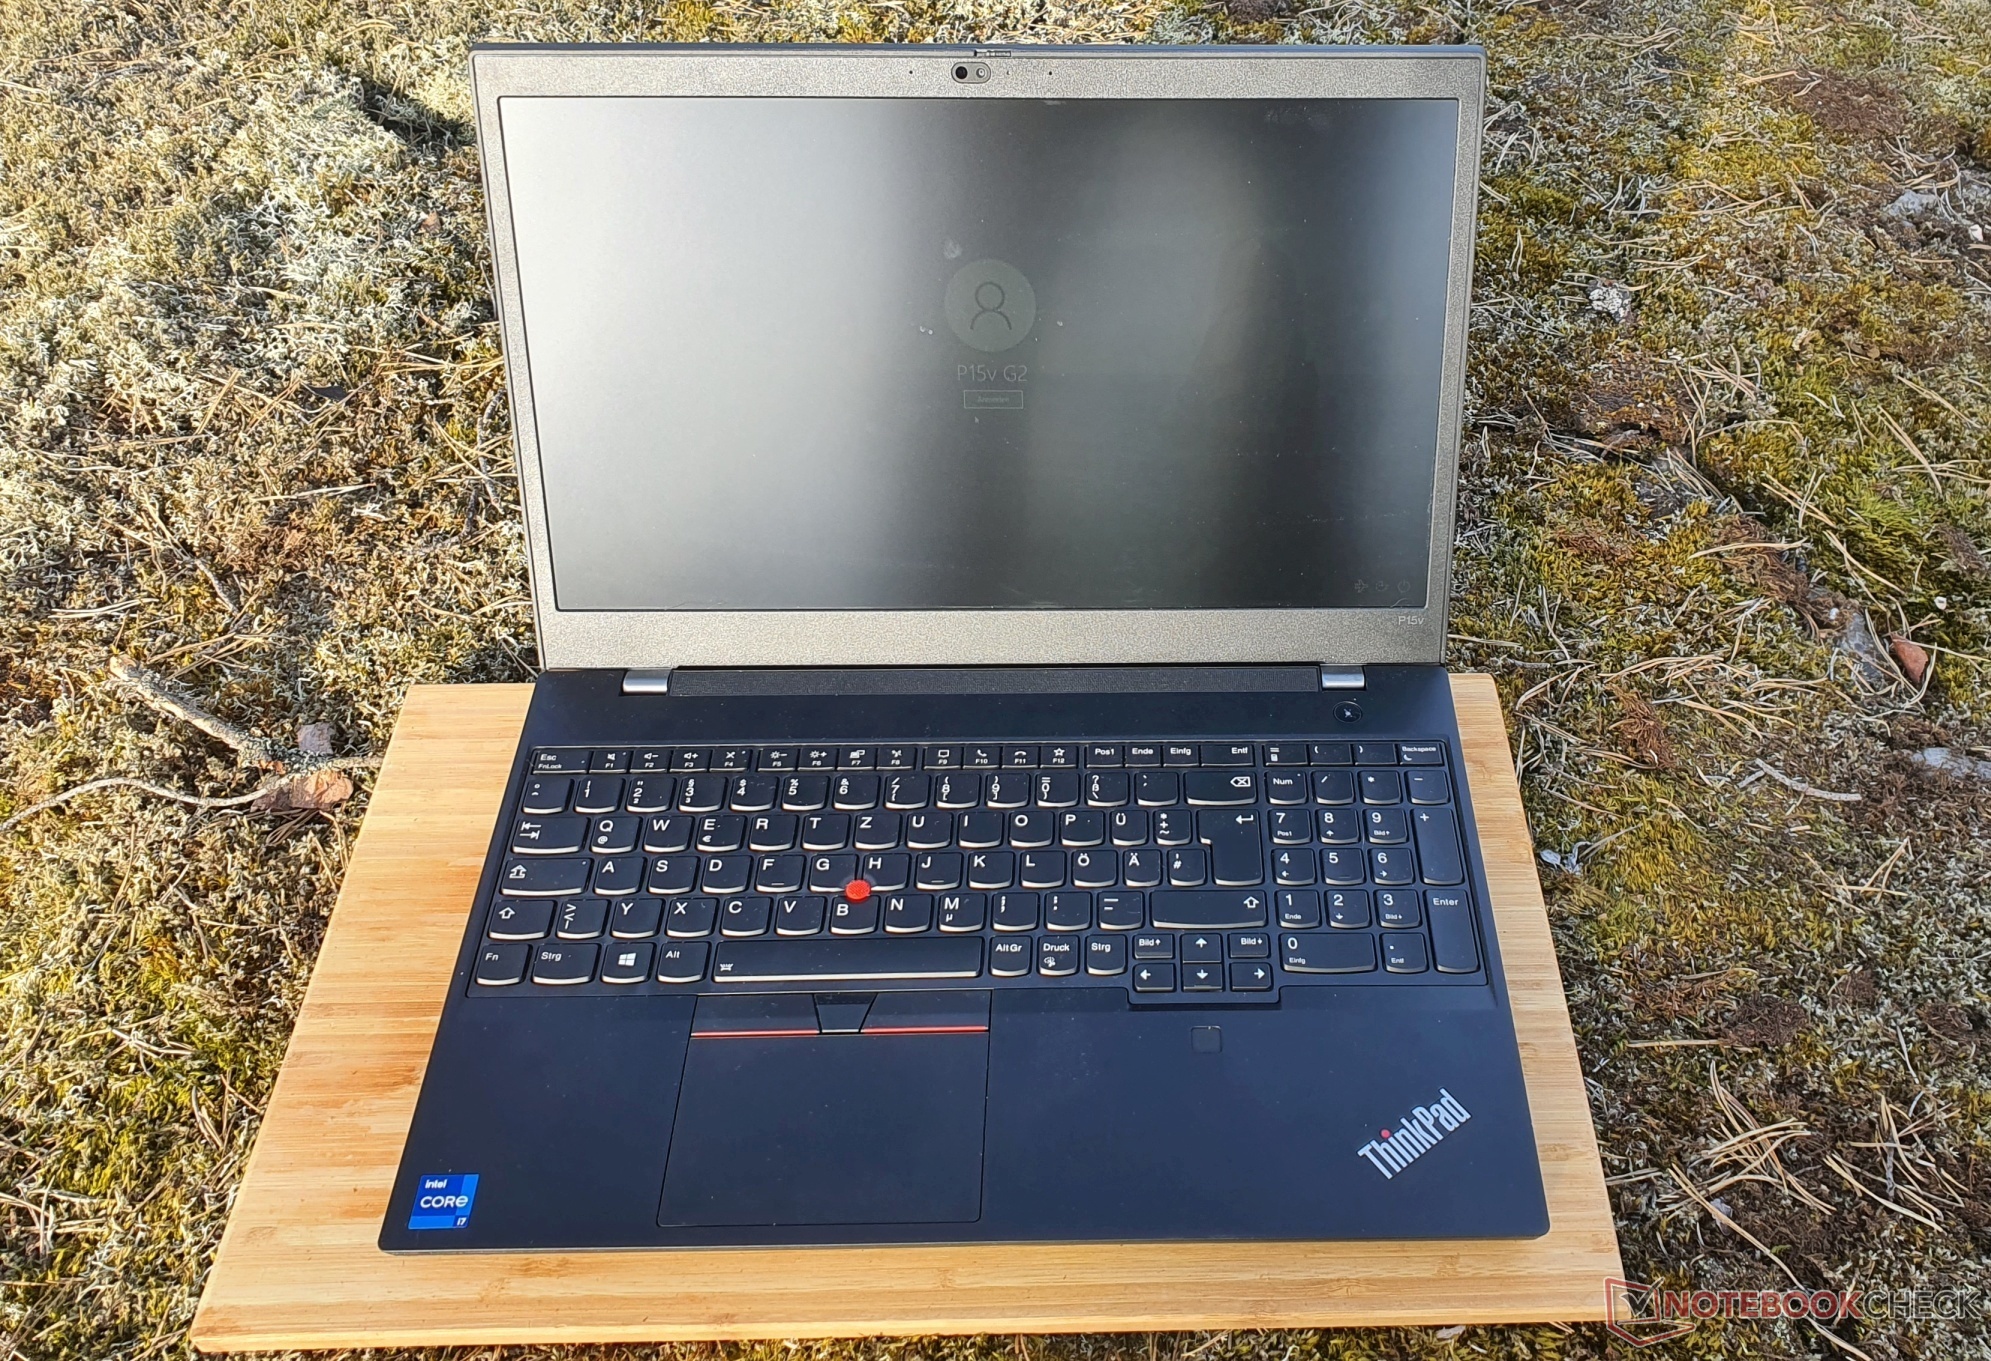
Display 4K opzionale sul ThinkPad P15v G2

Lenovo offre un totale di quattro opzioni di display opachi da 15,6 pollici in formato 16:9 per il ThinkPad P15v G2:
FHD (1920x1080) IPS, 300 nits, 45% NTSC.
FHD (1920x1080) IPS touch, 300 nits, 45% sRGB
FHD (1920x1080) IPS, 300 nits, 100% sRGB
UHD (3840x2160) IPS, 600 Nits, 100% AdobeRGB, HDR400, X-Rite
Il nostro pannello rappresenta la variante entry-level e ha una risoluzione di 1920x1080, quindi i contenuti vengono visualizzati in modo sufficientemente nitido. Anche il ridimensionamento, che può essere impostato al 100%, è vantaggioso, in quanto consente di ottenere contenuti ancora più nitidi e di evitare problemi di ridimensionamento.
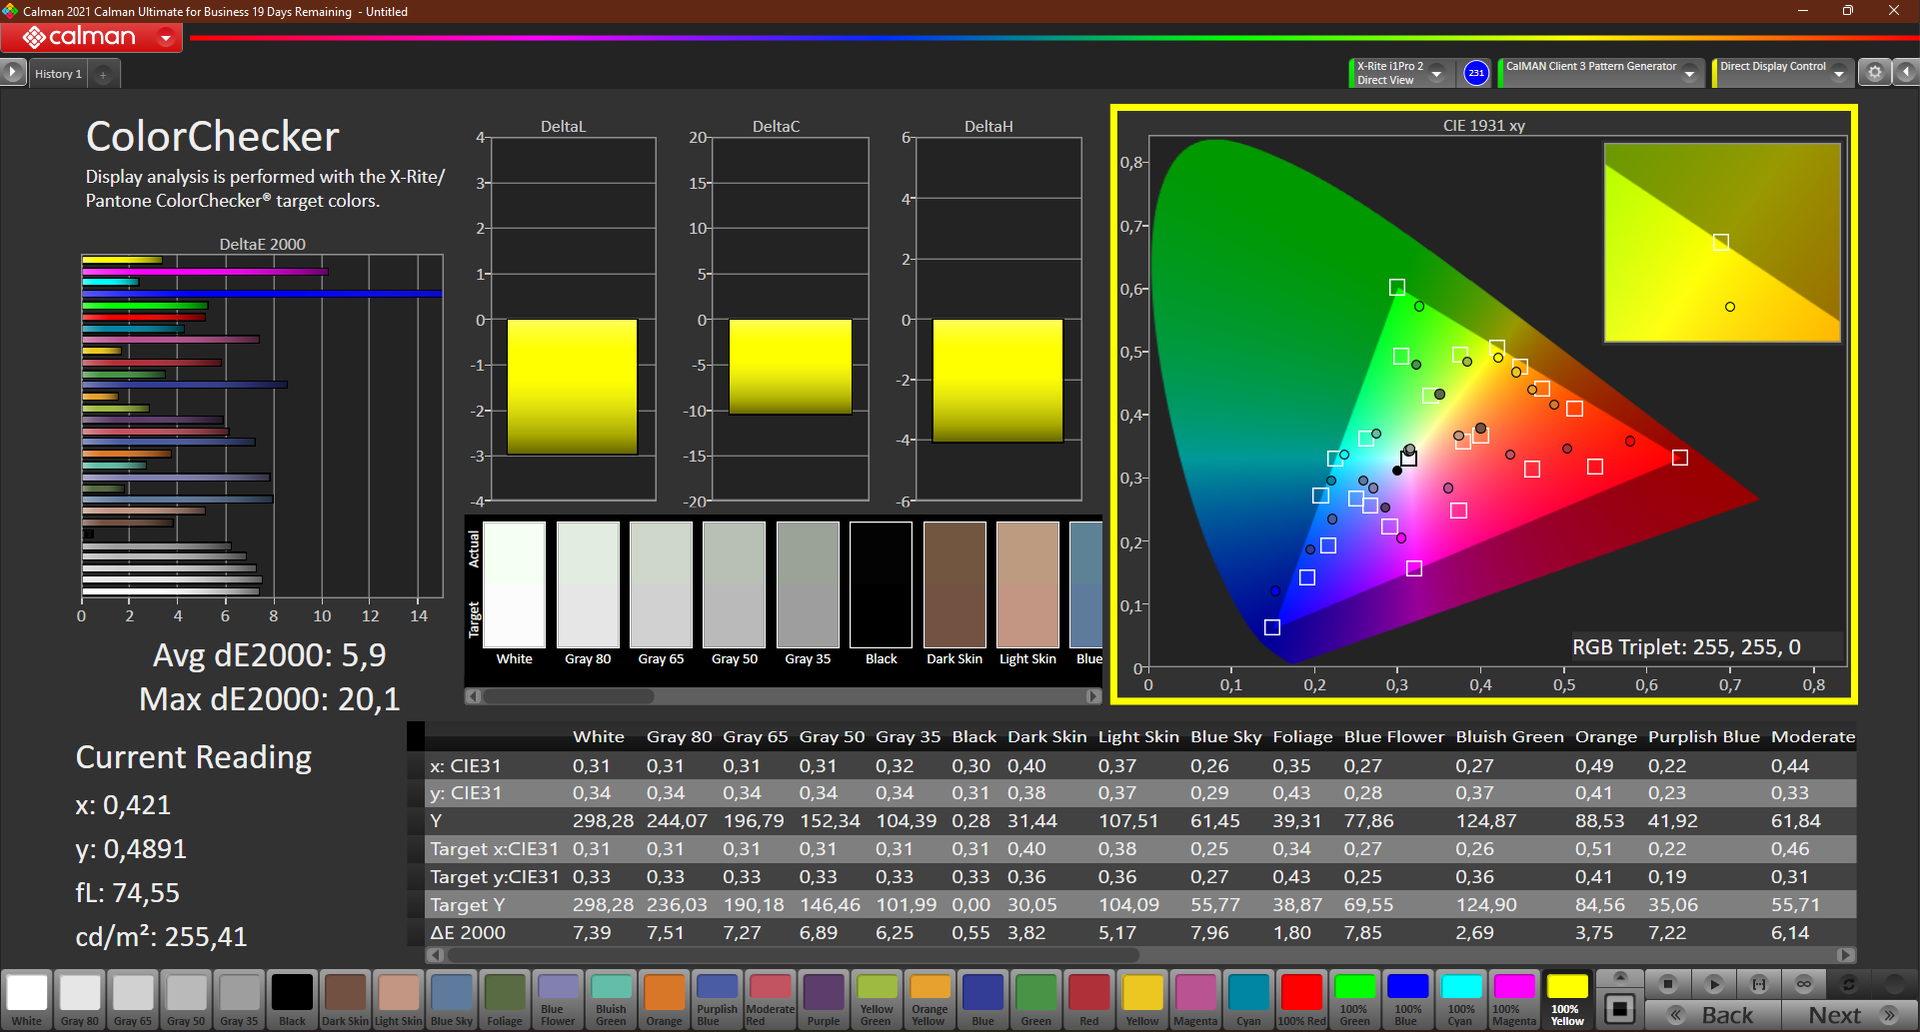
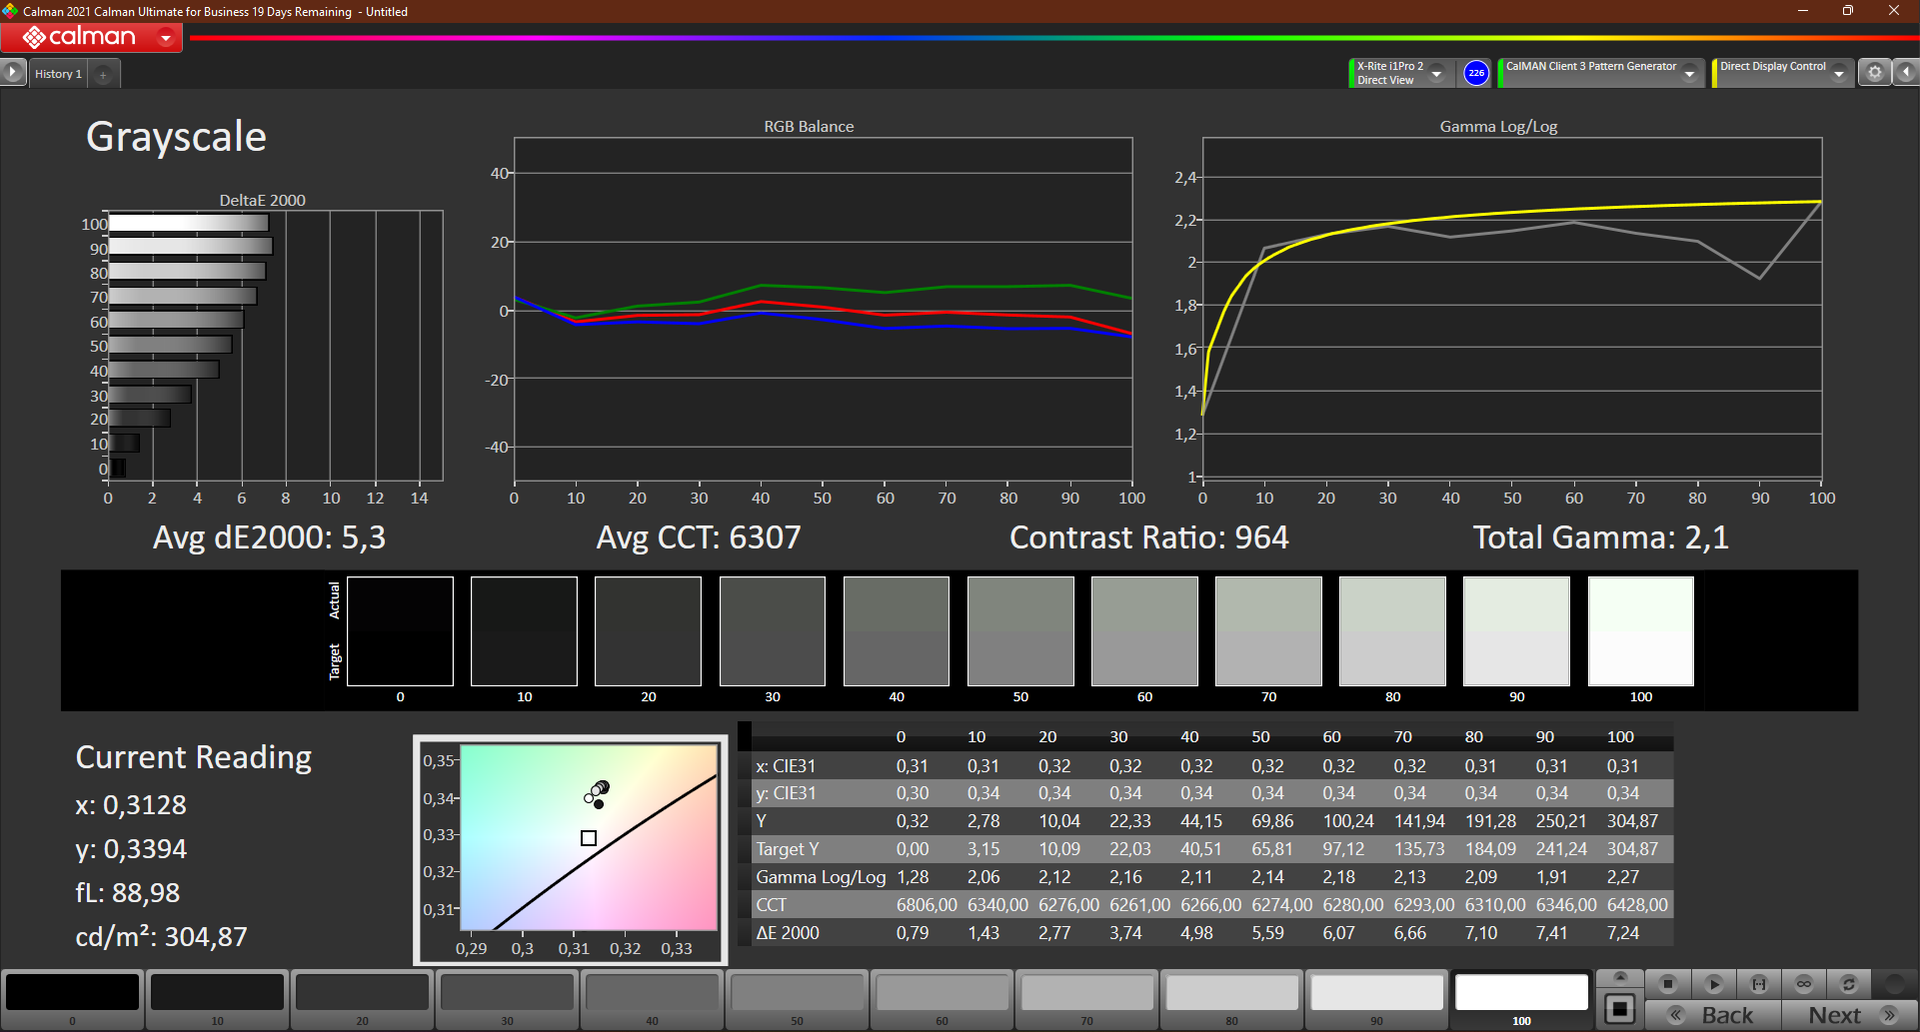
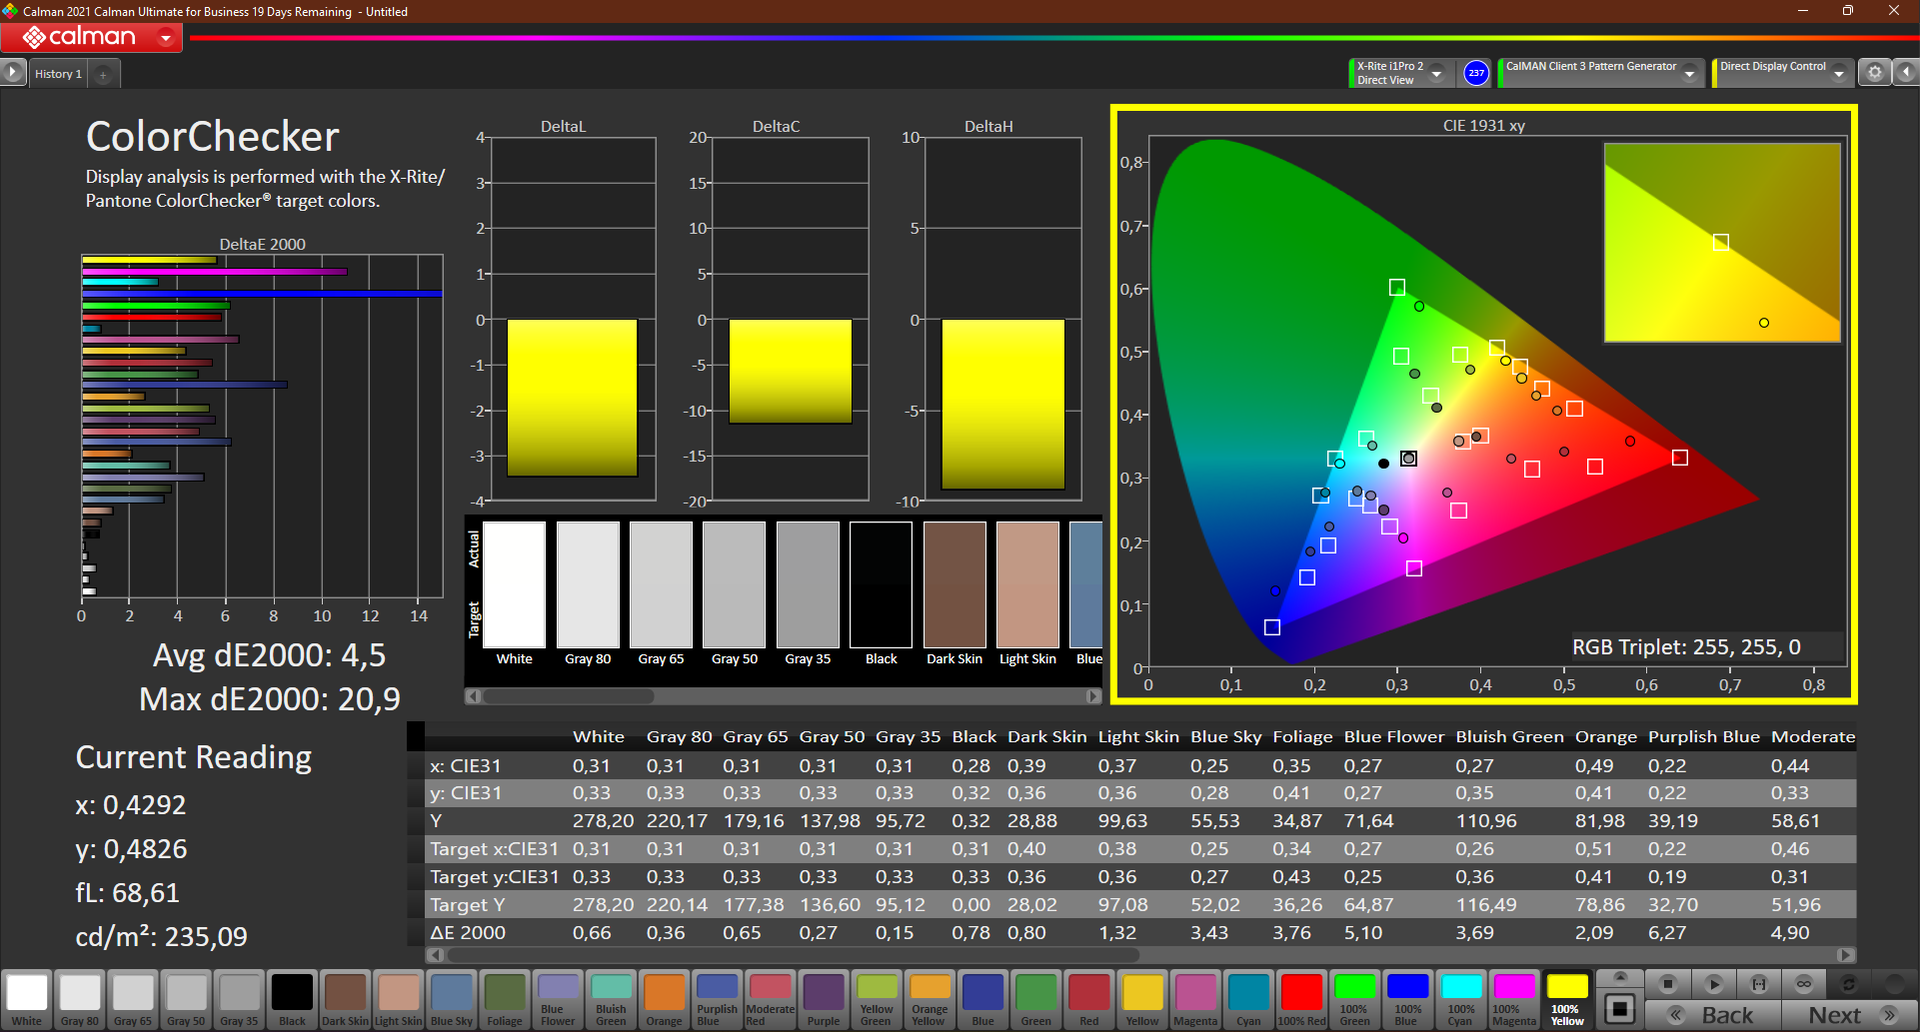
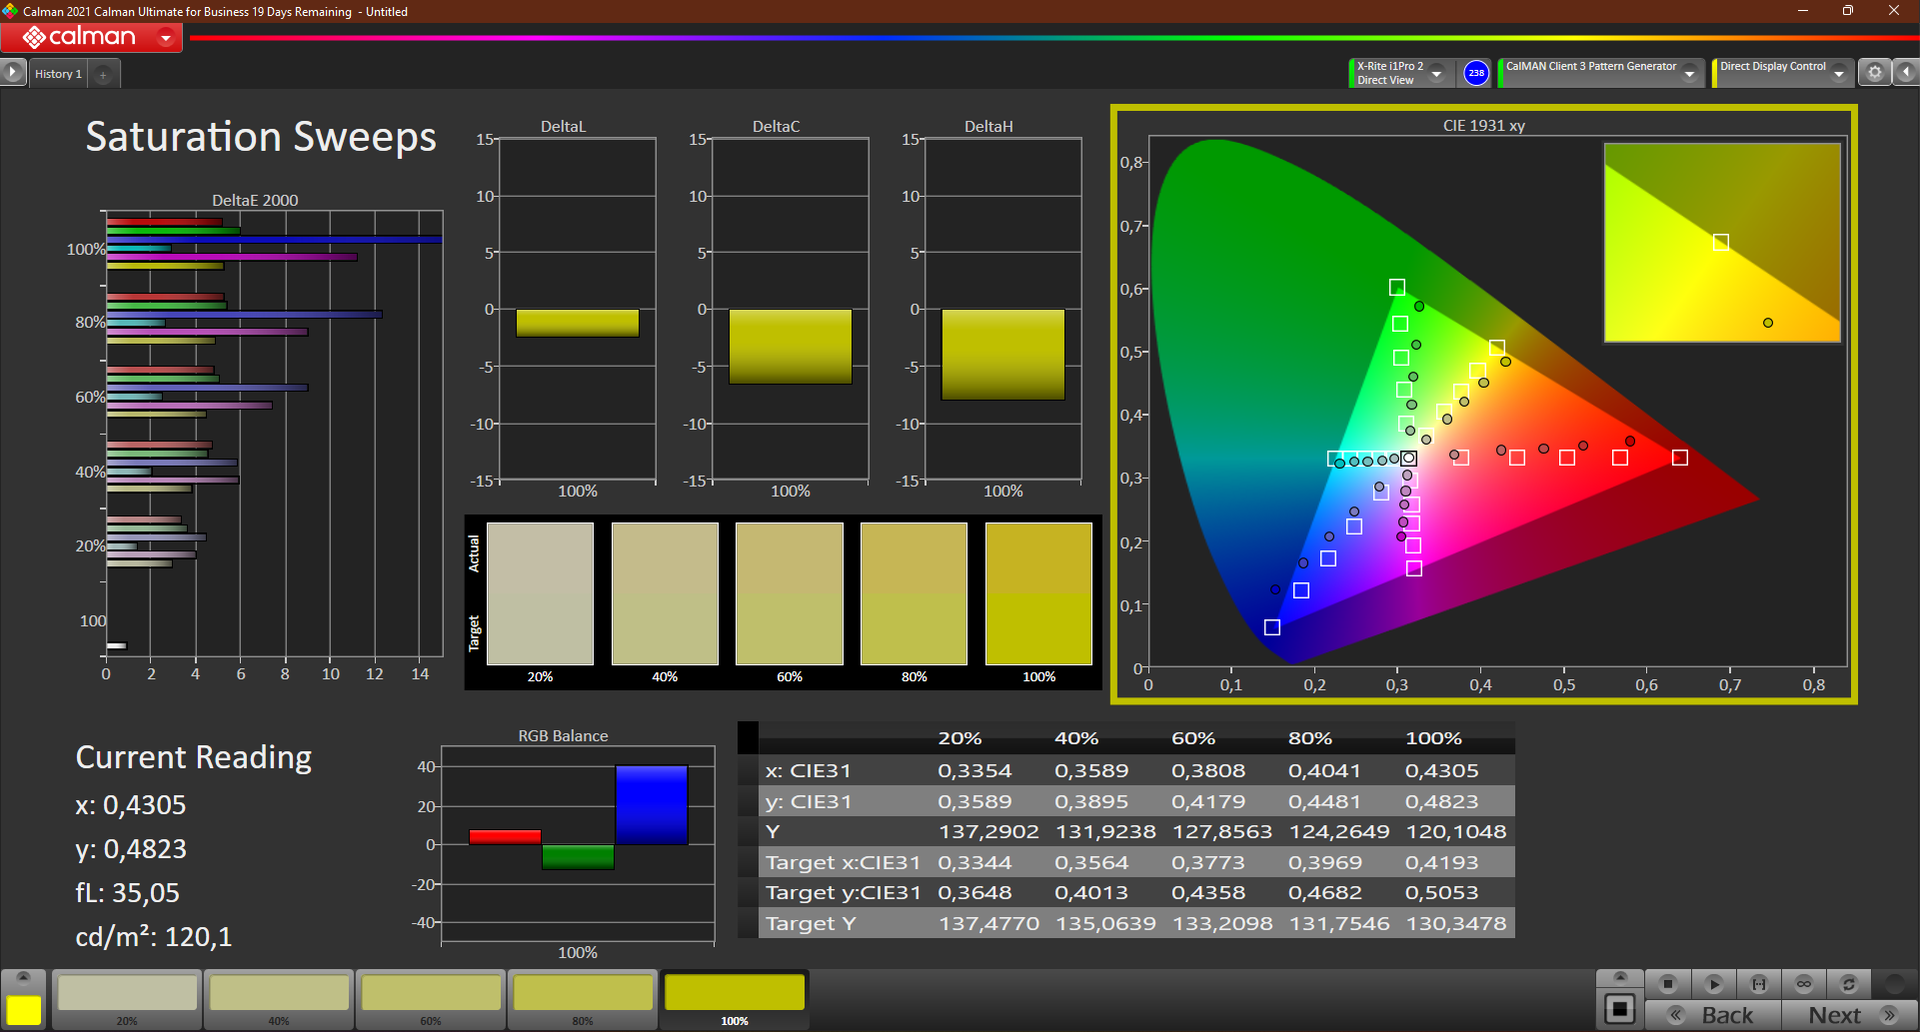
La luminosità di circa 280 nit non è ottimale, ma è comunque accettabile in ambienti chiusi. Il rapporto di contrasto di 953:1 è buono, così come il valore del nero di 0,32. La calibrazione ha permesso di ottenere un nero più ricco e di ridurre il corrispondente valore DeltaE della scala di grigi da 5,3 a un buon 0,9. Tuttavia, il valore Delta E del colore rimane invariato. Tuttavia, il valore Delta E del colore rimane elevato, pari a 4,5
Soggettivamente, la qualità dell'immagine è buona, anche grazie ai subpixel relativamente chiari e al nero ricco. L'HP ZBook Power 15 e tutti gli altri dispositivi di confronto offrono tassi molto migliori sulla carta. I tempi di risposta del pannello sono mediocri o lenti e quindi non ottimali per i giochi. Non è stato rilevato alcuno sfarfallio PWM.
| |||||||||||||||||||||||||
Distribuzione della luminosità: 88 %
Al centro con la batteria: 305 cd/m²
Contrasto: 953:1 (Nero: 0.32 cd/m²)
ΔE ColorChecker Calman: 5.9 | ∀{0.5-29.43 Ø4.71}
calibrated: 4.5
ΔE Greyscale Calman: 5.3 | ∀{0.09-98 Ø4.96}
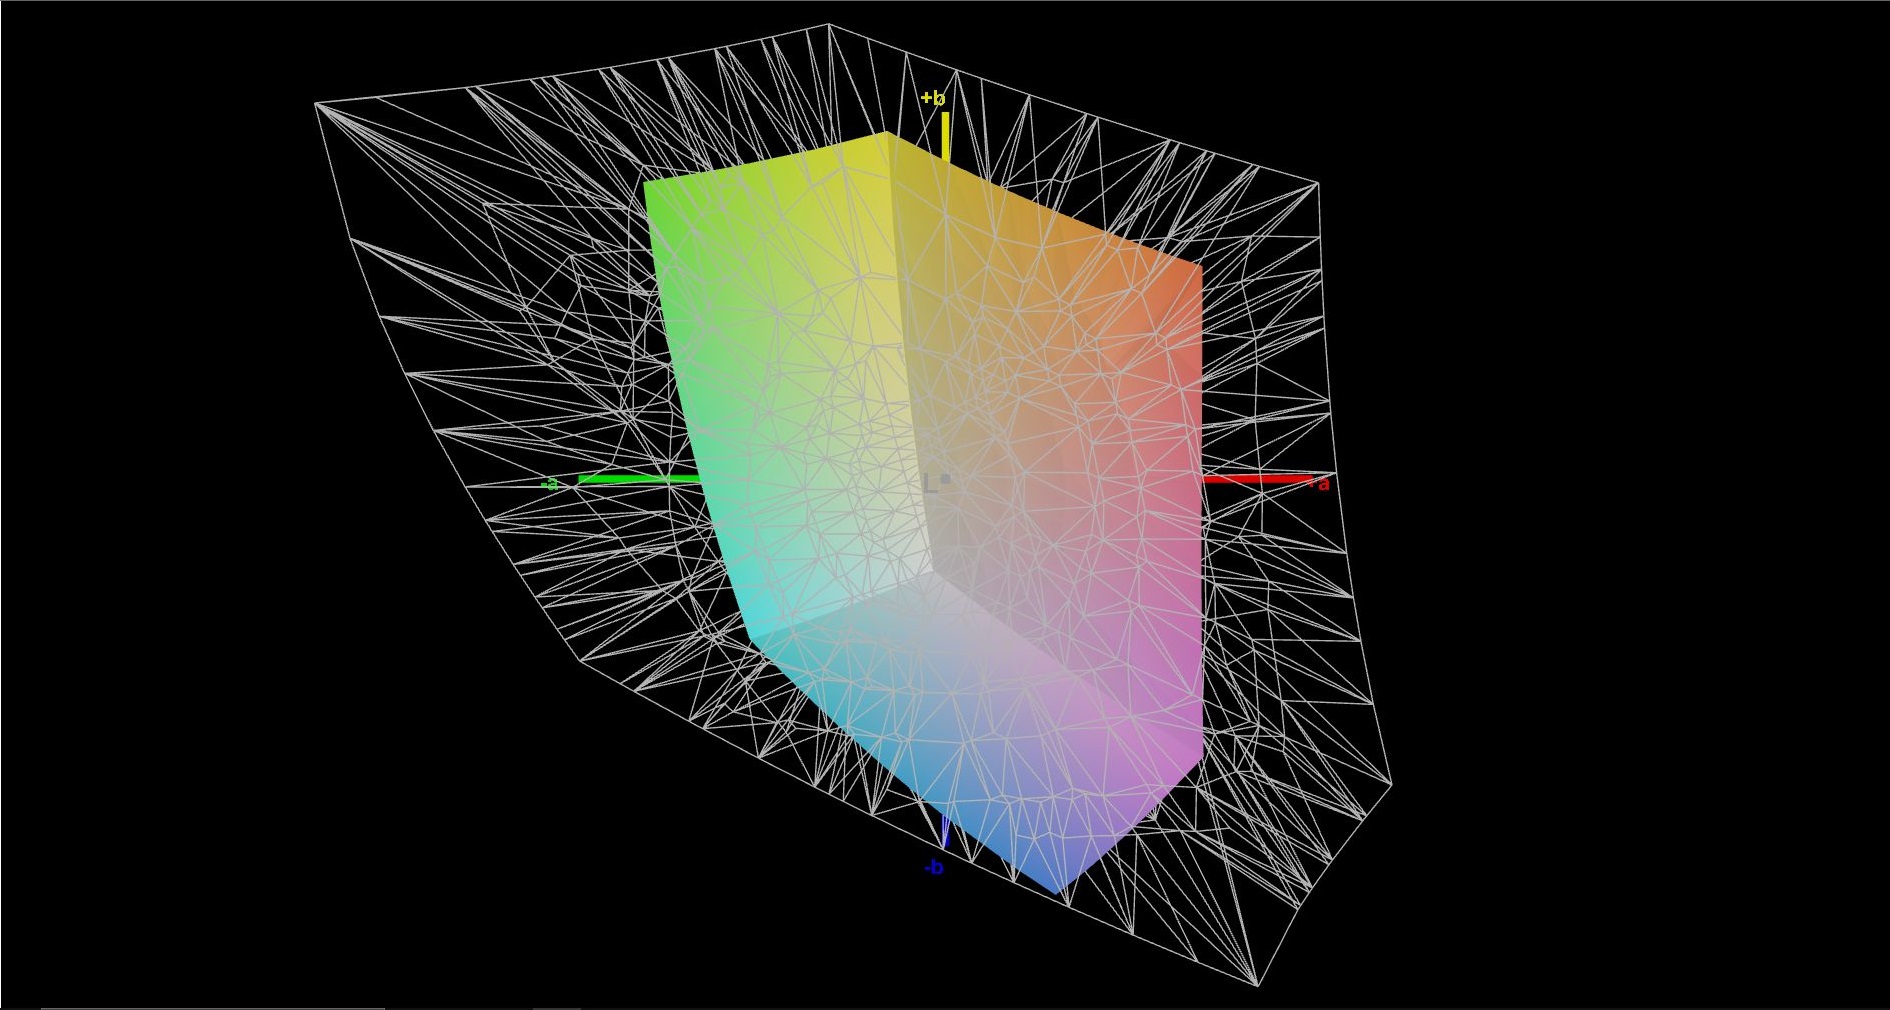
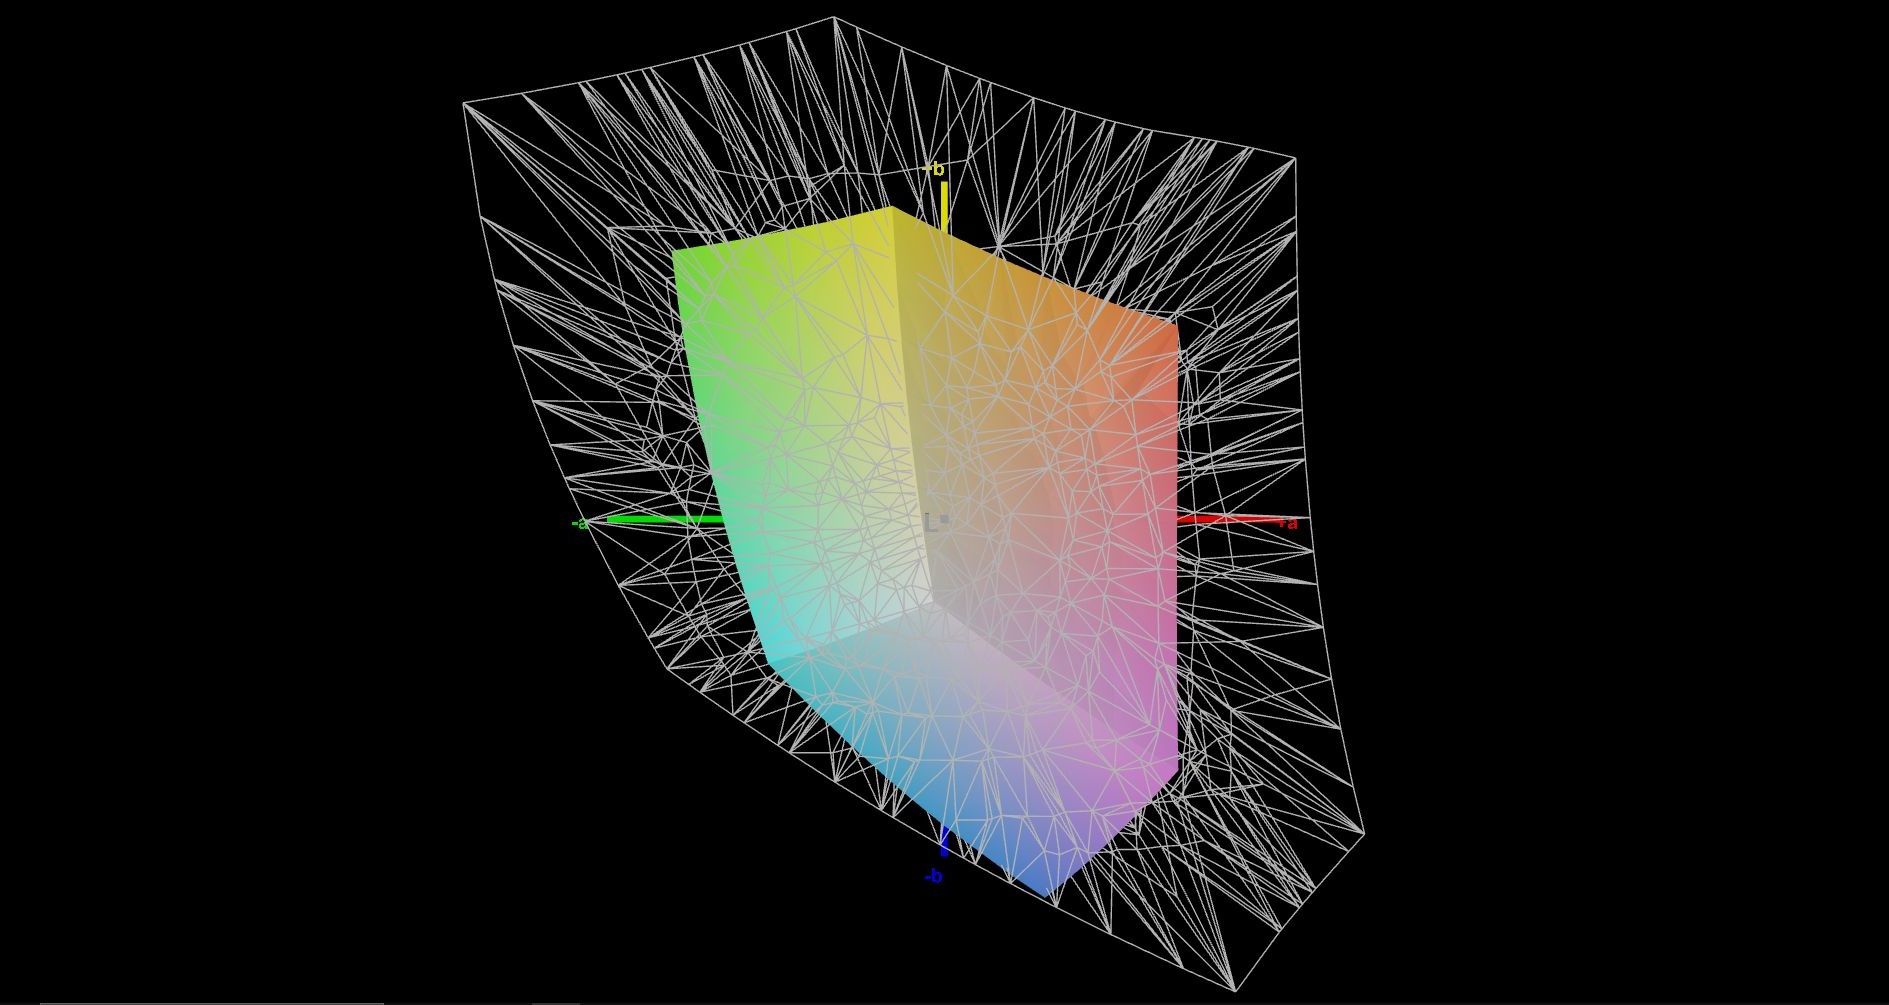
45.3% AdobeRGB 1998 (Argyll 3D)
65.1% sRGB (Argyll 3D)
43.7% Display P3 (Argyll 3D)
Gamma: 2.1
CCT: 6307 K
| Lenovo ThinkPad P15v G2 21A9000XGE N156HCA-EAC, IPS LED, 1920x1080, 15.6" | Lenovo ThinkPad P15 G2-20YQ001JGE N156HCE_GN1, IPS, 1920x1080, 15.6" | Lenovo ThinkPad T15g-20UR000GGE N156HCE-GN1, IPS, 1920x1080, 15.6" | Lenovo ThinkPad T15p-20TN0006GE MNF601EA1-1, IPS LED, 3840x2160, 15.6" | Lenovo ThinkPad P15s Gen2-20W6000GGE MNF601EA1-1, IPS LED, 3840x2160, 15.6" | HP ZBook Power 15 G8 313S5EA AUOA08B, IPS LED, 1920x1080, 15.6" | Dell Precision 5000 5560 Sharp LQ156R1, IPS, 3840x2400, 15.6" | |
|---|---|---|---|---|---|---|---|
| Display | 55% | 39% | 90% | 87% | 57% | 97% | |
| Display P3 Coverage (%) | 43.7 | 68.6 57% | 61.3 40% | 86.8 99% | 84.5 93% | 70.5 61% | 94.9 117% |
| sRGB Coverage (%) | 65.1 | 99.8 53% | 90.5 39% | 99.3 53% | 98.7 52% | 99 52% | 100 54% |
| AdobeRGB 1998 Coverage (%) | 45.3 | 70.6 56% | 62.3 38% | 98.5 117% | 97.8 116% | 71.3 57% | 100 121% |
| Response Times | 33% | 31% | 19% | 17% | -32% | -4% | |
| Response Time Grey 50% / Grey 80% * (ms) | 48 ? | 37.6 ? 22% | 38 ? 21% | 41.6 ? 13% | 40 ? 17% | 61 -27% | 47.2 ? 2% |
| Response Time Black / White * (ms) | 28 ? | 16 ? 43% | 16.8 ? 40% | 21.2 ? 24% | 23.2 ? 17% | 38 ? -36% | 30.4 ? -9% |
| PWM Frequency (Hz) | 26040 ? | 26040 ? | |||||
| Screen | 46% | 44% | 70% | 70% | 49% | 34% | |
| Brightness middle (cd/m²) | 305 | 498 63% | 504 65% | 595 95% | 604 98% | 393 29% | 501.5 64% |
| Brightness (cd/m²) | 281 | 490 74% | 476 69% | 594 111% | 609 117% | 385 37% | 467 66% |
| Brightness Distribution (%) | 88 | 95 8% | 90 2% | 94 7% | 91 3% | 78 -11% | 83 -6% |
| Black Level * (cd/m²) | 0.32 | 0.39 -22% | 0.34 -6% | 0.32 -0% | 0.34 -6% | 0.25 22% | 0.44 -38% |
| Contrast (:1) | 953 | 1277 34% | 1482 56% | 1859 95% | 1776 86% | 1572 65% | 1140 20% |
| Colorchecker dE 2000 * | 5.9 | 2.1 64% | 2.9 51% | 1.2 80% | 0.9 85% | 1.5 75% | 4.73 20% |
| Colorchecker dE 2000 max. * | 20.1 | 5.6 72% | 7.1 65% | 2.5 88% | 2.6 87% | 4.3 79% | 8.45 58% |
| Colorchecker dE 2000 calibrated * | 4.5 | 0.8 82% | 1.3 71% | 1 78% | 0.8 82% | 1.4 69% | 0.51 89% |
| Greyscale dE 2000 * | 5.3 | 3.4 36% | 4.3 19% | 1.4 74% | 1.1 79% | 1.3 75% | 3.6 32% |
| Gamma | 2.1 105% | 2.32 95% | 2.25 98% | 2.1 105% | 2.15 102% | 2.26 97% | 2.08 106% |
| CCT | 6307 103% | 7162 91% | 7265 89% | 6492 100% | 6656 98% | 6435 101% | 6447 101% |
| Color Space (Percent of AdobeRGB 1998) (%) | 57.7 | 85.3 | 84.5 | ||||
| Color Space (Percent of sRGB) (%) | 90.8 | 99.2 | 98.6 | ||||
| Media totale (Programma / Settaggio) | 45% /
46% | 38% /
41% | 60% /
67% | 58% /
66% | 25% /
39% | 42% /
42% |
* ... Meglio usare valori piccoli
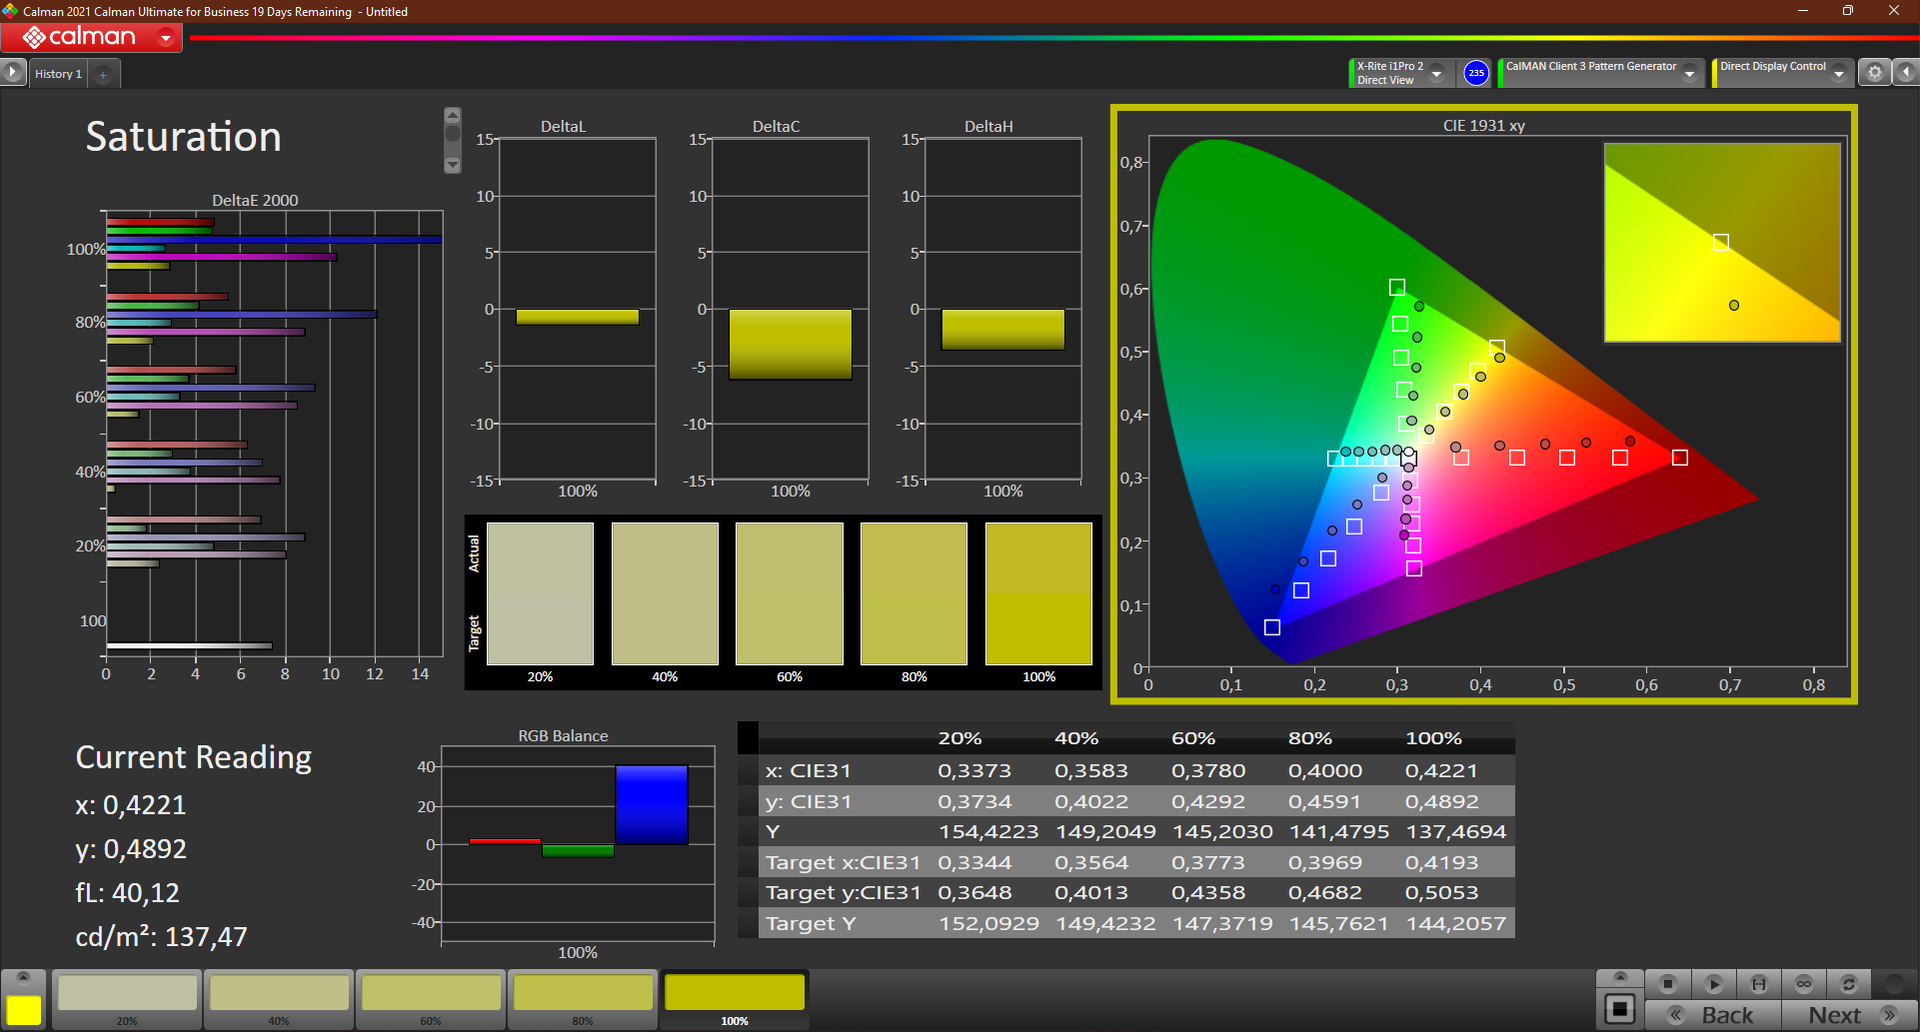
Lo spazio colore più piccolo che abbiamo misurato (sRGB) è coperto solo al 65%. Se avete bisogno di spazi di colore più ampi, dovrete utilizzare altre opzioni di visualizzazione, poiché il modello da noi testato non è adatto per un editing ambizioso delle immagini.

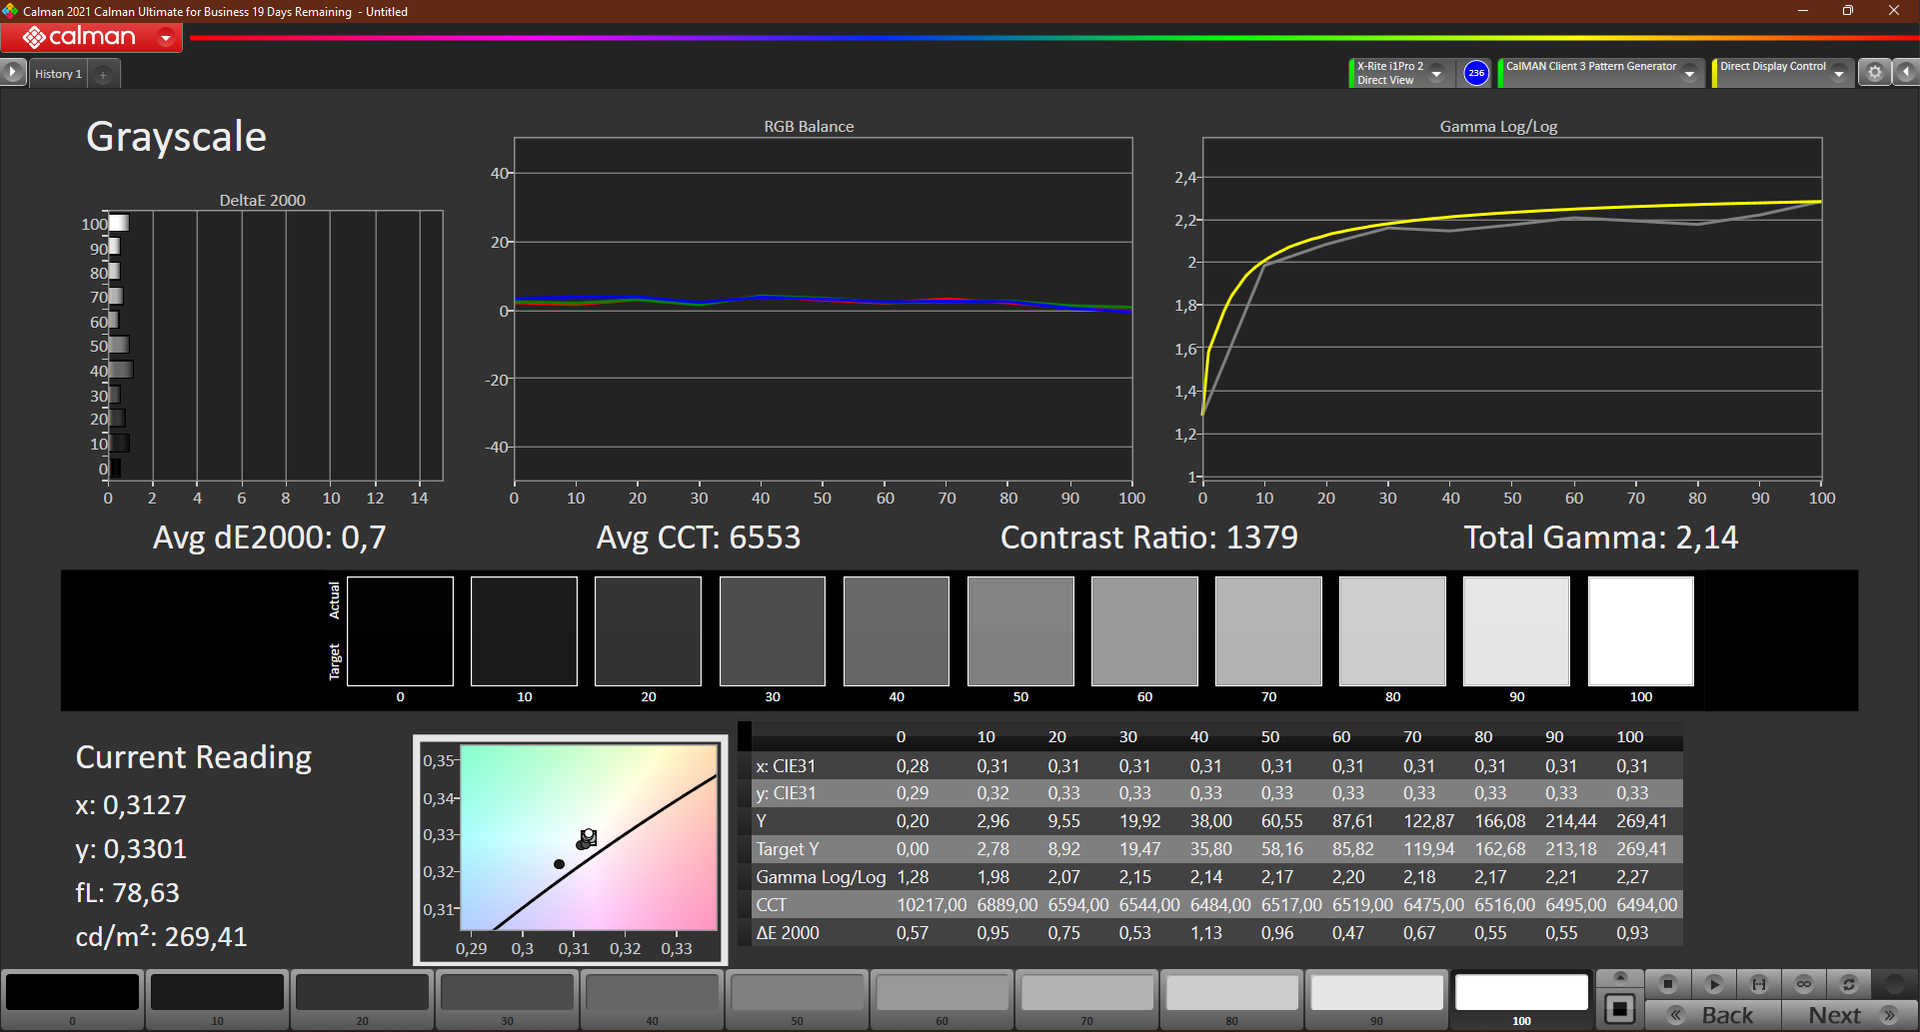
Il bilanciamento RGB è migliorato dopo la calibrazione con CalMan e il colorimetro X-Rite i1 Pro 2. Il blu, in particolare, si discosta notevolmente con un valore DeltaE di ~15. Il blu, in particolare, si discosta significativamente con un valore di DeltaE di ~15. Anche il rapporto di contrasto è aumentato del 45%, passando a 1.379:1. Tuttavia, la luminosità è diminuita di circa 20 nits a causa del processo. Come sempre, il nostro profilo colore ICC è disponibile per il download accanto al grafico dell'illuminazione.
Tempi di risposta del Display
| ↔ Tempi di risposta dal Nero al Bianco | ||
|---|---|---|
| 28 ms ... aumenta ↗ e diminuisce ↘ combinato | ↗ 17 ms Incremento | 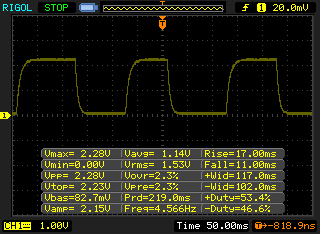 |
| ↘ 11 ms Calo | ||
| Lo schermo mostra tempi di risposta relativamente lenti nei nostri tests e potrebbe essere troppo lento per i gamers. In confronto, tutti i dispositivi di test variano da 0.1 (minimo) a 240 (massimo) ms. » 71 % di tutti i dispositivi è migliore. Questo significa che i tempi di risposta rilevati sono peggiori rispetto alla media di tutti i dispositivi testati (19.8 ms). | ||
| ↔ Tempo di risposta dal 50% Grigio all'80% Grigio | ||
| 48 ms ... aumenta ↗ e diminuisce ↘ combinato | ↗ 26 ms Incremento | 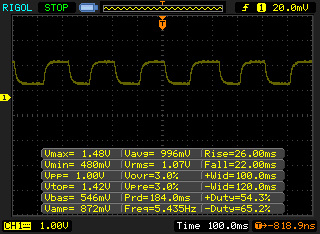 |
| ↘ 22 ms Calo | ||
| Lo schermo mostra tempi di risposta lenti nei nostri tests e sarà insoddisfacente per i gamers. In confronto, tutti i dispositivi di test variano da 0.165 (minimo) a 636 (massimo) ms. » 82 % di tutti i dispositivi è migliore. Questo significa che i tempi di risposta rilevati sono peggiori rispetto alla media di tutti i dispositivi testati (31 ms). | ||
Sfarfallio dello schermo / PWM (Pulse-Width Modulation)
| flickering dello schermo / PWM non rilevato | 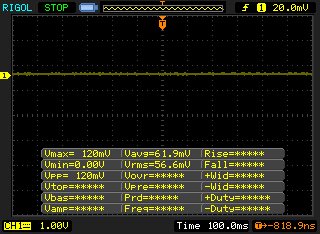 | ||
In confronto: 52 % di tutti i dispositivi testati non utilizza PWM per ridurre la luminosita' del display. Se è rilevato PWM, una media di 7747 (minimo: 5 - massimo: 343500) Hz è stata rilevata. | |||
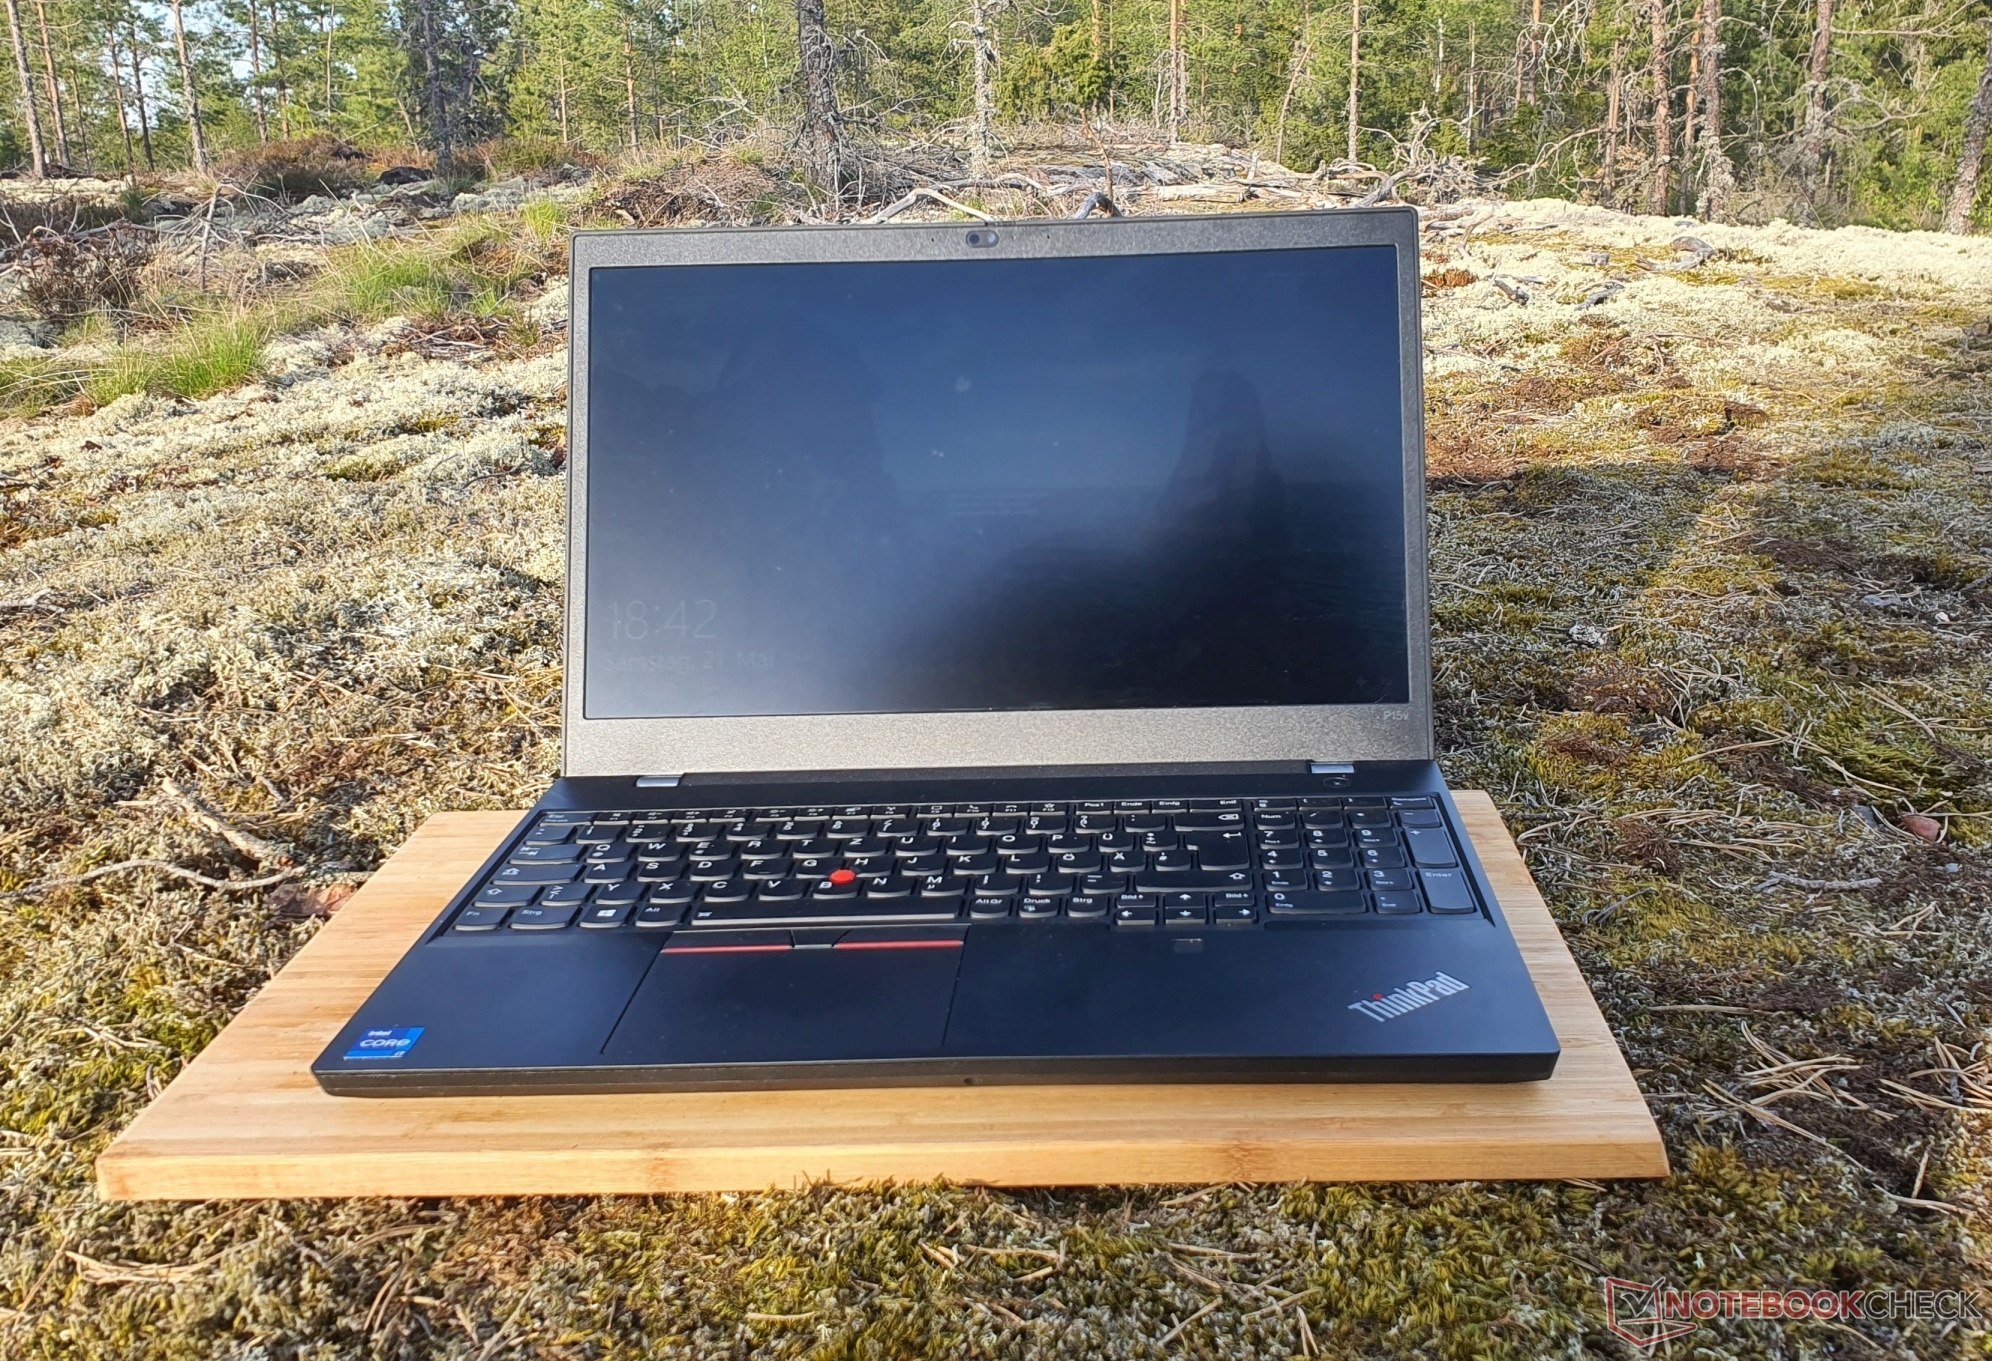
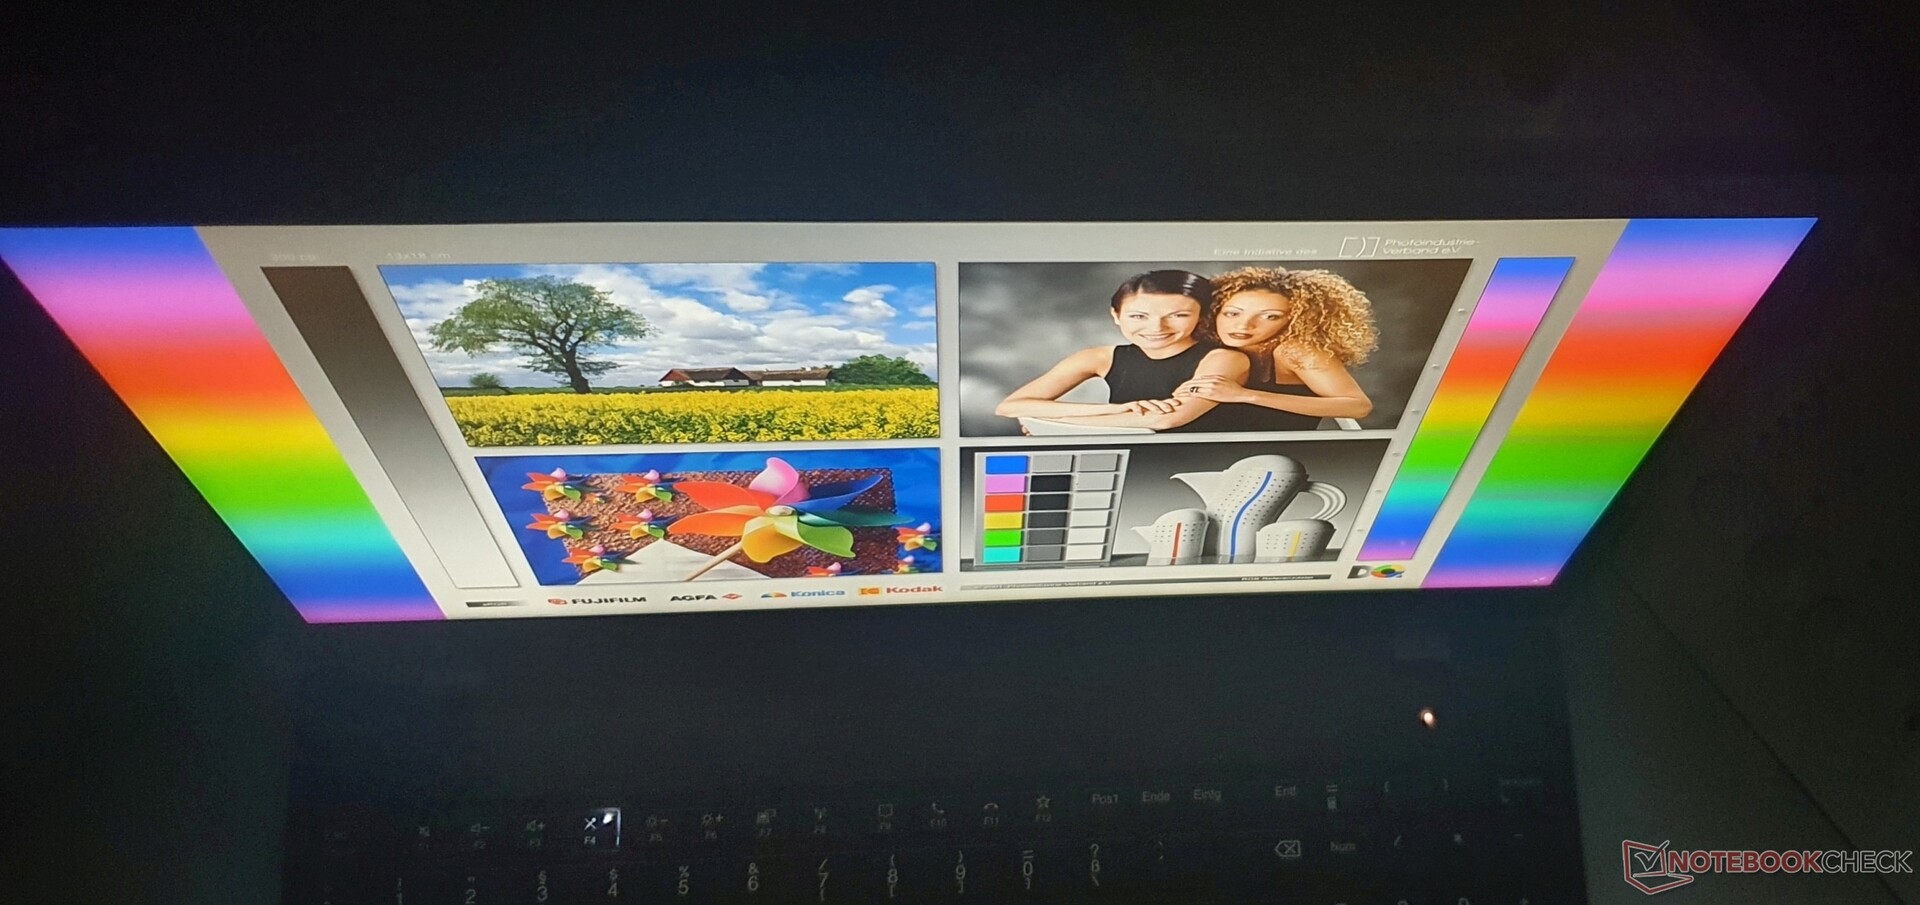
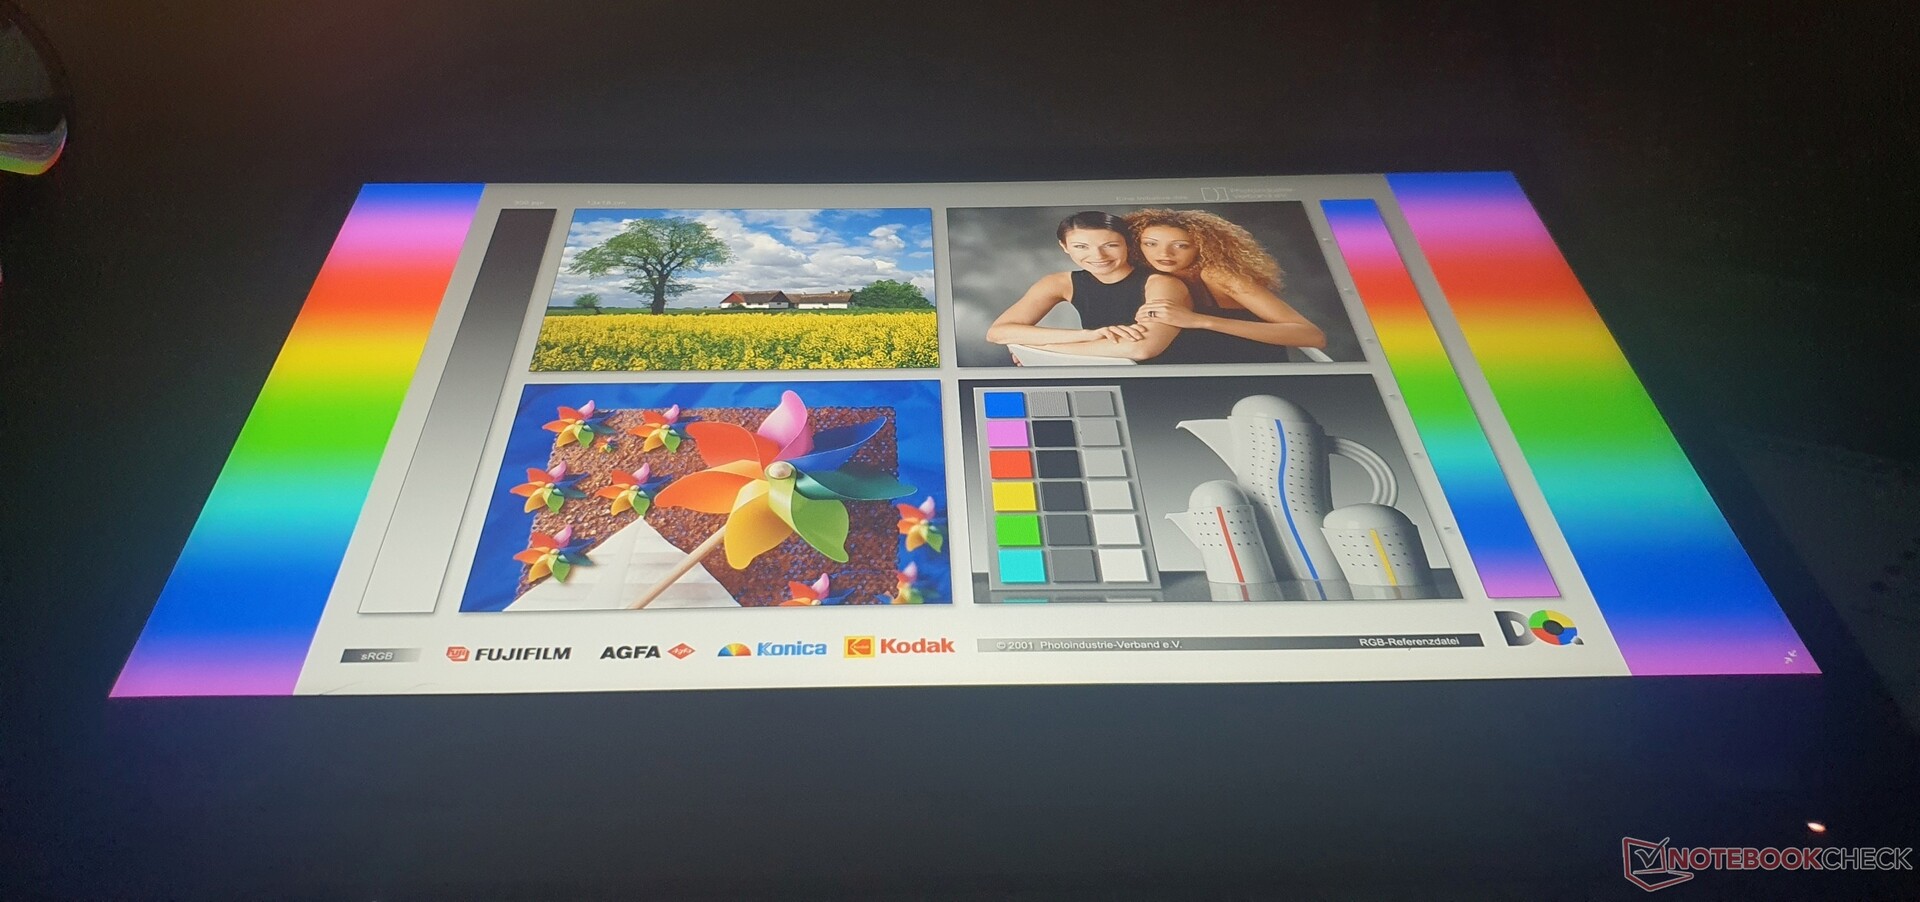
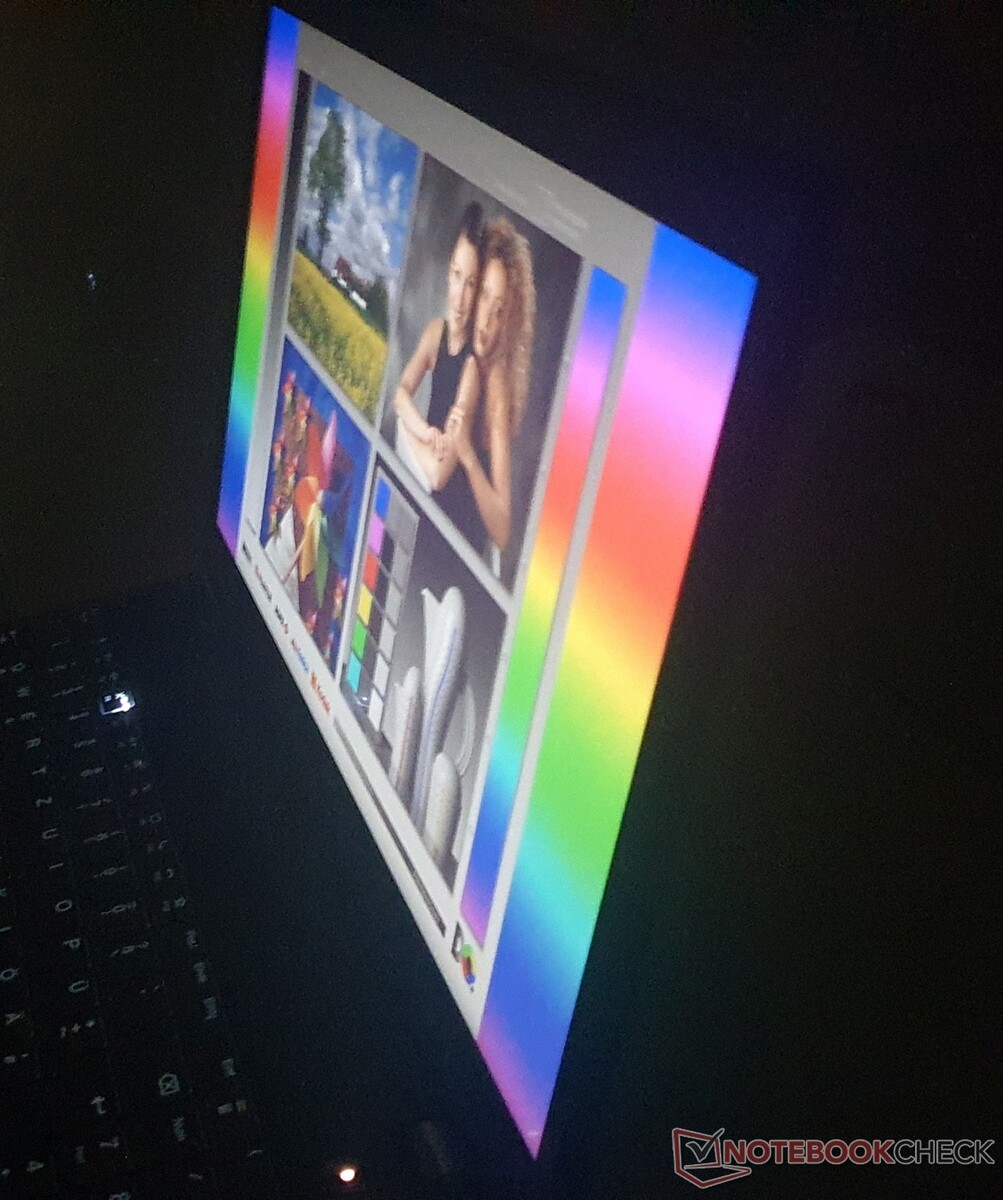
All'aperto, sotto il sole, il display da 280 nit non è abbastanza luminoso, nonostante la superficie opaca. Ma il P15v può essere utilizzato anche all'ombra
La leggibilità del display è molto buona fino a un angolo di visione di circa 170°, tipico degli IPS. Gli OLED hanno prestazioni ancora migliori.
Prestazioni: ThinkPad P15v G2 migliore con Intel Core i9
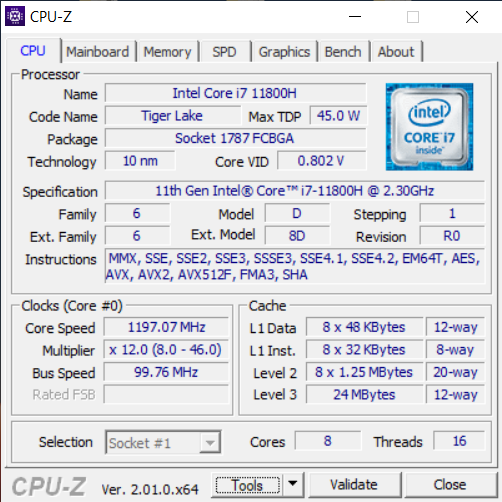
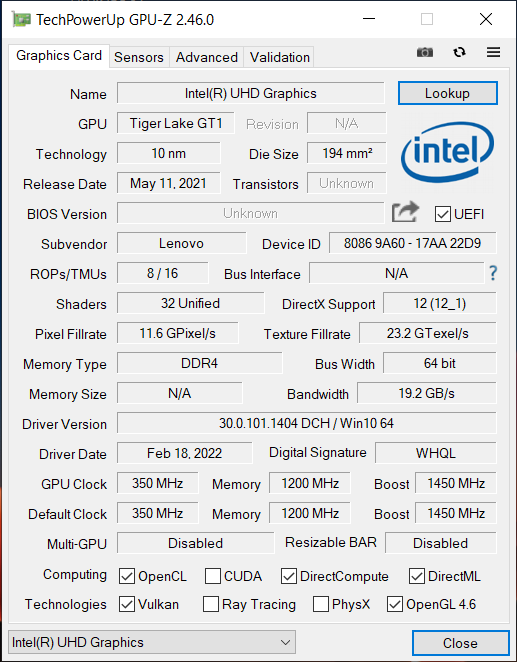
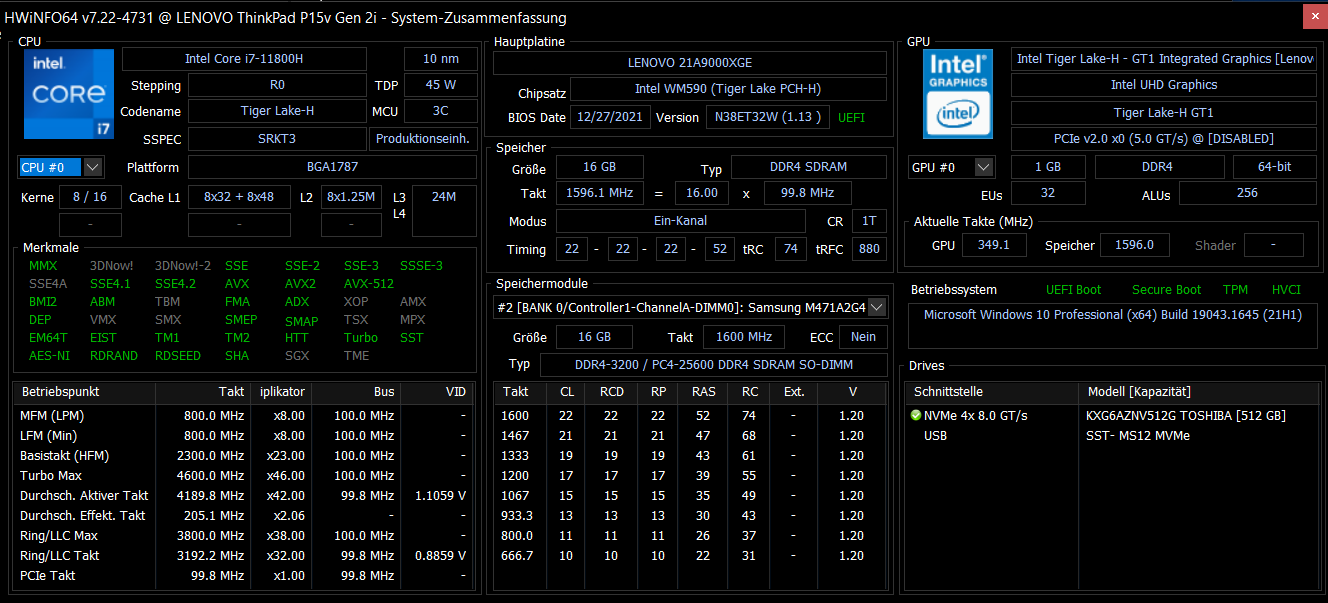
Il nostro modello in prova è dotato di un Intel Tiger-LakeCore i7-11800H in alternativa, è possibile optare per un Core Core i9-11950Hper quanto riguarda la grafica, oltre alla scheda integrata Intel Xe-iGPU (32/16 EU), è possibile scegliere tra una Nvidia T600, T1200 (il nostro modello) o una RTX A2000, ciascuno con certificazioni ISV. Le CPU Xeon e la RAM ECC non sono destinate a quella che dovrebbe essere una workstation economica.
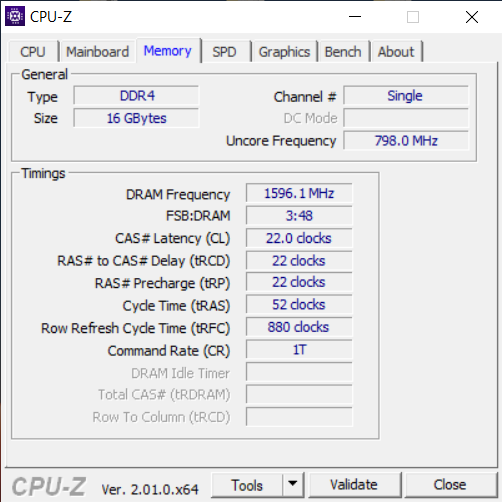
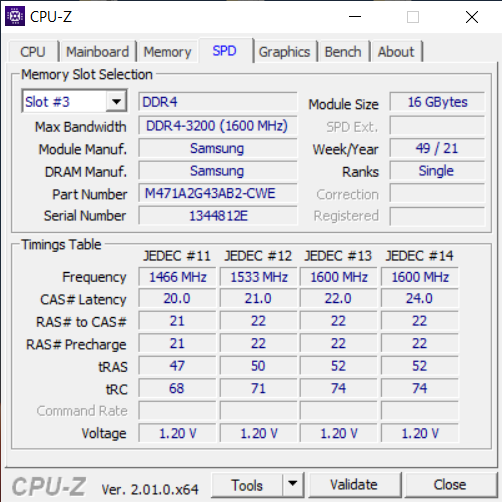
Due SODIMM possono contenere fino a 64 GB di RAM DDR4-3200, mentre il nostro modello è dotato di un modulo da 16 GB in modalità single-channel. Sono presenti anche due slot PCIe 4.0, ciascuno dei quali consente un massimo di 2 TB di SSD NVMe in formato M.2 2280

Processore
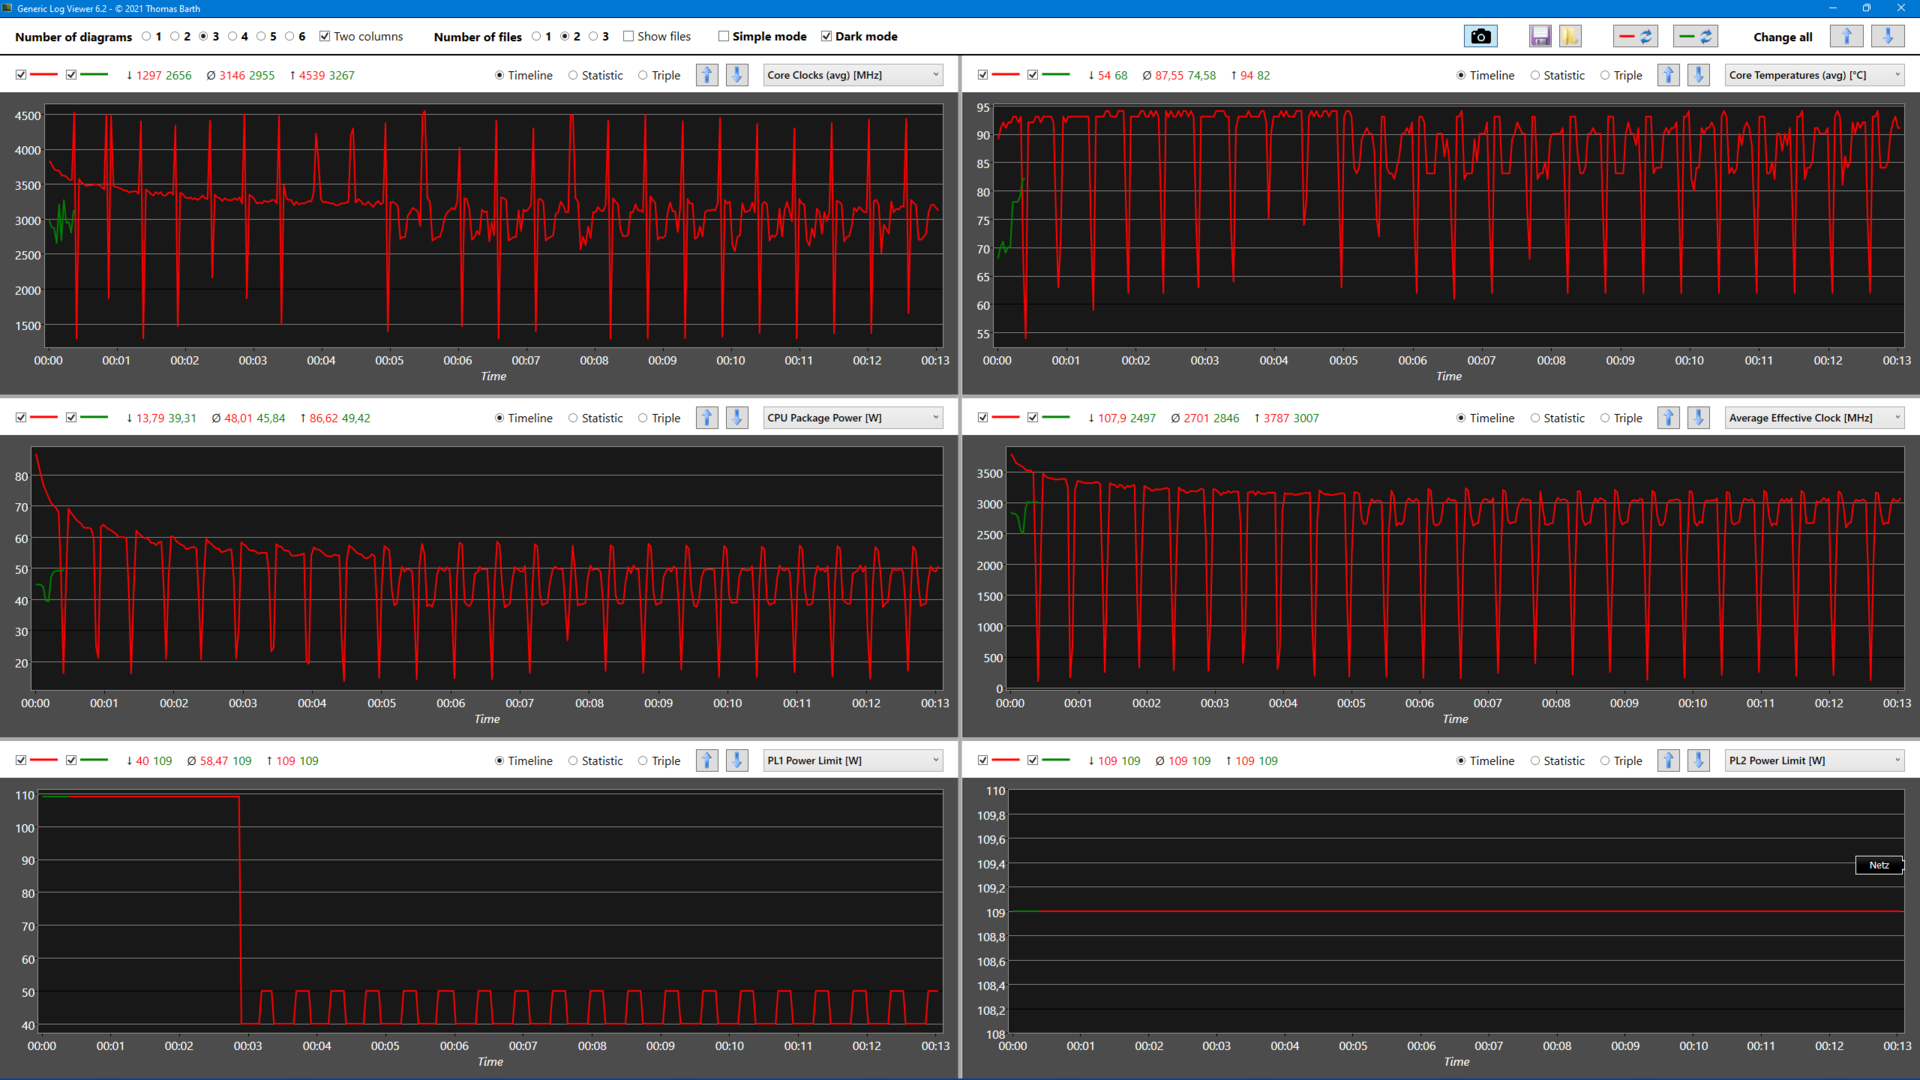
Il processore Intel Core i7-11800Hpromette molta potenza con i suoi otto core, ma nella pratica la CPU non è configurata in modo ottimale nel ThinkPad P15v G2. Nel corso del ciclo CB15, vengono ripetutamente raggiunti 4,6 GHz, mentre la media è di 3,15 GHz. Dopo 10 esecuzioni, sono stati raggiunti solo 1.400 punti in modo costante. Lo spessore ThinkPad P15 G2raggiunge 1.768 punti con la stessa CPU.
Anche il ThinkPad P1 G3 del tester, molto più sottile, raggiunge un punteggio di ~1.700 punti con il Core i9 di prima generazione. In PL2 (iniziale), vengono utilizzati 87 dei 109 watt, ma il problema nasce dai 60 watt (@4,6 GHz) spinti oltre PL1 (50 watt). Di conseguenza, la CPU raggiunge regolarmente i 94 °C ed è soggetta al throttling termico graduale.
Circa il 25% delle prestazioni viene sprecato in alcune applicazioni. Anche la limitazione manuale del TDP a 50 o addirittura 45 watt tramite lo strumento "ThrottleStop" porta a un comportamento fluttuante. È interessante notare che non si è verificato alcun throttling con un consumo costante di 50 watt durante lo stress test con Prime95. Un aggiornamento del BIOS non ha aiutato. Rimane il dubbio se questo calo di prestazioni possa essere rimediato con un Core i9 più flessibile, e questa opzione è costosa. Come minimo, il predecessore è chiaramente superato, ma lo ZBook Power 15 di HP è circa il 30% più veloce con lo stesso Core i7.
Il punteggio OpenCL relativo alle workstation è solo la metà di quello del ThinkPad P15, soprattutto a causa della GPU più debole. Questa discrepanza è ancora più marcata in V-Ray 5 CUDA. In modalità batteria, le prestazioni calano di circa il 20% (@45 watt).
Cinebench R15 Multi Sustained Load
Cinebench R23: Multi Core | Single Core
Cinebench R20: CPU (Multi Core) | CPU (Single Core)
Cinebench R15: CPU Multi 64Bit | CPU Single 64Bit
Blender: v2.79 BMW27 CPU
7-Zip 18.03: 7z b 4 | 7z b 4 -mmt1
Geekbench 5.5: Multi-Core | Single-Core
HWBOT x265 Benchmark v2.2: 4k Preset
LibreOffice : 20 Documents To PDF
R Benchmark 2.5: Overall mean
V-Ray 5 Benchmark: GPU CUDA
Geekbench 5.5: OpenCL Score
SPECviewperf 13: Solidworks (sw-04) | Siemens NX (snx-03) | Showcase (showcase-02) | Medical (medical-02) | Maya (maya-05) | Energy (energy-02) | Creo (creo-02) | Catia (catia-05) | 3ds Max (3dsmax-06)
SPECviewperf 2020: 1920x1080 Solidworks (solidworks-05) | 1920x1080 Siemens NX (snx-04) | 1920x1080 Medical (medical-03) | 1920x1080 Maya (maya-06) | 1920x1080 Energy (energy-03) | 1920x1080 Creo (creo-03) | 1920x1080 CATIA (catia-06) | 1920x1080 3ds Max (3dsmax-07)
| CPU Performance rating | |
| Media della classe Workstation | |
| Lenovo ThinkPad P15 G2-20YQ001JGE -1! | |
| Media Intel Core i7-11800H | |
| Dell Precision 5000 5560 -4! | |
| Lenovo ThinkPad T15g-20UR000GGE -1! | |
| HP ZBook Power 15 G8 313S5EA | |
| Lenovo ThinkPad T15p-20TN0006GE -18! | |
| Lenovo ThinkPad P15v G2 21A9000XGE -1! | |
| Lenovo ThinkPad P15s Gen2-20W6000GGE -1! | |
| Cinebench R23 / Multi Core | |
| Media della classe Workstation (14621 - 38520, n=23, ultimi 2 anni) | |
| HP ZBook Power 15 G8 313S5EA | |
| Media Intel Core i7-11800H (6508 - 14088, n=48) | |
| Lenovo ThinkPad P15 G2-20YQ001JGE | |
| Lenovo ThinkPad P15v G2 21A9000XGE | |
| Dell Precision 5000 5560 | |
| Lenovo ThinkPad T15g-20UR000GGE | |
| Lenovo ThinkPad T15p-20TN0006GE | |
| Lenovo ThinkPad P15s Gen2-20W6000GGE | |
| Cinebench R23 / Single Core | |
| Media della classe Workstation (1712 - 2228, n=23, ultimi 2 anni) | |
| HP ZBook Power 15 G8 313S5EA | |
| Dell Precision 5000 5560 | |
| Lenovo ThinkPad P15 G2-20YQ001JGE | |
| Media Intel Core i7-11800H (1386 - 1522, n=45) | |
| Lenovo ThinkPad P15s Gen2-20W6000GGE | |
| Lenovo ThinkPad T15g-20UR000GGE | |
| Lenovo ThinkPad T15p-20TN0006GE | |
| Cinebench R20 / CPU (Multi Core) | |
| Media della classe Workstation (5760 - 15043, n=23, ultimi 2 anni) | |
| Media Intel Core i7-11800H (2498 - 5408, n=50) | |
| Lenovo ThinkPad P15 G2-20YQ001JGE | |
| HP ZBook Power 15 G8 313S5EA | |
| Dell Precision 5000 5560 | |
| Lenovo ThinkPad P15v G2 21A9000XGE | |
| Lenovo ThinkPad T15p-20TN0006GE | |
| Lenovo ThinkPad T15g-20UR000GGE | |
| Lenovo ThinkPad P15s Gen2-20W6000GGE | |
| Cinebench R20 / CPU (Single Core) | |
| Media della classe Workstation (671 - 857, n=23, ultimi 2 anni) | |
| HP ZBook Power 15 G8 313S5EA | |
| Dell Precision 5000 5560 | |
| Lenovo ThinkPad P15 G2-20YQ001JGE | |
| Media Intel Core i7-11800H (520 - 586, n=47) | |
| Lenovo ThinkPad P15v G2 21A9000XGE | |
| Lenovo ThinkPad P15s Gen2-20W6000GGE | |
| Lenovo ThinkPad T15g-20UR000GGE | |
| Lenovo ThinkPad T15p-20TN0006GE | |
| Cinebench R15 / CPU Multi 64Bit | |
| Media della classe Workstation (2489 - 5810, n=23, ultimi 2 anni) | |
| HP ZBook Power 15 G8 313S5EA | |
| HP ZBook Power 15 G8 313S5EA | |
| Media Intel Core i7-11800H (1342 - 2173, n=50) | |
| Lenovo ThinkPad P15 G2-20YQ001JGE | |
| Lenovo ThinkPad P15v G2 21A9000XGE | |
| Dell Precision 5000 5560 | |
| Lenovo ThinkPad T15g-20UR000GGE | |
| Lenovo ThinkPad T15p-20TN0006GE | |
| Lenovo ThinkPad P15s Gen2-20W6000GGE | |
| Cinebench R15 / CPU Single 64Bit | |
| Media della classe Workstation (191.4 - 328, n=23, ultimi 2 anni) | |
| Dell Precision 5000 5560 | |
| HP ZBook Power 15 G8 313S5EA | |
| Lenovo ThinkPad P15 G2-20YQ001JGE | |
| Media Intel Core i7-11800H (201 - 231, n=46) | |
| Lenovo ThinkPad P15v G2 21A9000XGE | |
| Lenovo ThinkPad P15s Gen2-20W6000GGE | |
| Lenovo ThinkPad T15g-20UR000GGE | |
| Lenovo ThinkPad T15p-20TN0006GE | |
| Blender / v2.79 BMW27 CPU | |
| Lenovo ThinkPad P15s Gen2-20W6000GGE | |
| Lenovo ThinkPad T15p-20TN0006GE | |
| Lenovo ThinkPad T15g-20UR000GGE | |
| Lenovo ThinkPad P15v G2 21A9000XGE | |
| Dell Precision 5000 5560 | |
| Media Intel Core i7-11800H (217 - 454, n=46) | |
| Lenovo ThinkPad P15 G2-20YQ001JGE | |
| HP ZBook Power 15 G8 313S5EA | |
| Media della classe Workstation (91 - 222, n=23, ultimi 2 anni) | |
| 7-Zip 18.03 / 7z b 4 | |
| Media della classe Workstation (60489 - 116969, n=23, ultimi 2 anni) | |
| Lenovo ThinkPad P15 G2-20YQ001JGE | |
| HP ZBook Power 15 G8 313S5EA | |
| Media Intel Core i7-11800H (33718 - 56758, n=46) | |
| Dell Precision 5000 5560 | |
| Lenovo ThinkPad P15v G2 21A9000XGE | |
| Lenovo ThinkPad T15g-20UR000GGE | |
| Lenovo ThinkPad T15p-20TN0006GE | |
| Lenovo ThinkPad P15s Gen2-20W6000GGE | |
| 7-Zip 18.03 / 7z b 4 -mmt1 | |
| Media della classe Workstation (5126 - 6960, n=23, ultimi 2 anni) | |
| Dell Precision 5000 5560 | |
| HP ZBook Power 15 G8 313S5EA | |
| Media Intel Core i7-11800H (5138 - 5732, n=46) | |
| Lenovo ThinkPad P15 G2-20YQ001JGE | |
| Lenovo ThinkPad P15s Gen2-20W6000GGE | |
| Lenovo ThinkPad T15g-20UR000GGE | |
| Lenovo ThinkPad P15v G2 21A9000XGE | |
| Lenovo ThinkPad T15p-20TN0006GE | |
| Geekbench 5.5 / Multi-Core | |
| Media della classe Workstation (11542 - 25554, n=23, ultimi 2 anni) | |
| Lenovo ThinkPad P15 G2-20YQ001JGE | |
| Media Intel Core i7-11800H (4655 - 9851, n=40) | |
| HP ZBook Power 15 G8 313S5EA | |
| Lenovo ThinkPad T15g-20UR000GGE | |
| Lenovo ThinkPad P15v G2 21A9000XGE | |
| Lenovo ThinkPad T15p-20TN0006GE | |
| Lenovo ThinkPad P15s Gen2-20W6000GGE | |
| Geekbench 5.5 / Single-Core | |
| Media della classe Workstation (1783 - 2183, n=23, ultimi 2 anni) | |
| Lenovo ThinkPad P15 G2-20YQ001JGE | |
| Media Intel Core i7-11800H (1429 - 1625, n=40) | |
| Lenovo ThinkPad P15s Gen2-20W6000GGE | |
| HP ZBook Power 15 G8 313S5EA | |
| Lenovo ThinkPad P15v G2 21A9000XGE | |
| Lenovo ThinkPad T15g-20UR000GGE | |
| Lenovo ThinkPad T15p-20TN0006GE | |
| HWBOT x265 Benchmark v2.2 / 4k Preset | |
| Media della classe Workstation (17.8 - 40.5, n=23, ultimi 2 anni) | |
| Lenovo ThinkPad P15 G2-20YQ001JGE | |
| HP ZBook Power 15 G8 313S5EA | |
| Media Intel Core i7-11800H (7.38 - 17.4, n=46) | |
| Dell Precision 5000 5560 | |
| Lenovo ThinkPad P15v G2 21A9000XGE | |
| Lenovo ThinkPad T15g-20UR000GGE | |
| Lenovo ThinkPad T15p-20TN0006GE | |
| Lenovo ThinkPad P15s Gen2-20W6000GGE | |
| LibreOffice / 20 Documents To PDF | |
| Lenovo ThinkPad P15v G2 21A9000XGE | |
| Lenovo ThinkPad P15 G2-20YQ001JGE | |
| Lenovo ThinkPad T15g-20UR000GGE | |
| Dell Precision 5000 5560 | |
| Media della classe Workstation (37.1 - 74.7, n=23, ultimi 2 anni) | |
| Media Intel Core i7-11800H (38.6 - 59.9, n=45) | |
| Lenovo ThinkPad P15s Gen2-20W6000GGE | |
| Lenovo ThinkPad T15p-20TN0006GE | |
| HP ZBook Power 15 G8 313S5EA | |
| R Benchmark 2.5 / Overall mean | |
| Lenovo ThinkPad T15p-20TN0006GE | |
| HP ZBook Power 15 G8 313S5EA | |
| Lenovo ThinkPad P15v G2 21A9000XGE | |
| Lenovo ThinkPad T15g-20UR000GGE | |
| Lenovo ThinkPad P15 G2-20YQ001JGE | |
| Media Intel Core i7-11800H (0.548 - 0.615, n=46) | |
| Lenovo ThinkPad P15s Gen2-20W6000GGE | |
| Dell Precision 5000 5560 | |
| Media della classe Workstation (0.3825 - 0.603, n=23, ultimi 2 anni) | |
| V-Ray 5 Benchmark / GPU CUDA | |
| Media della classe Workstation (989 - 3239, n=9, ultimi 2 anni) | |
| Media Intel Core i7-11800H (164 - 1238, n=16) | |
| Lenovo ThinkPad P15v G2 21A9000XGE | |
| HP ZBook Power 15 G8 313S5EA | |
| Geekbench 5.5 / OpenCL Score | |
| Media della classe Workstation (33651 - 272866, n=23, ultimi 2 anni) | |
| Lenovo ThinkPad P15 G2-20YQ001JGE | |
| Lenovo ThinkPad T15g-20UR000GGE | |
| Media Intel Core i7-11800H (8476 - 129333, n=46) | |
| Lenovo ThinkPad P15v G2 21A9000XGE | |
| HP ZBook Power 15 G8 313S5EA | |
| Lenovo ThinkPad P15s Gen2-20W6000GGE | |
| Lenovo ThinkPad T15p-20TN0006GE | |
| SPECviewperf 13 / Solidworks (sw-04) | |
| Media della classe Workstation (147.5 - 230, n=10, ultimi 2 anni) | |
| Lenovo ThinkPad P15 G2-20YQ001JGE | |
| Dell Precision 5000 5560 | |
| Lenovo ThinkPad P15v G2 21A9000XGE | |
| Media Intel Core i7-11800H (45.5 - 156.7, n=10) | |
| HP ZBook Power 15 G8 313S5EA | |
| Lenovo ThinkPad P15s Gen2-20W6000GGE | |
| Lenovo ThinkPad T15g-20UR000GGE | |
| SPECviewperf 13 / Siemens NX (snx-03) | |
| Media della classe Workstation (331 - 879, n=10, ultimi 2 anni) | |
| Lenovo ThinkPad P15 G2-20YQ001JGE | |
| Dell Precision 5000 5560 | |
| Lenovo ThinkPad P15v G2 21A9000XGE | |
| HP ZBook Power 15 G8 313S5EA | |
| Media Intel Core i7-11800H (5.45 - 250, n=10) | |
| Lenovo ThinkPad P15s Gen2-20W6000GGE | |
| Lenovo ThinkPad T15g-20UR000GGE | |
| SPECviewperf 13 / Showcase (showcase-02) | |
| Media della classe Workstation (85.3 - 319, n=10, ultimi 2 anni) | |
| Lenovo ThinkPad T15g-20UR000GGE | |
| Lenovo ThinkPad P15 G2-20YQ001JGE | |
| Media Intel Core i7-11800H (11.3 - 138, n=10) | |
| Dell Precision 5000 5560 | |
| Lenovo ThinkPad P15v G2 21A9000XGE | |
| HP ZBook Power 15 G8 313S5EA | |
| Lenovo ThinkPad P15s Gen2-20W6000GGE | |
| SPECviewperf 13 / Medical (medical-02) | |
| Media della classe Workstation (169.9 - 363, n=10, ultimi 2 anni) | |
| Lenovo ThinkPad P15 G2-20YQ001JGE | |
| Dell Precision 5000 5560 | |
| Media Intel Core i7-11800H (4.96 - 89.2, n=10) | |
| Lenovo ThinkPad P15v G2 21A9000XGE | |
| Lenovo ThinkPad T15g-20UR000GGE | |
| HP ZBook Power 15 G8 313S5EA | |
| Lenovo ThinkPad P15s Gen2-20W6000GGE | |
| SPECviewperf 13 / Maya (maya-05) | |
| Media della classe Workstation (287 - 448, n=5, ultimi 2 anni) | |
| Lenovo ThinkPad P15 G2-20YQ001JGE | |
| Lenovo ThinkPad T15g-20UR000GGE | |
| Media Intel Core i7-11800H (32 - 337, n=10) | |
| Dell Precision 5000 5560 | |
| Lenovo ThinkPad P15v G2 21A9000XGE | |
| HP ZBook Power 15 G8 313S5EA | |
| Lenovo ThinkPad P15s Gen2-20W6000GGE | |
| SPECviewperf 13 / Energy (energy-02) | |
| Media della classe Workstation (49.5 - 174.7, n=10, ultimi 2 anni) | |
| Lenovo ThinkPad P15 G2-20YQ001JGE | |
| Dell Precision 5000 5560 | |
| Media Intel Core i7-11800H (1.15 - 41.2, n=10) | |
| Lenovo ThinkPad T15g-20UR000GGE | |
| Lenovo ThinkPad P15v G2 21A9000XGE | |
| HP ZBook Power 15 G8 313S5EA | |
| Lenovo ThinkPad P15s Gen2-20W6000GGE | |
| SPECviewperf 13 / Creo (creo-02) | |
| Media della classe Workstation (262 - 589, n=10, ultimi 2 anni) | |
| Lenovo ThinkPad P15 G2-20YQ001JGE | |
| Dell Precision 5000 5560 | |
| Lenovo ThinkPad T15g-20UR000GGE | |
| Media Intel Core i7-11800H (22.5 - 225, n=10) | |
| Lenovo ThinkPad P15v G2 21A9000XGE | |
| HP ZBook Power 15 G8 313S5EA | |
| Lenovo ThinkPad P15s Gen2-20W6000GGE | |
| SPECviewperf 13 / Catia (catia-05) | |
| Media della classe Workstation (301 - 552, n=10, ultimi 2 anni) | |
| Lenovo ThinkPad P15 G2-20YQ001JGE | |
| Dell Precision 5000 5560 | |
| Media Intel Core i7-11800H (31.9 - 257, n=10) | |
| Lenovo ThinkPad P15v G2 21A9000XGE | |
| HP ZBook Power 15 G8 313S5EA | |
| Lenovo ThinkPad T15g-20UR000GGE | |
| Lenovo ThinkPad P15s Gen2-20W6000GGE | |
| SPECviewperf 13 / 3ds Max (3dsmax-06) | |
| Media della classe Workstation (202 - 422, n=10, ultimi 2 anni) | |
| Lenovo ThinkPad P15 G2-20YQ001JGE | |
| Lenovo ThinkPad T15g-20UR000GGE | |
| Media Intel Core i7-11800H (27.2 - 235, n=10) | |
| Dell Precision 5000 5560 | |
| Lenovo ThinkPad P15v G2 21A9000XGE | |
| HP ZBook Power 15 G8 313S5EA | |
| Lenovo ThinkPad P15s Gen2-20W6000GGE | |
| SPECviewperf 2020 / Solidworks (solidworks-05) | |
| Media della classe Workstation (50.6 - 542, n=9, ultimi 2 anni) | |
| Lenovo ThinkPad T15g-20UR000GGE | |
| Lenovo ThinkPad P15 G2-20YQ001JGE | |
| Dell Precision 5000 5560 | |
| Media Intel Core i7-11800H (73.4 - 147.9, n=6) | |
| Lenovo ThinkPad P15v G2 21A9000XGE | |
| HP ZBook Power 15 G8 313S5EA | |
| Lenovo ThinkPad P15s Gen2-20W6000GGE | |
| SPECviewperf 2020 / Siemens NX (snx-04) | |
| Media della classe Workstation (22.3 - 903, n=23, ultimi 2 anni) | |
| Lenovo ThinkPad P15 G2-20YQ001JGE | |
| Dell Precision 5000 5560 | |
| Lenovo ThinkPad P15v G2 21A9000XGE | |
| Media Intel Core i7-11800H (18.7 - 250, n=8) | |
| HP ZBook Power 15 G8 313S5EA | |
| Lenovo ThinkPad P15s Gen2-20W6000GGE | |
| Lenovo ThinkPad T15g-20UR000GGE | |
| SPECviewperf 2020 / Medical (medical-03) | |
| Media della classe Workstation (28.8 - 227, n=23, ultimi 2 anni) | |
| Lenovo ThinkPad P15 G2-20YQ001JGE | |
| Dell Precision 5000 5560 | |
| Media Intel Core i7-11800H (18.7 - 42.7, n=8) | |
| Lenovo ThinkPad T15g-20UR000GGE | |
| Lenovo ThinkPad P15v G2 21A9000XGE | |
| HP ZBook Power 15 G8 313S5EA | |
| Lenovo ThinkPad P15s Gen2-20W6000GGE | |
| SPECviewperf 2020 / Maya (maya-06) | |
| Media della classe Workstation (117.8 - 724, n=22, ultimi 2 anni) | |
| Lenovo ThinkPad P15 G2-20YQ001JGE | |
| Lenovo ThinkPad T15g-20UR000GGE | |
| Dell Precision 5000 5560 | |
| Media Intel Core i7-11800H (125 - 294, n=8) | |
| Lenovo ThinkPad P15v G2 21A9000XGE | |
| HP ZBook Power 15 G8 313S5EA | |
| Lenovo ThinkPad P15s Gen2-20W6000GGE | |
| SPECviewperf 2020 / Energy (energy-03) | |
| Media della classe Workstation (17.3 - 176.7, n=23, ultimi 2 anni) | |
| Lenovo ThinkPad P15 G2-20YQ001JGE | |
| Dell Precision 5000 5560 | |
| Media Intel Core i7-11800H (16 - 43.1, n=8) | |
| Lenovo ThinkPad T15g-20UR000GGE | |
| Lenovo ThinkPad P15v G2 21A9000XGE | |
| HP ZBook Power 15 G8 313S5EA | |
| Lenovo ThinkPad P15s Gen2-20W6000GGE | |
| SPECviewperf 2020 / Creo (creo-03) | |
| Media della classe Workstation (49.2 - 261, n=23, ultimi 2 anni) | |
| Lenovo ThinkPad P15 G2-20YQ001JGE | |
| Dell Precision 5000 5560 | |
| Media Intel Core i7-11800H (67.3 - 124.5, n=8) | |
| Lenovo ThinkPad T15g-20UR000GGE | |
| Lenovo ThinkPad P15v G2 21A9000XGE | |
| HP ZBook Power 15 G8 313S5EA | |
| Lenovo ThinkPad P15s Gen2-20W6000GGE | |
| SPECviewperf 2020 / CATIA (catia-06) | |
| Media della classe Workstation (27.1 - 182.2, n=23, ultimi 2 anni) | |
| Lenovo ThinkPad P15 G2-20YQ001JGE | |
| Dell Precision 5000 5560 | |
| Media Intel Core i7-11800H (33.1 - 80.5, n=8) | |
| Lenovo ThinkPad T15g-20UR000GGE | |
| Lenovo ThinkPad P15v G2 21A9000XGE | |
| HP ZBook Power 15 G8 313S5EA | |
| Lenovo ThinkPad P15s Gen2-20W6000GGE | |
| SPECviewperf 2020 / 3ds Max (3dsmax-07) | |
| Media della classe Workstation (24.7 - 251, n=23, ultimi 2 anni) | |
| Lenovo ThinkPad T15g-20UR000GGE | |
| Lenovo ThinkPad P15 G2-20YQ001JGE | |
| Media Intel Core i7-11800H (40.9 - 109.4, n=8) | |
| Dell Precision 5000 5560 | |
| Lenovo ThinkPad P15v G2 21A9000XGE | |
| HP ZBook Power 15 G8 313S5EA | |
| Lenovo ThinkPad P15s Gen2-20W6000GGE | |
* ... Meglio usare valori piccoli
AIDA64: FP32 Ray-Trace | FPU Julia | CPU SHA3 | CPU Queen | FPU SinJulia | FPU Mandel | CPU AES | CPU ZLib | FP64 Ray-Trace | CPU PhotoWorxx
| Performance rating | |
| Media della classe Workstation | |
| HP ZBook Power 15 G8 313S5EA | |
| Media Intel Core i7-11800H | |
| Lenovo ThinkPad P15v G2 21A9000XGE | |
| Lenovo ThinkPad T15g-20UR000GGE | |
| Lenovo ThinkPad T15p-20TN0006GE | |
| Lenovo ThinkPad P15s Gen2-20W6000GGE | |
| AIDA64 / FP32 Ray-Trace | |
| Media della classe Workstation (16730 - 61611, n=23, ultimi 2 anni) | |
| HP ZBook Power 15 G8 313S5EA | |
| Media Intel Core i7-11800H (8772 - 15961, n=20) | |
| Lenovo ThinkPad P15v G2 21A9000XGE | |
| Lenovo ThinkPad T15g-20UR000GGE | |
| Lenovo ThinkPad T15p-20TN0006GE | |
| Lenovo ThinkPad P15s Gen2-20W6000GGE | |
| AIDA64 / FPU Julia | |
| Media della classe Workstation (89597 - 186971, n=23, ultimi 2 anni) | |
| HP ZBook Power 15 G8 313S5EA | |
| Media Intel Core i7-11800H (39404 - 65636, n=20) | |
| Lenovo ThinkPad P15v G2 21A9000XGE | |
| Lenovo ThinkPad T15g-20UR000GGE | |
| Lenovo ThinkPad T15p-20TN0006GE | |
| Lenovo ThinkPad P15s Gen2-20W6000GGE | |
| AIDA64 / CPU SHA3 | |
| Media della classe Workstation (4178 - 8975, n=23, ultimi 2 anni) | |
| HP ZBook Power 15 G8 313S5EA | |
| Media Intel Core i7-11800H (2599 - 4439, n=20) | |
| Lenovo ThinkPad P15v G2 21A9000XGE | |
| Lenovo ThinkPad T15g-20UR000GGE | |
| Lenovo ThinkPad T15p-20TN0006GE | |
| Lenovo ThinkPad P15s Gen2-20W6000GGE | |
| AIDA64 / CPU Queen | |
| Media della classe Workstation (60778 - 144411, n=23, ultimi 2 anni) | |
| HP ZBook Power 15 G8 313S5EA | |
| Media Intel Core i7-11800H (85233 - 91941, n=20) | |
| Lenovo ThinkPad P15v G2 21A9000XGE | |
| Lenovo ThinkPad T15p-20TN0006GE | |
| Lenovo ThinkPad T15g-20UR000GGE | |
| Lenovo ThinkPad P15s Gen2-20W6000GGE | |
| AIDA64 / FPU SinJulia | |
| Media della classe Workstation (8165 - 29343, n=23, ultimi 2 anni) | |
| HP ZBook Power 15 G8 313S5EA | |
| Media Intel Core i7-11800H (6420 - 9792, n=20) | |
| Lenovo ThinkPad P15v G2 21A9000XGE | |
| Lenovo ThinkPad T15p-20TN0006GE | |
| Lenovo ThinkPad T15g-20UR000GGE | |
| Lenovo ThinkPad P15s Gen2-20W6000GGE | |
| AIDA64 / FPU Mandel | |
| Media della classe Workstation (44497 - 98153, n=23, ultimi 2 anni) | |
| HP ZBook Power 15 G8 313S5EA | |
| Media Intel Core i7-11800H (23365 - 39464, n=20) | |
| Lenovo ThinkPad P15v G2 21A9000XGE | |
| Lenovo ThinkPad T15g-20UR000GGE | |
| Lenovo ThinkPad T15p-20TN0006GE | |
| Lenovo ThinkPad P15s Gen2-20W6000GGE | |
| AIDA64 / CPU AES | |
| Media Intel Core i7-11800H (74617 - 149388, n=20) | |
| Media della classe Workstation (73133 - 187841, n=23, ultimi 2 anni) | |
| HP ZBook Power 15 G8 313S5EA | |
| Lenovo ThinkPad P15v G2 21A9000XGE | |
| Lenovo ThinkPad P15s Gen2-20W6000GGE | |
| Lenovo ThinkPad T15p-20TN0006GE | |
| Lenovo ThinkPad T15g-20UR000GGE | |
| AIDA64 / CPU ZLib | |
| Media della classe Workstation (929 - 2148, n=23, ultimi 2 anni) | |
| HP ZBook Power 15 G8 313S5EA | |
| Lenovo ThinkPad P15v G2 21A9000XGE | |
| Lenovo ThinkPad T15g-20UR000GGE | |
| Lenovo ThinkPad T15p-20TN0006GE | |
| Lenovo ThinkPad P15s Gen2-20W6000GGE | |
| Media Intel Core i7-11800H (461 - 830, n=43) | |
| AIDA64 / FP64 Ray-Trace | |
| Media della classe Workstation (8545 - 32891, n=23, ultimi 2 anni) | |
| HP ZBook Power 15 G8 313S5EA | |
| Media Intel Core i7-11800H (4545 - 8717, n=21) | |
| Lenovo ThinkPad P15v G2 21A9000XGE | |
| Lenovo ThinkPad T15g-20UR000GGE | |
| Lenovo ThinkPad T15p-20TN0006GE | |
| Lenovo ThinkPad P15s Gen2-20W6000GGE | |
| AIDA64 / CPU PhotoWorxx | |
| Media della classe Workstation (37151 - 93684, n=23, ultimi 2 anni) | |
| Lenovo ThinkPad P15s Gen2-20W6000GGE | |
| Lenovo ThinkPad T15g-20UR000GGE | |
| Media Intel Core i7-11800H (11898 - 26757, n=21) | |
| HP ZBook Power 15 G8 313S5EA | |
| Lenovo ThinkPad T15p-20TN0006GE | |
| Lenovo ThinkPad P15v G2 21A9000XGE | |
Prestazioni del sistema
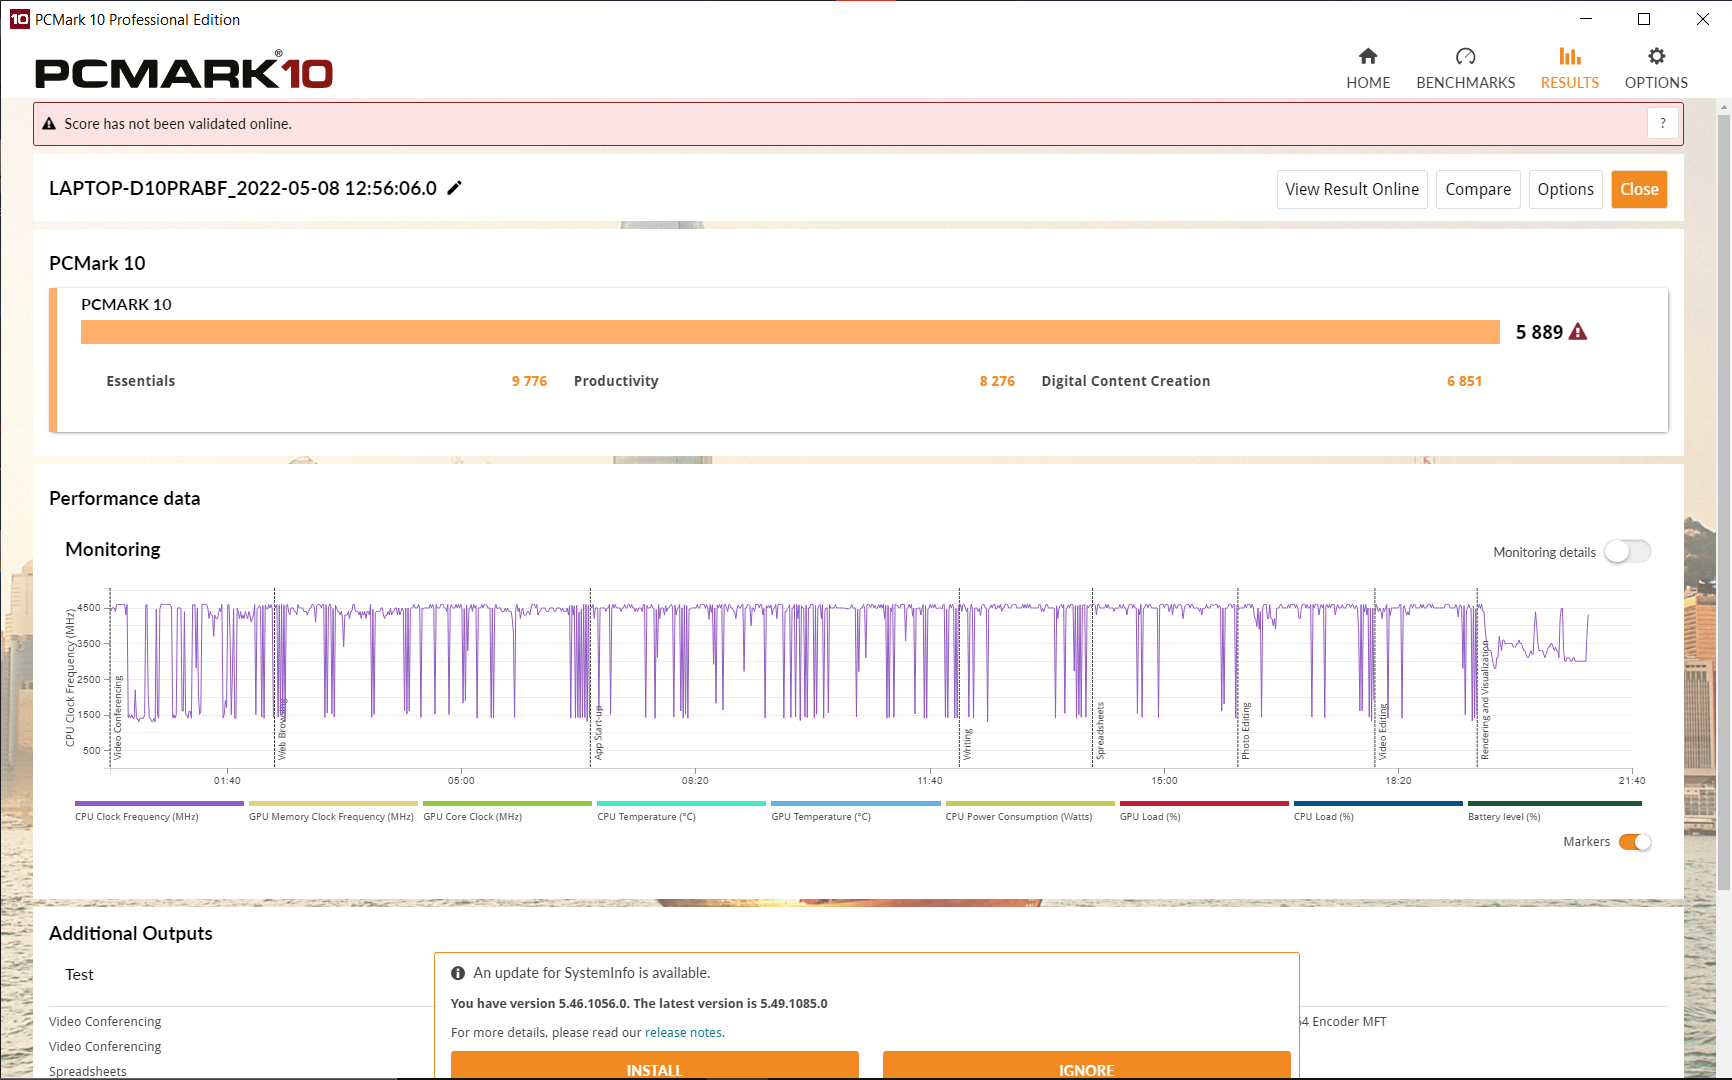
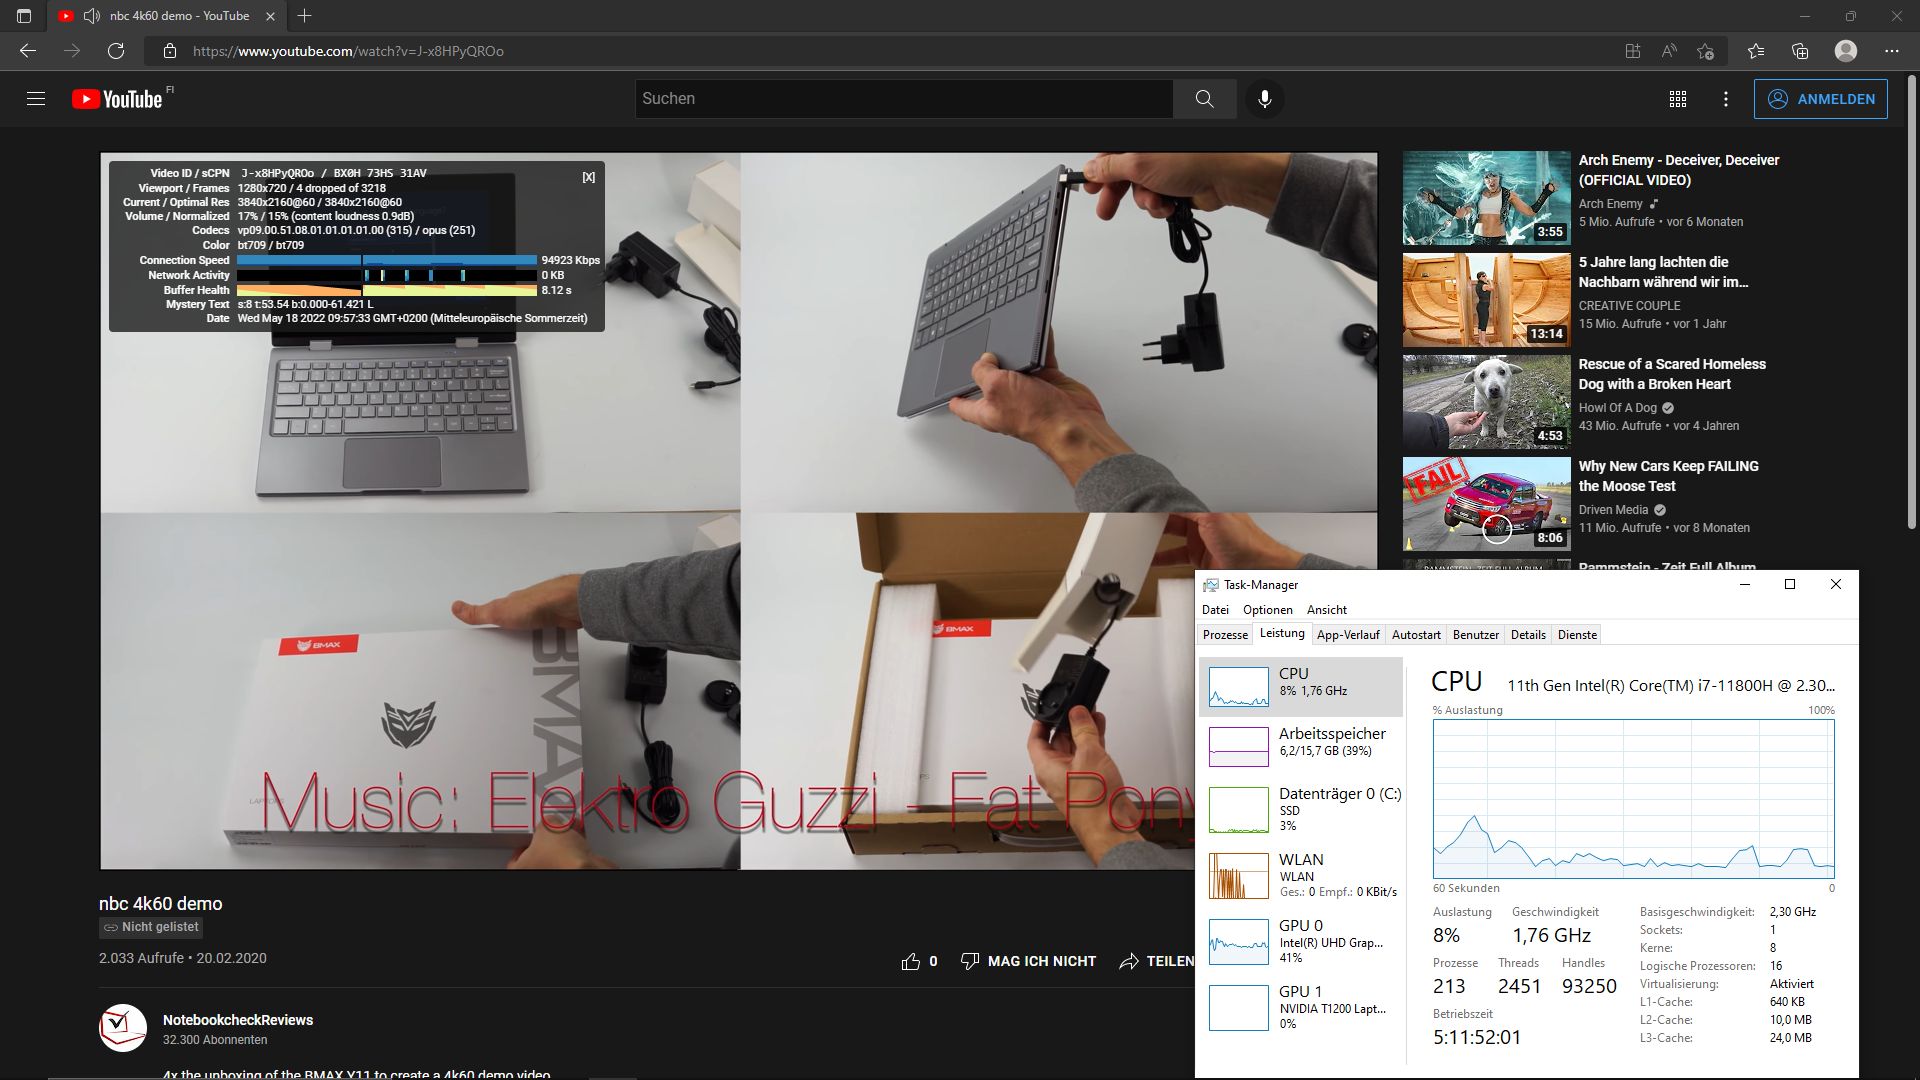
La navigazione con più schede mentre si riproduce un video YouTube in 4k funziona senza problemi.
I risultati dei benchmark sono di buon livello, che possono essere ulteriormente migliorati utilizzando un secondo modulo RAM (modalità dual-channel).
CrossMark: Overall | Productivity | Creativity | Responsiveness
| PCMark 10 / Score | |
| Media della classe Workstation (6563 - 10409, n=19, ultimi 2 anni) | |
| Dell Precision 5000 5560 | |
| Lenovo ThinkPad P15 G2-20YQ001JGE | |
| Lenovo ThinkPad T15g-20UR000GGE | |
| Media Intel Core i7-11800H, NVIDIA T1200 Laptop GPU (5889 - 6147, n=3) | |
| Lenovo ThinkPad P15v G2 21A9000XGE | |
| Lenovo ThinkPad P15s Gen2-20W6000GGE | |
| Lenovo ThinkPad T15p-20TN0006GE | |
| HP ZBook Power 15 G8 313S5EA | |
| PCMark 10 / Essentials | |
| Dell Precision 5000 5560 | |
| Media della classe Workstation (9622 - 11157, n=19, ultimi 2 anni) | |
| Lenovo ThinkPad P15 G2-20YQ001JGE | |
| Media Intel Core i7-11800H, NVIDIA T1200 Laptop GPU (9776 - 9956, n=3) | |
| Lenovo ThinkPad P15v G2 21A9000XGE | |
| Lenovo ThinkPad P15s Gen2-20W6000GGE | |
| Lenovo ThinkPad T15g-20UR000GGE | |
| Lenovo ThinkPad T15p-20TN0006GE | |
| HP ZBook Power 15 G8 313S5EA | |
| PCMark 10 / Productivity | |
| Media della classe Workstation (8789 - 20616, n=19, ultimi 2 anni) | |
| Lenovo ThinkPad P15s Gen2-20W6000GGE | |
| Dell Precision 5000 5560 | |
| Lenovo ThinkPad P15 G2-20YQ001JGE | |
| Media Intel Core i7-11800H, NVIDIA T1200 Laptop GPU (8276 - 8445, n=3) | |
| Lenovo ThinkPad P15v G2 21A9000XGE | |
| Lenovo ThinkPad T15g-20UR000GGE | |
| HP ZBook Power 15 G8 313S5EA | |
| Lenovo ThinkPad T15p-20TN0006GE | |
| PCMark 10 / Digital Content Creation | |
| Media della classe Workstation (8108 - 15631, n=19, ultimi 2 anni) | |
| Lenovo ThinkPad P15 G2-20YQ001JGE | |
| Dell Precision 5000 5560 | |
| Lenovo ThinkPad T15g-20UR000GGE | |
| Media Intel Core i7-11800H, NVIDIA T1200 Laptop GPU (6851 - 7581, n=3) | |
| Lenovo ThinkPad P15v G2 21A9000XGE | |
| Lenovo ThinkPad T15p-20TN0006GE | |
| HP ZBook Power 15 G8 313S5EA | |
| Lenovo ThinkPad P15s Gen2-20W6000GGE | |
| CrossMark / Overall | |
| Media della classe Workstation (1307 - 2267, n=22, ultimi 2 anni) | |
| HP ZBook Power 15 G8 313S5EA | |
| Media Intel Core i7-11800H, NVIDIA T1200 Laptop GPU (1367 - 1526, n=2) | |
| Lenovo ThinkPad P15v G2 21A9000XGE | |
| CrossMark / Productivity | |
| Media della classe Workstation (1130 - 2122, n=22, ultimi 2 anni) | |
| HP ZBook Power 15 G8 313S5EA | |
| Media Intel Core i7-11800H, NVIDIA T1200 Laptop GPU (1389 - 1521, n=2) | |
| Lenovo ThinkPad P15v G2 21A9000XGE | |
| CrossMark / Creativity | |
| Media della classe Workstation (1657 - 2725, n=22, ultimi 2 anni) | |
| HP ZBook Power 15 G8 313S5EA | |
| Media Intel Core i7-11800H, NVIDIA T1200 Laptop GPU (1430 - 1606, n=2) | |
| Lenovo ThinkPad P15v G2 21A9000XGE | |
| CrossMark / Responsiveness | |
| Media della classe Workstation (993 - 2096, n=22, ultimi 2 anni) | |
| Media Intel Core i7-11800H, NVIDIA T1200 Laptop GPU (1137 - 1323, n=2) | |
| HP ZBook Power 15 G8 313S5EA | |
| Lenovo ThinkPad P15v G2 21A9000XGE | |
| PCMark 10 Score | 5889 punti | |
Aiuto | ||
| AIDA64 / Memory Copy | |
| Media della classe Workstation (56003 - 164795, n=23, ultimi 2 anni) | |
| Lenovo ThinkPad P15s Gen2-20W6000GGE | |
| Media Intel Core i7-11800H (24508 - 48144, n=21) | |
| Lenovo ThinkPad T15g-20UR000GGE | |
| HP ZBook Power 15 G8 313S5EA | |
| Lenovo ThinkPad P15v G2 21A9000XGE | |
| Lenovo ThinkPad T15p-20TN0006GE | |
| AIDA64 / Memory Read | |
| Media della classe Workstation (55795 - 121563, n=23, ultimi 2 anni) | |
| Lenovo ThinkPad P15s Gen2-20W6000GGE | |
| Media Intel Core i7-11800H (25882 - 50365, n=20) | |
| Lenovo ThinkPad T15g-20UR000GGE | |
| HP ZBook Power 15 G8 313S5EA | |
| Lenovo ThinkPad P15v G2 21A9000XGE | |
| Lenovo ThinkPad T15p-20TN0006GE | |
| AIDA64 / Memory Write | |
| Media della classe Workstation (55663 - 214520, n=23, ultimi 2 anni) | |
| Lenovo ThinkPad P15s Gen2-20W6000GGE | |
| Lenovo ThinkPad T15g-20UR000GGE | |
| Media Intel Core i7-11800H (22240 - 46214, n=20) | |
| HP ZBook Power 15 G8 313S5EA | |
| Lenovo ThinkPad P15v G2 21A9000XGE | |
| Lenovo ThinkPad T15p-20TN0006GE | |
| AIDA64 / Memory Latency | |
| Media della classe Workstation (84.5 - 165.2, n=23, ultimi 2 anni) | |
| Lenovo ThinkPad P15v G2 21A9000XGE | |
| Lenovo ThinkPad P15s Gen2-20W6000GGE | |
| Lenovo ThinkPad T15p-20TN0006GE | |
| HP ZBook Power 15 G8 313S5EA | |
| Lenovo ThinkPad T15g-20UR000GGE | |
| Media Intel Core i7-11800H (71.9 - 104.1, n=44) | |
* ... Meglio usare valori piccoli
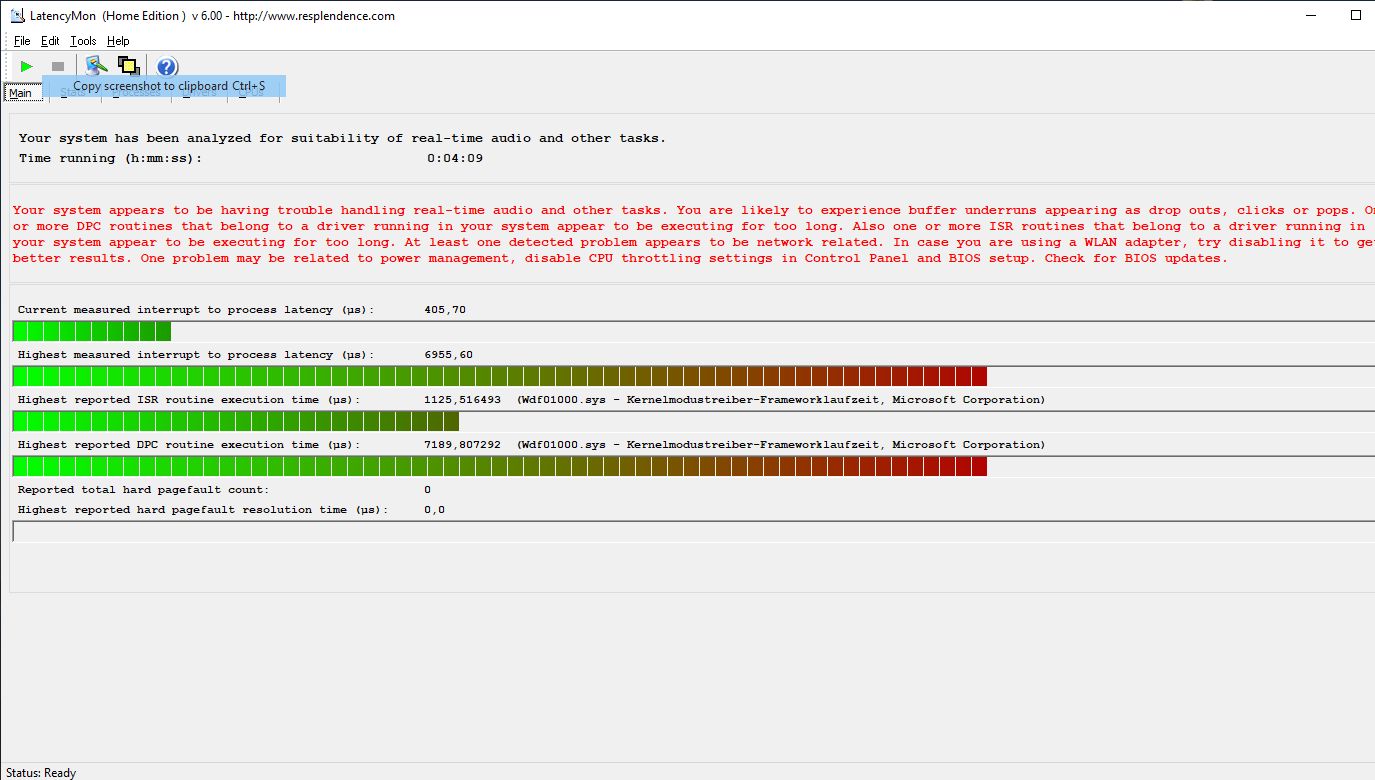
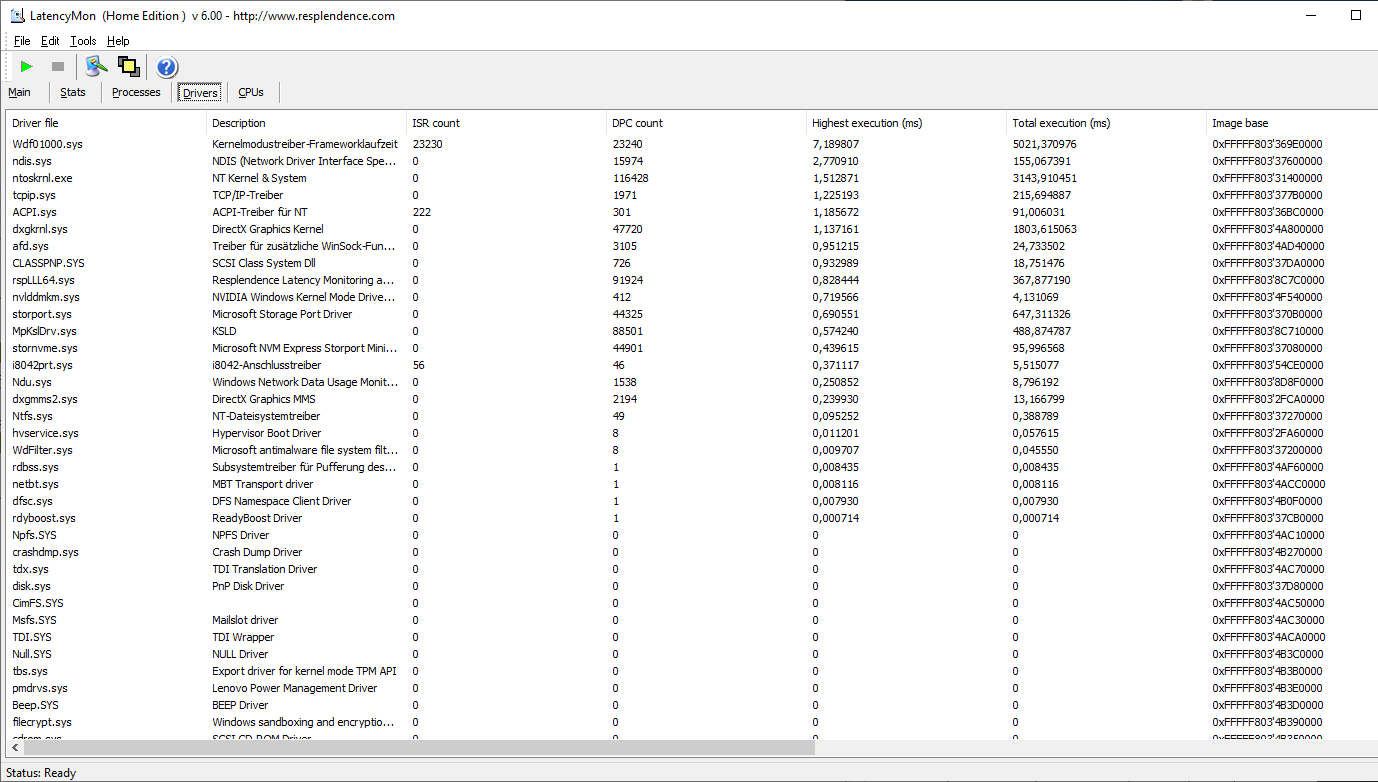
Latenze DPC
Come il più spesso ThinkPad P15 G2, le latenze DPC si sono rivelate pessime con i driver e il BIOS più recenti al momento del test. Come spesso accade, i responsabili sono il modulo kernel e i driver di rete. Il P15v G2 non è quindi adatto all'elaborazione video e audio in tempo reale Precision 5560 di Dell di Dell se la cava molto meglio.
| DPC Latencies / LatencyMon - interrupt to process latency (max), Web, Youtube, Prime95 | |
| Lenovo ThinkPad P15v G2 21A9000XGE | |
| Lenovo ThinkPad P15 G2-20YQ001JGE | |
| Lenovo ThinkPad P15s Gen2-20W6000GGE | |
| Lenovo ThinkPad T15g-20UR000GGE | |
| Lenovo ThinkPad T15p-20TN0006GE | |
| Dell Precision 5000 5560 | |
| HP ZBook Power 15 G8 313S5EA | |
* ... Meglio usare valori piccoli
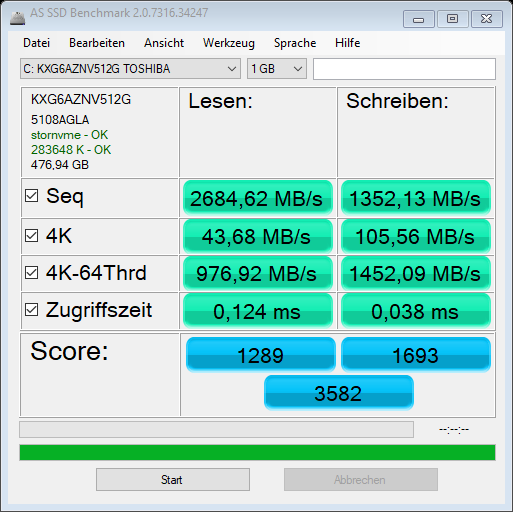
Dispositivi di archiviazione
L'unità SSD NVMe di Toshiba ha una capacità di 512 GB. La velocità è quella prevista per il PCIe 3.0, ma non sempre sufficiente per una workstation.
D'altra parte, è possibile aggiornare fino a due unità SSD PCIe 4.0 più veloci e utilizzarle in una configurazione RAID (0.1). ZBook Power 15 G8 di HP, Precision 5560 di Delle il ThinkPad P15 raggiungono velocità circa doppie.
| Lenovo ThinkPad P15v G2 21A9000XGE T1200 Laptop GPU, i7-11800H, Toshiba XG6 KXG6AZNV512G | Lenovo ThinkPad P15 G2-20YQ001JGE RTX A3000 Laptop GPU, i7-11800H, Kioxia XG7 KXG7AZNV512G | Lenovo ThinkPad T15g-20UR000GGE GeForce RTX 2070 Super Max-Q, i7-10750H, SK Hynix PC401 512GB M.2 (HFS512GD9TNG) | Lenovo ThinkPad T15p-20TN0006GE GeForce GTX 1050 Mobile, i7-10750H, WDC PC SN730 SDBQNTY-512GB | Lenovo ThinkPad P15s Gen2-20W6000GGE T500 Laptop GPU, i7-1165G7, WDC PC SN720 SDAQNTW-1T00 | Dell Precision 5000 5560 RTX A2000 Laptop GPU, i7-11850H, Samsung PM9A1 MZVL22T0HBLB | |
|---|---|---|---|---|---|---|
| AS SSD | 53% | 49% | 16% | 32% | 57% | |
| Seq Read (MB/s) | 2684 | 5105 90% | 2889 8% | 2505 -7% | 2796 4% | 5169 93% |
| Seq Write (MB/s) | 1352 | 1815 34% | 2424 79% | 1230 -9% | 2525 87% | 1986 47% |
| 4K Read (MB/s) | 43.68 | 47.46 9% | 55.6 27% | 42.4 -3% | 50.9 17% | 78 79% |
| 4K Write (MB/s) | 105.56 | 137.3 30% | 144.6 37% | 116.5 10% | 211.9 101% | 214.6 103% |
| 4K-64 Read (MB/s) | 976.92 | 2112 116% | 1569 61% | 1416 45% | 1505 54% | 1232 26% |
| 4K-64 Write (MB/s) | 1452.09 | 1702 17% | 1922 32% | 1809 25% | 949 -35% | 2719 87% |
| Access Time Read * (ms) | 0.124 | 0.065 48% | 0.07 44% | 0.109 12% | 0.081 35% | 0.024 81% |
| Access Time Write * (ms) | 0.038 | 0.03 21% | 0.026 32% | 0.032 16% | 0.019 50% | 0.059 -55% |
| Score Read (Points) | 1289 | 2670 107% | 1914 48% | 1708 33% | 1835 42% | 1827 42% |
| Score Write (Points) | 1693 | 2021 19% | 2309 36% | 2048 21% | 1413 -17% | 3133 85% |
| Score Total (Points) | 3582 | 5885 64% | 5185 45% | 4568 28% | 4177 17% | 5753 61% |
| Copy ISO MB/s (MB/s) | 1760.5 | 2054 17% | 2489 41% | 3201 82% | ||
| Copy Program MB/s (MB/s) | 355 | 714 101% | 728 105% | 415.8 17% | ||
| Copy Game MB/s (MB/s) | 849 | 1431 69% | 1670 97% | 1212 43% |
* ... Meglio usare valori piccoli

* ... Meglio usare valori piccoli
Sustained Read Performance: DiskSpd Read Loop, Queue Depth 8
Scheda grafica
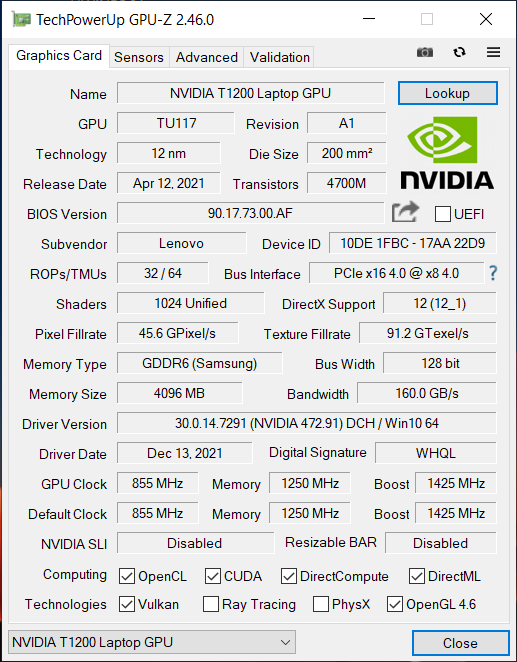
Il Nvidia T1200è la variante professionale della GeForce GTX 1650 Tiha 4 GB di VRAM GDDR6 ed è potenziata a 1.425 MHz. È più del doppio più veloce della GeForce GTX 1050 del predecessore e del suo modello gemello in molti benchmark. Una differenza ancora maggiore è data dalla scheda opzionale RTX A2000.
In modalità batteria, il TGP da 40 W si riduce a 30 watt e la velocità di clock scende di 250 MHz. Le prestazioni diminuiscono di conseguenza del 15%. In questo scenario, la CPU si fa carico di 7 watt in più dal TDP condiviso.
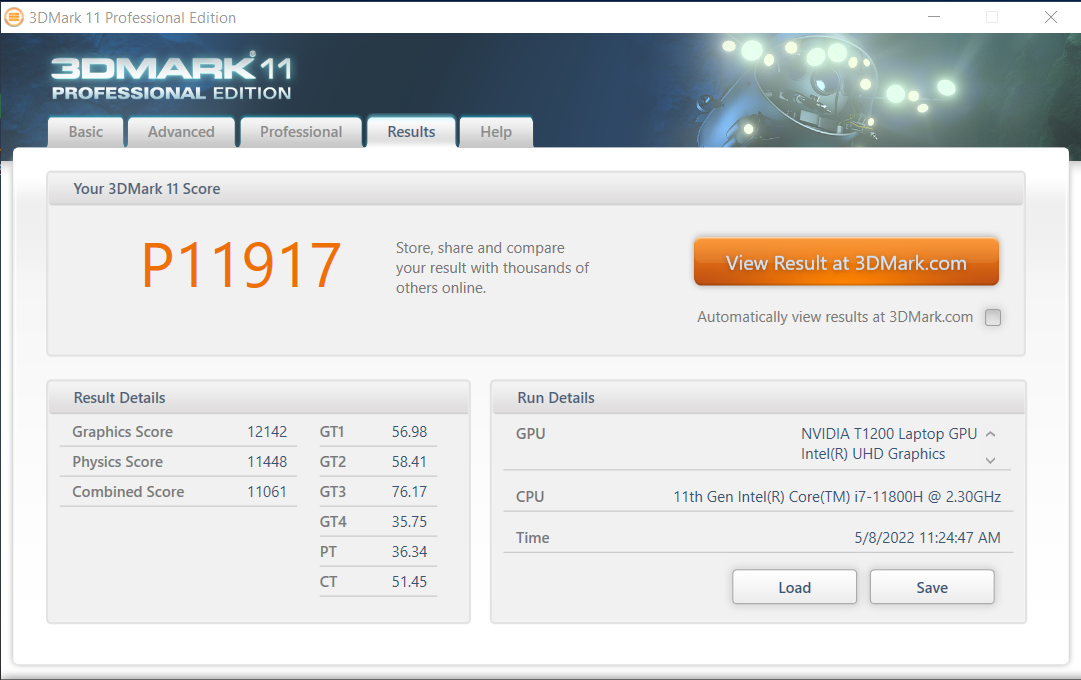
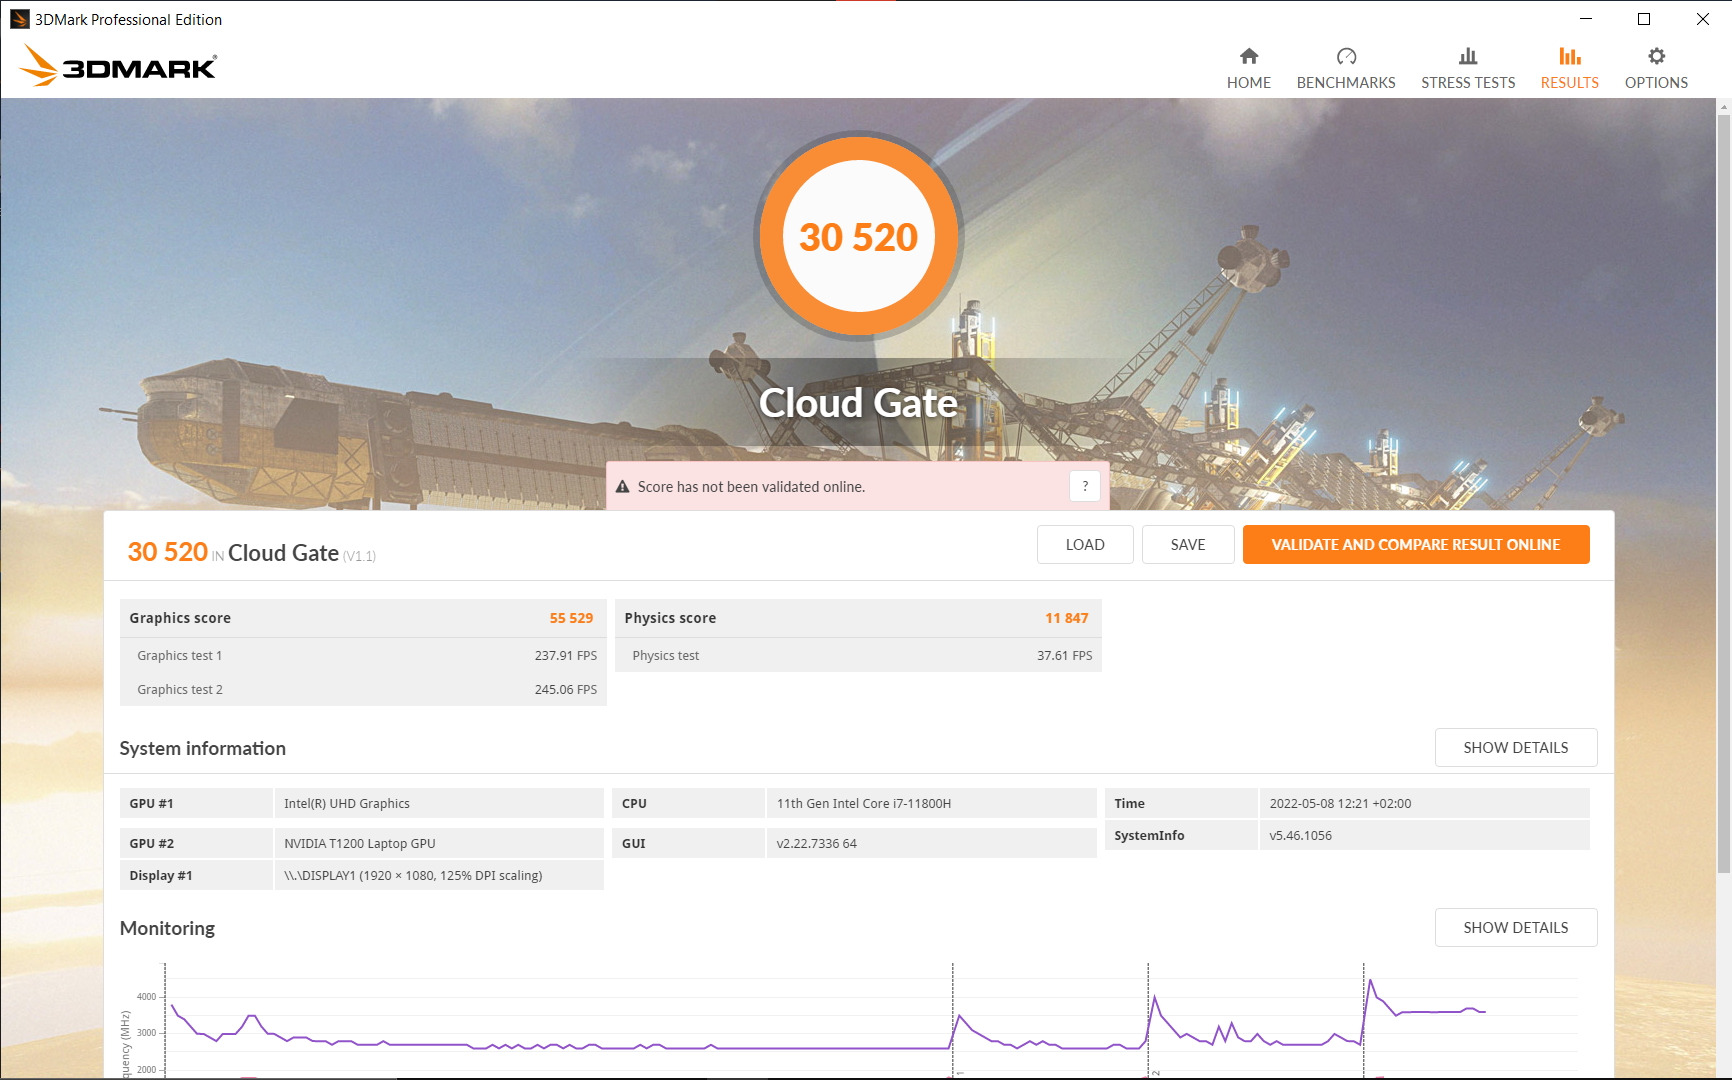
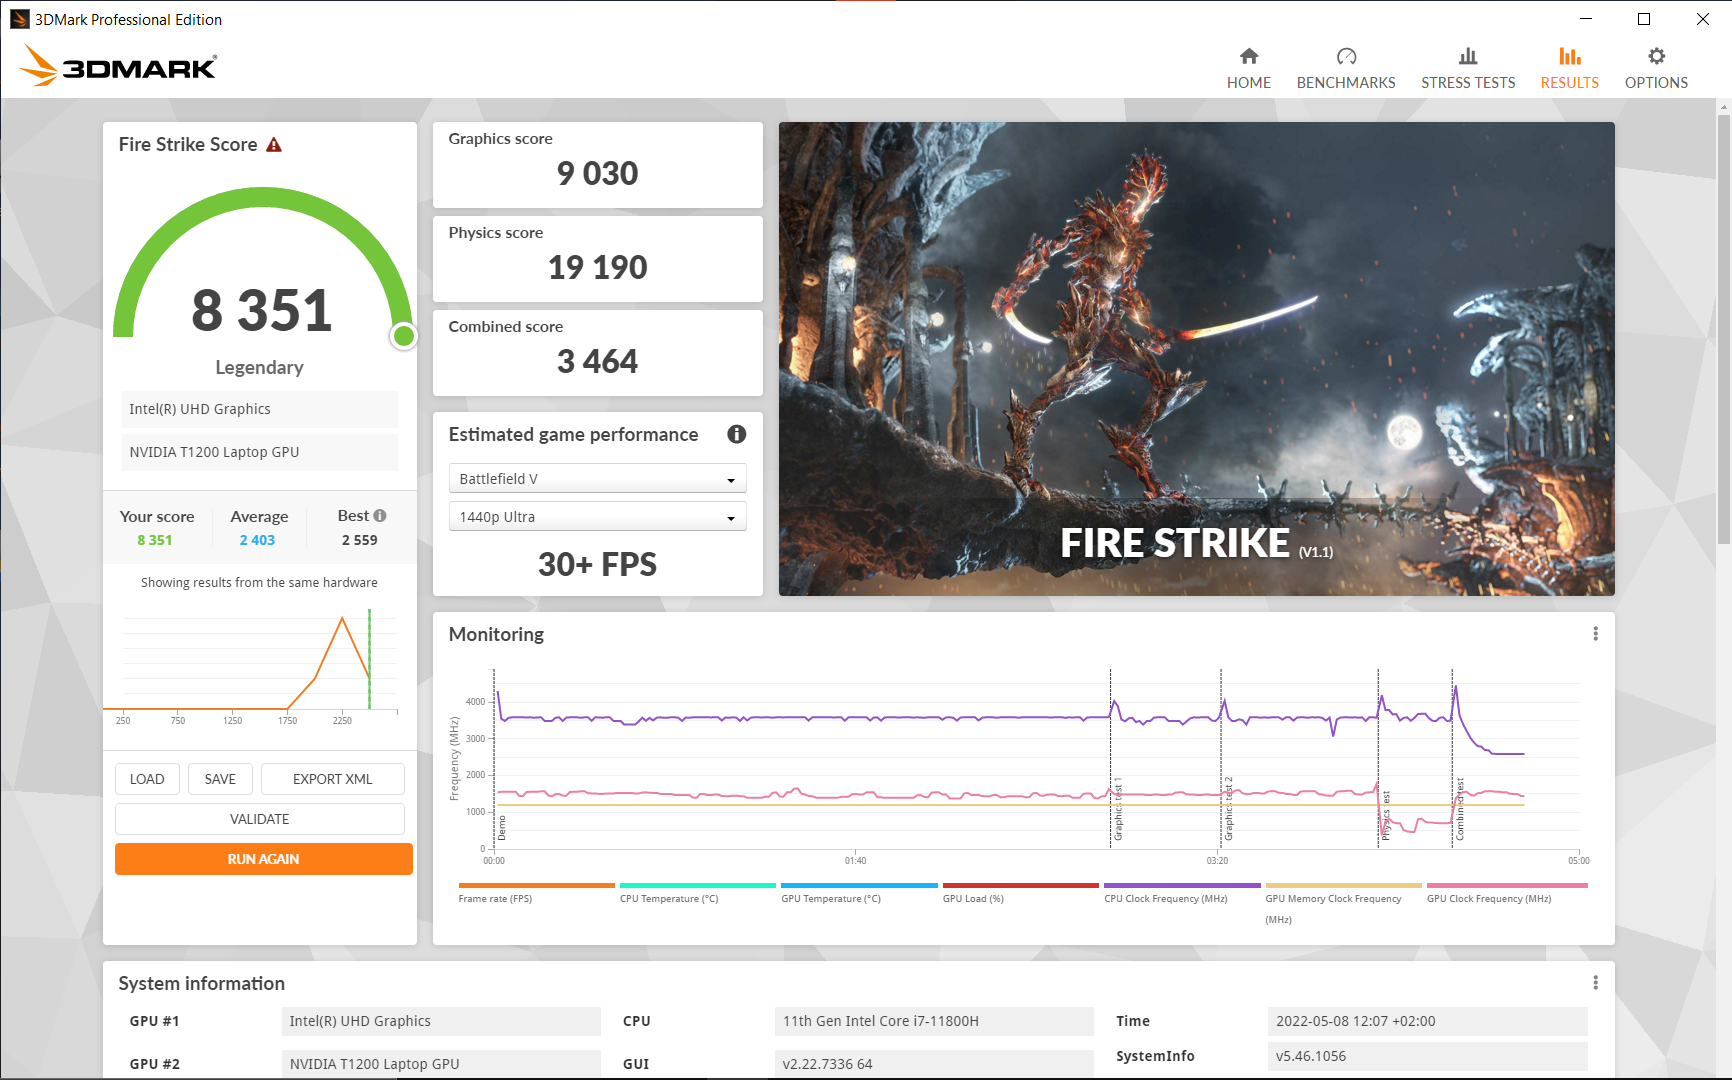
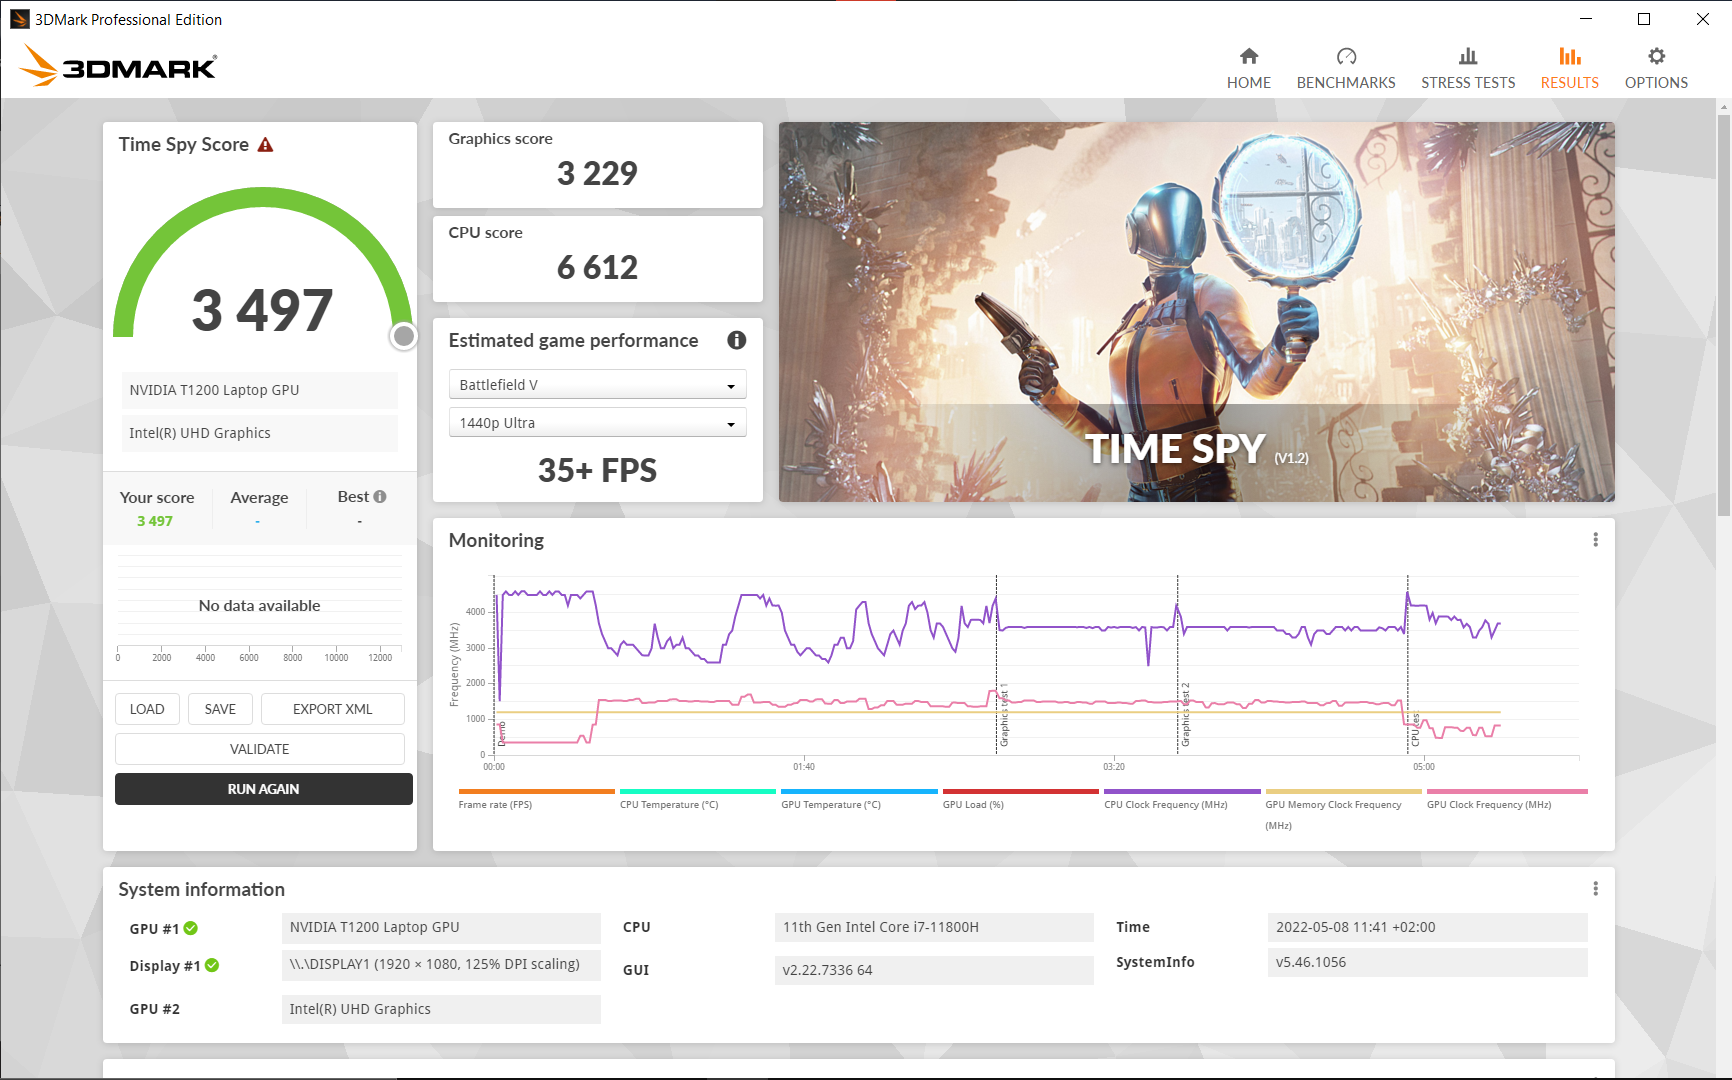
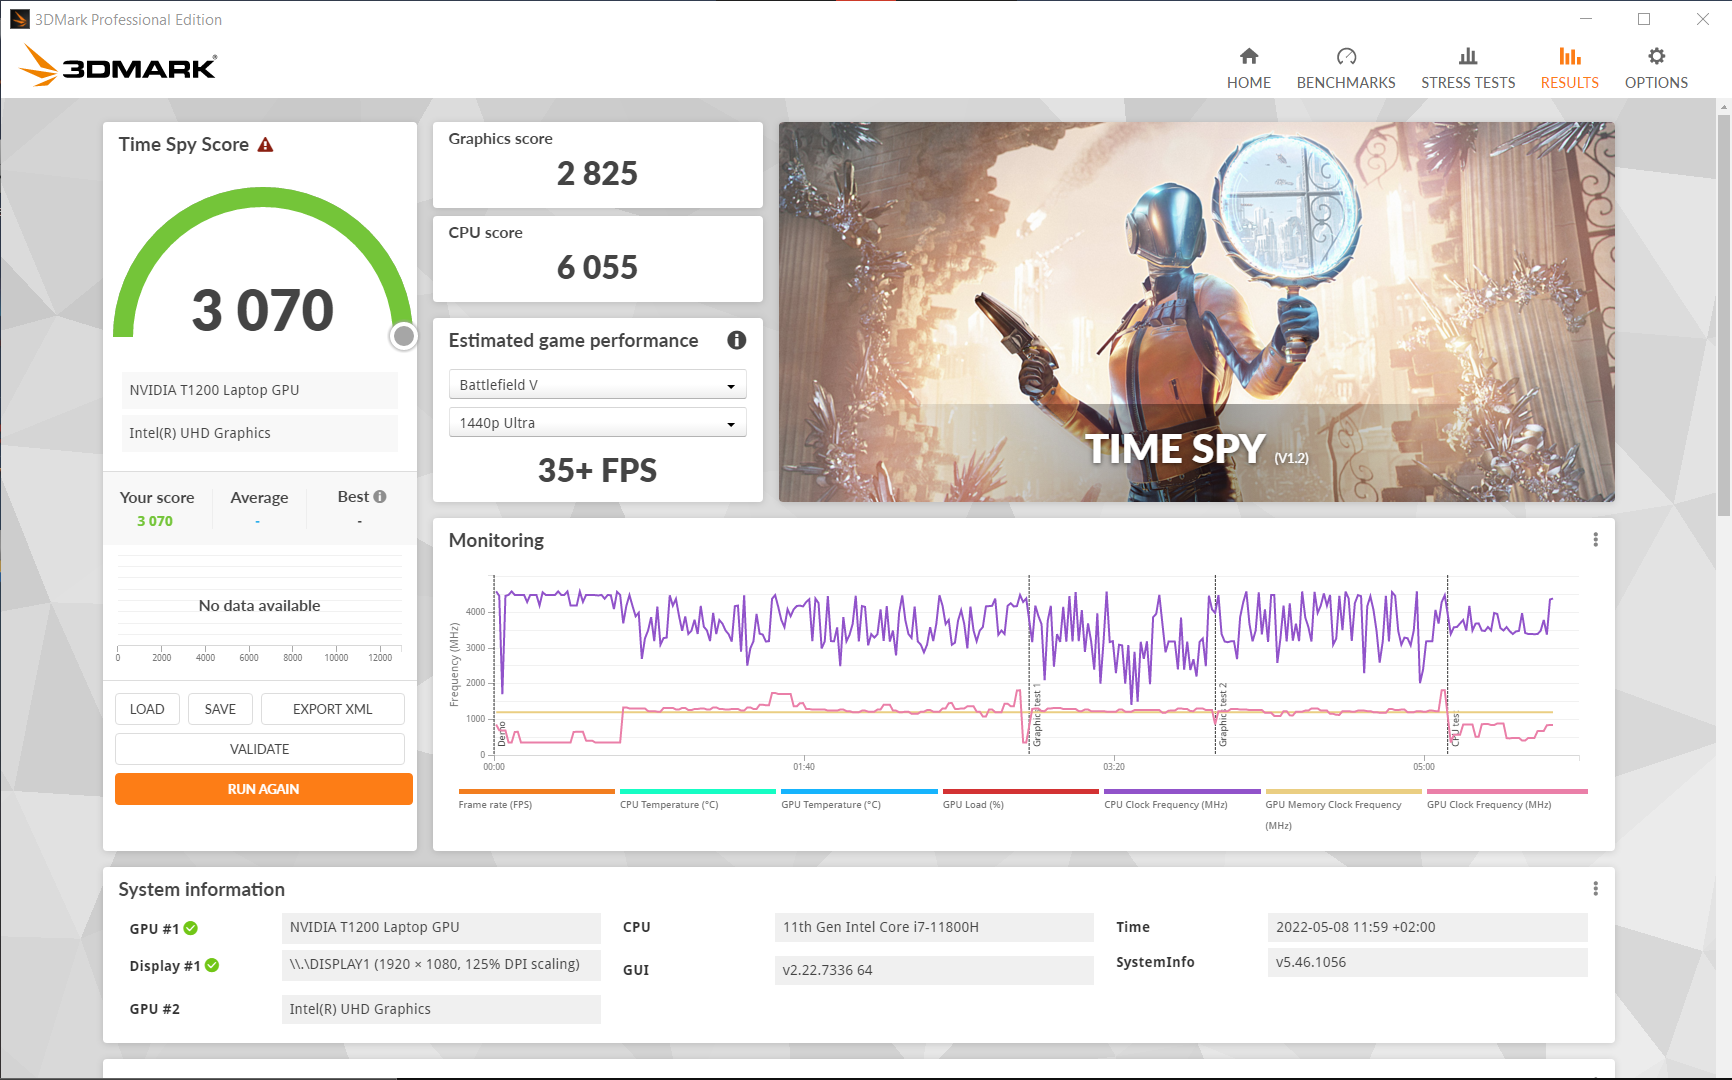
| 3DMark 06 Standard Score | 38139 punti | |
| 3DMark 11 Performance | 11917 punti | |
| 3DMark Cloud Gate Standard Score | 30520 punti | |
| 3DMark Fire Strike Score | 8351 punti | |
| 3DMark Time Spy Score | 3497 punti | |
Aiuto | ||
Prestazioni di gioco
La Nvidia T1200 è in grado di eseguire i giochi più vecchi a dettagli elevati senza problemi. I nuovi giochi sono giocabili a dettagli medi. Non sono stati osservati cali di prestazioni durante il test di un'ora su Witcher 3.
Witcher 3 FPS Chart
| basso | medio | alto | ultra | |
|---|---|---|---|---|
| BioShock Infinite (2013) | 352.2 | 235.8 | 207.9 | 88.1 |
| GTA V (2015) | 169.9 | 158.5 | 89.7 | 48.5 |
| The Witcher 3 (2015) | 59 | 33.2 | ||
| Dota 2 Reborn (2015) | 133.3 | 116.5 | 107.8 | 100.4 |
| Final Fantasy XV Benchmark (2018) | 88 | 49.5 | 35 | |
| X-Plane 11.11 (2018) | 96.2 | 77.5 | 64.8 | |
| Far Cry 5 (2018) | 107 | 60 | 53 | 51 |
| Strange Brigade (2018) | 208 | 84 | 68.5 | 59.3 |
| Shadow of the Tomb Raider (2018) | 96 | 59 | 48 | 39 |
| Mafia Definitive Edition (2020) | 84 | 43.4 | 39.2 | |
| Resident Evil Village (2021) | 114.3 | 64.3 | 57.9 | 49.8 |
| Riders Republic (2021) | 93 | 50 | 41 | 40 |
| Farming Simulator 22 (2021) | 171.9 | 96.6 | 70.1 | 61.2 |
| Dying Light 2 (2022) | 36.1 | 25.7 | 21.2 | |
| GRID Legends (2022) | 103 | 73 | 61.7 | 45.7 |
| Elden Ring (2022) | 52.9 | 47 | 39.5 | 36.8 |
| Elex 2 (2022) | 43.1 | 39.3 | 34.2 | 29.6 |
| Ghostwire Tokyo (2022) | 50.7 | 47.3 | 44.6 | 41.2 |
| Vampire Bloodhunt (2022) | 121.8 | 72.9 | 69.9 | 69.5 |
Emissioni: Computer portatile Lenovo silenzioso con hotspot
Rumore
La ventola rimane silenziosa al minimo e anche durante la navigazione. Solo sotto carico il ThinkPad è chiaramente udibile a 39 dB. Nel test di stress assoluto abbiamo misurato 43,5 dB. La ventola si fa sentire anche durante la navigazione intensa sul web, ma è tutt'altro che rumorosa. Non è stato rilevato alcun fruscio della bobina.
Tutti i dispositivi nel nostro campo di confronto sono generalmente più rumorosi, come l'HP ZBook Power 15, che registra circa il 10% di rumore in più negli scenari di carico.
Rumorosità
| Idle |
| 25.21 / 25.21 / 25.21 dB(A) |
| Sotto carico |
| 39.09 / 43.53 dB(A) |
 | ||
30 dB silenzioso 40 dB(A) udibile 50 dB(A) rumoroso |
||
min: | ||
| Lenovo ThinkPad P15v G2 21A9000XGE T1200 Laptop GPU, i7-11800H, Toshiba XG6 KXG6AZNV512G | Lenovo ThinkPad P15 G2-20YQ001JGE RTX A3000 Laptop GPU, i7-11800H, Kioxia XG7 KXG7AZNV512G | Lenovo ThinkPad T15g-20UR000GGE GeForce RTX 2070 Super Max-Q, i7-10750H, SK Hynix PC401 512GB M.2 (HFS512GD9TNG) | Lenovo ThinkPad T15p-20TN0006GE GeForce GTX 1050 Mobile, i7-10750H, WDC PC SN730 SDBQNTY-512GB | Lenovo ThinkPad P15s Gen2-20W6000GGE T500 Laptop GPU, i7-1165G7, WDC PC SN720 SDAQNTW-1T00 | HP ZBook Power 15 G8 313S5EA T600 Laptop GPU, i7-11800H, Samsung PM9A1 MZVL2512HCJQ | Dell Precision 5000 5560 RTX A2000 Laptop GPU, i7-11850H, Samsung PM9A1 MZVL22T0HBLB | |
|---|---|---|---|---|---|---|---|
| Noise | -8% | -1% | -13% | 5% | -10% | 8% | |
| off /ambiente * (dB) | 25.21 | 24.3 4% | 24 5% | 29.3 -16% | 24.3 4% | 25.54 -1% | 23.4 7% |
| Idle Minimum * (dB) | 25.21 | 24.3 4% | 24 5% | 29.3 -16% | 25.5 -1% | 25.54 -1% | 23.6 6% |
| Idle Average * (dB) | 25.21 | 24.3 4% | 24 5% | 29.3 -16% | 25.5 -1% | 25.54 -1% | 23.6 6% |
| Idle Maximum * (dB) | 25.21 | 28.6 -13% | 24 5% | 30.6 -21% | 25.5 -1% | 25.54 -1% | 23.6 6% |
| Load Average * (dB) | 39.09 | 47.5 -22% | 36.1 8% | 42.7 -9% | 35.65 9% | 48.85 -25% | 25.8 34% |
| Witcher 3 ultra * (dB) | 36.6 | 46 -26% | 42.7 -17% | 46.58 -27% | 40.1 -10% | ||
| Load Maximum * (dB) | 43.53 | 54.9 -26% | 46 -6% | 42.7 2% | 35.65 18% | 50.98 -17% | 41.4 5% |
* ... Meglio usare valori piccoli
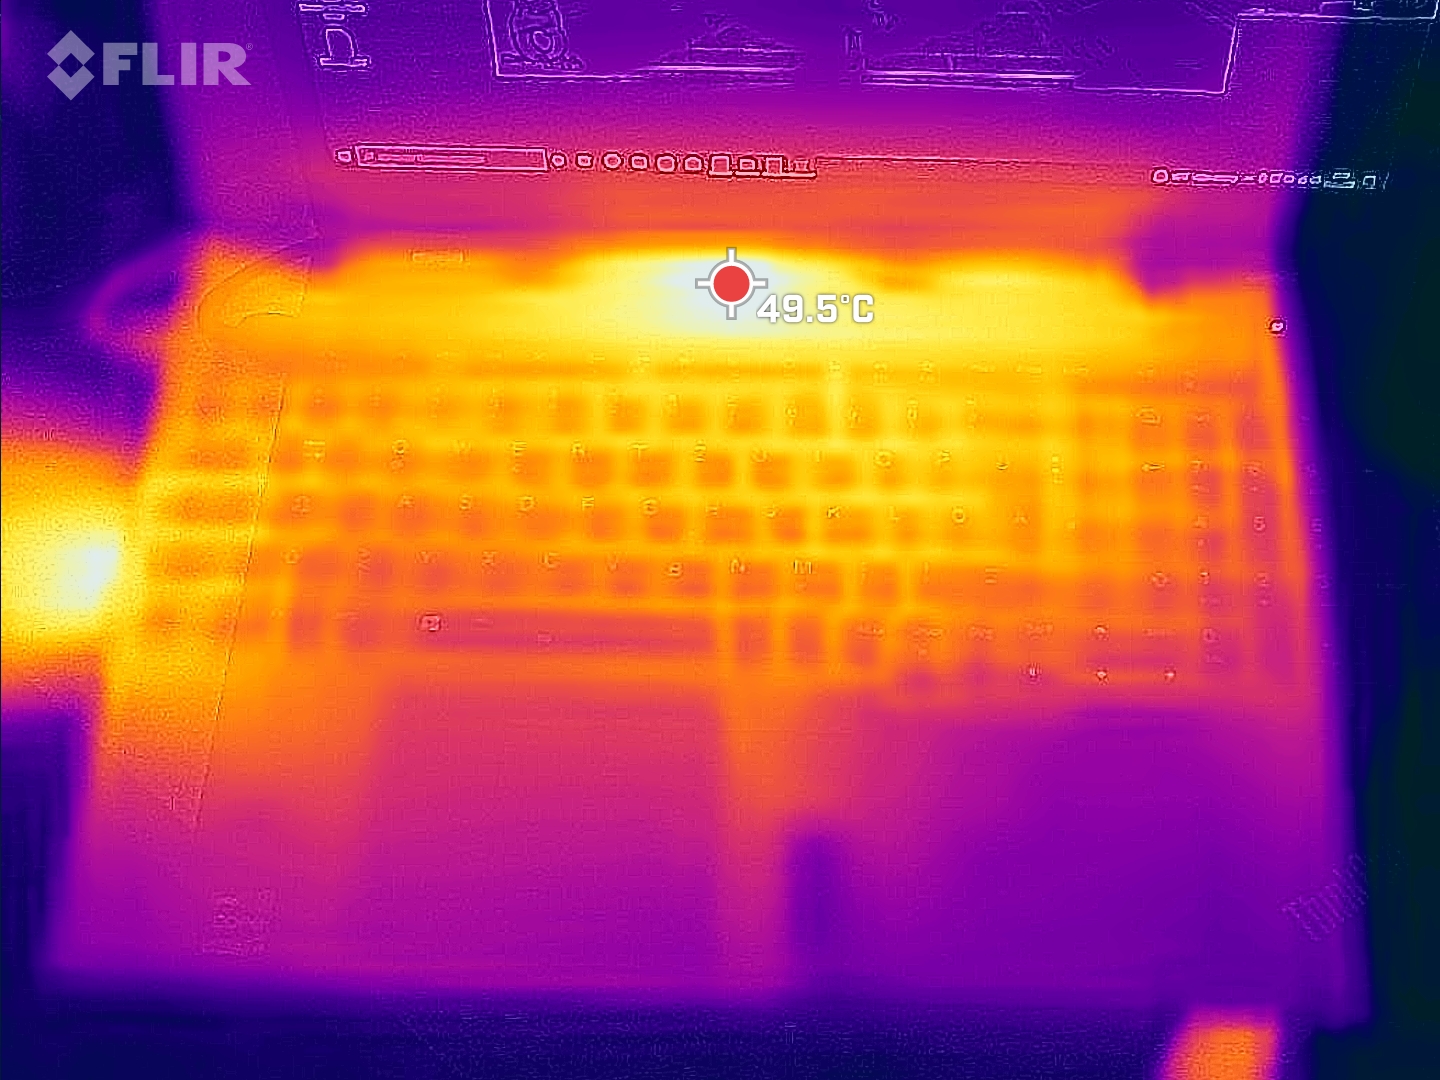
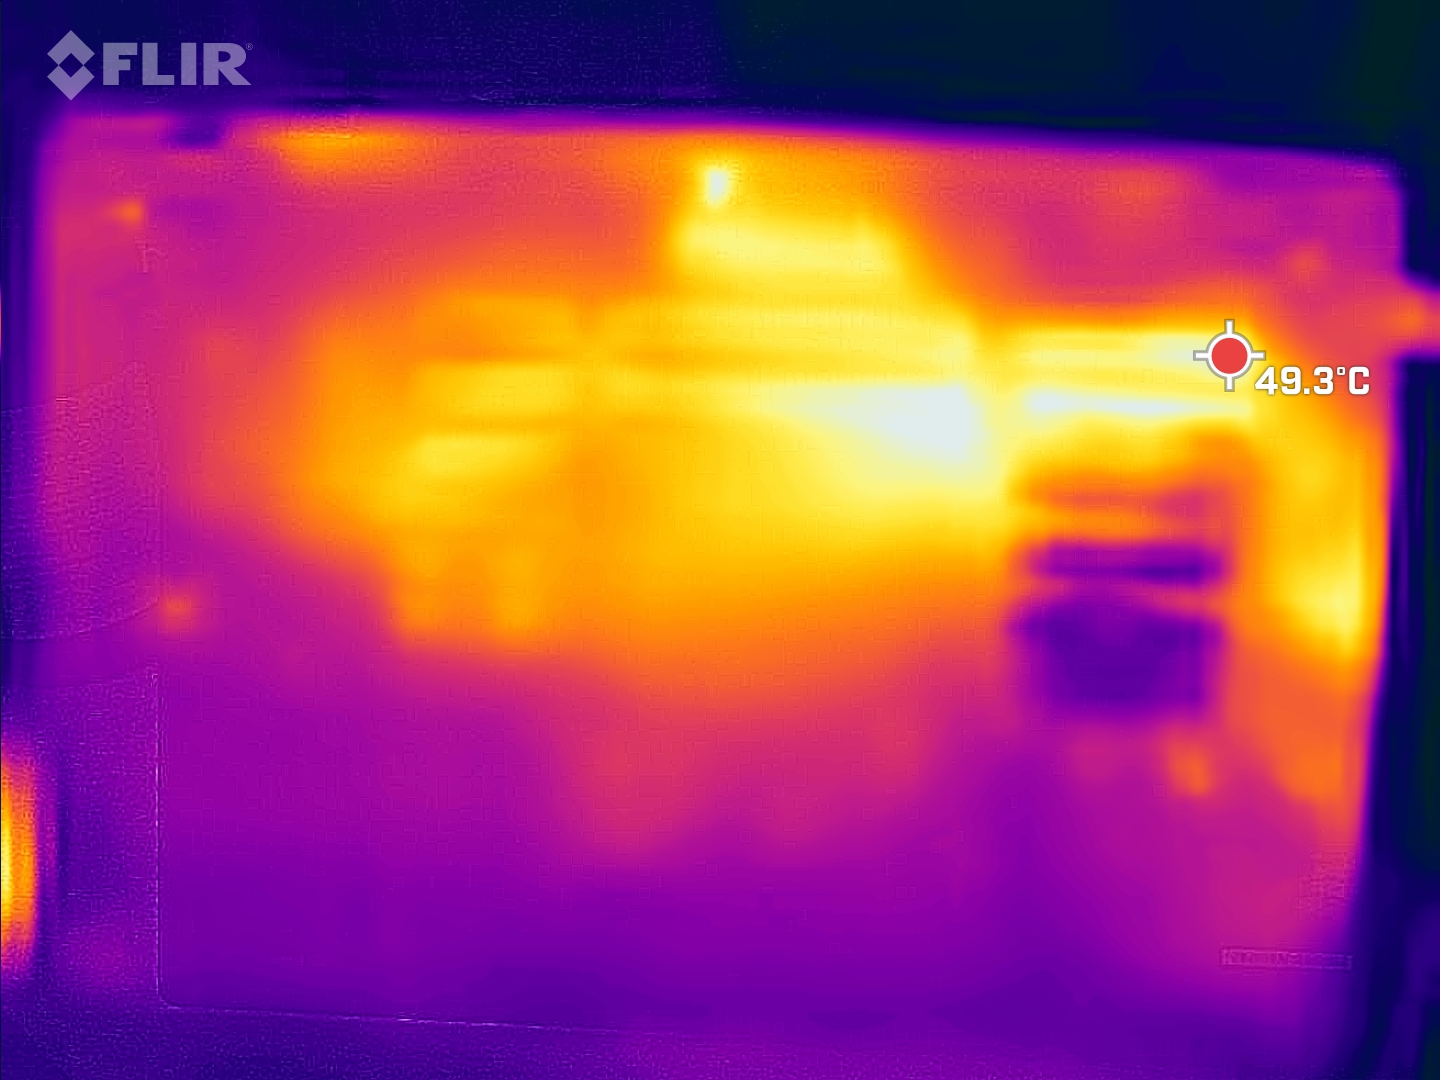
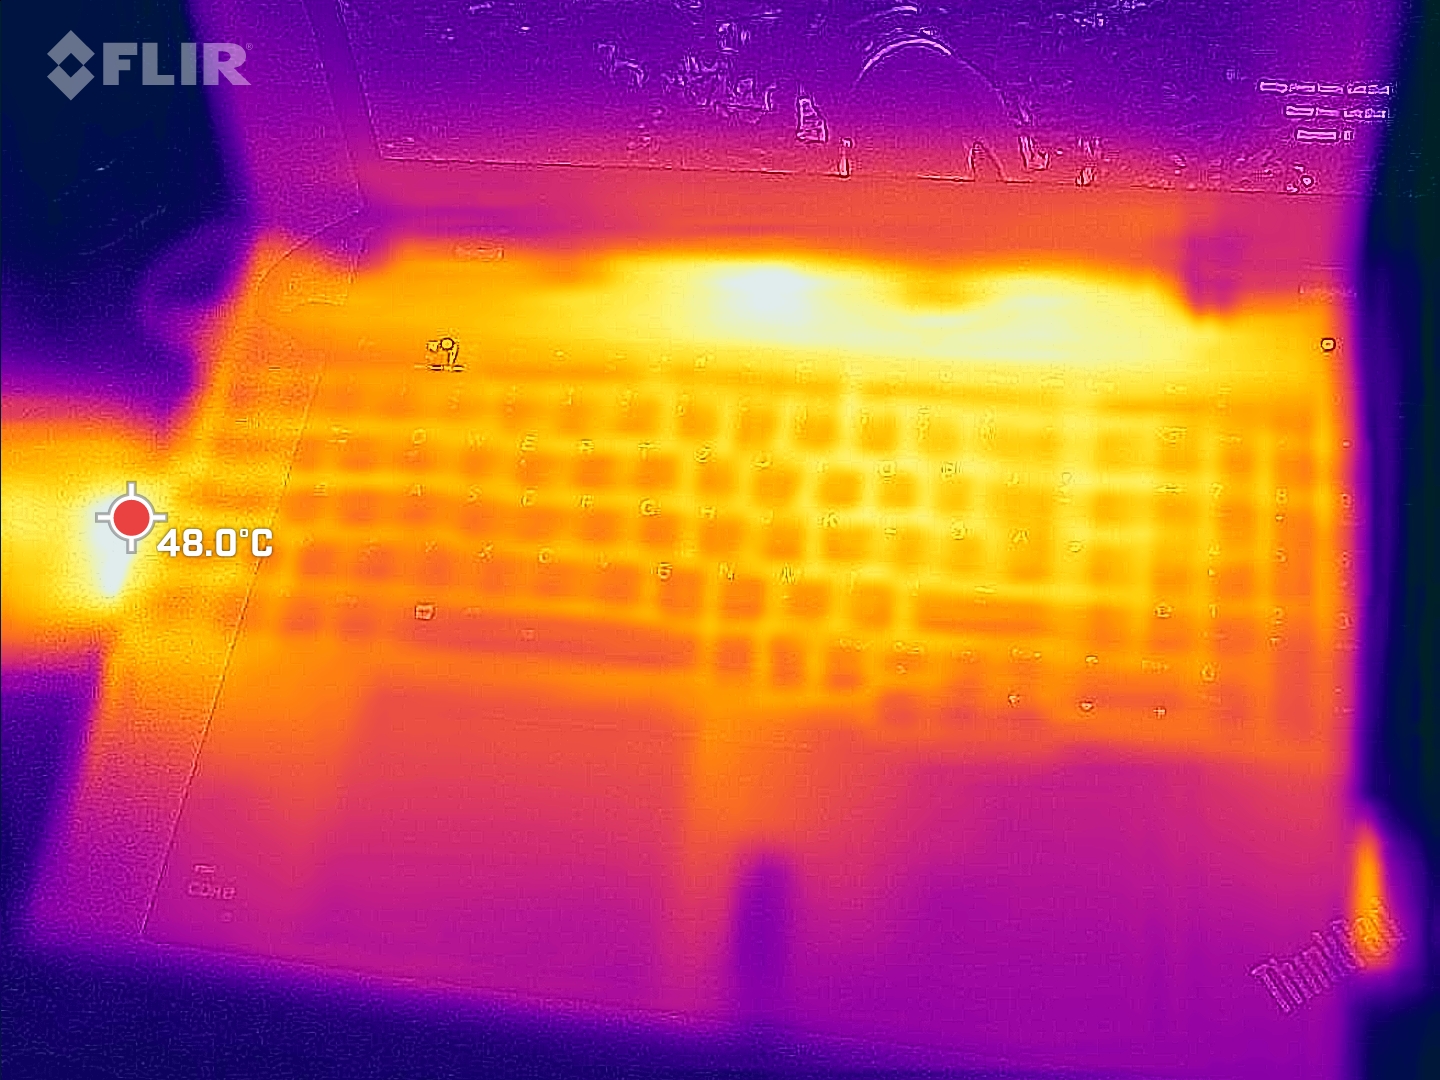
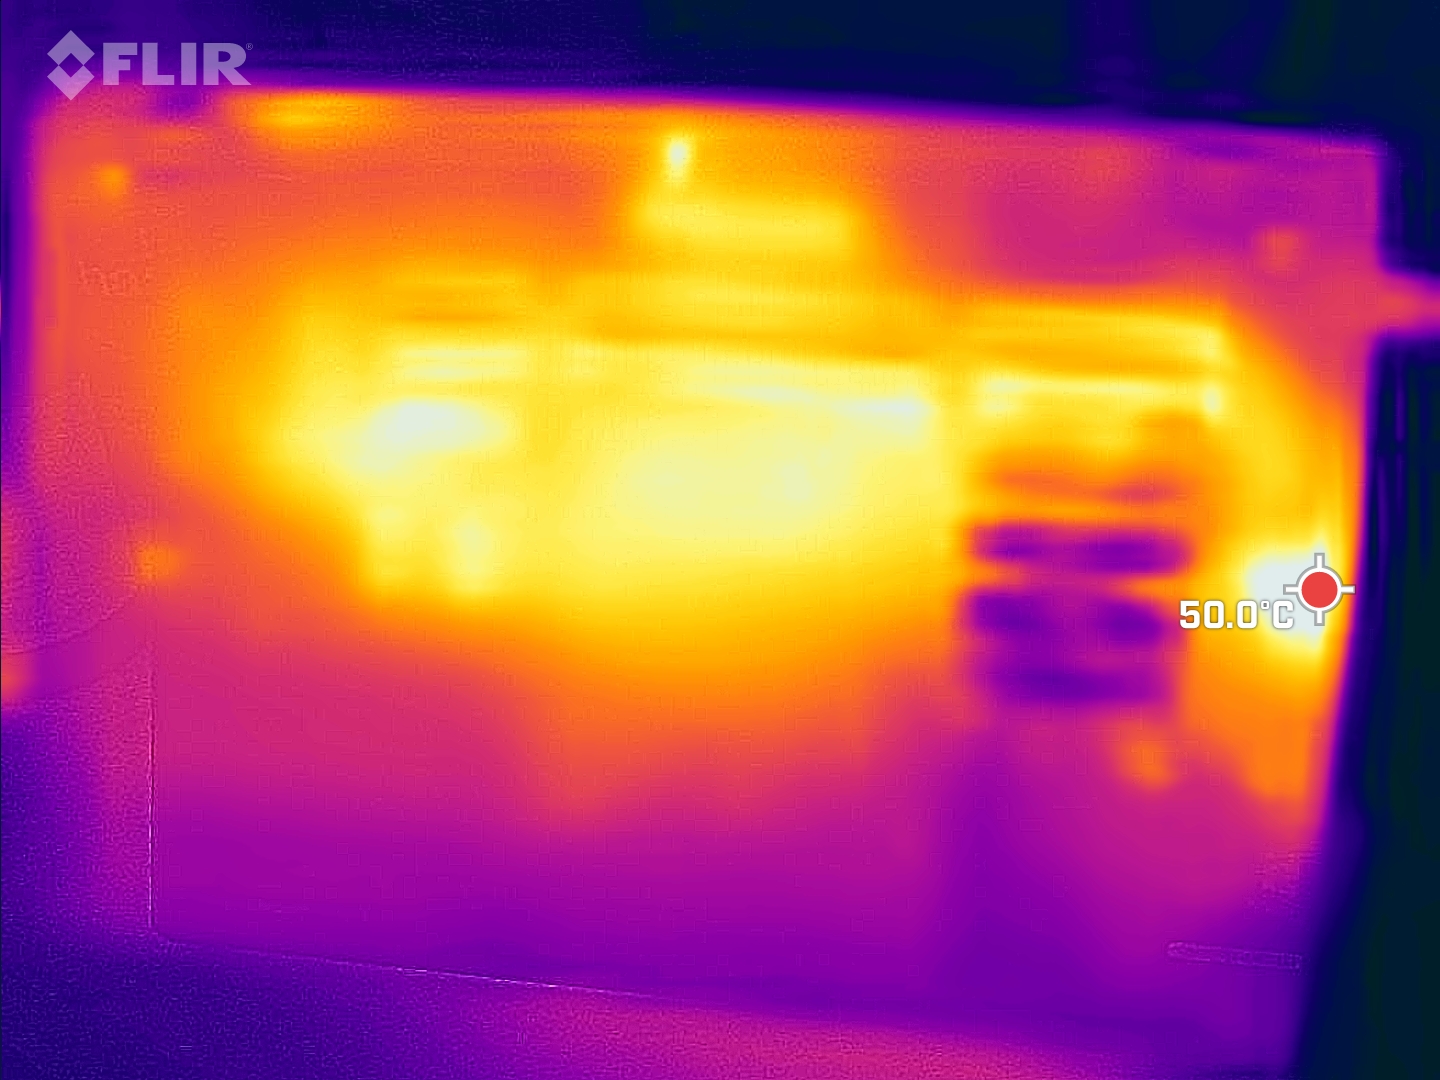
Temperatura
Sotto carico e anche durante il gioco, il ThinkPad P15v diventa molto caldo, con 53,8 °C al centro sopra la tastiera. Lo ZBook Power 15 è significativamente più fresco, con 41,5 °C, ma al prezzo di livelli di rumore significativamente più elevati.
(-) La temperatura massima sul lato superiore è di 53.8 °C / 129 F, rispetto alla media di 38.2 °C / 101 F, che varia da 22.2 a 69.8 °C per questa classe Workstation.
(-) Il lato inferiore si riscalda fino ad un massimo di 52.1 °C / 126 F, rispetto alla media di 41.1 °C / 106 F
(+) In idle, la temperatura media del lato superiore è di 25.6 °C / 78 F, rispetto alla media deld ispositivo di 32 °C / 90 F.
(-) Riproducendo The Witcher 3, la temperatura media per il lato superiore e' di 41.4 °C / 107 F, rispetto alla media del dispositivo di 32 °C / 90 F.
(+) I poggiapolsi e il touchpad raggiungono la temperatura massima della pelle (35.6 °C / 96.1 F) e quindi non sono caldi.
(-) La temperatura media della zona del palmo della mano di dispositivi simili e'stata di 27.8 °C / 82 F (-7.8 °C / -14.1 F).
| Lenovo ThinkPad P15v G2 21A9000XGE Intel Core i7-11800H, NVIDIA T1200 Laptop GPU | Lenovo ThinkPad P15 G2-20YQ001JGE Intel Core i7-11800H, NVIDIA RTX A3000 Laptop GPU | Lenovo ThinkPad T15g-20UR000GGE Intel Core i7-10750H, NVIDIA GeForce RTX 2070 Super Max-Q | Lenovo ThinkPad T15p-20TN0006GE Intel Core i7-10750H, NVIDIA GeForce GTX 1050 Mobile | Lenovo ThinkPad P15s Gen2-20W6000GGE Intel Core i7-1165G7, NVIDIA T500 Laptop GPU | HP ZBook Power 15 G8 313S5EA Intel Core i7-11800H, NVIDIA T600 Laptop GPU | Dell Precision 5000 5560 Intel Core i7-11850H, NVIDIA RTX A2000 Laptop GPU | |
|---|---|---|---|---|---|---|---|
| Heat | -5% | -15% | 4% | 2% | 17% | -6% | |
| Maximum Upper Side * (°C) | 53.8 | 49.7 8% | 47.7 11% | 53.8 -0% | 42.8 20% | 41.4 23% | 48.2 10% |
| Maximum Bottom * (°C) | 52.1 | 63.2 -21% | 62.1 -19% | 56.6 -9% | 59.1 -13% | 41.5 20% | 42.6 18% |
| Idle Upper Side * (°C) | 27.6 | 27.1 2% | 31.3 -13% | 24.7 11% | 26.4 4% | 23.8 14% | 34.8 -26% |
| Idle Bottom * (°C) | 27.7 | 29.8 -8% | 38.8 -40% | 24.2 13% | 28.9 -4% | 25 10% | 35.2 -27% |
* ... Meglio usare valori piccoli
Stress test
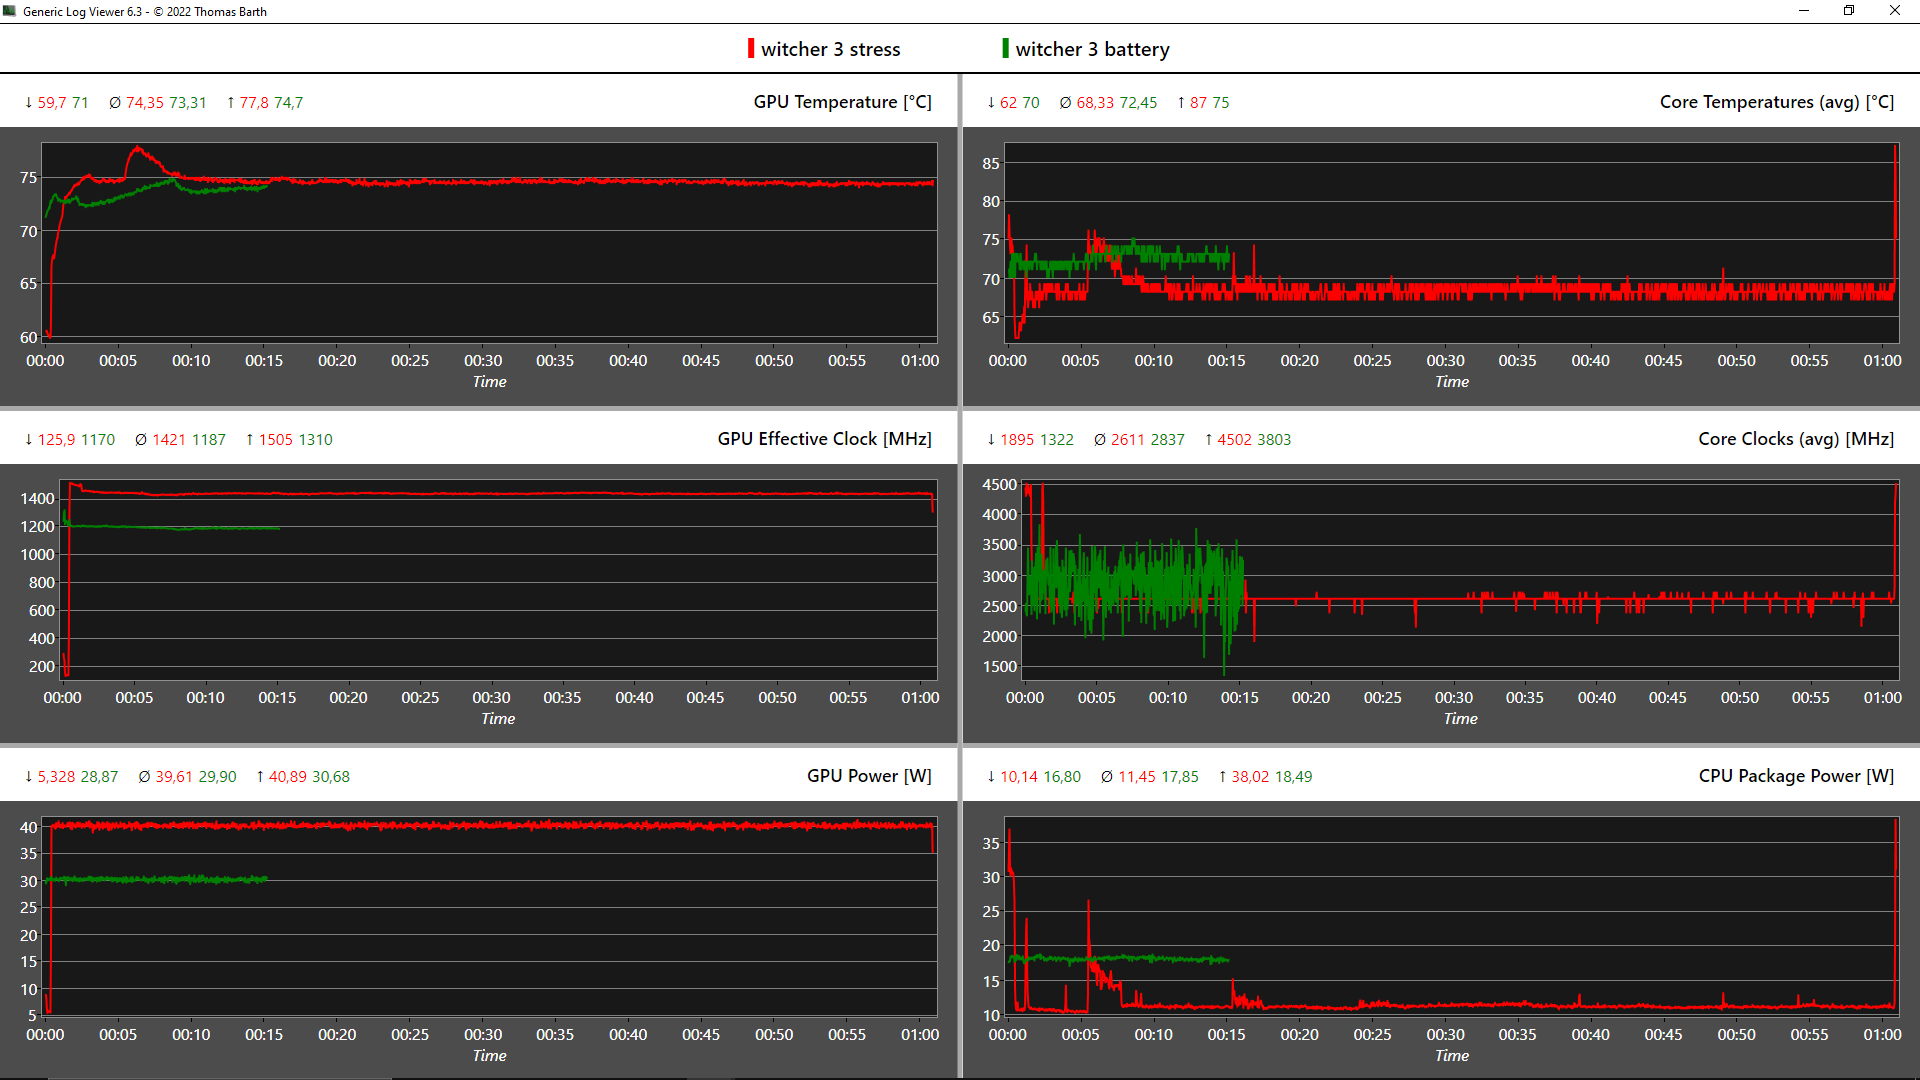
Dopo un'ora di stress test combinati (FurMark + Prime95), la CPU si aggira intorno ai 2,15 GHz, che è solo leggermente inferiore al clock di base di 2,3 GHz. Le temperature raggiungono quasi i 94 °C e il consumo è di 40 watt, mentre la GPU Nvidia consuma i 35 watt specificati, ma non sfrutta appieno il suo potenziale di clock a 986 MHz.
In condizioni di puro stress della GPU, la scheda grafica assorbe 40 watt e raggiunge quindi i 1.445 MHz a temperature non critiche. Sotto l'unico stress della CPU, il Core i7-11800H si attesta su una frequenza stabile di 2,55 GHz, consuma 50 watt costanti e si riscalda fino a 91,6 °C.
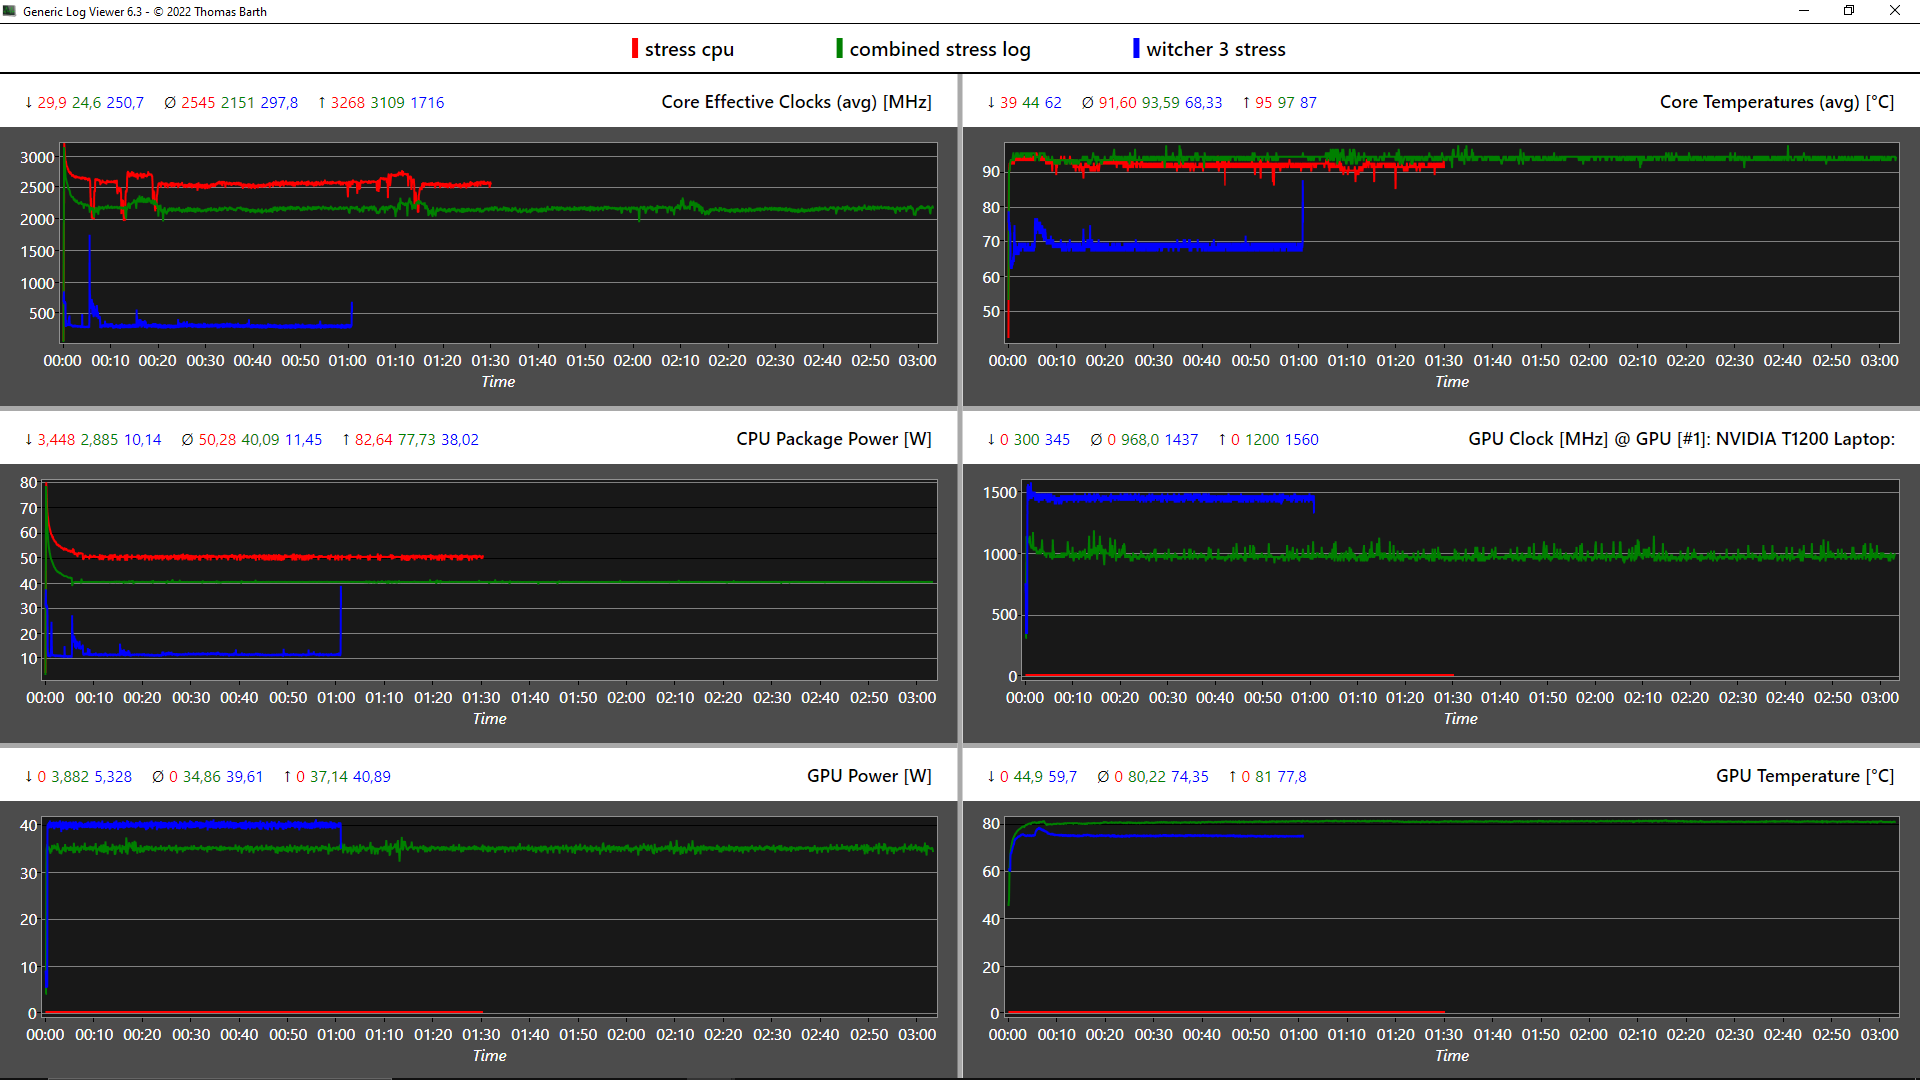
| Clock della CPU (GHz) | Clock della GPU (MHz) | Temperatura media della CPU (°C) | Temperatura media della GPU (°C) | |
| Sistema inattivo | 1,2 | 300 | 42 | 44,8 |
| Stress Prime95 | 2,5 | 300 | 91,6 | 46,4 |
| Prime95 + FurMark Stress | 2,2 | 970 | 93,6 | 80,2 |
| Witcher 3 Stress | 0,3 | 1.445 | 68,3 | 74,4 |
Altoparlanti
Gli altoparlanti 2x da 2 watt rivolti verso l'alto non sono particolarmente rumorosi, ma il suono è chiaro e i bassi sono presenti in una certa misura. Nel complesso, servono allo scopo e superano gli altoparlanti di molti altri notebook da ufficio
Lenovo ThinkPad P15v G2 21A9000XGE analisi audio
(-) | altoparlanti non molto potenti (70.7 dB)
Bassi 100 - 315 Hz
(±) | bassi ridotti - in media 13.4% inferiori alla media
(±) | la linearità dei bassi è media (13.6% delta rispetto alla precedente frequenza)
Medi 400 - 2000 Hz
(+) | medi bilanciati - solo only 4.7% rispetto alla media
(+) | medi lineari (6.2% delta rispetto alla precedente frequenza)
Alti 2 - 16 kHz
(+) | Alti bilanciati - appena 3.2% dalla media
(+) | alti lineari (5.7% delta rispetto alla precedente frequenza)
Nel complesso 100 - 16.000 Hz
(±) | la linearità complessiva del suono è media (21.2% di differenza rispetto alla media
Rispetto alla stessa classe
» 76% di tutti i dispositivi testati in questa classe è stato migliore, 6% simile, 18% peggiore
» Il migliore ha avuto un delta di 7%, medio di 17%, peggiore di 35%
Rispetto a tutti i dispositivi testati
» 59% di tutti i dispositivi testati in questa classe è stato migliore, 7% similare, 34% peggiore
» Il migliore ha avuto un delta di 4%, medio di 23%, peggiore di 134%
HP ZBook Power 15 G8 313S5EA analisi audio
(±) | potenza degli altiparlanti media ma buona (72.3 dB)
Bassi 100 - 315 Hz
(-) | quasi nessun basso - in media 23.3% inferiori alla media
(±) | la linearità dei bassi è media (11.8% delta rispetto alla precedente frequenza)
Medi 400 - 2000 Hz
(+) | medi bilanciati - solo only 2.5% rispetto alla media
(+) | medi lineari (5.1% delta rispetto alla precedente frequenza)
Alti 2 - 16 kHz
(+) | Alti bilanciati - appena 4.1% dalla media
(+) | alti lineari (3.1% delta rispetto alla precedente frequenza)
Nel complesso 100 - 16.000 Hz
(±) | la linearità complessiva del suono è media (21.4% di differenza rispetto alla media
Rispetto alla stessa classe
» 77% di tutti i dispositivi testati in questa classe è stato migliore, 6% simile, 18% peggiore
» Il migliore ha avuto un delta di 7%, medio di 17%, peggiore di 35%
Rispetto a tutti i dispositivi testati
» 60% di tutti i dispositivi testati in questa classe è stato migliore, 7% similare, 33% peggiore
» Il migliore ha avuto un delta di 4%, medio di 23%, peggiore di 134%
Gestione dell'energia: Media per il ThinkPad P15v
Consumo di energia
Il consumo di 1,6 watt in standby suggerisce che non è possibile un'autonomia di 2 giorni di funzionamento. D'altra parte, i consumi in idle sono molto buoni per una workstation e possono essere surclassati solo dallo ZBook Power 15.
All'inizio dello stress test vengono consumati 127 watt e 108 watt in modo continuo. L'alimentatore da 135 W è quindi sufficientemente dimensionato e in grado di assorbire qualsiasi picco di carico. Una ricarica completa del ThinkPad dura circa 90 minuti.
| Off / Standby | |
| Idle | |
| Sotto carico |
|
Leggenda:
min: | |
| Lenovo ThinkPad P15v G2 21A9000XGE i7-11800H, T1200 Laptop GPU, Toshiba XG6 KXG6AZNV512G, IPS LED, 1920x1080, 15.6" | Lenovo ThinkPad P15 G2-20YQ001JGE i7-11800H, RTX A3000 Laptop GPU, Kioxia XG7 KXG7AZNV512G, IPS, 1920x1080, 15.6" | Lenovo ThinkPad T15g-20UR000GGE i7-10750H, GeForce RTX 2070 Super Max-Q, SK Hynix PC401 512GB M.2 (HFS512GD9TNG), IPS, 1920x1080, 15.6" | Lenovo ThinkPad T15p-20TN0006GE i7-10750H, GeForce GTX 1050 Mobile, WDC PC SN730 SDBQNTY-512GB, IPS LED, 3840x2160, 15.6" | Lenovo ThinkPad P15s Gen2-20W6000GGE i7-1165G7, T500 Laptop GPU, WDC PC SN720 SDAQNTW-1T00, IPS LED, 3840x2160, 15.6" | HP ZBook Power 15 G8 313S5EA i7-11800H, T600 Laptop GPU, Samsung PM9A1 MZVL2512HCJQ, IPS LED, 1920x1080, 15.6" | Dell Precision 5000 5560 i7-11850H, RTX A2000 Laptop GPU, Samsung PM9A1 MZVL22T0HBLB, IPS, 3840x2400, 15.6" | Media NVIDIA T1200 Laptop GPU | Media della classe Workstation | |
|---|---|---|---|---|---|---|---|---|---|
| Power Consumption | -31% | -36% | -20% | 6% | 23% | -38% | -23% | -53% | |
| Idle Minimum * (Watt) | 5.96 | 6.3 -6% | 5.8 3% | 6 -1% | 5.8 3% | 4.17 30% | 6.2 -4% | 7.85 ? -32% | 9.11 ? -53% |
| Idle Average * (Watt) | 8.37 | 10.7 -28% | 11.4 -36% | 12.8 -53% | 13.3 -59% | 6.32 24% | 13.9 -66% | 11.4 ? -36% | 13.8 ? -65% |
| Idle Maximum * (Watt) | 9.05 | 11.6 -28% | 13.9 -54% | 16.1 -78% | 15.6 -72% | 7.1 22% | 23.8 -163% | 12 ? -33% | 17.9 ? -98% |
| Load Average * (Watt) | 91.82 | 99.3 -8% | 93.2 -2% | 95.6 -4% | 43.2 53% | 80.41 12% | 95.7 -4% | 93.8 ? -2% | 96 ? -5% |
| Witcher 3 ultra * (Watt) | 102 | 154 -51% | 145 -42% | 84 18% | 37.1 64% | 62.3 39% | 87 15% | ||
| Load Maximum * (Watt) | 126.38 | 210 -66% | 234 -85% | 131.1 -4% | 67.3 47% | 110.18 13% | 132.6 -5% | 143.7 ? -14% | 180.3 ? -43% |
* ... Meglio usare valori piccoli
Power Consumption Witcher 3 / Stresstest
Power Consumption Witcher 3 / Stress test (external monitor)
Durata della batteria
La batteria da 68 Wh è in grado di alimentare il nostro test Wi-Fi per 7,5 ore, come dichiarato da Lenovo. Altre workstation raggiungono tempi di esecuzione significativamente più lunghi con batterie più grandi.
Anche lo ZBook Power 15 di HP dura molto di più nella navigazione web, con quasi 12,5 ore Precision 5560 di Delldell, con il suo display 4K, registra una misera durata di 6,5 ore.
| Lenovo ThinkPad P15v G2 21A9000XGE i7-11800H, T1200 Laptop GPU, 68 Wh | Lenovo ThinkPad P15 G2-20YQ001JGE i7-11800H, RTX A3000 Laptop GPU, 94 Wh | Lenovo ThinkPad T15g-20UR000GGE i7-10750H, GeForce RTX 2070 Super Max-Q, 94 Wh | Lenovo ThinkPad T15p-20TN0006GE i7-10750H, GeForce GTX 1050 Mobile, 68 Wh | Lenovo ThinkPad P15s Gen2-20W6000GGE i7-1165G7, T500 Laptop GPU, 57 Wh | HP ZBook Power 15 G8 313S5EA i7-11800H, T600 Laptop GPU, 83 Wh | Dell Precision 5000 5560 i7-11850H, RTX A2000 Laptop GPU, 86 Wh | Media della classe Workstation | |
|---|---|---|---|---|---|---|---|---|
| Autonomia della batteria | 34% | 47% | 5% | 46% | 53% | 18% | 38% | |
| Reader / Idle (h) | 17.2 | 14.9 -13% | 12 -30% | 26.1 ? 52% | ||||
| H.264 (h) | 8 | 10 25% | 12.7 59% | 7.7 -4% | 9.9 24% | 10.1 26% | 10.1 ? 26% | |
| WiFi v1.3 (h) | 7.5 | 9.9 32% | 11.2 49% | 7.3 -3% | 7.7 3% | 12.3 64% | 6.3 -16% | 8.55 ? 14% |
| Load (h) | 0.9 | 1.3 44% | 1.2 33% | 1.1 22% | 1.9 111% | 2.1 133% | 1.8 100% | 1.441 ? 60% |
Pro
Contro
Verdetto: ThinkPad P15v G2 per creativi attenti al prezzo?


Il ThinkPad P15v G2 riesce a bilanciare abbastanza bene l'equilibrio tra notebook aziendale e workstation, considerando che si rivolge a un gruppo target che può fare a meno di alcune caratteristiche di fascia alta come le CPU Xeon, la RAM ECC, l'hardware più veloce e alcune altre cose. Detto questo, le prestazioni sono generalmente buone, anche se in alcuni scenari si può notare un calo del 25%
L'opzione di visualizzazione è sufficiente solo per i creativi e nel settore CAD, se si utilizza principalmente un monitor esterno e per coloro che devono eseguire calcoli più complessi a un prezzo equo. Le prestazioni grafiche sono adeguate, considerando il prezzo inferiore ai 2.000 euro, e i dispositivi di input sono di alto livello. Ci sono alcuni svantaggi per quanto riguarda il display un po' scuro con una bassa copertura dello spazio colore. Fortunatamente è disponibile l'opzione 4K
La connettività è ampia e il ThinkPad è facilmente espandibile. Nel complesso, ottiene un ottimo punteggio rispetto al più sottile ThinkPad P15. Anche il case è robusto, anche se altri ThinkPad hanno un coperchio del display rinforzato. La quantità di plastica potrebbe risultare fastidiosa per alcuni in termini di sensazione e aspetto. L'autonomia della batteria non è delle migliori, ma le emissioni sono di tipo business-oriented e molto buone, fatta eccezione per alcuni piccoli hotspot lontano dalla tastiera e dal palm rest. Il sistema di raffreddamento è stato mantenuto complessivamente piuttosto semplice a favore del prezzo. La ricarica tramite USB-C non è disponibile e il modulo Wi-Fi è saldato. Ma il modulo WWAN può essere installato in un secondo momento
Il ThinkPad P15v G2 non ha necessariamente bisogno di un Core i9 e di un display 4K per essere un solido strumento di lavoro. Sebbene brilli soprattutto per il suo prezzo di ingresso ragionevole, rimane un prodotto di nicchia con limitazioni, soprattutto in termini di display e CPU.
Escludendo il modello gemello (T15p G2), ci sono due alternative dirette nello stesso segmento di prezzo: Lo ZBook Power 15 di HP, che offre costantemente prestazioni di alto livello, ha un display molto più luminoso e migliore, una tastiera ben progettata e una durata della batteria decisamente migliore, ma è anche fastidiosamente rumoroso. Il Dell Precision 3651 pesa solo 1,79 kg, offre un pannello 4K e la ricarica USB-C.
Prezzo e disponibilità
Il sito ufficiale di Lenovo offre il Lenovo ThinkPad P15v G2 in varie configurazioni a vari prezzi, a seconda del Paese di acquisto. Ad esempio:
STATI UNITIa partire da US$ 1.391,42
UKa partire da GBP£ 1.758,63
Canadaa partire da CAD$ 1.780,02
Australiaa partire da AUD$ 2.119,47
Nuova Zelandaa partire da NZ$ 4.699,00
Lenovo ThinkPad P15v G2 21A9000XGE
- 05/30/2022 v7 (old)
Marvin Gollor
Price comparison

