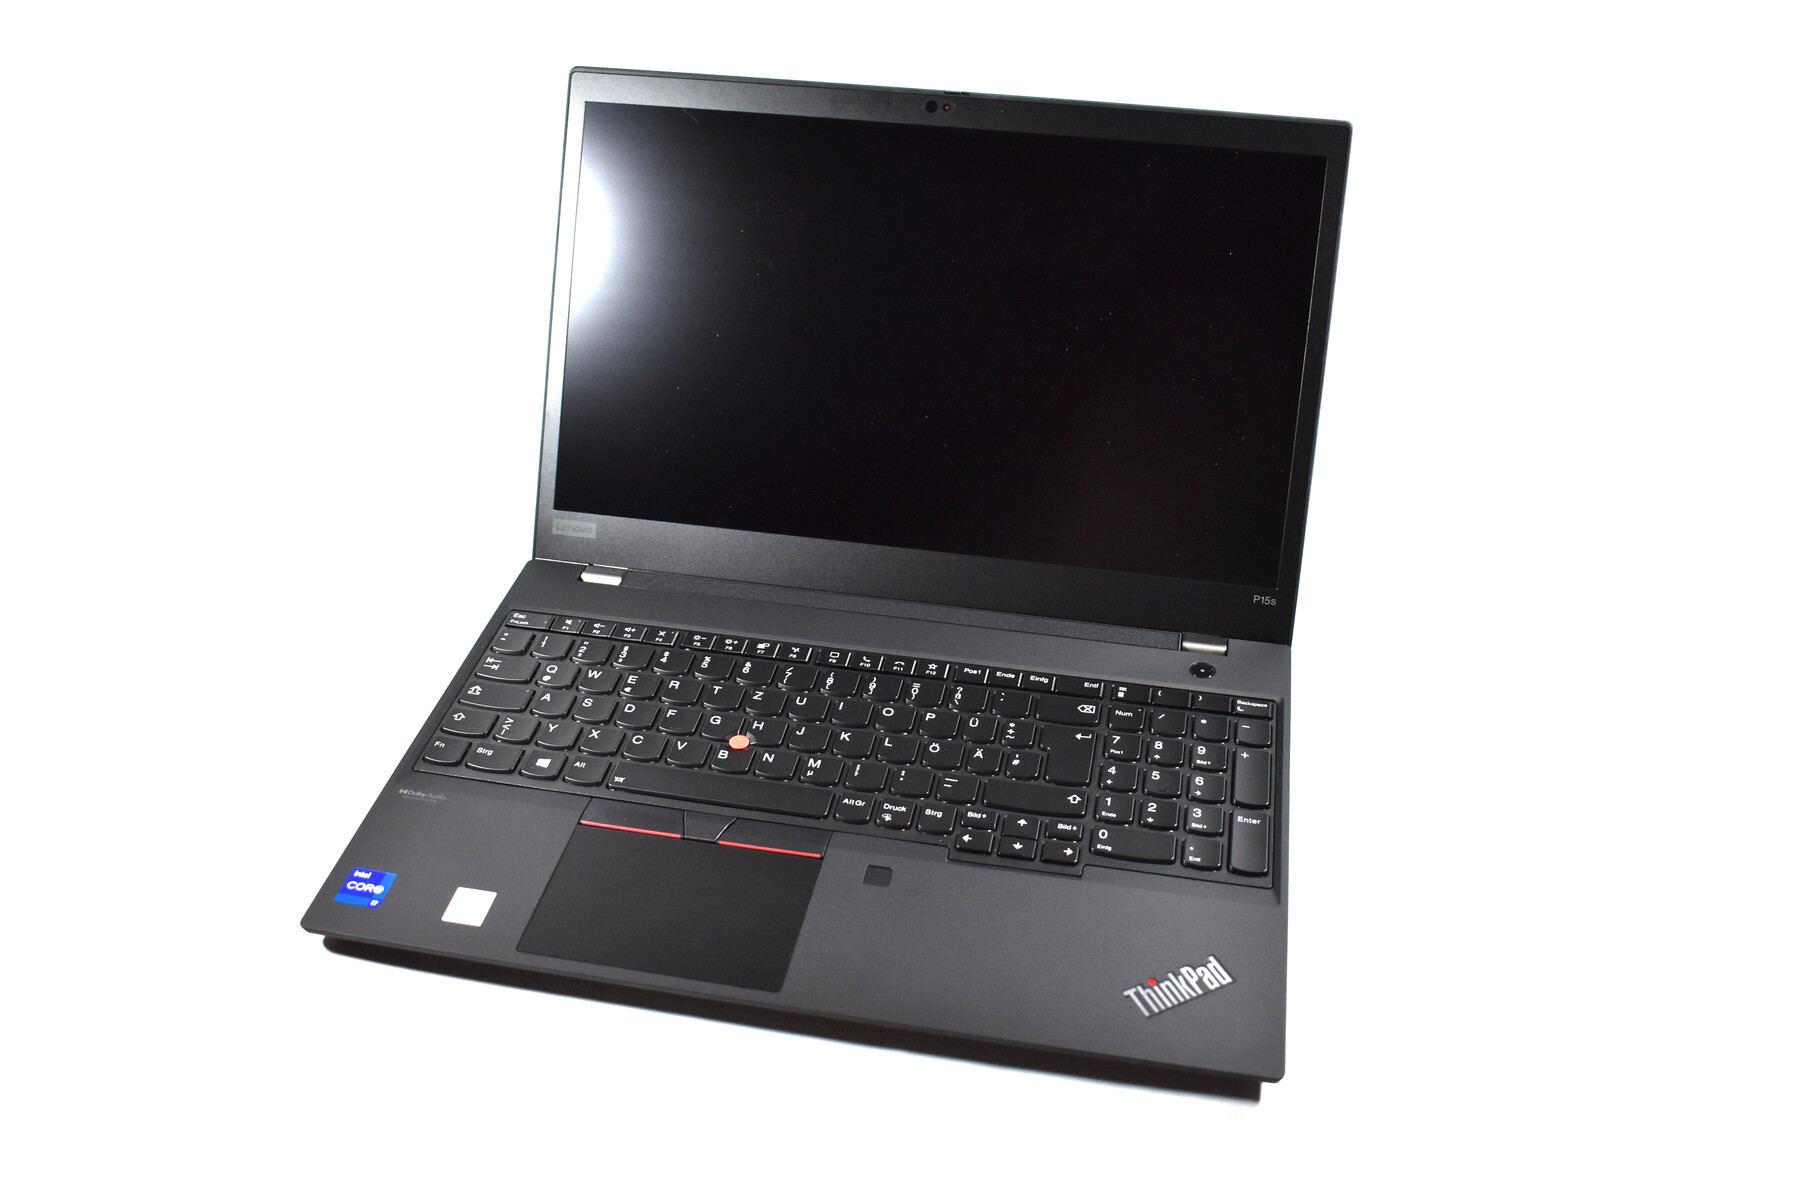
Recensione del computer portatile Lenovo ThinkPad P15s Gen 2: Ultrabook workstation ora con Nvidia T500
Confronto con i potenziali concorrenti
Punteggio | Data | Modello | Peso | Altezza | Dimensione | Risoluzione | Prezzo |
|---|---|---|---|---|---|---|---|
| 85.3 % v7 (old) | 06/2021 | Lenovo ThinkPad P15s Gen2-20W6000GGE i7-1165G7, T500 Laptop GPU | 1.9 kg | 19.1 mm | 15.60" | 3840x2160 | |
| 82.5 % v7 (old) | 01/2021 | Lenovo ThinkPad P15s Gen1-20T4000JGE i7-10510U, Quadro P520 | 1.8 kg | 19.1 mm | 15.60" | 3840x2160 | |
| 85.6 % v7 (old) | 03/2021 | Lenovo ThinkPad P15 Gen1-20ST000DGE i7-10750H, Quadro T1000 (Laptop) | 2.7 kg | 31.45 mm | 15.60" | 1920x1080 | |
| 83.8 % v7 (old) | 04/2021 | HP ZBook Firefly 15 G8 2C9R7EA i7-1165G7, T500 Laptop GPU | 1.8 kg | 19.2 mm | 15.60" | 1920x1080 | |
| 81.2 % v7 (old) | 10/2020 | Dell Precision 3000 3551 i9-10885H, Quadro P620 | 2.2 kg | 24.92 mm | 15.60" | 1920x1080 |

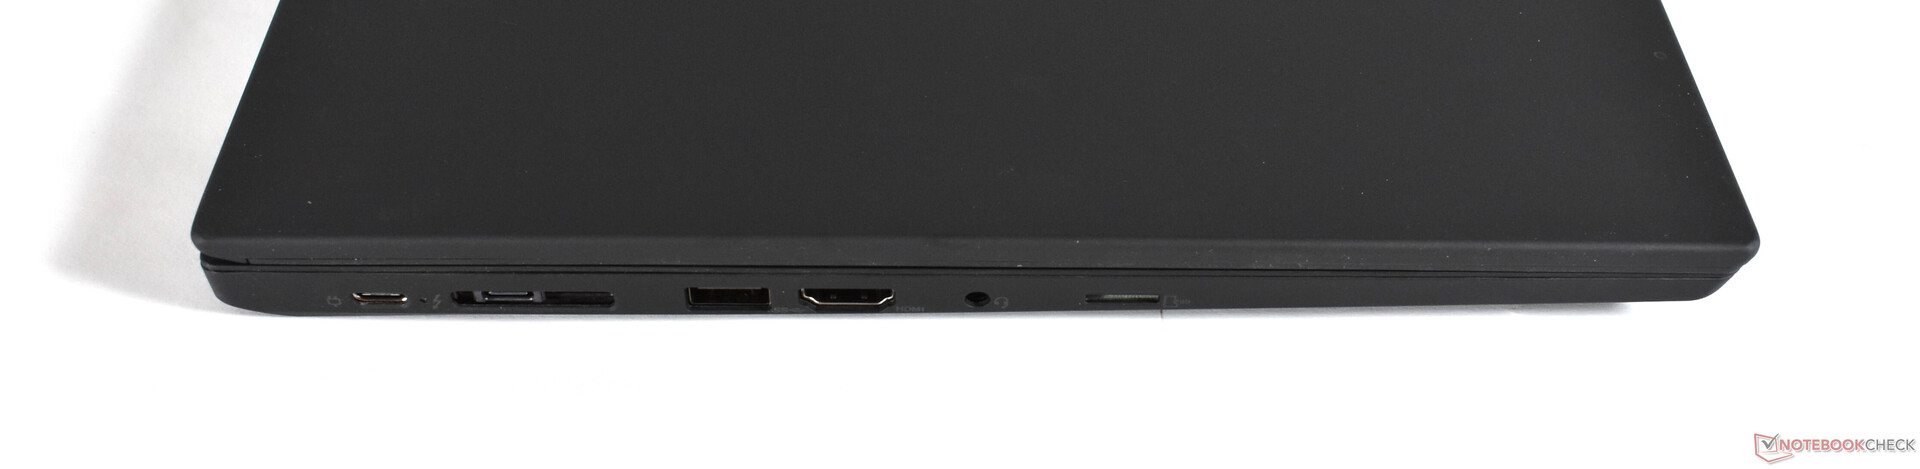
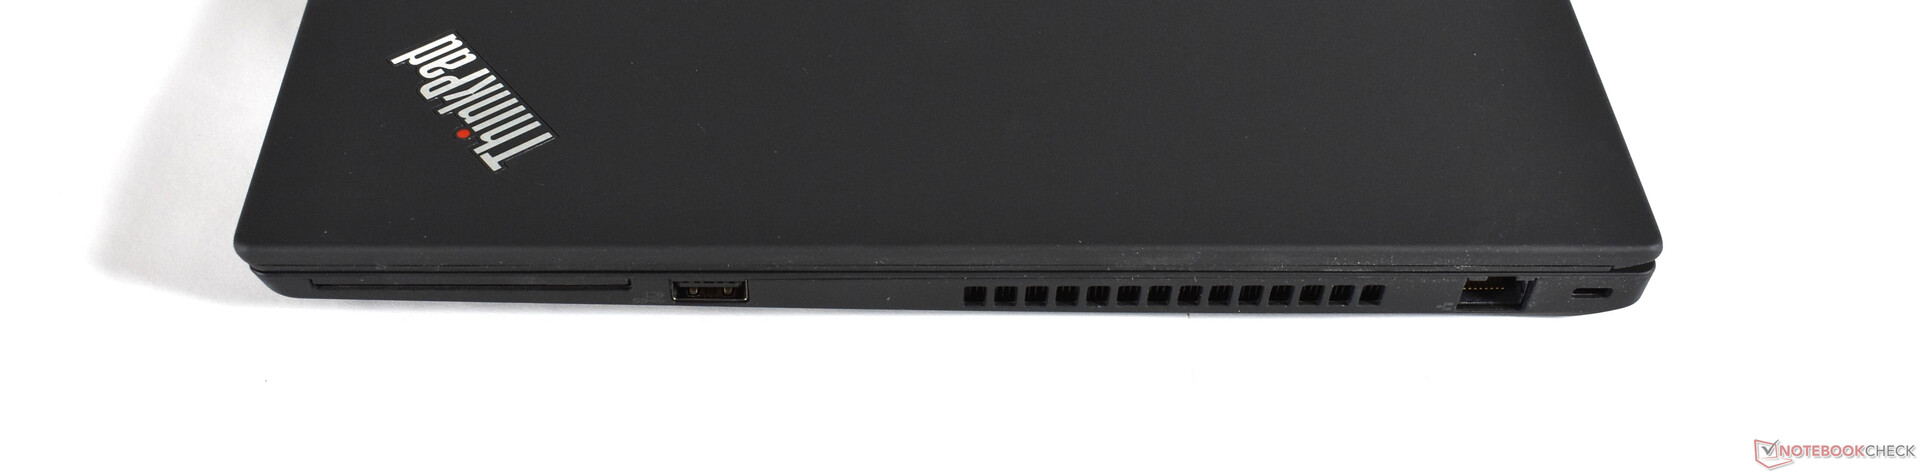
Connessioni
| SD Card Reader | |
| average JPG Copy Test (av. of 3 runs) | |
| Dell Precision 3000 3551 (Toshiba Exceria Pro M501 64 GB UHS-II) | |
| Media della classe Workstation (49.6 - 681, n=14, ultimi 2 anni) | |
| Lenovo ThinkPad P15 Gen1-20ST000DGE (Toshiba Exceria Pro SDXC 64 GB UHS-II) | |
| Lenovo ThinkPad P15s Gen1-20T4000JGE (Toshiba Exceria Pro M501 64 GB UHS-II) | |
| Lenovo ThinkPad P15s Gen2-20W6000GGE (AV Pro V60) | |
| maximum AS SSD Seq Read Test (1GB) | |
| Media della classe Workstation (87.6 - 1455, n=14, ultimi 2 anni) | |
| Dell Precision 3000 3551 (Toshiba Exceria Pro M501 64 GB UHS-II) | |
| Lenovo ThinkPad P15 Gen1-20ST000DGE (Toshiba Exceria Pro SDXC 64 GB UHS-II) | |
| Lenovo ThinkPad P15s Gen2-20W6000GGE (AV Pro V60) | |
| Lenovo ThinkPad P15s Gen1-20T4000JGE (Toshiba Exceria Pro M501 64 GB UHS-II) | |


| |||||||||||||||||||||||||
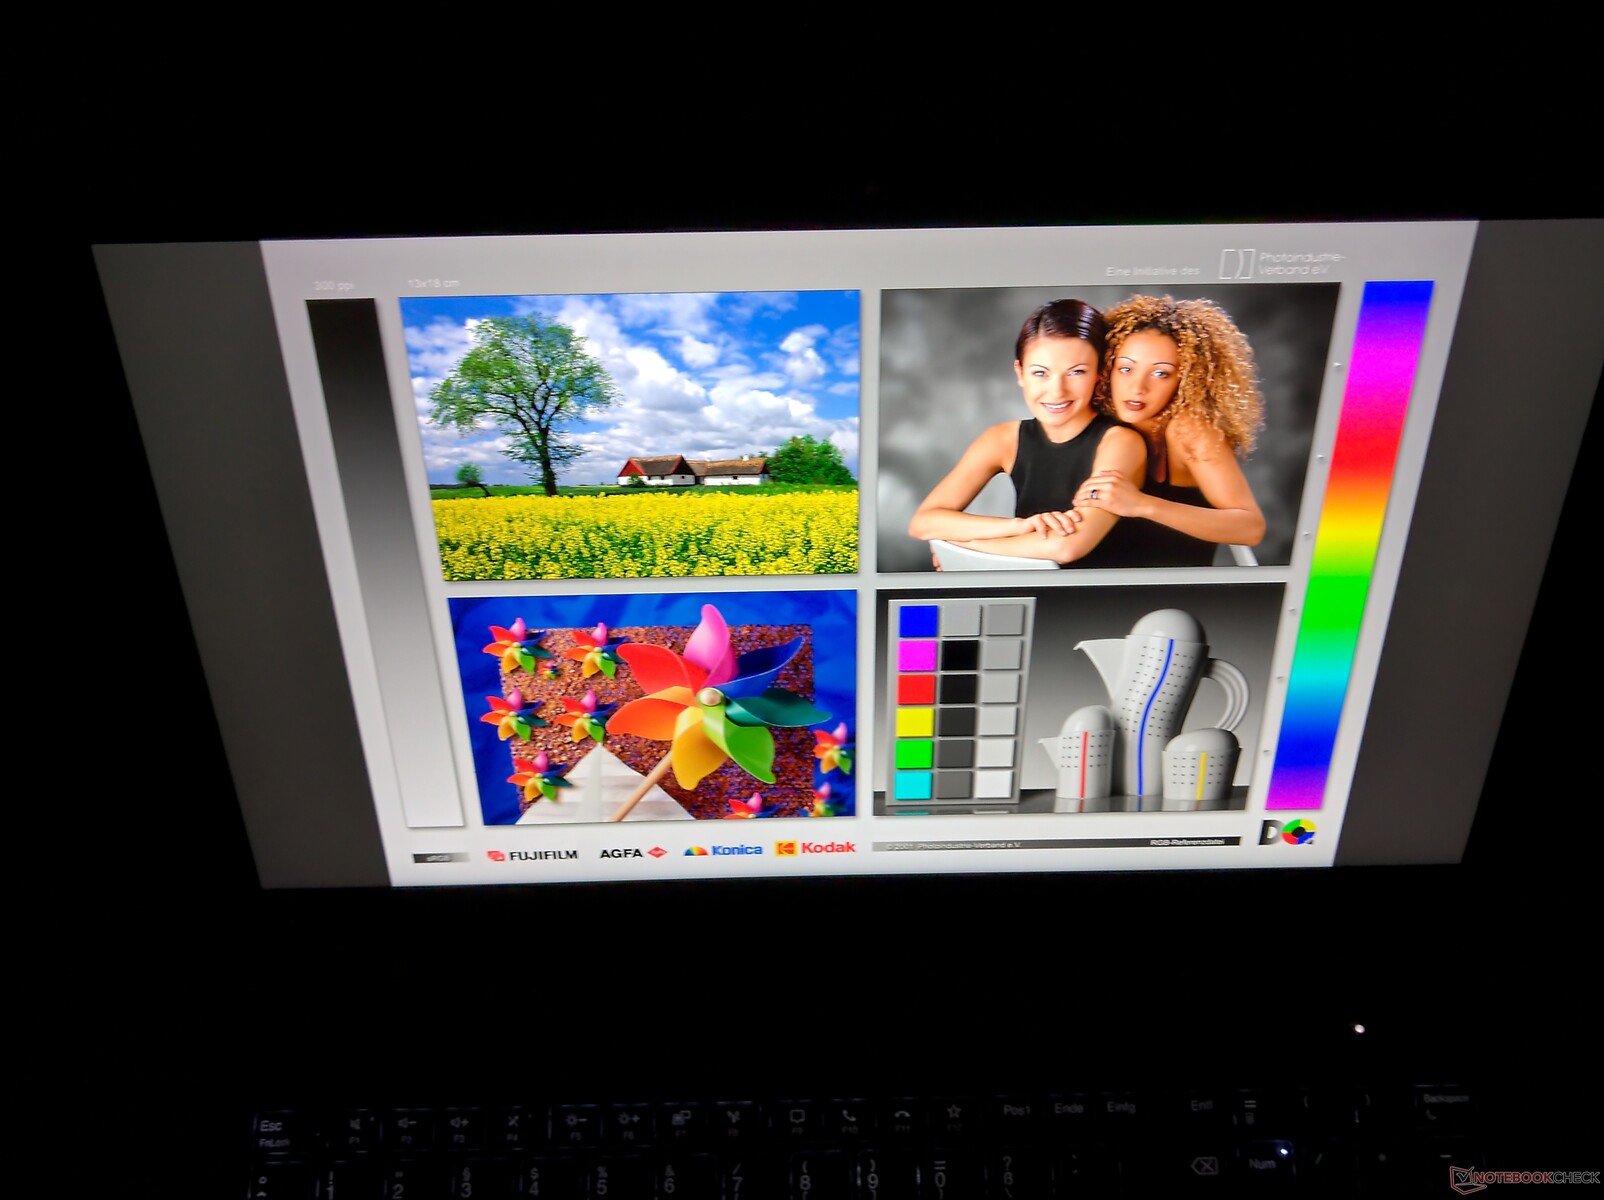
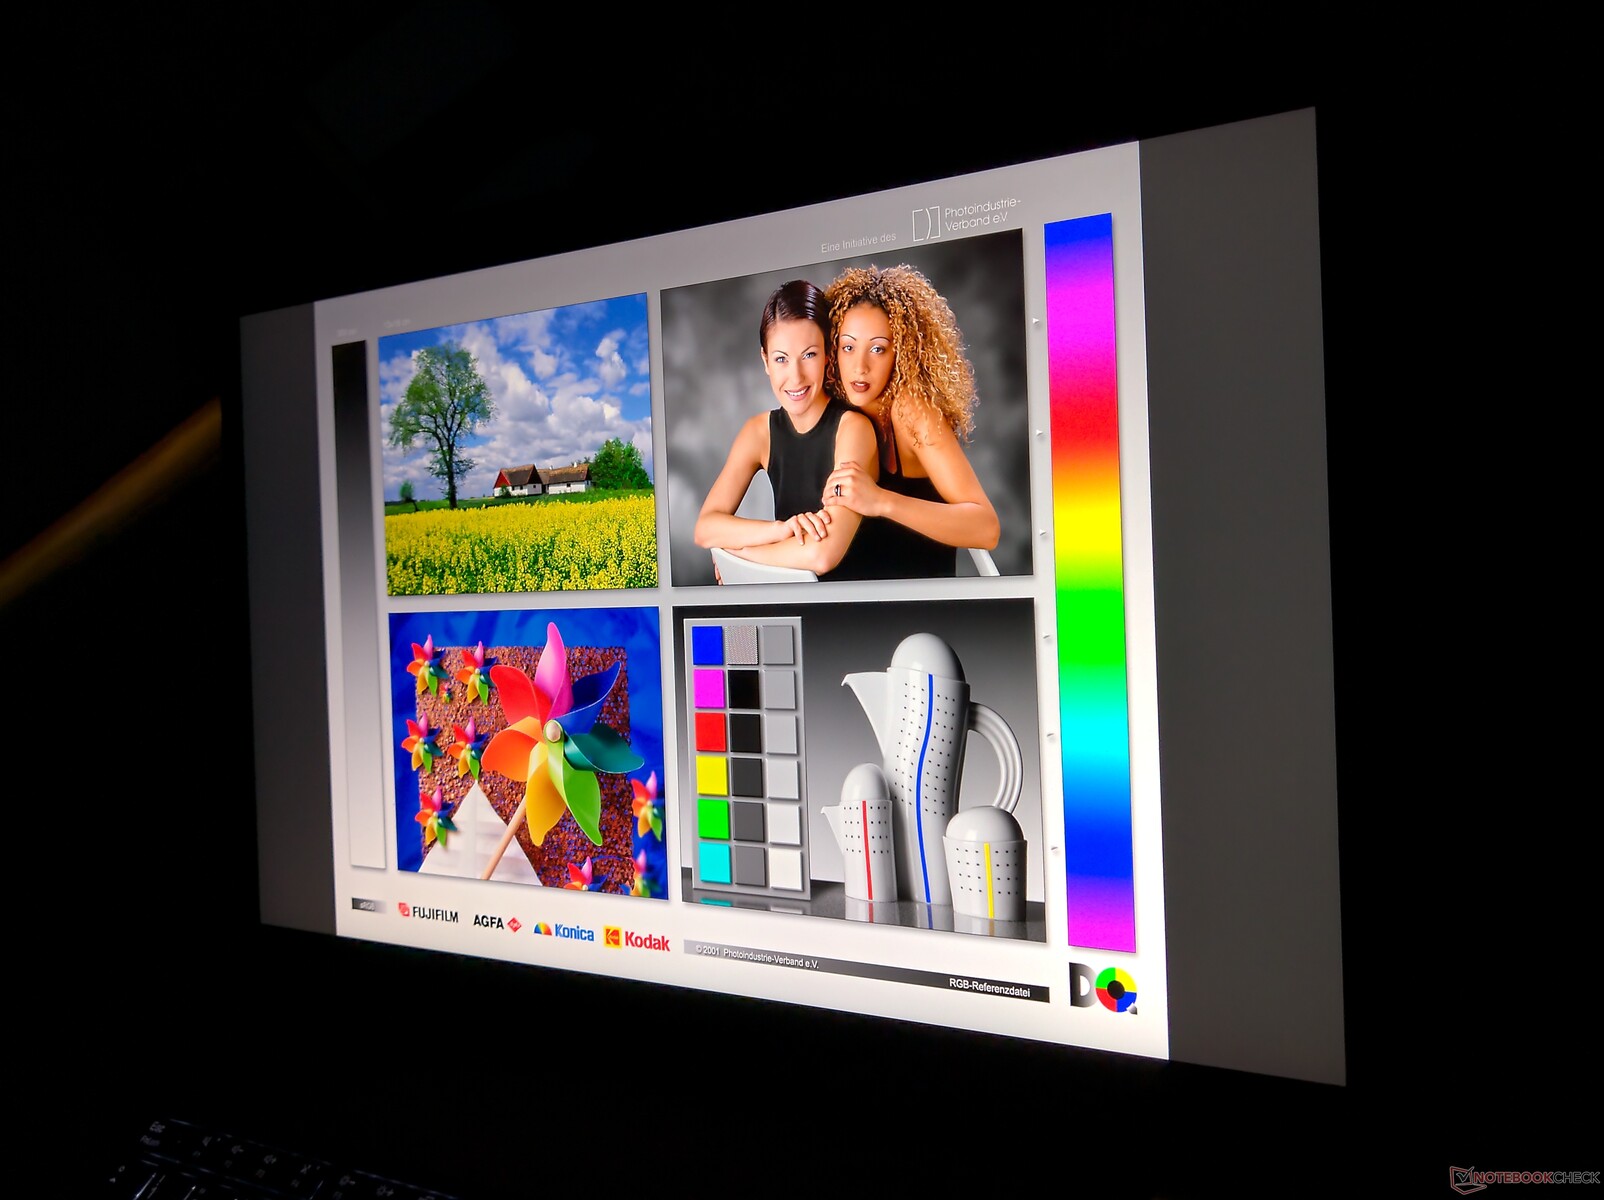
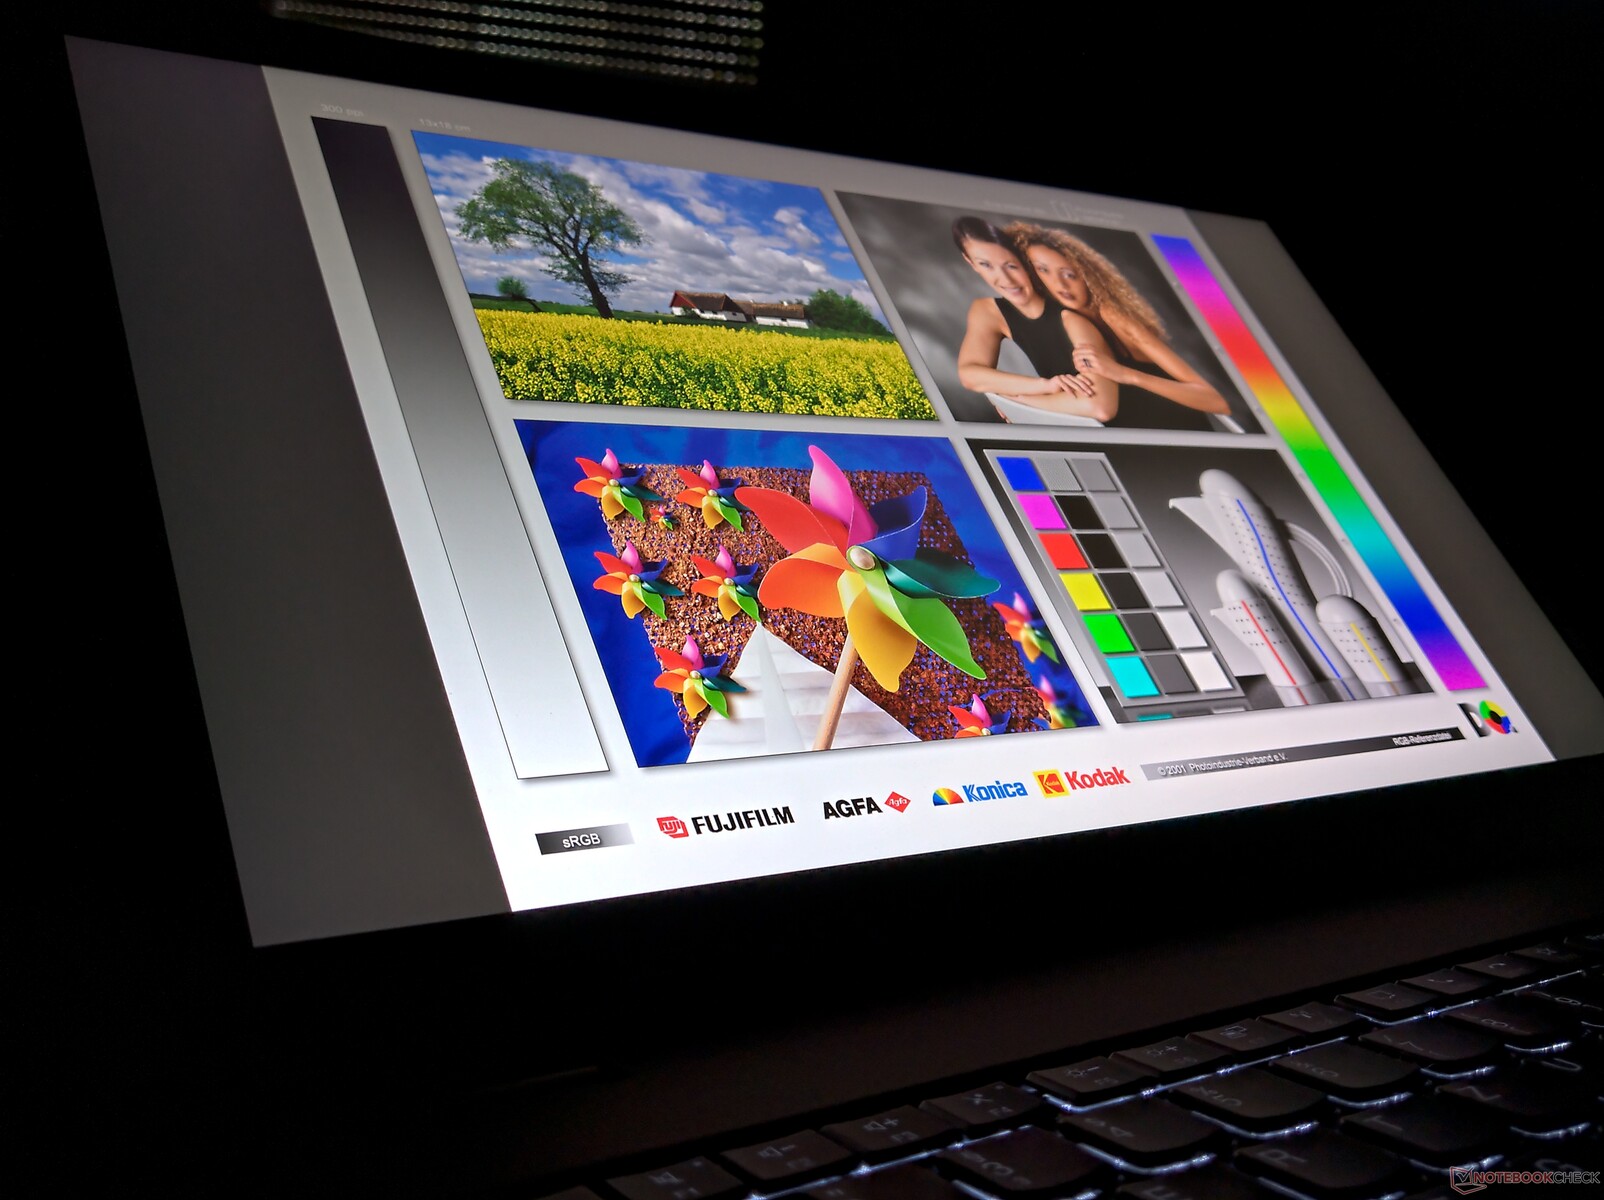
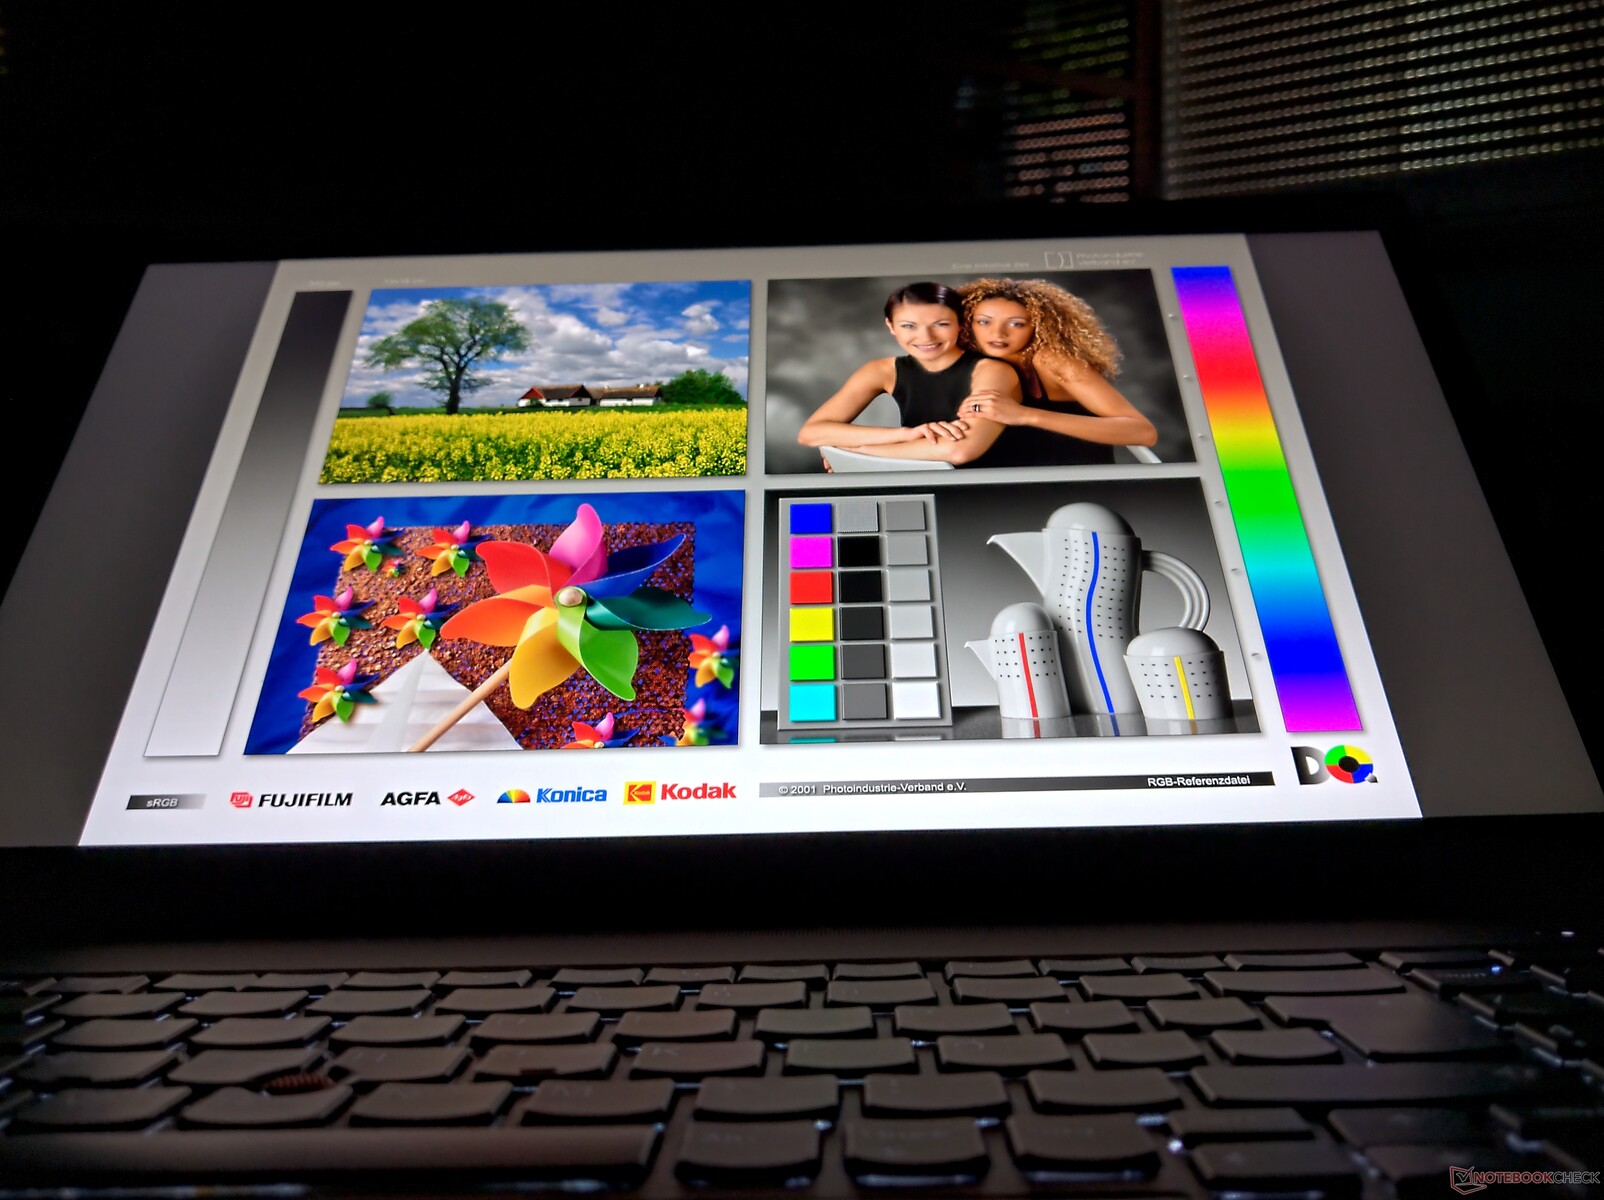
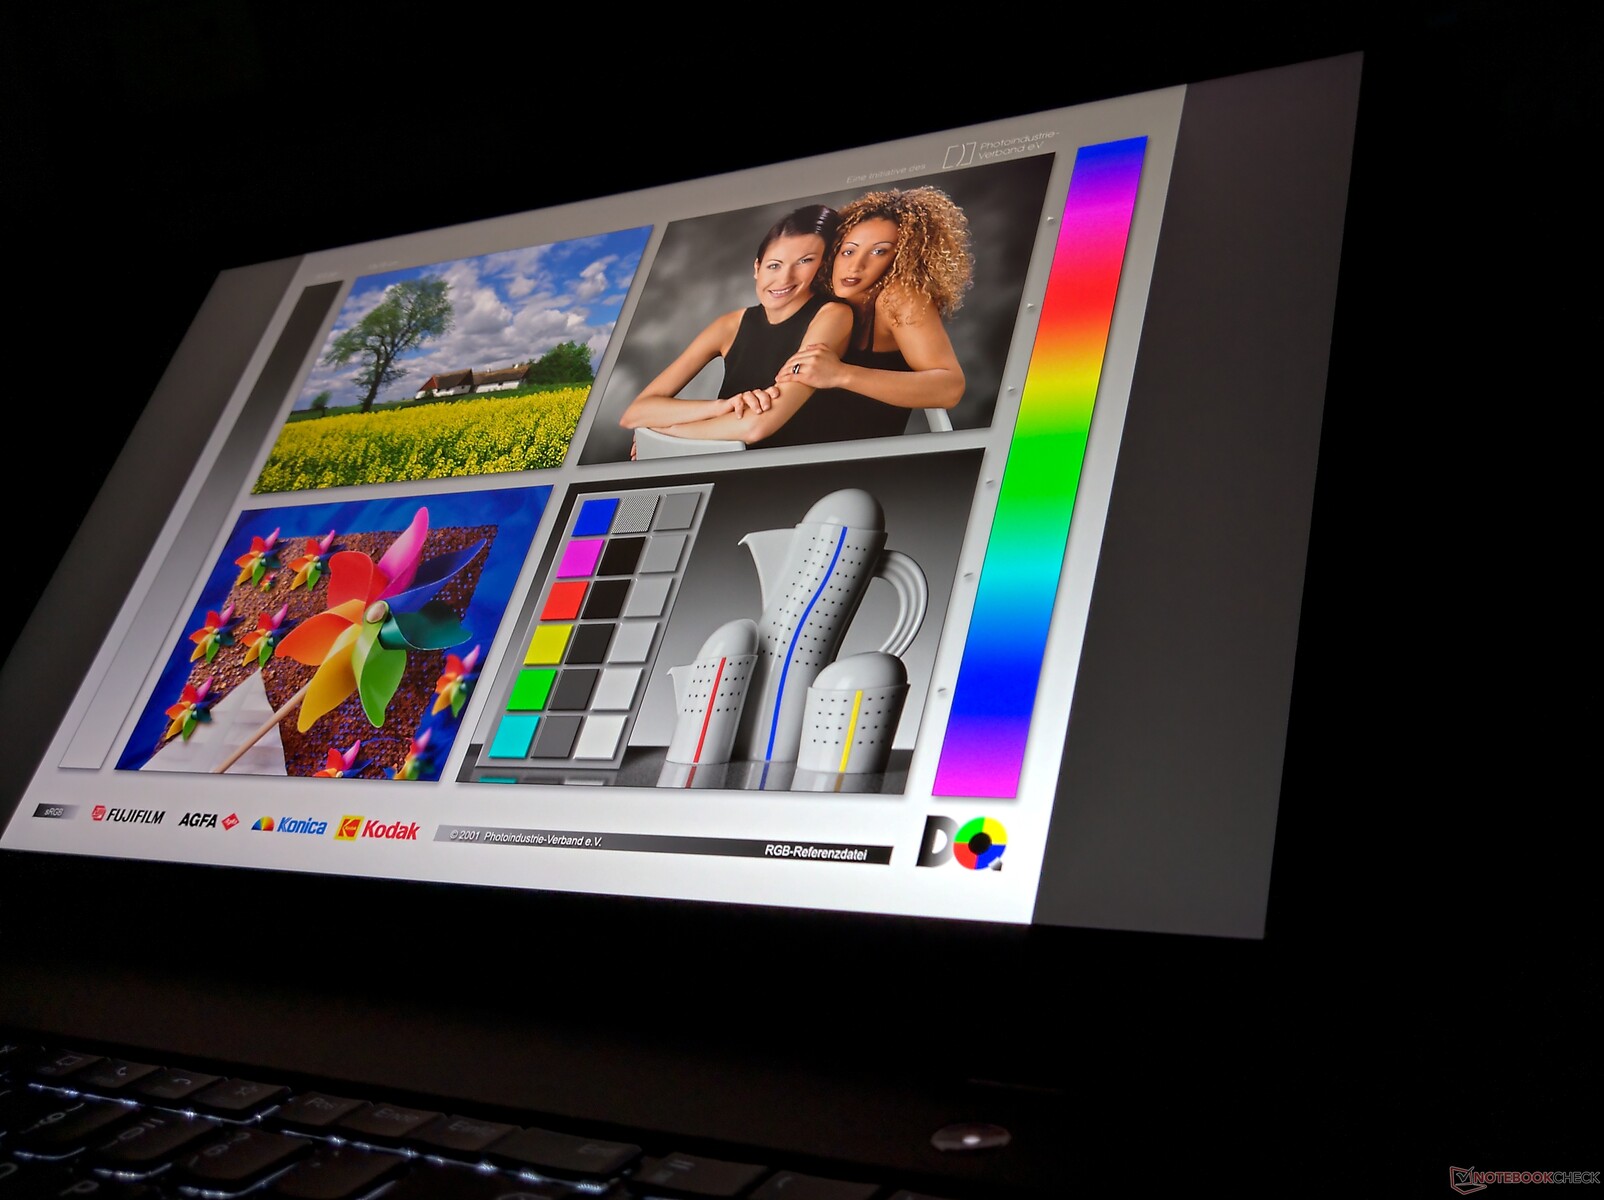
Distribuzione della luminosità: 91 %
Al centro con la batteria: 596 cd/m²
Contrasto: 1776:1 (Nero: 0.34 cd/m²)
ΔE ColorChecker Calman: 0.9 | ∀{0.5-29.43 Ø4.71}
calibrated: 0.8
ΔE Greyscale Calman: 1.1 | ∀{0.09-98 Ø4.96}
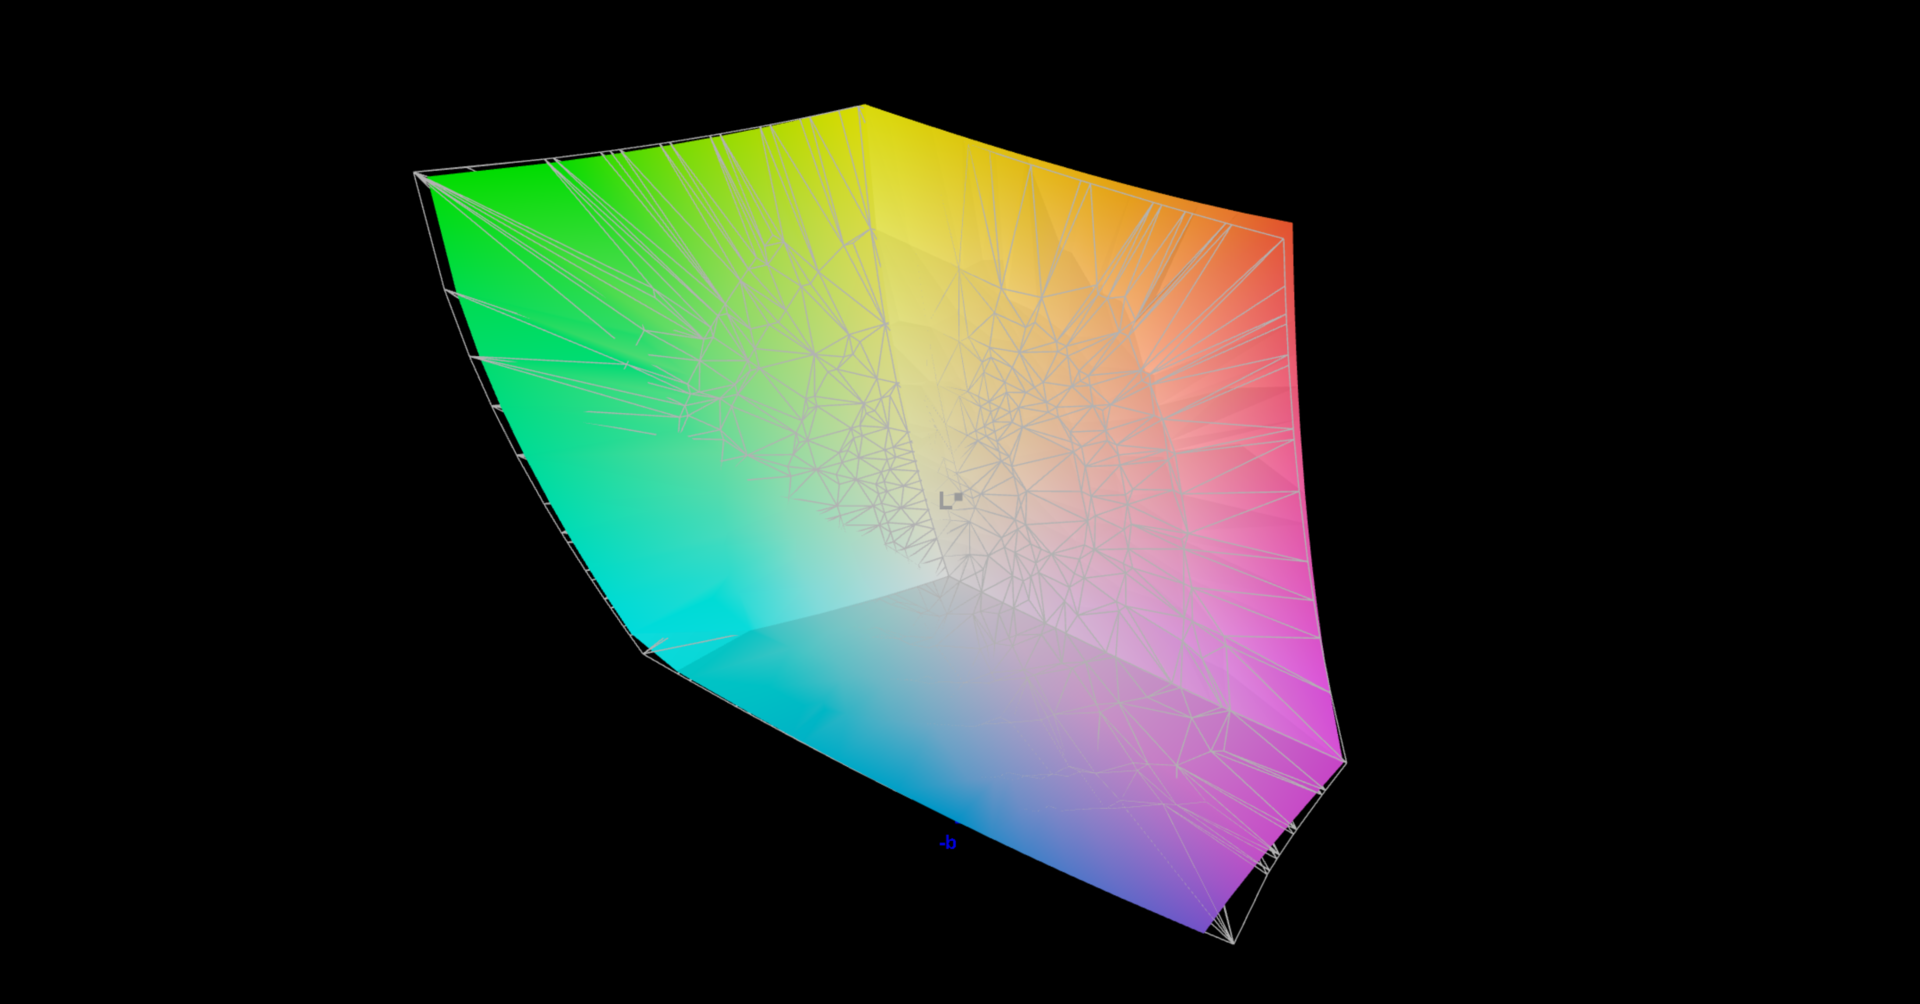
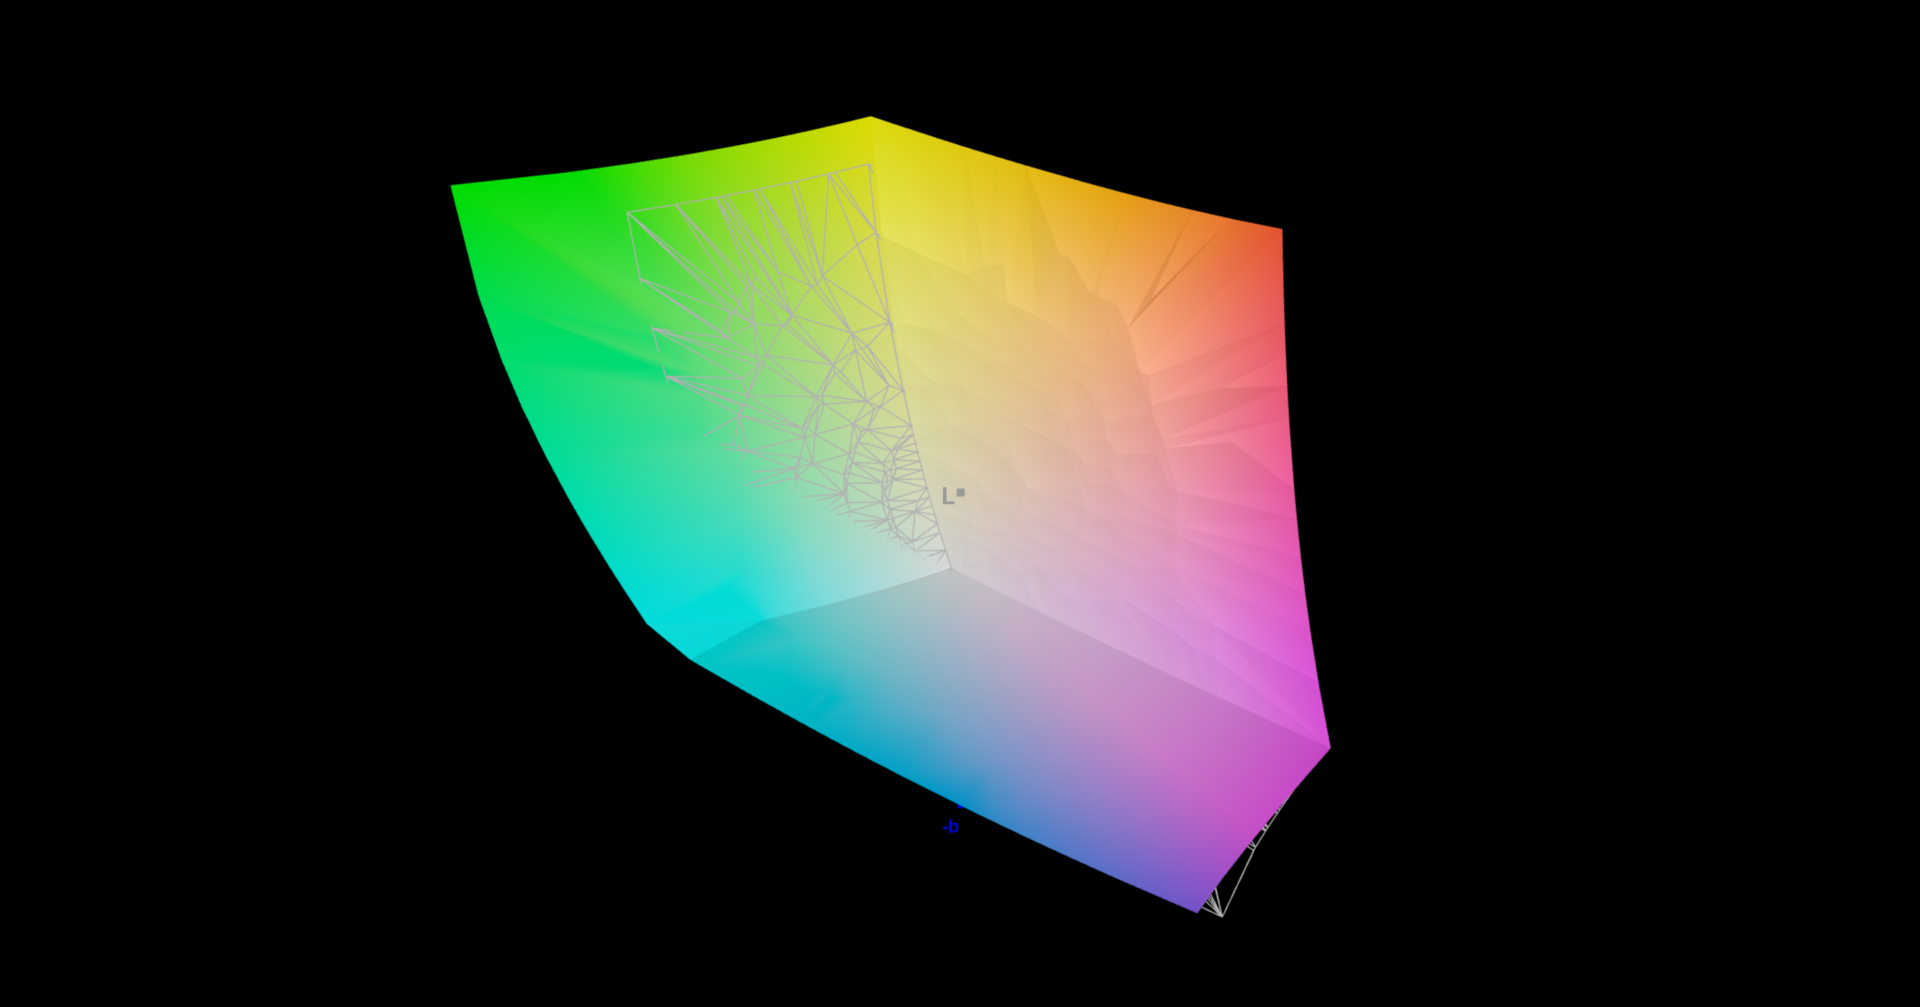
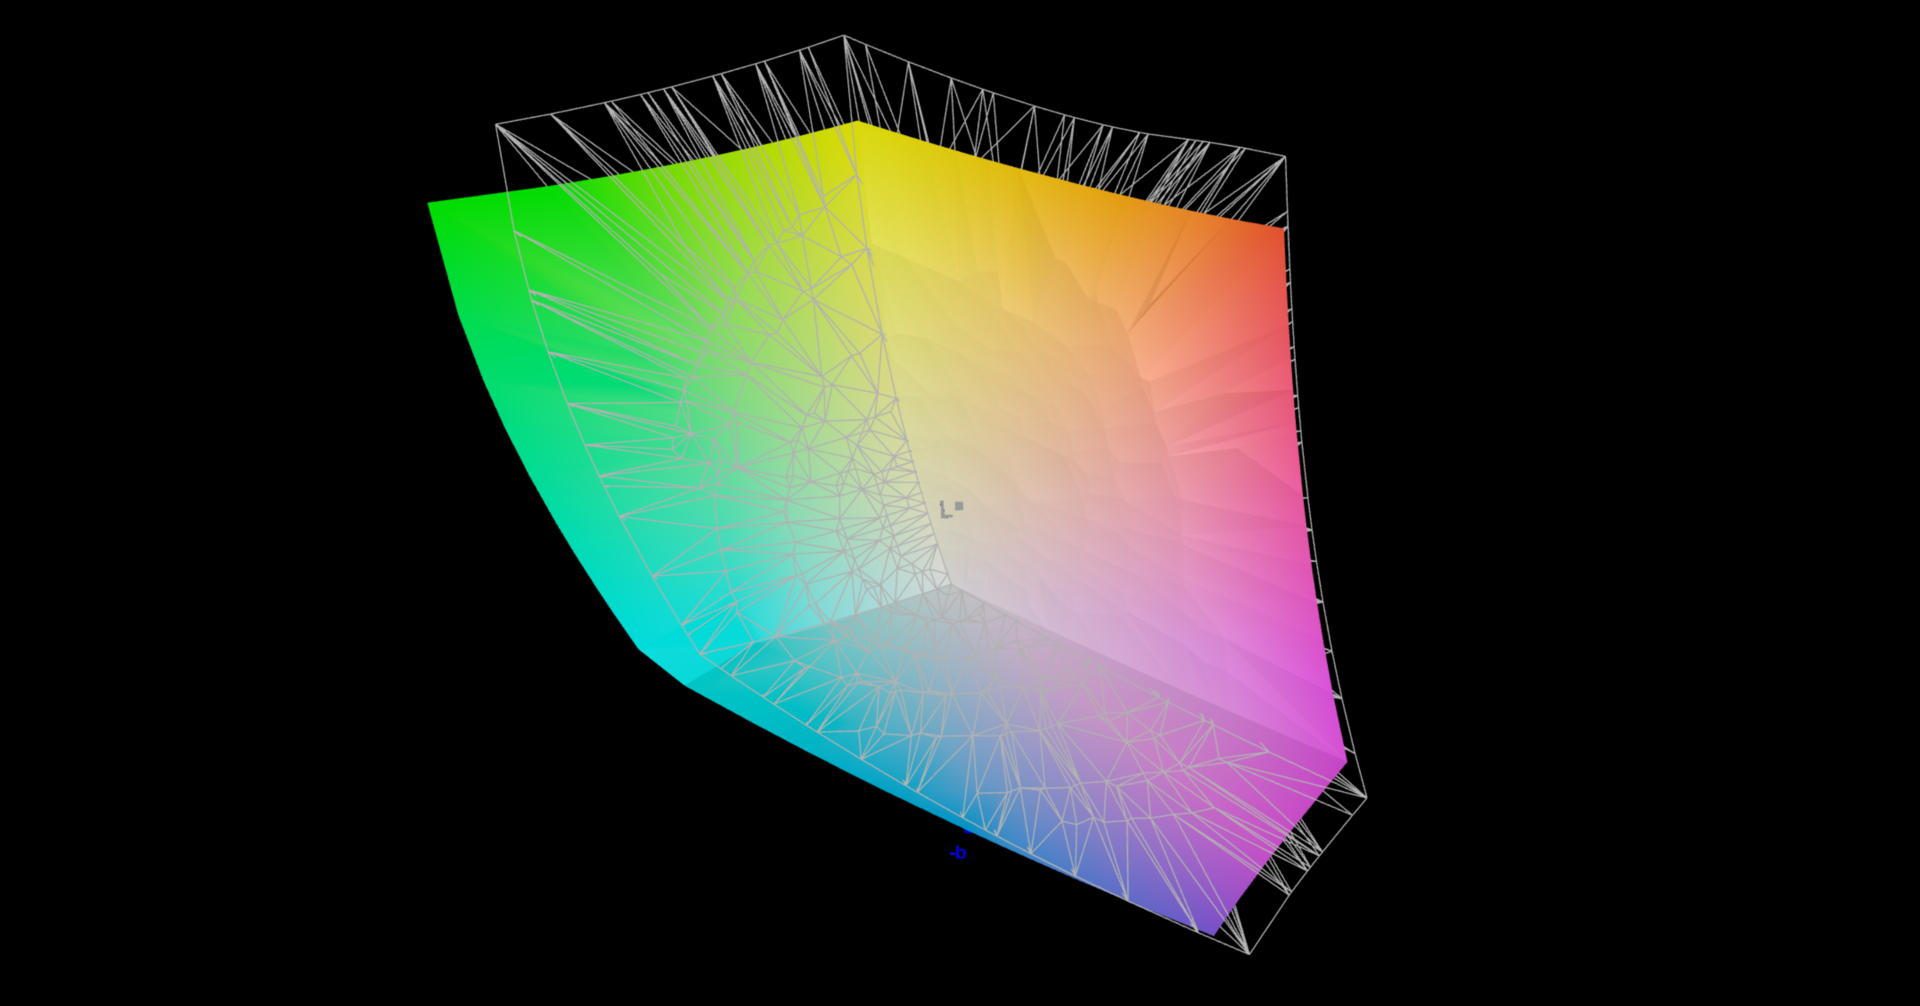
98.6% sRGB (Argyll 1.6.3 3D)
84.5% AdobeRGB 1998 (Argyll 1.6.3 3D)
97.8% AdobeRGB 1998 (Argyll 3D)
98.7% sRGB (Argyll 3D)
84.5% Display P3 (Argyll 3D)
Gamma: 2.15
CCT: 6656 K
| Lenovo ThinkPad P15s Gen2-20W6000GGE MNF601EA1-1, IPS LED, 3840x2160, 15.6" | Lenovo ThinkPad P15s Gen1-20T4000JGE MNF601EA1-1, IPS LED, 3840x2160, 15.6" | Lenovo ThinkPad P15 Gen1-20ST000DGE N156HCE-EN1, a-Si IPS LED, 1920x1080, 15.6" | HP ZBook Firefly 15 G8 2C9R7EA LGD069B, IPS, 1920x1080, 15.6" | Dell Precision 3000 3551 LG Philips 156WFD, IPS, 1920x1080, 15.6" | |
|---|---|---|---|---|---|
| Display | 1% | -19% | -16% | -53% | |
| Display P3 Coverage (%) | 84.5 | 85.8 2% | 66.6 -21% | 68.6 -19% | 37.5 -56% |
| sRGB Coverage (%) | 98.7 | 99.4 1% | 92.3 -6% | 98.5 0% | 56.5 -43% |
| AdobeRGB 1998 Coverage (%) | 97.8 | 98.7 1% | 67.1 -31% | 70 -28% | 38.74 -60% |
| Response Times | -6% | -22% | -39% | 6% | |
| Response Time Grey 50% / Grey 80% * (ms) | 40 ? | 42 ? -5% | 41.2 ? -3% | 56 ? -40% | 29.6 ? 26% |
| Response Time Black / White * (ms) | 23.2 ? | 24.8 ? -7% | 32.8 ? -41% | 32 ? -38% | 26.4 ? -14% |
| PWM Frequency (Hz) | 24270 | ||||
| Screen | -50% | -166% | -138% | -173% | |
| Brightness middle (cd/m²) | 604 | 628 4% | 338 -44% | 397 -34% | 235.5 -61% |
| Brightness (cd/m²) | 609 | 608 0% | 304 -50% | 402 -34% | 228 -63% |
| Brightness Distribution (%) | 91 | 90 -1% | 81 -11% | 84 -8% | 89 -2% |
| Black Level * (cd/m²) | 0.34 | 0.38 -12% | 0.45 -32% | 0.13 62% | 0.25 26% |
| Contrast (:1) | 1776 | 1653 -7% | 751 -58% | 3054 72% | 942 -47% |
| Colorchecker dE 2000 * | 0.9 | 2.3 -156% | 5.5 -511% | 5.9 -556% | 5.44 -504% |
| Colorchecker dE 2000 max. * | 2.6 | 4.9 -88% | 11.5 -342% | 9.4 -262% | 13.58 -422% |
| Colorchecker dE 2000 calibrated * | 0.8 | 1.2 -50% | 1.9 -137% | 1.1 -38% | 5.2 -550% |
| Greyscale dE 2000 * | 1.1 | 3.8 -245% | 7.8 -609% | 8.8 -700% | 3.1 -182% |
| Gamma | 2.15 102% | 2.22 99% | 2.24 98% | 2.47 89% | 2.42 91% |
| CCT | 6656 98% | 6914 94% | 6764 96% | 6416 101% | 7070 92% |
| Color Space (Percent of AdobeRGB 1998) (%) | 84.5 | 85.6 1% | 60 -29% | 63.7 -25% | 35.5 -58% |
| Color Space (Percent of sRGB) (%) | 98.6 | 99.4 1% | 92.1 -7% | 98.5 0% | 56.1 -43% |
| Media totale (Programma / Settaggio) | -18% /
-35% | -69% /
-121% | -64% /
-103% | -73% /
-128% |
* ... Meglio usare valori piccoli
Tempi di risposta del Display
| ↔ Tempi di risposta dal Nero al Bianco | ||
|---|---|---|
| 23.2 ms ... aumenta ↗ e diminuisce ↘ combinato | ↗ 10.8 ms Incremento | 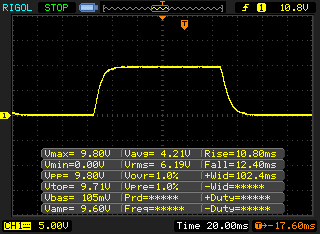 |
| ↘ 12.4 ms Calo | ||
| Lo schermo mostra buoni tempi di risposta durante i nostri tests, ma potrebbe essere troppo lento per i gamers competitivi. In confronto, tutti i dispositivi di test variano da 0.1 (minimo) a 240 (massimo) ms. » 53 % di tutti i dispositivi è migliore. Questo significa che i tempi di risposta rilevati sono peggiori rispetto alla media di tutti i dispositivi testati (19.8 ms). | ||
| ↔ Tempo di risposta dal 50% Grigio all'80% Grigio | ||
| 40 ms ... aumenta ↗ e diminuisce ↘ combinato | ↗ 19.6 ms Incremento | 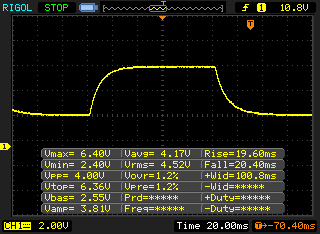 |
| ↘ 20.4 ms Calo | ||
| Lo schermo mostra tempi di risposta lenti nei nostri tests e sarà insoddisfacente per i gamers. In confronto, tutti i dispositivi di test variano da 0.165 (minimo) a 636 (massimo) ms. » 61 % di tutti i dispositivi è migliore. Questo significa che i tempi di risposta rilevati sono peggiori rispetto alla media di tutti i dispositivi testati (31 ms). | ||
Sfarfallio dello schermo / PWM (Pulse-Width Modulation)
| flickering dello schermo / PWM non rilevato | 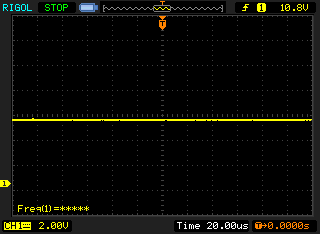 | ||
In confronto: 52 % di tutti i dispositivi testati non utilizza PWM per ridurre la luminosita' del display. Se è rilevato PWM, una media di 7757 (minimo: 5 - massimo: 343500) Hz è stata rilevata. | |||
Cinebench R23: Single Core | Multi Core
Cinebench R15: CPU Single 64Bit | CPU Multi 64Bit
Blender: v2.79 BMW27 CPU
7-Zip 18.03: 7z b 4 -mmt1 | 7z b 4
Geekbench 5.5: Single-Core | Multi-Core
HWBOT x265 Benchmark v2.2: 4k Preset
LibreOffice : 20 Documents To PDF
R Benchmark 2.5: Overall mean
| Cinebench R20 / CPU (Single Core) | |
| Media della classe Workstation (671 - 857, n=23, ultimi 2 anni) | |
| HP ZBook Firefly 15 G8 2C9R7EA | |
| Lenovo ThinkPad P15s Gen2-20W6000GGE | |
| Media Intel Core i7-1165G7 (442 - 589, n=81) | |
| Lenovo ThinkPad P15 Gen1-20ST000DGE | |
| Lenovo ThinkPad P15s Gen1-20T4000JGE | |
| Dell Precision 3000 3551 | |
| Cinebench R20 / CPU (Multi Core) | |
| Media della classe Workstation (5760 - 15043, n=23, ultimi 2 anni) | |
| Lenovo ThinkPad P15 Gen1-20ST000DGE | |
| Dell Precision 3000 3551 | |
| HP ZBook Firefly 15 G8 2C9R7EA | |
| Media Intel Core i7-1165G7 (1060 - 2657, n=81) | |
| Lenovo ThinkPad P15s Gen2-20W6000GGE | |
| Lenovo ThinkPad P15s Gen1-20T4000JGE | |
| Cinebench R23 / Single Core | |
| Media della classe Workstation (1712 - 2228, n=23, ultimi 2 anni) | |
| Lenovo ThinkPad P15s Gen2-20W6000GGE | |
| Media Intel Core i7-1165G7 (1110 - 1539, n=59) | |
| Lenovo ThinkPad P15 Gen1-20ST000DGE | |
| Cinebench R23 / Multi Core | |
| Media della classe Workstation (14621 - 38520, n=23, ultimi 2 anni) | |
| Lenovo ThinkPad P15 Gen1-20ST000DGE | |
| Lenovo ThinkPad P15s Gen2-20W6000GGE | |
| Media Intel Core i7-1165G7 (2525 - 6862, n=64) | |
| Cinebench R15 / CPU Single 64Bit | |
| Media della classe Workstation (191.4 - 328, n=23, ultimi 2 anni) | |
| HP ZBook Firefly 15 G8 2C9R7EA | |
| Lenovo ThinkPad P15s Gen2-20W6000GGE | |
| Media Intel Core i7-1165G7 (115 - 230, n=78) | |
| Lenovo ThinkPad P15 Gen1-20ST000DGE | |
| Dell Precision 3000 3551 | |
| Lenovo ThinkPad P15s Gen1-20T4000JGE | |
| Cinebench R15 / CPU Multi 64Bit | |
| Media della classe Workstation (2489 - 5810, n=23, ultimi 2 anni) | |
| Lenovo ThinkPad P15 Gen1-20ST000DGE | |
| Dell Precision 3000 3551 | |
| Lenovo ThinkPad P15s Gen2-20W6000GGE | |
| HP ZBook Firefly 15 G8 2C9R7EA | |
| Media Intel Core i7-1165G7 (553 - 1027, n=86) | |
| Lenovo ThinkPad P15s Gen1-20T4000JGE | |
| Blender / v2.79 BMW27 CPU | |
| Lenovo ThinkPad P15s Gen1-20T4000JGE | |
| Media Intel Core i7-1165G7 (468 - 1138, n=80) | |
| HP ZBook Firefly 15 G8 2C9R7EA | |
| Lenovo ThinkPad P15s Gen2-20W6000GGE | |
| Lenovo ThinkPad P15 Gen1-20ST000DGE | |
| Dell Precision 3000 3551 | |
| Media della classe Workstation (91 - 222, n=23, ultimi 2 anni) | |
| 7-Zip 18.03 / 7z b 4 -mmt1 | |
| Media della classe Workstation (5126 - 6960, n=23, ultimi 2 anni) | |
| HP ZBook Firefly 15 G8 2C9R7EA | |
| Lenovo ThinkPad P15s Gen2-20W6000GGE | |
| Dell Precision 3000 3551 | |
| Lenovo ThinkPad P15 Gen1-20ST000DGE | |
| Media Intel Core i7-1165G7 (4478 - 5507, n=80) | |
| Lenovo ThinkPad P15s Gen1-20T4000JGE | |
| 7-Zip 18.03 / 7z b 4 | |
| Media della classe Workstation (60489 - 116969, n=23, ultimi 2 anni) | |
| Lenovo ThinkPad P15 Gen1-20ST000DGE | |
| Dell Precision 3000 3551 | |
| HP ZBook Firefly 15 G8 2C9R7EA | |
| Media Intel Core i7-1165G7 (15347 - 27405, n=80) | |
| Lenovo ThinkPad P15s Gen2-20W6000GGE | |
| Lenovo ThinkPad P15s Gen1-20T4000JGE | |
| Geekbench 5.5 / Single-Core | |
| Media della classe Workstation (1783 - 2183, n=23, ultimi 2 anni) | |
| HP ZBook Firefly 15 G8 2C9R7EA | |
| Lenovo ThinkPad P15s Gen2-20W6000GGE | |
| Media Intel Core i7-1165G7 (1302 - 1595, n=77) | |
| Lenovo ThinkPad P15 Gen1-20ST000DGE | |
| Dell Precision 3000 3551 | |
| Lenovo ThinkPad P15s Gen1-20T4000JGE | |
| Geekbench 5.5 / Multi-Core | |
| Media della classe Workstation (11542 - 25554, n=23, ultimi 2 anni) | |
| Dell Precision 3000 3551 | |
| Lenovo ThinkPad P15 Gen1-20ST000DGE | |
| Lenovo ThinkPad P15s Gen2-20W6000GGE | |
| Media Intel Core i7-1165G7 (3078 - 5926, n=77) | |
| HP ZBook Firefly 15 G8 2C9R7EA | |
| Lenovo ThinkPad P15s Gen1-20T4000JGE | |
| HWBOT x265 Benchmark v2.2 / 4k Preset | |
| Media della classe Workstation (17.8 - 40.5, n=23, ultimi 2 anni) | |
| Dell Precision 3000 3551 | |
| Lenovo ThinkPad P15 Gen1-20ST000DGE | |
| Lenovo ThinkPad P15s Gen2-20W6000GGE | |
| HP ZBook Firefly 15 G8 2C9R7EA | |
| Media Intel Core i7-1165G7 (1.39 - 8.47, n=80) | |
| Lenovo ThinkPad P15s Gen1-20T4000JGE | |
| LibreOffice / 20 Documents To PDF | |
| Lenovo ThinkPad P15s Gen1-20T4000JGE | |
| Lenovo ThinkPad P15 Gen1-20ST000DGE | |
| Media Intel Core i7-1165G7 (21.5 - 88.1, n=78) | |
| Media della classe Workstation (37.1 - 74.7, n=23, ultimi 2 anni) | |
| Dell Precision 3000 3551 | |
| Lenovo ThinkPad P15s Gen2-20W6000GGE | |
| HP ZBook Firefly 15 G8 2C9R7EA | |
| R Benchmark 2.5 / Overall mean | |
| Lenovo ThinkPad P15s Gen1-20T4000JGE | |
| Lenovo ThinkPad P15 Gen1-20ST000DGE | |
| Media Intel Core i7-1165G7 (0.552 - 1.002, n=80) | |
| Dell Precision 3000 3551 | |
| HP ZBook Firefly 15 G8 2C9R7EA | |
| Lenovo ThinkPad P15s Gen2-20W6000GGE | |
| Media della classe Workstation (0.3825 - 0.603, n=23, ultimi 2 anni) | |
* ... Meglio usare valori piccoli
| PCMark 10 / Score | |
| Media della classe Workstation (6563 - 10409, n=19, ultimi 2 anni) | |
| Lenovo ThinkPad P15 Gen1-20ST000DGE | |
| HP ZBook Firefly 15 G8 2C9R7EA | |
| Media Intel Core i7-1165G7, NVIDIA T500 Laptop GPU (5237 - 5550, n=3) | |
| Lenovo ThinkPad P15s Gen2-20W6000GGE | |
| Dell Precision 3000 3551 | |
| Lenovo ThinkPad P15s Gen1-20T4000JGE | |
| PCMark 10 / Essentials | |
| Media della classe Workstation (9622 - 11157, n=19, ultimi 2 anni) | |
| Dell Precision 3000 3551 | |
| Lenovo ThinkPad P15 Gen1-20ST000DGE | |
| Lenovo ThinkPad P15s Gen2-20W6000GGE | |
| HP ZBook Firefly 15 G8 2C9R7EA | |
| Media Intel Core i7-1165G7, NVIDIA T500 Laptop GPU (8765 - 9540, n=3) | |
| Lenovo ThinkPad P15s Gen1-20T4000JGE | |
| PCMark 10 / Productivity | |
| Media della classe Workstation (8789 - 20616, n=19, ultimi 2 anni) | |
| Lenovo ThinkPad P15s Gen2-20W6000GGE | |
| HP ZBook Firefly 15 G8 2C9R7EA | |
| Media Intel Core i7-1165G7, NVIDIA T500 Laptop GPU (8337 - 9317, n=3) | |
| Dell Precision 3000 3551 | |
| Lenovo ThinkPad P15 Gen1-20ST000DGE | |
| Lenovo ThinkPad P15s Gen1-20T4000JGE | |
| PCMark 10 / Digital Content Creation | |
| Media della classe Workstation (8108 - 15631, n=19, ultimi 2 anni) | |
| Lenovo ThinkPad P15 Gen1-20ST000DGE | |
| HP ZBook Firefly 15 G8 2C9R7EA | |
| Media Intel Core i7-1165G7, NVIDIA T500 Laptop GPU (4477 - 5604, n=3) | |
| Dell Precision 3000 3551 | |
| Lenovo ThinkPad P15s Gen2-20W6000GGE | |
| Lenovo ThinkPad P15s Gen1-20T4000JGE | |
| PCMark 10 Score | 5237 punti | |
Aiuto | ||
| DPC Latencies / LatencyMon - interrupt to process latency (max), Web, Youtube, Prime95 | |
| Lenovo ThinkPad P15s Gen2-20W6000GGE | |
* ... Meglio usare valori piccoli
| Lenovo ThinkPad P15s Gen2-20W6000GGE WDC PC SN720 SDAQNTW-1T00 | Lenovo ThinkPad P15s Gen1-20T4000JGE Samsung PM981a MZVLB1T0HBLR | Lenovo ThinkPad P15 Gen1-20ST000DGE Toshiba XG6 KXG6AZNV512G | HP ZBook Firefly 15 G8 2C9R7EA Toshiba XG6 KXG60ZNV1T02 | Dell Precision 3000 3551 Toshiba Kioxia XG6 KXG60PNV512G | Media WDC PC SN720 SDAQNTW-1T00 | Media della classe Workstation | |
|---|---|---|---|---|---|---|---|
| CrystalDiskMark 5.2 / 6 | -11% | -7% | -12% | -18% | -10% | 60% | |
| Write 4K (MB/s) | 237.6 | 142.8 -40% | 129.5 -45% | 140.6 -41% | 120.9 -49% | 168.6 ? -29% | 169.9 ? -28% |
| Read 4K (MB/s) | 54.7 | 47.51 -13% | 49.54 -9% | 52.8 -3% | 46.79 -14% | 47.6 ? -13% | 71.1 ? 30% |
| Write Seq (MB/s) | 2603 | 2051 -21% | 2379 -9% | 1844 -29% | 1916 -26% | 2602 ? 0% | 3945 ? 52% |
| Read Seq (MB/s) | 1889 | 2219 17% | 1989 5% | 2108 12% | 2216 17% | 2084 ? 10% | 4364 ? 131% |
| Write 4K Q32T1 (MB/s) | 505 | 470.6 -7% | 663 31% | 418 -17% | 393.9 -22% | 391 ? -23% | 511 ? 1% |
| Read 4K Q32T1 (MB/s) | 606 | 419.5 -31% | 425.2 -30% | 476.8 -21% | 375.1 -38% | 481 ? -21% | 615 ? 1% |
| Write Seq Q32T1 (MB/s) | 2795 | 3011 8% | 2960 6% | 3064 10% | 2795 0% | 2792 ? 0% | 6681 ? 139% |
| Read Seq Q32T1 (MB/s) | 3448 | 3563 3% | 3182 -8% | 3289 -5% | 3106 -10% | 3377 ? -2% | 8610 ? 150% |

Carico di lettura continuo: DiskSpd Read Loop, Queue Depth 8
| 3DMark 11 Performance | 6293 punti | |
| 3DMark Fire Strike Score | 3406 punti | |
| 3DMark Time Spy Score | 1627 punti | |
Aiuto | ||
| basso | medio | alto | ultra | QHD | 4K | |
|---|---|---|---|---|---|---|
| GTA V (2015) | 133 | 76.1 | 42.1 | 23.2 | 13.2 | 14 |
| The Witcher 3 (2015) | 114 | 50.4 | 28.4 | 16.9 | ||
| Dota 2 Reborn (2015) | 97.5 | 120 | 77.1 | 70.5 | 27.7 | |
| Final Fantasy XV Benchmark (2018) | 51.1 | 23.6 | 16.5 | 12.4 | 5.73 | |
| X-Plane 11.11 (2018) | 76.1 | 48.1 | 65.1 | 29.4 | ||
| Strange Brigade (2018) | 113 | 33.8 | 29.2 | 25.6 | 17.9 | 9.6 |
| F1 2020 (2020) | 100 | 59.8 | 44 | 29.3 |
Rumorosità
| Idle |
| 25.5 / 25.5 / 25.5 dB(A) |
| Sotto carico |
| 35.65 / 35.65 dB(A) |
 | ||
30 dB silenzioso 40 dB(A) udibile 50 dB(A) rumoroso |
||
min: | ||
(±) La temperatura massima sul lato superiore è di 42.8 °C / 109 F, rispetto alla media di 38.2 °C / 101 F, che varia da 22.2 a 69.8 °C per questa classe Workstation.
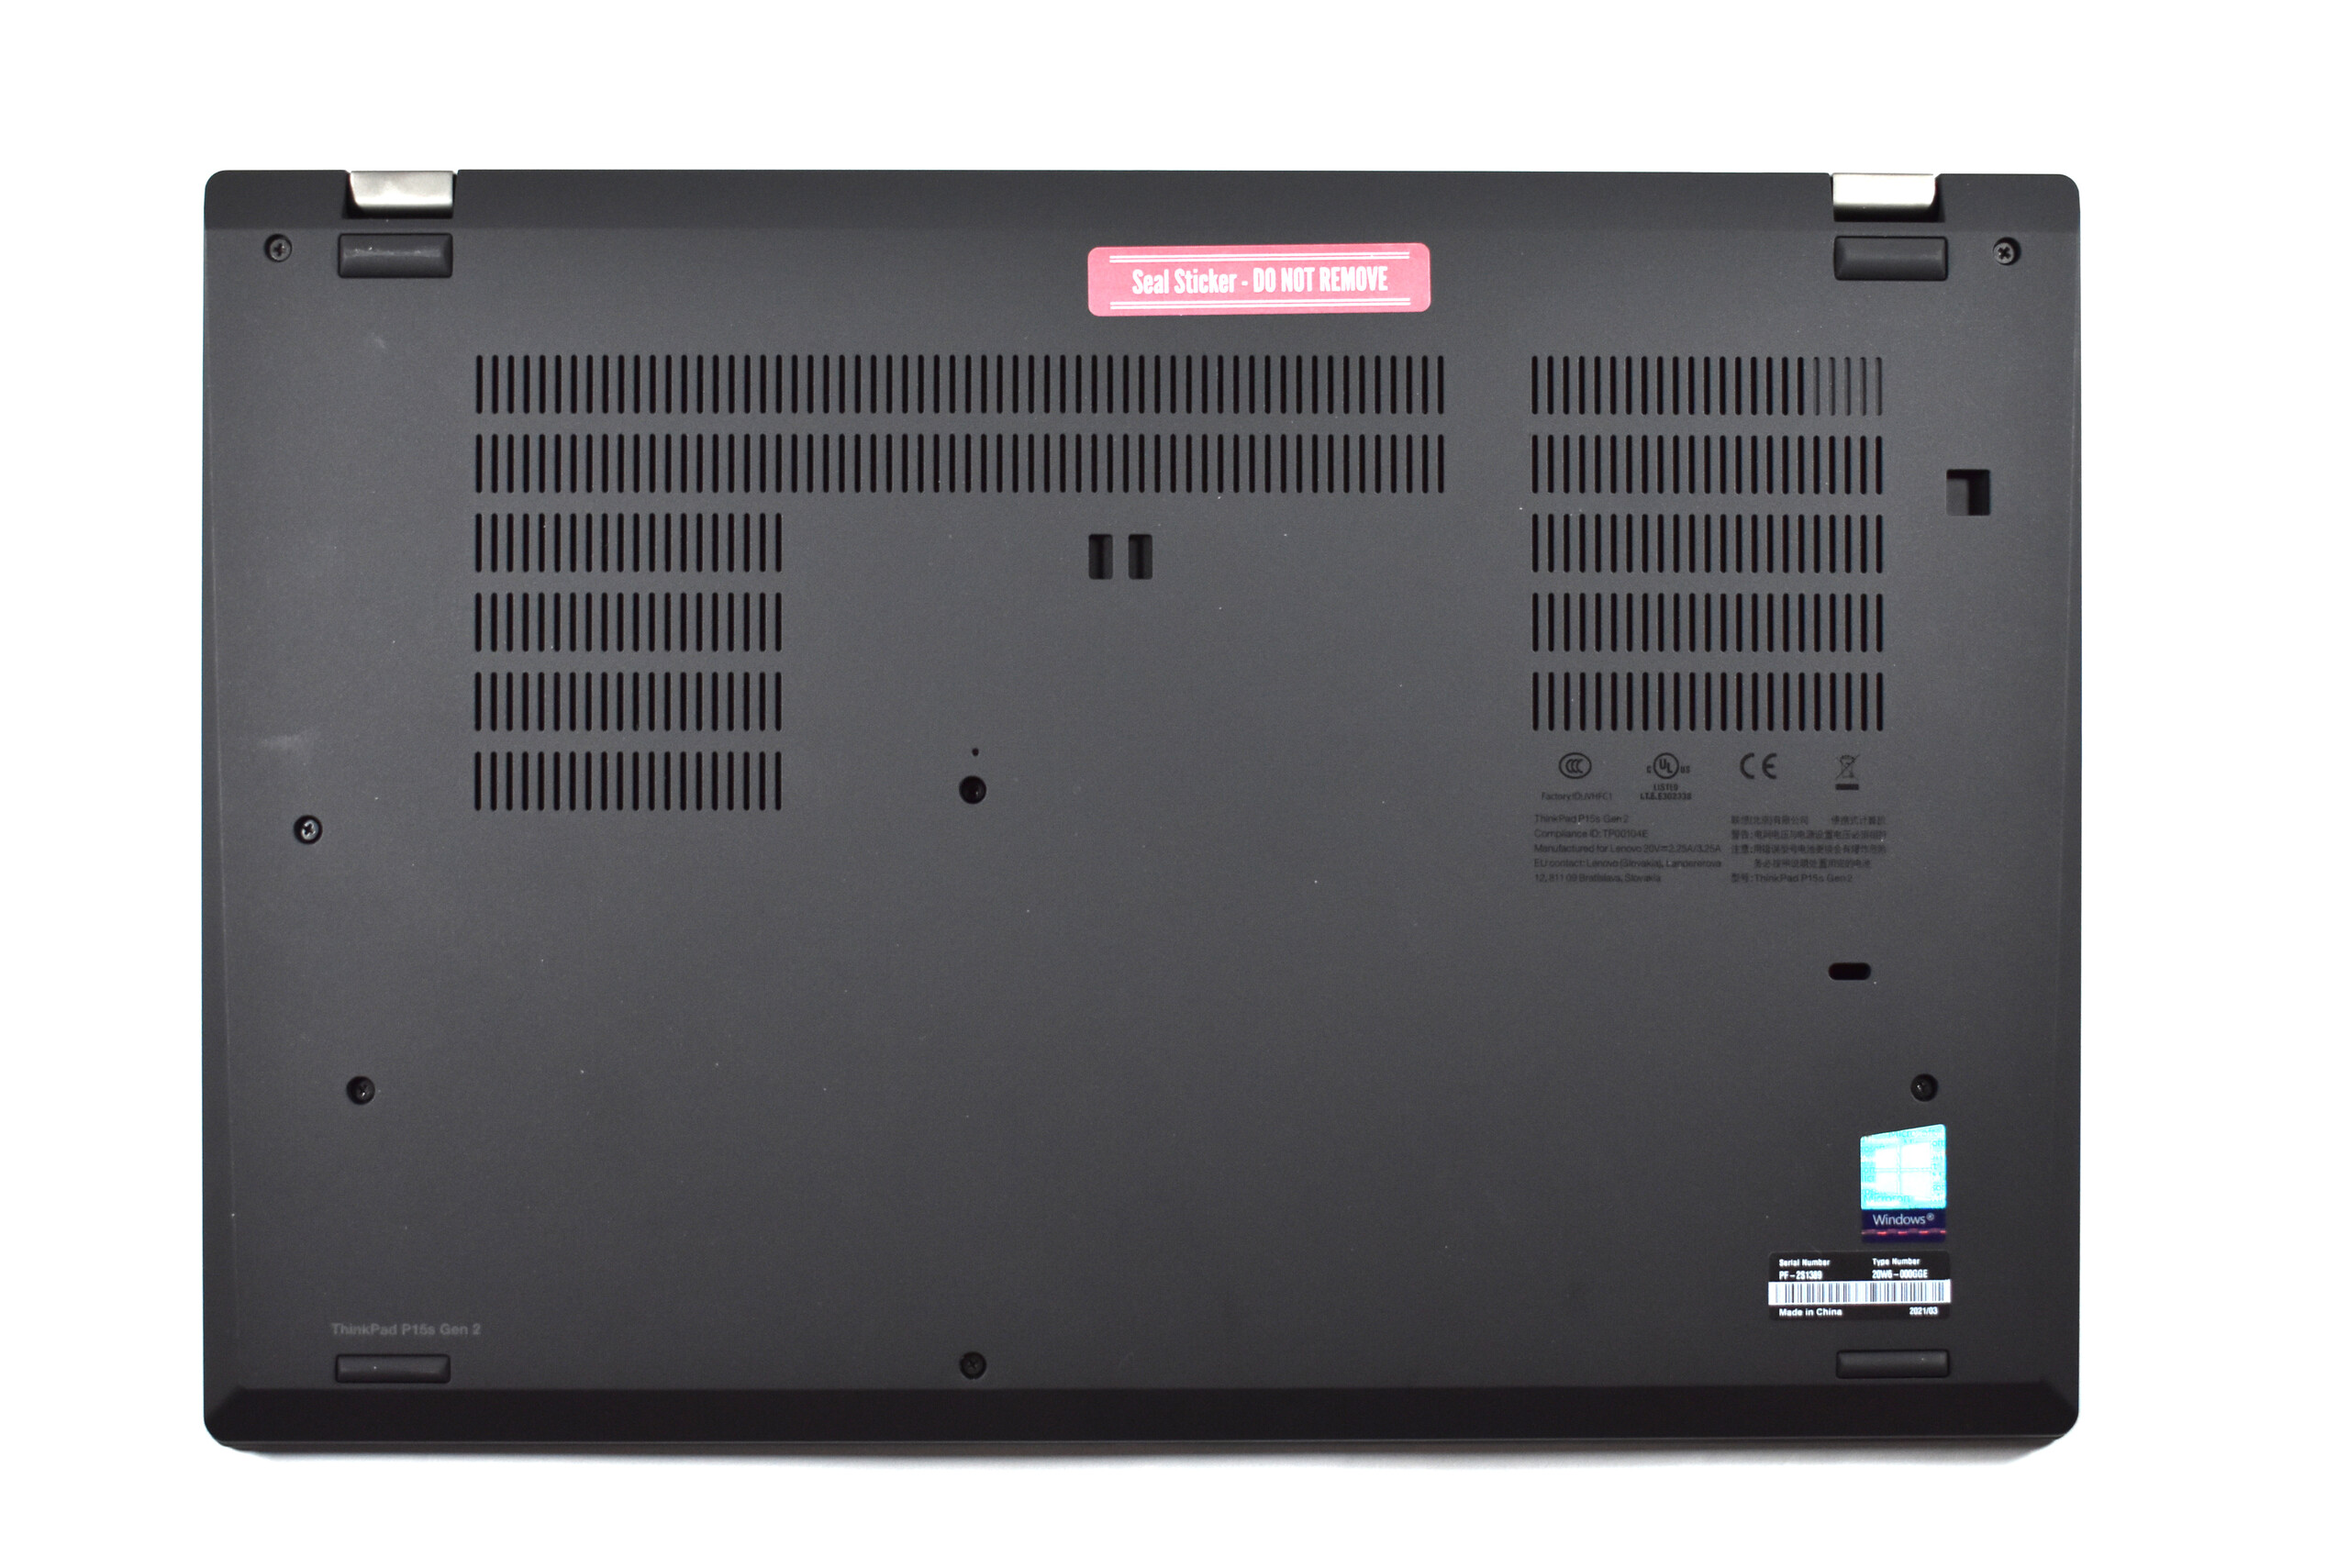
(-) Il lato inferiore si riscalda fino ad un massimo di 59.1 °C / 138 F, rispetto alla media di 41.1 °C / 106 F
(+) In idle, la temperatura media del lato superiore è di 25.5 °C / 78 F, rispetto alla media deld ispositivo di 32 °C / 90 F.
(±) Riproducendo The Witcher 3, la temperatura media per il lato superiore e' di 34 °C / 93 F, rispetto alla media del dispositivo di 32 °C / 90 F.
(+) I poggiapolsi e il touchpad raggiungono la temperatura massima della pelle (32.1 °C / 89.8 F) e quindi non sono caldi.
(-) La temperatura media della zona del palmo della mano di dispositivi simili e'stata di 27.8 °C / 82 F (-4.3 °C / -7.8 F).
Lenovo ThinkPad P15s Gen2-20W6000GGE analisi audio
(±) | potenza degli altiparlanti media ma buona (76.7 dB)
Bassi 100 - 315 Hz
(-) | quasi nessun basso - in media 20.6% inferiori alla media
(±) | la linearità dei bassi è media (14.6% delta rispetto alla precedente frequenza)
Medi 400 - 2000 Hz
(±) | medi elevati - circa 5% superiore alla media
(+) | medi lineari (6.9% delta rispetto alla precedente frequenza)
Alti 2 - 16 kHz
(+) | Alti bilanciati - appena 3.1% dalla media
(+) | alti lineari (5.5% delta rispetto alla precedente frequenza)
Nel complesso 100 - 16.000 Hz
(±) | la linearità complessiva del suono è media (20.1% di differenza rispetto alla media
Rispetto alla stessa classe
» 71% di tutti i dispositivi testati in questa classe è stato migliore, 6% simile, 23% peggiore
» Il migliore ha avuto un delta di 7%, medio di 17%, peggiore di 35%
Rispetto a tutti i dispositivi testati
» 52% di tutti i dispositivi testati in questa classe è stato migliore, 8% similare, 40% peggiore
» Il migliore ha avuto un delta di 4%, medio di 23%, peggiore di 134%
HP ZBook Firefly 15 G8 2C9R7EA analisi audio
(±) | potenza degli altiparlanti media ma buona (79.1 dB)
Bassi 100 - 315 Hz
(-) | quasi nessun basso - in media 18% inferiori alla media
(±) | la linearità dei bassi è media (11.3% delta rispetto alla precedente frequenza)
Medi 400 - 2000 Hz
(+) | medi bilanciati - solo only 3% rispetto alla media
(+) | medi lineari (4.1% delta rispetto alla precedente frequenza)
Alti 2 - 16 kHz
(+) | Alti bilanciati - appena 3.3% dalla media
(+) | alti lineari (5.6% delta rispetto alla precedente frequenza)
Nel complesso 100 - 16.000 Hz
(±) | la linearità complessiva del suono è media (16.2% di differenza rispetto alla media
Rispetto alla stessa classe
» 43% di tutti i dispositivi testati in questa classe è stato migliore, 7% simile, 50% peggiore
» Il migliore ha avuto un delta di 7%, medio di 17%, peggiore di 35%
Rispetto a tutti i dispositivi testati
» 26% di tutti i dispositivi testati in questa classe è stato migliore, 6% similare, 68% peggiore
» Il migliore ha avuto un delta di 4%, medio di 23%, peggiore di 134%
| Off / Standby | |
| Idle | |
| Sotto carico |
|
Leggenda:
min: | |
Pro
Contro
Valutazione complessiva: Il ThinkPad P15s G2 è utile per alcune particolari aree di applicazione
L'evoluzione della "workstation ultrabook" di Lenovo continua. Quello che una volta è iniziato con il ThinkPad W550s come un portatile dalla potenza molto limitata è a questo punto abbastanza potente per le applicazioni workstation. Tuttavia, non ci si può ancora aspettare prestazioni al top nemmeno con l'Intel Tiger Lake e la Nvidia Turing.
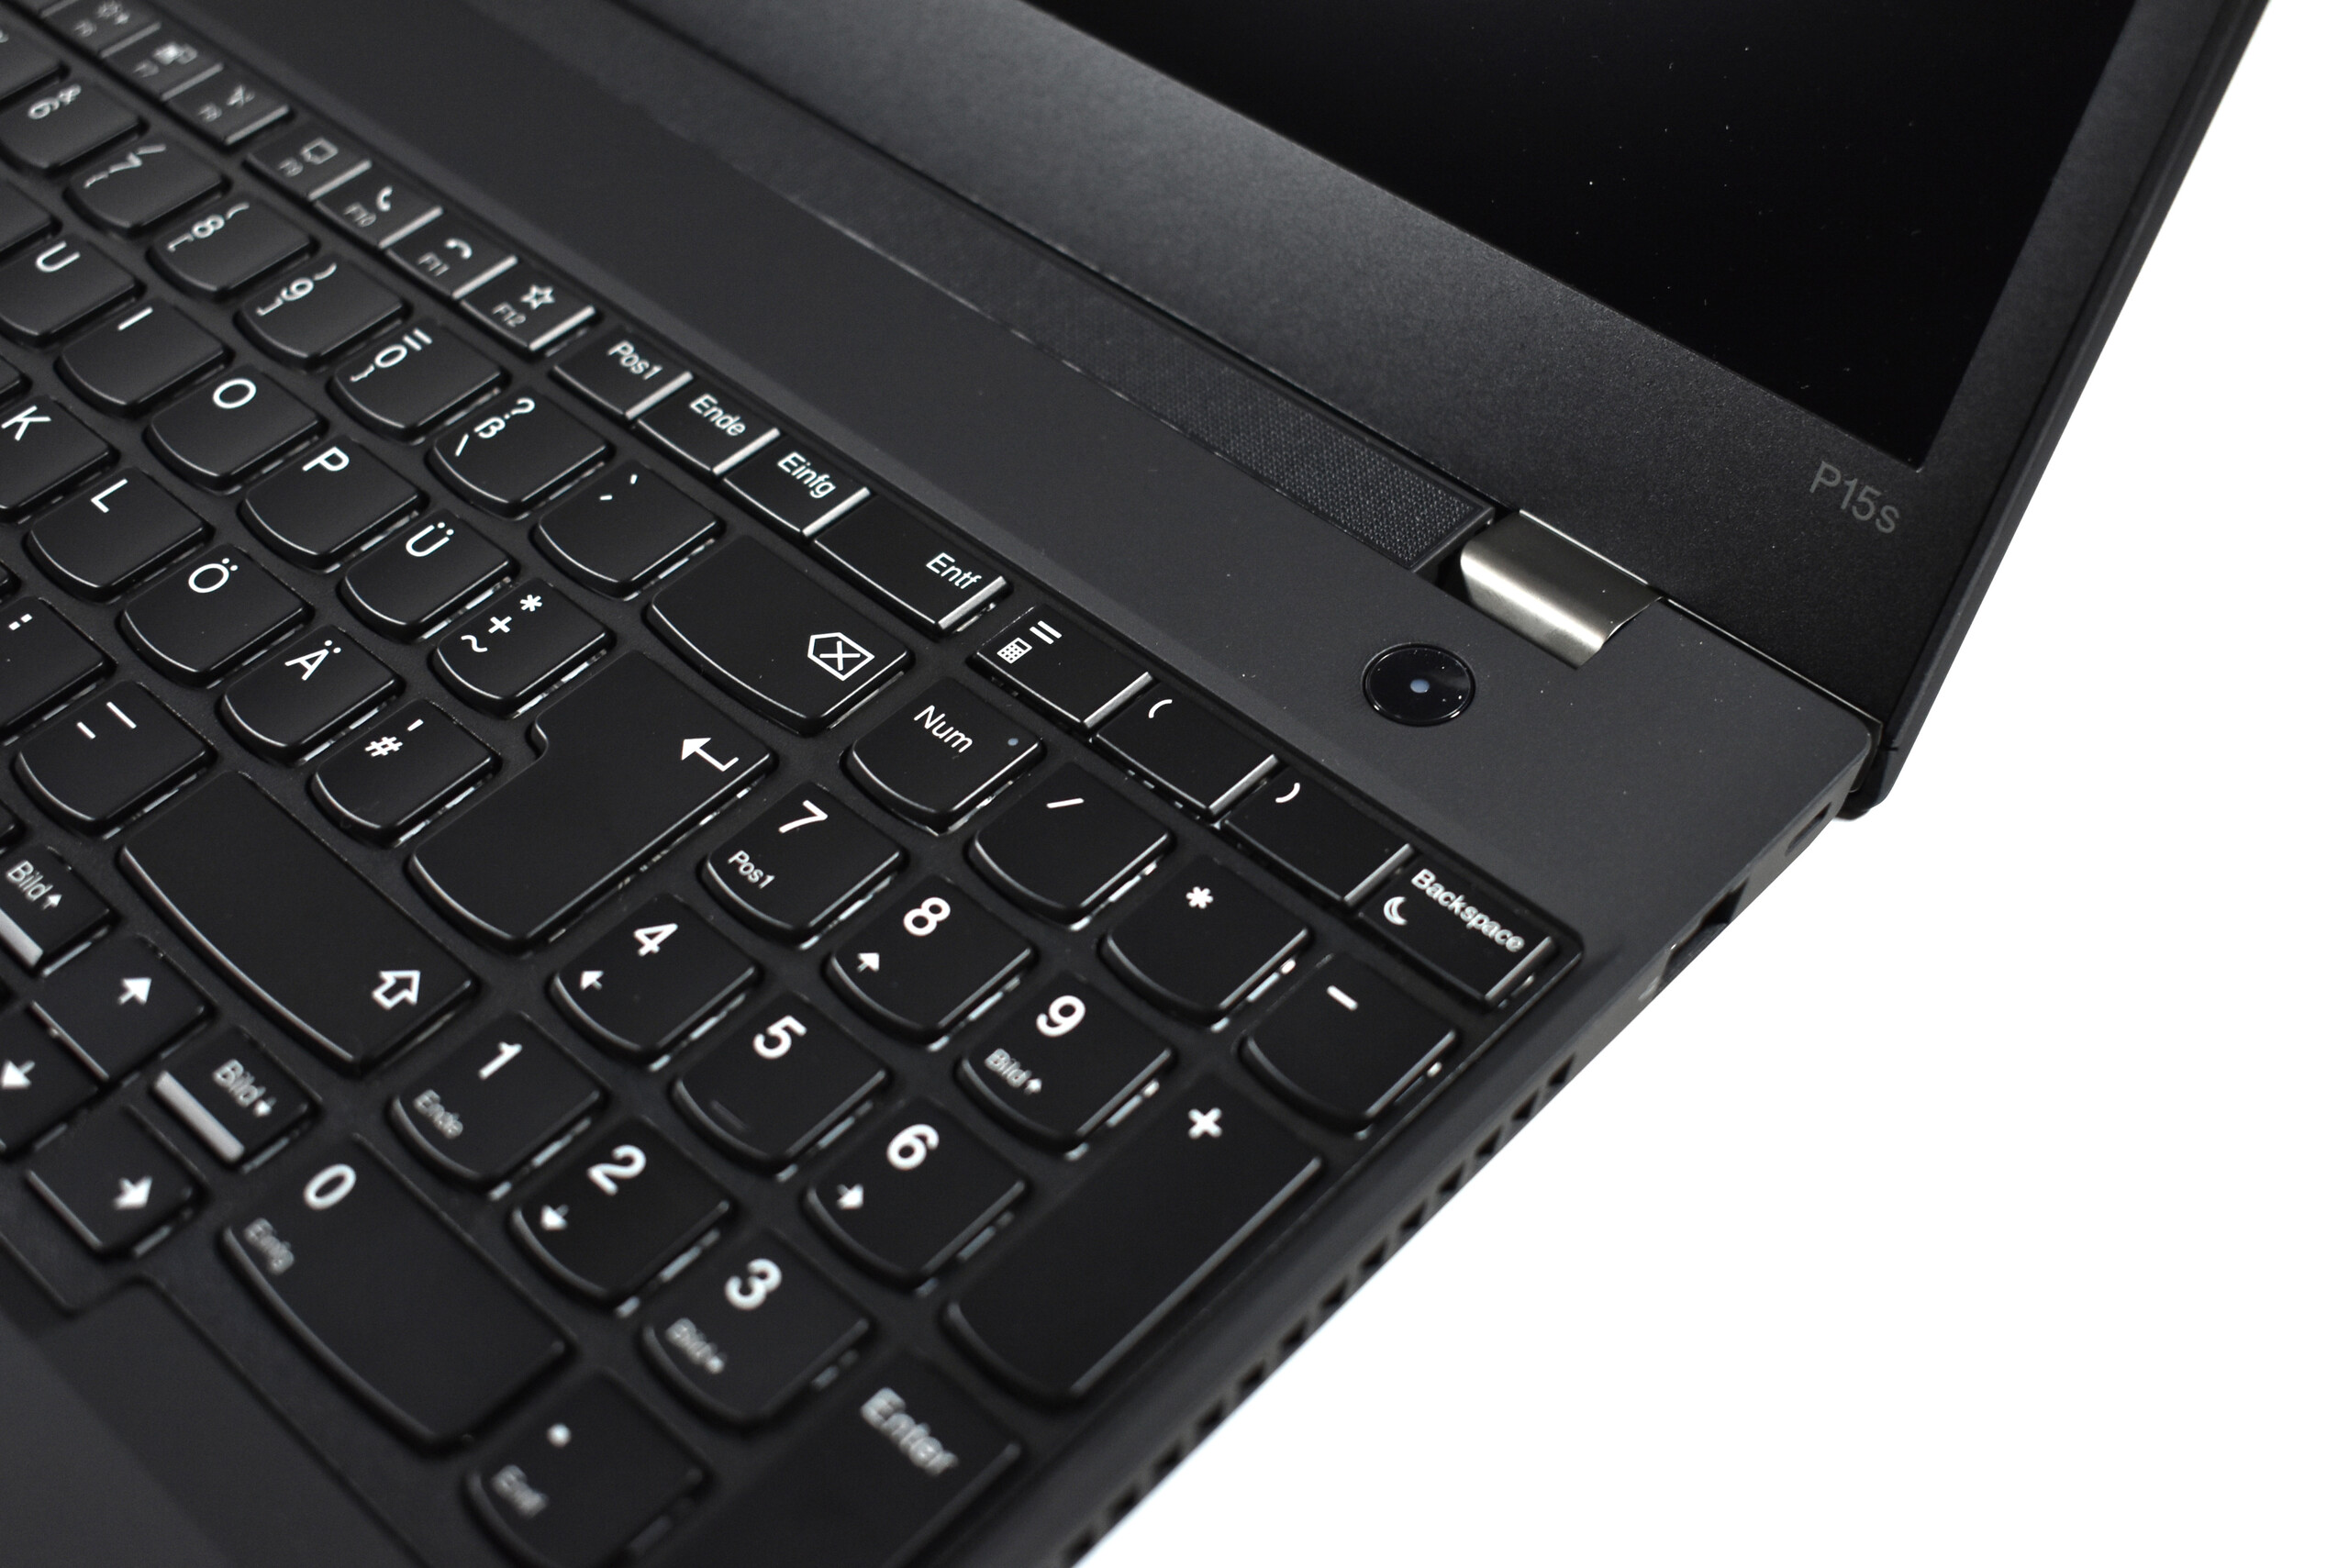
Poiché Lenovo usa ancora il case del ThinkPad T15 Gen 2, il ThinkPad P15s continua a mancare di alcune funzionalità che ci si dovrebbe davvero aspettare da una workstation. Queste includono un lettore di schede SD full-size, e ci manca anche un secondo slot M.2-2280. Inoltre, il raffreddamento non è molto potente, e le temperature del case sono particolarmente elevate nella parte inferiore. Anche se la ventola funziona più silenziosamente con l'ultimo aggiornamento del BIOS, non si ferma mai al termine dello stress test.
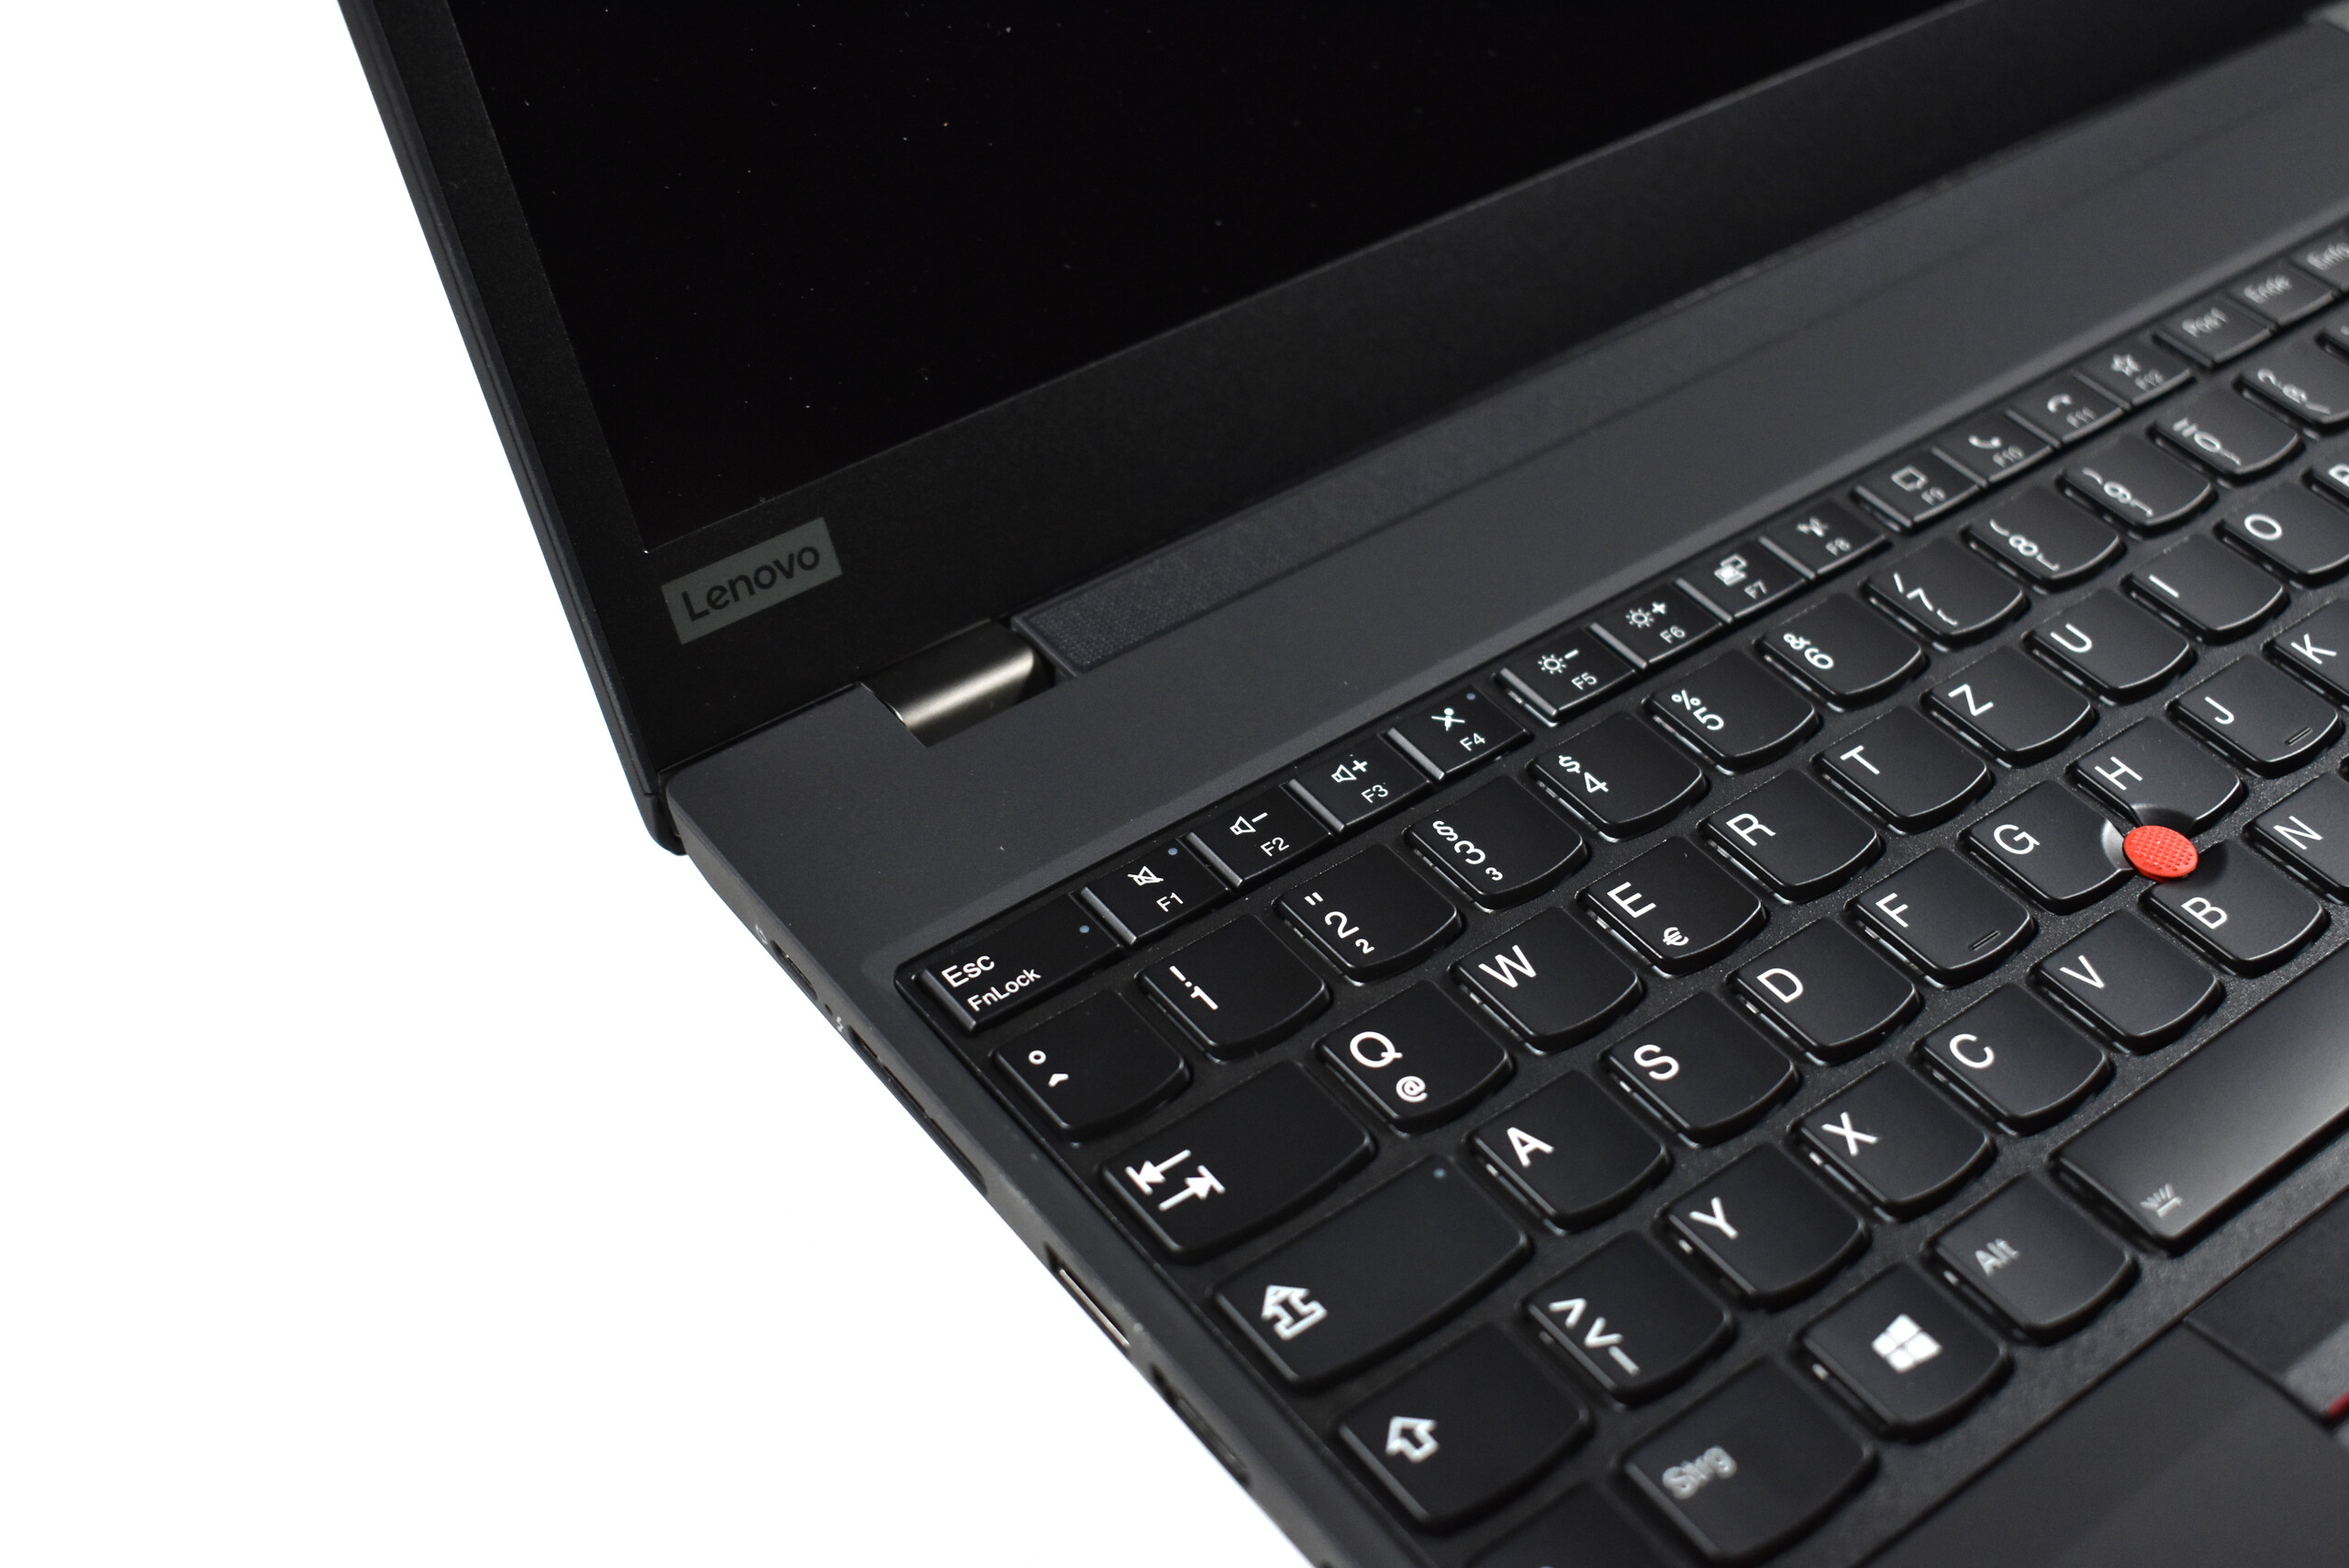
Possiamo raccomandare il ThinkPad P15s Gen 2 agli utenti che hanno bisogno di un LCD estremamente buono, un'ottima tastiera e una GPU certificata ISV.
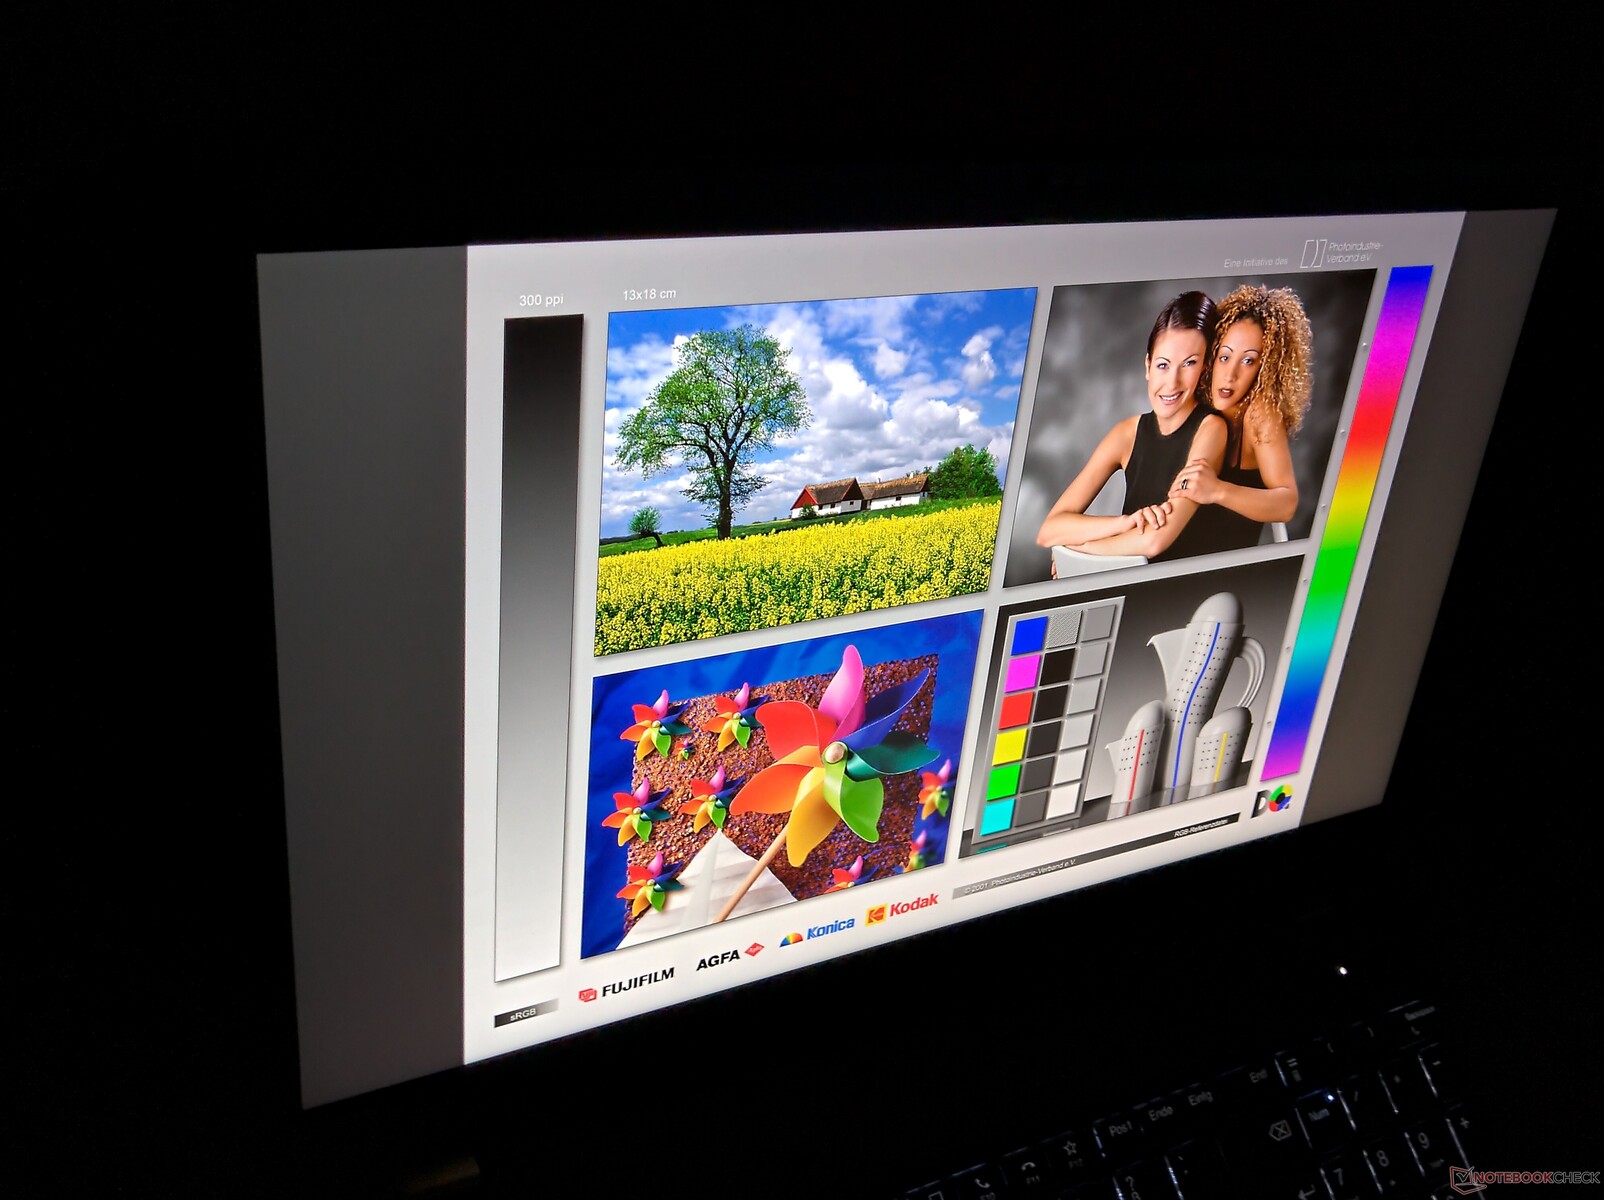
Lenovo dovrebbe davvero risolvere questo bug, poiché ci sono per il resto molte cose che ci piacciono del portatile Lenovo. Queste includono il display 4K UHD estremamente luminoso che produce colori vibranti, la comoda tastiera con una corsa di 1,8 mm, e la buona dotazione complessiva. Tuttavia, non stiamo dando una raccomandazione generale per il ThinkPad P15s G2, poiché l'identico ThinkPad T15 Gen 2 è l'alternativa più logica nella maggior parte dei casi. Ma per quegli utenti che hanno bisogno della GPU certificata ISV, può essere una buona selezione.
Lenovo ThinkPad P15s Gen2-20W6000GGE
- 06/14/2021 v7 (old)
Benjamin Herzig
Price comparison
