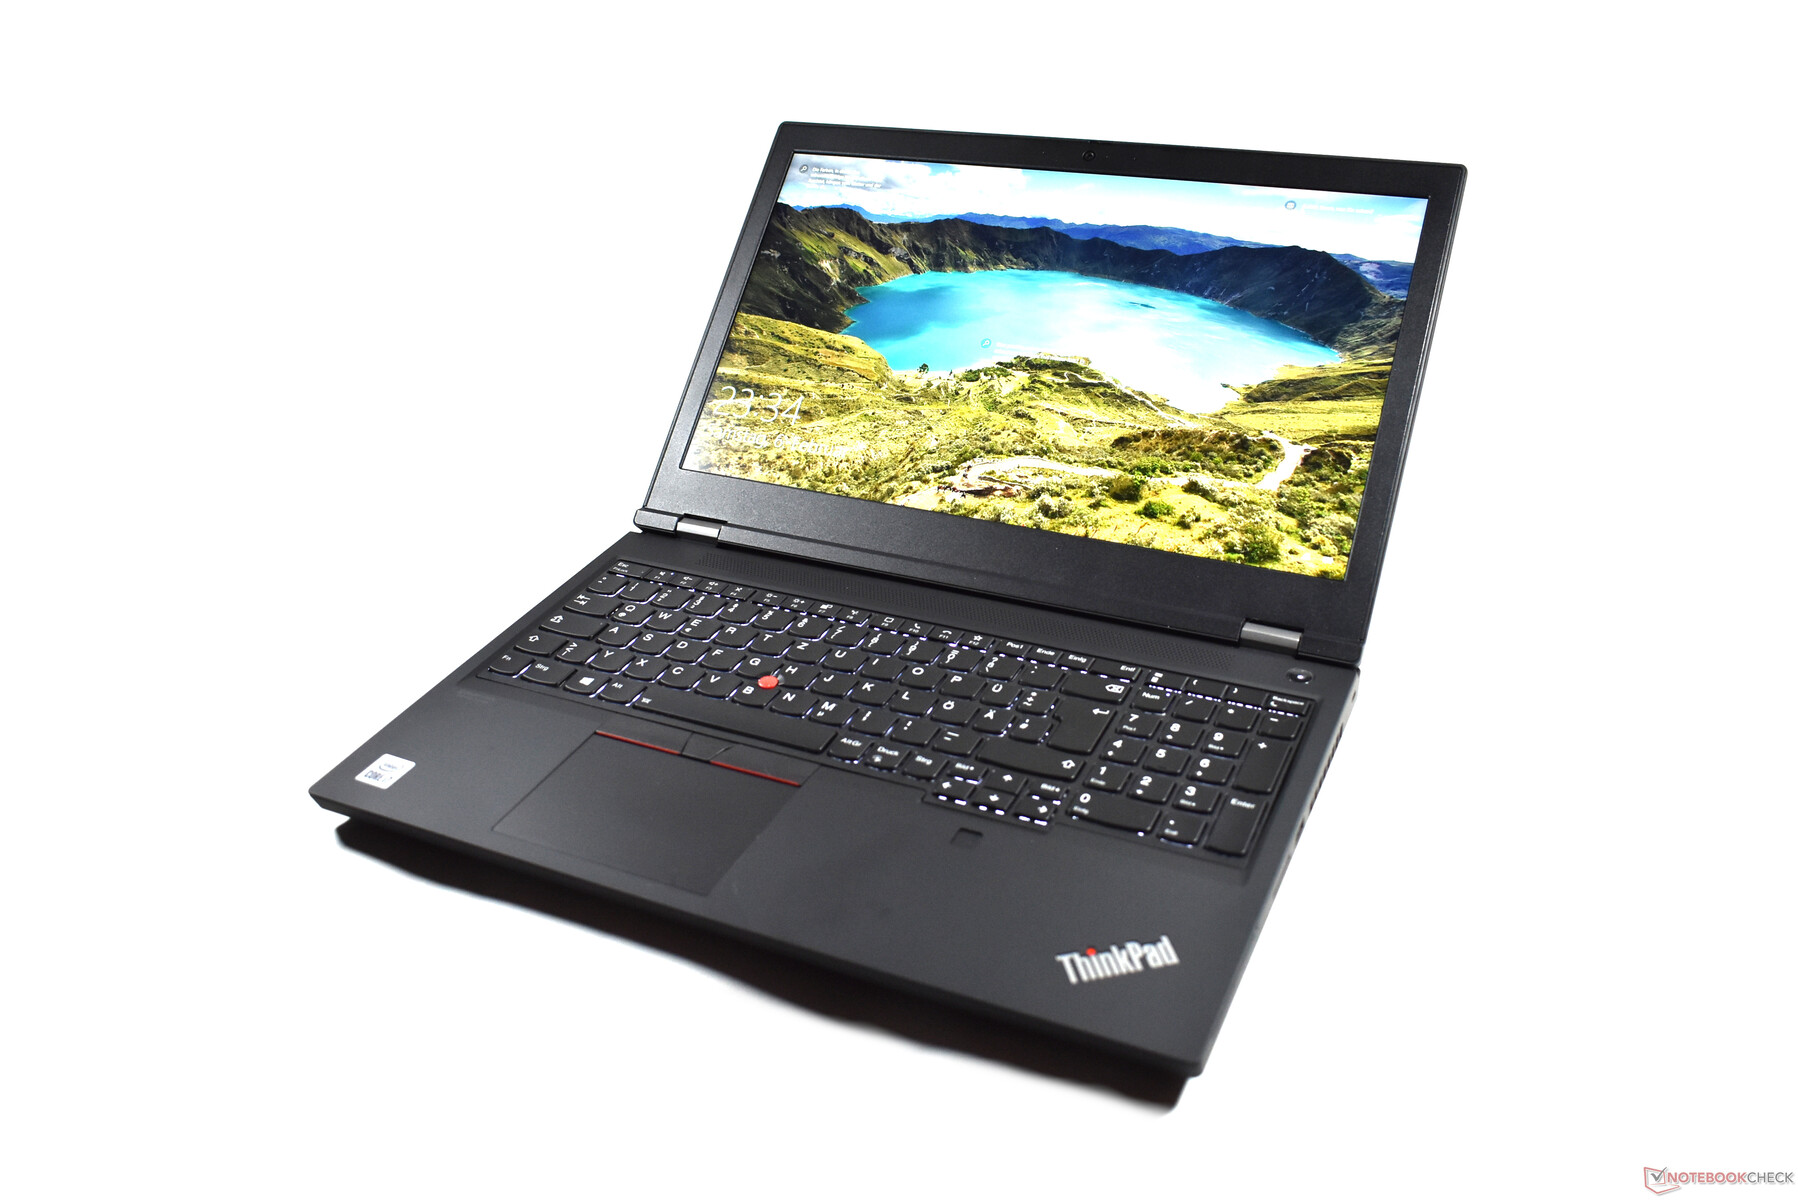
Recensione del portatile Lenovo ThinkPad P15 Gen 1: Workstation mobile con un punto debole nella tastiera
Quando Lenovo ha introdotto il ThinkPad P50 sul mercato nel 2015, era il primo modello della nuova serie ThinkPad P, che avrebbe dovuto formare il ramo workstation al posto della serie W. Da allora, Lenovo ha ampliato la serie, ma le workstation classiche rappresentano ancora il nucleo del portafoglio workstations. Il modello da 15 pollici dell'anno scorso di questo ramo si chiamava Lenovo ThinkPad P53. L'attuale successore non si chiama ThinkPad P54 ma LenovoThinkPad P15 Gen 1, seguendo il nuovo schema di denominazione ThinkPad.
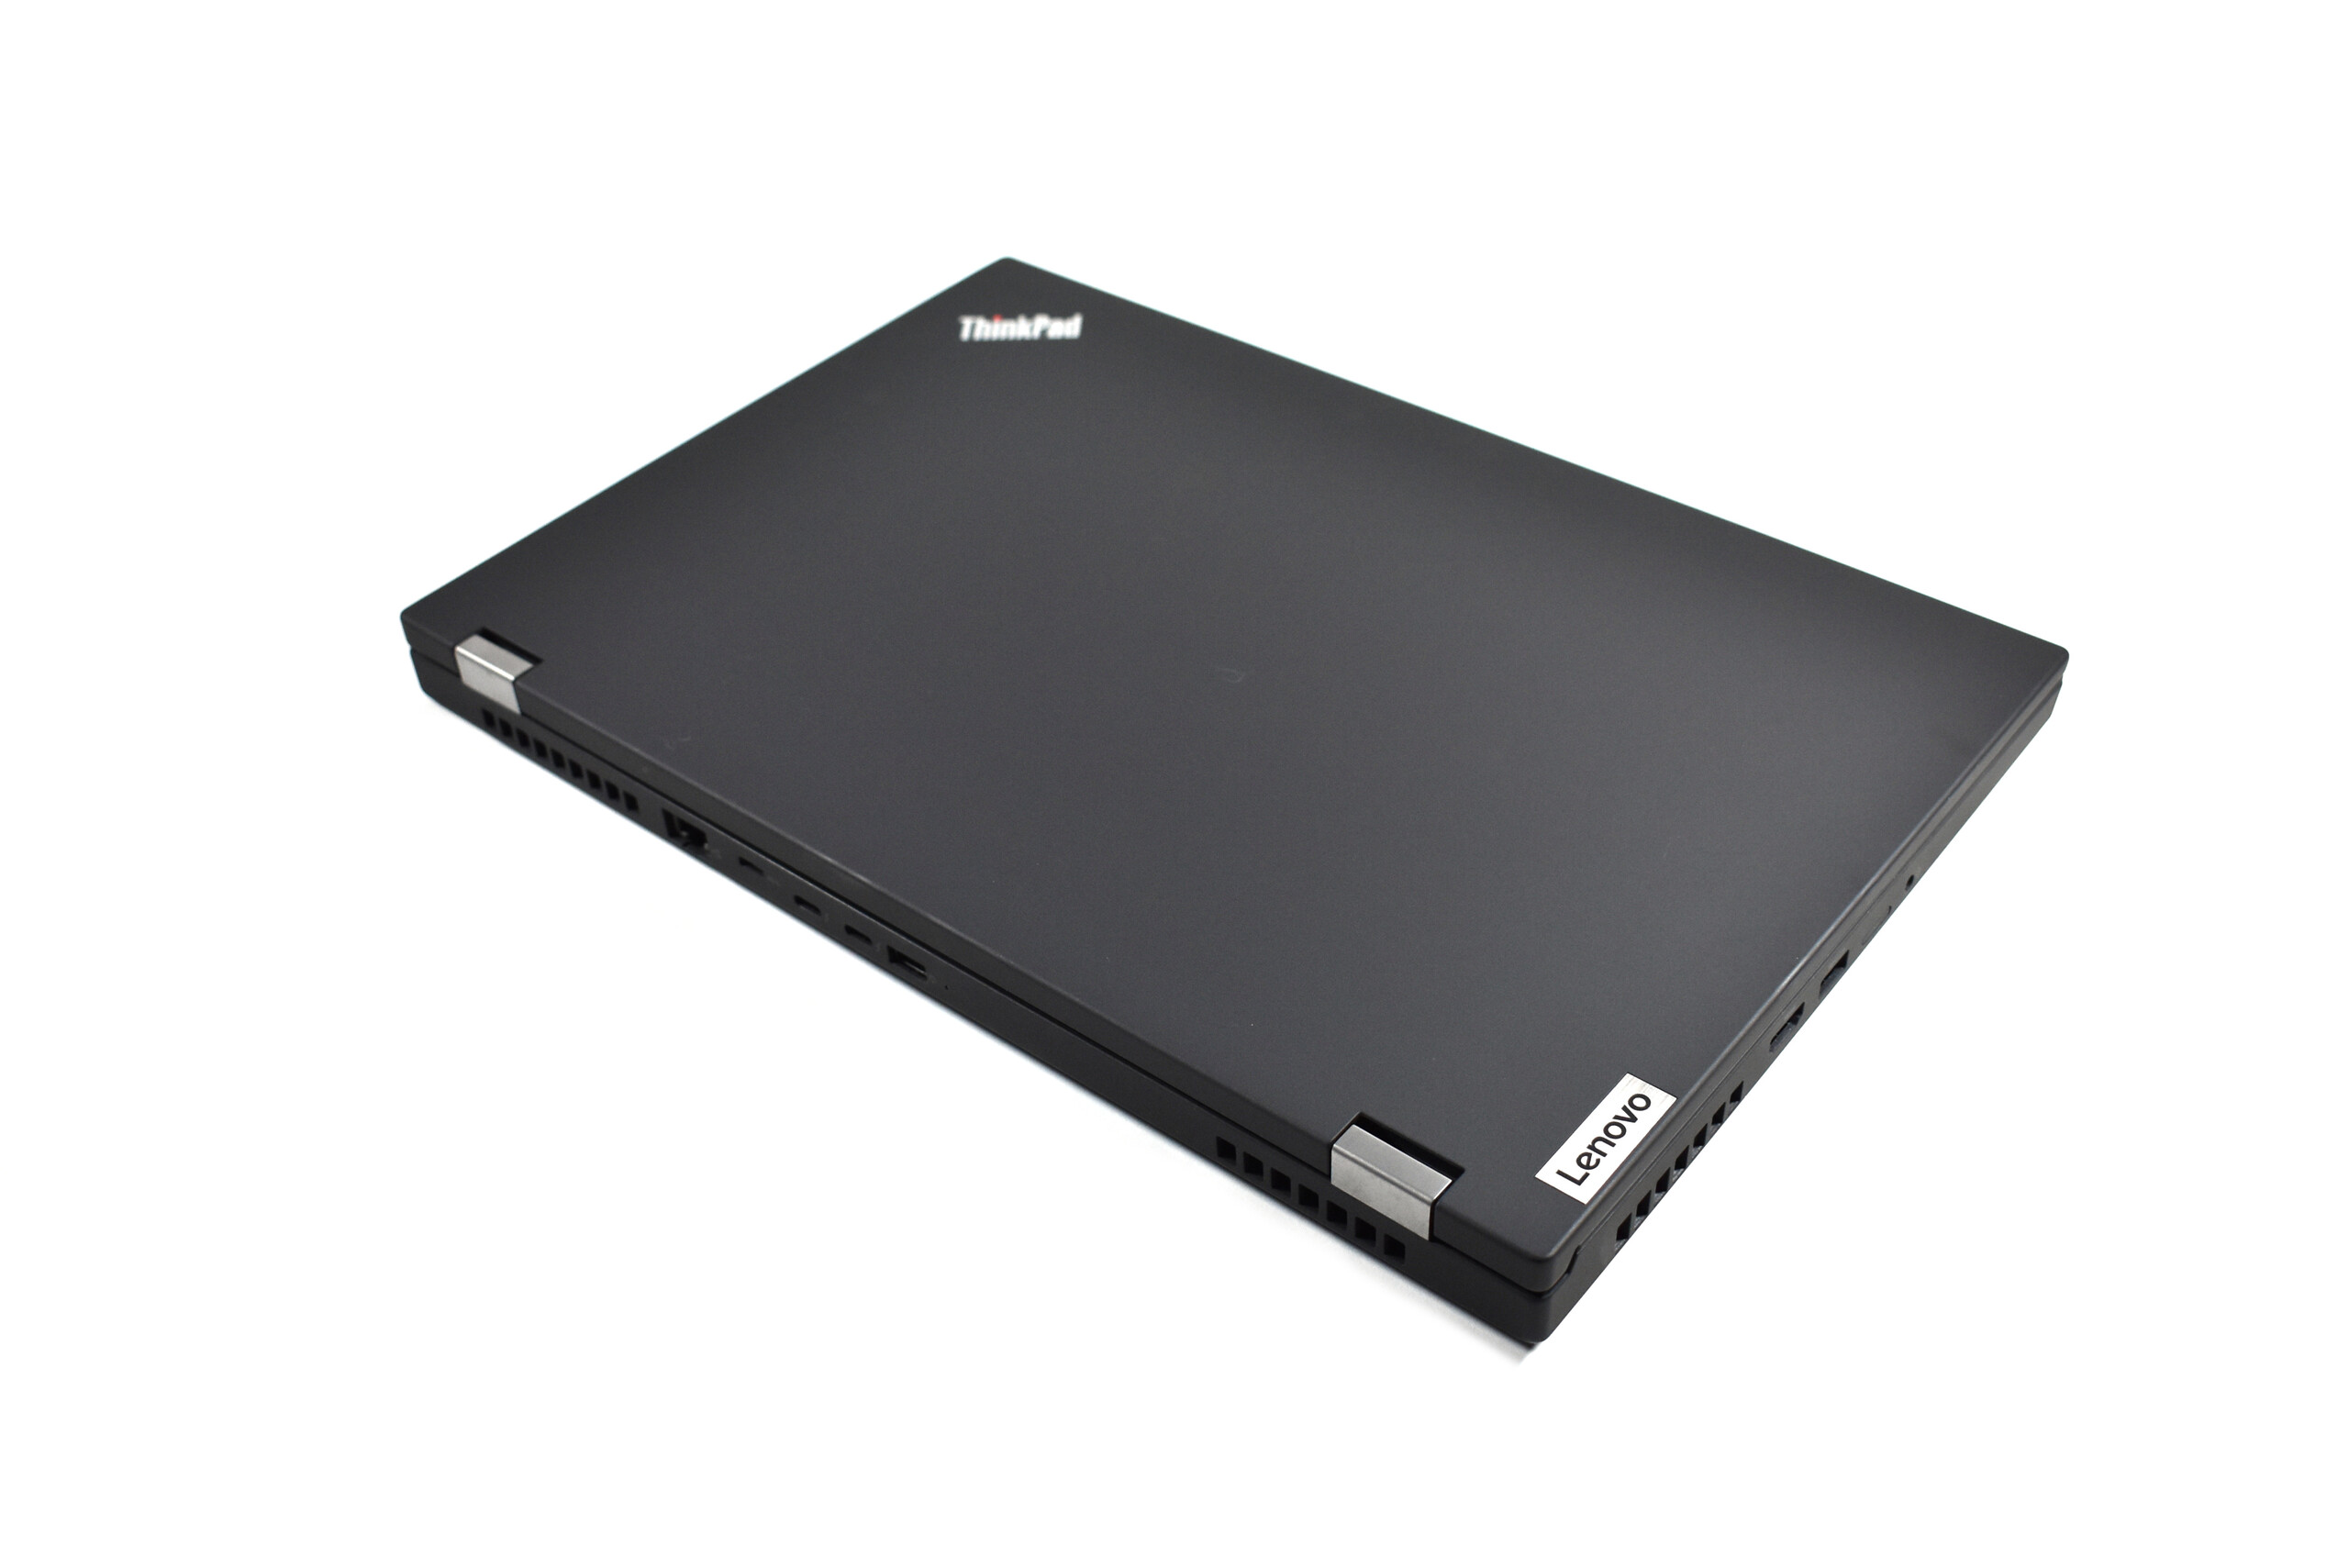
Lenovo non solo introduce un nuovo schema di denominazione con il ThinkPad P15, ma anche un nuovo design del case. Ma poiché condivide la stessa struttura con il Lenovo ThinkPad T15g Gen 1, non riferiremo qui sugli aspetti del design, delle caratteristiche e dei dispositivi di input in dettaglio. Potete trovare maggiori informazioni su queste aree nella nostra recensione del ThinkPad T15g.
Confronto con i potenziali concorrenti
Punteggio | Data | Modello | Peso | Altezza | Dimensione | Risoluzione | Prezzo |
|---|---|---|---|---|---|---|---|
| 85.6 % v7 (old) | 03/2021 | Lenovo ThinkPad P15 Gen1-20ST000DGE i7-10750H, Quadro T1000 (Laptop) | 2.7 kg | 31.45 mm | 15.60" | 1920x1080 | |
| 89.8 % v7 (old) | 11/2019 | Lenovo ThinkPad P53-20QN000YGE i7-9850H, Quadro RTX 5000 Max-Q | 2.7 kg | 29.4 mm | 15.60" | 1920x1080 | |
| 86.3 % v7 (old) | 03/2021 | Lenovo ThinkPad T15g-20UR000GGE i7-10750H, GeForce RTX 2070 Super Max-Q | 2.8 kg | 31.45 mm | 15.60" | 1920x1080 | |
| 86.6 % v7 (old) | 02/2021 | Lenovo ThinkPad T15p-20TN0006GE i7-10750H, GeForce GTX 1050 Mobile | 2.2 kg | 22.7 mm | 15.60" | 3840x2160 | |
| 87.8 % v7 (old) | 09/2020 | Dell Precision 7550 W-10885M, Quadro RTX 5000 Max-Q | 2.8 kg | 27.36 mm | 15.60" | 3840x2160 | |
| 90.2 % v7 (old) | 01/2021 | HP ZBook Fury 15 G7 W-10885M, Quadro RTX 5000 Max-Q | 2.4 kg | 25.9 mm | 15.60" | 3840x2160 |
I cambiamenti più importanti dal Lenovo ThinkPad P53
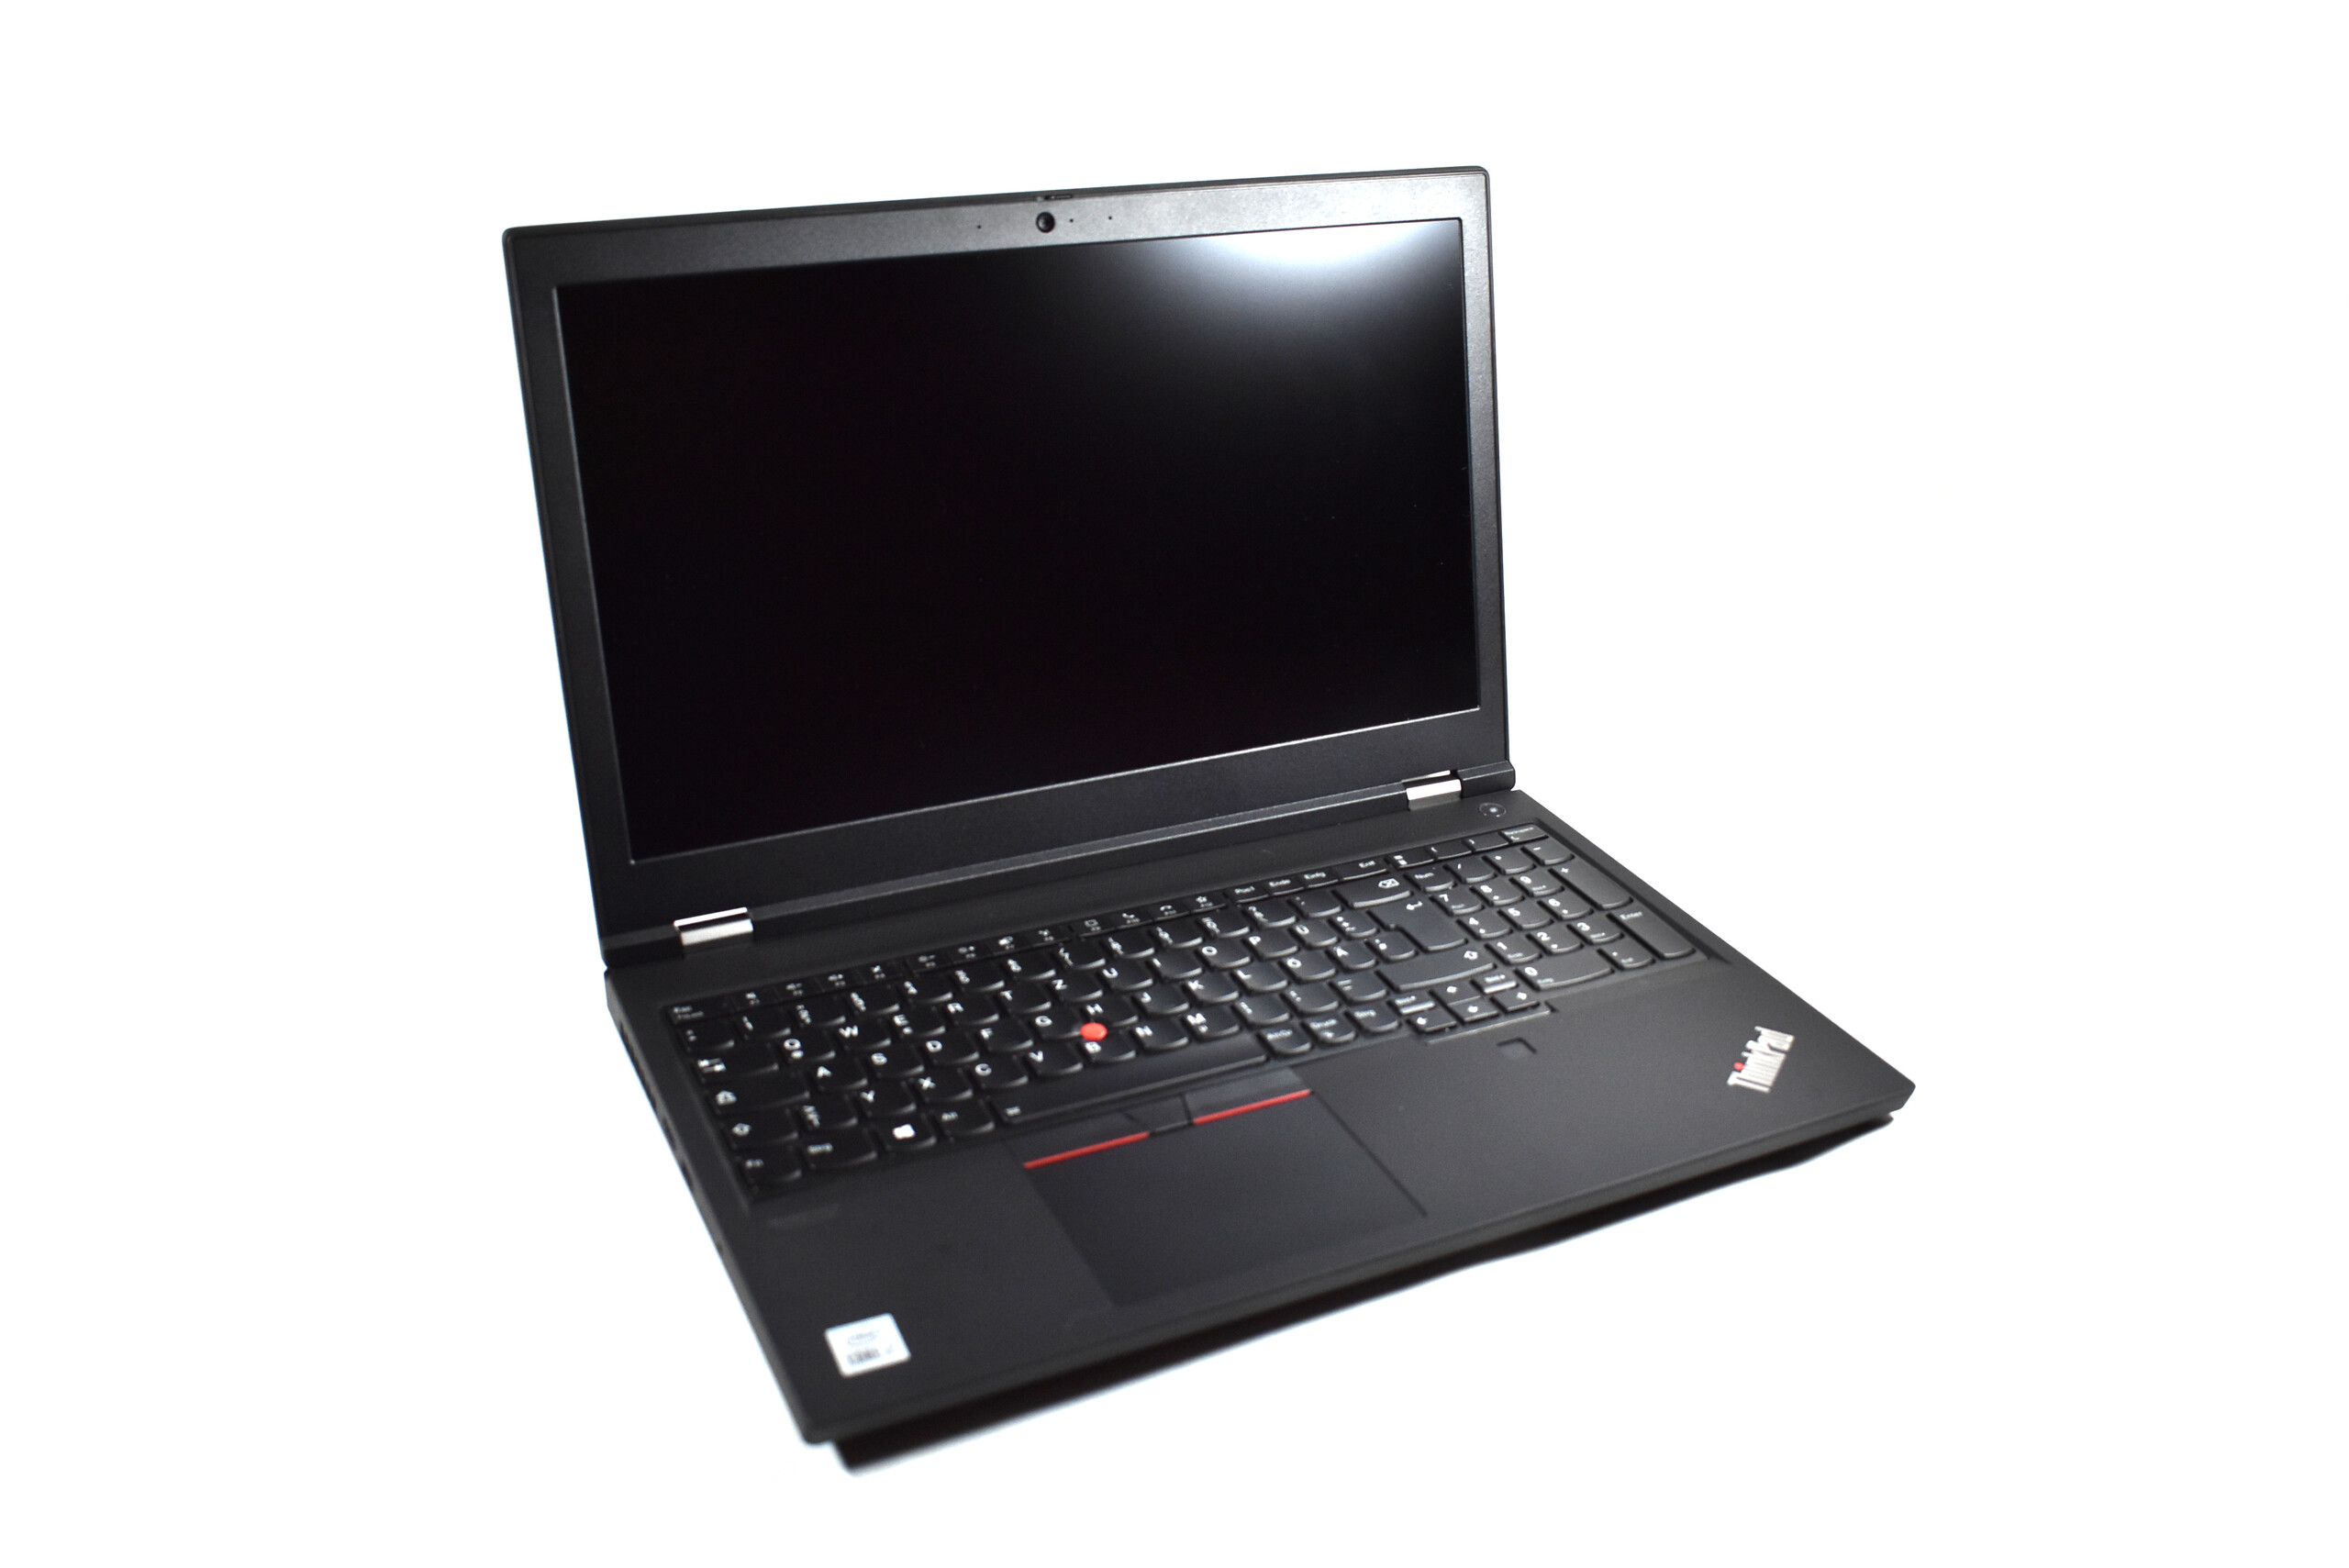
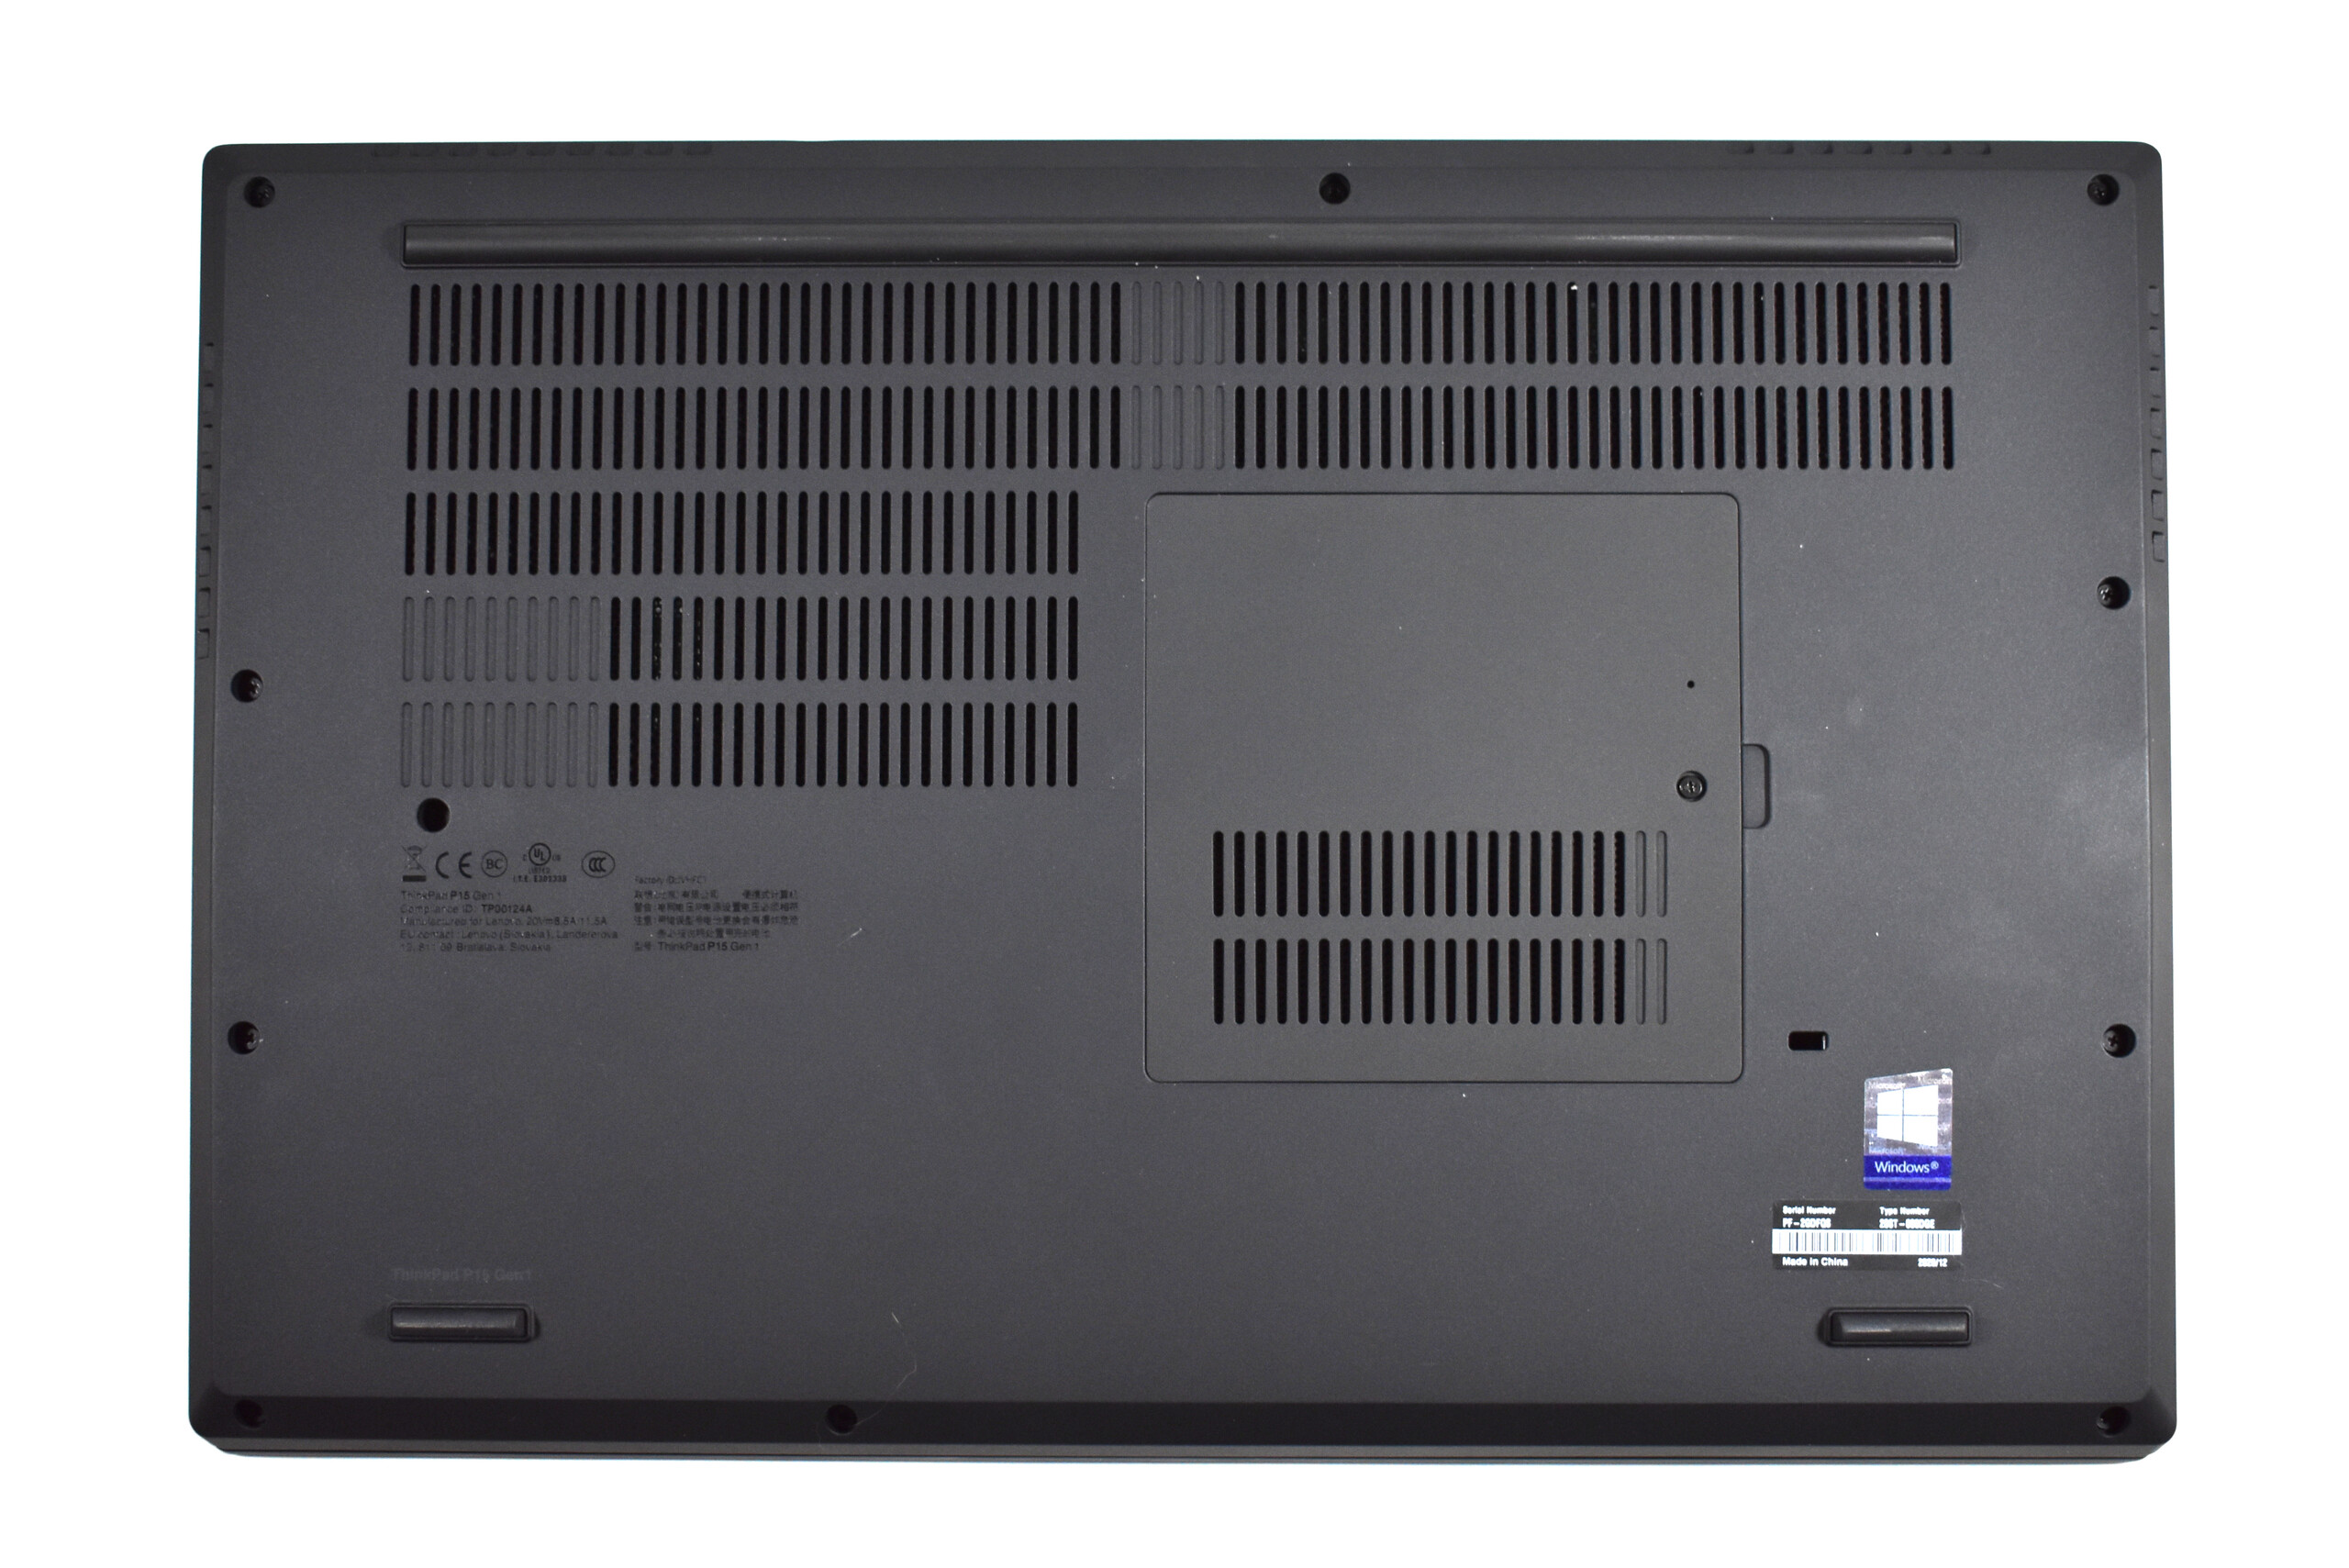
Esternamente, il Lenovo ThinkPad P15 Gen 1 sembra molto simile al suo predecessore. Tuttavia, sotto il cofano e nel case nero, molte cose sono cambiate rispetto al ThinkPad P53. Ad eccezione del telaio in magnesio all'interno, il case del ThinkPad P15 è ora completamente fatto di plastica in fibra di vetro, mentre il fondo del case era ancora fatto di una lega di magnesio-alluminio nel P53. Mentre la stabilità generale non ne risente, la sensazione al tatto in un certo senso sì, dato che si può sentire la differenza tra metallo e plastica.
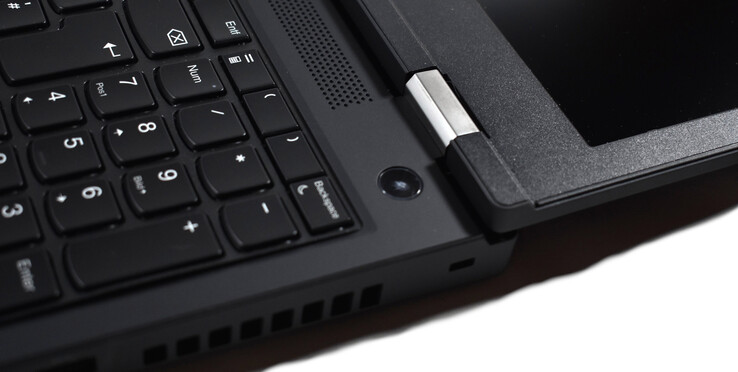
Sorprendentemente, Lenovo fa un grosso errore in termini di lavorazione: Come nel ThinkPad T15g, la tastiera ha qualche evidente cedimento nell'angolo inferiore sinistro. Inoltre, non tutti i cambiamenti nel design sono positivi: i due LED di stato sotto il display sono stati rimossi, proprio come i tasti dedicati del touchpad.
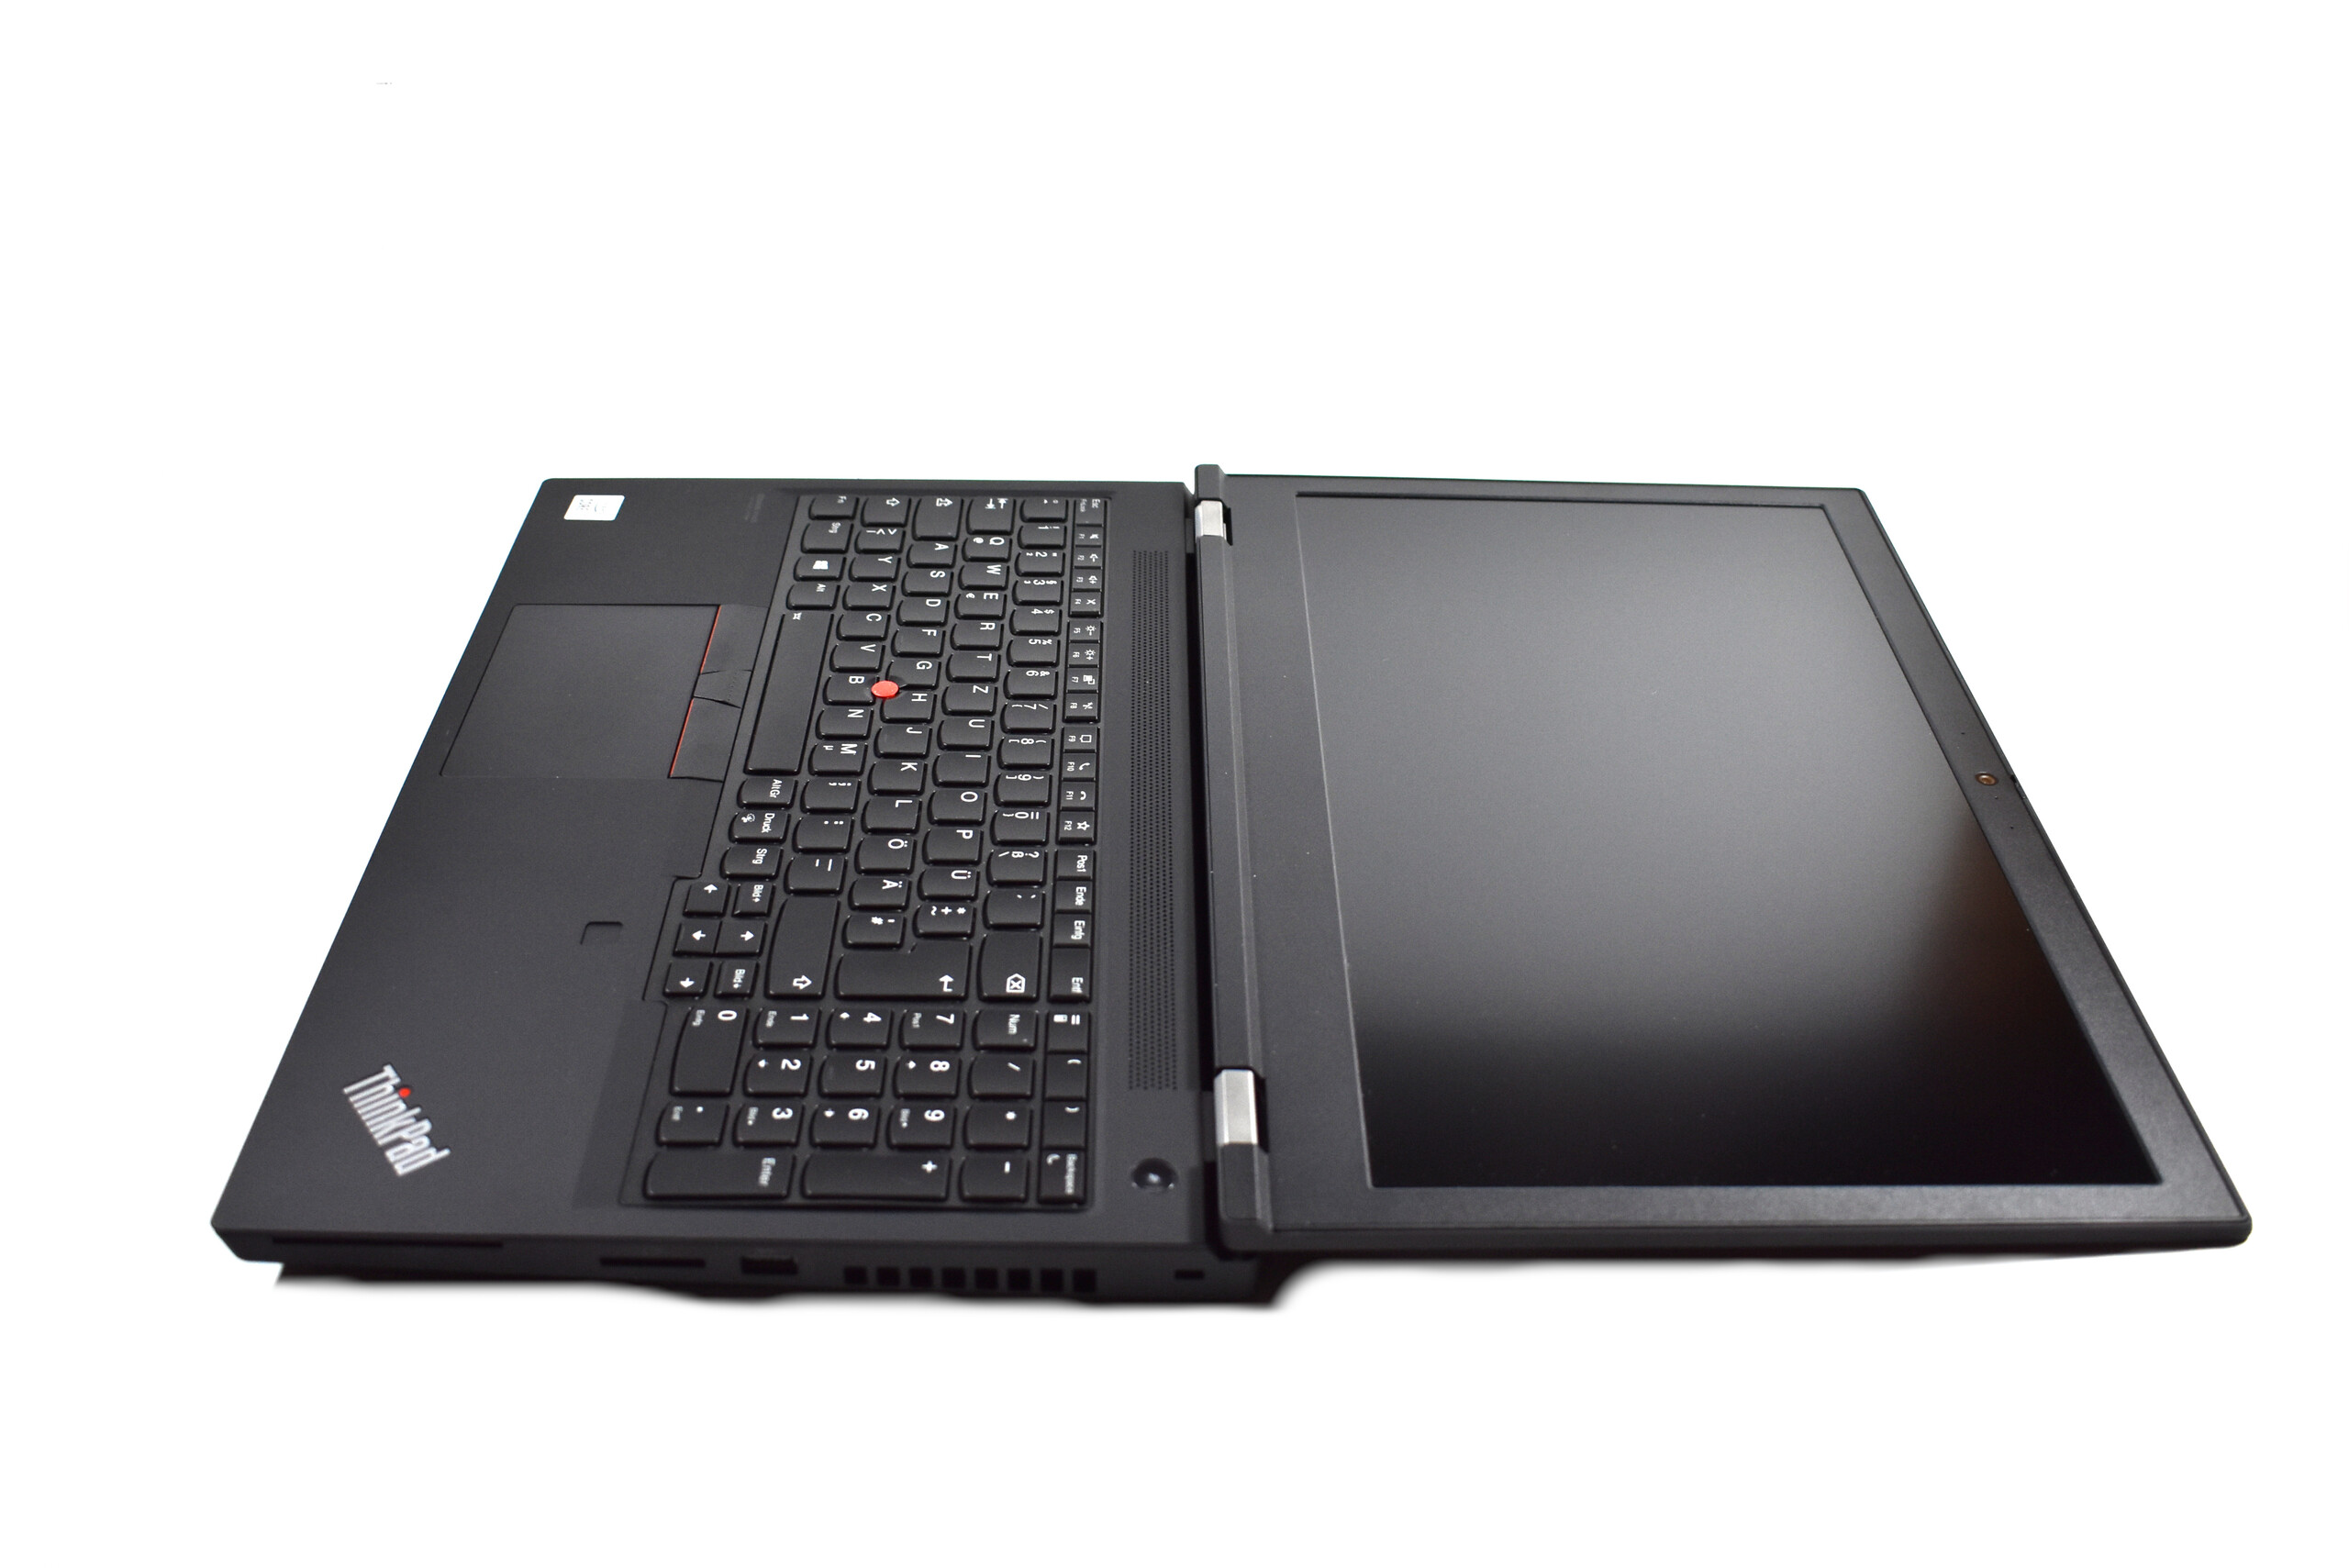
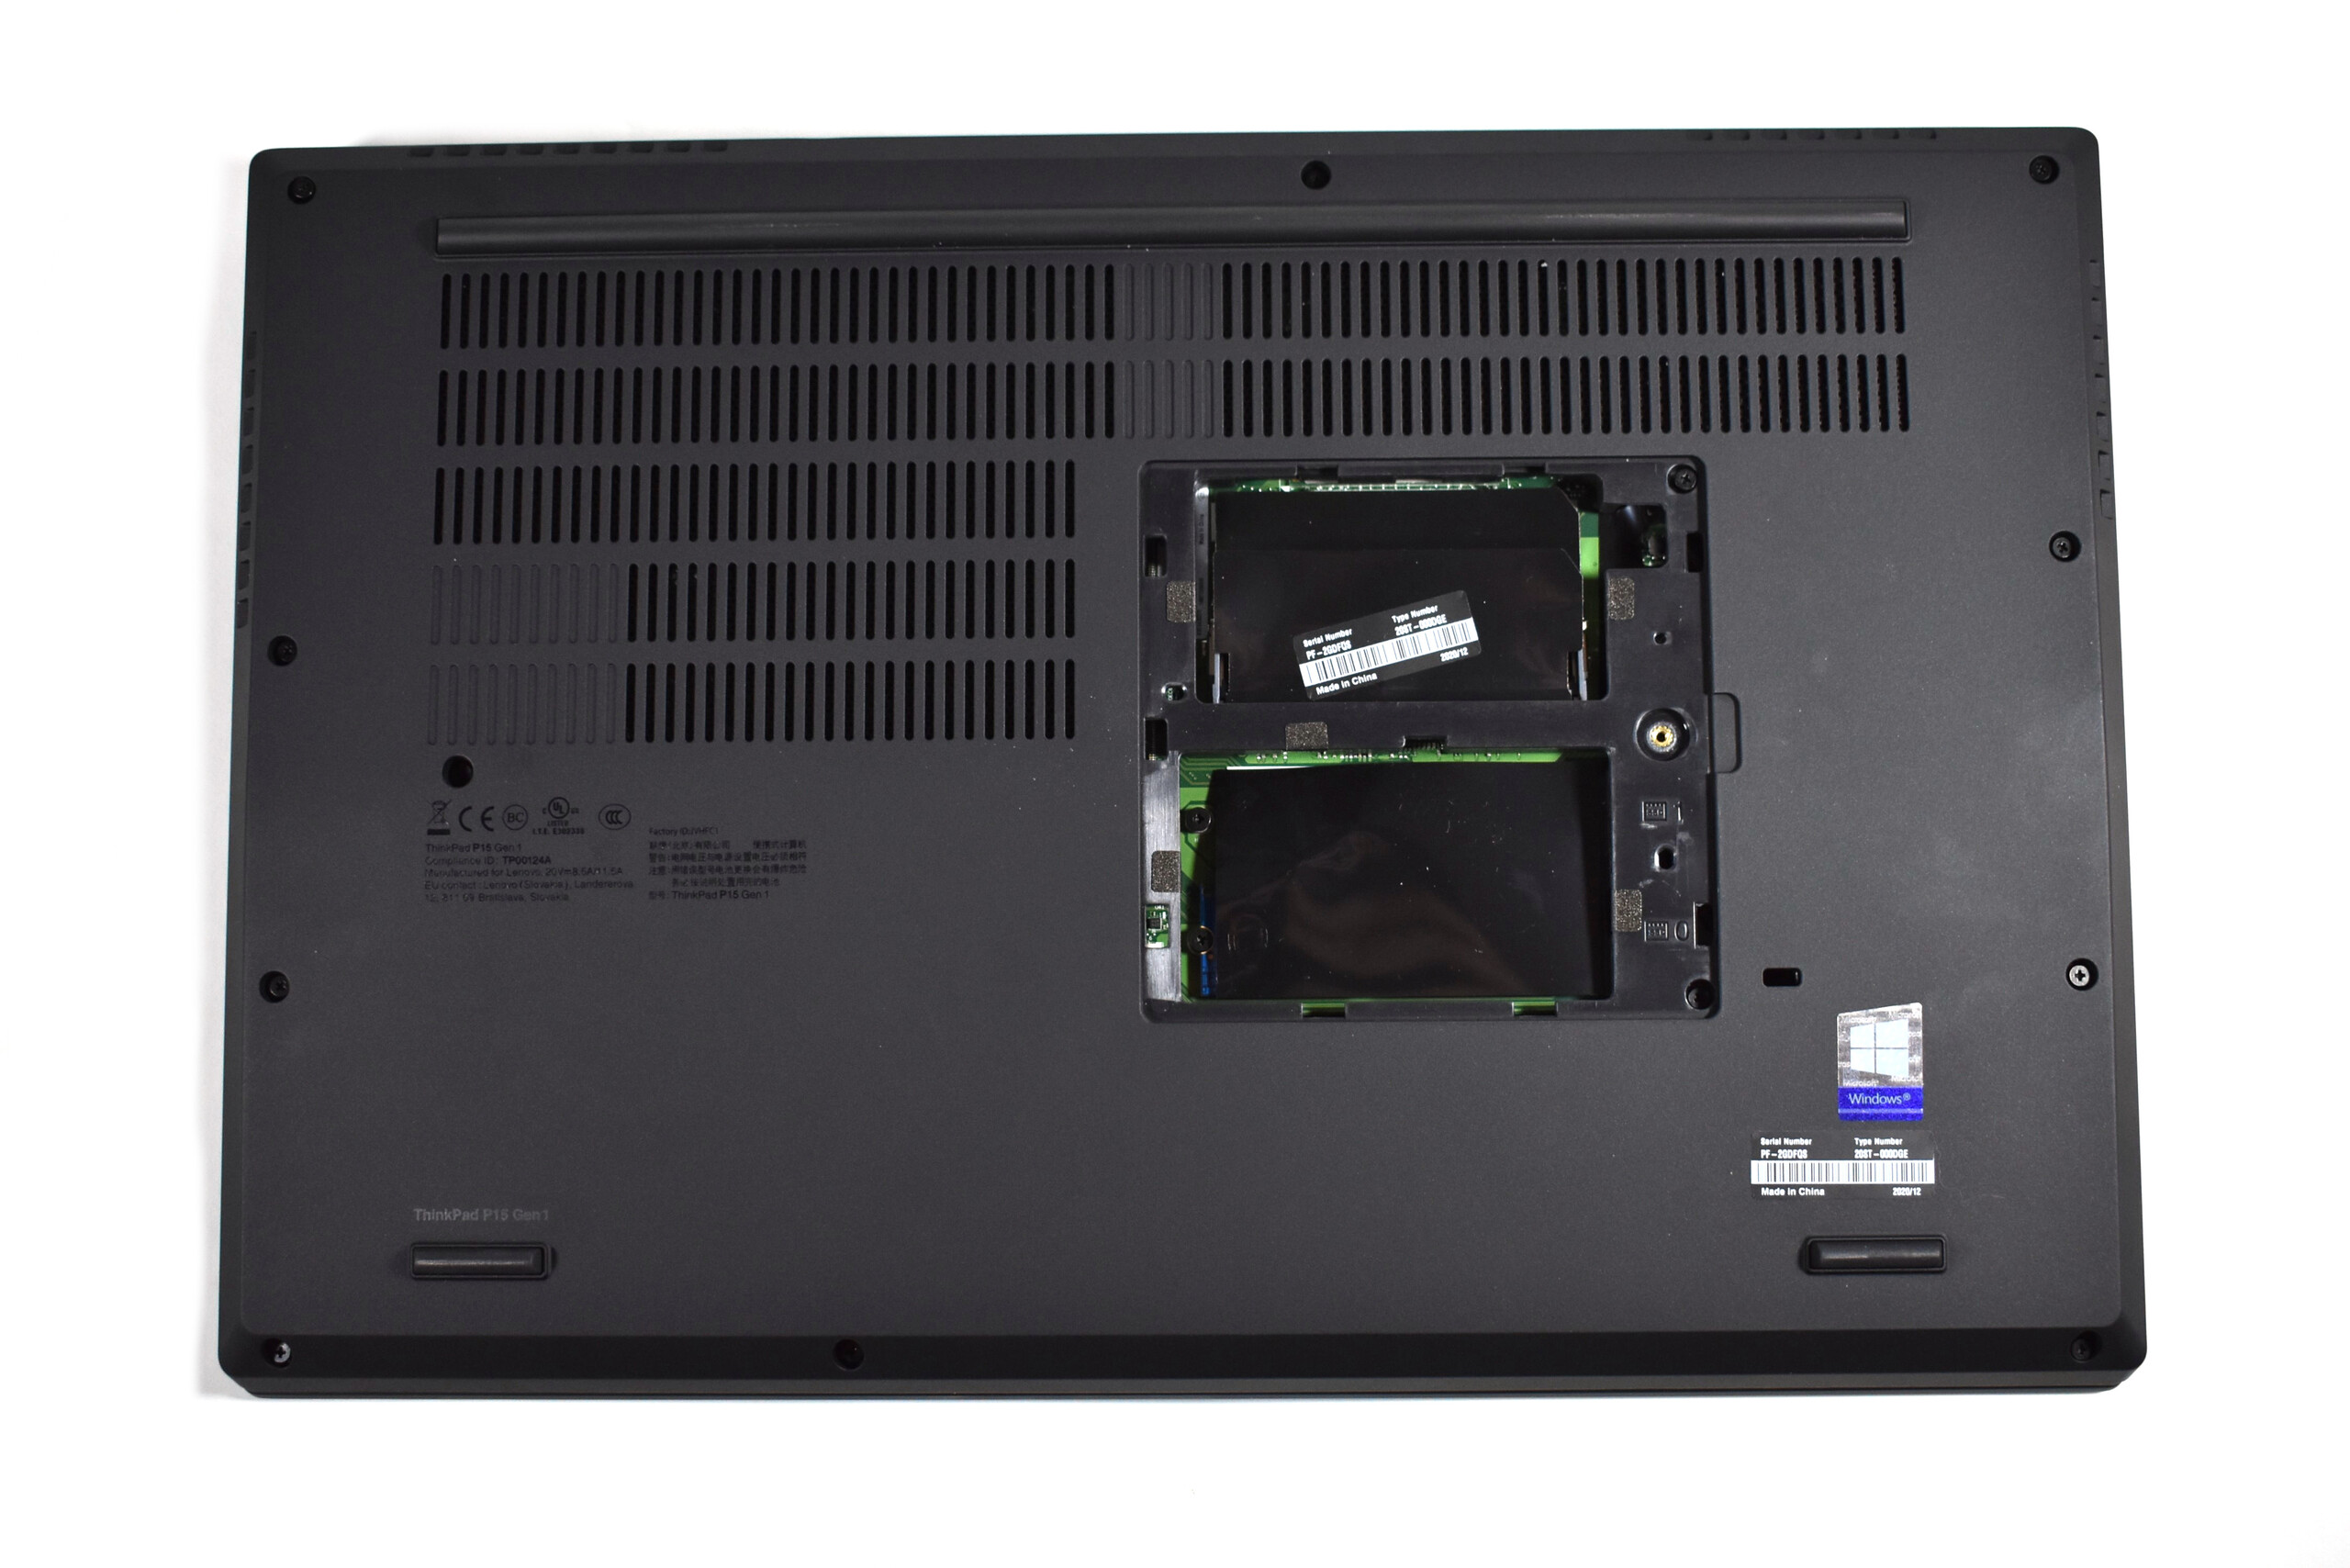
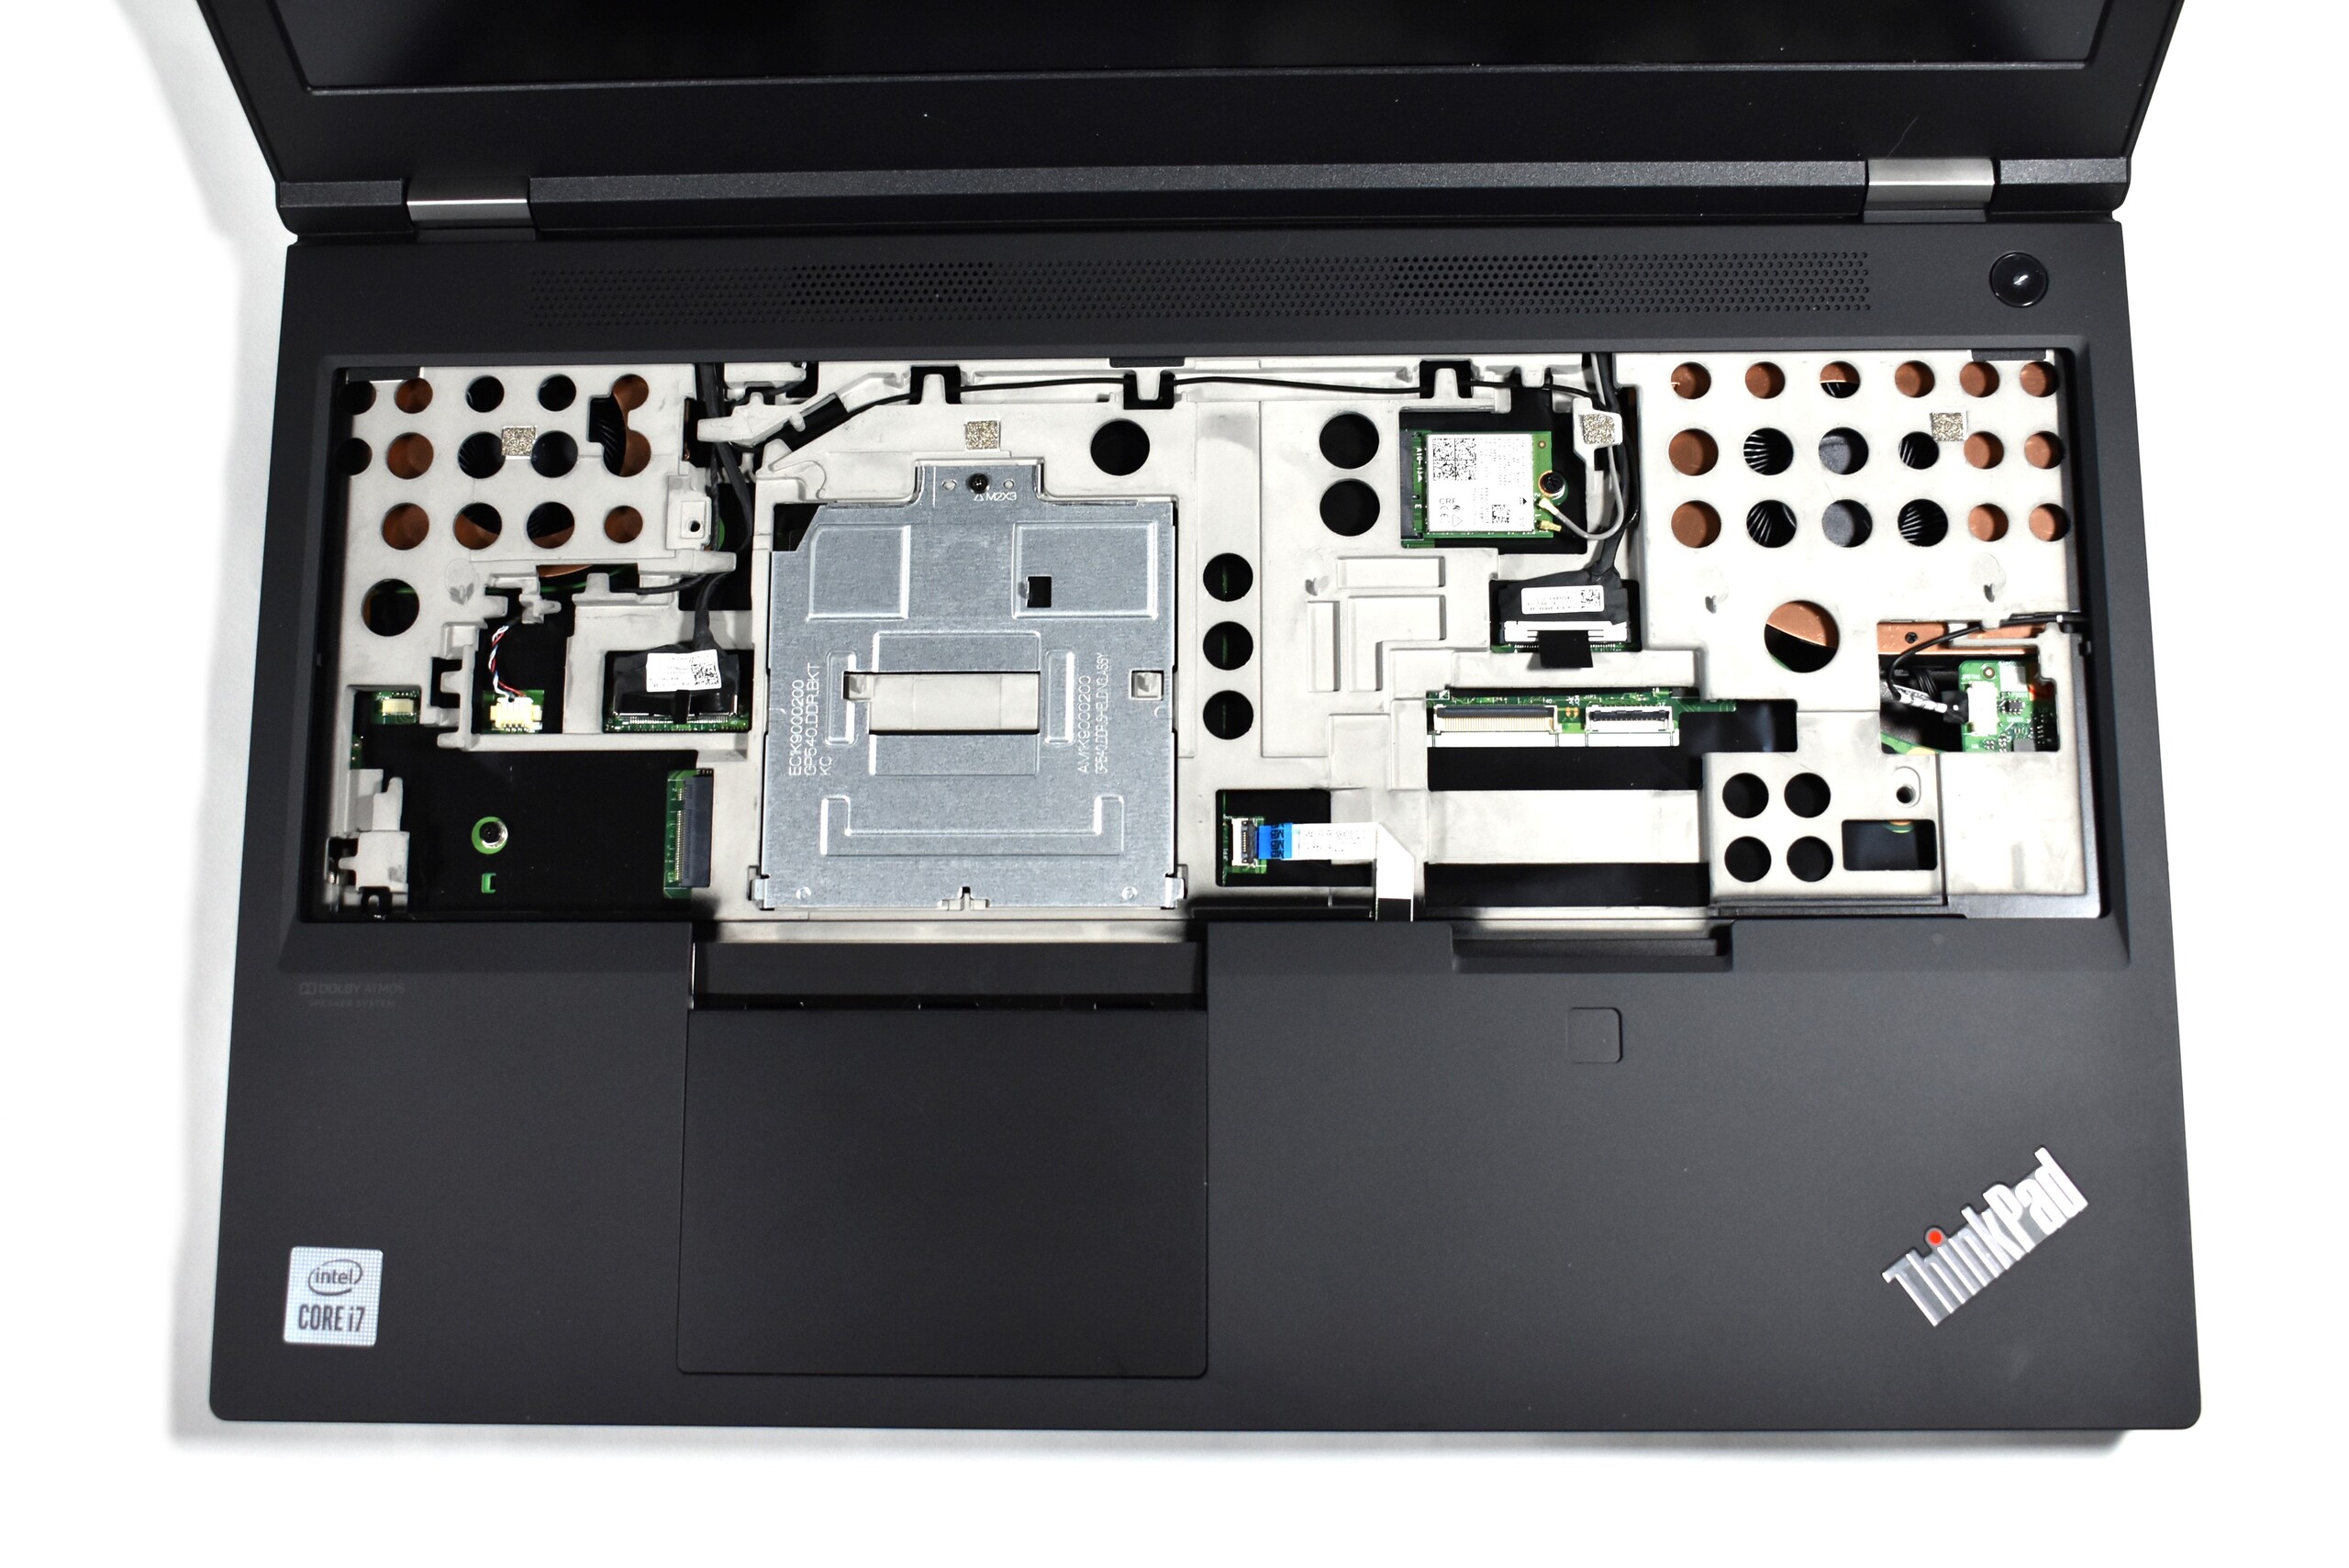
Mentre alcuni di questi cambiamenti ci lasciano piuttosto preoccupati, ci piacciono sicuramente le opzioni di manutenzione migliorate e la maggiore modularità. Nel predecessore, si doveva ancora smontare l'intero case per accedere al sistema di raffreddamento, ma nel ThinkPad P15, è sufficiente rimuovere la piastra inferiore. Rimuovere la tastiera con il tastierino numerico è altrettanto facile, dando accesso a due dei quattro slot RAM.
| SD Card Reader | |
| average JPG Copy Test (av. of 3 runs) | |
| Dell Precision 7550 (Toshiba Exceria Pro SDXC 64 GB UHS-II) | |
| Lenovo ThinkPad P53-20QN000YGE (Toshiba Exceria Pro SDXC 64 GB UHS-II) | |
| HP ZBook Fury 15 G7 (Toshiba Exceria Pro SDXC 64 GB UHS-II) | |
| Media della classe Workstation (49.6 - 681, n=13, ultimi 2 anni) | |
| Lenovo ThinkPad T15p-20TN0006GE (Toshiba Exceria Pro SDXC 64 GB UHS-II) | |
| Lenovo ThinkPad P15 Gen1-20ST000DGE (Toshiba Exceria Pro SDXC 64 GB UHS-II) | |
| maximum AS SSD Seq Read Test (1GB) | |
| Media della classe Workstation (87.6 - 1455, n=13, ultimi 2 anni) | |
| HP ZBook Fury 15 G7 (Toshiba Exceria Pro SDXC 64 GB UHS-II) | |
| Lenovo ThinkPad P53-20QN000YGE (Toshiba Exceria Pro SDXC 64 GB UHS-II) | |
| Dell Precision 7550 (Toshiba Exceria Pro SDXC 64 GB UHS-II) | |
| Lenovo ThinkPad T15p-20TN0006GE (Toshiba Exceria Pro SDXC 64 GB UHS-II) | |
| Lenovo ThinkPad P15 Gen1-20ST000DGE (Toshiba Exceria Pro SDXC 64 GB UHS-II) | |
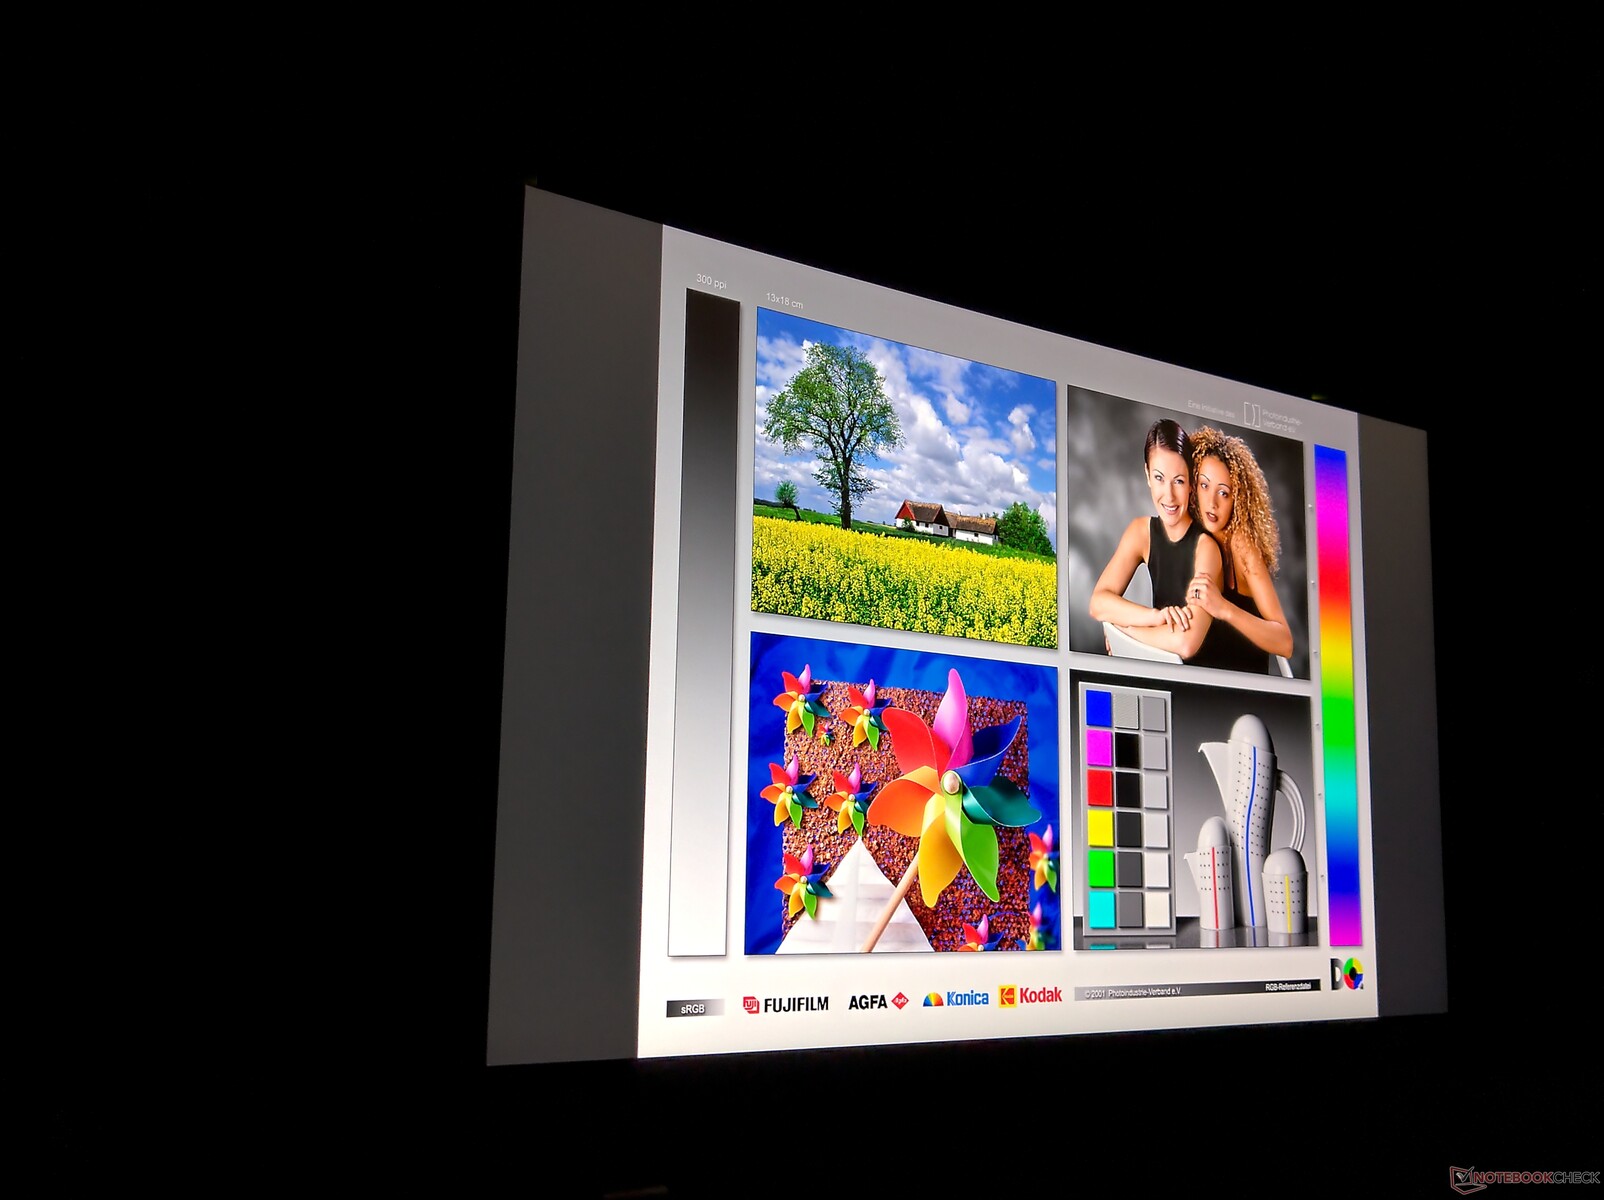
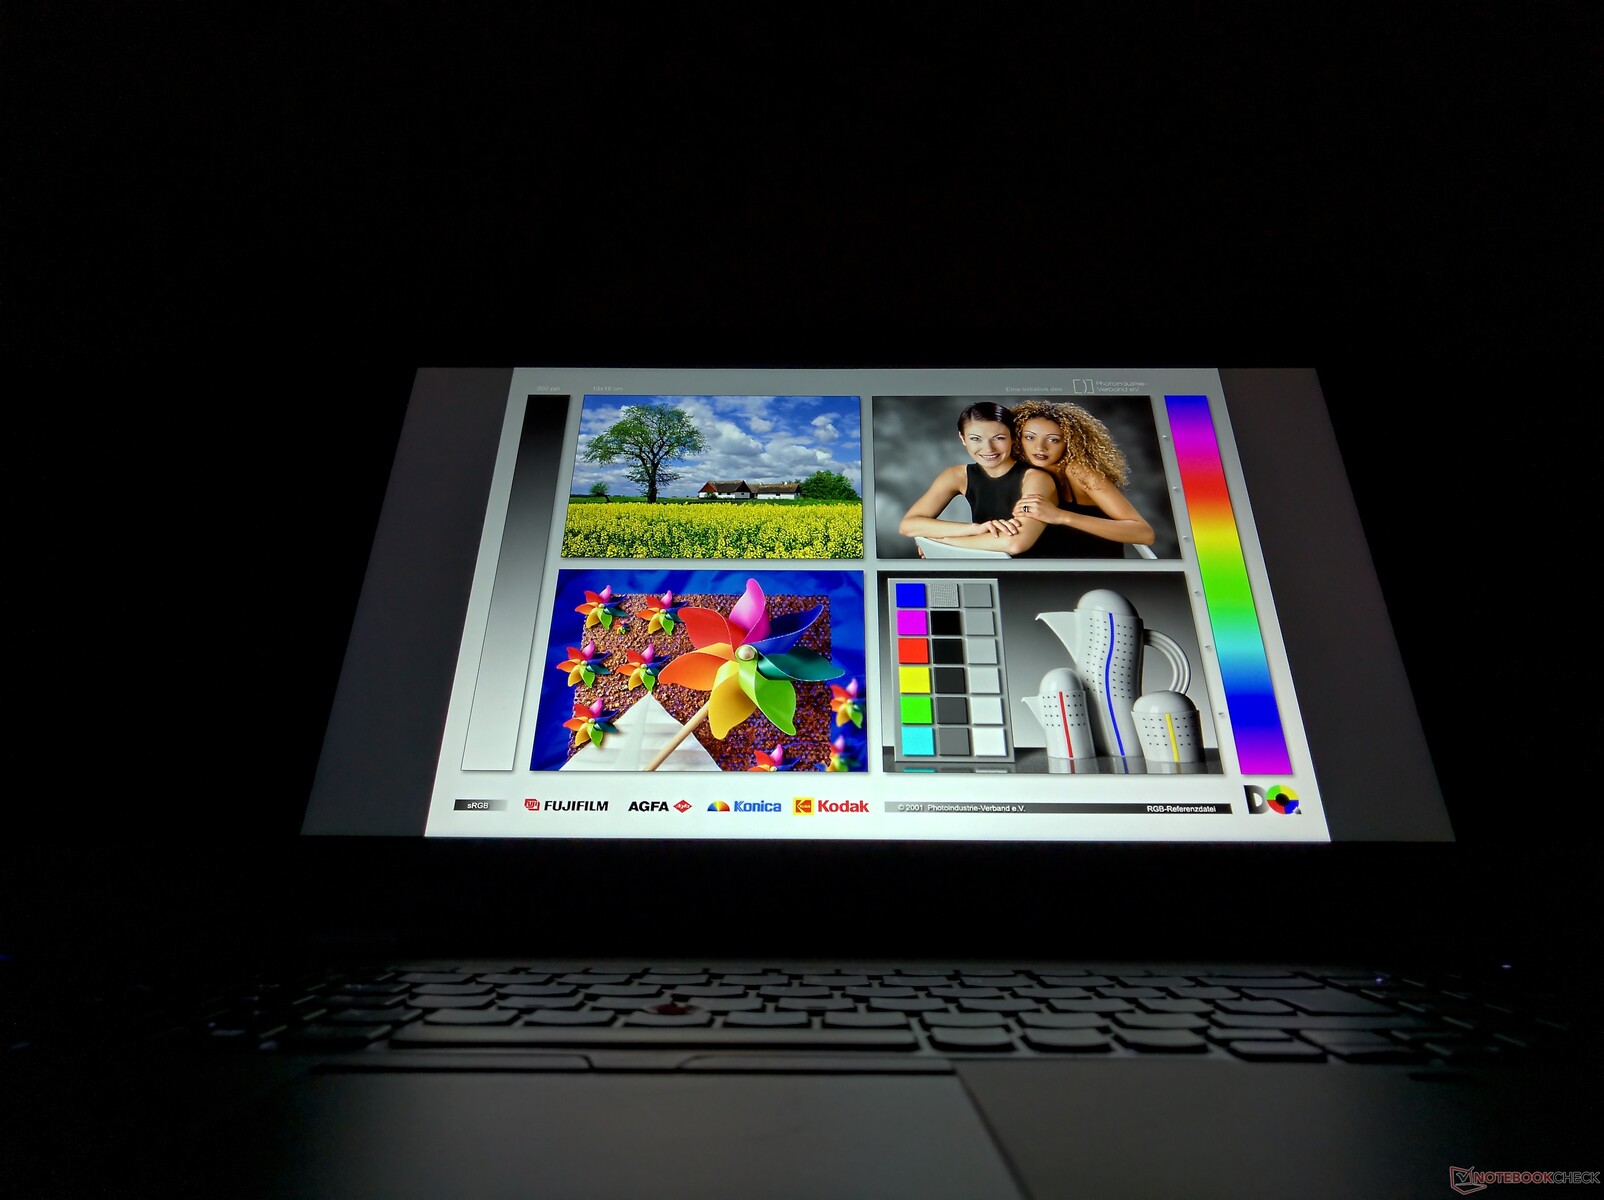
Display: Test del pannello entry-level del Lenovo ThinkPad P15

Come molti altri portatili ThinkPad, il Lenovo ThinkPad P15 Gen 1 offre anche una selezione di display disponibili che hanno tutti in comune la diagonale di 15,6 pollici e il formato 16:9
- Full-HD (1920 x 1080), IPS LCD, 300 cd/m², 72% NTSC, opaco
- Full-HD (1920 x 1080), IPS LCD, 500 cd/m², 72% NTSC, opaco, Dolby Vision
- 4K-UHD (3840 x 2160), IPS LCD, 600 cd/m², 100% AdobeRGB, opaco, Dolby Vision
- 4K-UHD (3840 x 2160), OLED, 400 cd/m² (picco 500 cd/m²), 100% DCI-P3, lucido, Dolby Vision, touchscreen
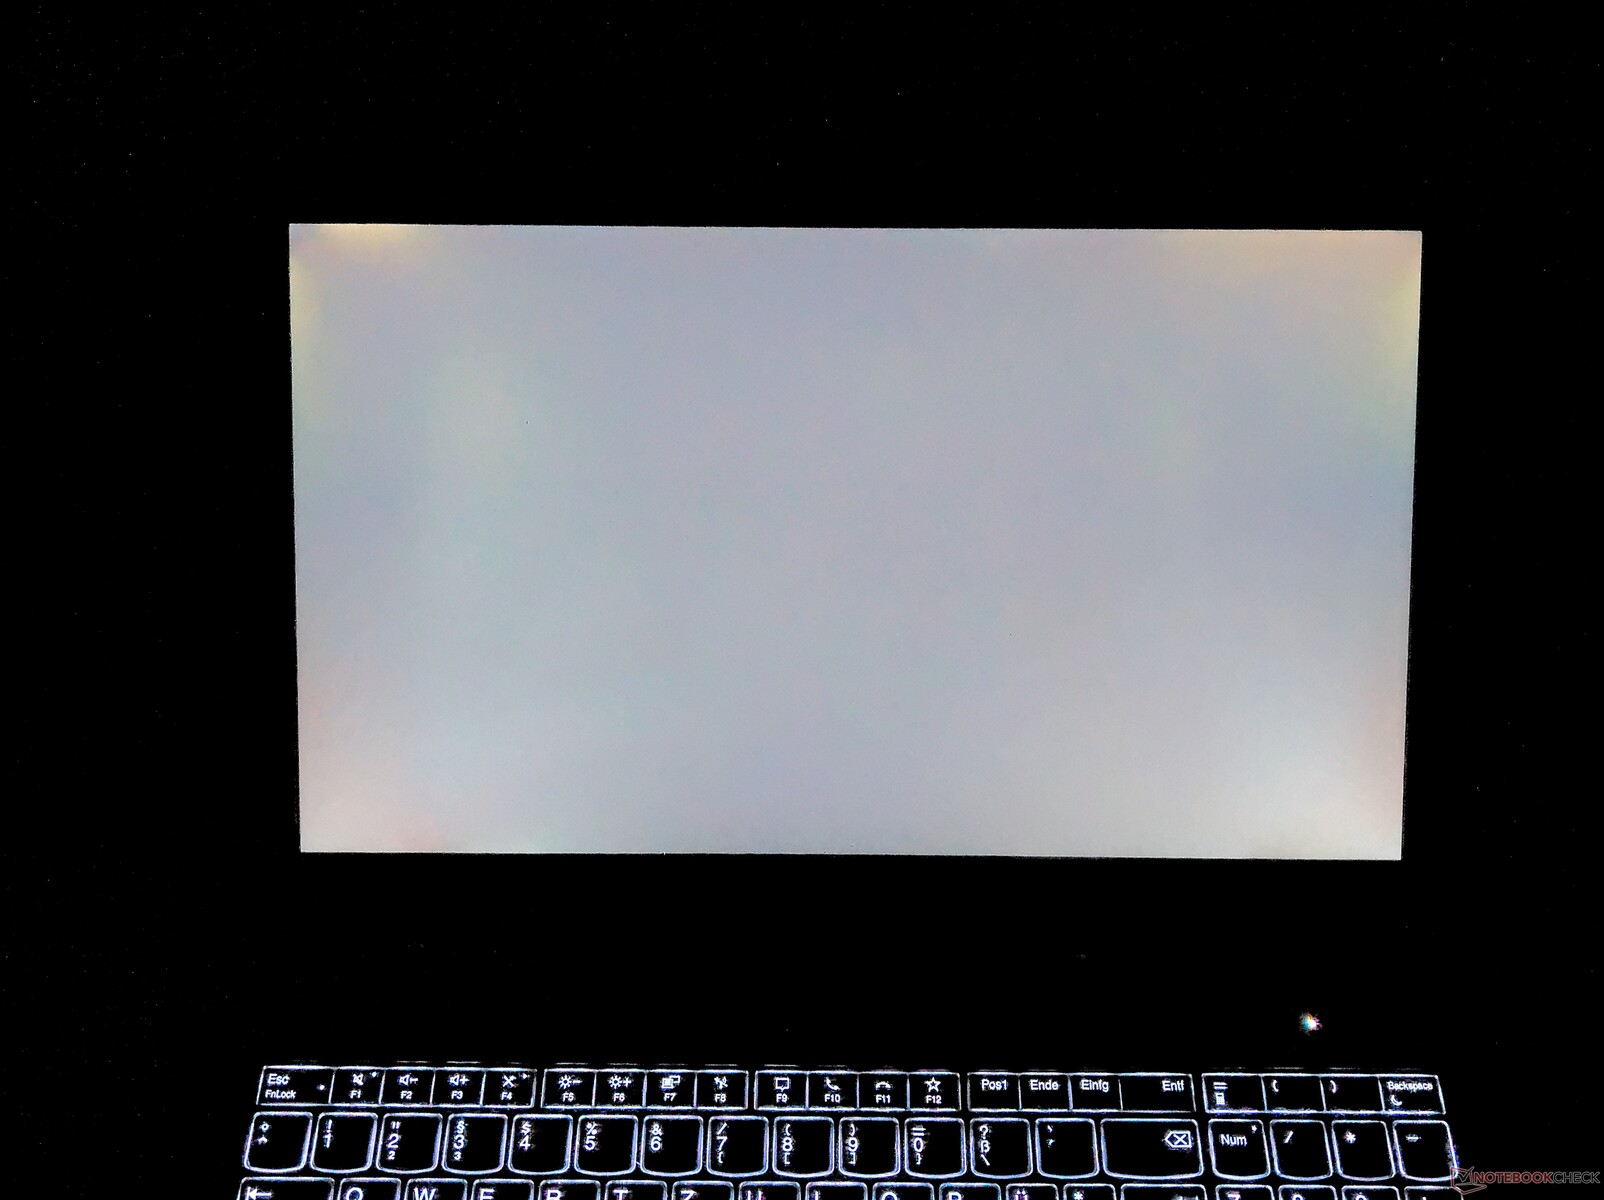
Con una luminosità media misurata di 304 cd/m², il display entry-level nella nostra unità di test raggiunge il valore promesso. Anche se questo rende il display il più scuro del nostro confronto, questo non è sorprendente, dato che le altre workstations sono dotate di display 4K UHD e il ThinkPad P53 aveva il più luminoso LCD Full-HD.
La distribuzione della luminosità sotto la media risalta, ma non ci sono ombreggiature evidenti guardando ad occhi nudi.
| |||||||||||||||||||||||||
Distribuzione della luminosità: 81 %
Al centro con la batteria: 336 cd/m²
Contrasto: 751:1 (Nero: 0.45 cd/m²)
ΔE ColorChecker Calman: 5.5 | ∀{0.5-29.43 Ø4.71}
calibrated: 1.9
ΔE Greyscale Calman: 7.8 | ∀{0.09-98 Ø4.96}
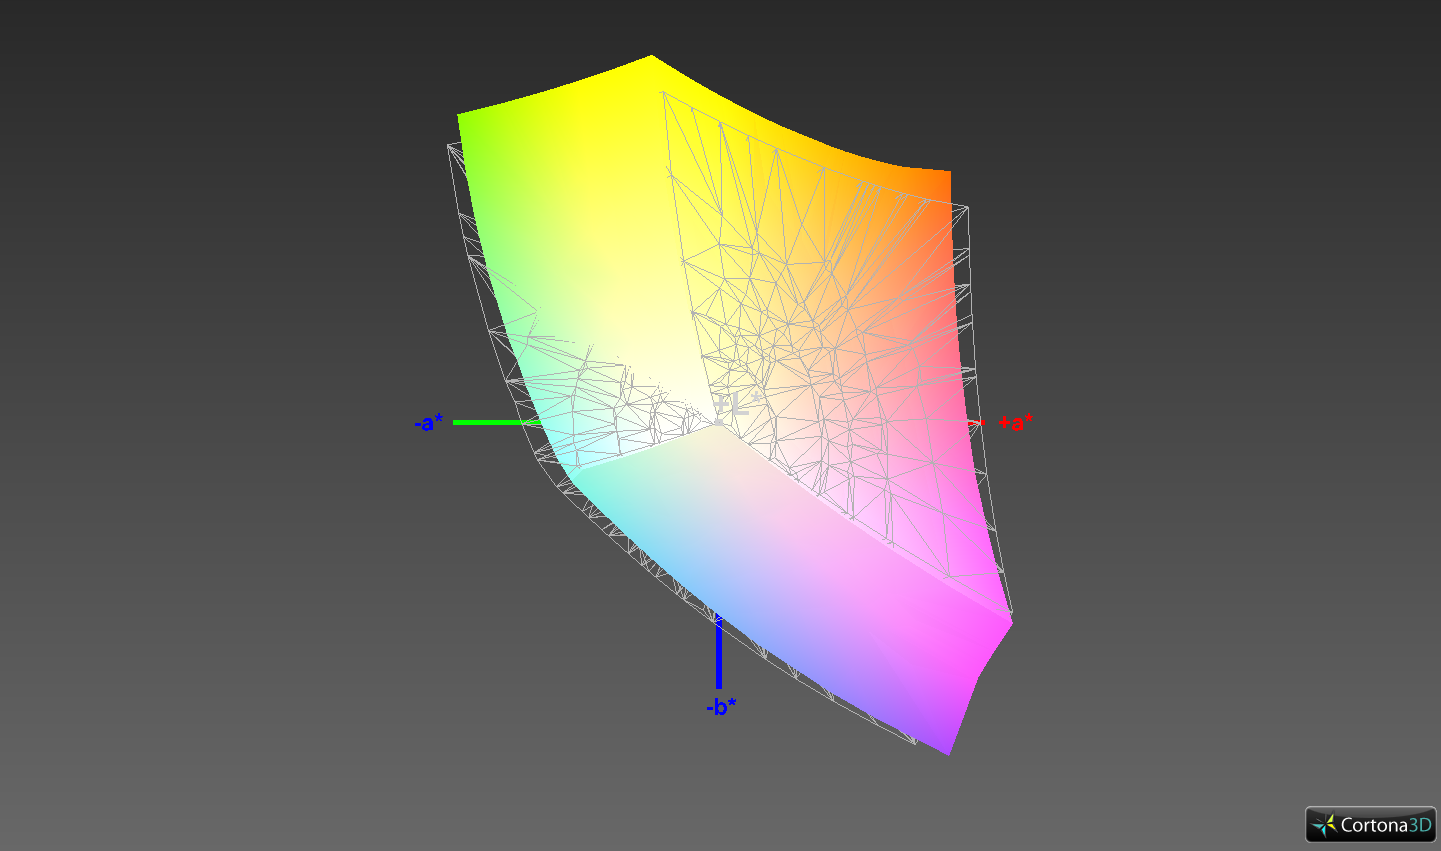
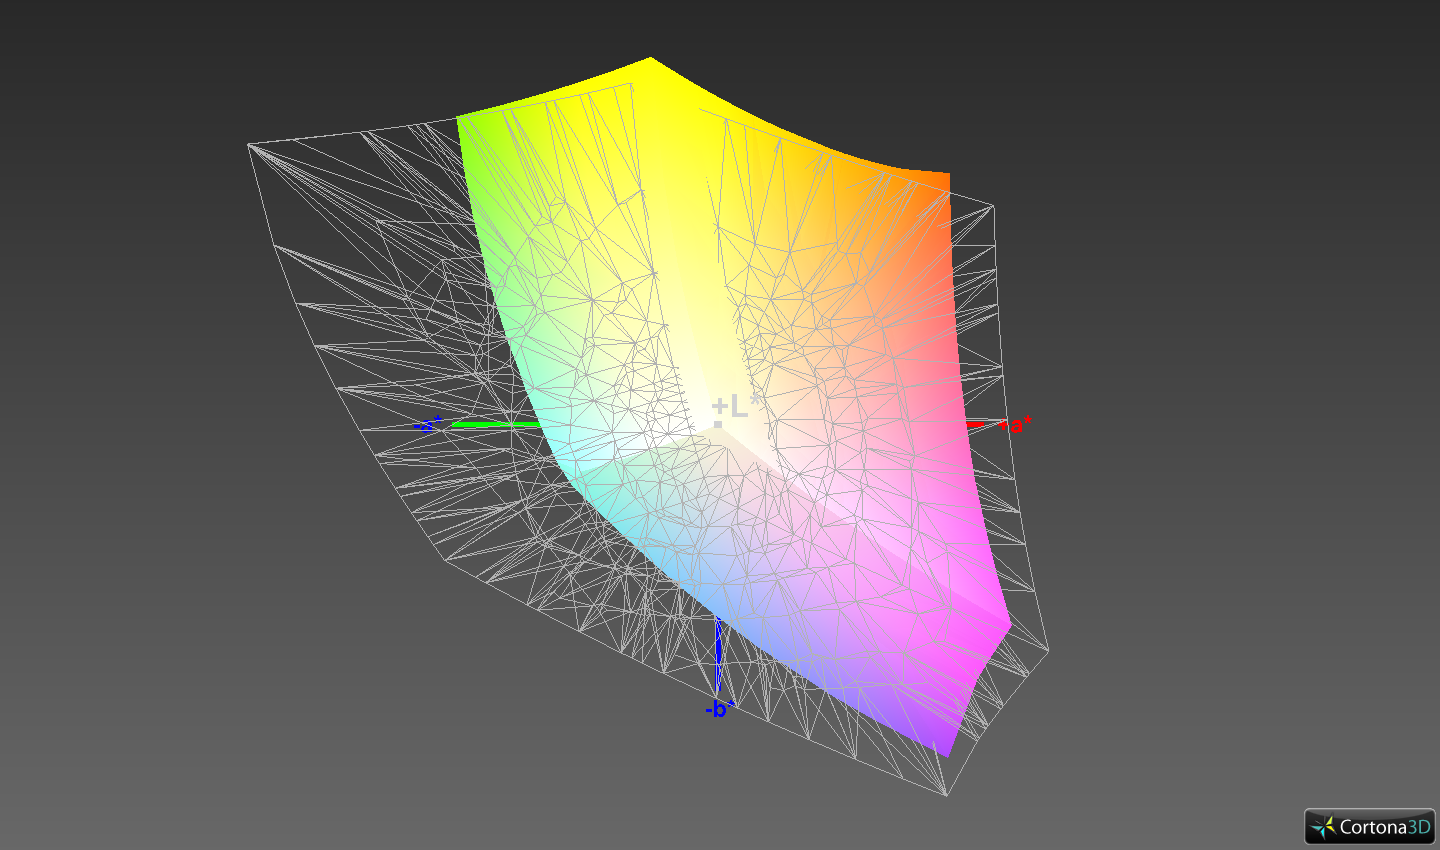
92.1% sRGB (Argyll 1.6.3 3D)
60% AdobeRGB 1998 (Argyll 1.6.3 3D)
67.1% AdobeRGB 1998 (Argyll 3D)
92.3% sRGB (Argyll 3D)
66.6% Display P3 (Argyll 3D)
Gamma: 2.24
CCT: 6764 K
| Lenovo ThinkPad P15 Gen1-20ST000DGE N156HCE-EN1, a-Si IPS LED, 1920x1080, 15.6" | Lenovo ThinkPad P53-20QN000YGE N156HCE-GN1, IPS, 1920x1080, 15.6" | Lenovo ThinkPad T15p-20TN0006GE MNF601EA1-1, IPS LED, 3840x2160, 15.6" | Dell Precision 7550 AU Optronics B156ZAN, IPS, 3840x2160, 15.6" | HP ZBook Fury 15 G7 LG Philips LGD0661, IPS, 3840x2160, 15.6" | |
|---|---|---|---|---|---|
| Display | -3% | 28% | 25% | 26% | |
| Display P3 Coverage (%) | 66.6 | 63.2 -5% | 86.8 30% | 82.1 23% | 95.6 44% |
| sRGB Coverage (%) | 92.3 | 92.9 1% | 99.3 8% | 99.6 8% | 99.8 8% |
| AdobeRGB 1998 Coverage (%) | 67.1 | 64.3 -4% | 98.5 47% | 96.8 44% | 84.5 26% |
| Response Times | 15% | 17% | -14% | -23% | |
| Response Time Grey 50% / Grey 80% * (ms) | 41.2 ? | 38.4 ? 7% | 41.6 ? -1% | 51.2 ? -24% | 56 ? -36% |
| Response Time Black / White * (ms) | 32.8 ? | 25.2 ? 23% | 21.2 ? 35% | 34 ? -4% | 36 ? -10% |
| PWM Frequency (Hz) | 24270 | 26040 ? | |||
| Screen | 39% | 64% | 14% | 35% | |
| Brightness middle (cd/m²) | 338 | 510 51% | 595 76% | 473.5 40% | 672.8 99% |
| Brightness (cd/m²) | 304 | 468 54% | 594 95% | 461 52% | 674 122% |
| Brightness Distribution (%) | 81 | 89 10% | 94 16% | 90 11% | 89 10% |
| Black Level * (cd/m²) | 0.45 | 0.36 20% | 0.32 29% | 0.55 -22% | 0.5 -11% |
| Contrast (:1) | 751 | 1417 89% | 1859 148% | 861 15% | 1346 79% |
| Colorchecker dE 2000 * | 5.5 | 2.3 58% | 1.2 78% | 4.8 13% | 3.48 37% |
| Colorchecker dE 2000 max. * | 11.5 | 5.5 52% | 2.5 78% | 8.73 24% | 9.44 18% |
| Colorchecker dE 2000 calibrated * | 1.9 | 1.2 37% | 1 47% | 3.08 -62% | 3.03 -59% |
| Greyscale dE 2000 * | 7.8 | 3.2 59% | 1.4 82% | 5.6 28% | 3.1 60% |
| Gamma | 2.24 98% | 2.34 94% | 2.1 105% | 2.34 94% | 2.04 108% |
| CCT | 6764 96% | 7036 92% | 6492 100% | 7549 86% | 6380 102% |
| Color Space (Percent of AdobeRGB 1998) (%) | 60 | 59.4 -1% | 85.3 42% | 86.4 44% | 75.2 25% |
| Color Space (Percent of sRGB) (%) | 92.1 | 93.1 1% | 99.2 8% | 99.7 8% | 100 9% |
| Media totale (Programma / Settaggio) | 17% /
28% | 36% /
51% | 8% /
12% | 13% /
26% |
* ... Meglio usare valori piccoli
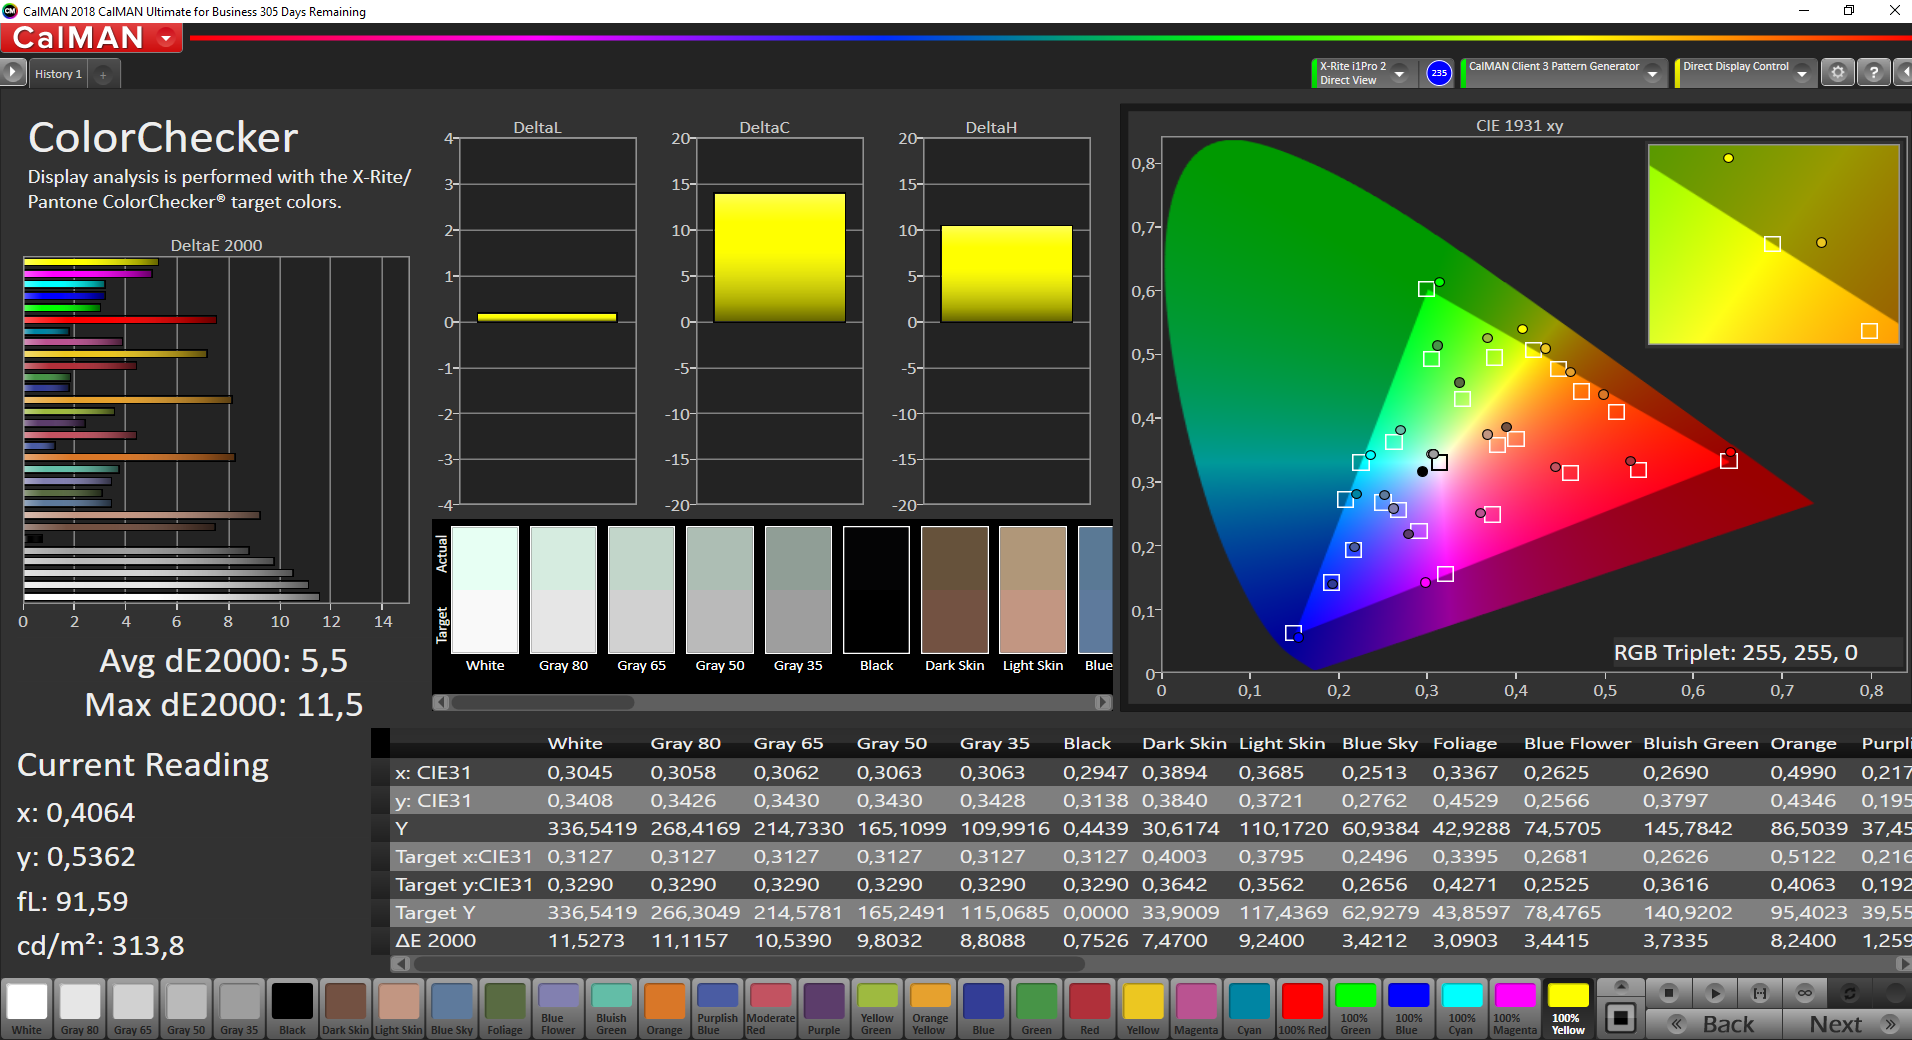
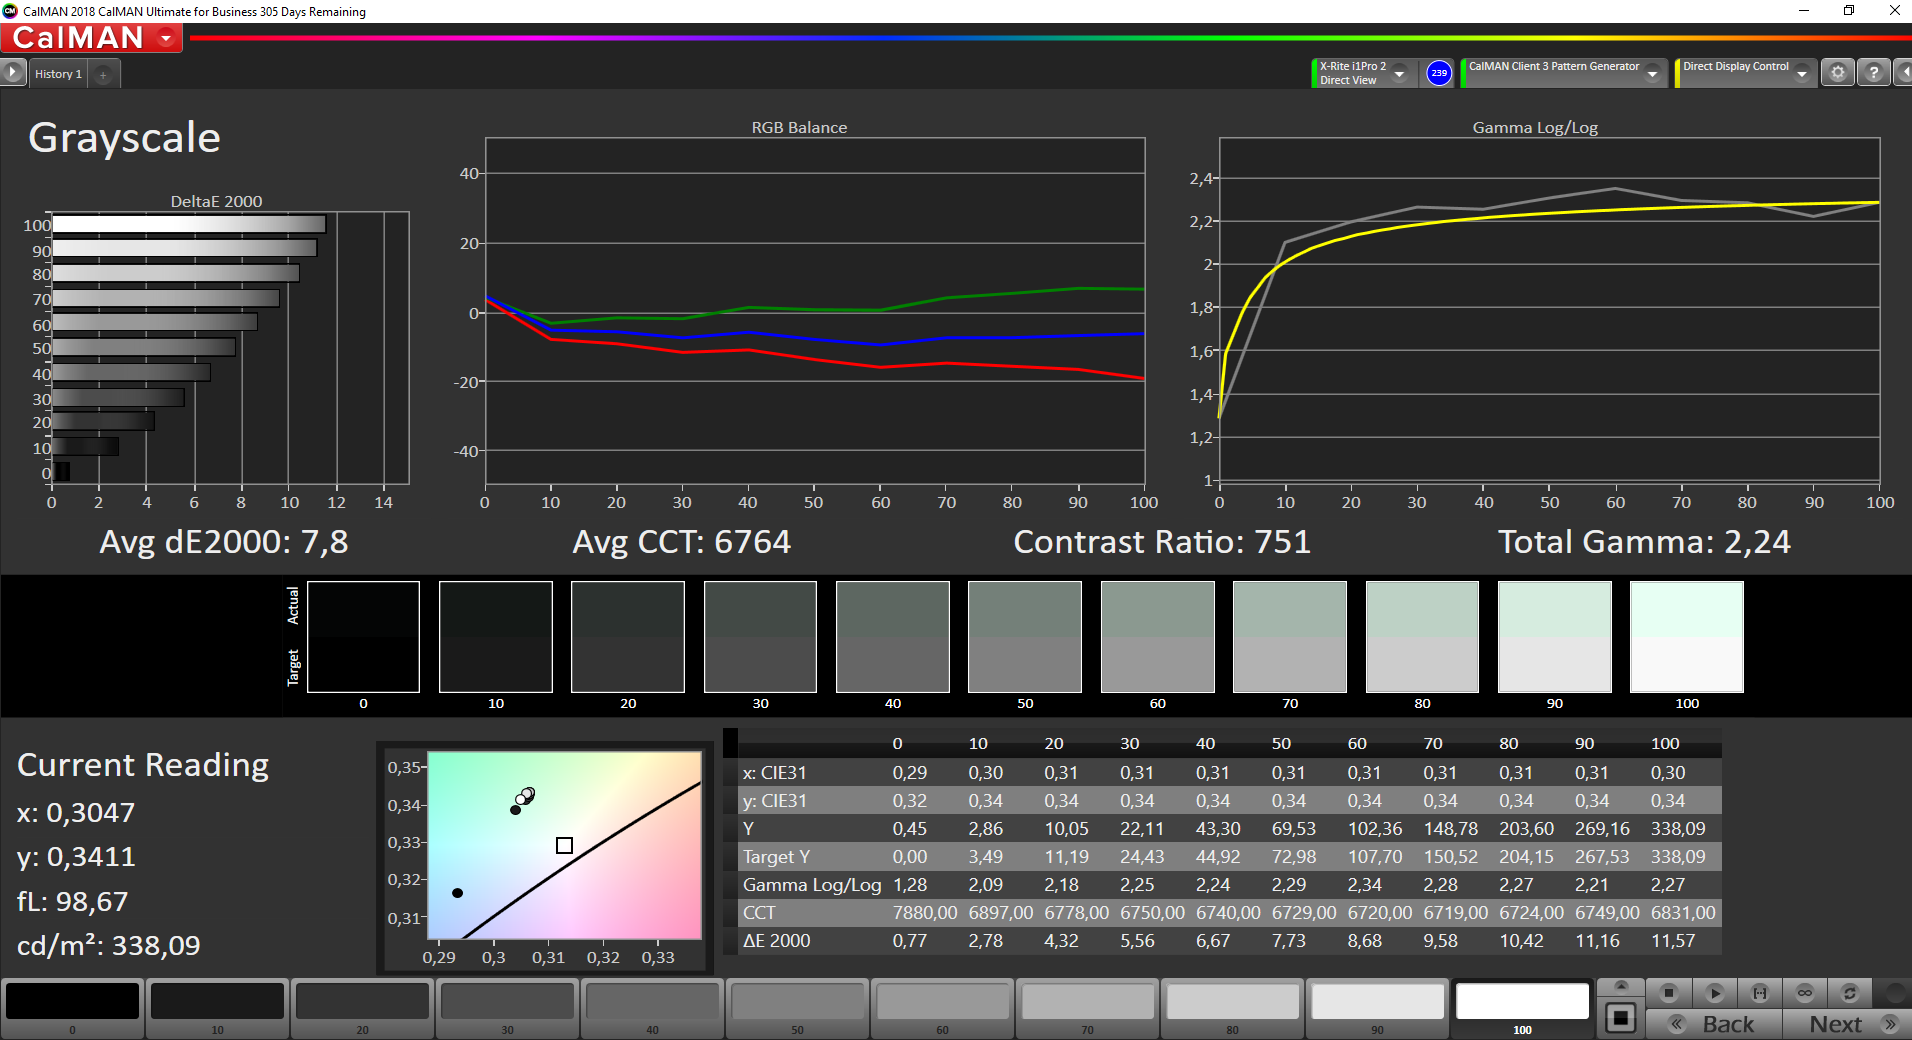
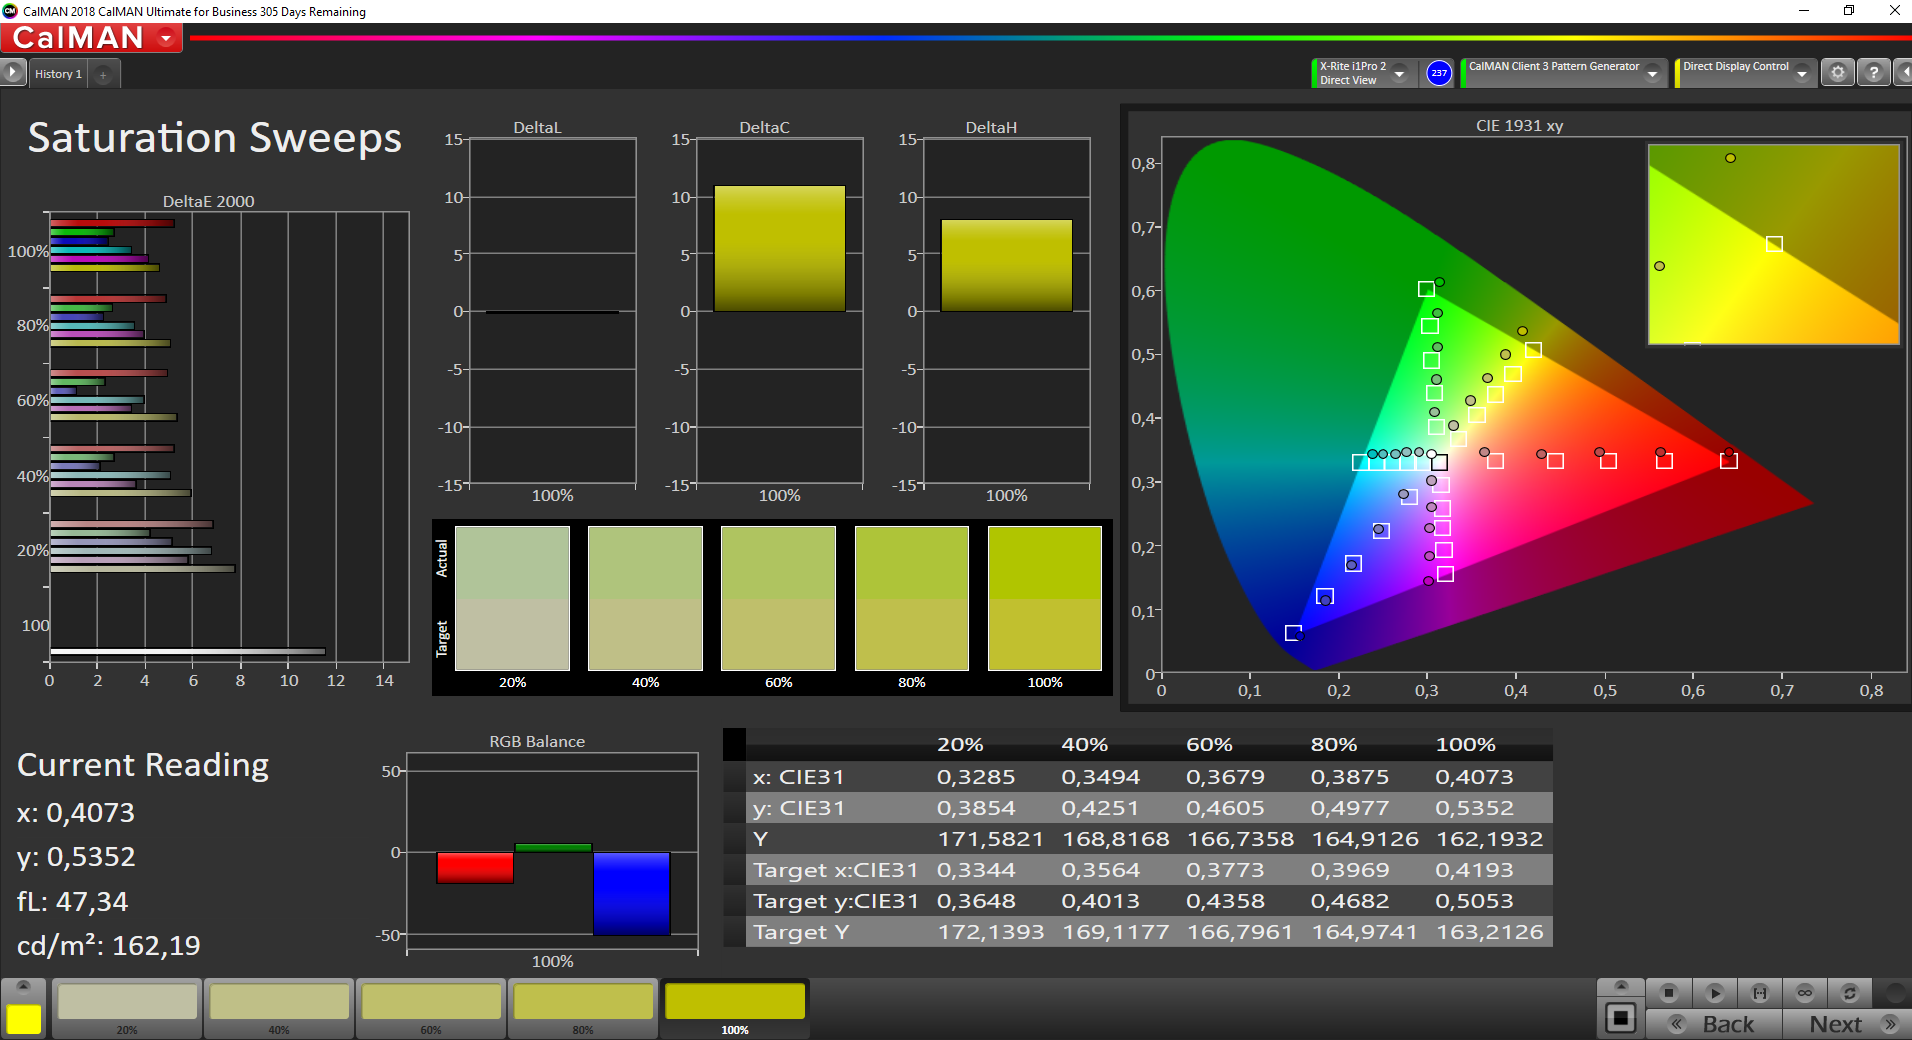
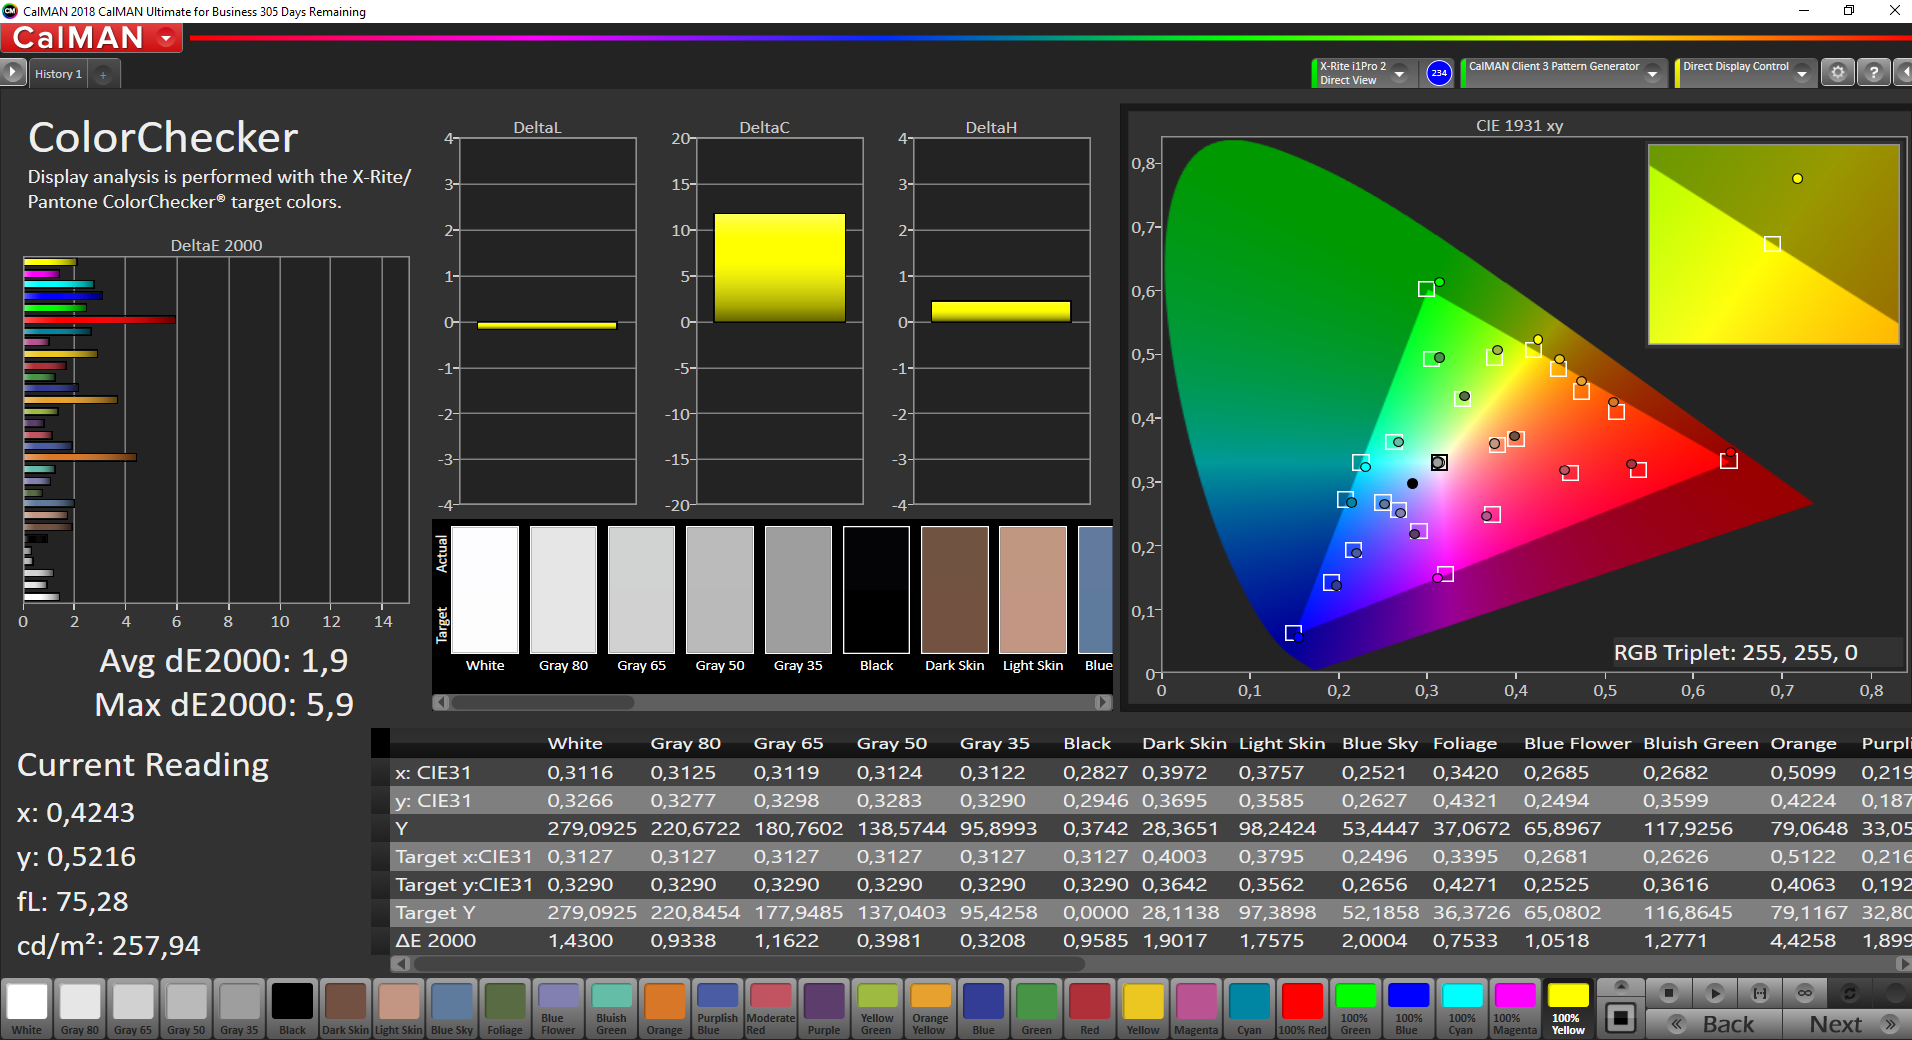
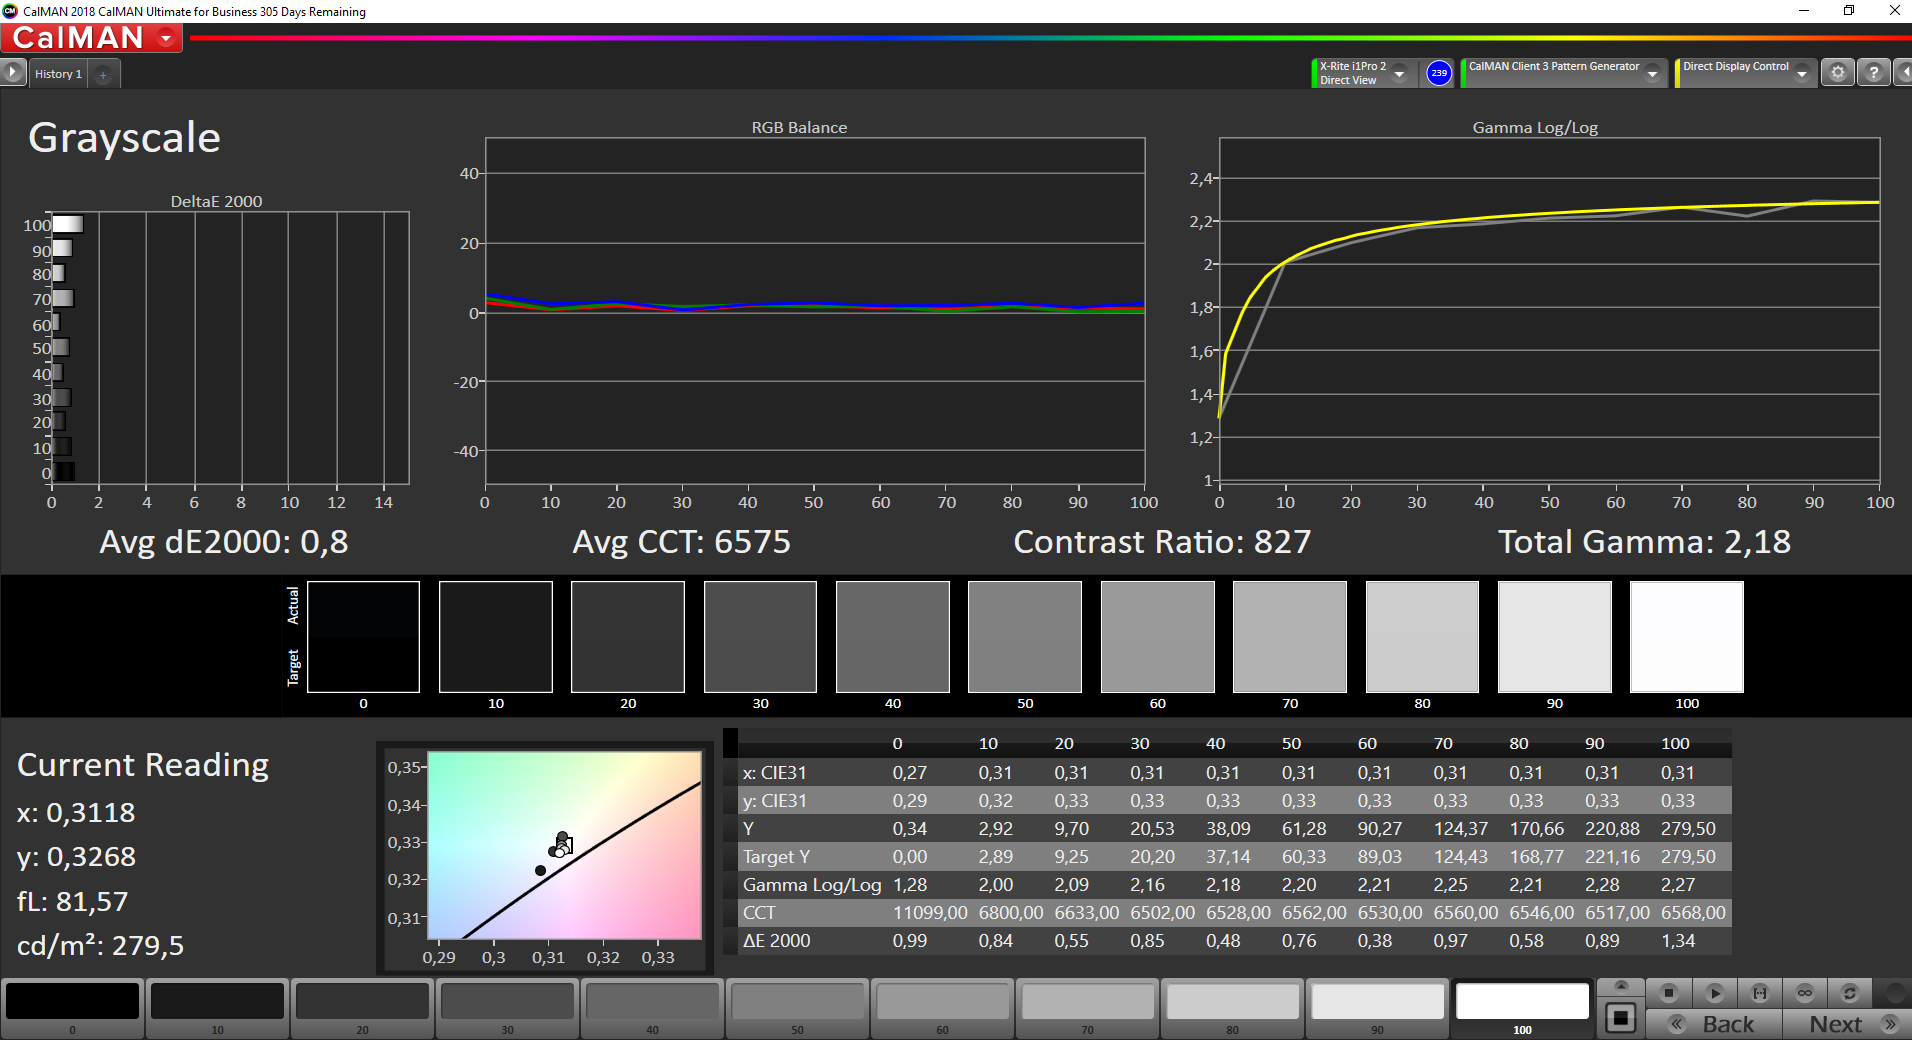
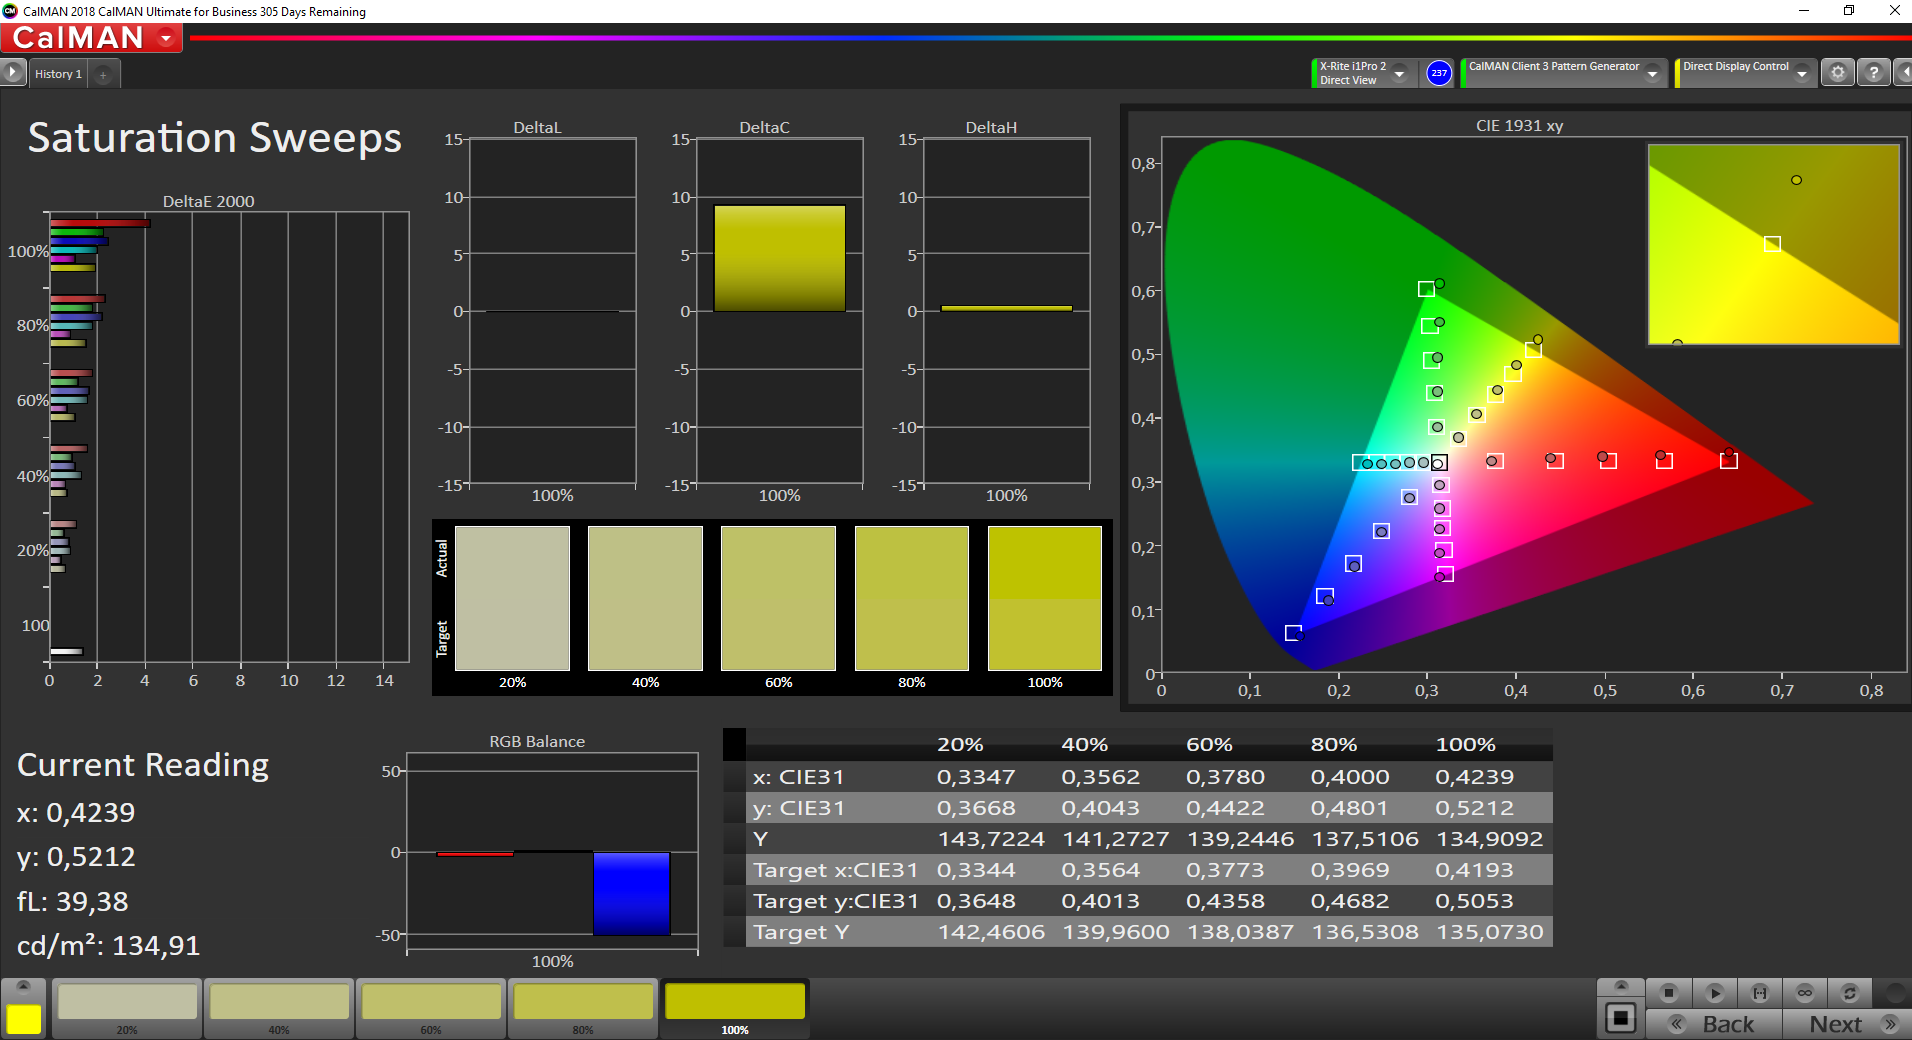
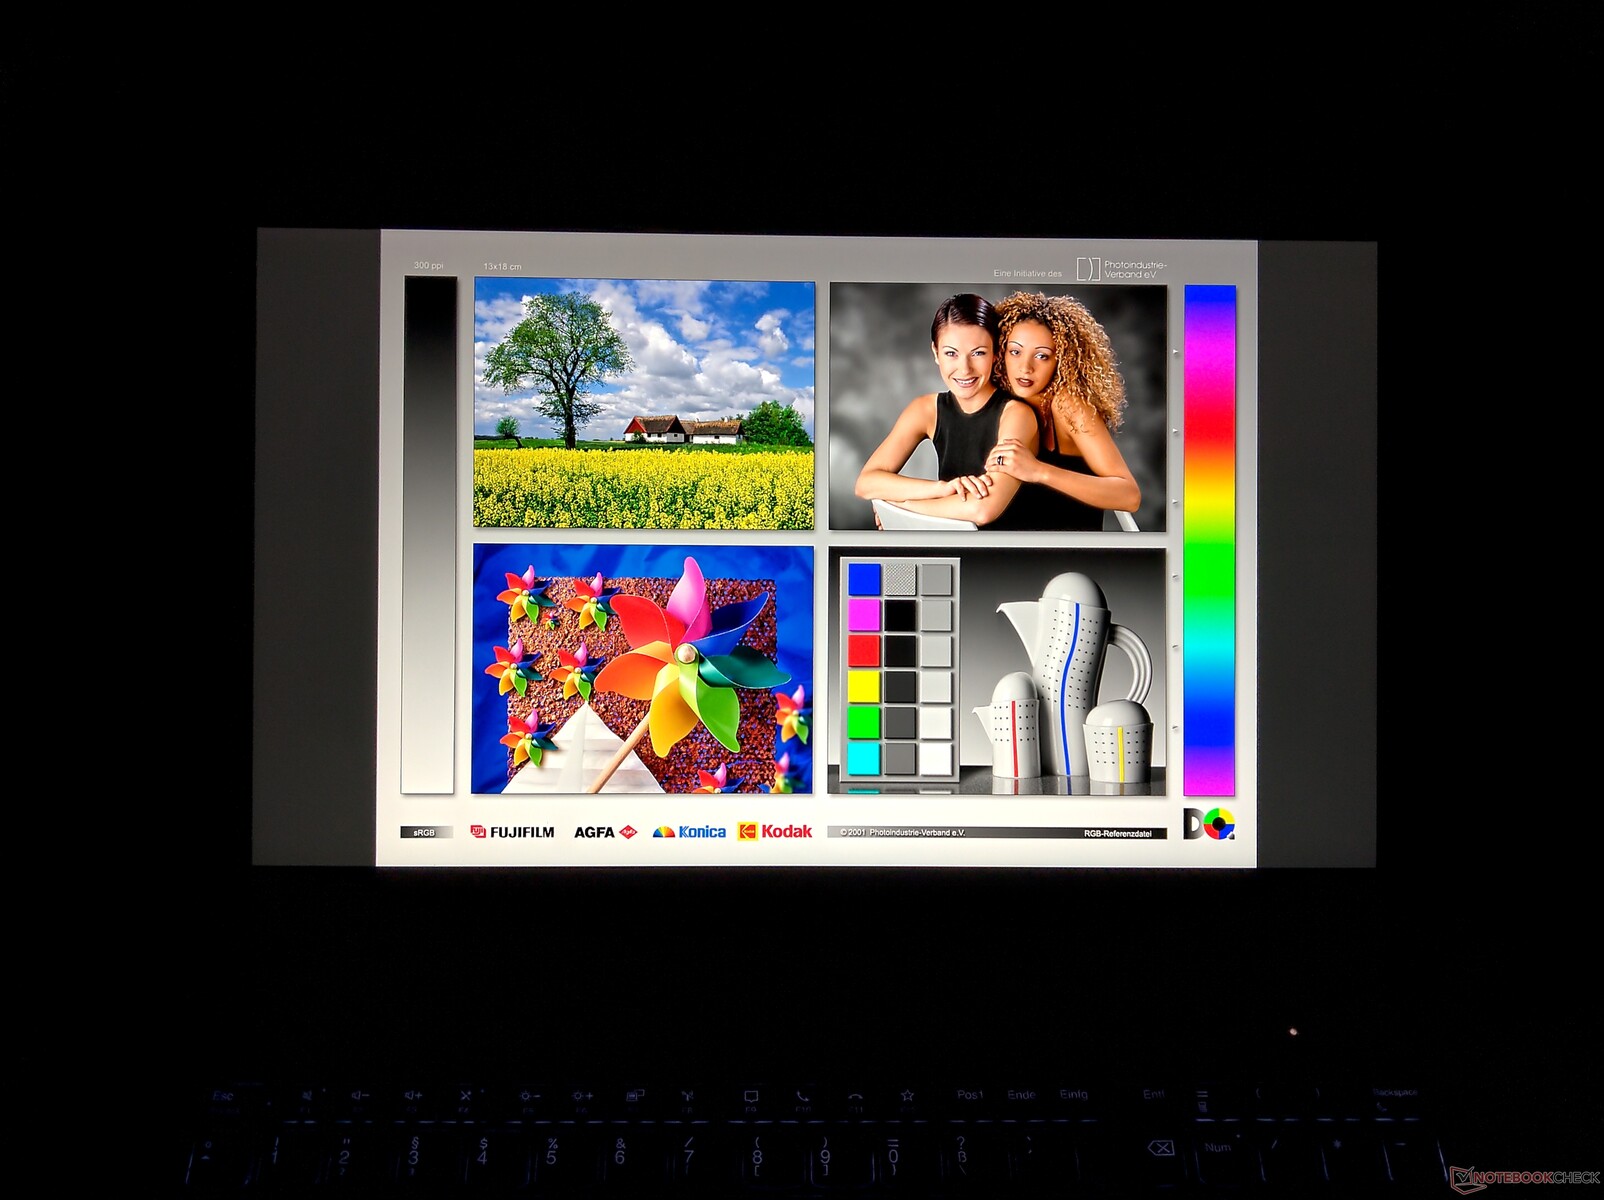
Allo stato di consegna, il display non è calibrato bene, il che lo si nota chiaramente nei valori che abbiamo misurato con CalMan e il colorimetro X-Rite i1 Pro 2: Il ThinkPad LCD ha una sfumatura verde. Una calibrazione decente rimedierà a questo, ed mettiamo a disposizione il relativo profilo in download gratuito. Tuttavia, a causa della calibrazione, la luminosità massima al centro del pannello LCD calerà di circa 60 cd/m².
Siamo un po' delusi dal valore del contrasto. Anche se 751:1 non è del tutto negativo, non è nemmeno un buon valore. Mancano anche alcuni punti percentuali per coprire completamente lo spazio colore sRGB, ma questo era anche il caso del ThinkPad P53 con il display da 500 cd/m².
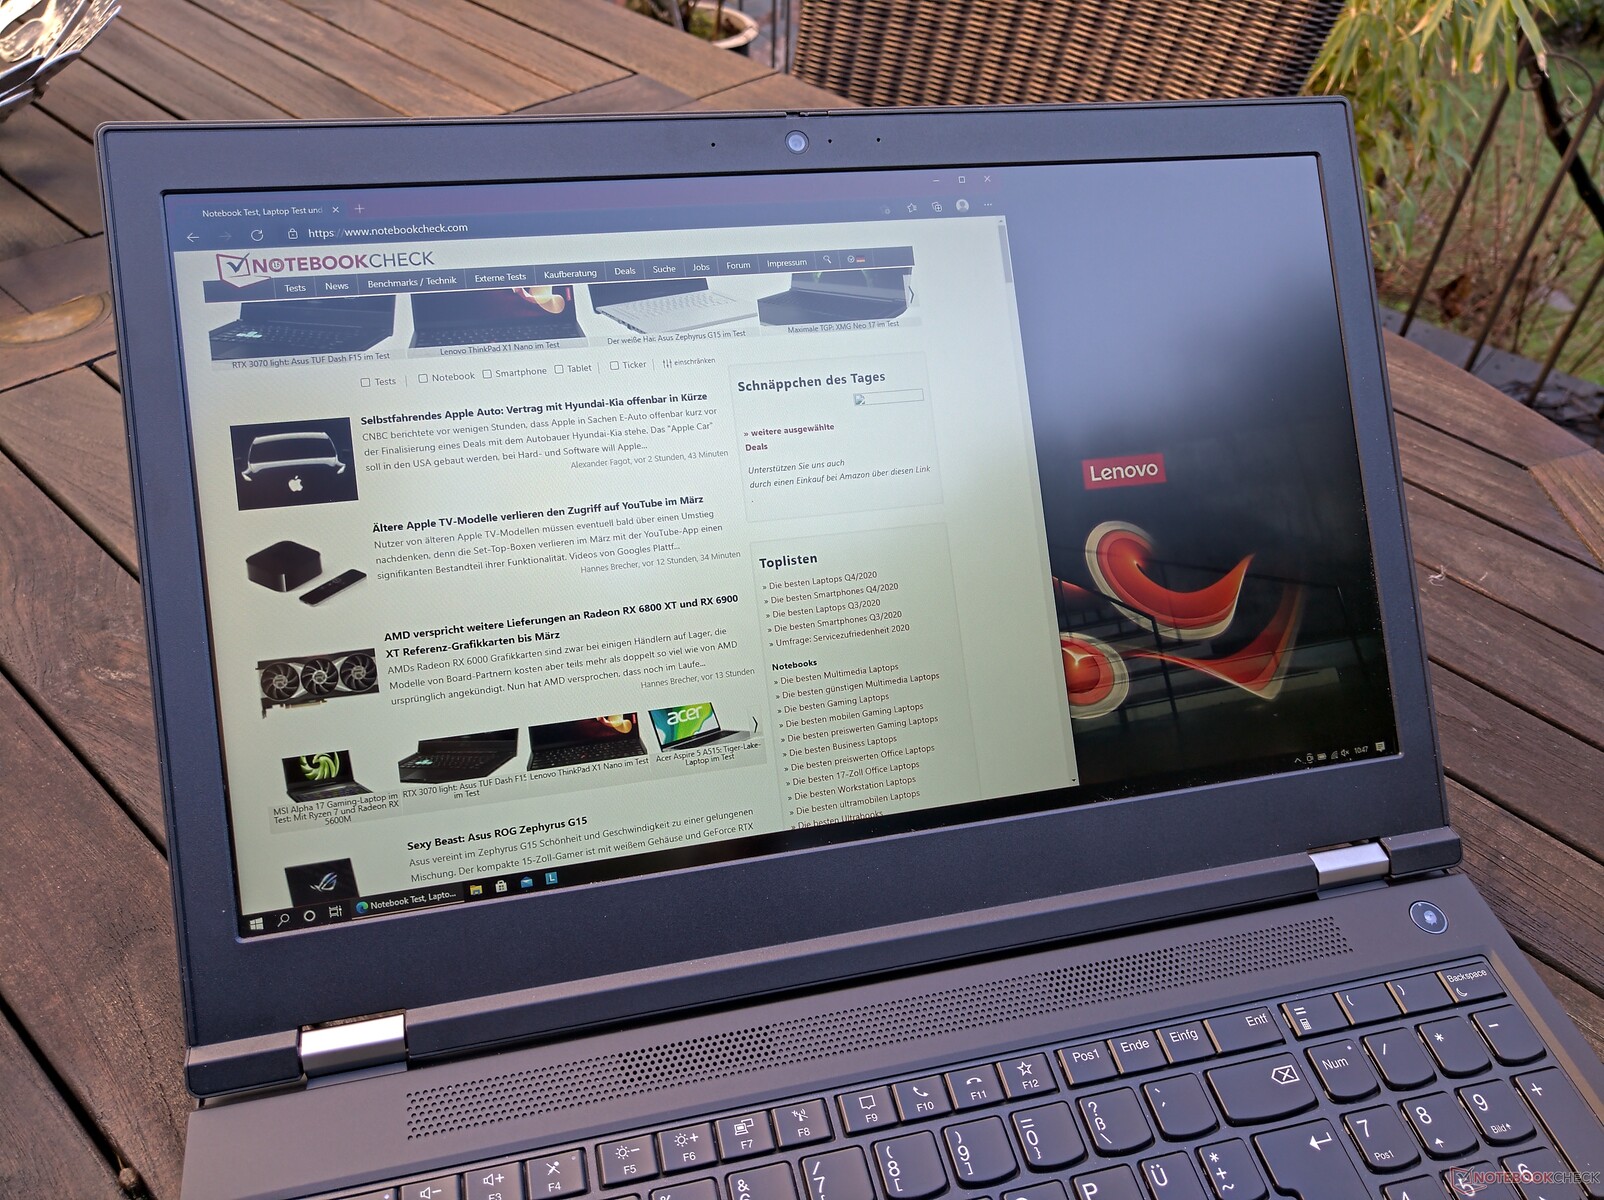
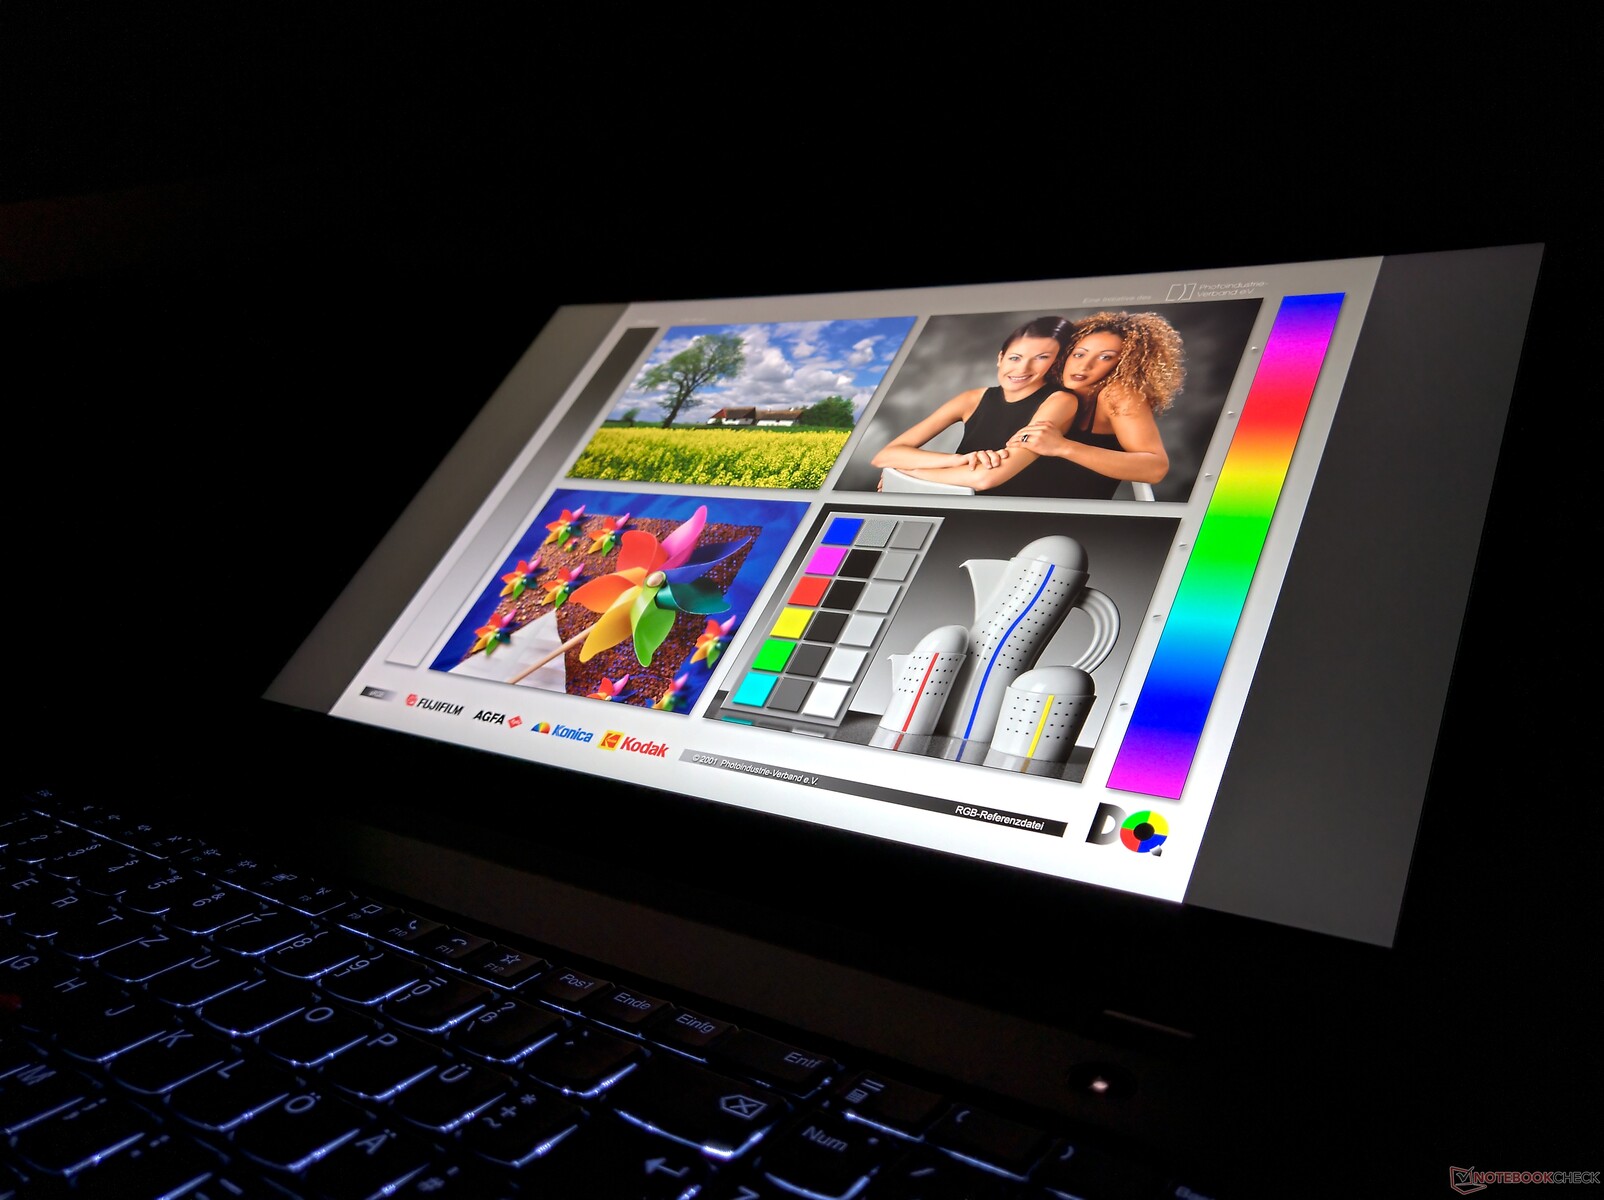
Mentre in generale si può usare il Lenovo ThinkPad P15 Gen 1 anche all'aperto, questo è solo il caso all'ombra o nelle giornate nuvolose. Per la luce diretta del sole, avrebbe bisogno di una maggiore luminosità.
Tempi di risposta del Display
| ↔ Tempi di risposta dal Nero al Bianco | ||
|---|---|---|
| 32.8 ms ... aumenta ↗ e diminuisce ↘ combinato | ↗ 18.8 ms Incremento | 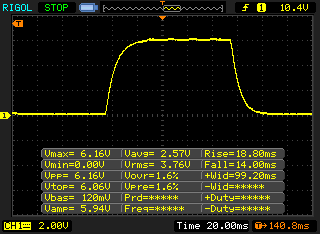 |
| ↘ 14 ms Calo | ||
| Lo schermo mostra tempi di risposta lenti nei nostri tests e sarà insoddisfacente per i gamers. In confronto, tutti i dispositivi di test variano da 0.1 (minimo) a 240 (massimo) ms. » 88 % di tutti i dispositivi è migliore. Questo significa che i tempi di risposta rilevati sono peggiori rispetto alla media di tutti i dispositivi testati (19.8 ms). | ||
| ↔ Tempo di risposta dal 50% Grigio all'80% Grigio | ||
| 41.2 ms ... aumenta ↗ e diminuisce ↘ combinato | ↗ 22 ms Incremento | 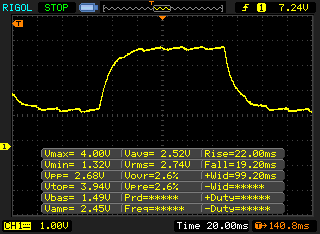 |
| ↘ 19.2 ms Calo | ||
| Lo schermo mostra tempi di risposta lenti nei nostri tests e sarà insoddisfacente per i gamers. In confronto, tutti i dispositivi di test variano da 0.165 (minimo) a 636 (massimo) ms. » 66 % di tutti i dispositivi è migliore. Questo significa che i tempi di risposta rilevati sono peggiori rispetto alla media di tutti i dispositivi testati (30.9 ms). | ||
Sfarfallio dello schermo / PWM (Pulse-Width Modulation)
| flickering dello schermo / PWM rilevato | 24270 Hz | 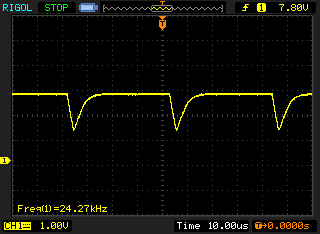 | |
Il display sfarfalla a 24270 Hz (Probabilmente a causa dell'uso di PWM) . La frequenza di 24270 Hz è abbastanza alta, quindi la maggioranza degli utenti sensibili al PWM non dovrebbero notare alcun flickering. In confronto: 52 % di tutti i dispositivi testati non utilizza PWM per ridurre la luminosita' del display. Se è rilevato PWM, una media di 7741 (minimo: 5 - massimo: 343500) Hz è stata rilevata. | |||
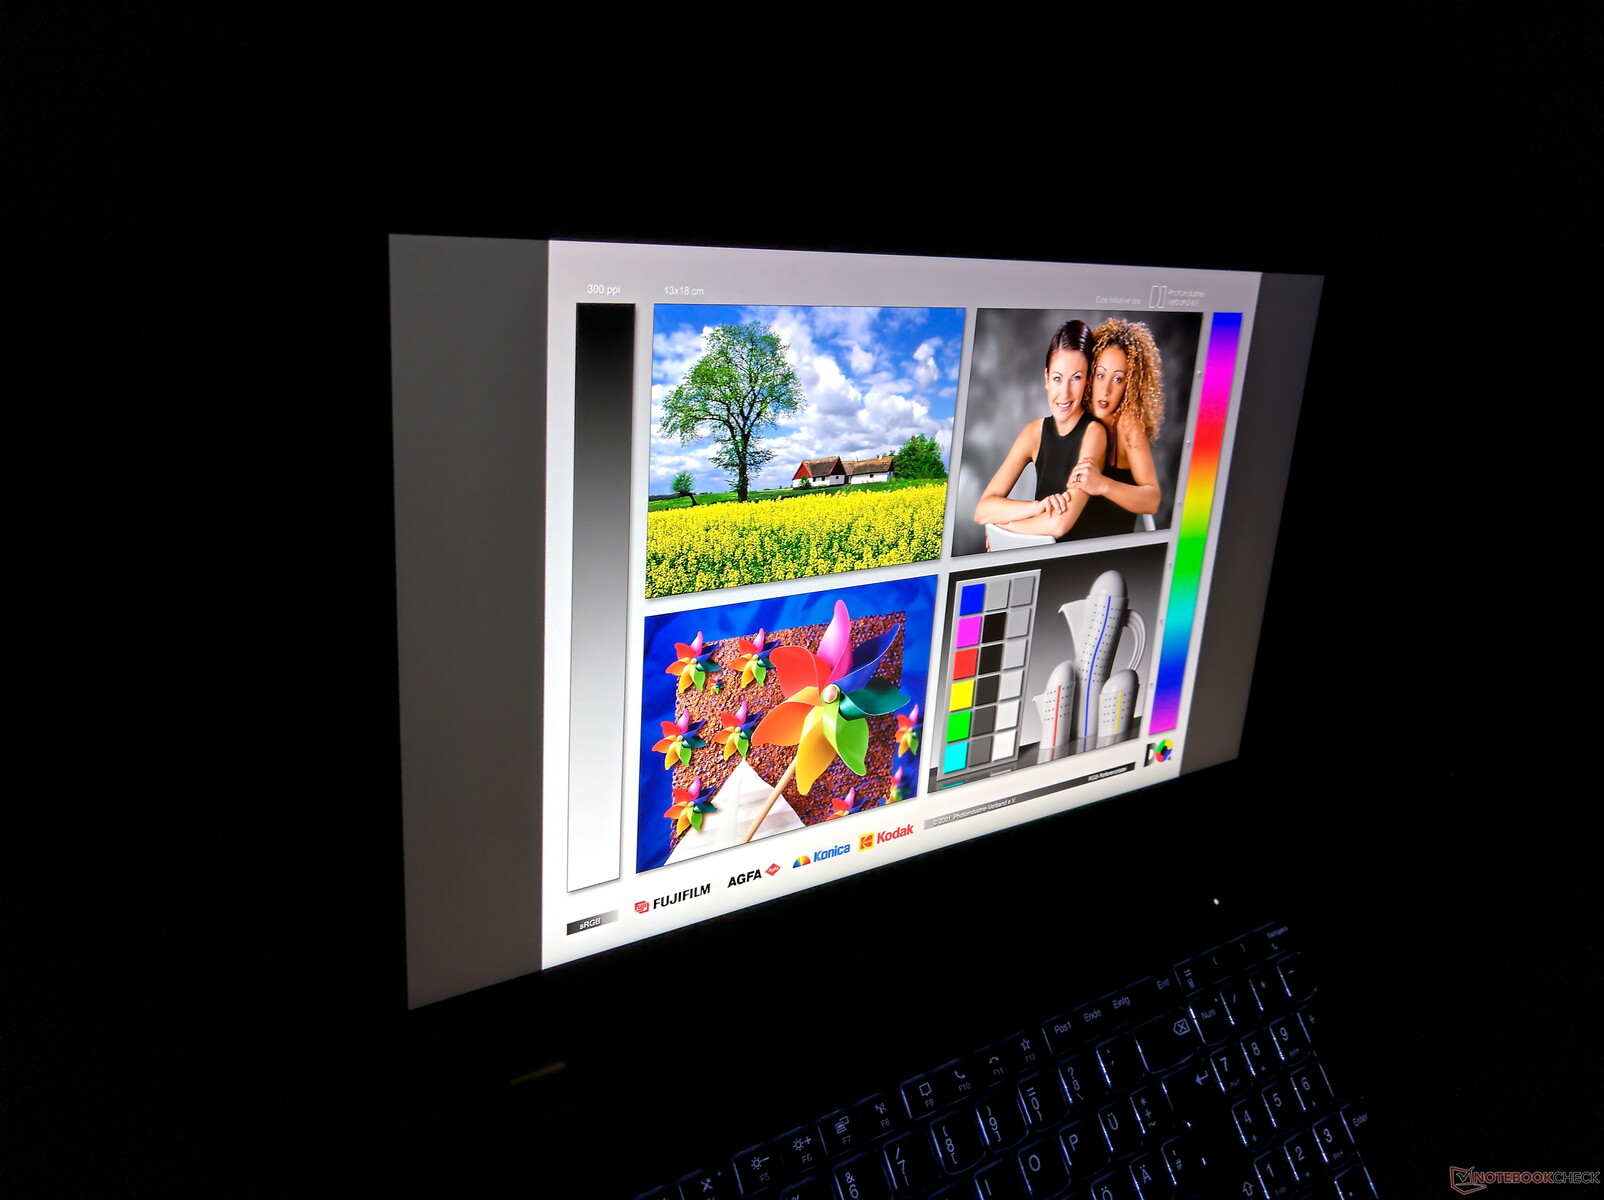
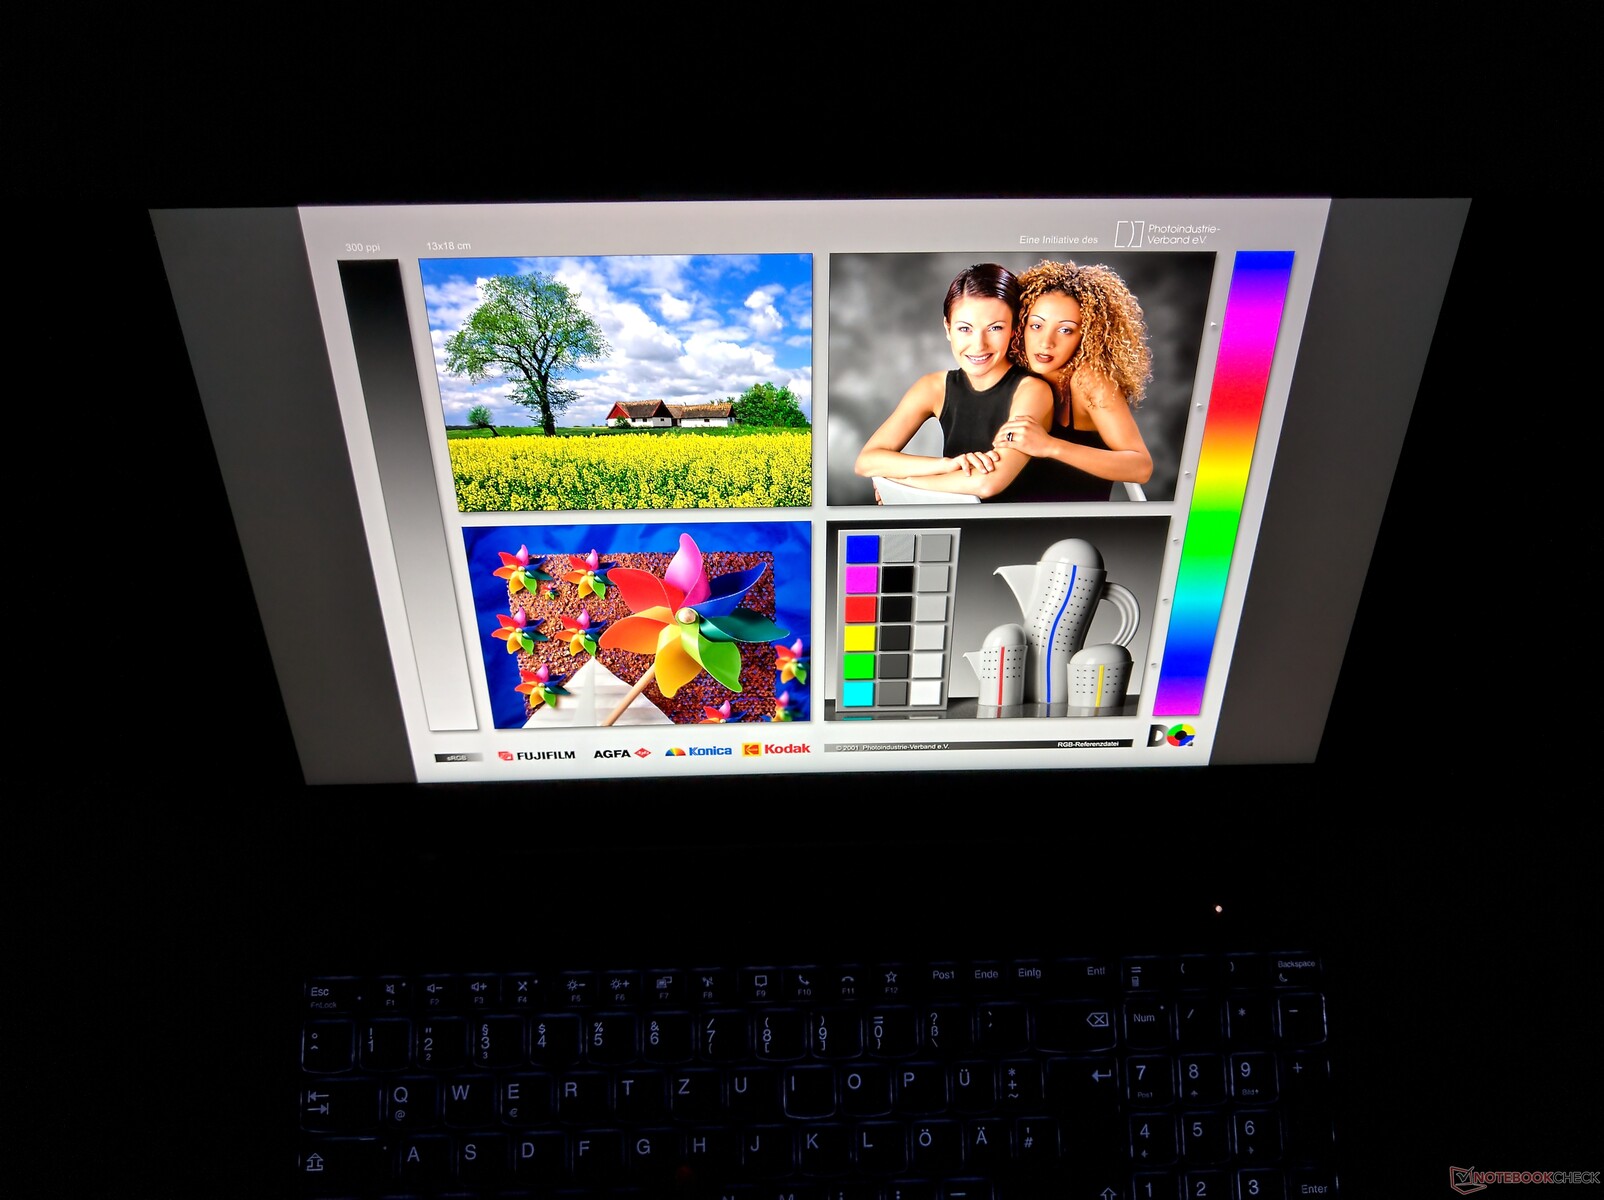
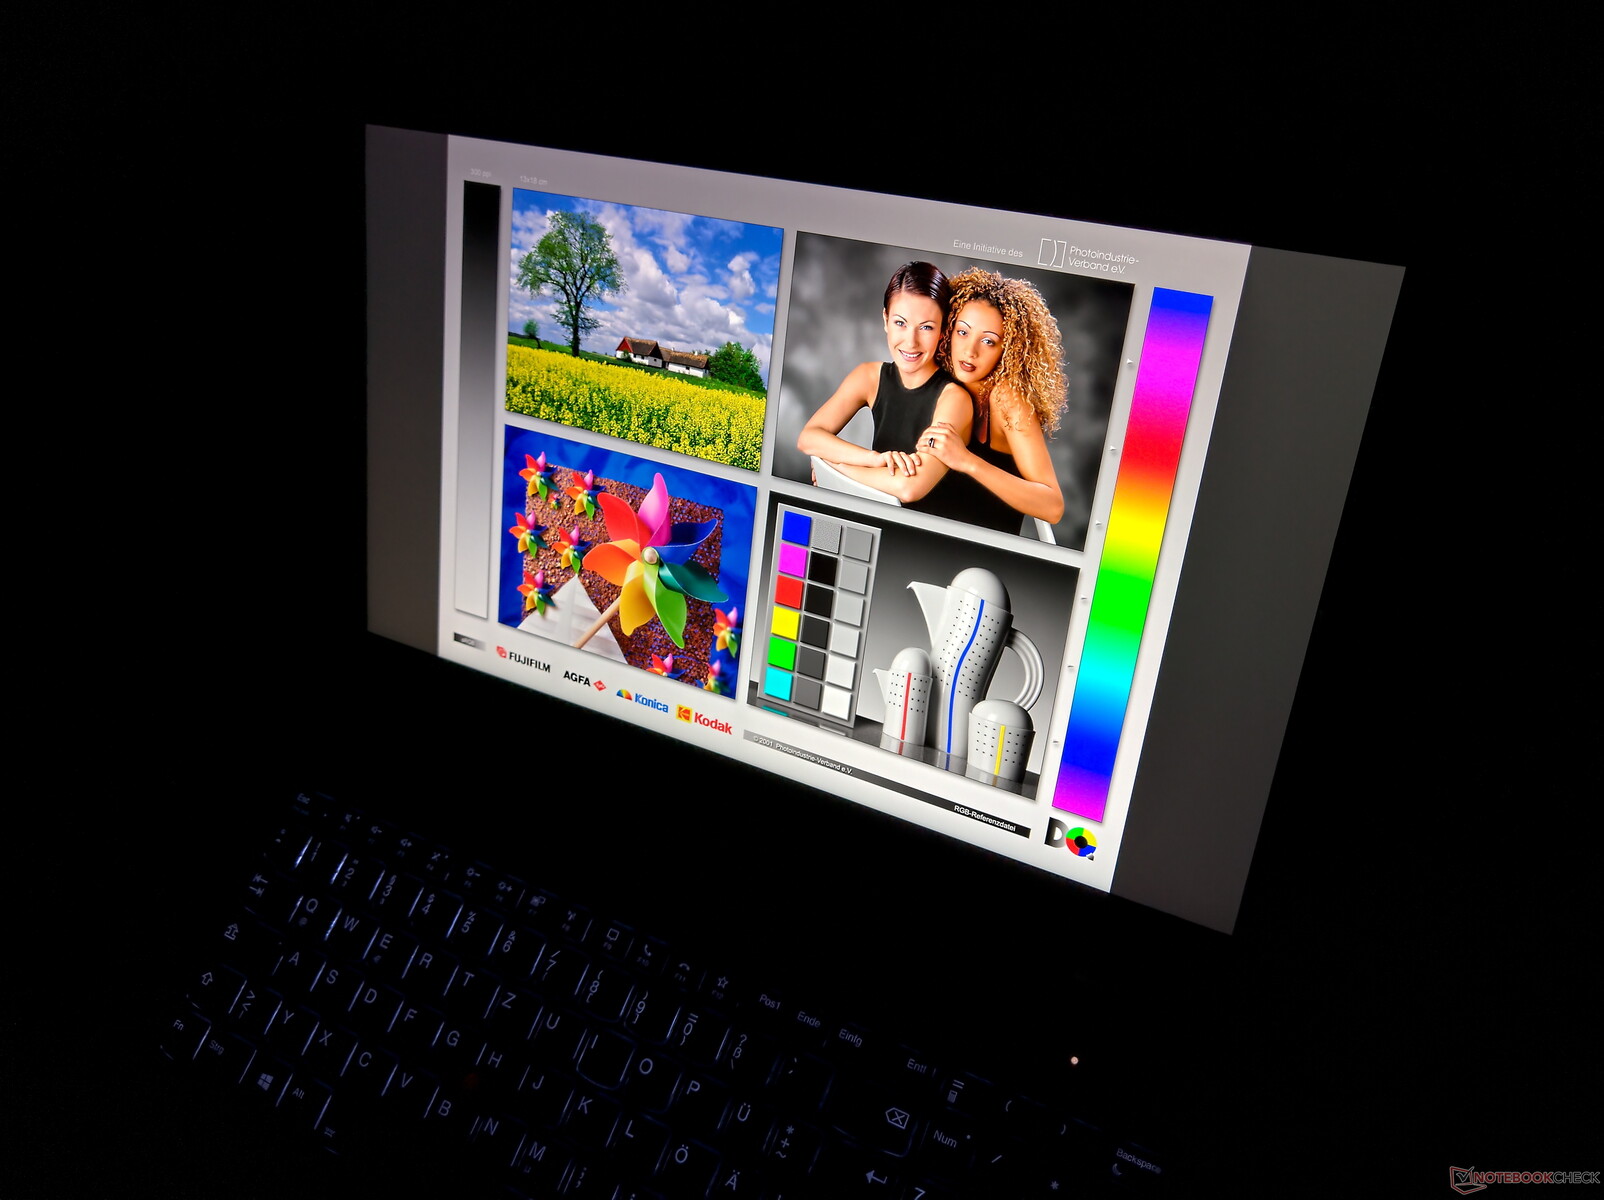
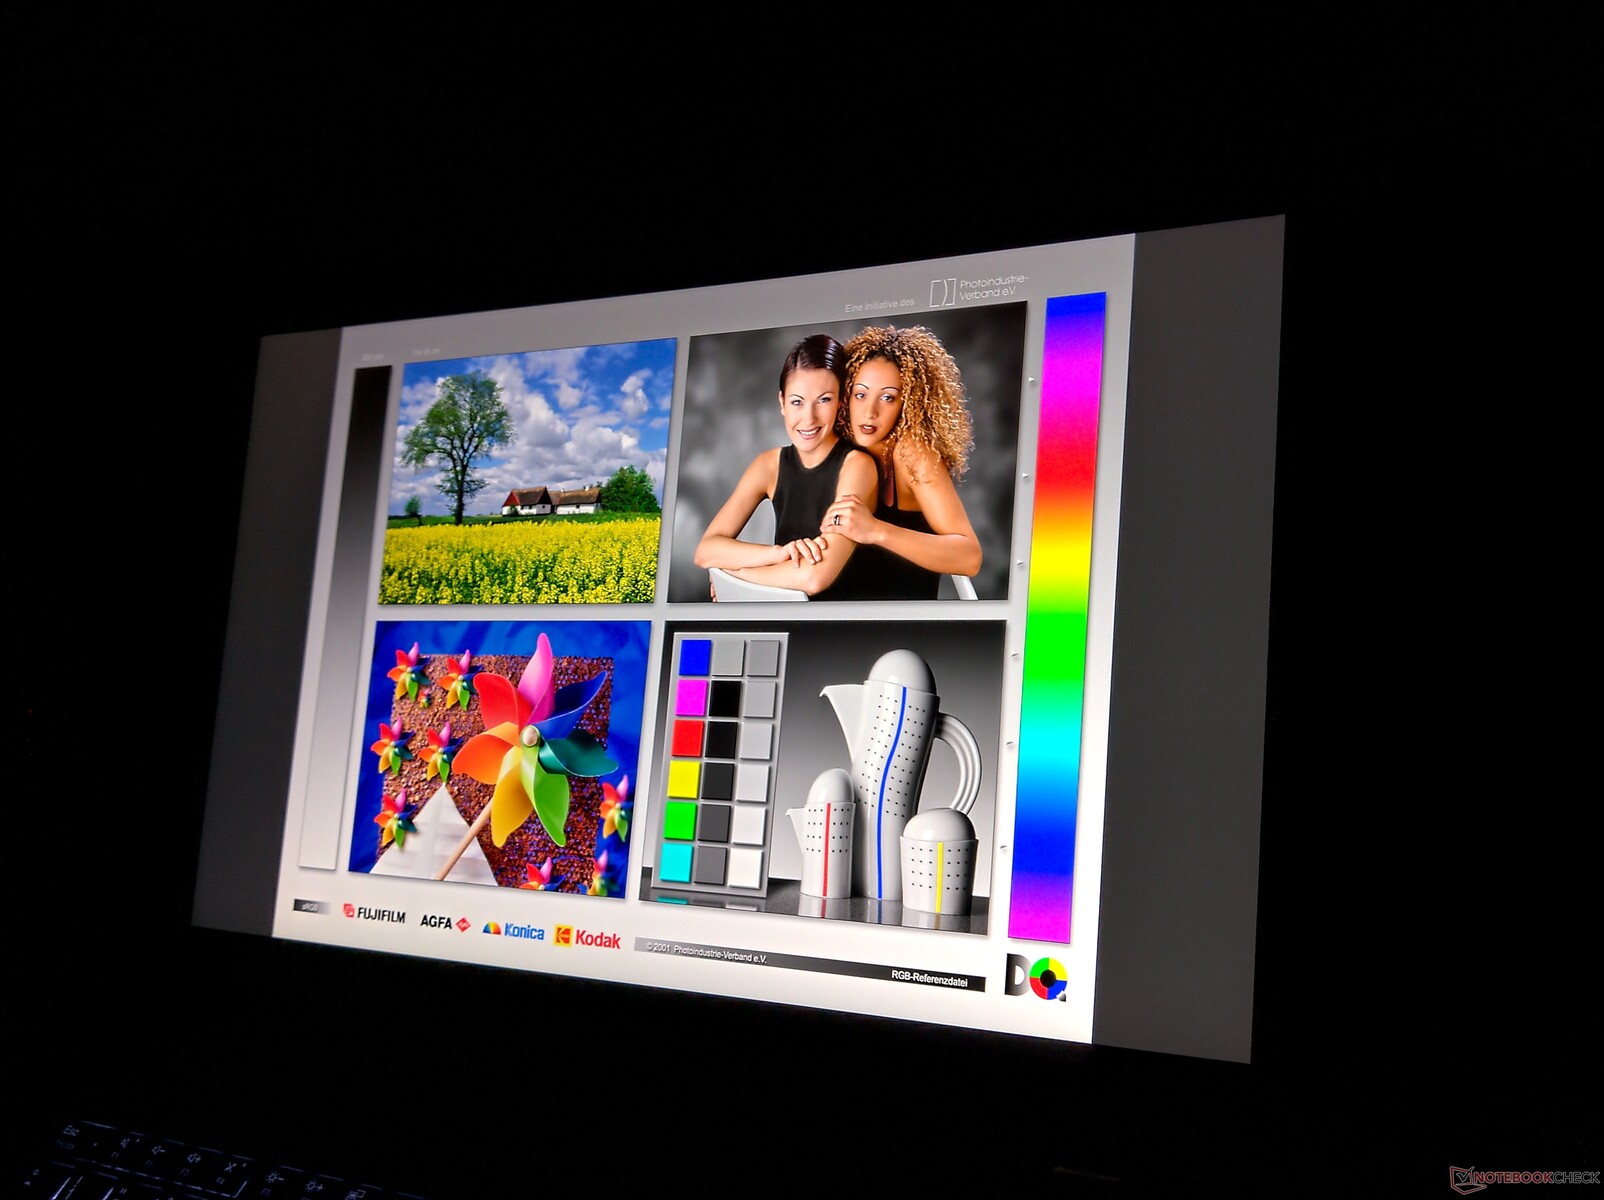
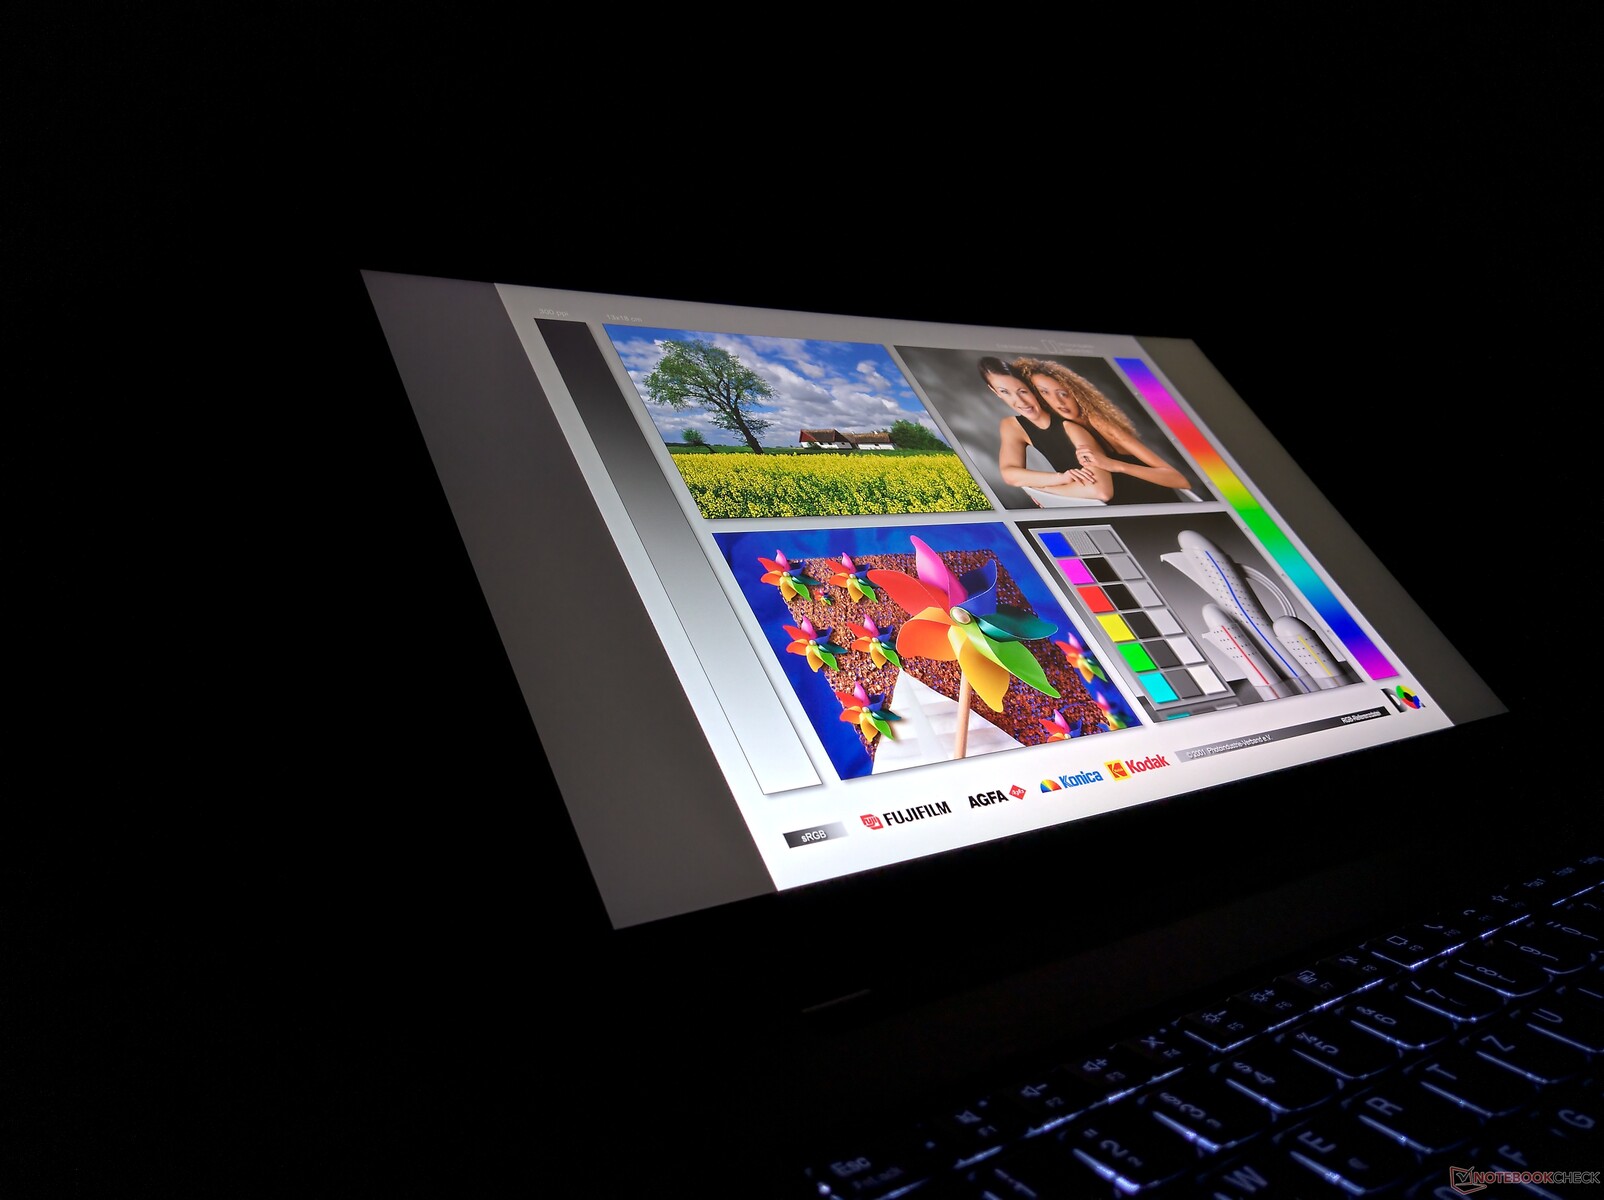
La stabilità dell'angolo di visualizzazione del display IPS non offre motivi di critica.
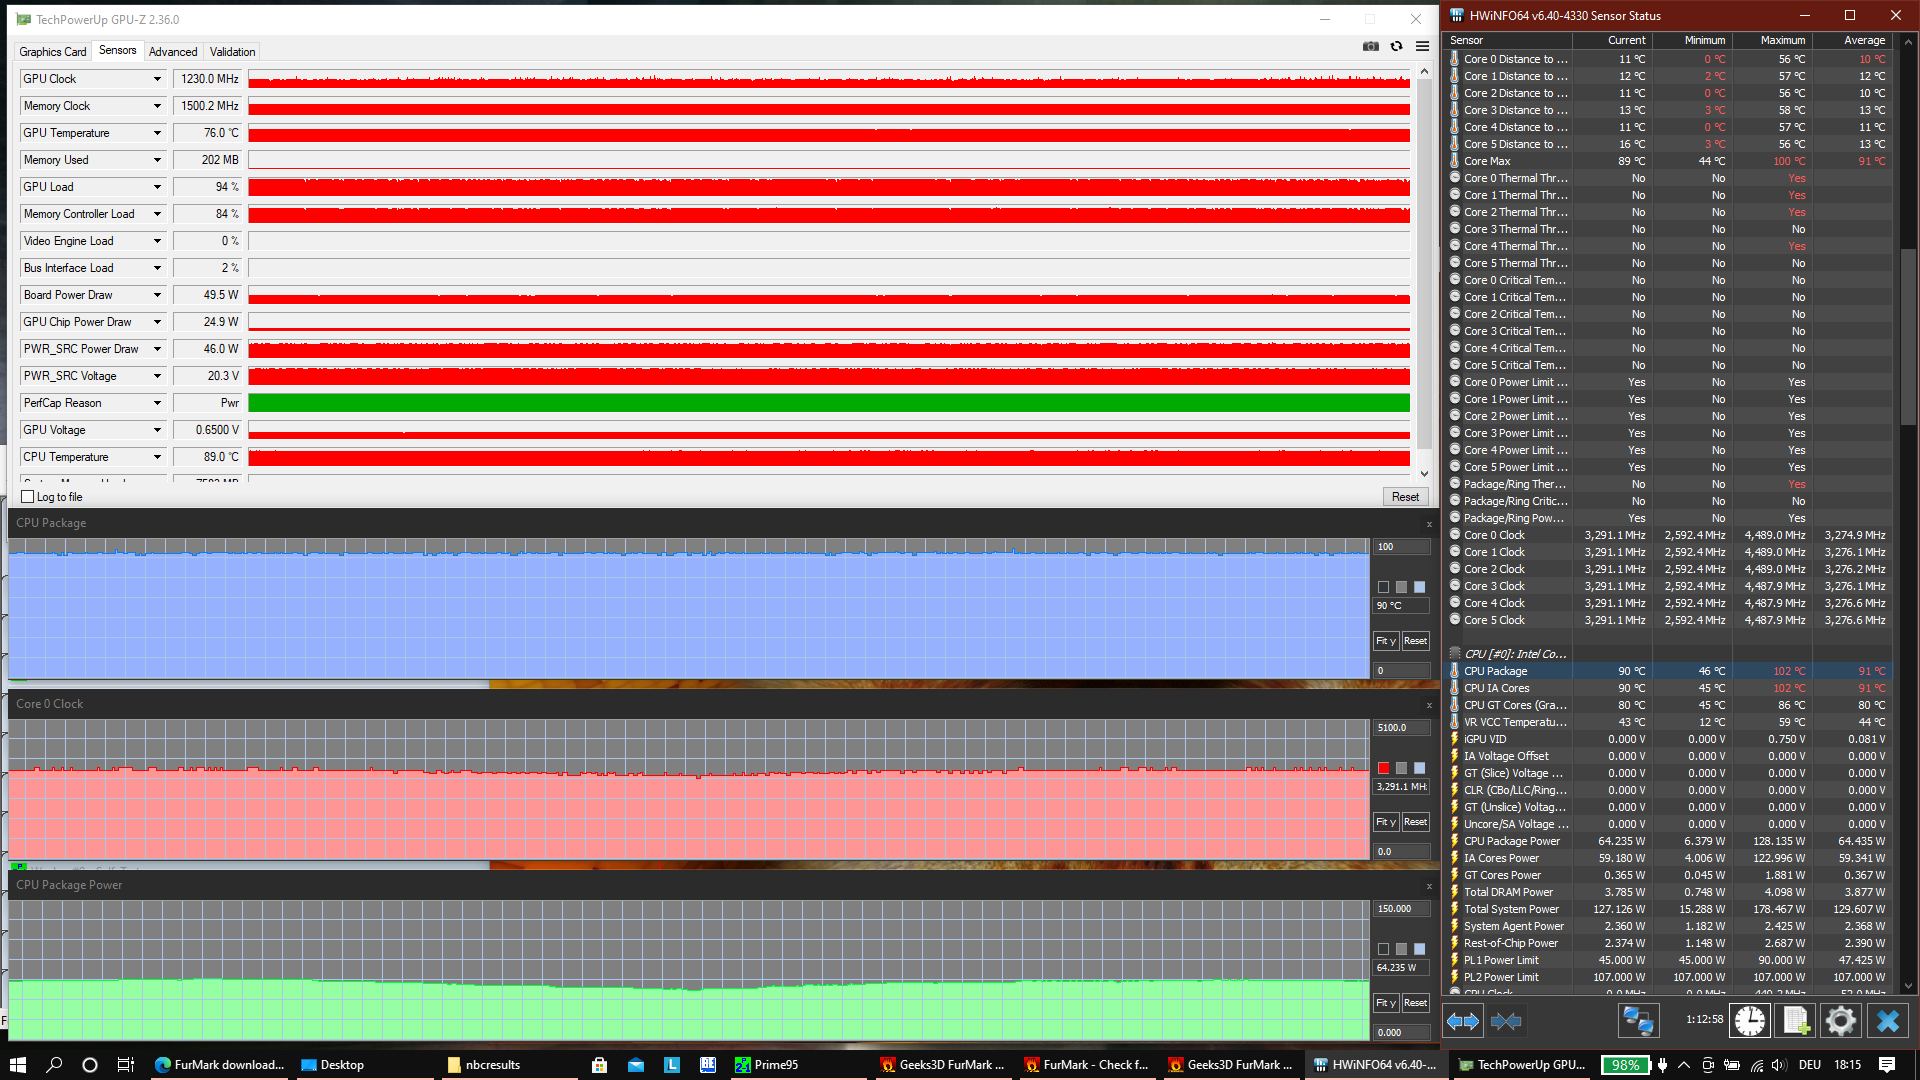
Prestazioni: La CPU del portatile Lenovo può consumare più di 100 watt
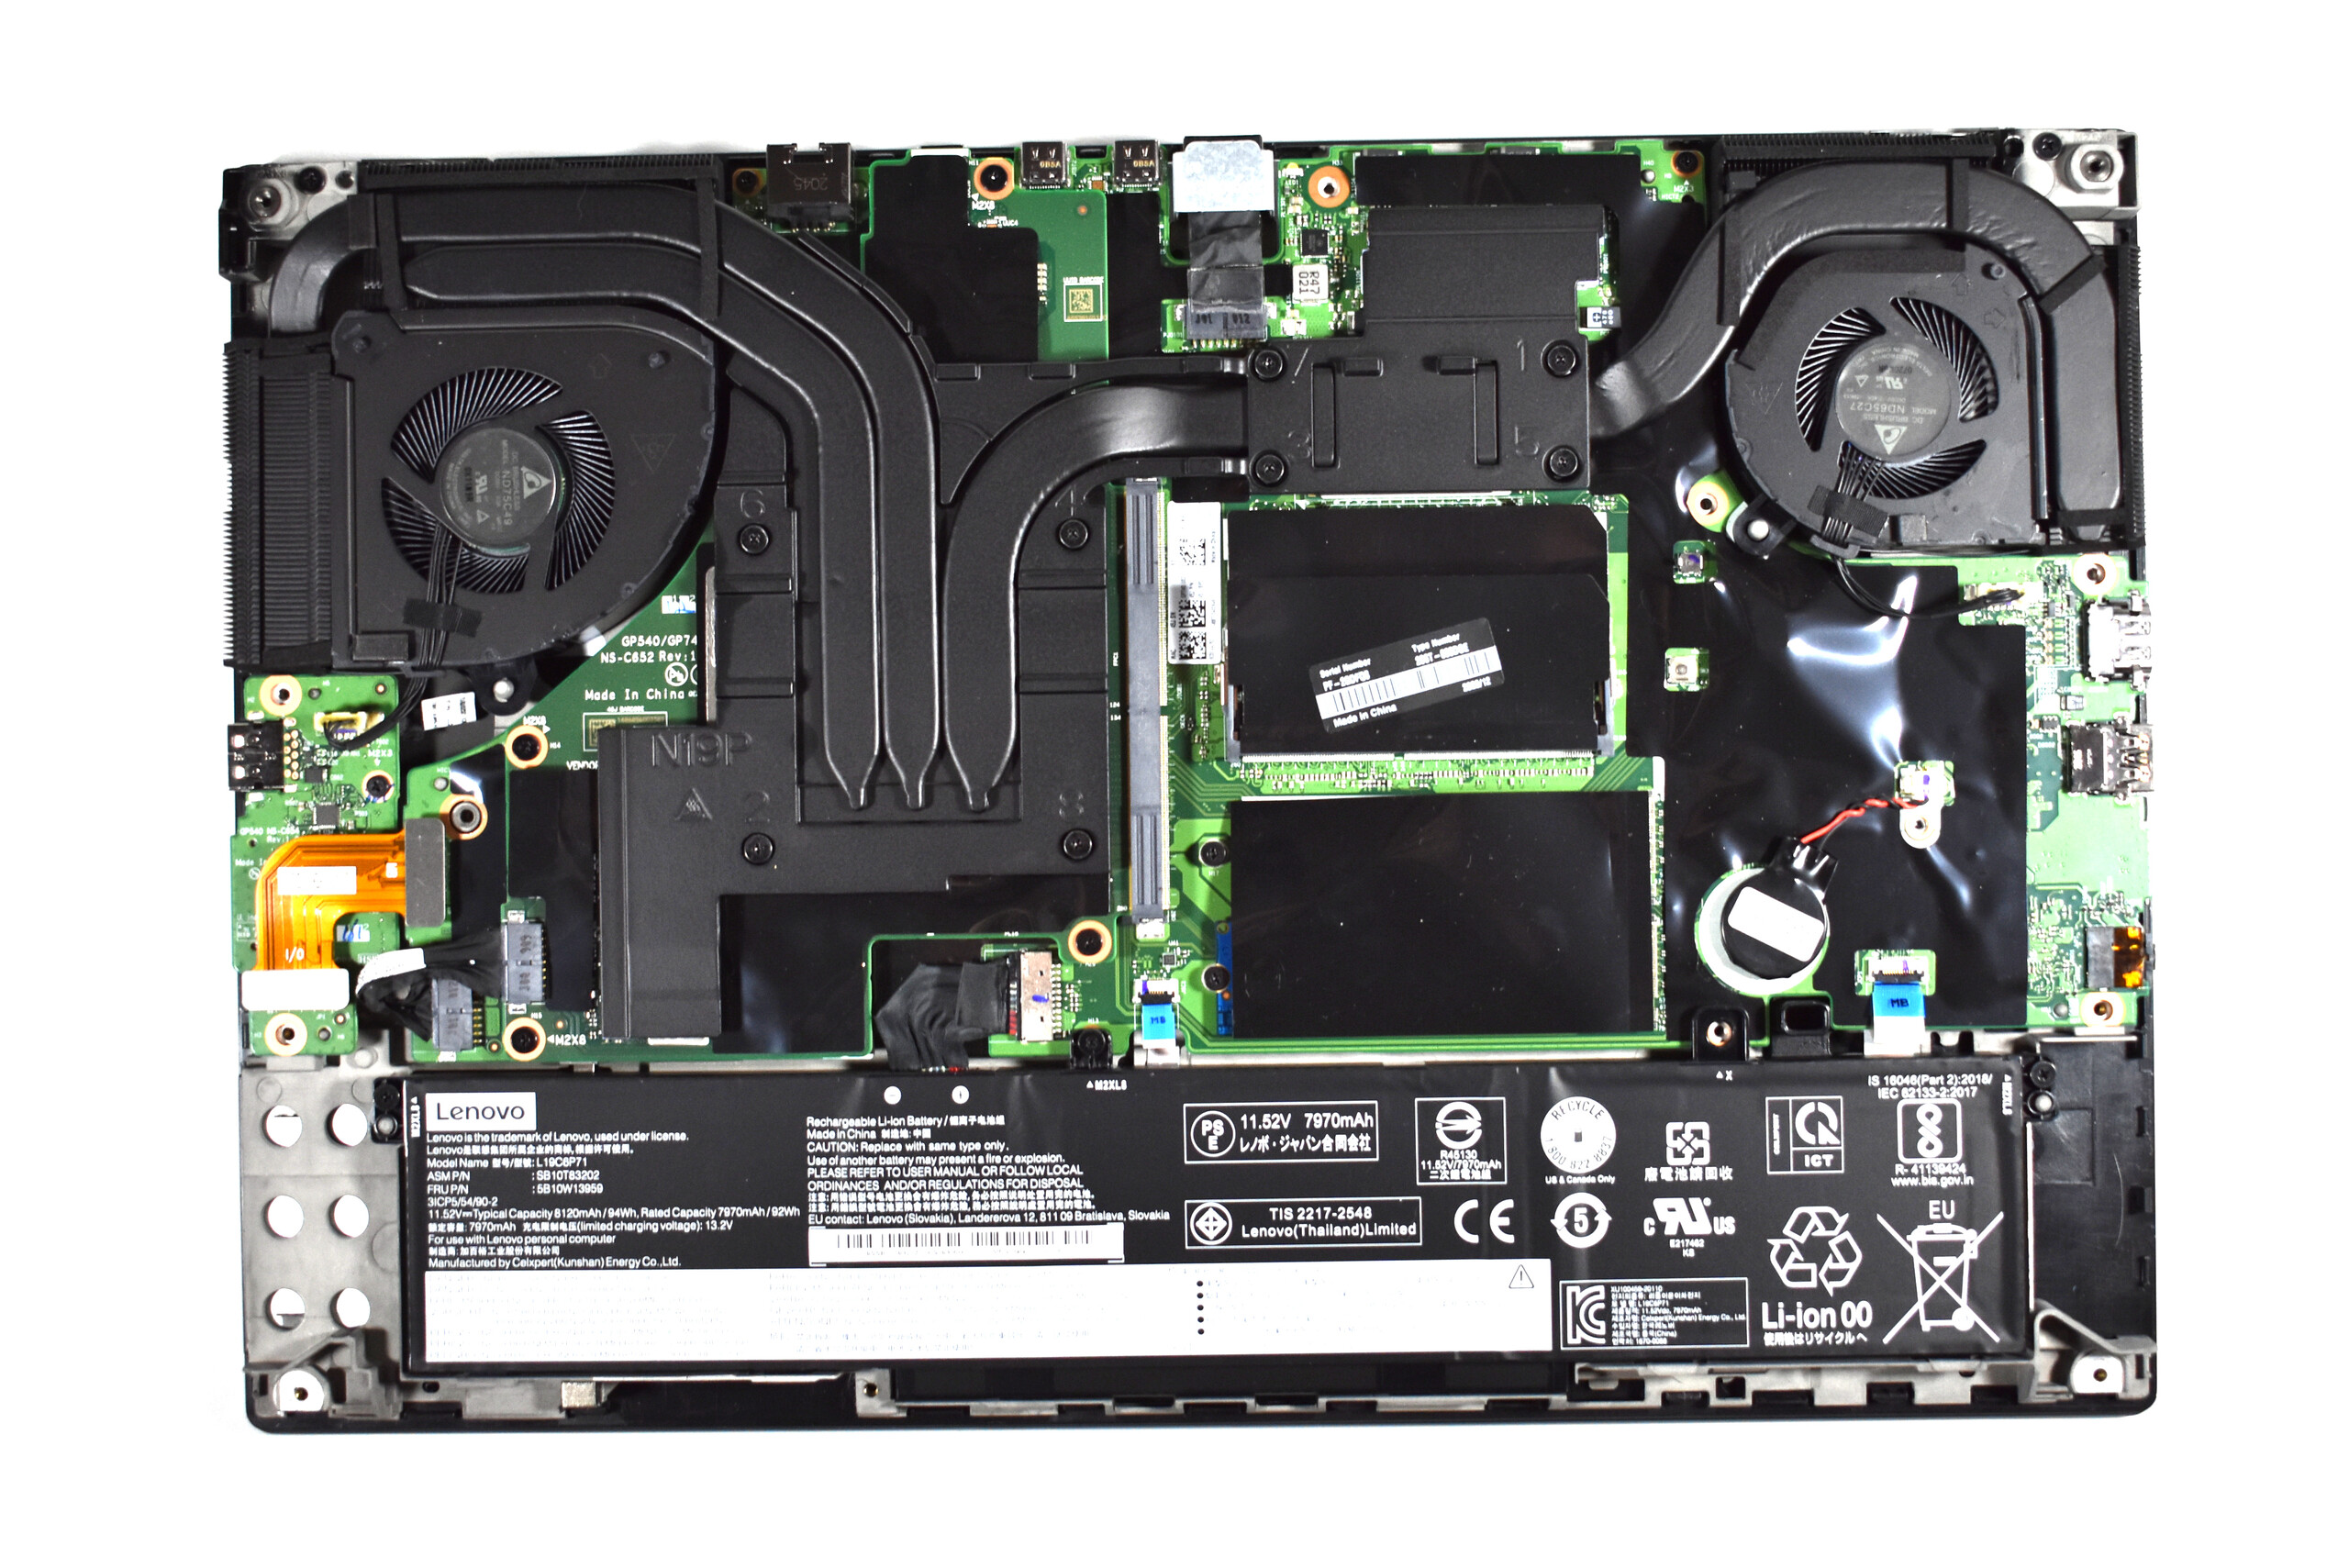
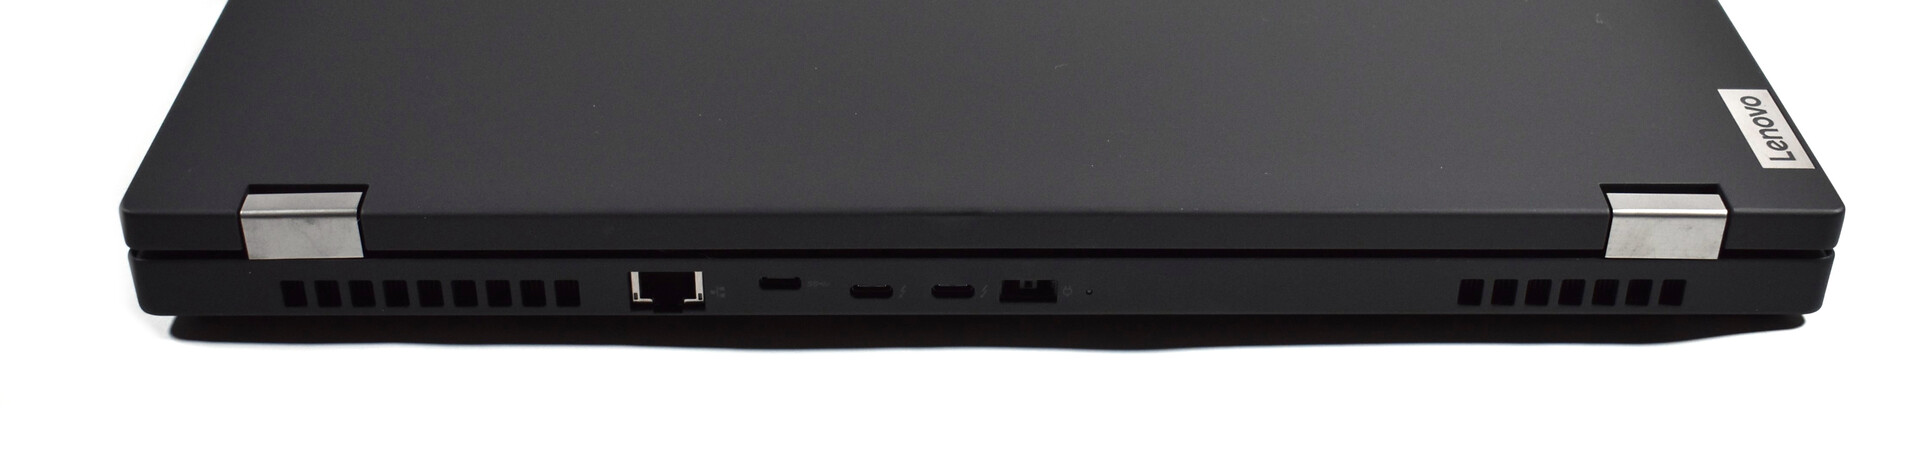
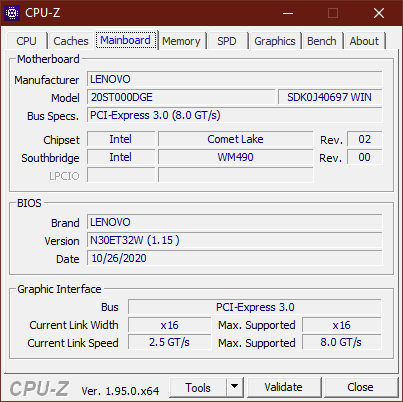
Un miglioramento centrale rispetto al ThinkPad P53 è il fatto che le opzioni GPU non sono più legate alle CPU, perché i chip grafici non sono saldati sulla scheda madre ma integrati tramite una scheda separata. Questo significa che qualsiasi GPU professionale della generazione Nvidia Turing (Quadro T1000, T2000, RTX 3000, RTX 4000 Max-Q, RTX 5000 Max-Q) può essere combinata con tutte le CPU Intel disponibili della serie "Comet Lake H" (Core i5-10400H, i7-10750H, i7-10850H, i7-10875H, i9-10885H, i9-10980HK, Xeon W-10855M, W-10885M).
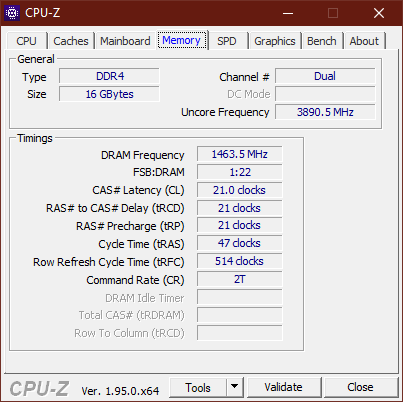
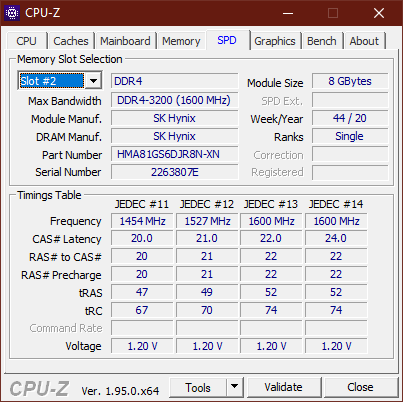
La RAM può essere completamente aggiornata, e i quattro slot SO-DIMM DDR4-2933 consentono un massimo di 128 GB - nei modelli Xeon anche come memoria ECC. Per quanto riguarda la soluzione di archiviazione, sono rimasti solo due SSD M.2-2280, mentre il predecessore ne permetteva ancora tre, oltre a offrire alcune opzioni HDD per alcuni modelli.
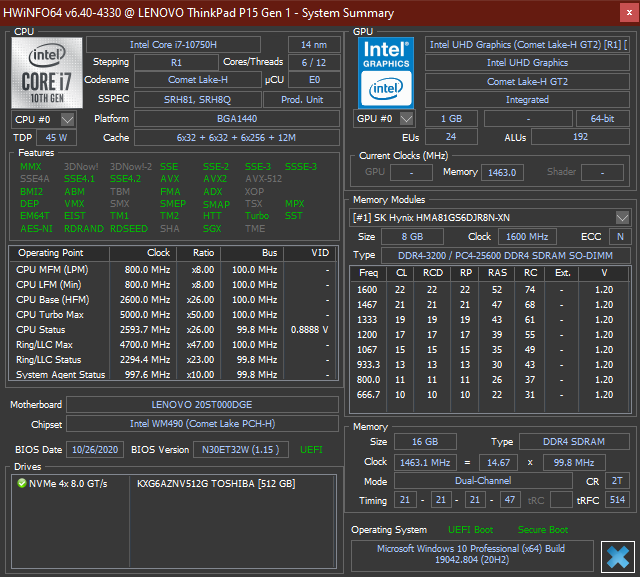
Processore
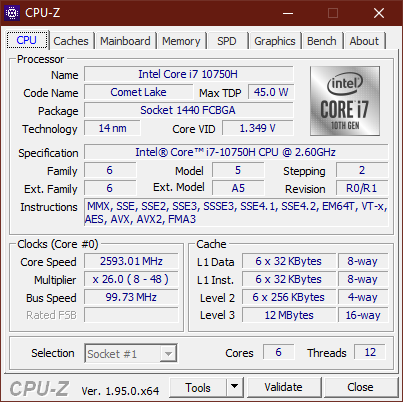
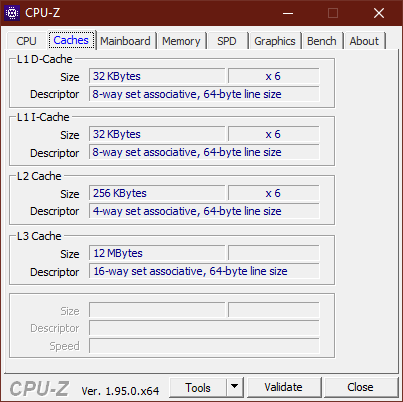
L'Intel Core i7-10750H appartiene alla serie "Comet Lake H" di Intel ed è probabilmente uno degli ultimi chip a 14 nanometri in un portatile. I sei cores con un TDP nominale di 45 watts hanno una velocità di clock massima teorica di 5 GHz (velocità di clock di base: 2.6 GHz). La nostra lista di CPU può aiutarvi a confrontare ulteriori benchmarks.
Con quasi 130 watt (boost breve) e 75 watt (costante) sotto carico multicore, il processore del ThinkPad P15 può consumare molto più di 45 watt. Mentre questo contribuisce ad una buona prestazione della CPU, non può ancora competere con le CPU octa-core. Inoltre, la CPU è abbastanza inefficiente, e il considerevolmente più efficiente AMD Ryzen 7 Pro 4750U nell'economico ThinkPad L15 è più veloce sotto carico su tutti i cores.
Quando si utilizza la batteria, le prestazioni della CPU sono limitate con un consumo massimo di 65 watt. A 1172 punti, il risultato del CB15 multicore è inferiore di circa il 10%
Cinebench R15: CPU Single 64Bit | CPU Multi 64Bit
Blender: v2.79 BMW27 CPU
7-Zip 18.03: 7z b 4 -mmt1 | 7z b 4
Geekbench 5.5: Single-Core | Multi-Core
HWBOT x265 Benchmark v2.2: 4k Preset
LibreOffice : 20 Documents To PDF
R Benchmark 2.5: Overall mean
| Cinebench R20 / CPU (Single Core) | |
| Media della classe Workstation (671 - 857, n=22, ultimi 2 anni) | |
| HP ZBook Fury 15 G7 | |
| HP ZBook Fury 15 G7 | |
| Lenovo ThinkPad P15 Gen1-20ST000DGE | |
| Dell Precision 7550 | |
| Lenovo ThinkPad T15g-20UR000GGE | |
| Media Intel Core i7-10750H (431 - 504, n=43) | |
| Lenovo ThinkPad T15p-20TN0006GE | |
| Cinebench R20 / CPU (Multi Core) | |
| Media della classe Workstation (5760 - 15043, n=22, ultimi 2 anni) | |
| Dell Precision 7550 | |
| HP ZBook Fury 15 G7 | |
| HP ZBook Fury 15 G7 | |
| Lenovo ThinkPad P15 Gen1-20ST000DGE | |
| Lenovo ThinkPad T15p-20TN0006GE | |
| Lenovo ThinkPad T15g-20UR000GGE | |
| Media Intel Core i7-10750H (1749 - 3325, n=43) | |
| Cinebench R15 / CPU Single 64Bit | |
| Media della classe Workstation (191.4 - 328, n=22, ultimi 2 anni) | |
| HP ZBook Fury 15 G7 | |
| HP ZBook Fury 15 G7 | |
| Dell Precision 7550 | |
| Lenovo ThinkPad P15 Gen1-20ST000DGE | |
| Lenovo ThinkPad T15g-20UR000GGE | |
| Lenovo ThinkPad T15p-20TN0006GE | |
| Media Intel Core i7-10750H (184 - 213, n=45) | |
| Lenovo ThinkPad P53-20QN000YGE | |
| Cinebench R15 / CPU Multi 64Bit | |
| Media della classe Workstation (2489 - 5810, n=22, ultimi 2 anni) | |
| Dell Precision 7550 | |
| HP ZBook Fury 15 G7 | |
| HP ZBook Fury 15 G7 | |
| Lenovo ThinkPad P15 Gen1-20ST000DGE | |
| Lenovo ThinkPad T15g-20UR000GGE | |
| Lenovo ThinkPad T15p-20TN0006GE | |
| Media Intel Core i7-10750H (804 - 1418, n=50) | |
| Lenovo ThinkPad P53-20QN000YGE | |
| Blender / v2.79 BMW27 CPU | |
| Lenovo ThinkPad P53-20QN000YGE | |
| HP ZBook Fury 15 G7 | |
| Media Intel Core i7-10750H (322 - 587, n=43) | |
| Lenovo ThinkPad T15p-20TN0006GE | |
| Lenovo ThinkPad P15 Gen1-20ST000DGE | |
| Lenovo ThinkPad T15g-20UR000GGE | |
| Dell Precision 7550 | |
| Media della classe Workstation (91 - 222, n=22, ultimi 2 anni) | |
| 7-Zip 18.03 / 7z b 4 -mmt1 | |
| Media della classe Workstation (5126 - 6895, n=22, ultimi 2 anni) | |
| HP ZBook Fury 15 G7 | |
| Dell Precision 7550 | |
| Lenovo ThinkPad T15g-20UR000GGE | |
| Lenovo ThinkPad P15 Gen1-20ST000DGE | |
| Media Intel Core i7-10750H (4504 - 5470, n=43) | |
| Lenovo ThinkPad P53-20QN000YGE | |
| Lenovo ThinkPad T15p-20TN0006GE | |
| 7-Zip 18.03 / 7z b 4 | |
| Media della classe Workstation (60489 - 116969, n=22, ultimi 2 anni) | |
| Dell Precision 7550 | |
| Lenovo ThinkPad T15g-20UR000GGE | |
| Lenovo ThinkPad P15 Gen1-20ST000DGE | |
| HP ZBook Fury 15 G7 | |
| Lenovo ThinkPad T15p-20TN0006GE | |
| Media Intel Core i7-10750H (26040 - 37345, n=43) | |
| Lenovo ThinkPad P53-20QN000YGE | |
| Geekbench 5.5 / Single-Core | |
| Media della classe Workstation (1783 - 2183, n=22, ultimi 2 anni) | |
| HP ZBook Fury 15 G7 | |
| Dell Precision 7550 | |
| Lenovo ThinkPad T15g-20UR000GGE | |
| Lenovo ThinkPad P15 Gen1-20ST000DGE | |
| Media Intel Core i7-10750H (1114 - 1333, n=43) | |
| Lenovo ThinkPad T15p-20TN0006GE | |
| Geekbench 5.5 / Multi-Core | |
| Media della classe Workstation (11542 - 25554, n=22, ultimi 2 anni) | |
| Dell Precision 7550 | |
| HP ZBook Fury 15 G7 | |
| Lenovo ThinkPad T15g-20UR000GGE | |
| Lenovo ThinkPad P15 Gen1-20ST000DGE | |
| Media Intel Core i7-10750H (4443 - 6674, n=43) | |
| Lenovo ThinkPad T15p-20TN0006GE | |
| HWBOT x265 Benchmark v2.2 / 4k Preset | |
| Media della classe Workstation (17.8 - 40.5, n=22, ultimi 2 anni) | |
| Dell Precision 7550 | |
| Lenovo ThinkPad T15g-20UR000GGE | |
| Lenovo ThinkPad P15 Gen1-20ST000DGE | |
| Media Intel Core i7-10750H (5.54 - 11.6, n=43) | |
| Lenovo ThinkPad T15p-20TN0006GE | |
| Lenovo ThinkPad P53-20QN000YGE | |
| HP ZBook Fury 15 G7 | |
| LibreOffice / 20 Documents To PDF | |
| HP ZBook Fury 15 G7 | |
| Lenovo ThinkPad P15 Gen1-20ST000DGE | |
| Media Intel Core i7-10750H (43.1 - 99.2, n=43) | |
| Lenovo ThinkPad T15g-20UR000GGE | |
| Media della classe Workstation (37.1 - 74.7, n=22, ultimi 2 anni) | |
| Dell Precision 7550 | |
| Lenovo ThinkPad T15p-20TN0006GE | |
| R Benchmark 2.5 / Overall mean | |
| Lenovo ThinkPad T15p-20TN0006GE | |
| Lenovo ThinkPad P15 Gen1-20ST000DGE | |
| Media Intel Core i7-10750H (0.578 - 0.708, n=42) | |
| Lenovo ThinkPad T15g-20UR000GGE | |
| Dell Precision 7550 | |
| HP ZBook Fury 15 G7 | |
| Media della classe Workstation (0.395 - 0.603, n=22, ultimi 2 anni) | |
* ... Meglio usare valori piccoli
Prestazioni di sistema
Con i suoi potenti componenti, il ThinkPad P15 non mostra alcuna debolezza nelle prestazioni del sistema.
| PCMark 10 Score | 5620 punti | |
Aiuto | ||
Latenze DPC
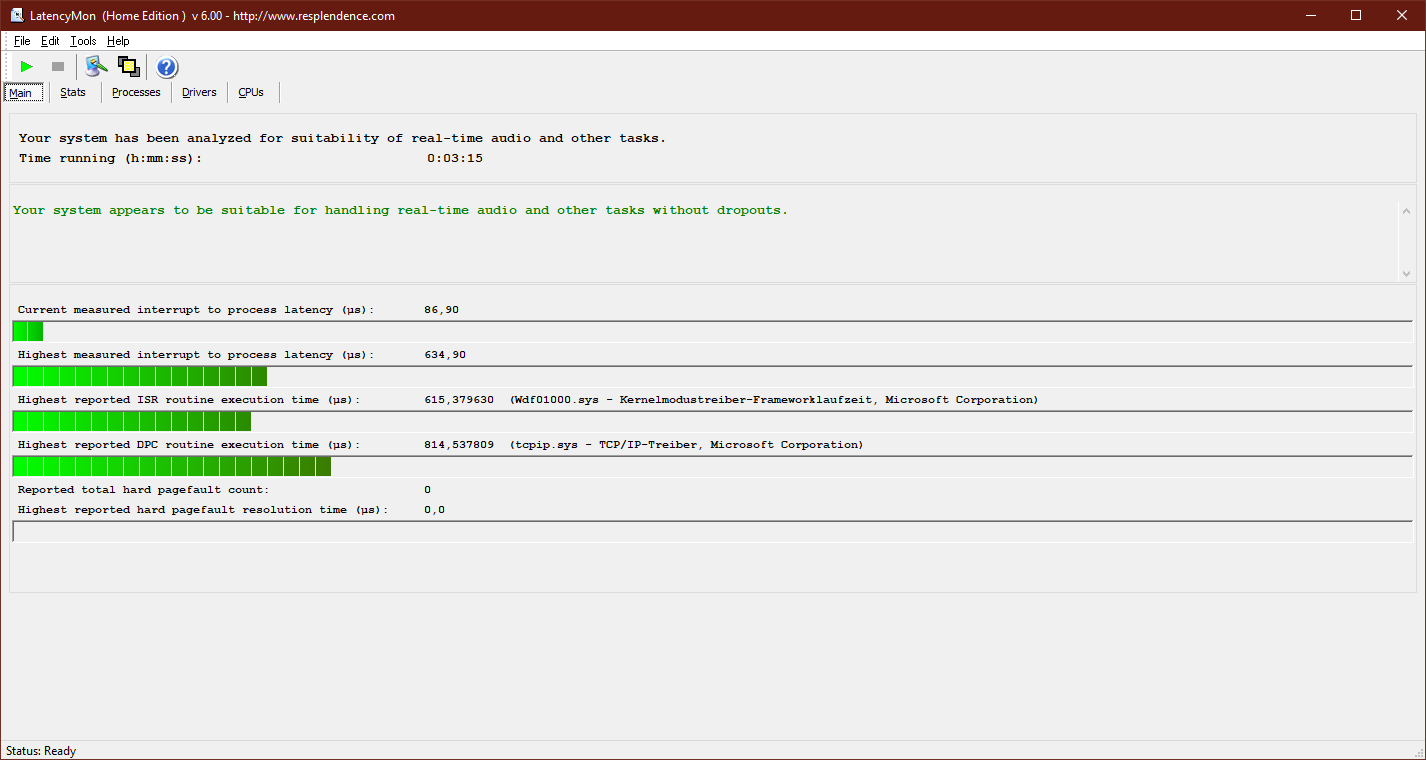
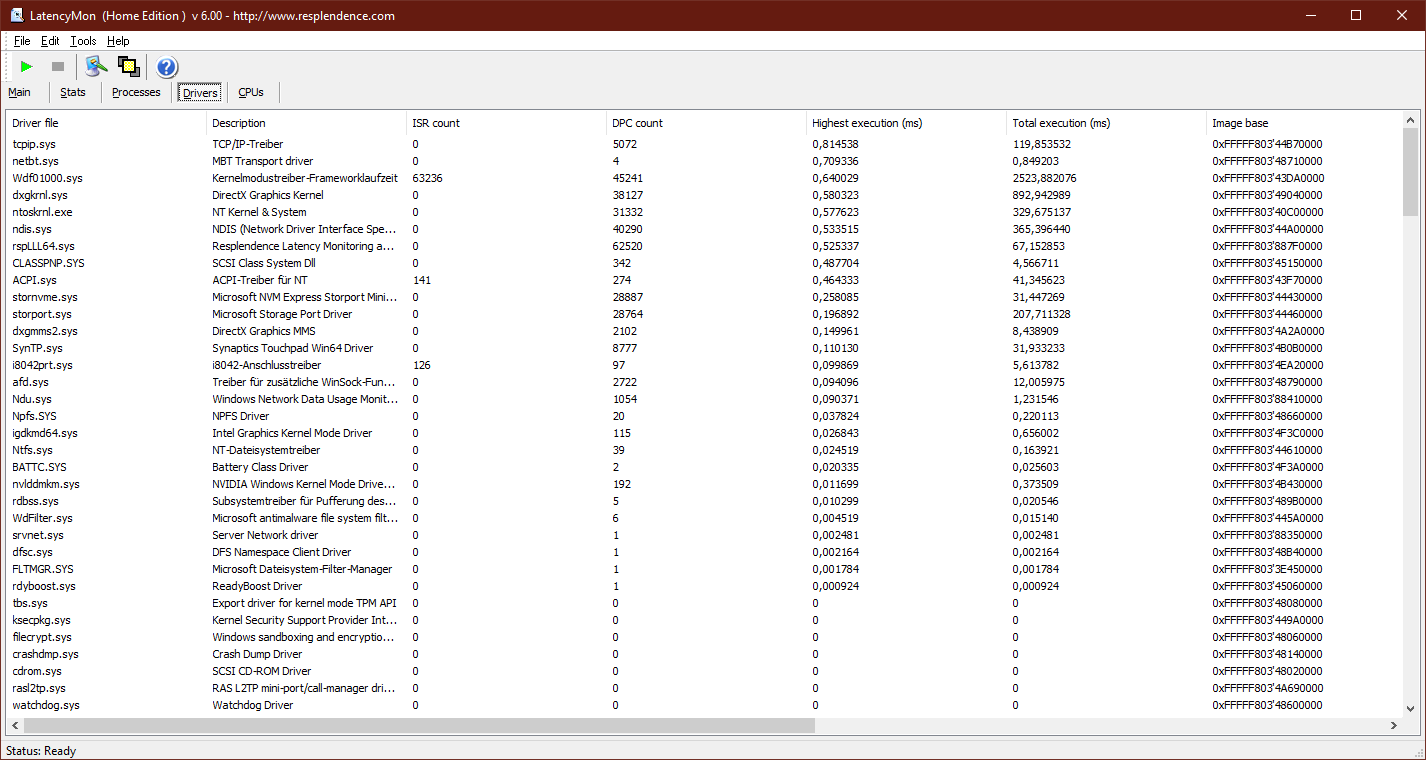
| DPC Latencies / LatencyMon - interrupt to process latency (max), Web, Youtube, Prime95 | |
| Lenovo ThinkPad P15 Gen1-20ST000DGE | |
* ... Meglio usare valori piccoli
Soluzione di archiviazione
L'SSD M.2 2280 offre ottimi risultati nei benchmarks. È prodotto da Toshiba, offre una capacità di 512 GB ed è collegato tramite PCIe NVMe.
| Lenovo ThinkPad P15 Gen1-20ST000DGE Toshiba XG6 KXG6AZNV512G | Lenovo ThinkPad P53-20QN000YGE Samsung PM981a MZVLB1T0HBLR | Lenovo ThinkPad T15g-20UR000GGE SK Hynix PC401 512GB M.2 (HFS512GD9TNG) | Lenovo ThinkPad T15p-20TN0006GE WDC PC SN730 SDBQNTY-512GB | Dell Precision 7550 SK Hynix PC601A NVMe 1TB | HP ZBook Fury 15 G7 Samsung PM981a MZVLB1T0HBLR | Media Toshiba XG6 KXG6AZNV512G | |
|---|---|---|---|---|---|---|---|
| CrystalDiskMark 5.2 / 6 | -4% | 2% | 0% | -12% | -1% | -12% | |
| Write 4K (MB/s) | 129.5 | 147 14% | 154 19% | 141.8 9% | 121 -7% | 114.1 -12% | 139 ? 7% |
| Read 4K (MB/s) | 49.54 | 48.3 -3% | 46.01 -7% | 47.39 -4% | 42.16 -15% | 57.2 15% | 45.8 ? -8% |
| Write Seq (MB/s) | 2379 | 1402 -41% | 2561 8% | 2404 1% | 2150 -10% | 2580 8% | 1628 ? -32% |
| Read Seq (MB/s) | 1989 | 1503 -24% | 1799 -10% | 2124 7% | 1755 -12% | 2527 27% | 1647 ? -17% |
| Write 4K Q32T1 (MB/s) | 663 | 475.2 -28% | 452.2 -32% | 637 -4% | 395.3 -40% | 480.2 -28% | 547 ? -17% |
| Read 4K Q32T1 (MB/s) | 425.2 | 581 37% | 570 34% | 414.8 -2% | 381.8 -10% | 387.6 -9% | 436 ? 3% |
| Write Seq Q32T1 (MB/s) | 2960 | 2936 -1% | 2736 -8% | 2706 -9% | 2730 -8% | 2996 1% | 2522 ? -15% |
| Read Seq Q32T1 (MB/s) | 3182 | 3539 11% | 3468 9% | 3319 4% | 3468 9% | 2853 -10% | 2739 ? -14% |

Carico di lettura costante: DiskSpd Read Loop, Queue Depth 8
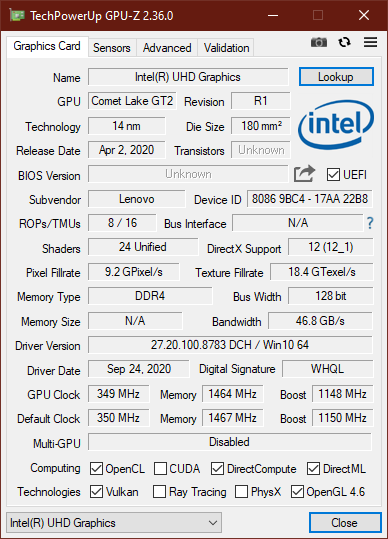
Scheda grafica
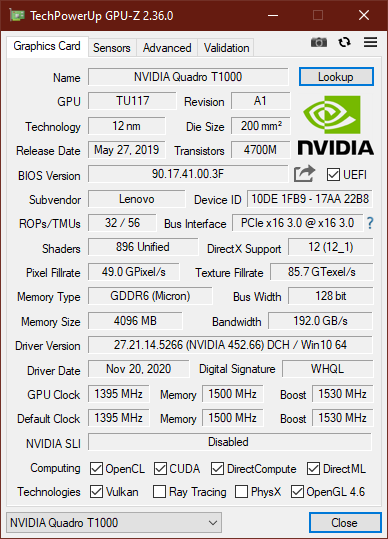
La Nvidia Quadro T1000 rappresenta l'opzione entry-level nel Lenovo ThinkPad P15. Naturalmente, la Nvidia Quadro RTX 5000 Max-Q nel predecessore ThinkPad P53 è notevolmente più veloce, ma questo non è una sorpresa. Un confronto più interessante è la Nvidia GeForce GTX 1050 del LenovoThinkPad T15p. A seconda del test, il T1000 ha un vantaggio dal 50 al 75% circa, qui. Quindi se volete prestazioni grafiche elevate, anche la configurazione entry-level del ThinkPad P15 è una scelta migliore del ThinkPad T15p. Ulteriori confronti sono disponibili nella nostra lista di benchmarks delle GPU.
Come per il processore, anche qui si può determinare una leggera riduzione delle prestazioni in modalità batteria. Con 9654 punti nel test GPU 3DMark 11, le prestazioni sono risultate inferiori di circa il 15%.
| 3DMark 11 Performance | 11592 punti | |
| 3DMark Fire Strike Score | 8173 punti | |
| 3DMark Time Spy Score | 3565 punti | |
Aiuto | ||
Prestazioni di gioco
Generalmente, le workstations non sono pensate per il gaming, ma non sono del tutto inadatte. Il P15 è anche in grado di gestire i giochi moderni senza problemi in risoluzione Full-HD e con impostazioni di dettaglio elevate. Tuttavia, per i giochi 4K, il ThinkPad T15g con una GeForce RTX sarebbe più adatto.
| The Witcher 3 - 1920x1080 High Graphics & Postprocessing (Nvidia HairWorks Off) | |
| Media della classe Workstation (n=1ultimi 2 anni) | |
| Lenovo ThinkPad T15g-20UR000GGE | |
| Lenovo ThinkPad P15 Gen1-20ST000DGE | |
| Media NVIDIA Quadro T1000 (Laptop) (52.7 - 62.9, n=3) | |
| Lenovo ThinkPad T15p-20TN0006GE | |
| basso | medio | alto | ultra | |
|---|---|---|---|---|
| The Witcher 3 (2015) | 189 | 114 | 62.9 | 35 |
| Dota 2 Reborn (2015) | 151 | 136 | 123 | 115 |
| X-Plane 11.11 (2018) | 108 | 96 | 80.1 | |
| Shadow of the Tomb Raider (2018) | 111 | 56.7 | 54.1 | 46 |
| Total War: Three Kingdoms (2019) | 189 | 60.4 | 39.1 | 24.7 |
Emissioni: Le ventole possono diventare più rumorose nel ThinkPad P15
Rumorosità
Durante il funzionamento inattivo, Lenovo riesce a lasciare le ventole spente per la maggior parte del tempo, e se funzionano, sono appena udibili a 28,8 dB(a). Sotto carico, la situazione cambia: Un livello di rumore di 37,7 dB(a) può essere facilmente notato, e il livello massimo di rumore di 44,6 dB(a) può diventare fastidioso. Rispetto al ThinkPad P53, le due ventole possono diventare significativamente più rumorose questa volta.
Non abbiamo notato alcun rumore elettronico.
Rumorosità
| Idle |
| 24.9 / 24.9 / 28.8 dB(A) |
| Sotto carico |
| 37.7 / 44.6 dB(A) |
 | ||
30 dB silenzioso 40 dB(A) udibile 50 dB(A) rumoroso |
||
min: | ||
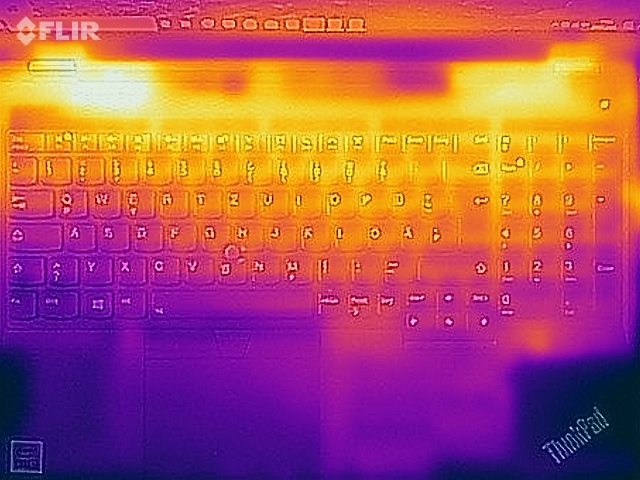
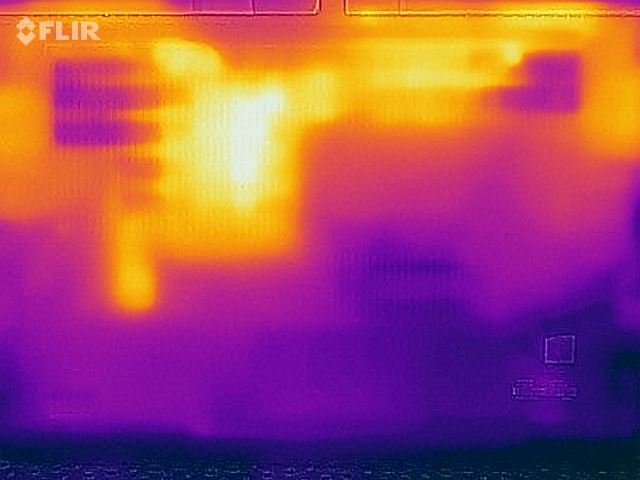
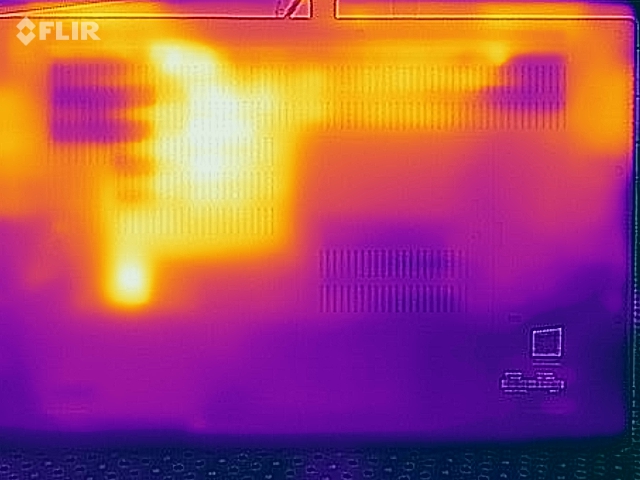
Temperature
Gli elevati valori di consumo della CPU hanno un prezzo: le temperature esterne salgono fino a 60 °C (140 °F)sul fondo - e questo in un modello entry-level! Con CPU e GPU più potenti, le temperature potrebbero salire ancora di più.
Naturalmente lo stress test rappresenta uno scenario estremo. Dopo un'ora di stress test, né la CPU né la GPU mostrano alcun throttling dovuto alle temperature elevate. Il chip grafico è in grado di consumare 50 watts, e la CPU 65 watts - le prestazioni di raffreddamento sembrano essere migliorate rispetto al portatile Lenovo ThinkPad P53.
(-) La temperatura massima sul lato superiore è di 45.4 °C / 114 F, rispetto alla media di 38.2 °C / 101 F, che varia da 22.2 a 69.8 °C per questa classe Workstation.
(-) Il lato inferiore si riscalda fino ad un massimo di 60.6 °C / 141 F, rispetto alla media di 41.1 °C / 106 F
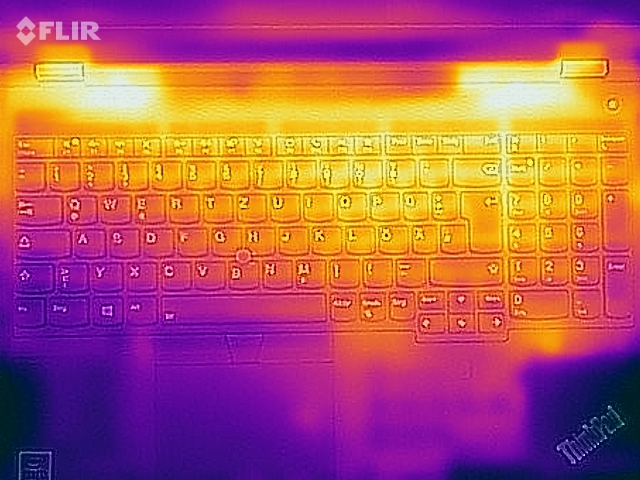
(+) In idle, la temperatura media del lato superiore è di 25.8 °C / 78 F, rispetto alla media deld ispositivo di 32 °C / 90 F.
(±) Riproducendo The Witcher 3, la temperatura media per il lato superiore e' di 36.1 °C / 97 F, rispetto alla media del dispositivo di 32 °C / 90 F.
(+) I poggiapolsi e il touchpad raggiungono la temperatura massima della pelle (32.5 °C / 90.5 F) e quindi non sono caldi.
(-) La temperatura media della zona del palmo della mano di dispositivi simili e'stata di 27.8 °C / 82 F (-4.7 °C / -8.5 F).
Altoparlanti
Lenovo ThinkPad P15 Gen1-20ST000DGE analisi audio
(±) | potenza degli altiparlanti media ma buona (80.7 dB)
Bassi 100 - 315 Hz
(-) | quasi nessun basso - in media 15.1% inferiori alla media
(±) | la linearità dei bassi è media (11.4% delta rispetto alla precedente frequenza)
Medi 400 - 2000 Hz
(±) | medi elevati - circa 7.6% superiore alla media
(+) | medi lineari (5.4% delta rispetto alla precedente frequenza)
Alti 2 - 16 kHz
(+) | Alti bilanciati - appena 3.4% dalla media
(+) | alti lineari (6.9% delta rispetto alla precedente frequenza)
Nel complesso 100 - 16.000 Hz
(±) | la linearità complessiva del suono è media (18.2% di differenza rispetto alla media
Rispetto alla stessa classe
» 59% di tutti i dispositivi testati in questa classe è stato migliore, 10% simile, 31% peggiore
» Il migliore ha avuto un delta di 7%, medio di 17%, peggiore di 35%
Rispetto a tutti i dispositivi testati
» 39% di tutti i dispositivi testati in questa classe è stato migliore, 8% similare, 53% peggiore
» Il migliore ha avuto un delta di 4%, medio di 23%, peggiore di 134%
Lenovo ThinkPad T15p-20TN0006GE analisi audio
(±) | potenza degli altiparlanti media ma buona (74.7 dB)
Bassi 100 - 315 Hz
(-) | quasi nessun basso - in media 22.8% inferiori alla media
(±) | la linearità dei bassi è media (12.2% delta rispetto alla precedente frequenza)
Medi 400 - 2000 Hz
(±) | medi elevati - circa 6.4% superiore alla media
(±) | linearità dei medi adeguata (8.5% delta rispetto alla precedente frequenza)
Alti 2 - 16 kHz
(+) | Alti bilanciati - appena 3.6% dalla media
(+) | alti lineari (6.3% delta rispetto alla precedente frequenza)
Nel complesso 100 - 16.000 Hz
(±) | la linearità complessiva del suono è media (29.3% di differenza rispetto alla media
Rispetto alla stessa classe
» 95% di tutti i dispositivi testati in questa classe è stato migliore, 2% simile, 3% peggiore
» Il migliore ha avuto un delta di 5%, medio di 17%, peggiore di 45%
Rispetto a tutti i dispositivi testati
» 87% di tutti i dispositivi testati in questa classe è stato migliore, 3% similare, 10% peggiore
» Il migliore ha avuto un delta di 4%, medio di 23%, peggiore di 134%
Gestione dell'energia: Una workstation ThinkPad con una grande batteria
Consumo energetico
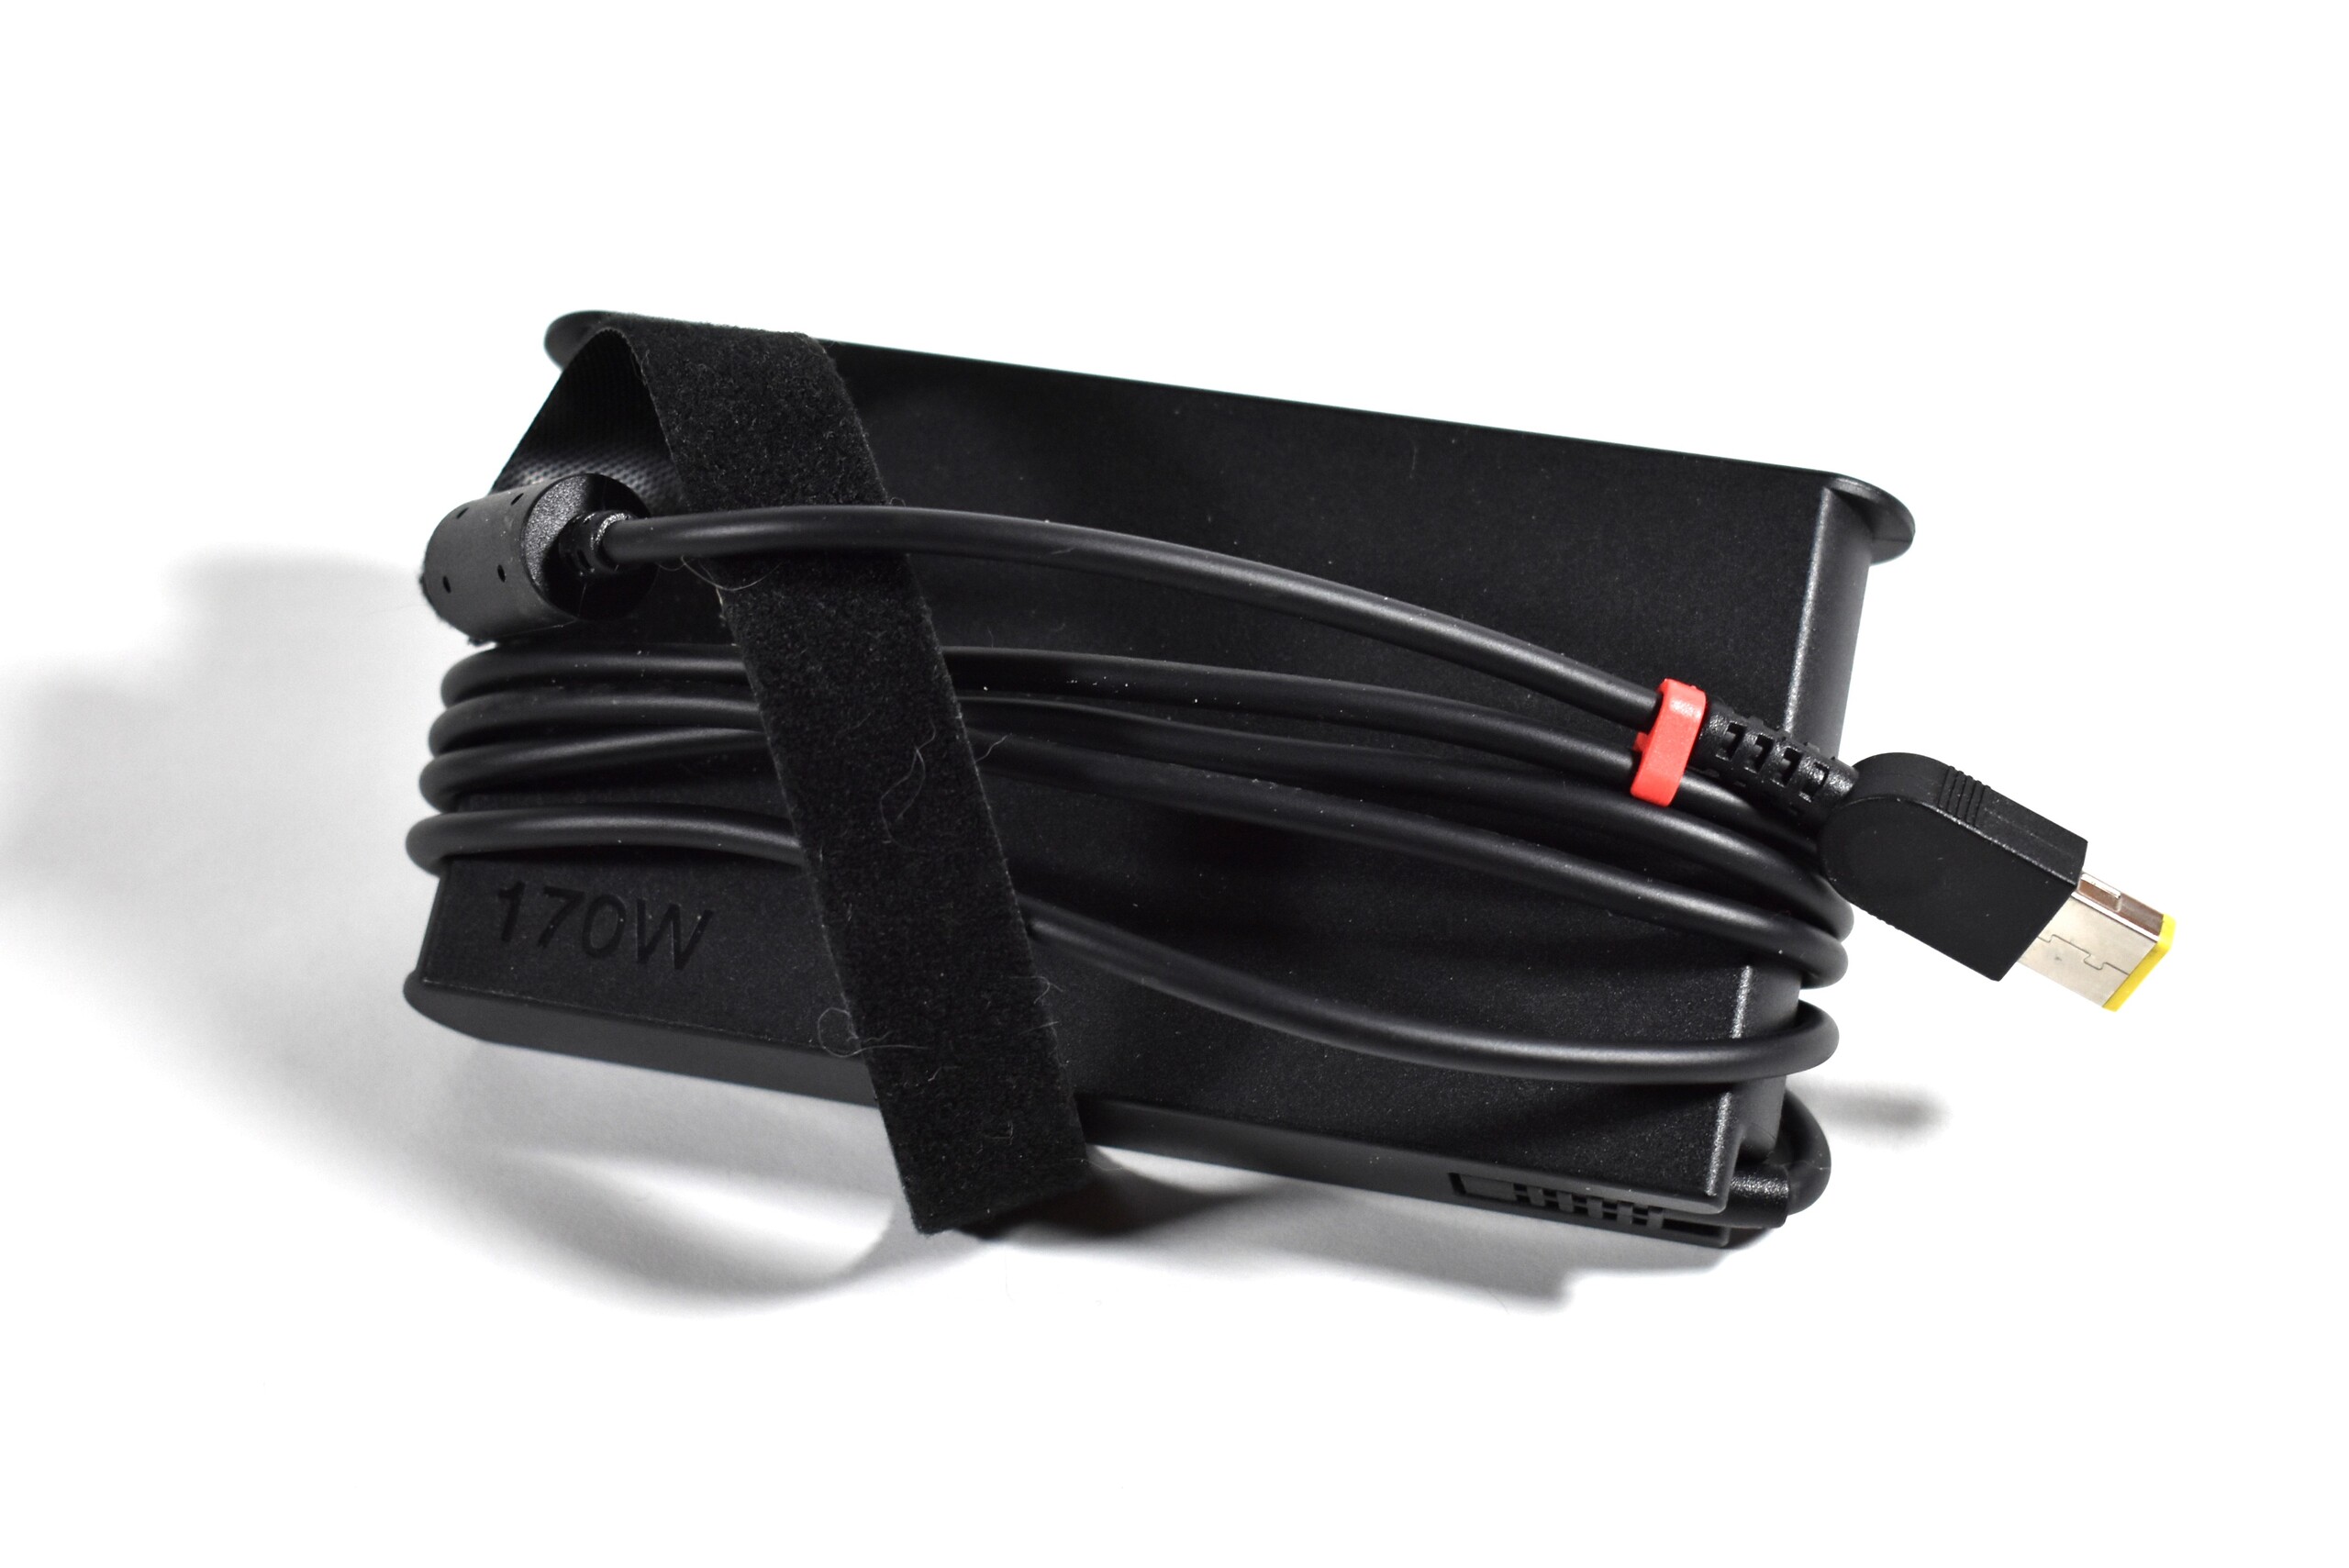
Non è cambiato molto rispetto al Lenovo ThinkPad P53 in termini di consumo energetico, almeno in funzionamento inattivo. Sotto carico, il consumo è significativamente inferiore, il che può essere attribuito alla GPU più debole. Il consumo massimo è facile da gestire per l'alimentatore da 170 Watt.
| Off / Standby | |
| Idle | |
| Sotto carico |
|
Leggenda:
min: | |
| Lenovo ThinkPad P15 Gen1-20ST000DGE i7-10750H, Quadro T1000 (Laptop), Toshiba XG6 KXG6AZNV512G, a-Si IPS LED, 1920x1080, 15.6" | Lenovo ThinkPad P53-20QN000YGE i7-9850H, Quadro RTX 5000 Max-Q, Samsung PM981a MZVLB1T0HBLR, IPS, 1920x1080, 15.6" | Lenovo ThinkPad T15g-20UR000GGE i7-10750H, GeForce RTX 2070 Super Max-Q, SK Hynix PC401 512GB M.2 (HFS512GD9TNG), IPS, 1920x1080, 15.6" | Lenovo ThinkPad T15p-20TN0006GE i7-10750H, GeForce GTX 1050 Mobile, WDC PC SN730 SDBQNTY-512GB, IPS LED, 3840x2160, 15.6" | Dell Precision 7550 W-10885M, Quadro RTX 5000 Max-Q, SK Hynix PC601A NVMe 1TB, IPS, 3840x2160, 15.6" | HP ZBook Fury 15 G7 W-10885M, Quadro RTX 5000 Max-Q, Samsung PM981a MZVLB1T0HBLR, IPS, 3840x2160, 15.6" | Media NVIDIA Quadro T1000 (Laptop) | Media della classe Workstation | |
|---|---|---|---|---|---|---|---|---|
| Power Consumption | -13% | -8% | 8% | -38% | -20% | 6% | -10% | |
| Idle Minimum * (Watt) | 8.4 | 7.9 6% | 5.8 31% | 6 29% | 8.2 2% | 4.6 45% | 8.33 ? 1% | 9.13 ? -9% |
| Idle Average * (Watt) | 12.3 | 11.8 4% | 11.4 7% | 12.8 -4% | 16.8 -37% | 13.6 -11% | 11.8 ? 4% | 13.8 ? -12% |
| Idle Maximum * (Watt) | 14.2 | 14.9 -5% | 13.9 2% | 16.1 -13% | 24.4 -72% | 21.5 -51% | 15.2 ? -7% | 18 ? -27% |
| Load Average * (Watt) | 96 | 96 -0% | 93.2 3% | 95.6 -0% | 131 -36% | 113.1 -18% | 86.4 ? 10% | 94.5 ? 2% |
| Witcher 3 ultra * (Watt) | 95 | 149 -57% | 145 -53% | 84 12% | 156.6 -65% | 157.5 -66% | ||
| Load Maximum * (Watt) | 168.8 | 207.8 -23% | 234 -39% | 131.1 22% | 201.8 -20% | 199 -18% | 131.1 ? 22% | 177.8 ? -5% |
* ... Meglio usare valori piccoli
Durata della batteria
Con 94 Wh, il Lenovo ThinkPad P15 Gen 1 ha la batteria attualmente più grande di un ThinkPad da 15 pollici. È anche 4 Wh più grande di quella del predecessore ThinkPad P53. Con il basso consumo del display Full-HD, Lenovo raggiunge una lunga autonomia, durando quasi 14 ore nel test Wi-Fi (150 cd/m²), che è un risultato eccellente. E quasi 10 ore nello stesso test alla massima luminosità sono un risultato altrettanto buono.
| Lenovo ThinkPad P15 Gen1-20ST000DGE i7-10750H, Quadro T1000 (Laptop), 94 Wh | Lenovo ThinkPad P53-20QN000YGE i7-9850H, Quadro RTX 5000 Max-Q, 90 Wh | Lenovo ThinkPad T15g-20UR000GGE i7-10750H, GeForce RTX 2070 Super Max-Q, 94 Wh | Lenovo ThinkPad T15p-20TN0006GE i7-10750H, GeForce GTX 1050 Mobile, 68 Wh | Dell Precision 7550 W-10885M, Quadro RTX 5000 Max-Q, 95 Wh | HP ZBook Fury 15 G7 W-10885M, Quadro RTX 5000 Max-Q, 94 Wh | Media della classe Workstation | |
|---|---|---|---|---|---|---|---|
| Autonomia della batteria | 6% | -10% | -34% | -27% | -16% | -15% | |
| H.264 (h) | 13.9 | 9.8 -29% | 12.7 -9% | 7.7 -45% | 10.1 ? -27% | ||
| WiFi v1.3 (h) | 14.1 | 11.1 -21% | 11.2 -21% | 7.3 -48% | 8.9 -37% | 8.6 -39% | 8.63 ? -39% |
| Load (h) | 1.2 | 2 67% | 1.2 0% | 1.1 -8% | 1 -17% | 1.3 8% | 1.441 ? 20% |
Pro
Contro
Valutazione complessiva: lascia un'impressione mista questo Lenovo ThinkPad P15 Gen 1
Anche se a prima vista non sembra, Lenovo ha cambiato alcune cose nel ThinkPad P15 Gen 1 rispetto al modello precedente ThinkPad P53. Anche se ci sono diversi miglioramenti, il nuovo notebook ThinkPad è peggiore in altri aspetti.
Un aspetto è il case, che non è altrettanto piacevole al tatto. Questo include anche un problema di stabilità nella zona della tastiera, che sferraglia in basso a sinistra. Non ci piace nemmeno che alcune caratteristiche come i tasti dedicati del touchpad siano stati rimossi. Non vediamo alcuna ragione valida per cui Lenove dovrebbe fare dei tagli in un dispositivo professionale così costoso. Il contrasto della versione di display entry-level del P15 potrebbe anche essere più elevato. E c'è anche uno slot M.2 in meno rispetto al predecessore.
I cambiamenti positivi riguardano la costruzione e il raffreddamento. Il ThinkPad P15 Gen 1 è più facile da mantenere, perché il sistema di raffreddamento è più accessibile. Quest'ultimo è anche migliorato rispetto al predecessore e non c'è throttling, anche se le ventole possono diventare più rumorose. Il risultato è un miglioramento delle prestazioni della CPU. Rispetto al P53, anche le dimensioni della batteria sono aumentate, il che si traduce in una migliore autonomia.
Nel complesso, il ThinkPad P15 Gen 1 è una workstation ben equipaggiata con diversi punti deboli a cui Lenovo potrebbe forse porre rimedio nel successore (parola chiave: tastiera sferragliante).
Avremmo qualche difficoltà a raccomandare il Lenovo ThinkPad P15 Gen 1. Da un lato, a causa del punto debole nella tastiera, e dall'altro perché le CPU utilizzate sono semplicemente inefficienti. Un ThinkPad P15 Gen 2 con CPU 10-nm di Intel potrebbe funzionare sicuramente con temperature e rumorosità inferiori pur offrendo le stesse prestazioni.
Prezzo e disponibilità
Nella configurazione testata, il Lenovo ThinkPad P15 Gen 1 costa circa 1980 euro (~$2371) in Germania. Negli Stati Uniti, il ThinkPad P15 Gen 1 è disponibile su Amazon a partire da 1545 dollari.
Lenovo ThinkPad P15 Gen1-20ST000DGE
- 03/04/2021 v7 (old)
Benjamin Herzig
Price comparison
