Recensione della Workstation HP ZBook Fury 15 G7: Camera di vapore per il massimo delle prestazioni
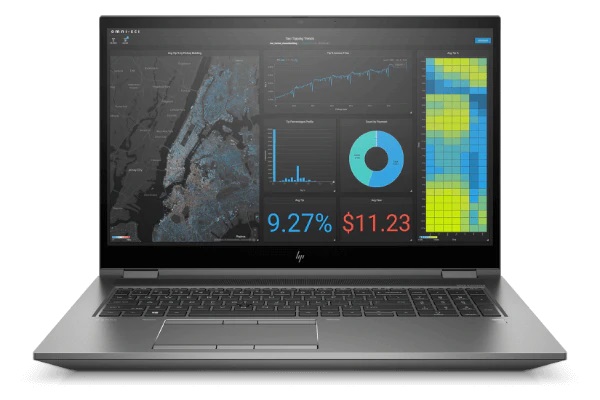
L'HP ZBook Fury 15 G7 è la workstation mobile da 15,6 pollici di punta dell'azienda, progettata per utenti CAD ad alte prestazioni e professionisti. A differenza della più sottile serie ZBook 15u o Firefly, la ZBook Fury 15 utilizza CPU Intel serie H molto più veloci con opzioni GPU di fascia alta GeForce RTX invece della più lenta serie U Intel con GPU Quadro P.
È disponibile un'ampia gamma di configurazioni che vanno dalla CPU Core i5-10300H fino alla Xeon W-10885M, 16 GB di RAM fino a 128 GB, display 1080p 250 nits fino a 4K UHD 600 nits, e la GPU Quadro T2000 Max-Q fino a RTX 5000 Max-Q. L'elenco completo delle specifiche tecniche può essere trovato sul datasheet ufficiale di HP. L'unità che abbiamo a disposizione è una configurazione di fascia alta con la CPU Xeon, display 4K e GPU Quadr RTX 5000 Max-Q che costa circa $6100 USD.
Le alternative allo ZBook Fury 15 G7 includono altre workstations di fascia alta da 15,6 pollici come il Dell Precision 7550, Lenovo ThinkPad serie P, Asus ProArt StudioBook Pro 15, o l'MSI WS66.
Altre recensioni HP:
Confronto con i possibili concorrenti
Punteggio | Data | Modello | Peso | Altezza | Dimensione | Risoluzione | Prezzo |
|---|---|---|---|---|---|---|---|
| 90.2 % v7 (old) | 01/2021 | HP ZBook Fury 15 G7 W-10885M, Quadro RTX 5000 Max-Q | 2.4 kg | 25.9 mm | 15.60" | 3840x2160 | |
| 83.1 % v7 (old) | 11/2020 | Asus ProArt StudioBook Pro 15 W500G5T i7-9750H, Quadro RTX 5000 Max-Q | 2 kg | 18.9 mm | 15.60" | 3840x2160 | |
| 83.4 % v7 (old) | 09/2020 | MSI WS66 10TMT-207US i9-10980HK, Quadro RTX 5000 Max-Q | 2.3 kg | 19.8 mm | 15.60" | 1920x1080 | |
| 87.8 % v7 (old) | 09/2020 | Dell Precision 7550 W-10885M, Quadro RTX 5000 Max-Q | 2.8 kg | 27.36 mm | 15.60" | 3840x2160 | |
| 87 % v7 (old) | 08/2020 | Razer Blade 15 Studio Edition 2020 i7-10875H, Quadro RTX 5000 Max-Q | 2.2 kg | 13.98 mm | 15.60" | 3840x2160 | |
| 87.8 % v7 (old) | 08/2019 | Lenovo ThinkPad P1 2019-20QT000RGE i7-9850H, Quadro T1000 (Laptop) | 1.7 kg | 18.4 mm | 15.60" | 1920x1080 |
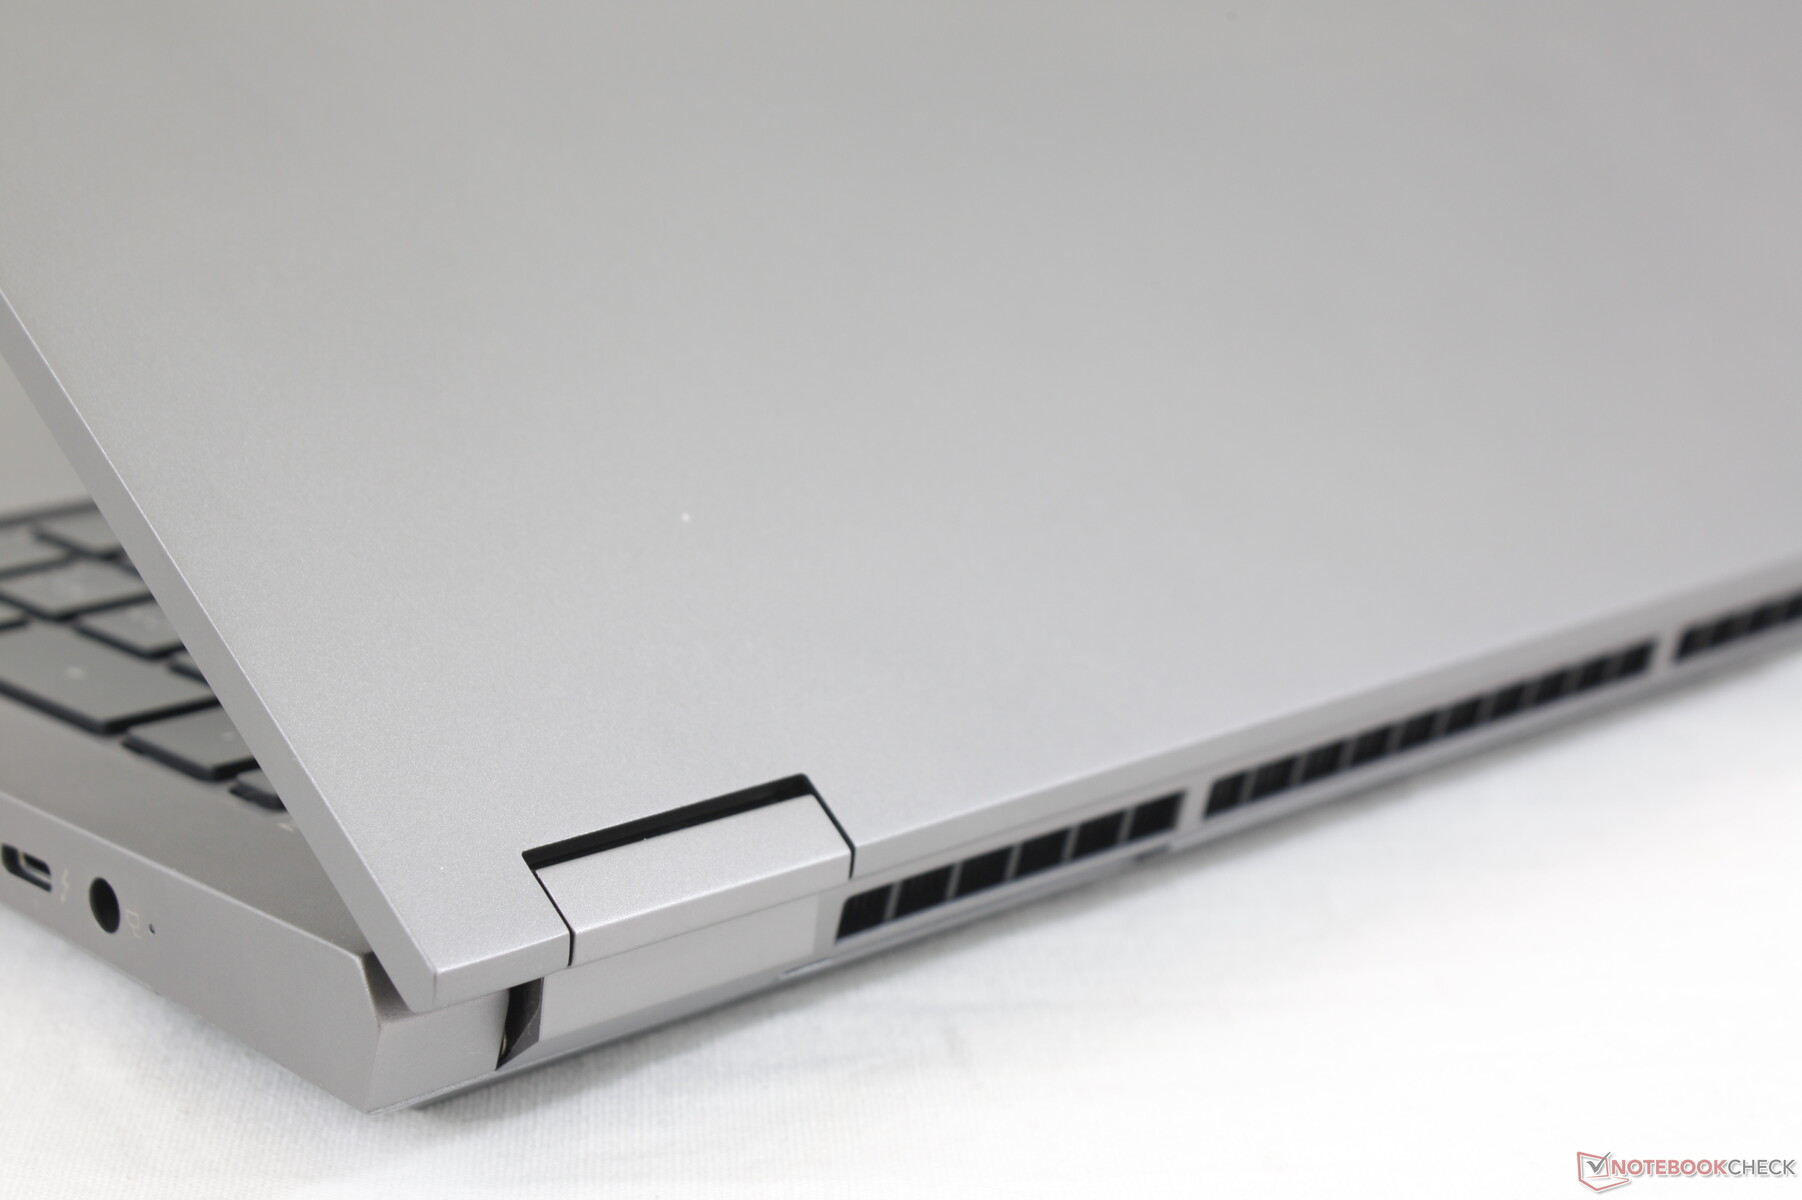
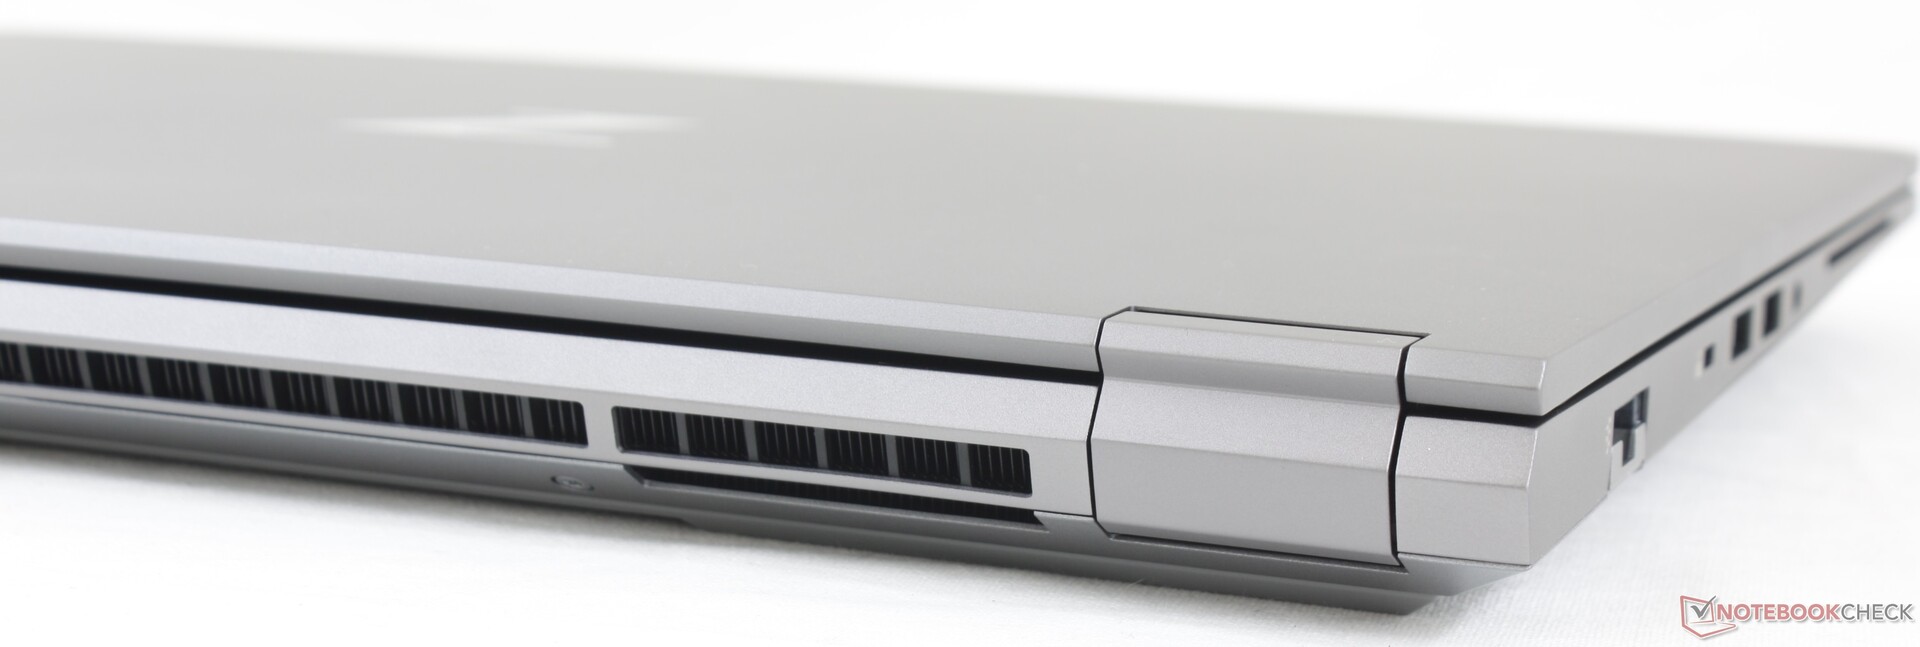
Case
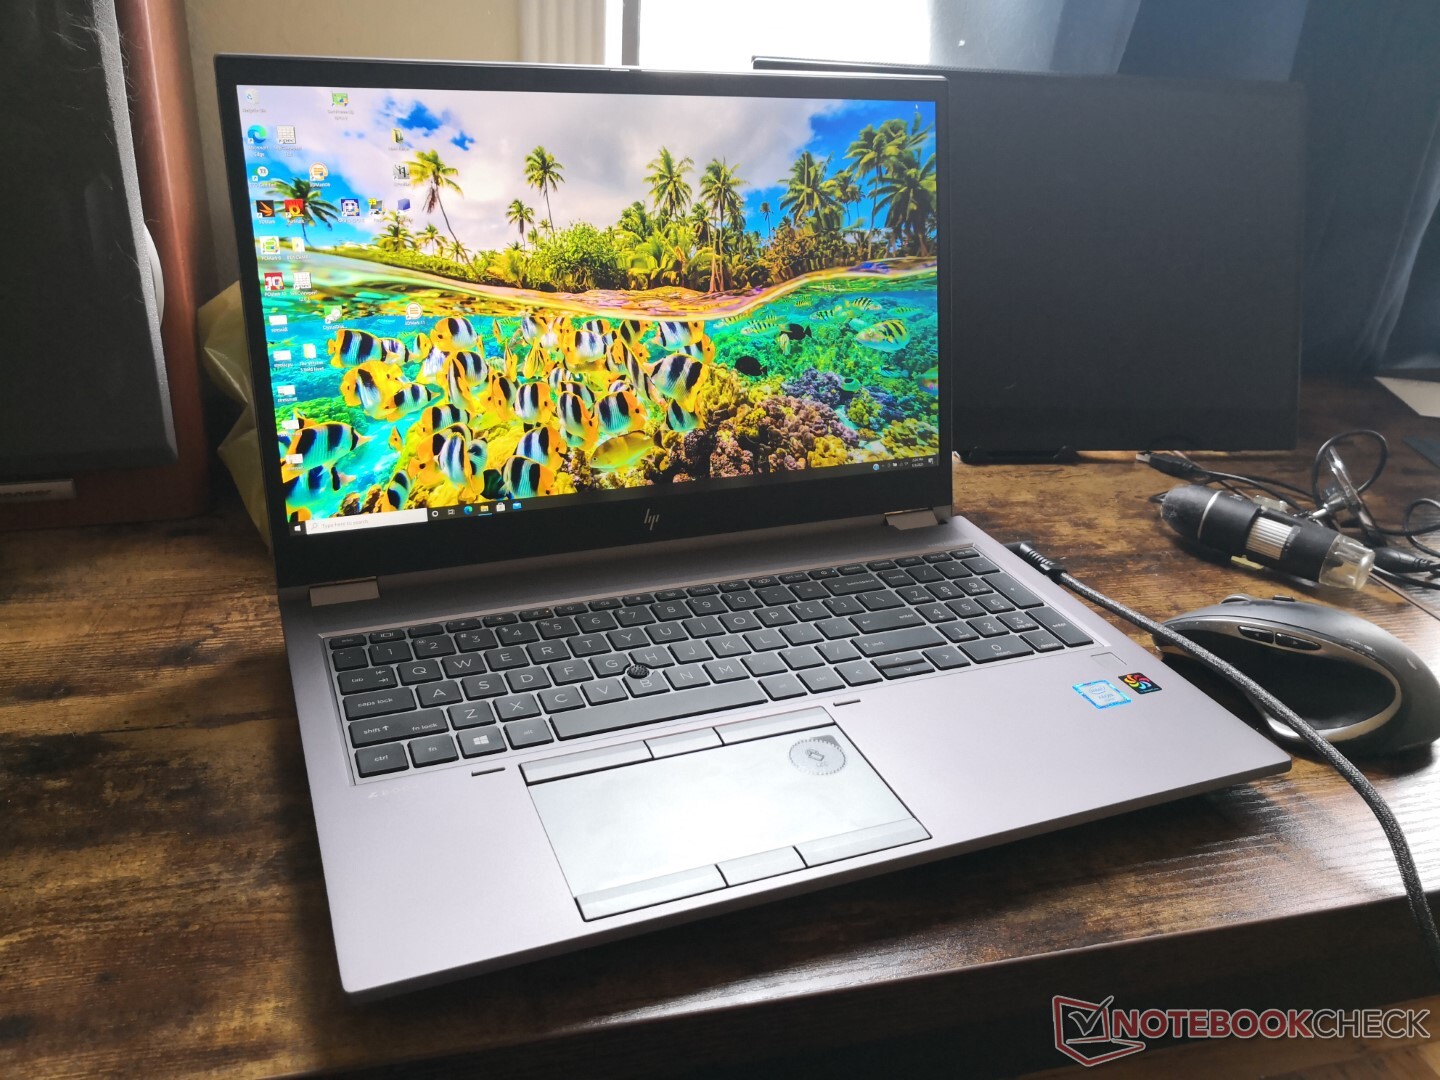
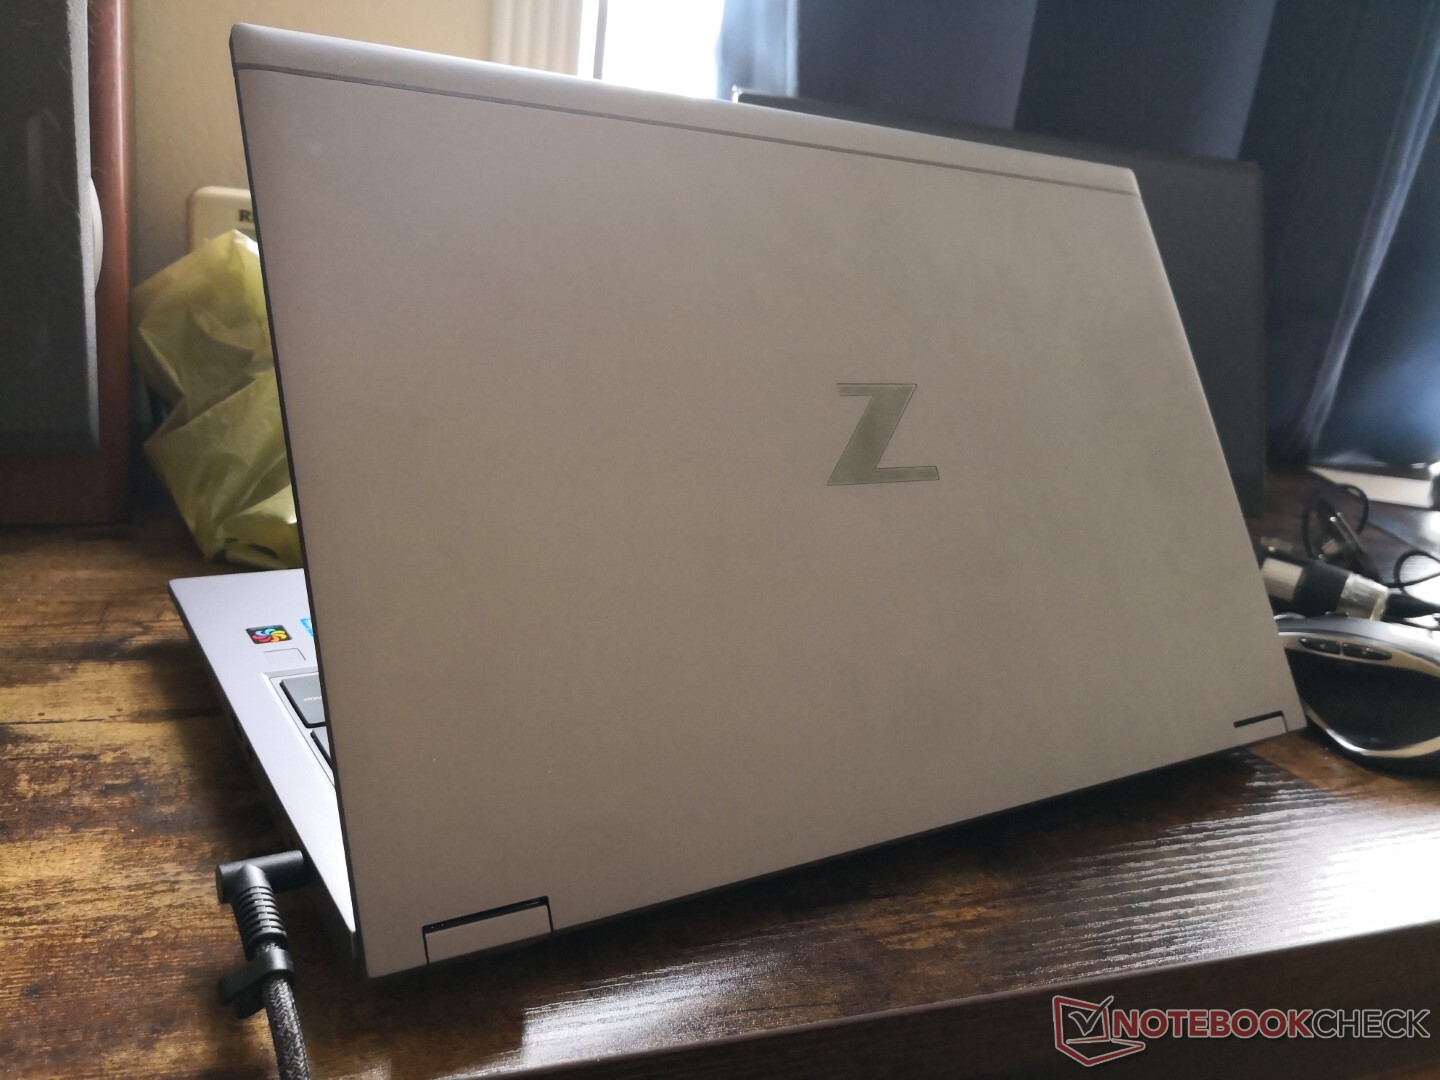
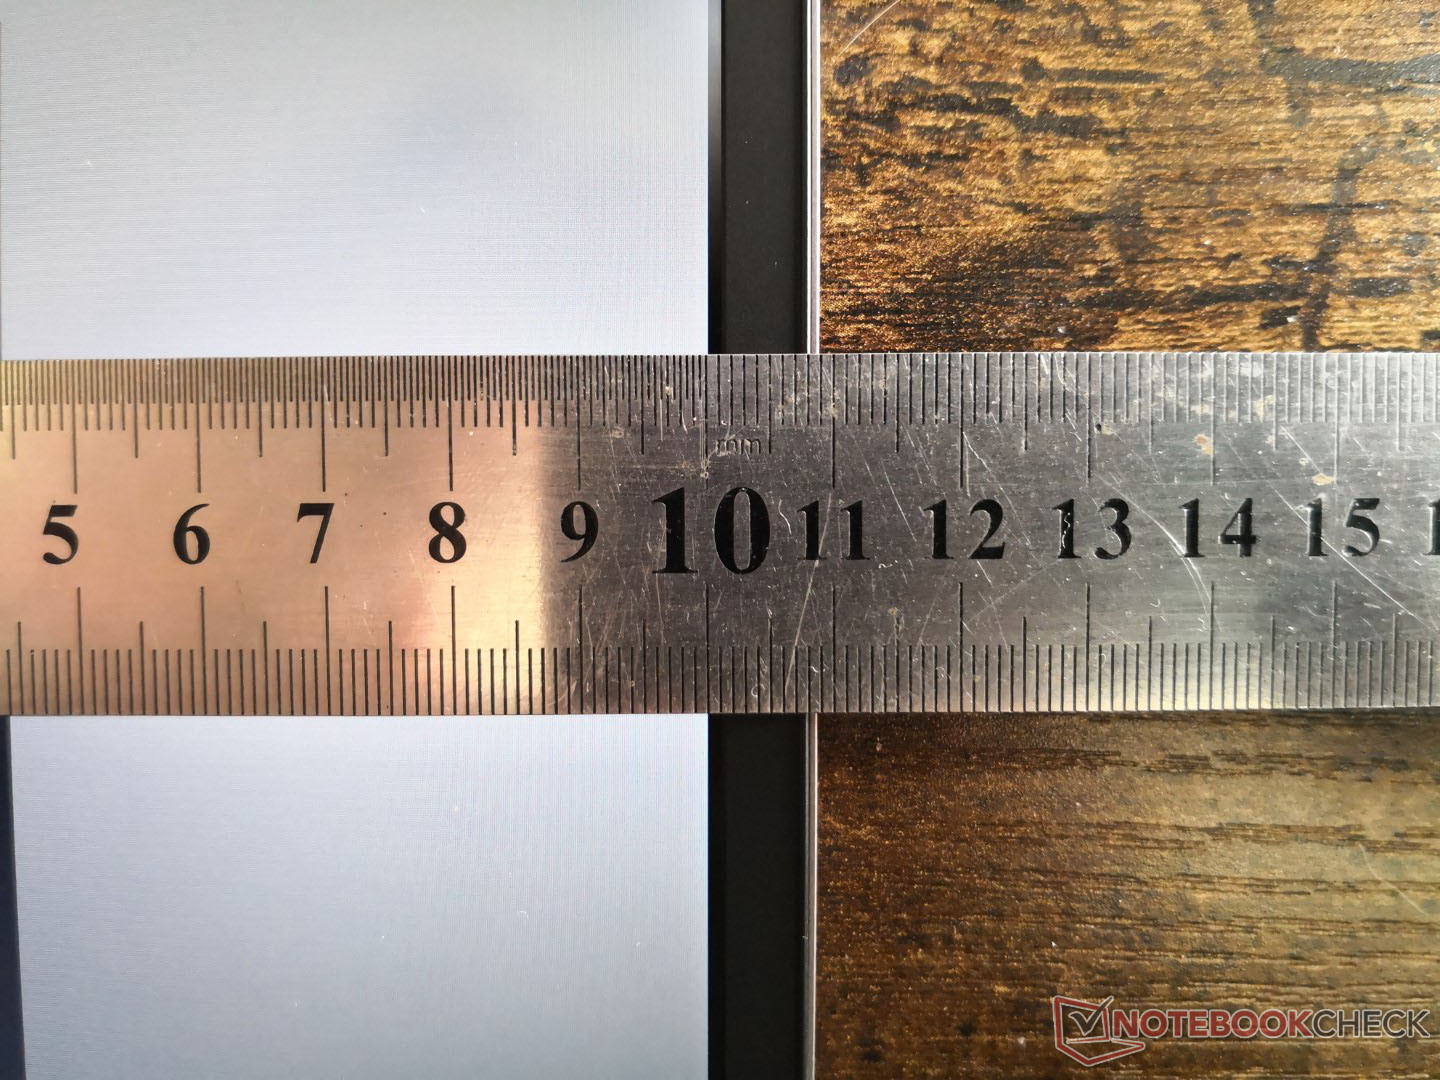
Sono passati alcuni anni dall'ultima volta che abbiamo testato uno ZBook 15 a grandezza naturale e sono cambiate molte cose. HP ha ridisegnato il telaio dalla testa ai piedi con look più nitidi senza sacrificare molte delle caratteristiche che le workstations più sottili tendono a tralasciare, come i lettori di smart card, lo stick nub e i pulsanti del mouse dedicati. HP dice che le cornici superiore, laterale e inferiore sono rispettivamente il 59,7%, il 53,1% e il 10,6% più piccole dello ZBook 15 G6 precedente. La base è solida e cede poco o per nulla, compreso il centro della tastiera, che è il punto in cui la maggior parte dei portatili è più debole. La cover si flette un po' di più, ma non abbastanza da destare preoccupazione.
L'HP è notevolmente più leggero del Precision 7550 di circa 400 g nonostante le dimensioni simili. Il sistema Dell appare più solido, tuttavia, probabilmente a causa del suo peso più elevato. Ci sono molte workstations Nvidia Studio ultrasottili come il Razer Blade o l'MSI WS66 che sono progettate per essere ancora più sottili e leggere se gli utenti vogliono qualcosa di più portatile.
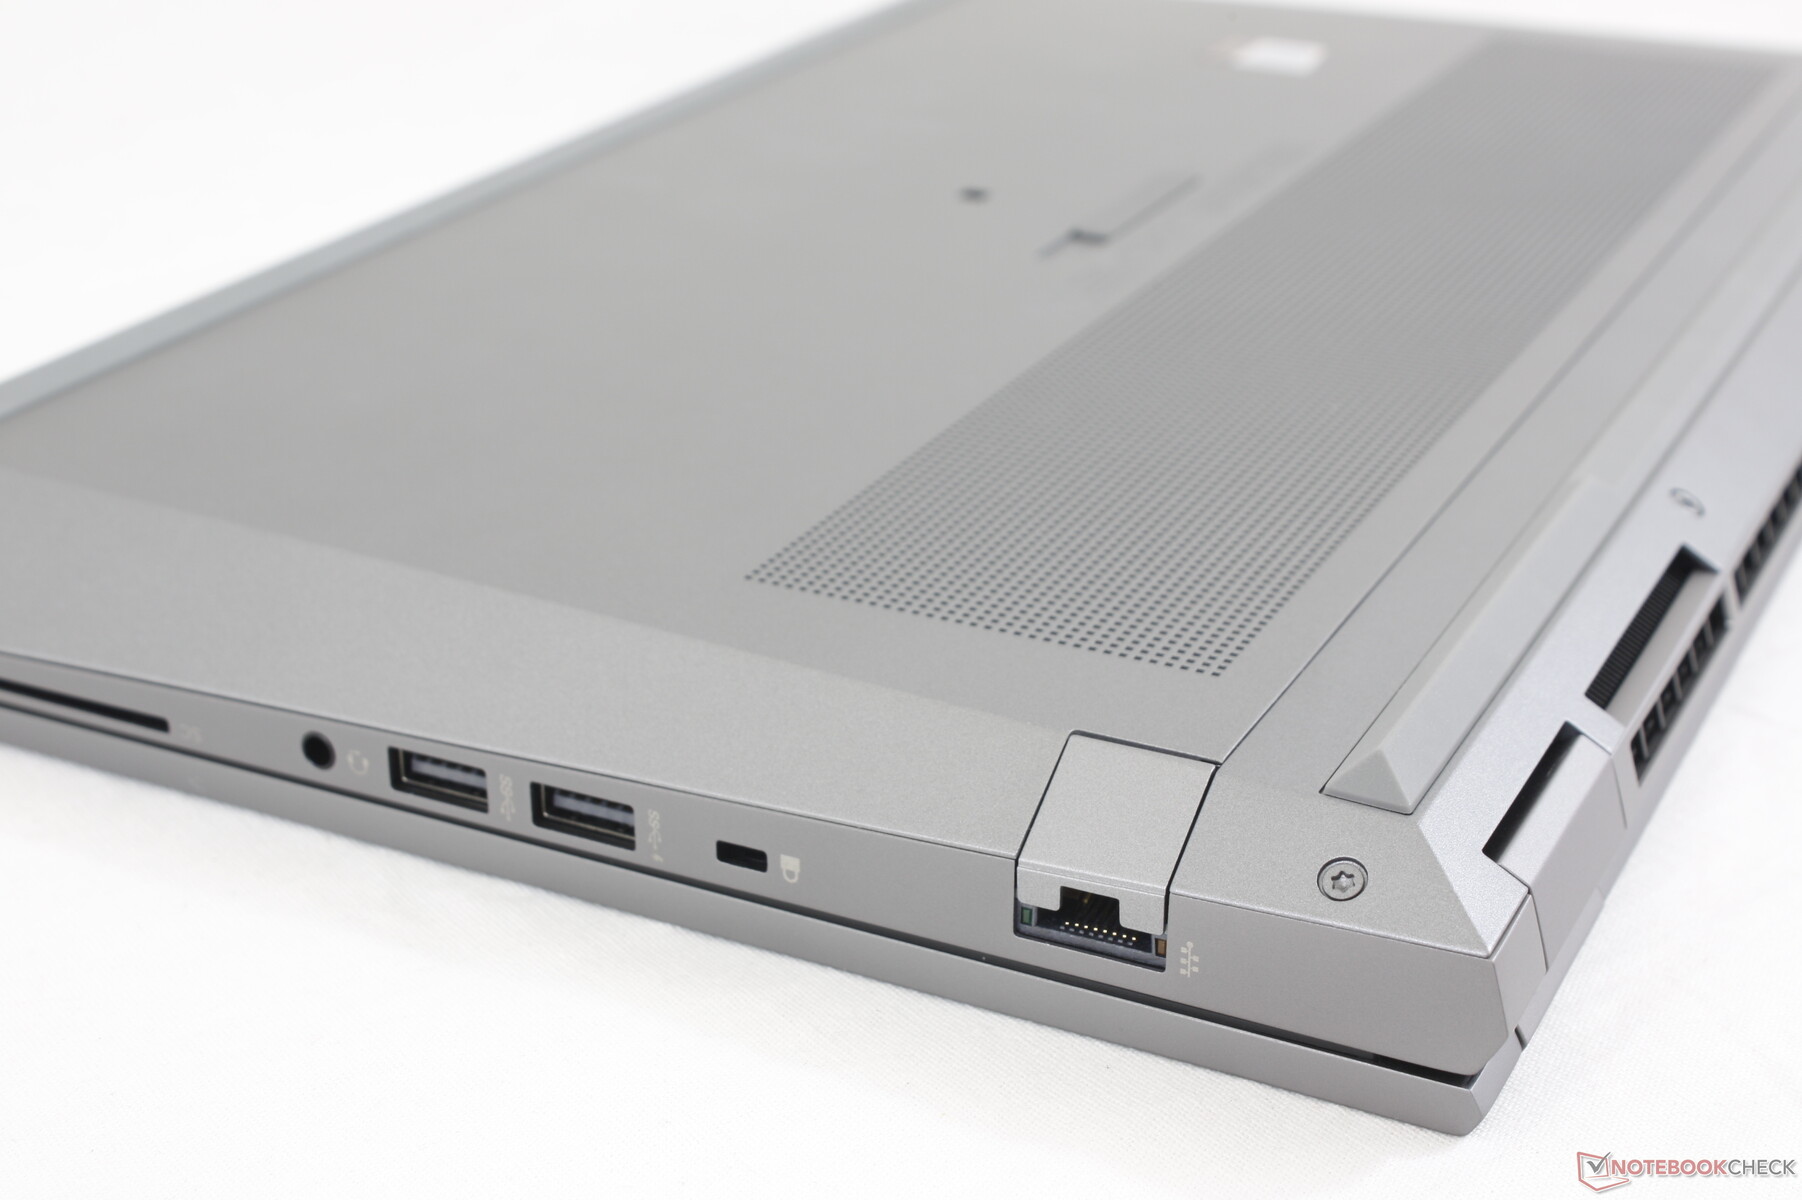
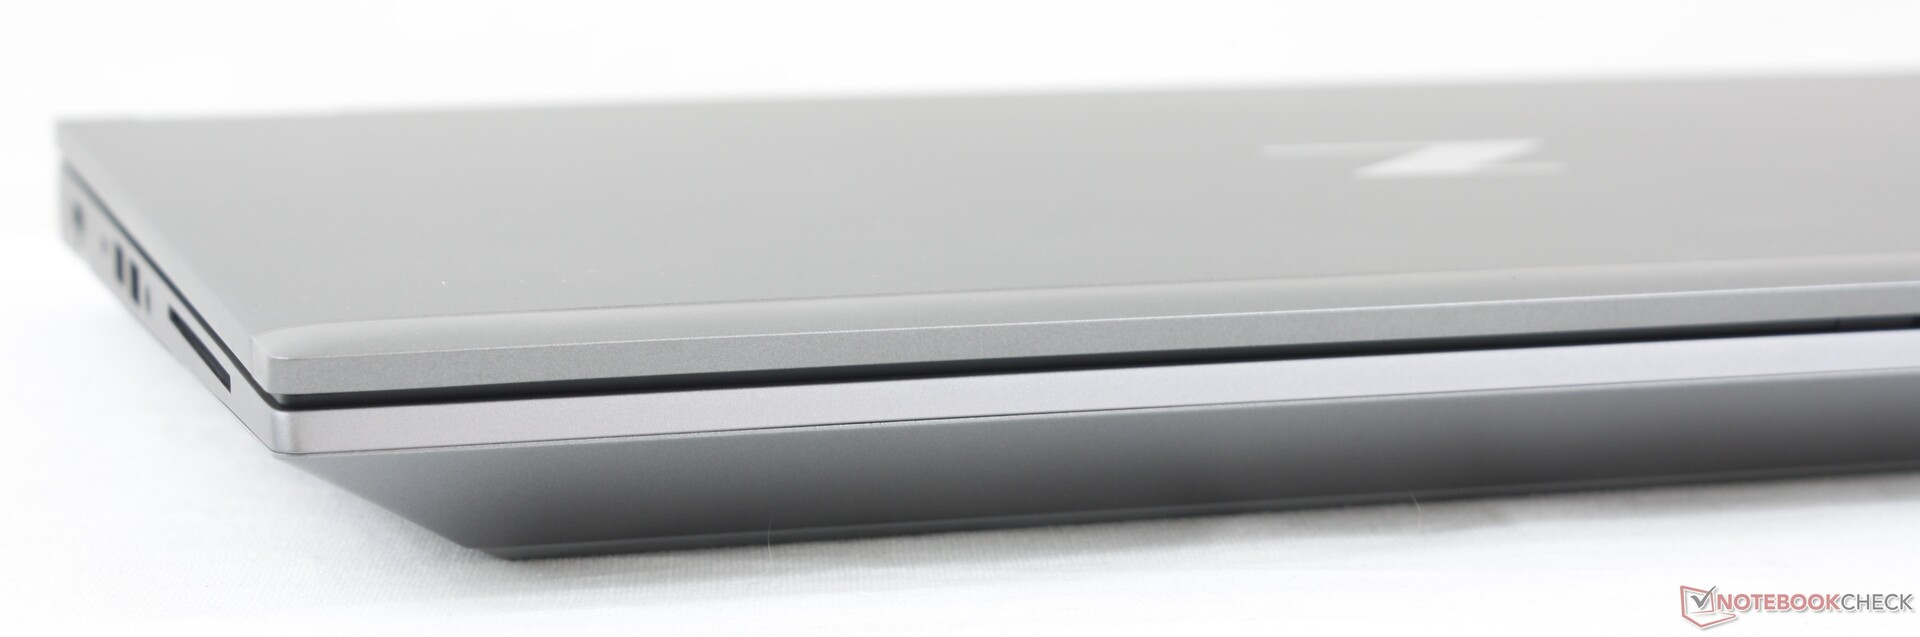
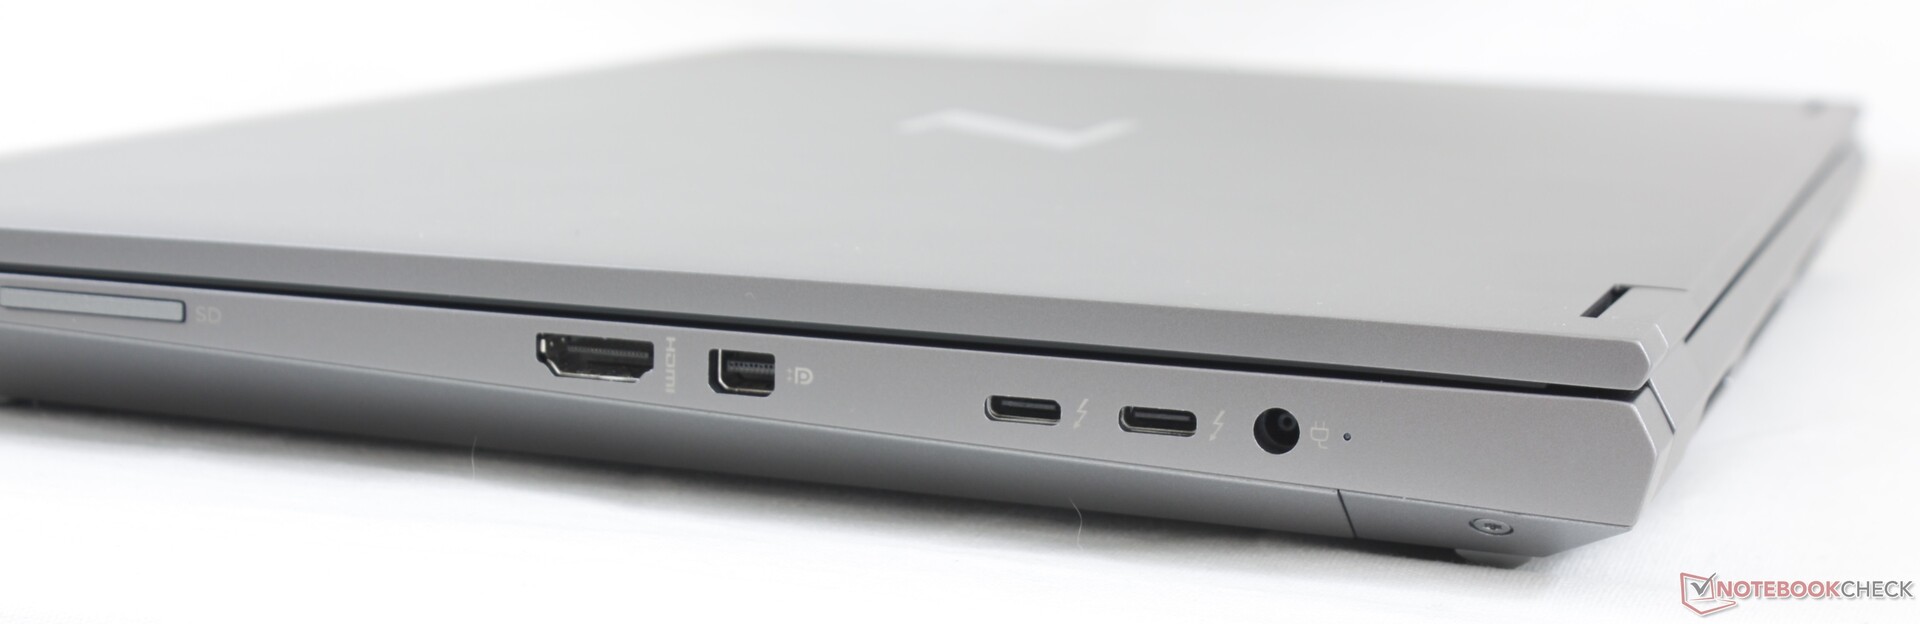
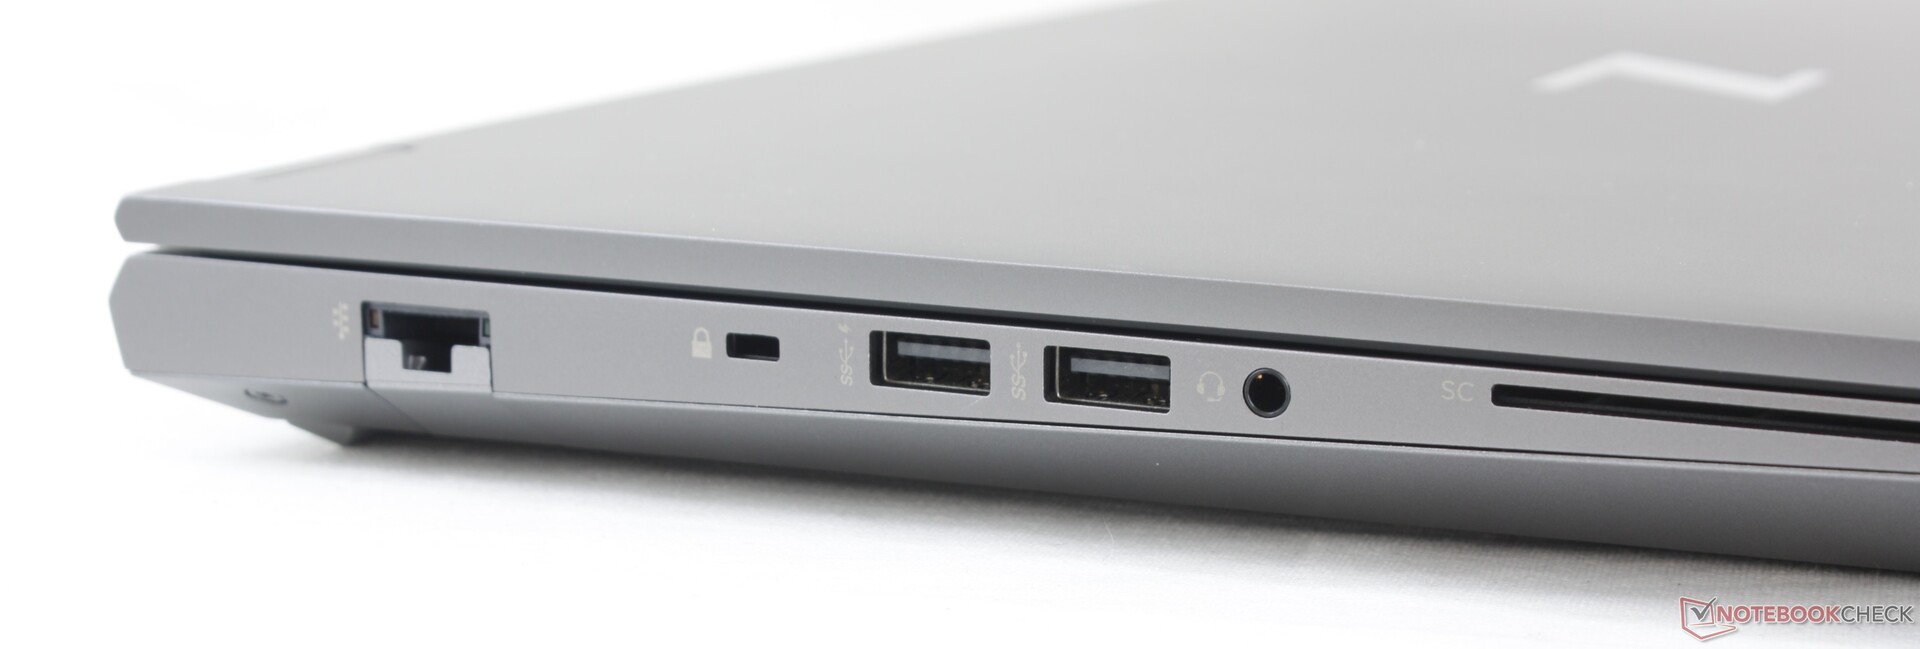
Connettività
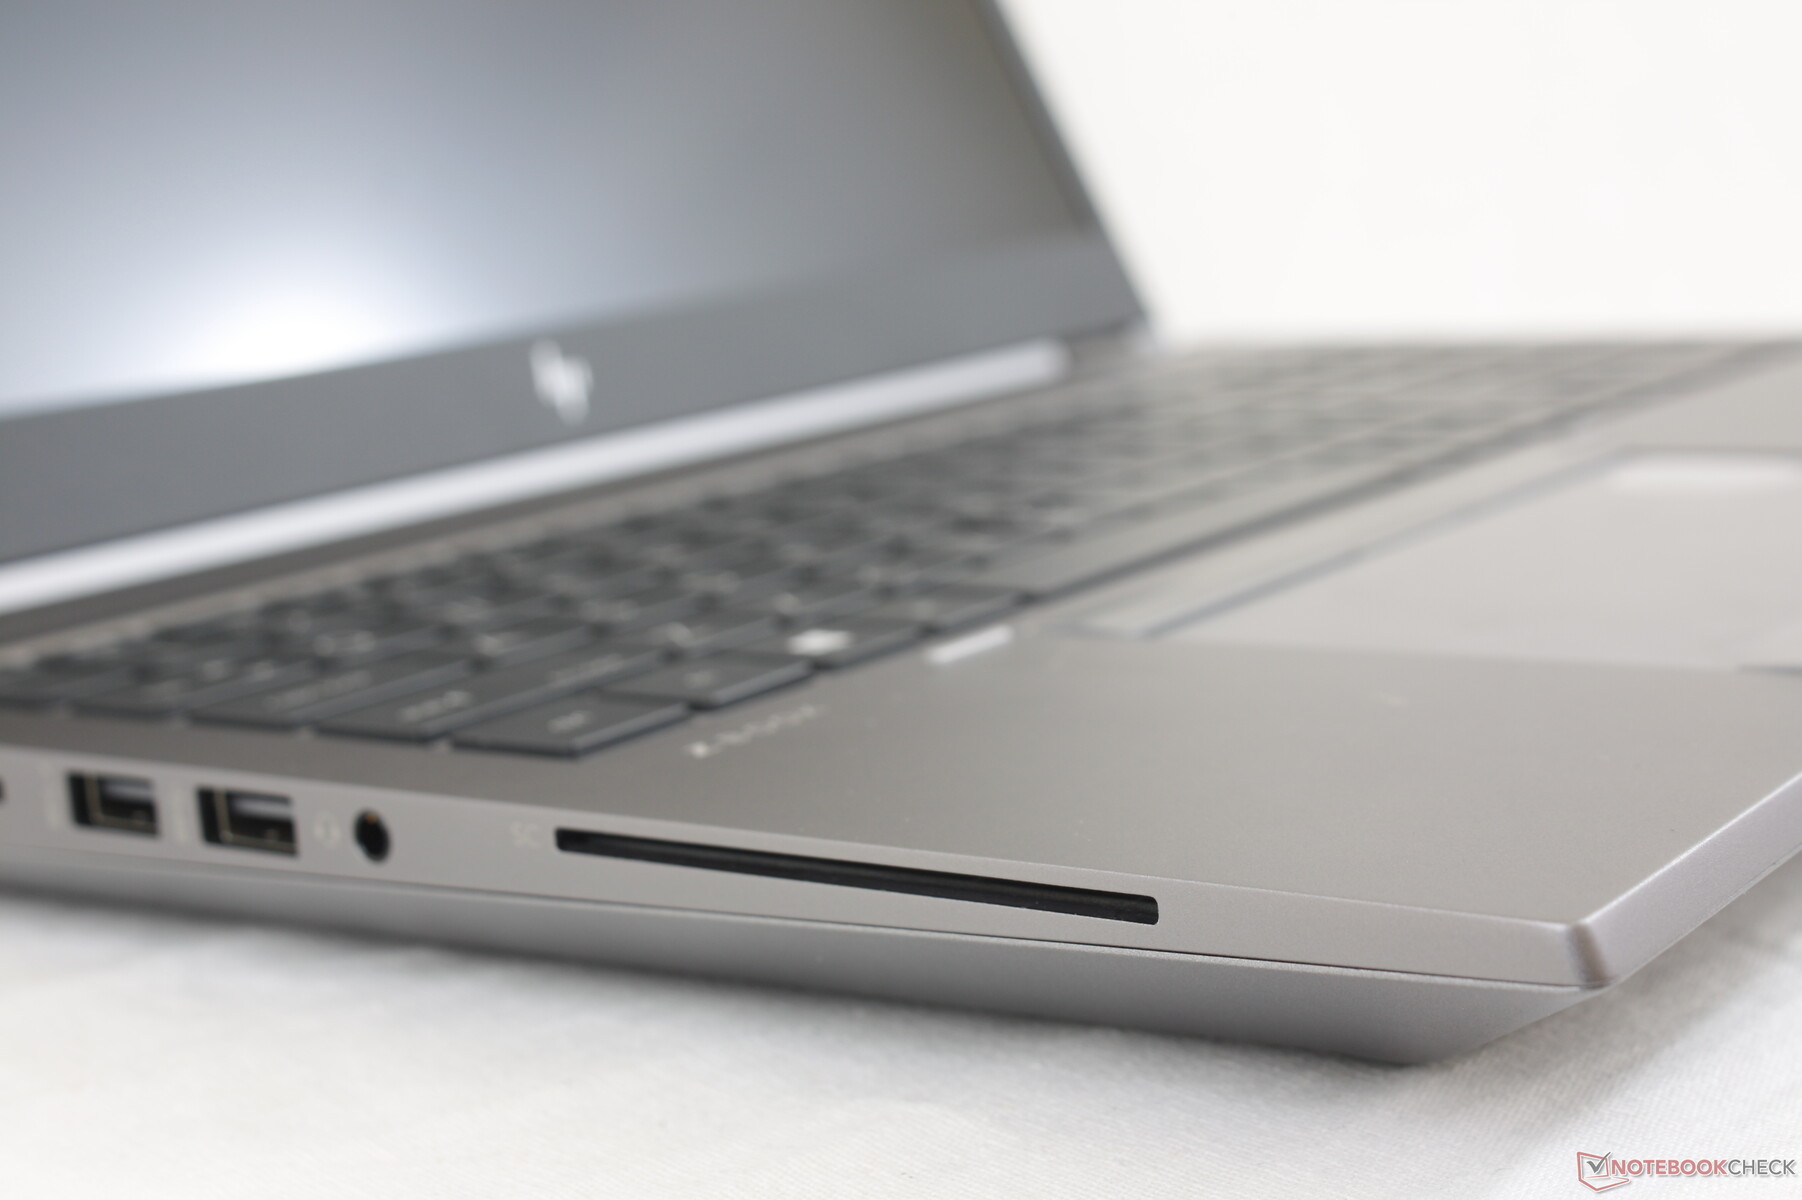
Le opzioni delle porta sono numerose e identiche a quelle del Dell Precision 7550. Il posizionamento delle porte è più accessibile sull'HP poiché non ce ne sono lungo il bordo posteriore.
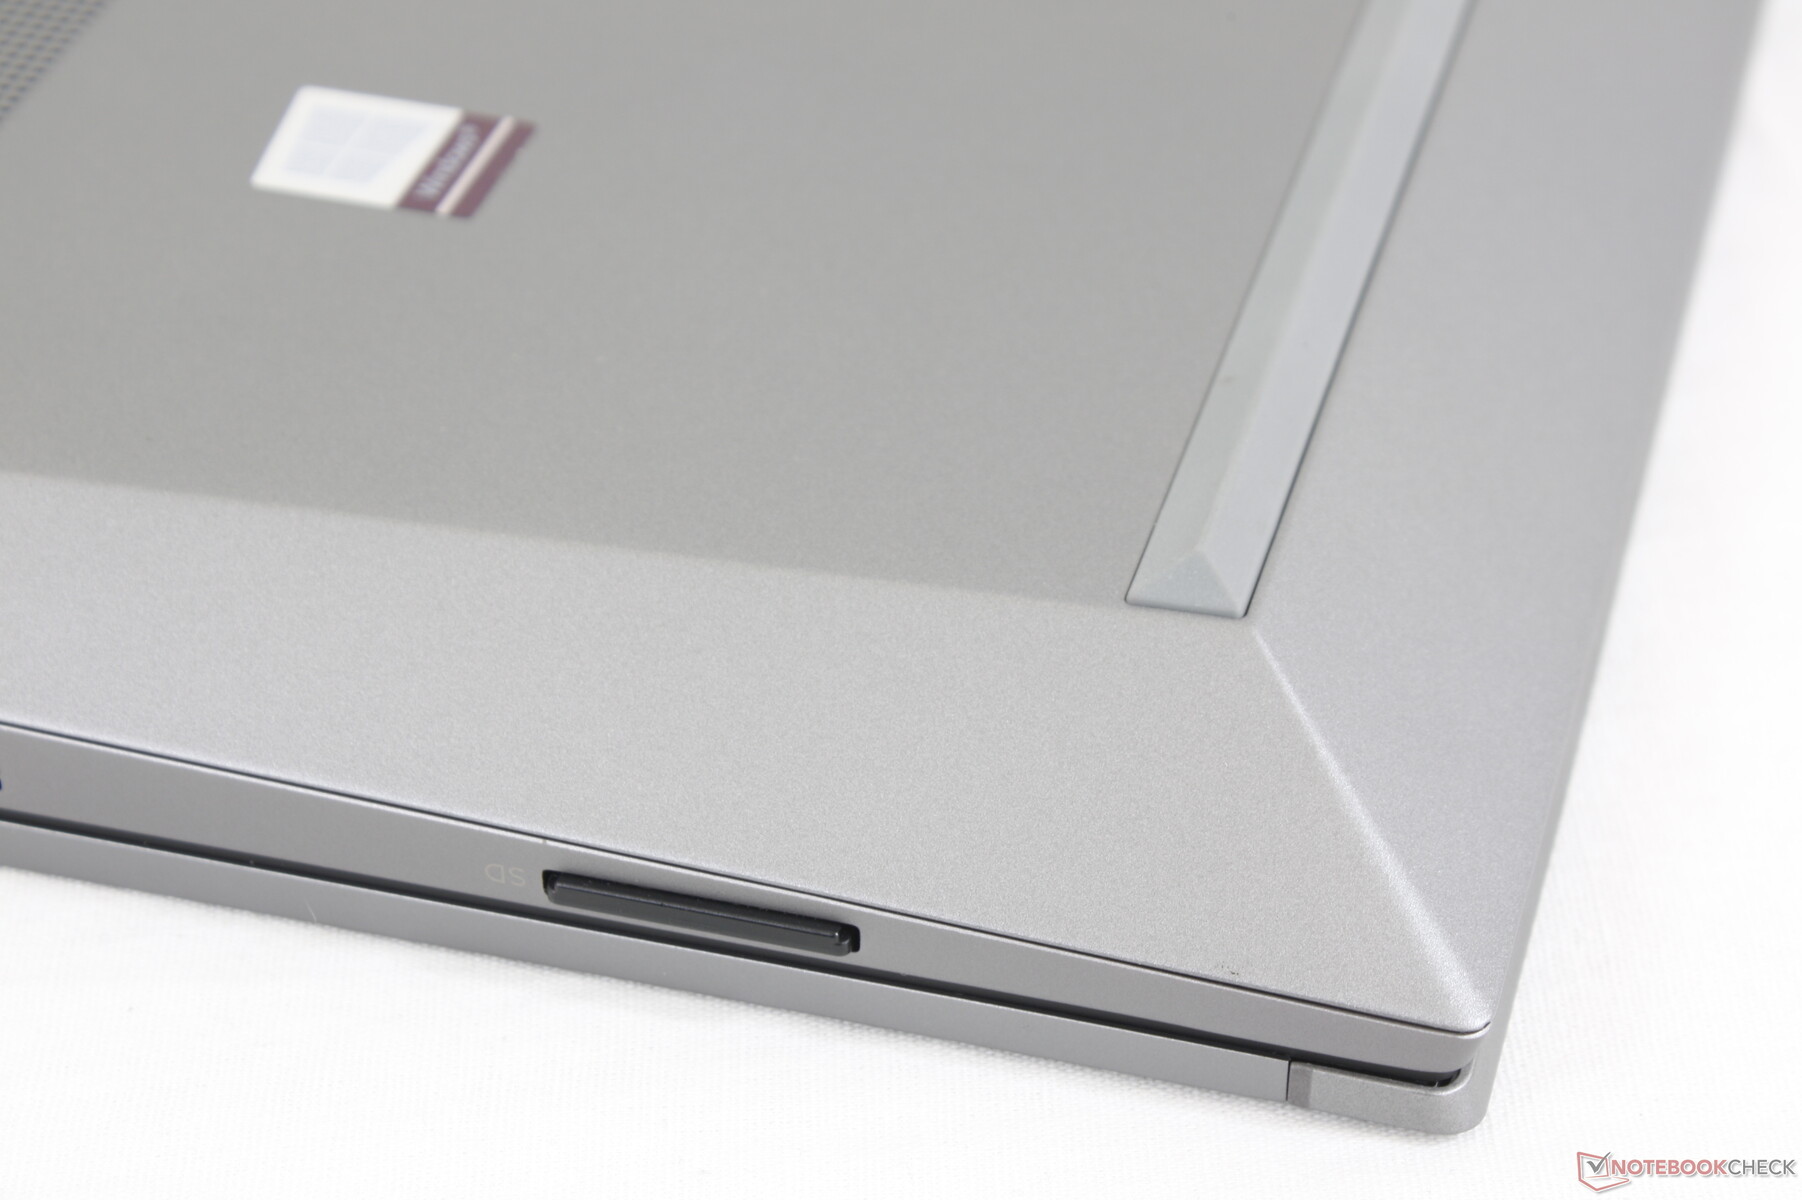
Lettore di schede SD
Il lettore di schede SD integrato offre velocità di trasferimento elevate. Lo spostamento di 1 GB di immagini dalla nostra scheda UHS-II al desktop richiede circa 6 secondi risultando essere in linea con la maggior parte delle altre workstations di fascia alta.
| SD Card Reader | |
| average JPG Copy Test (av. of 3 runs) | |
| MSI WS66 10TMT-207US (Toshiba Exceria Pro SDXC 64 GB UHS-II) | |
| Dell Precision 7550 (Toshiba Exceria Pro SDXC 64 GB UHS-II) | |
| Lenovo ThinkPad P1 2019-20QT000RGE (Toshiba Exceria Pro SDXC 64 GB UHS-II) | |
| HP ZBook Fury 15 G7 (Toshiba Exceria Pro SDXC 64 GB UHS-II) | |
| Razer Blade 15 Studio Edition 2020 (Toshiba Exceria Pro SDXC 64 GB UHS-II) | |
| maximum AS SSD Seq Read Test (1GB) | |
| MSI WS66 10TMT-207US (Toshiba Exceria Pro SDXC 64 GB UHS-II) | |
| HP ZBook Fury 15 G7 (Toshiba Exceria Pro SDXC 64 GB UHS-II) | |
| Lenovo ThinkPad P1 2019-20QT000RGE (Toshiba Exceria Pro SDXC 64 GB UHS-II) | |
| Dell Precision 7550 (Toshiba Exceria Pro SDXC 64 GB UHS-II) | |
Comunicazioni
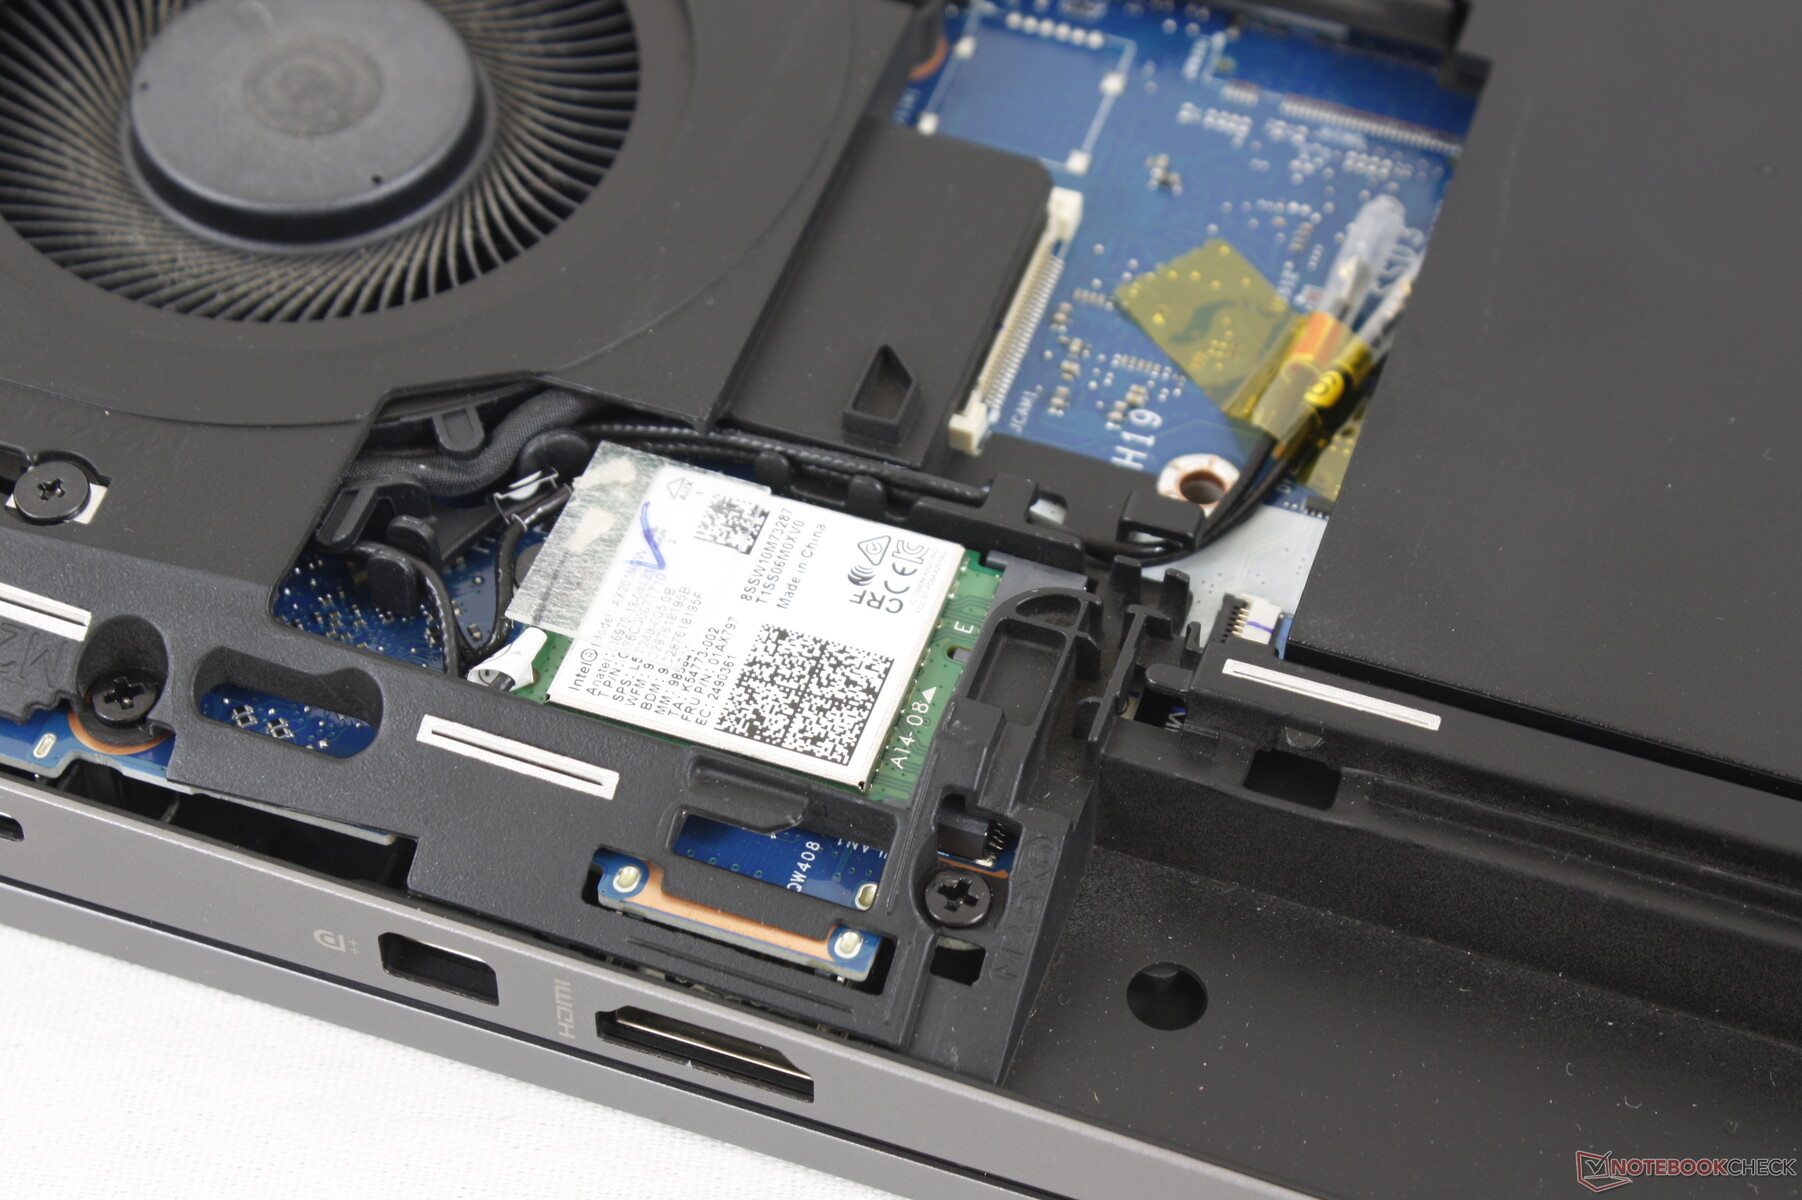
L'Intel AX201 viene fornito di serie per la connettività Wi-Fi 6 e Bluetooth 5.1. Non abbiamo riscontrato alcun problema quando l'abbiamo accoppiato al nostro router di prova Netgear RAX200. La velocità media di trasferimento varia a seconda dell'ambiente.
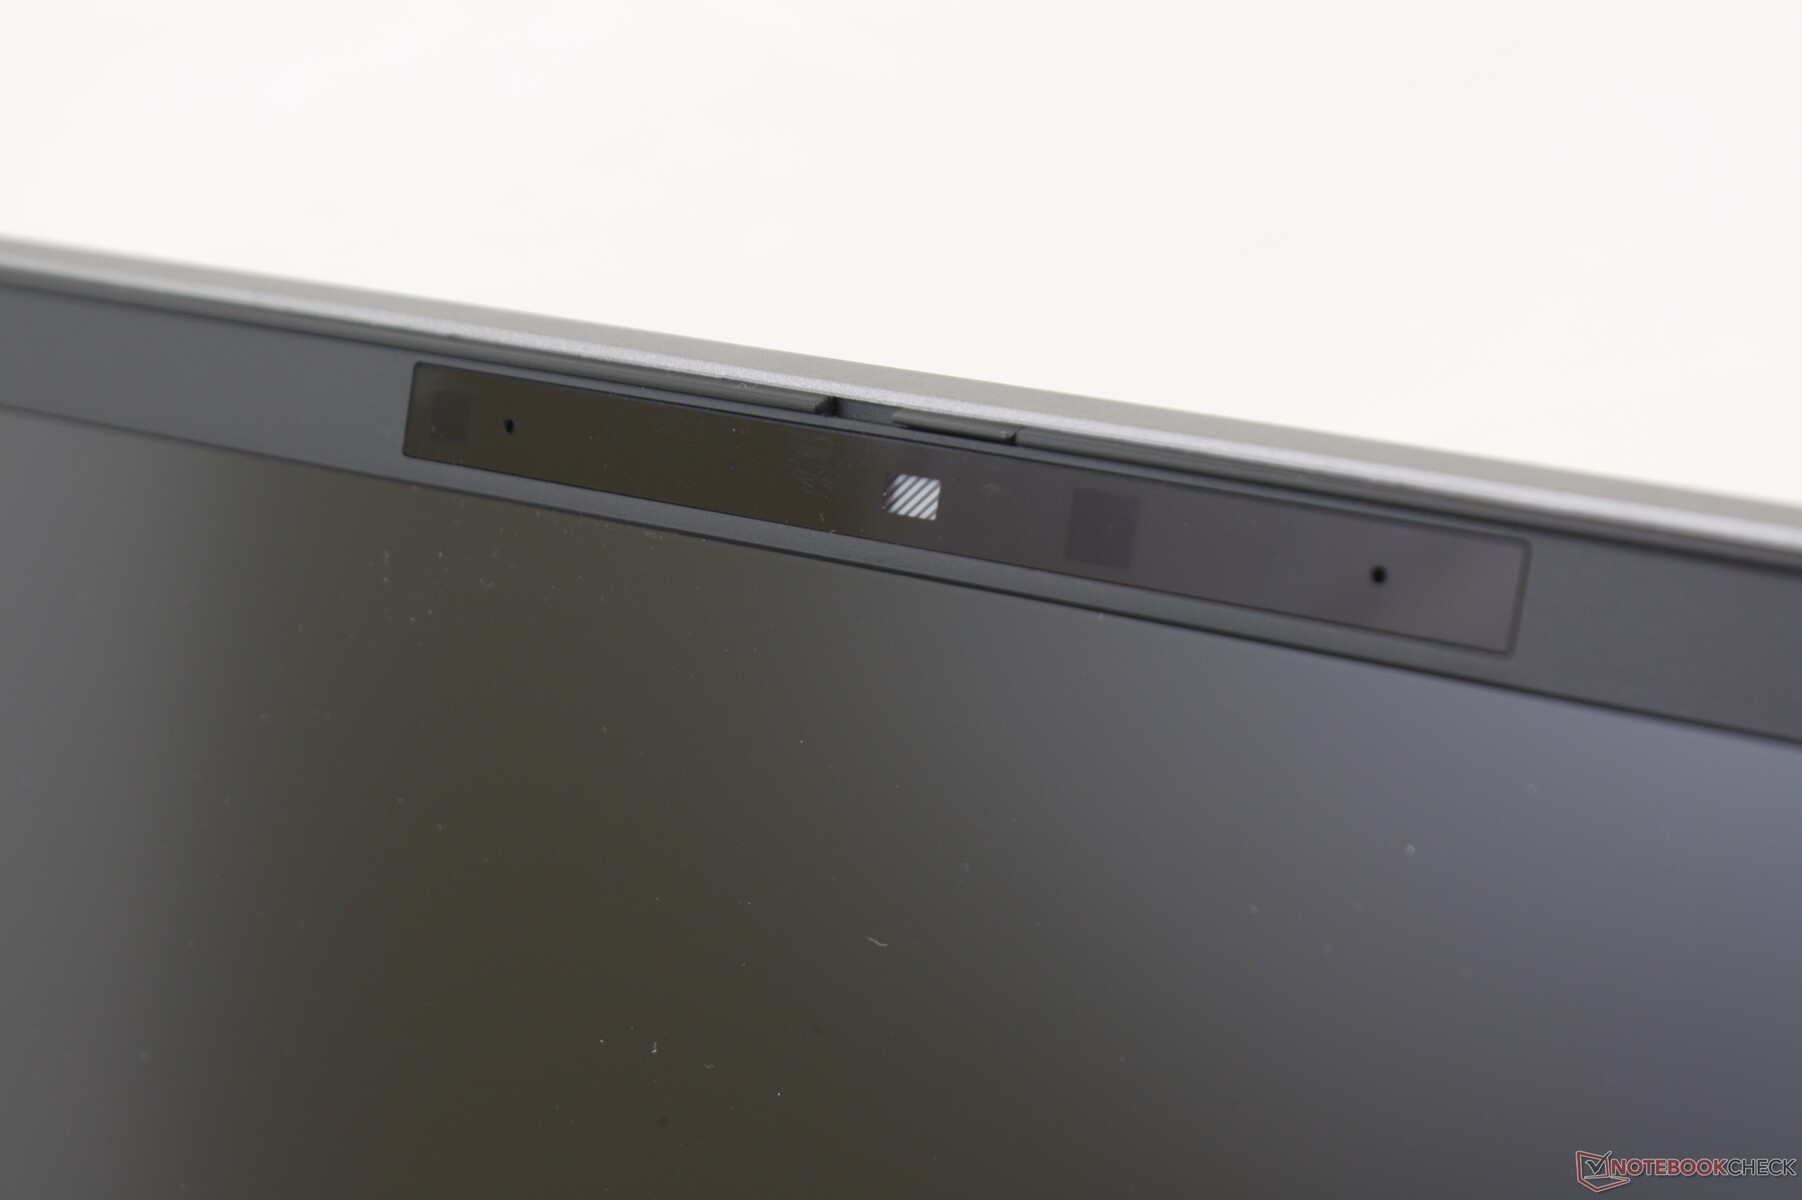
Webcam


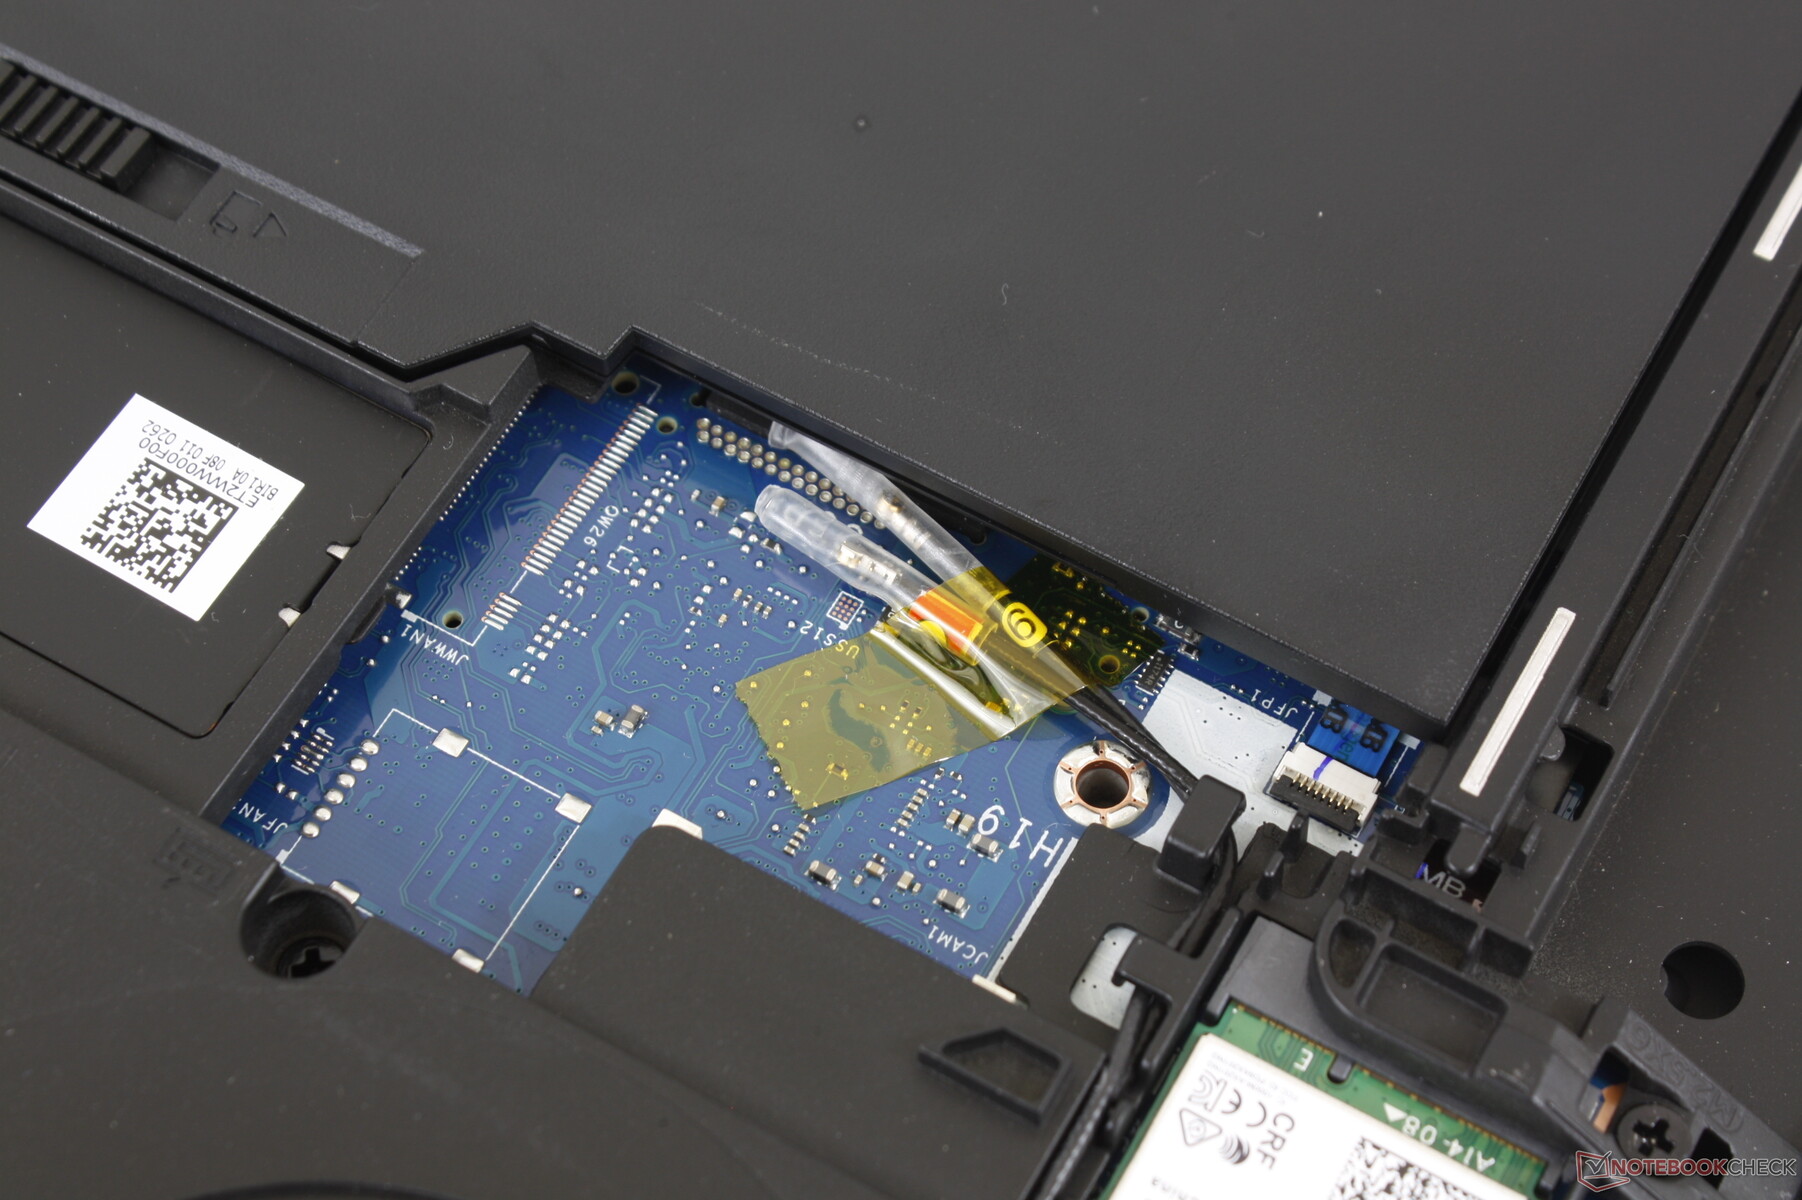
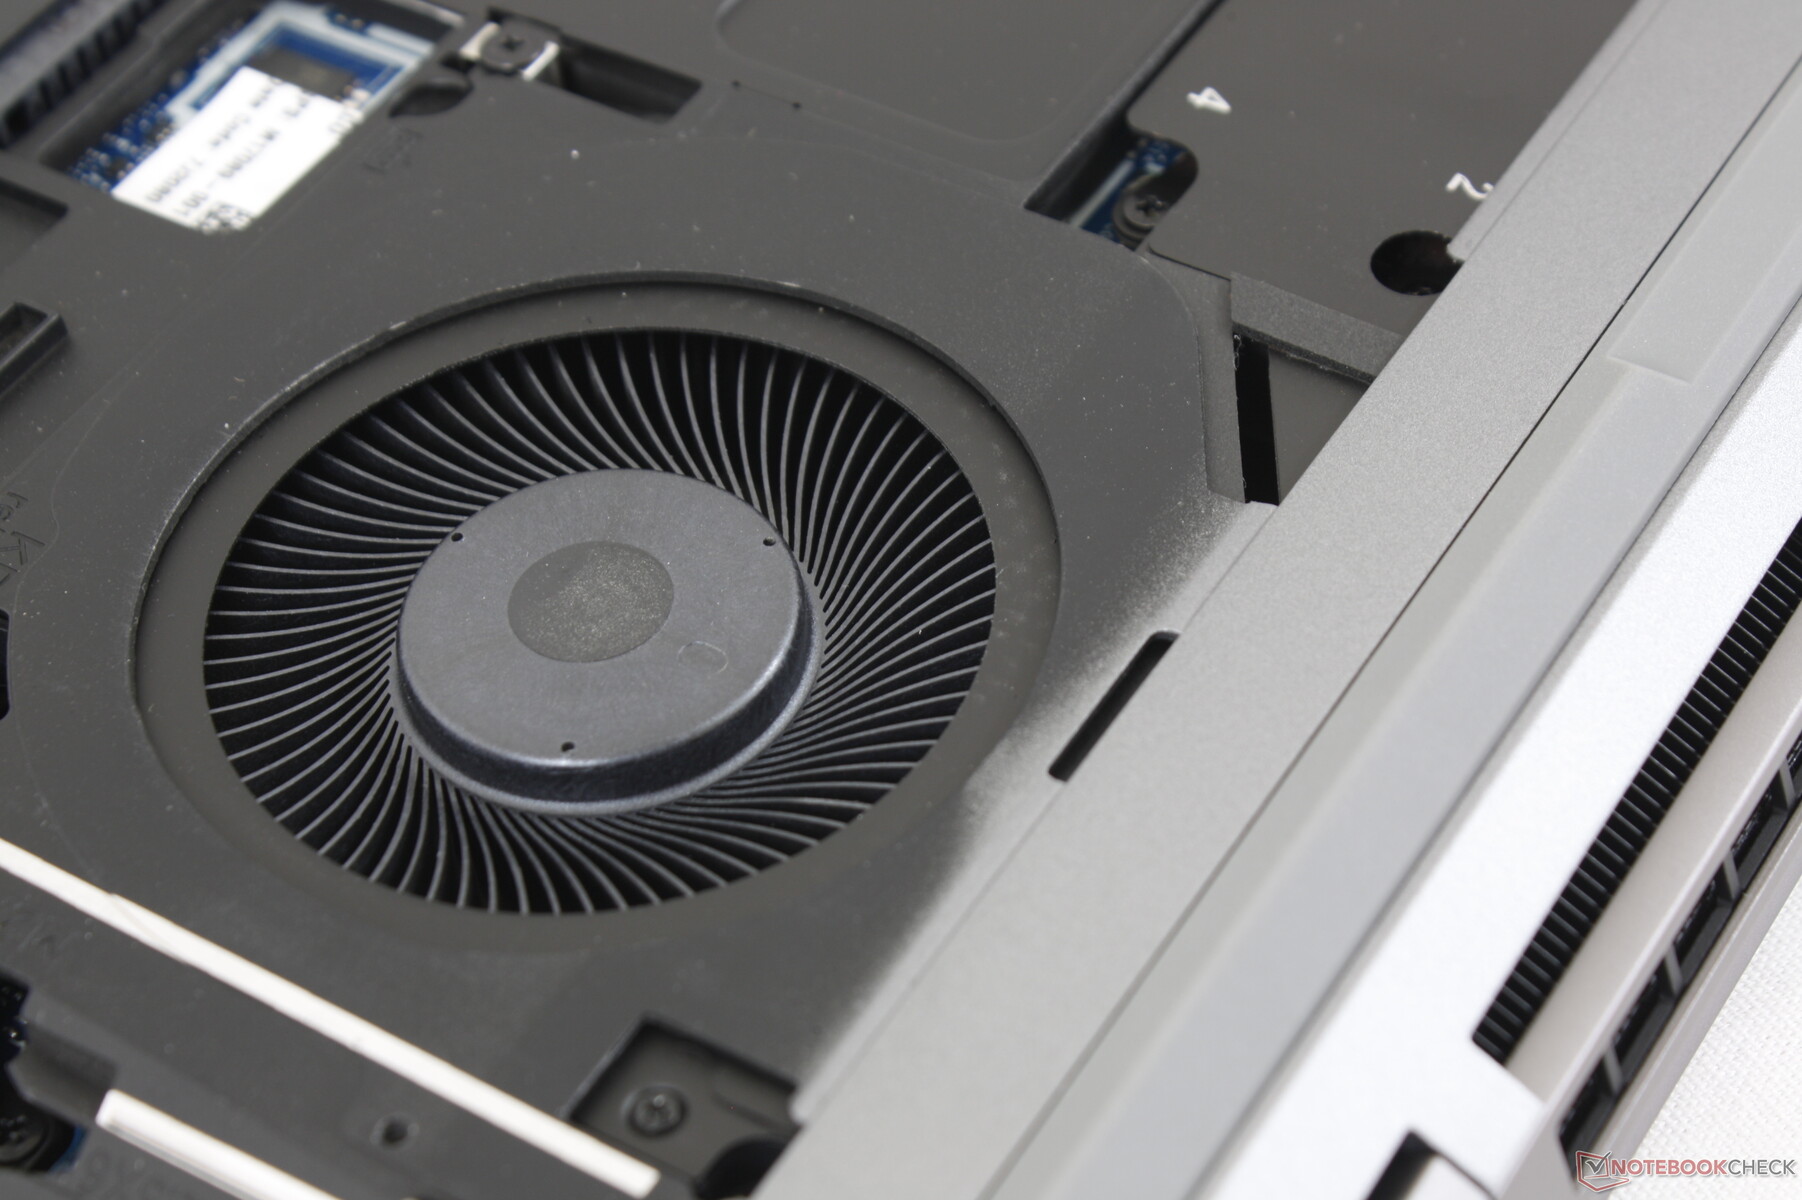
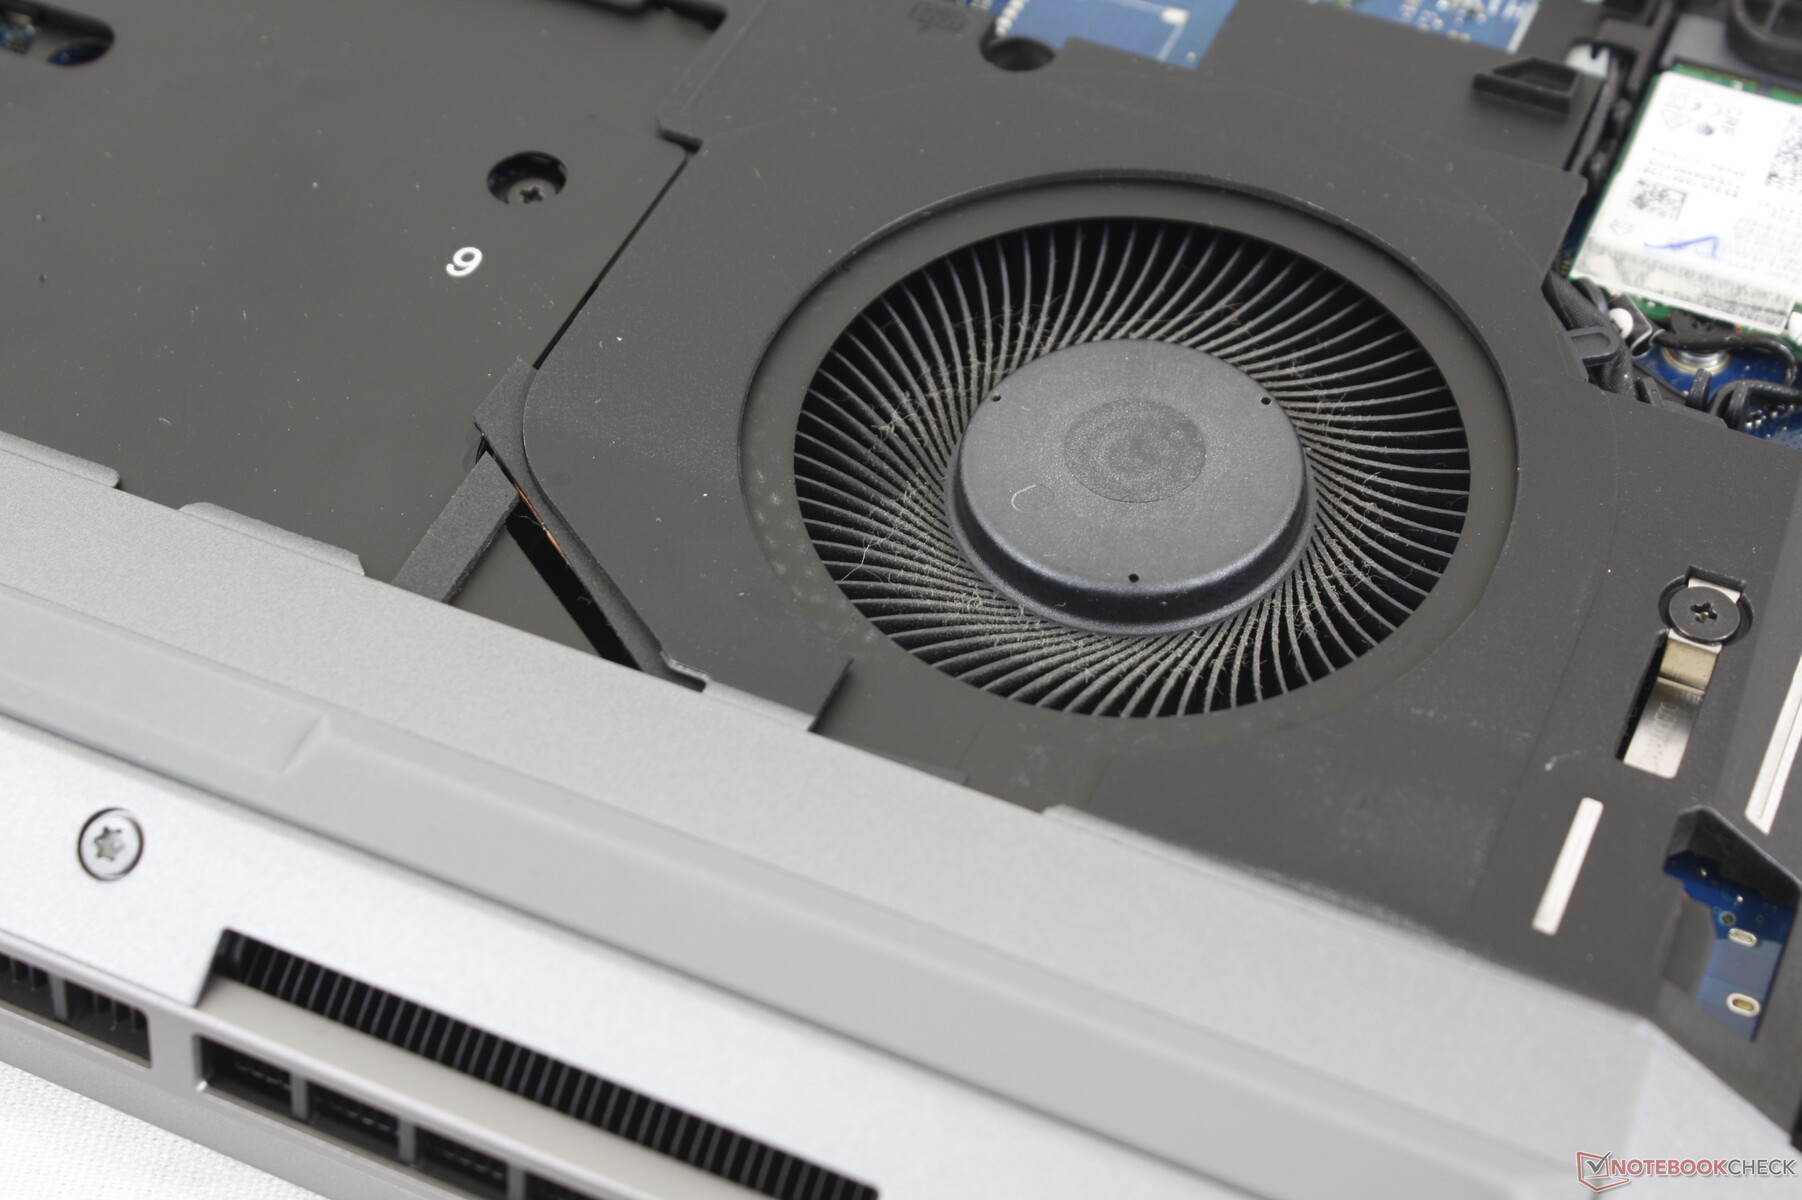
Manutenzione
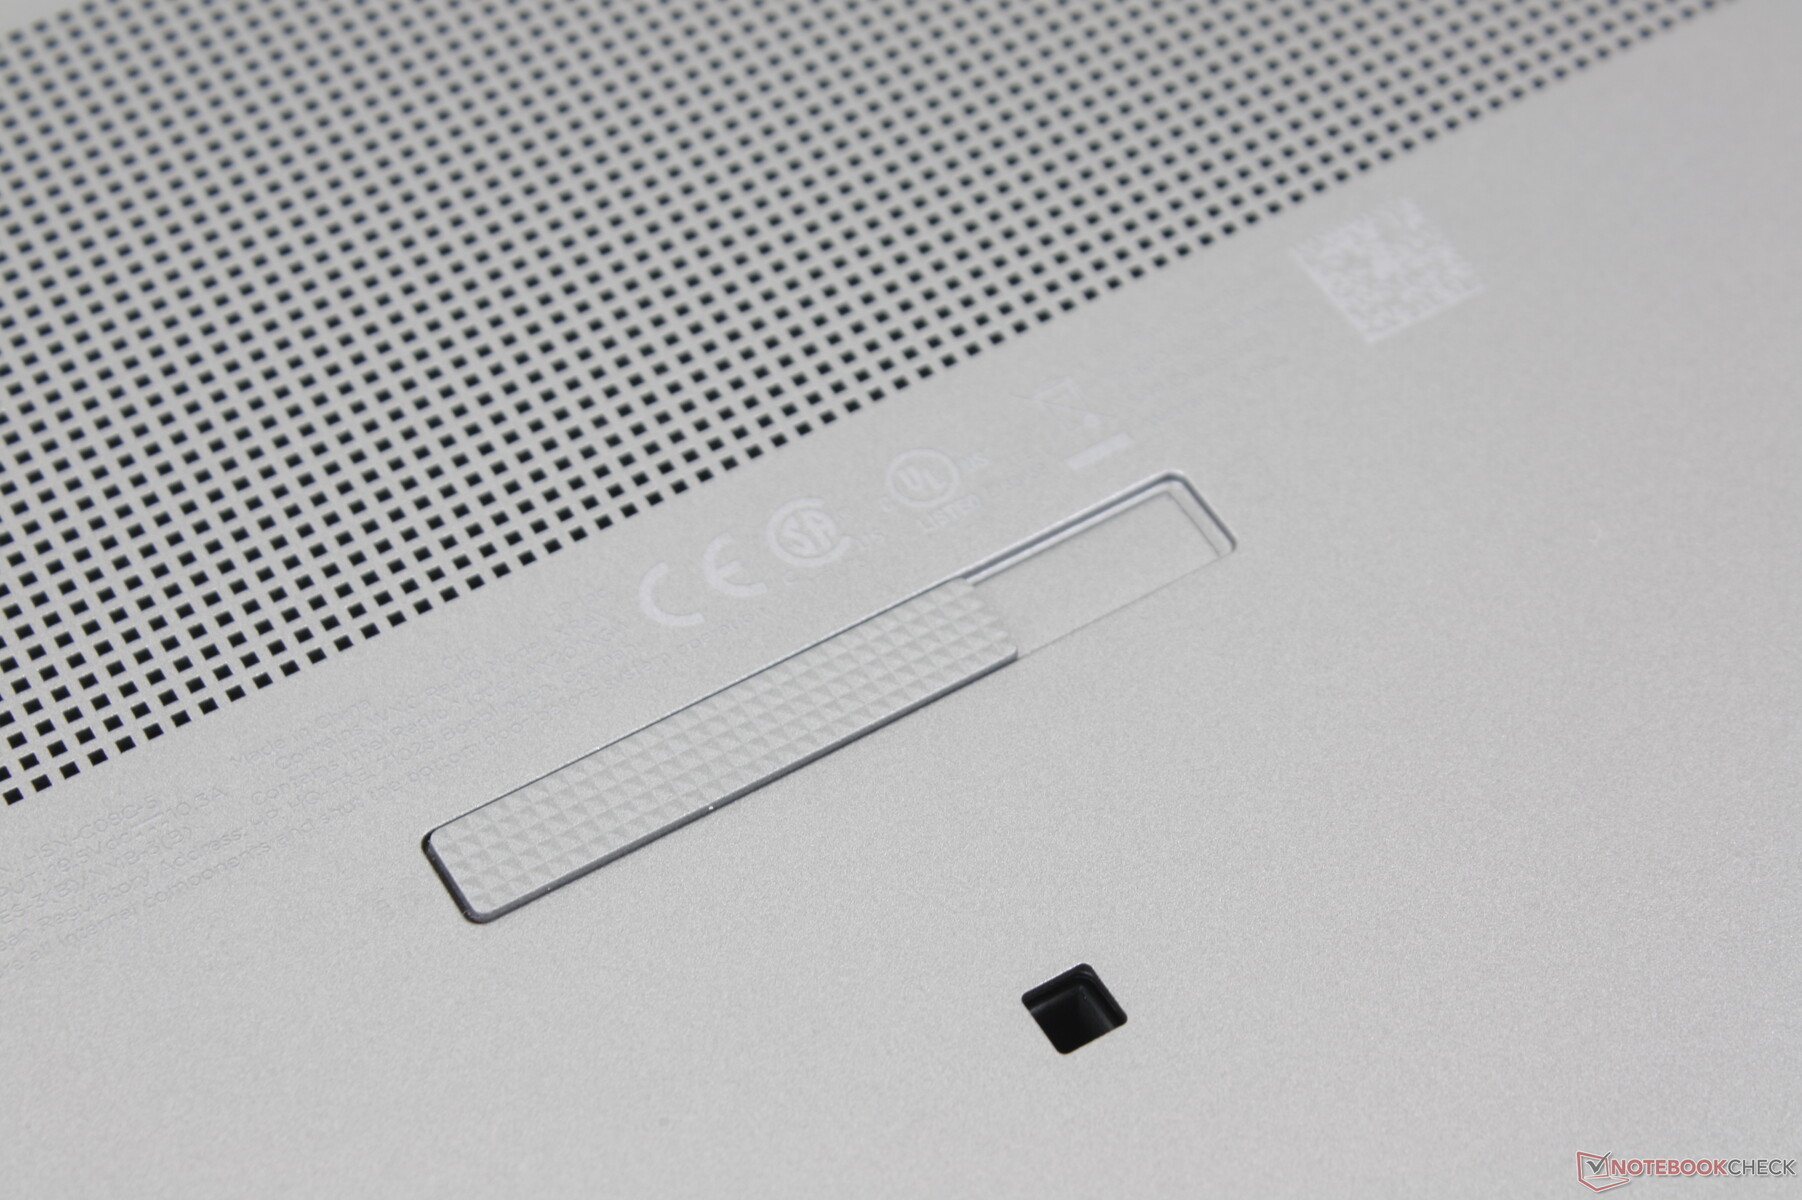
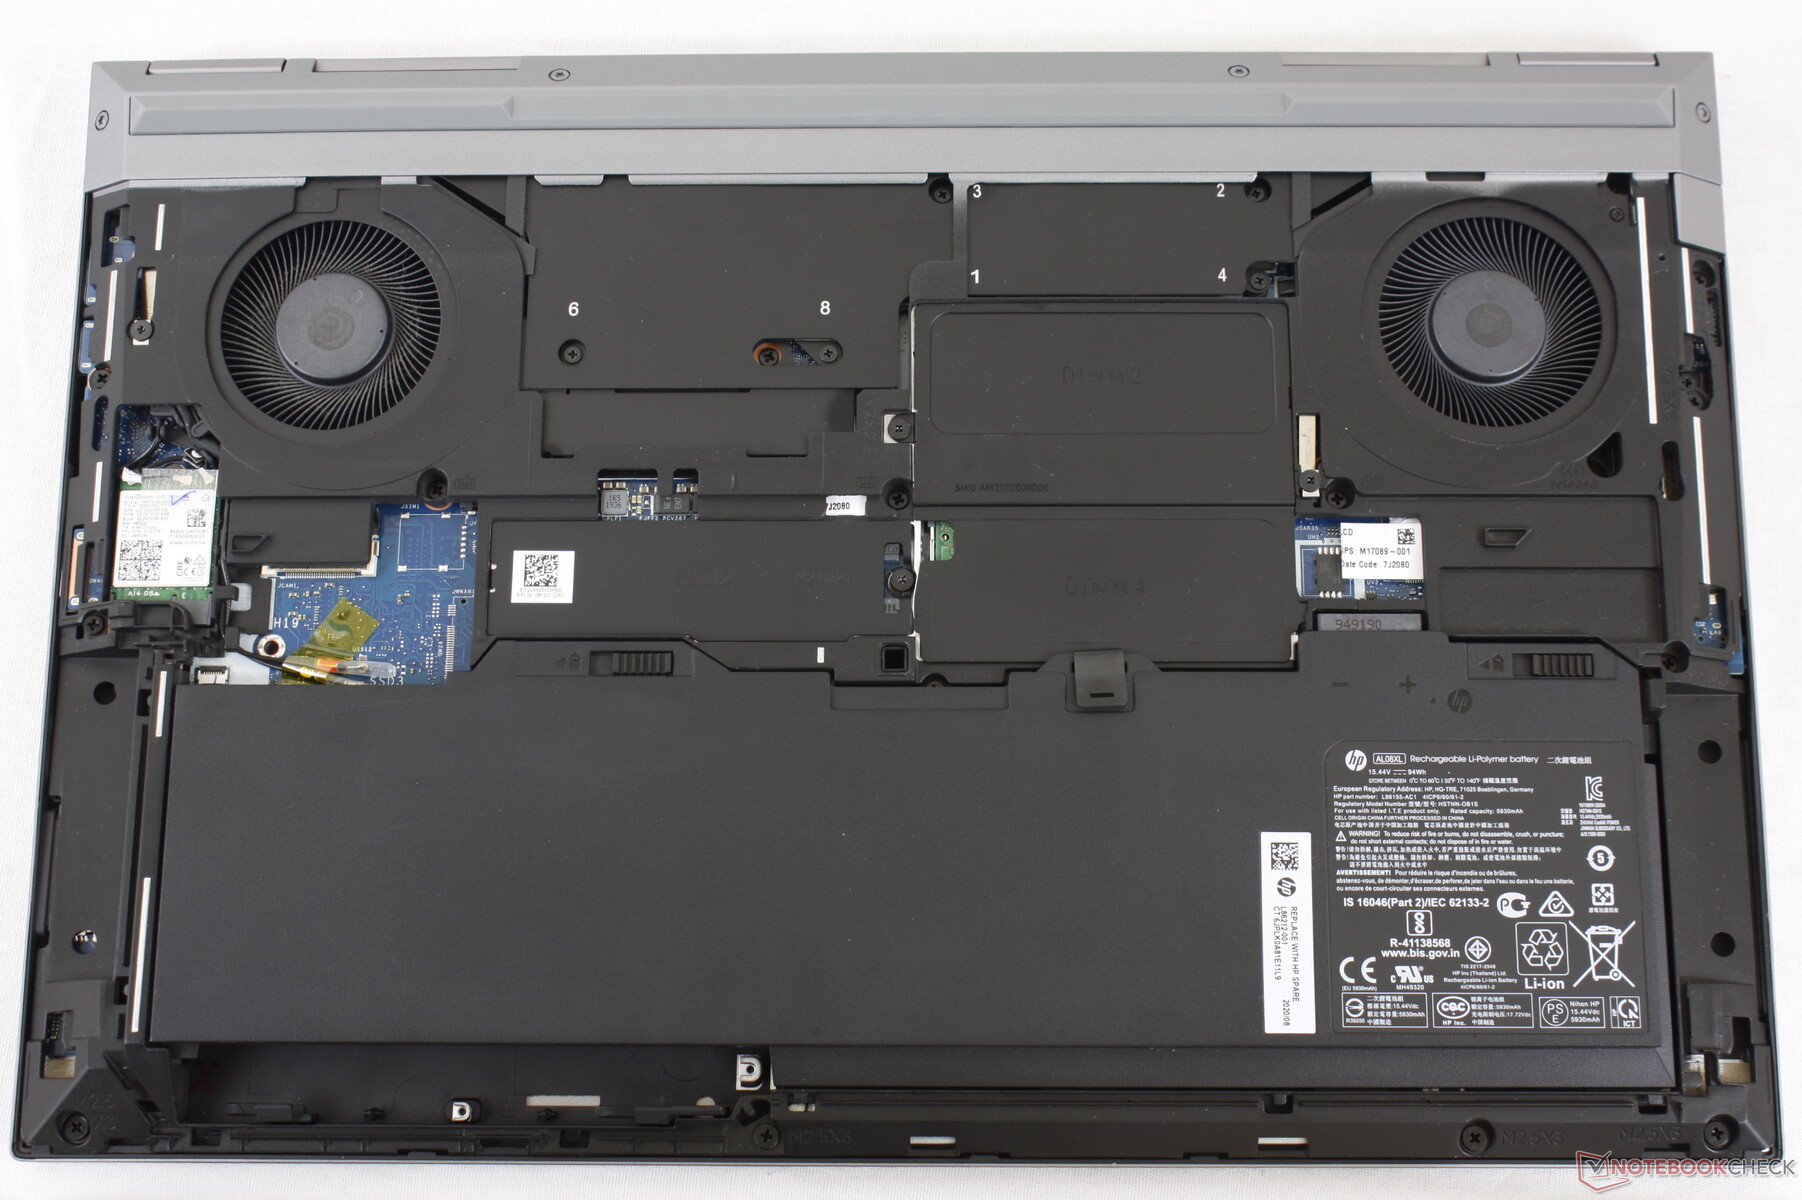
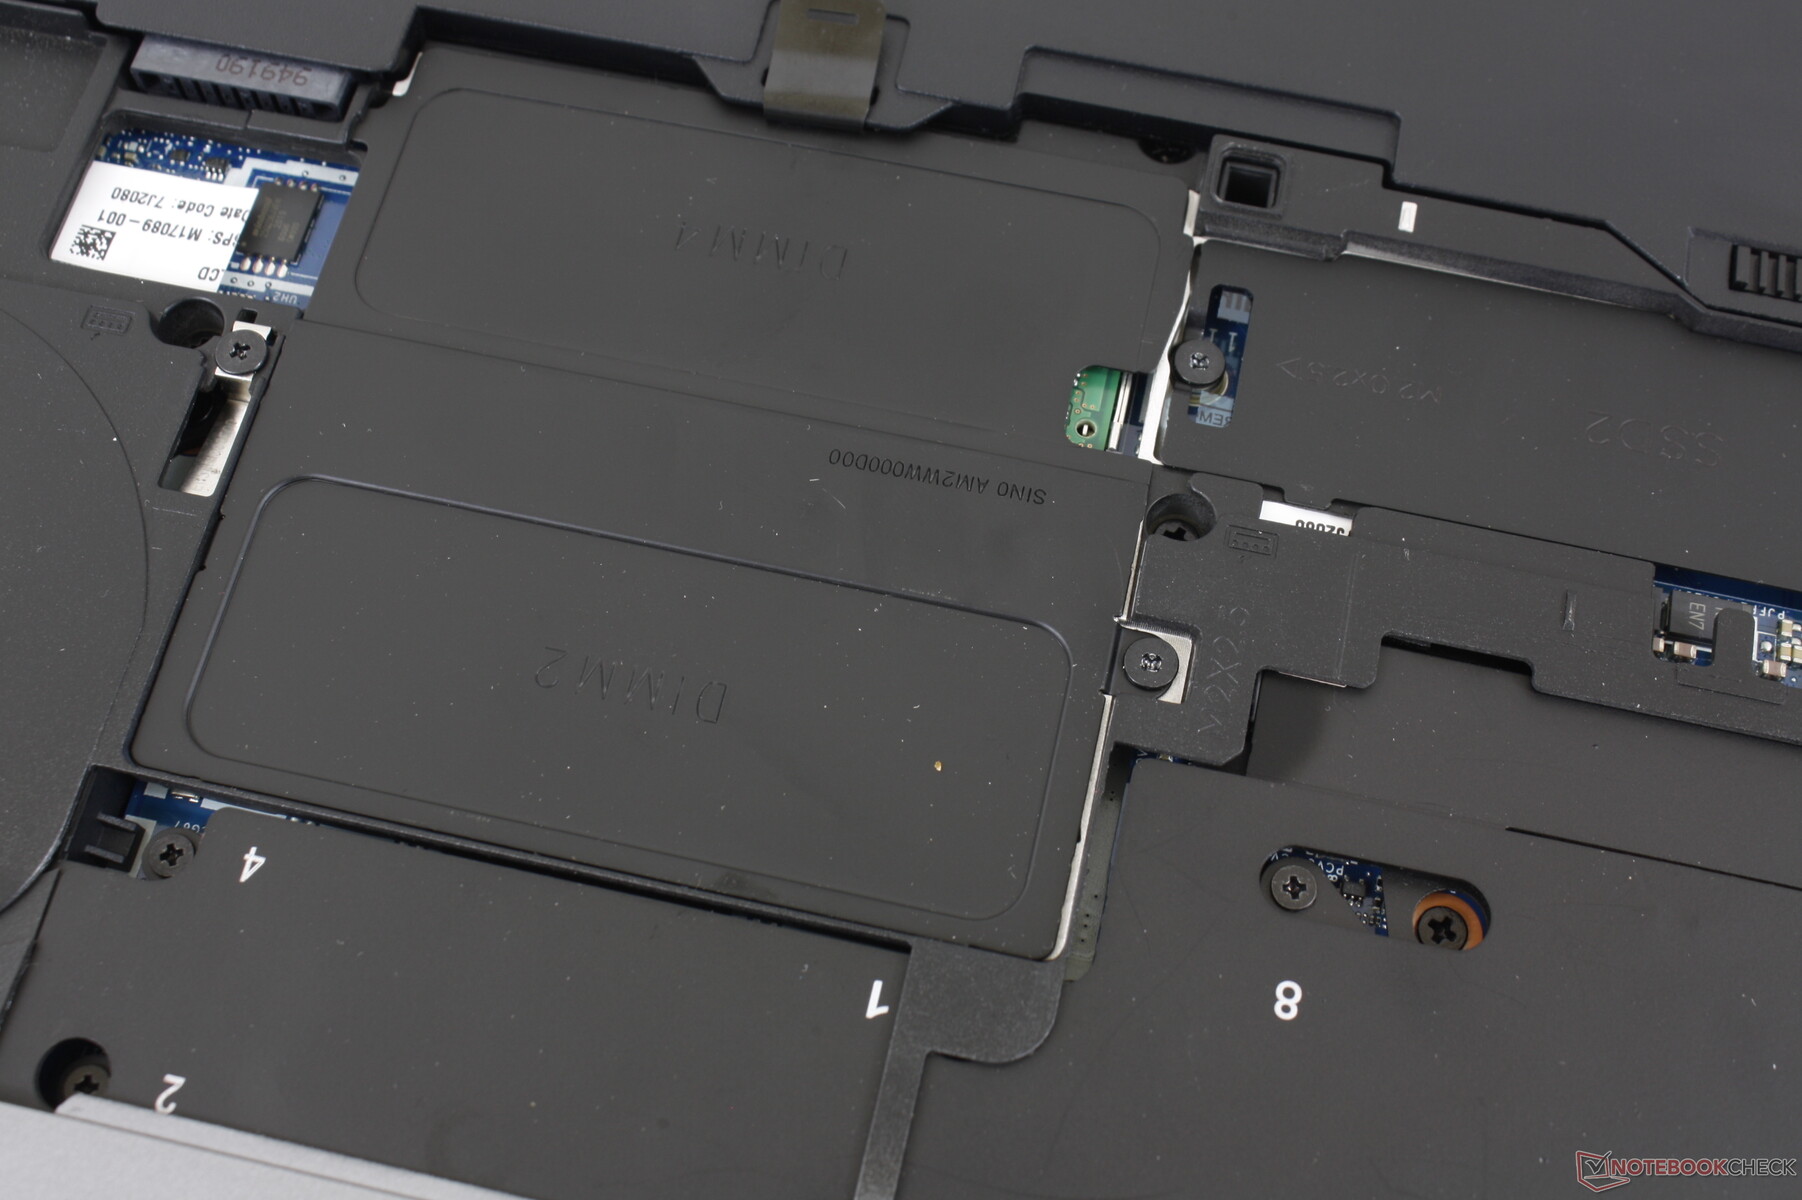
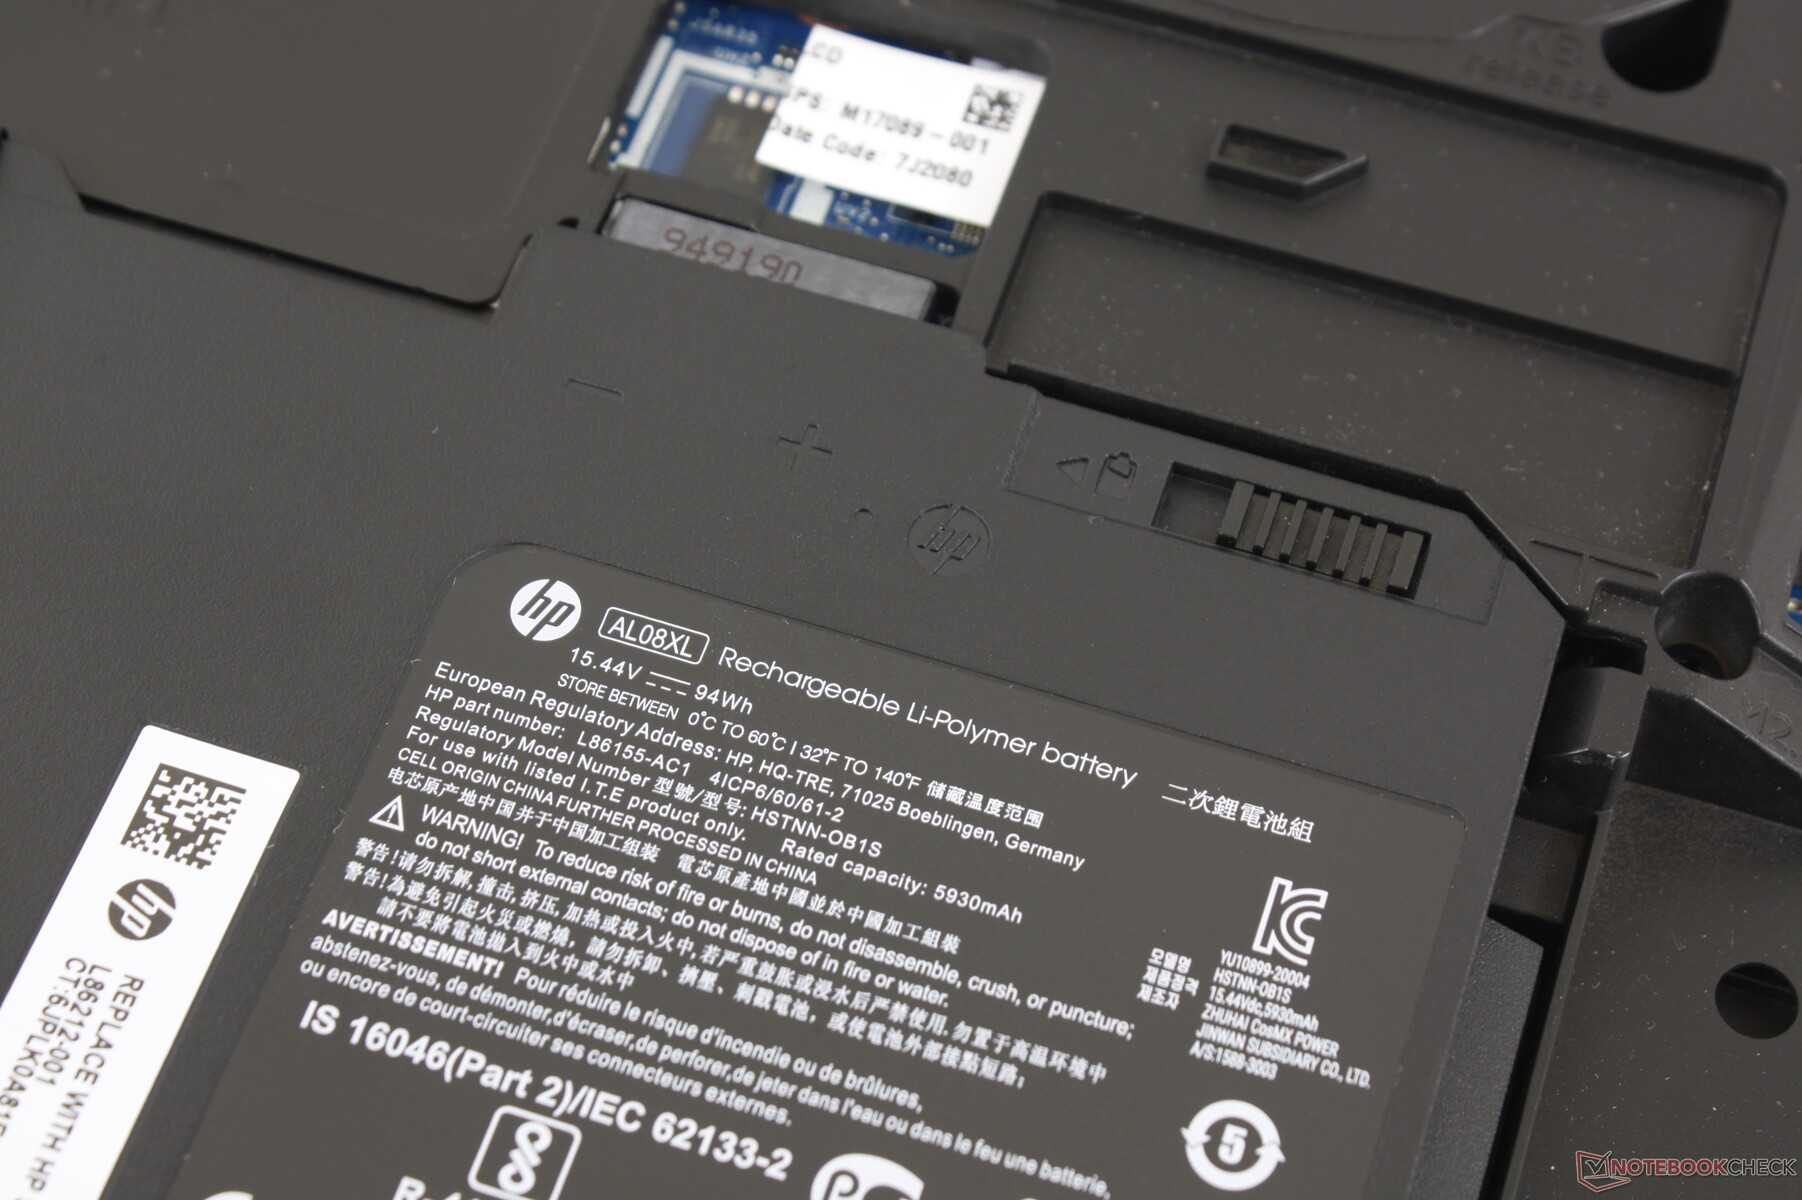
HP pubblicizza la manutenzione "senza attrezzi" perché il pannello inferiore e la batteria principale possono essere facilmente rimossi sganciando un paio di ganci. Noi amiamo assolutamente questo approccio e pensiamo che più OEM dovrebbero implementare qualcosa di simile per i loro portatili professionali. Sfortunatamente, c'è un grande avvertimento da fare: un cacciavite è ancora necessario per accedere a quasi tutto il resto. La RAM e lo storage sono dietro una schermatura aggiuntiva, il che significa che il design "tool-less" non riguarda tutto.
Inoltre, le viti che fissano la RAM e gli slot SSD sono vicine e strette, il che significa che possono uscire più facilmente. Abbiamo smontato molti computer portatili nei nostri laboratori e le viti di questo HP sono più difficili da rimuovere
Accessori e garanzia
Non ci sono extra nella confezione oltre ai soliti documenti e all'adattatore. Tuttavia, ci sono un sacco molte docking stations e accessori opzionali tra cui l'HP Thunderbolt Dock.
Una garanzia limitata di tre anni viene fornita di serie con opzioni di estensione se ordinata direttamente da HP.
Dispositivi di input
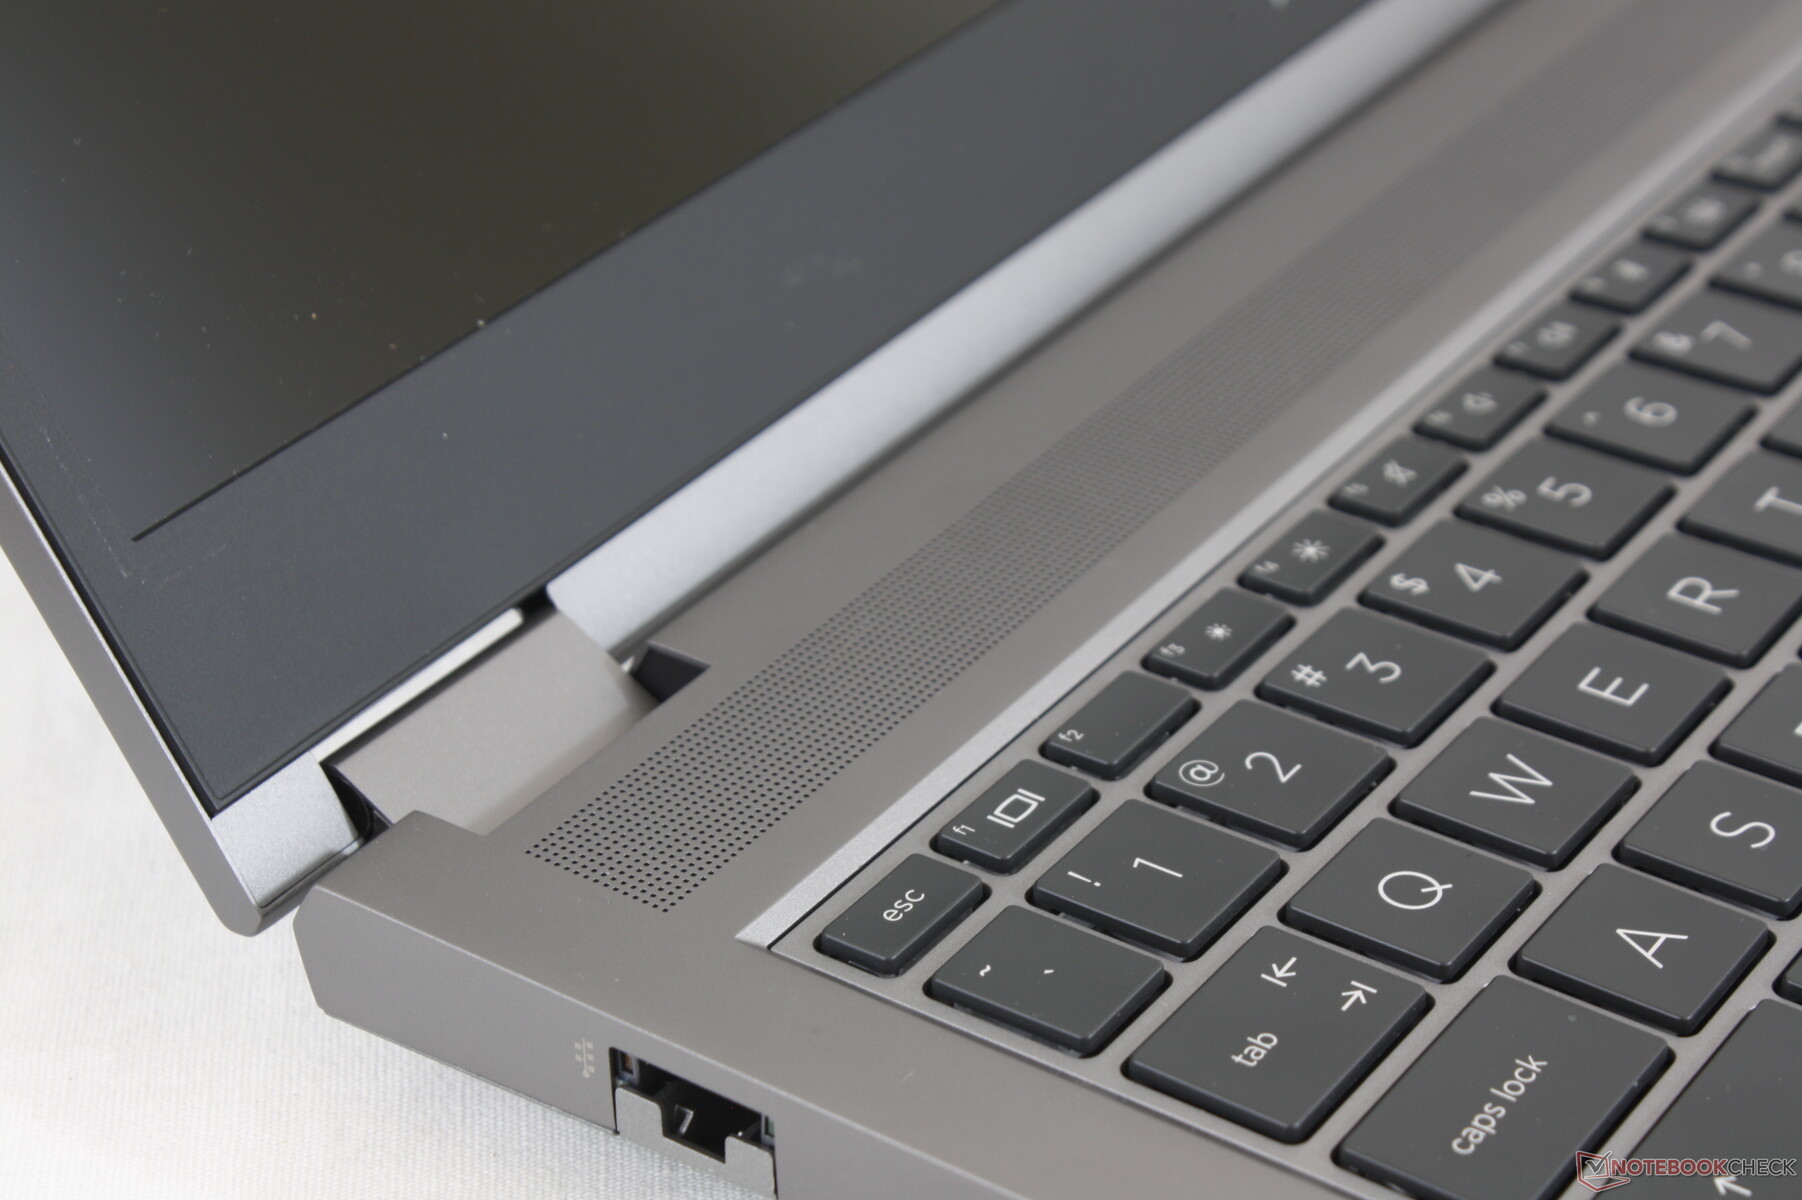
Tastiera
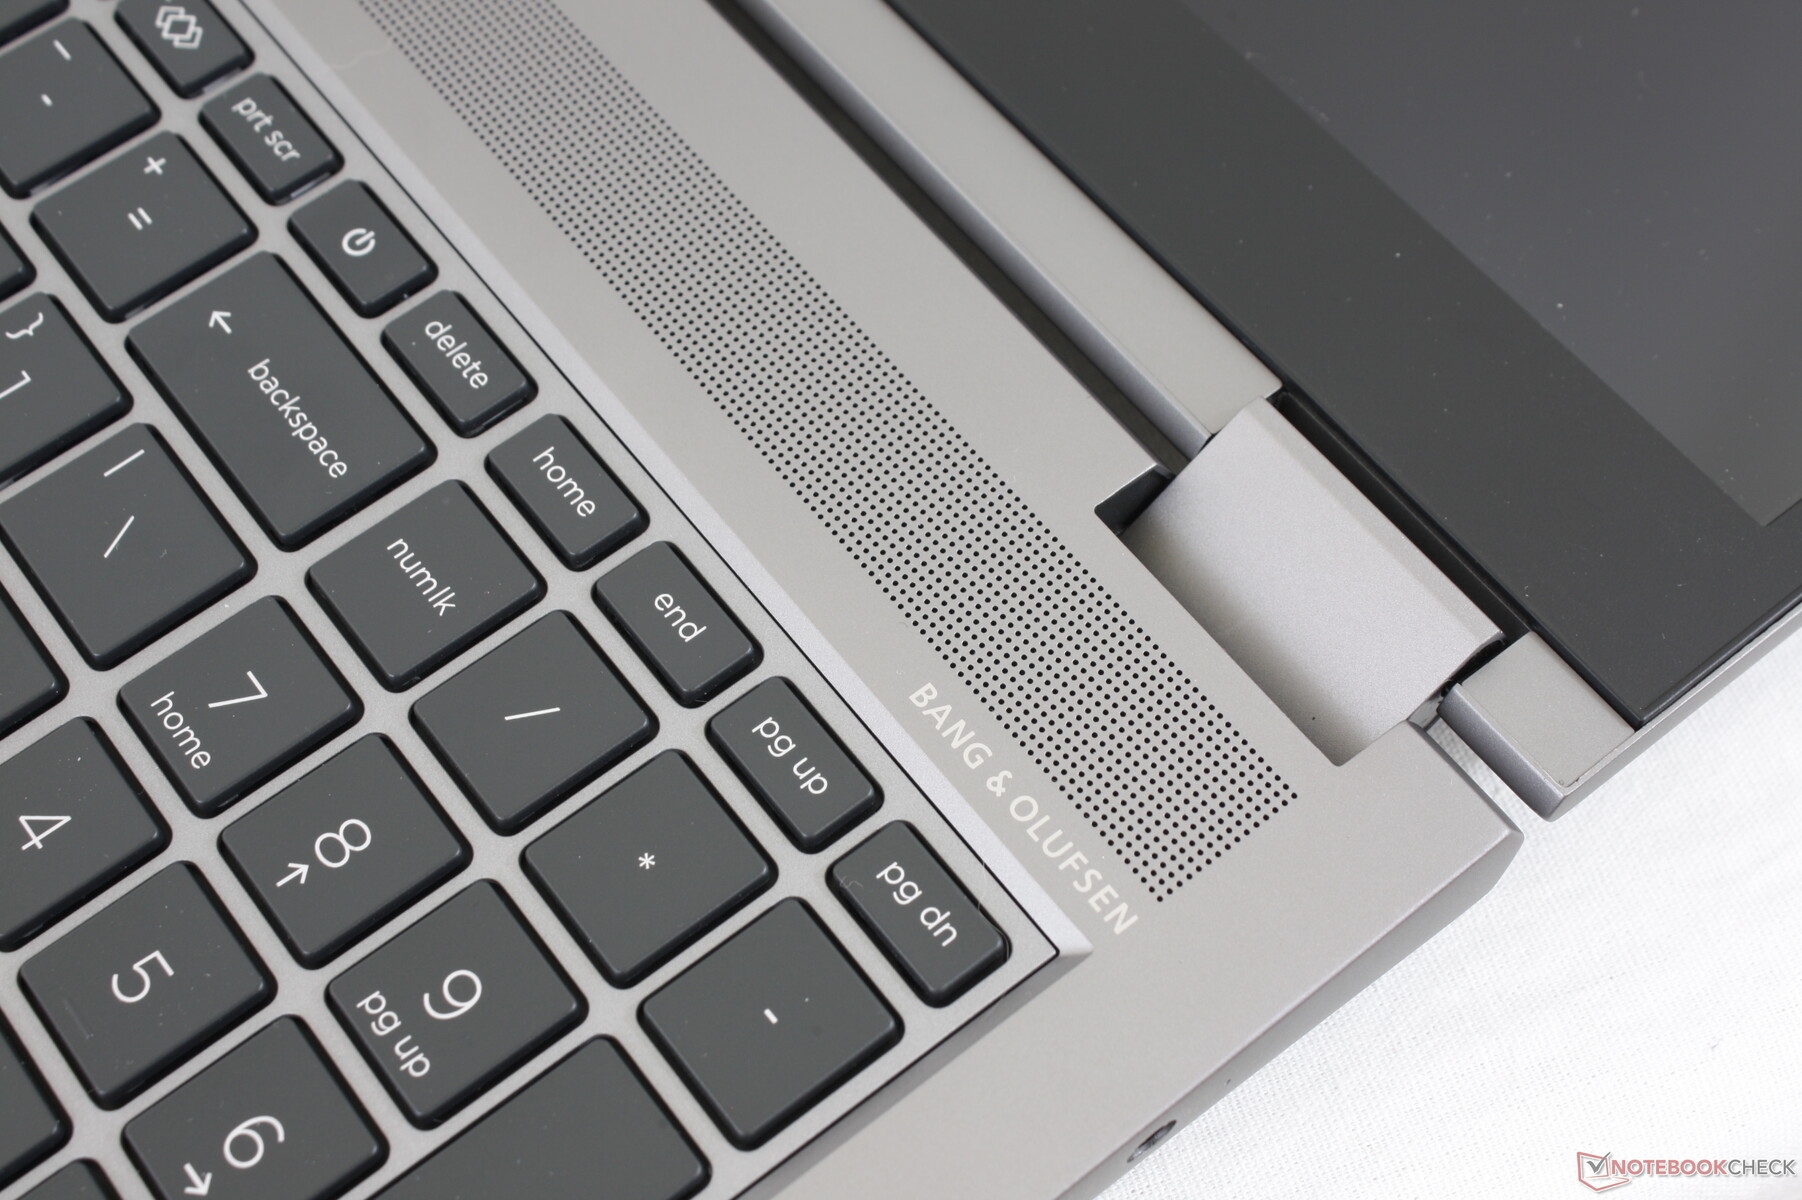
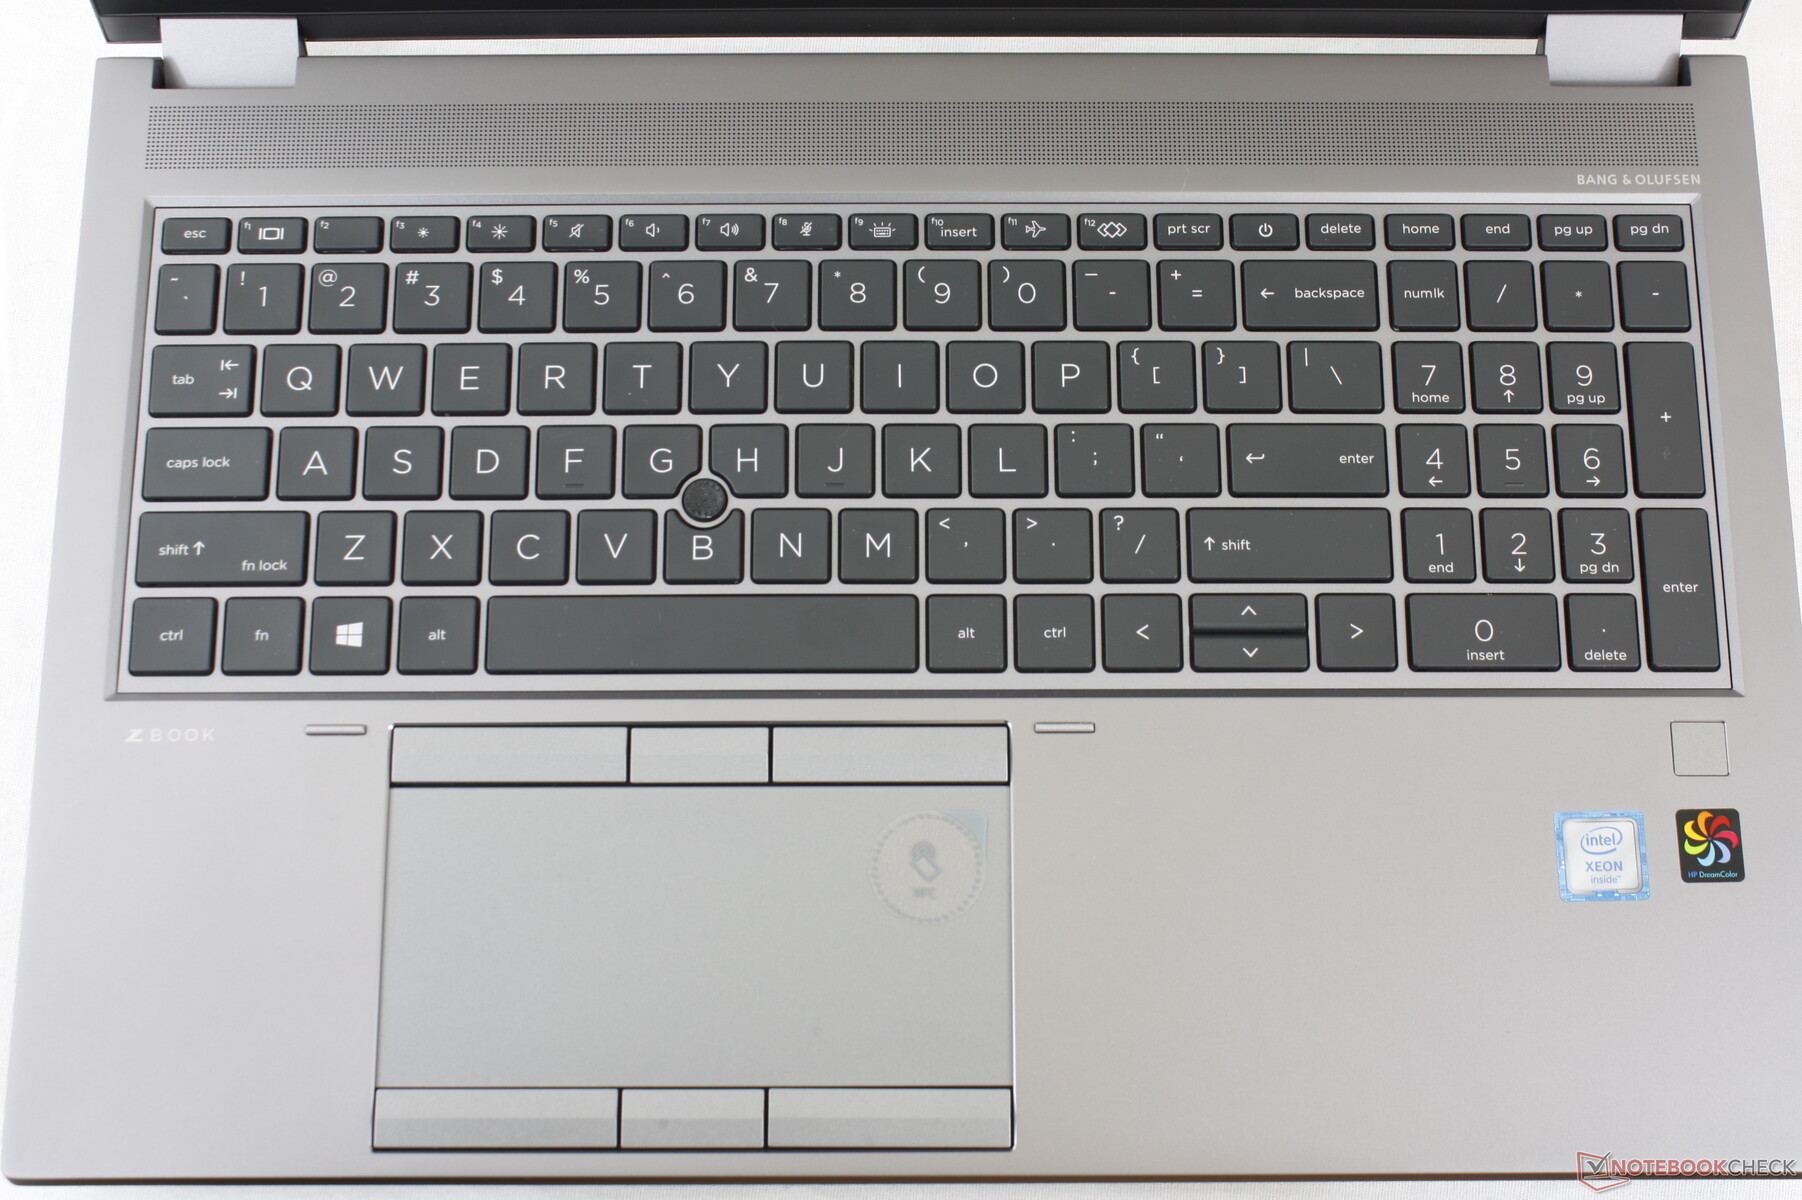
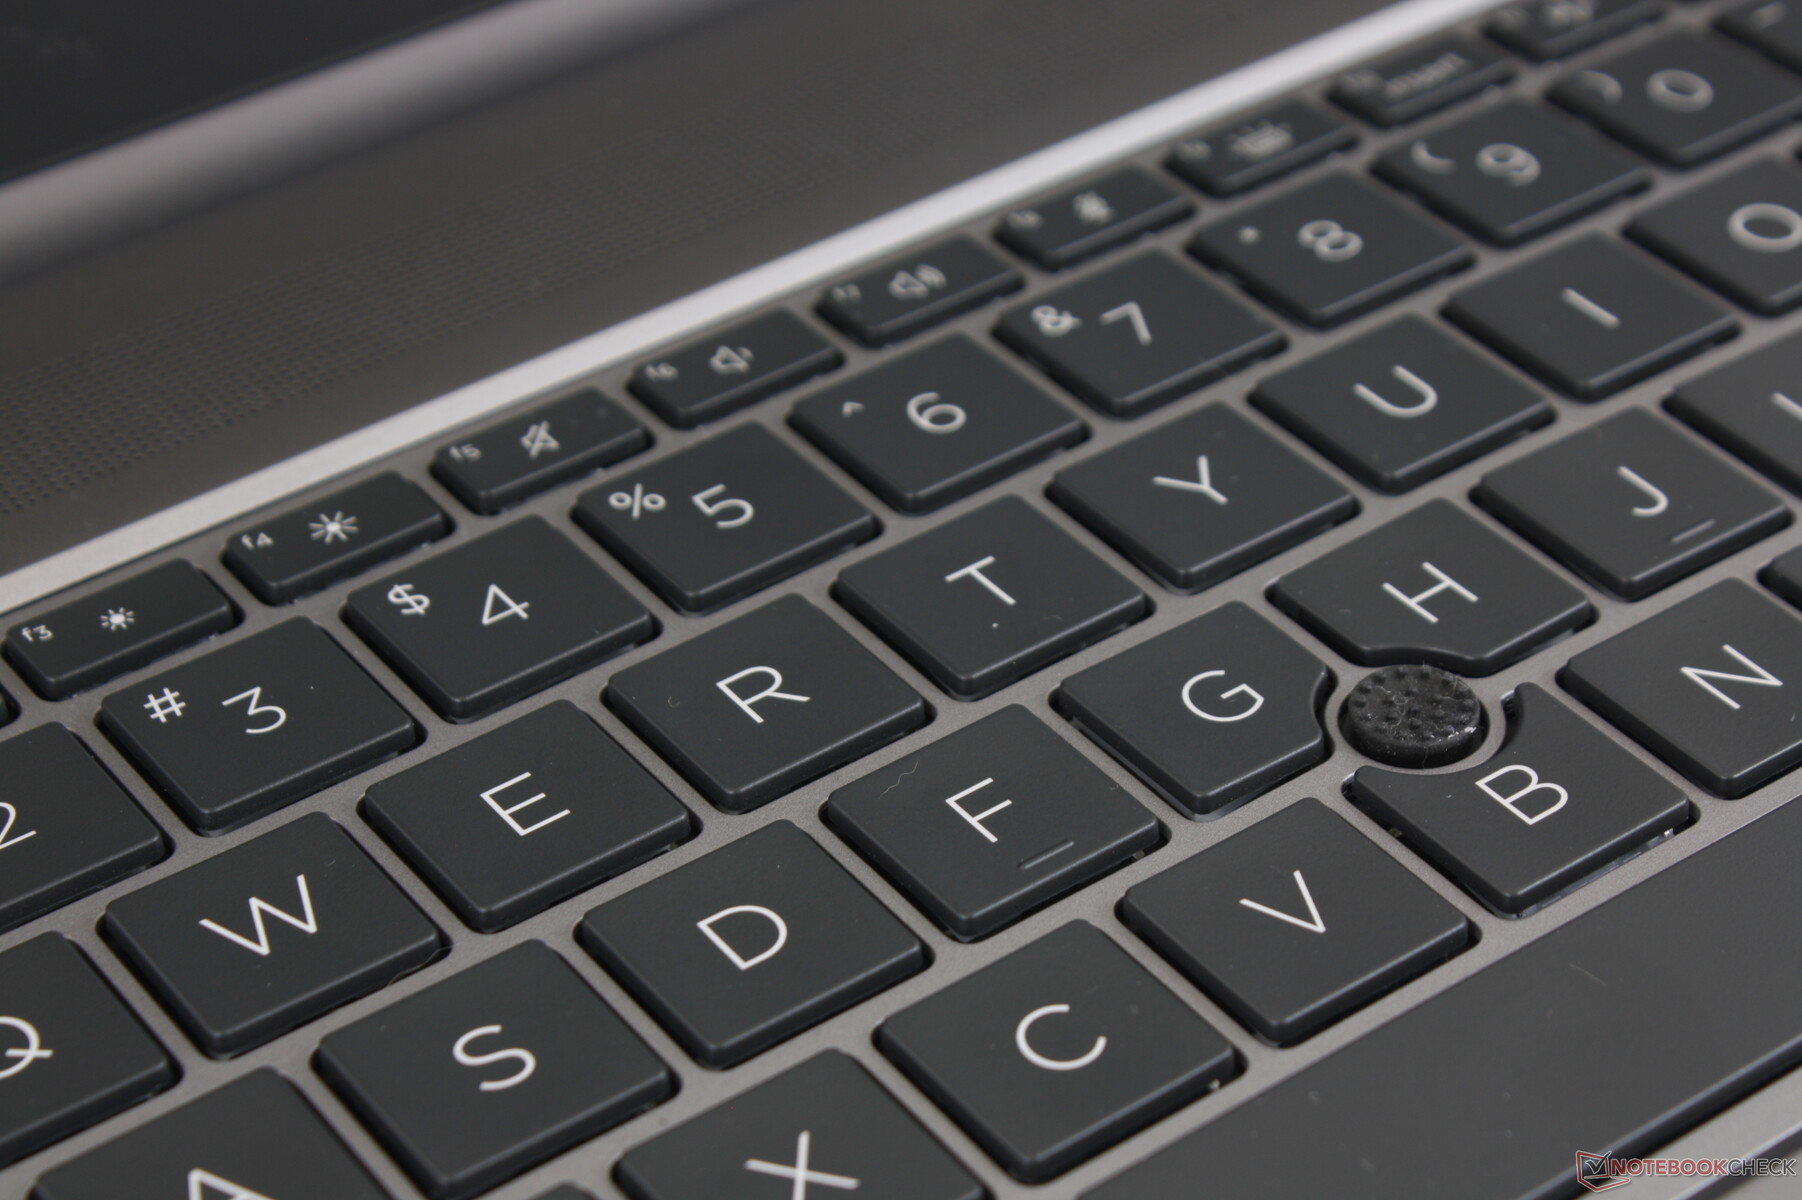
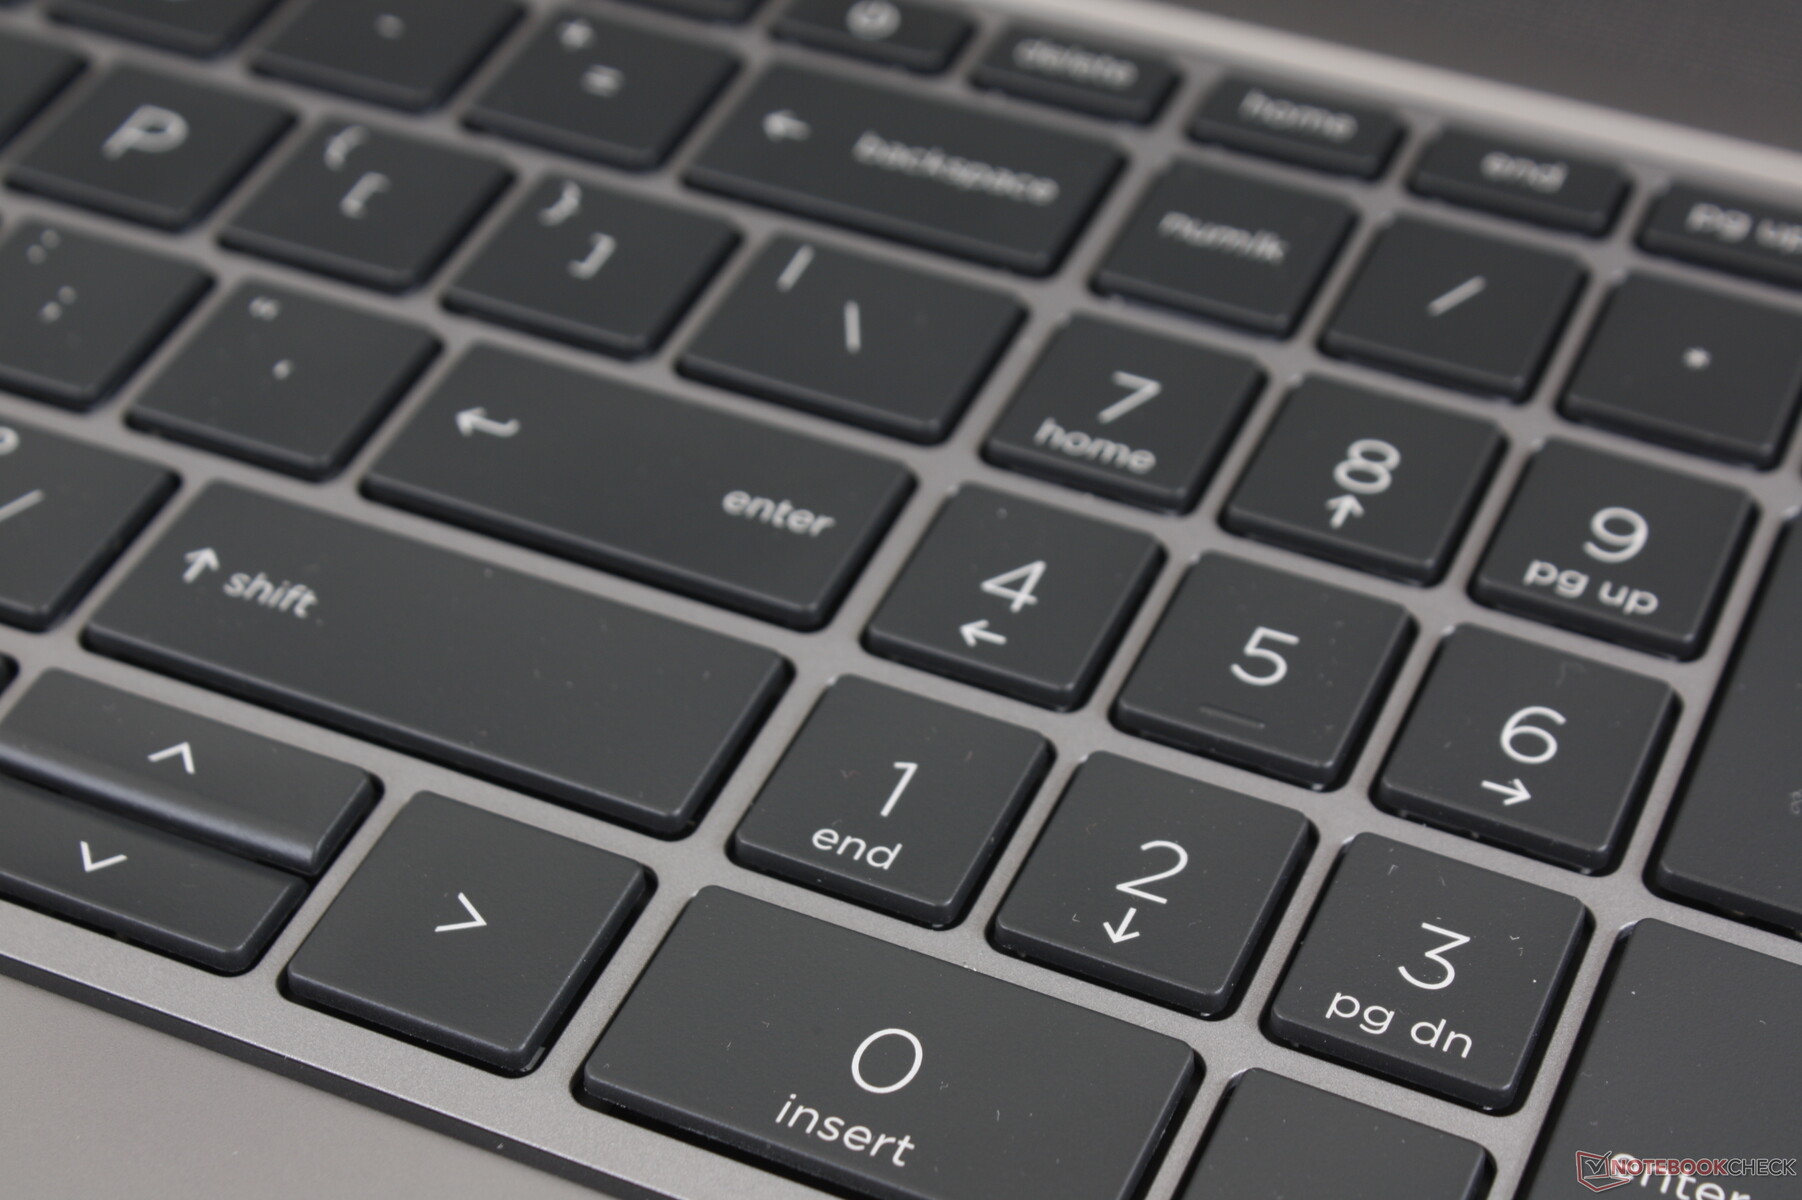
Le tastiere dei portatili HP Spectre, EliteBook e ZBook sono tra le migliori nelle rispettive categorie. Il feedback è nitido con una corsa relativamente profonda, quindi non sembra di digitare su un Ultrabook sottile con tasti poco profondi. Il rumore è anche relativamente basso, tranne che per il tasto Space più rumoroso. Il fatto che la base sia così popolata aiuta ogni tasto ad apparire uniforme da un angolo all'altro.
Una nuova caratteristica della tastiera è il tasto F12 personalizzabile che si trova anche sui più recenti portatili Envy e Spectre. Gli utenti possono impostare il tasto per lanciare rapidamente programmi, file, cartelle o siti web. Tuttavia, non supporta le macro, cosa che riteniamo sia un'enorme errore.
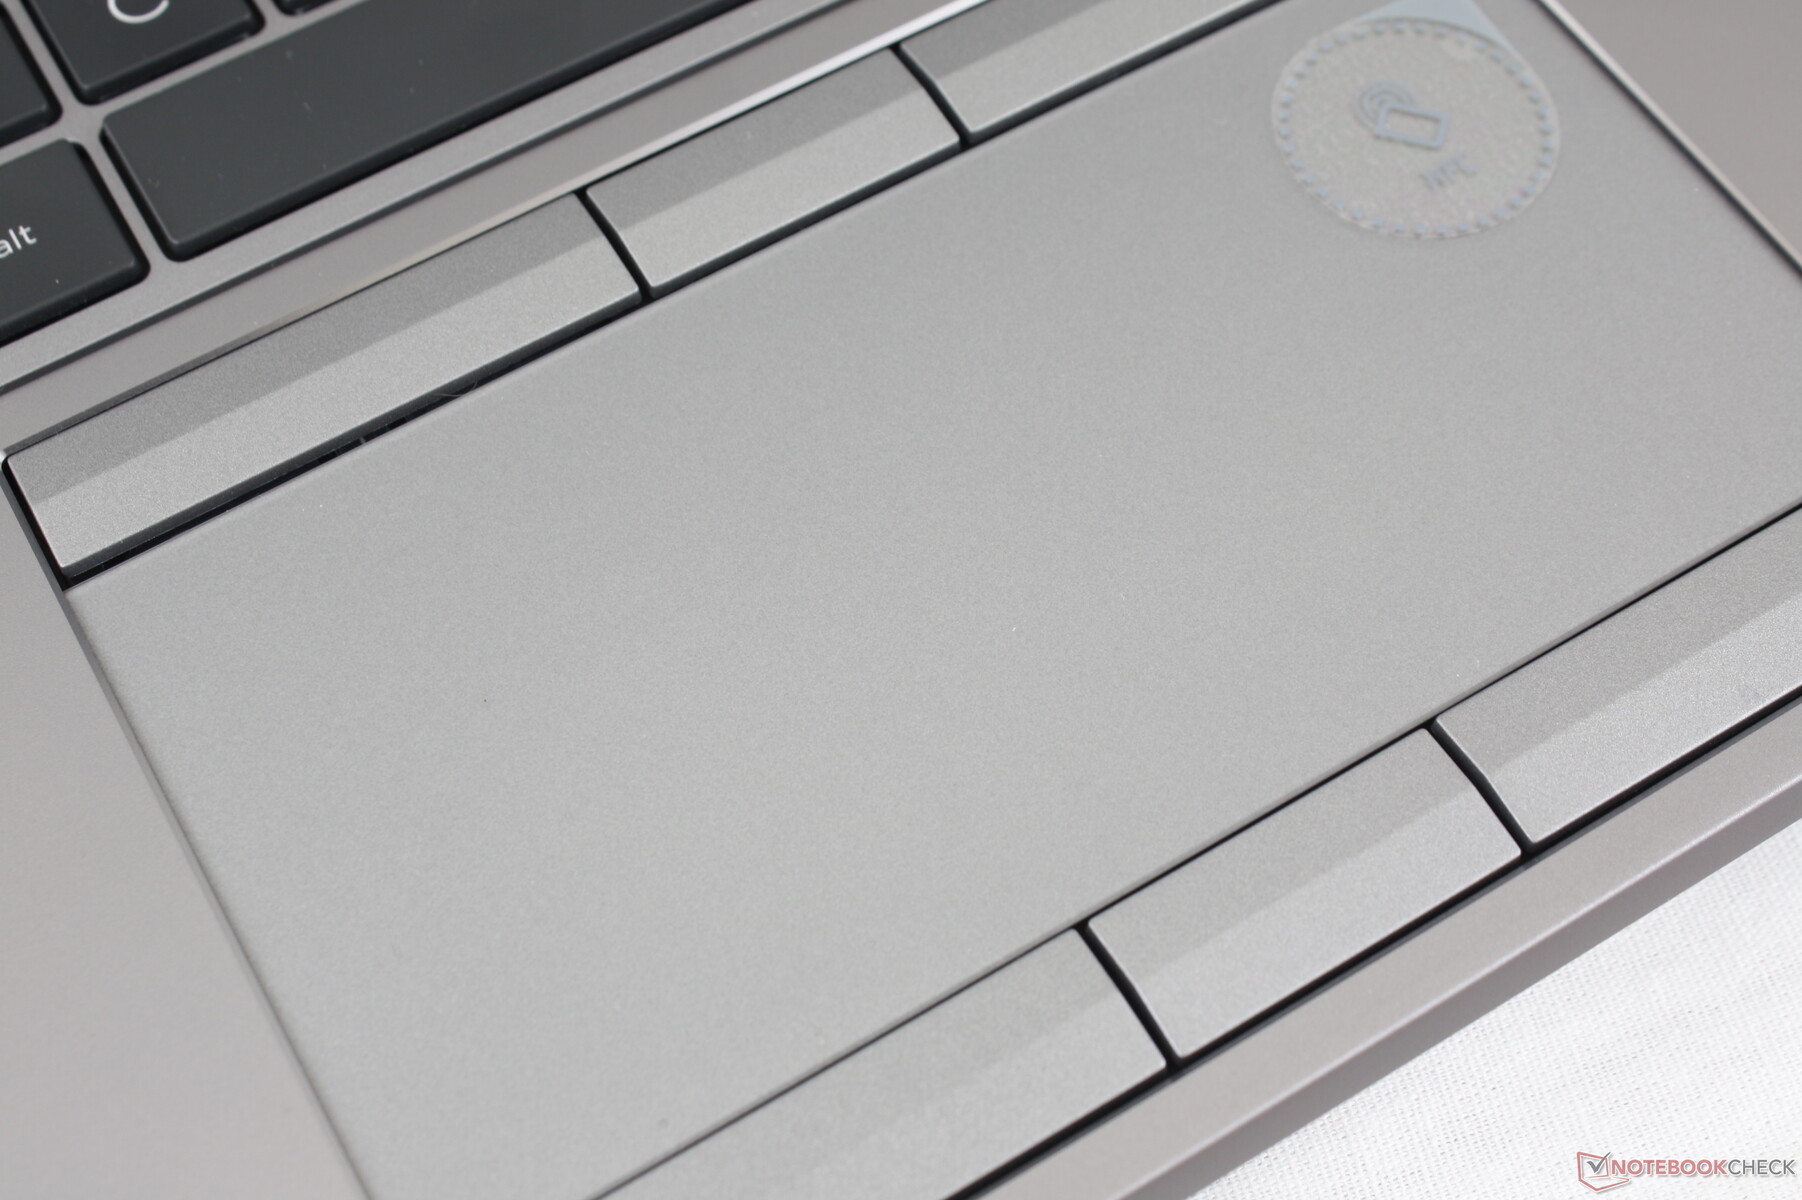
Touchpad
Il touchpad è uno dei migliori che abbiamo usato su qualsiasi workstation da 15,6 pollici. È solido, con proprietà di scorrimento fluido e solo un po' di aderenza a velocità più basse. La superficie è anche più grande rispetto al Precision 7550 (12,5 x 6 cm contro 10 x 6,5 cm) e offre più pulsanti del mouse dedicati.
Il feedback dei pulsanti dedicati è soddisfacente anche con corse più profonde rispetto alla maggior parte dei portatili. Il rumore è moderato ma non abbastanza elevato da essere fastidioso. Il feedback non è però uniforme tra ogni tasto, in quanto i tasti in basso a destra sono un po' più morbidi rispetto al resto dei tasti.
Display
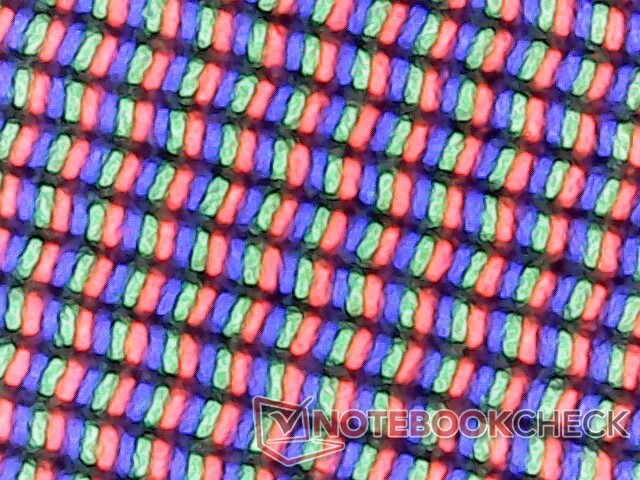
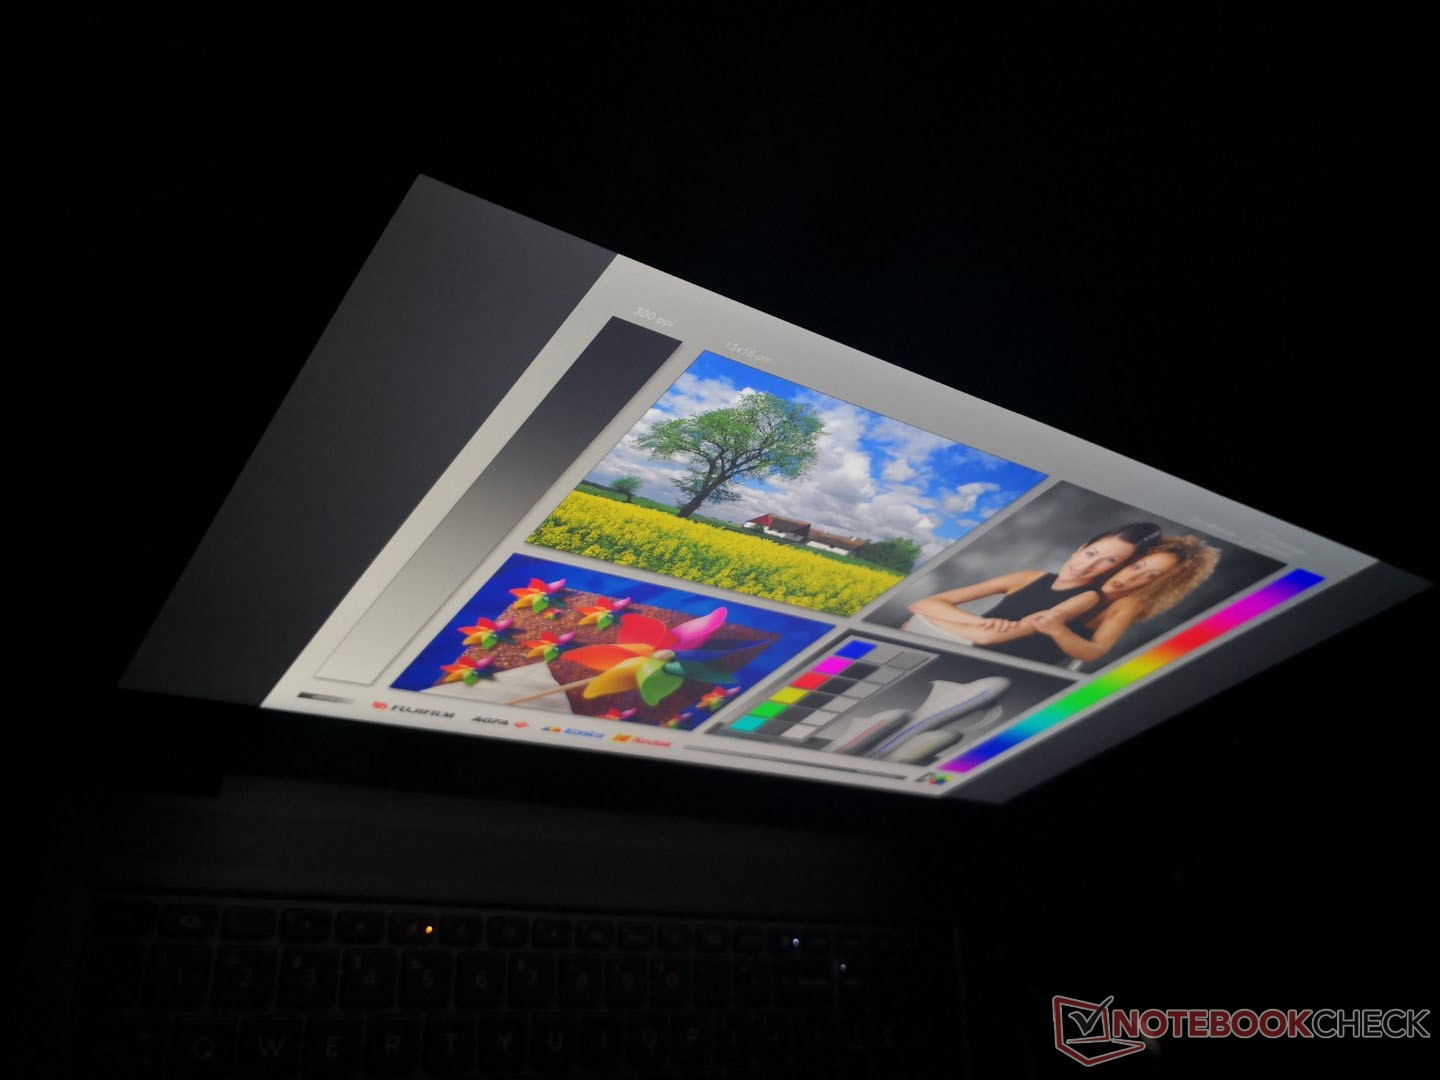
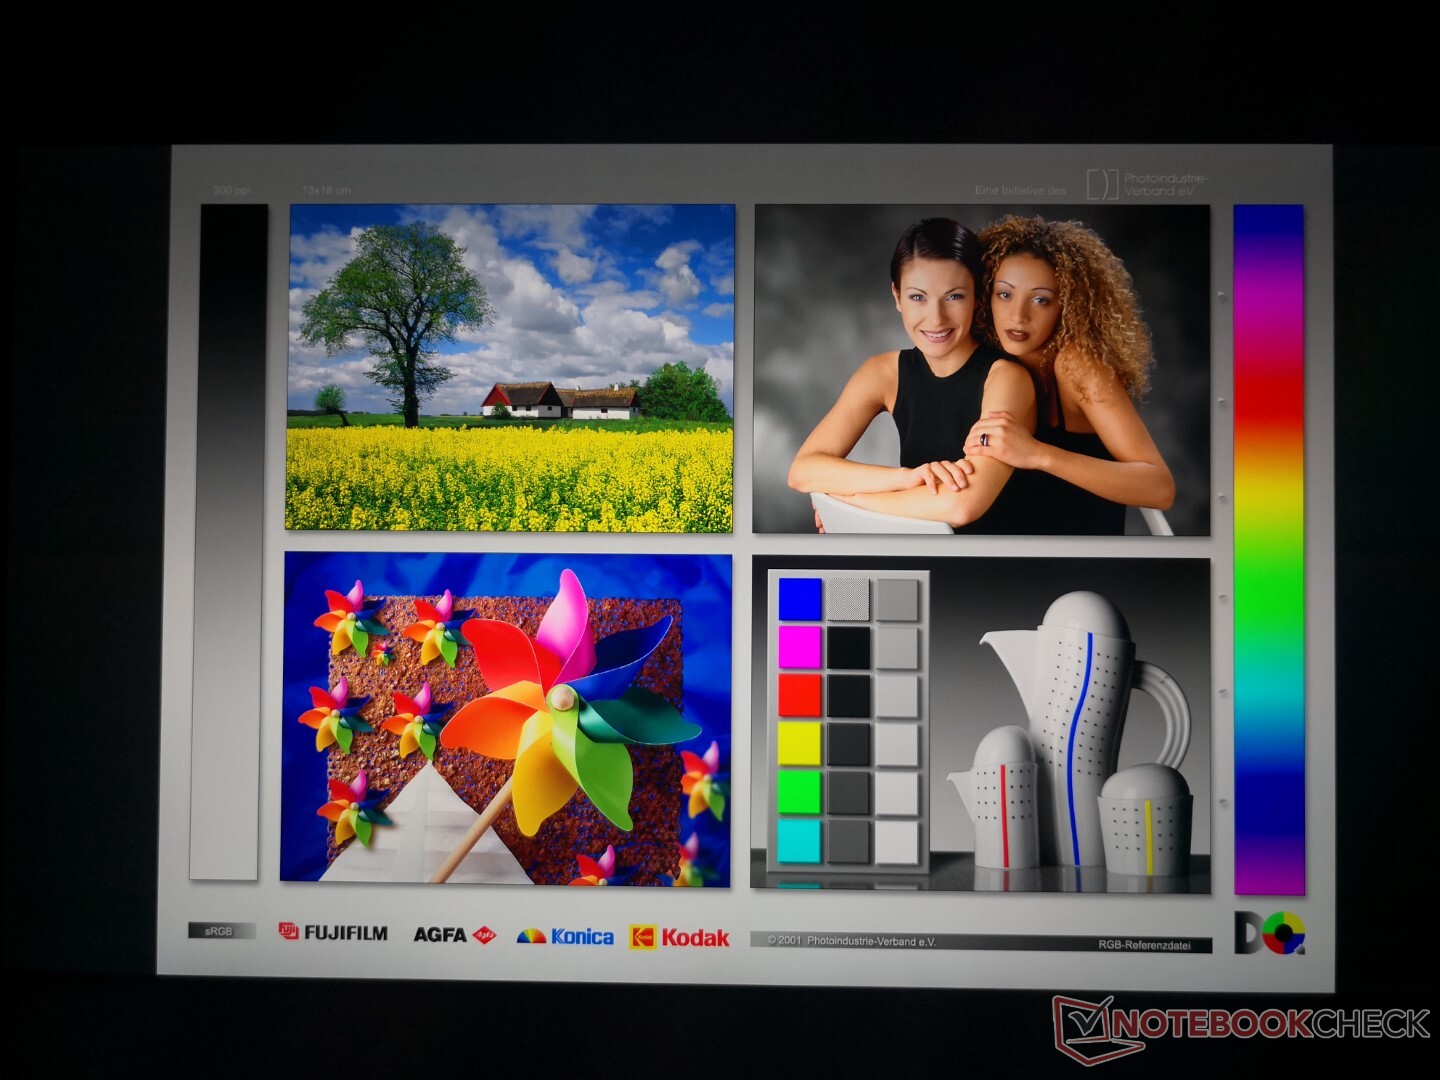
HP offre un diluvio di opzioni di display - 13, infatti - che vanno da FHD a 4K, da 250 nits a 1000 nits, touchscreen e senza touchscreen, e tutto ciò che sta in mezzo. Le nostre misure e le impressioni qui sotto riflettono solo il pannello 4K UHD HDR400 DreamColor non touchscreen, poiché gli altri pannelli avranno quasi sicuramente attributi diversi.
HWiNFO non è in grado di estrarre il nome esatto del pannello della nostra unità e può restituire solo il controller LG Philips LGD0661. Ciononostante, possiamo confermare l'elevato rapporto di contrasto e il display da 600 nits risultando essere più luminoso della maggior parte delle altre workstations.
| |||||||||||||||||||||||||
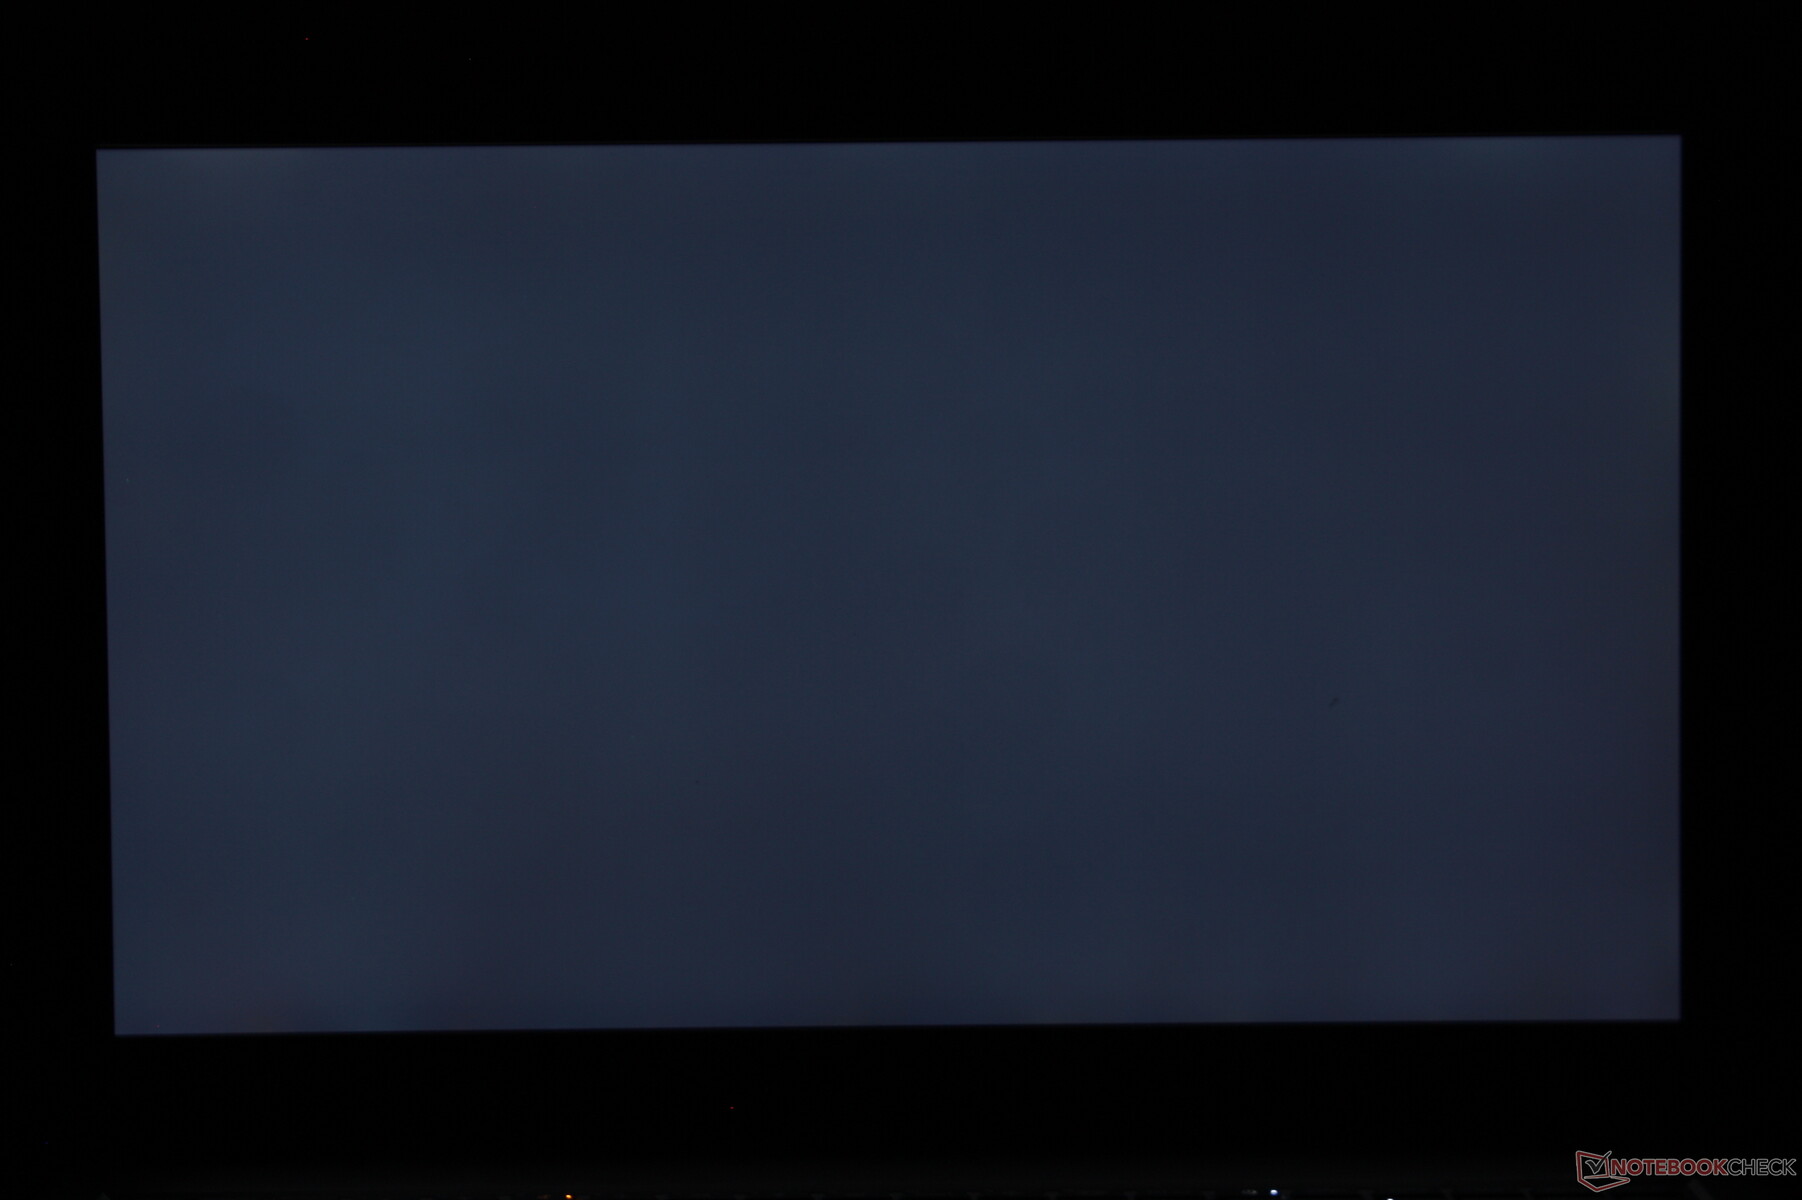
Distribuzione della luminosità: 89 %
Al centro con la batteria: 672.8 cd/m²
Contrasto: 1346:1 (Nero: 0.5 cd/m²)
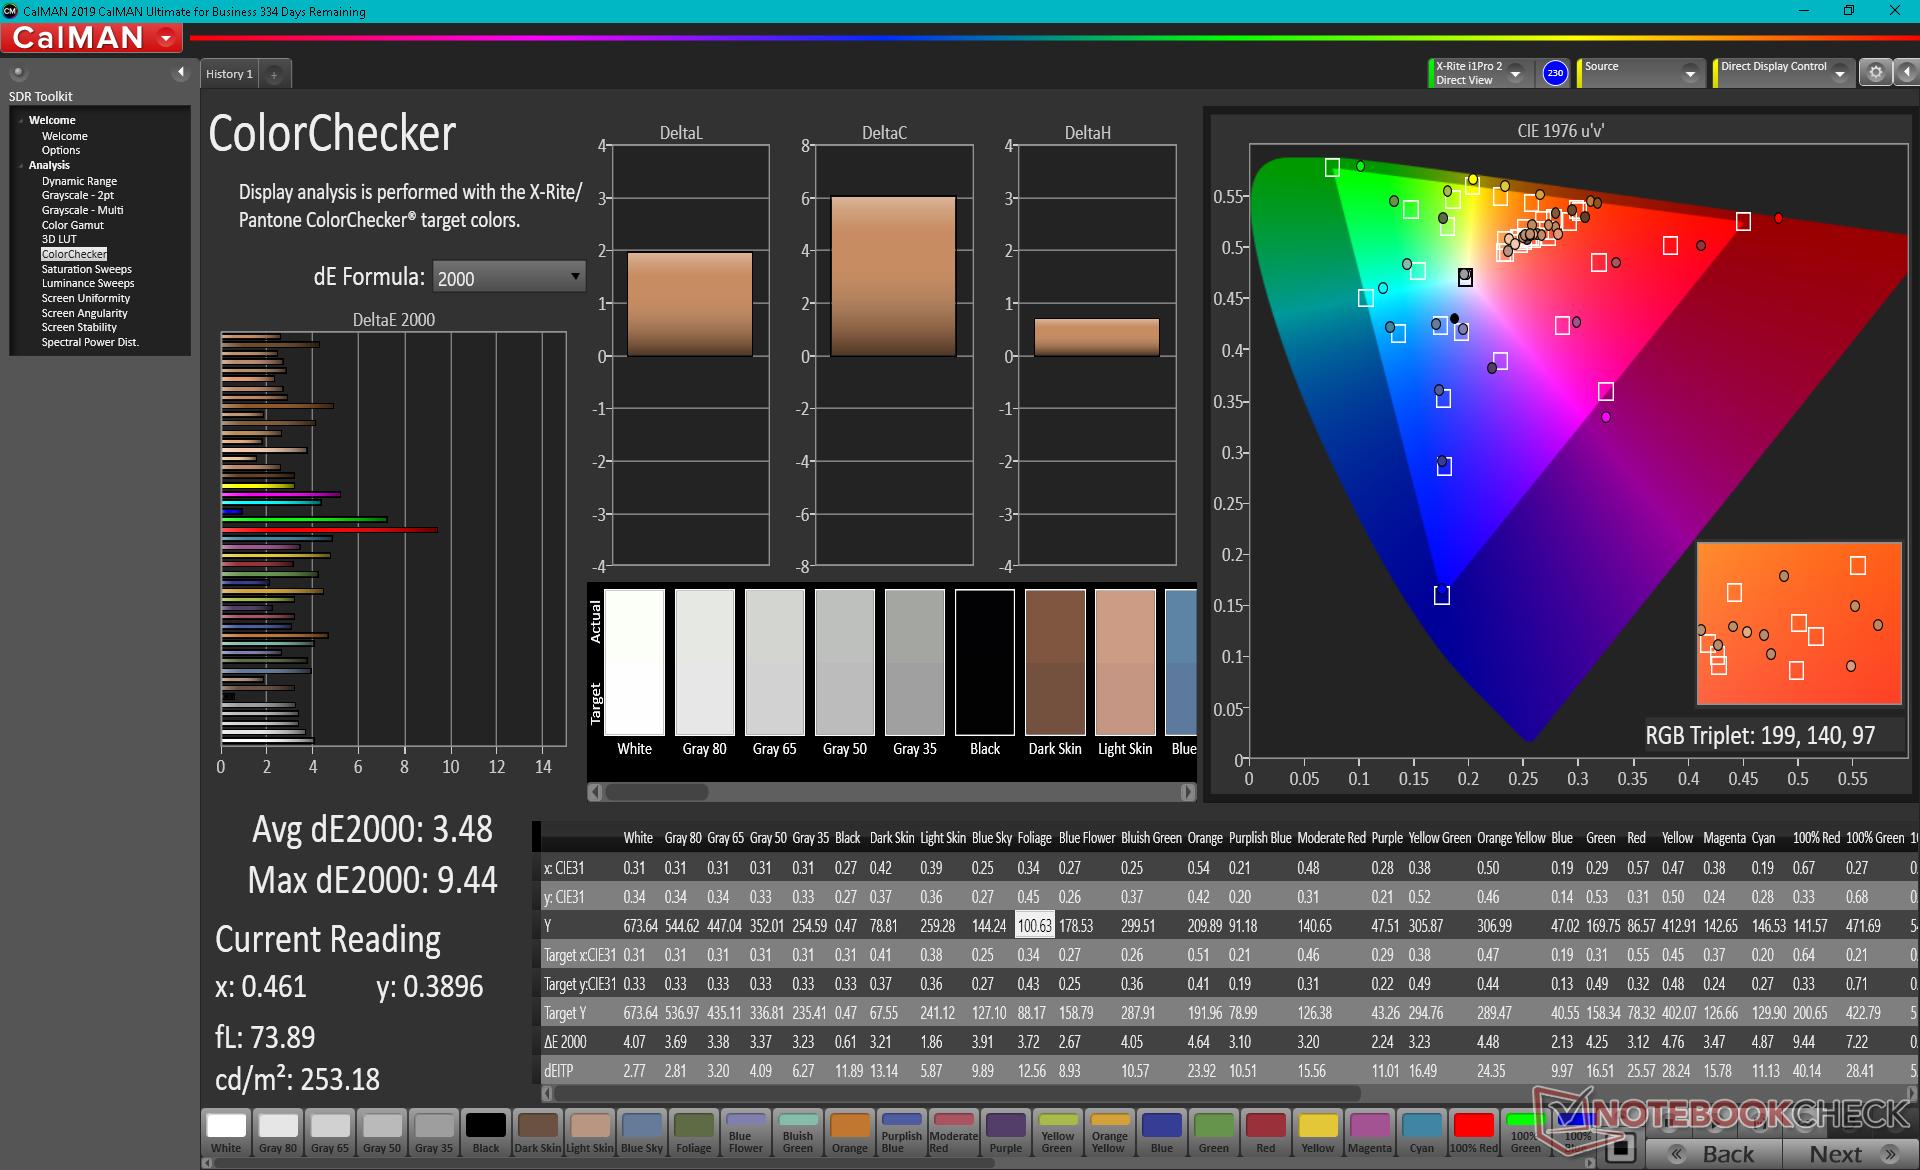
ΔE ColorChecker Calman: 3.48 | ∀{0.5-29.43 Ø4.73}
calibrated: 3.03
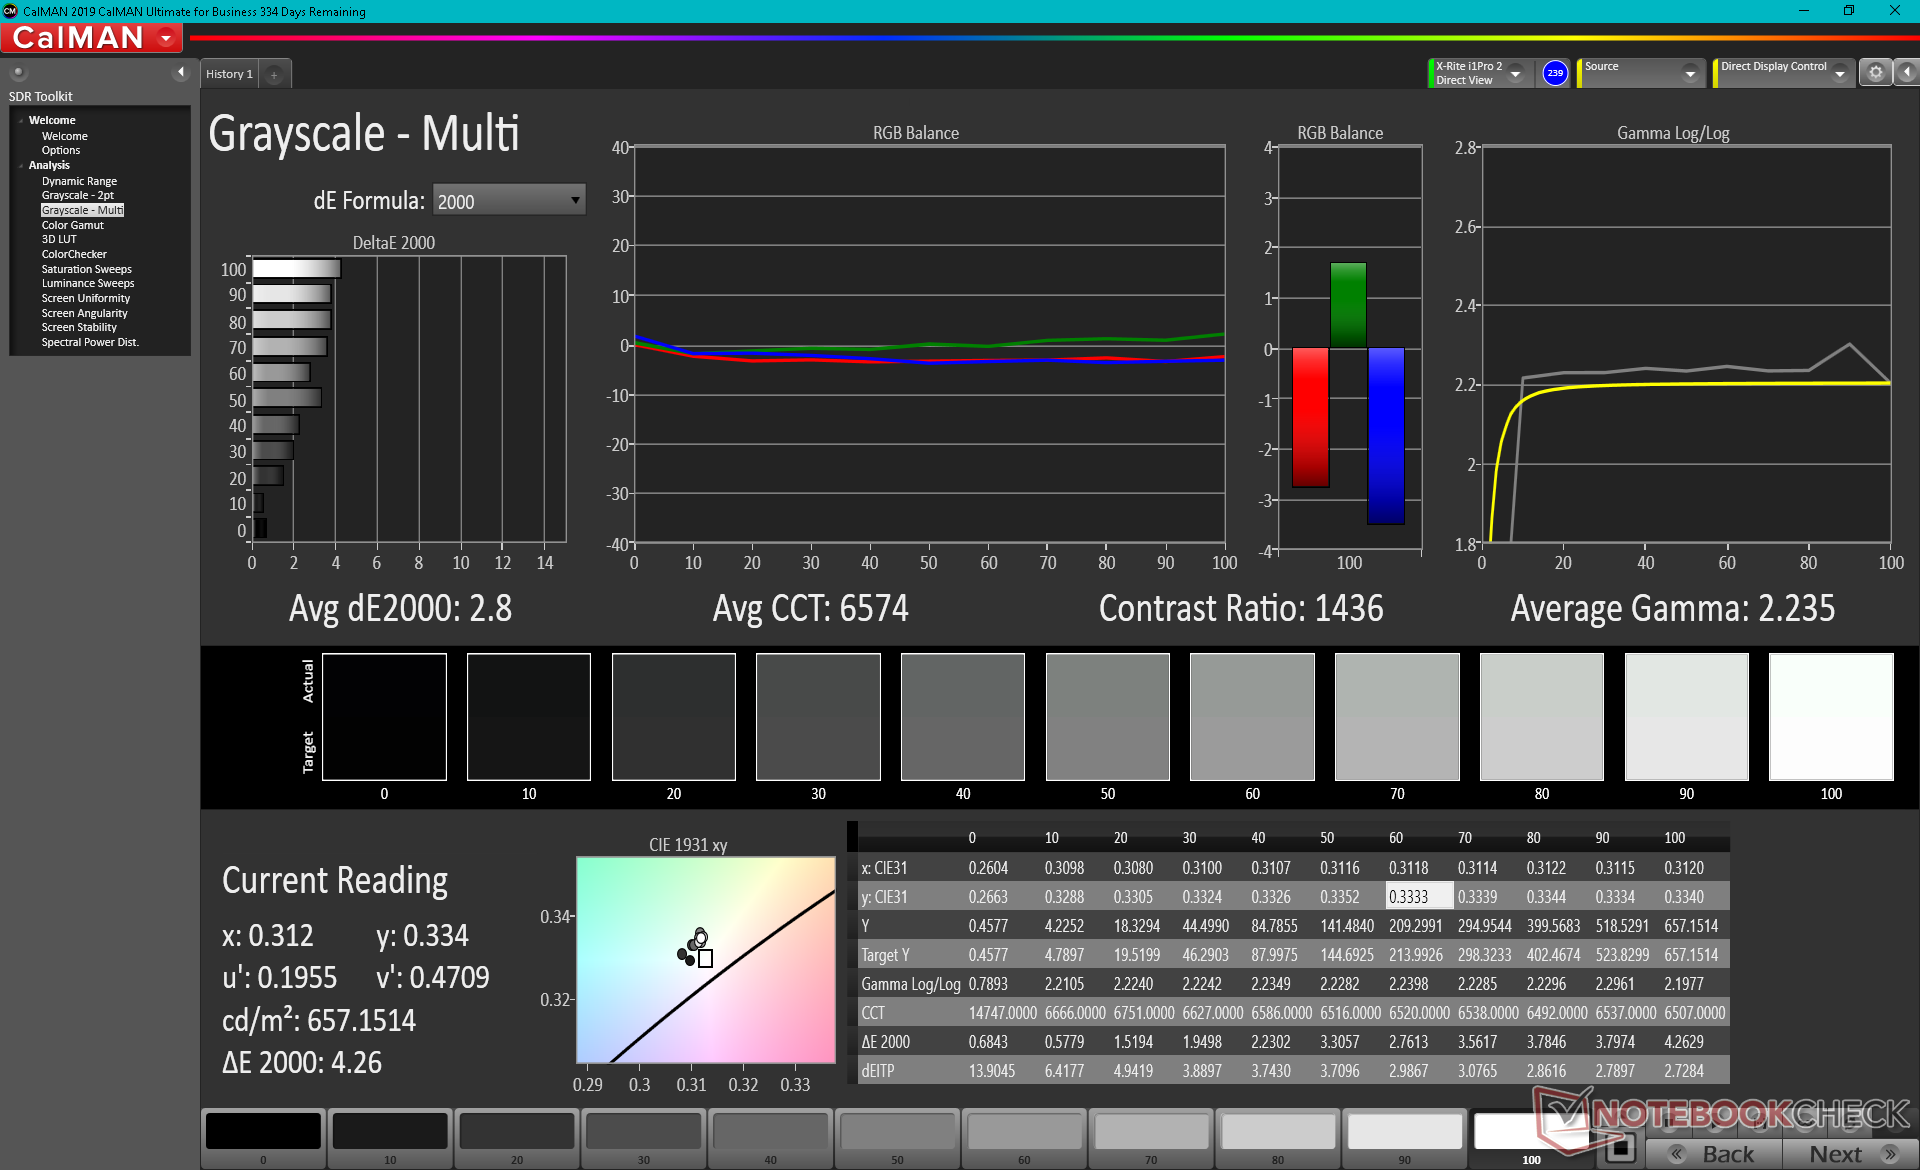
ΔE Greyscale Calman: 3.1 | ∀{0.09-98 Ø4.97}
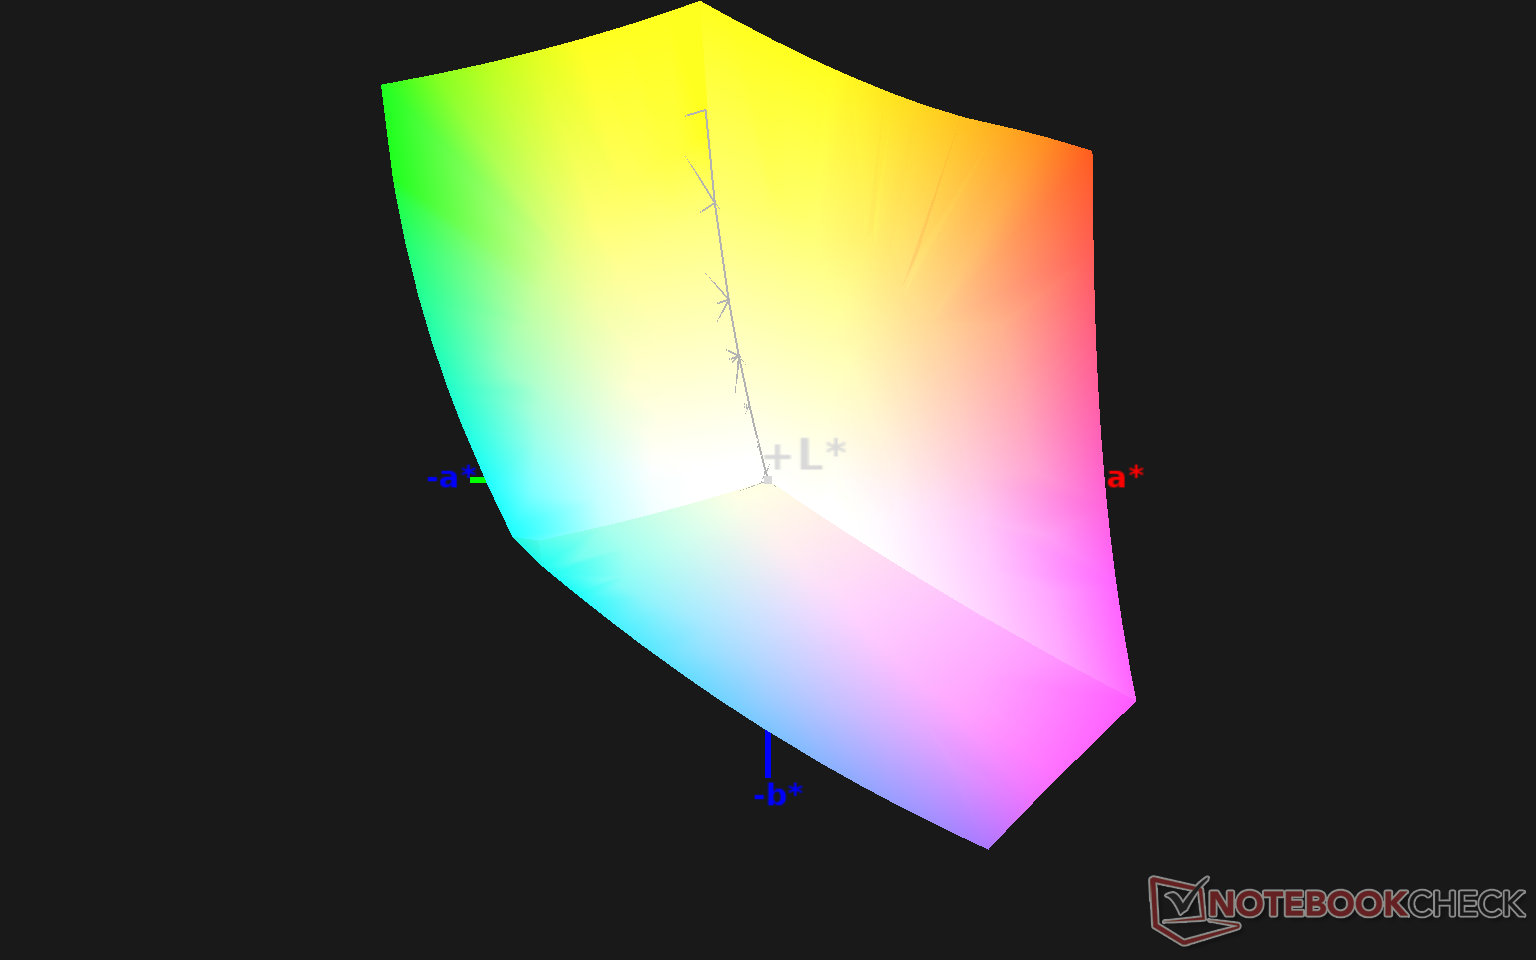
100% sRGB (Argyll 1.6.3 3D)
75.2% AdobeRGB 1998 (Argyll 1.6.3 3D)
84.5% AdobeRGB 1998 (Argyll 3D)
99.8% sRGB (Argyll 3D)
95.6% Display P3 (Argyll 3D)
Gamma: 2.04
CCT: 6380 K
| HP ZBook Fury 15 G7 LG Philips LGD0661, IPS, 15.6", 3840x2160 | Asus ProArt StudioBook Pro 15 W500G5T AU Optronics B156ZAN03.1, IPS, 15.6", 3840x2160 | MSI WS66 10TMT-207US AU Optronics B156HAB03.0, IPS, 15.6", 1920x1080 | Dell Precision 7550 AU Optronics B156ZAN, IPS, 15.6", 3840x2160 | Razer Blade 15 Studio Edition 2020 Samsung SDCA029, OLED, 15.6", 3840x2160 | Lenovo ThinkPad P1 2019-20QT000RGE N156HCE-GN1, IPS LED, 15.6", 1920x1080 | |
|---|---|---|---|---|---|---|
| Display | -1% | -24% | 0% | 6% | -23% | |
| Display P3 Coverage (%) | 95.6 | 82.1 -14% | 62.8 -34% | 82.1 -14% | 99.9 4% | 62.4 -35% |
| sRGB Coverage (%) | 99.8 | 97.6 -2% | 86.9 -13% | 99.6 0% | 100 0% | 91.5 -8% |
| AdobeRGB 1998 Coverage (%) | 84.5 | 95 12% | 63.6 -25% | 96.8 15% | 97.3 15% | 63.4 -25% |
| Response Times | -1% | 20% | 8% | 91% | 50% | |
| Response Time Grey 50% / Grey 80% * (ms) | 56 ? | 58 ? -4% | 44.8 ? 20% | 51.2 ? 9% | 4 ? 93% | 34.4 ? 39% |
| Response Time Black / White * (ms) | 36 ? | 35 ? 3% | 28.8 ? 20% | 34 ? 6% | 4 ? 89% | 14 ? 61% |
| PWM Frequency (Hz) | 26040 ? | |||||
| Screen | 1% | -16% | -19% | 126% | -4% | |
| Brightness middle (cd/m²) | 672.8 | 344 -49% | 374.5 -44% | 473.5 -30% | 380 -44% | 542 -19% |
| Brightness (cd/m²) | 674 | 335 -50% | 363 -46% | 461 -32% | 388 -42% | 528 -22% |
| Brightness Distribution (%) | 89 | 93 4% | 91 2% | 90 1% | 93 4% | 84 -6% |
| Black Level * (cd/m²) | 0.5 | 0.37 26% | 0.42 16% | 0.55 -10% | 0.018 96% | 0.41 18% |
| Contrast (:1) | 1346 | 930 -31% | 892 -34% | 861 -36% | 21111 1468% | 1322 -2% |
| Colorchecker dE 2000 * | 3.48 | 1.76 49% | 4.05 -16% | 4.8 -38% | 5.47 -57% | 3.5 -1% |
| Colorchecker dE 2000 max. * | 9.44 | 4.31 54% | 8.17 13% | 8.73 8% | 8.19 13% | 7.8 17% |
| Colorchecker dE 2000 calibrated * | 3.03 | 4.36 -44% | 3.08 -2% | 3.04 -0% | 1.3 57% | |
| Greyscale dE 2000 * | 3.1 | 3.12 -1% | 2.6 16% | 5.6 -81% | 5.3 -71% | 4.8 -55% |
| Gamma | 2.04 108% | 2.2 100% | 2.21 100% | 2.34 94% | 2.15 102% | 2.33 94% |
| CCT | 6380 102% | 6563 99% | 7027 93% | 7549 86% | 6128 106% | 7690 85% |
| Color Space (Percent of AdobeRGB 1998) (%) | 75.2 | 85 13% | 56.4 -25% | 86.4 15% | 86 14% | 58.8 -22% |
| Color Space (Percent of sRGB) (%) | 100 | 98 -2% | 86.3 -14% | 99.7 0% | 100 0% | 91.1 -9% |
| Media totale (Programma / Settaggio) | -0% /
1% | -7% /
-13% | -4% /
-12% | 74% /
99% | 8% /
-1% |
* ... Meglio usare valori piccoli
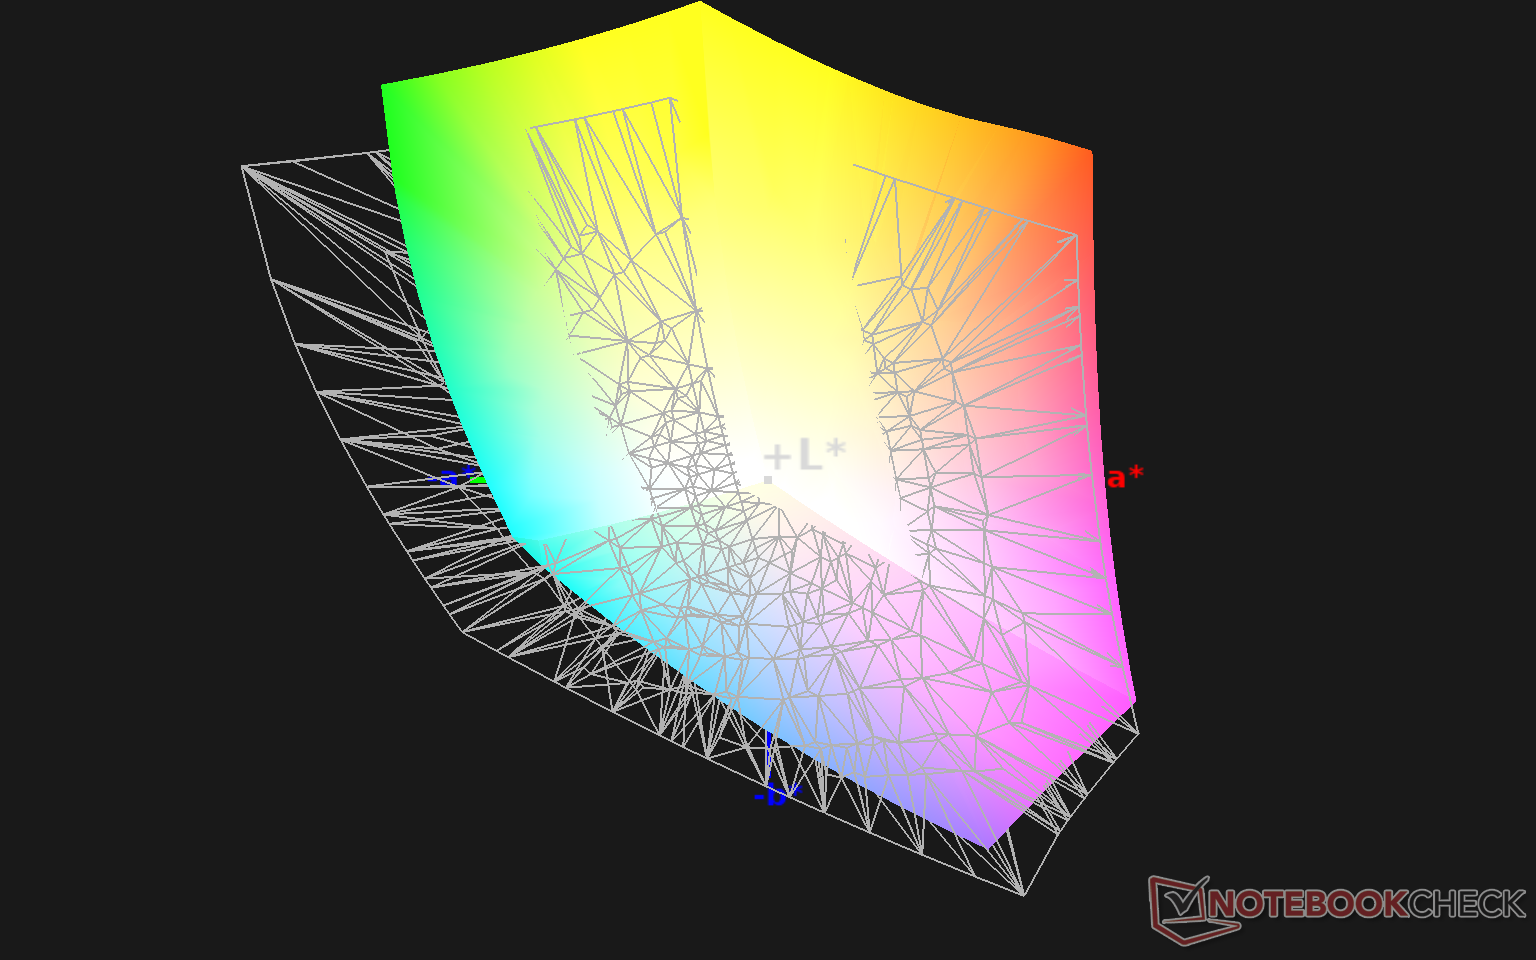
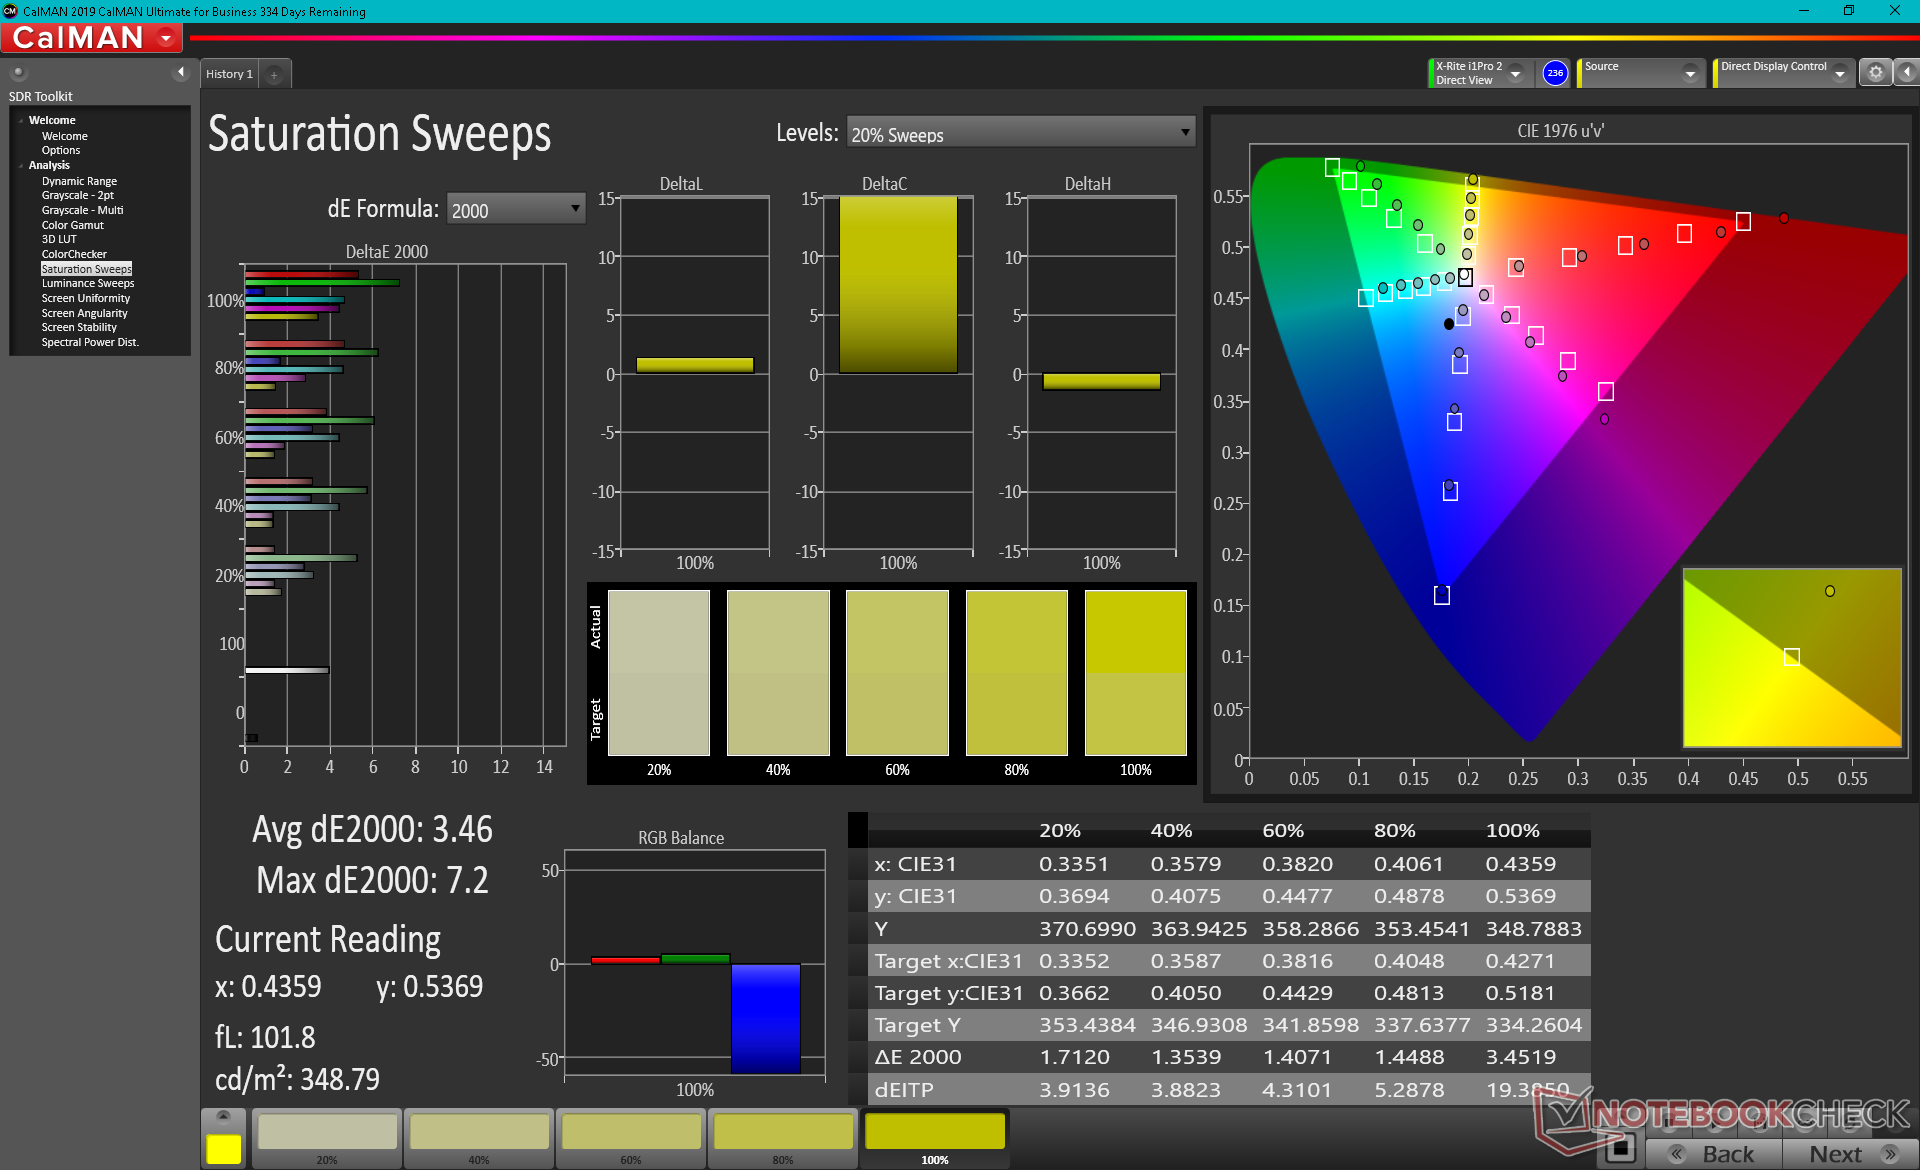
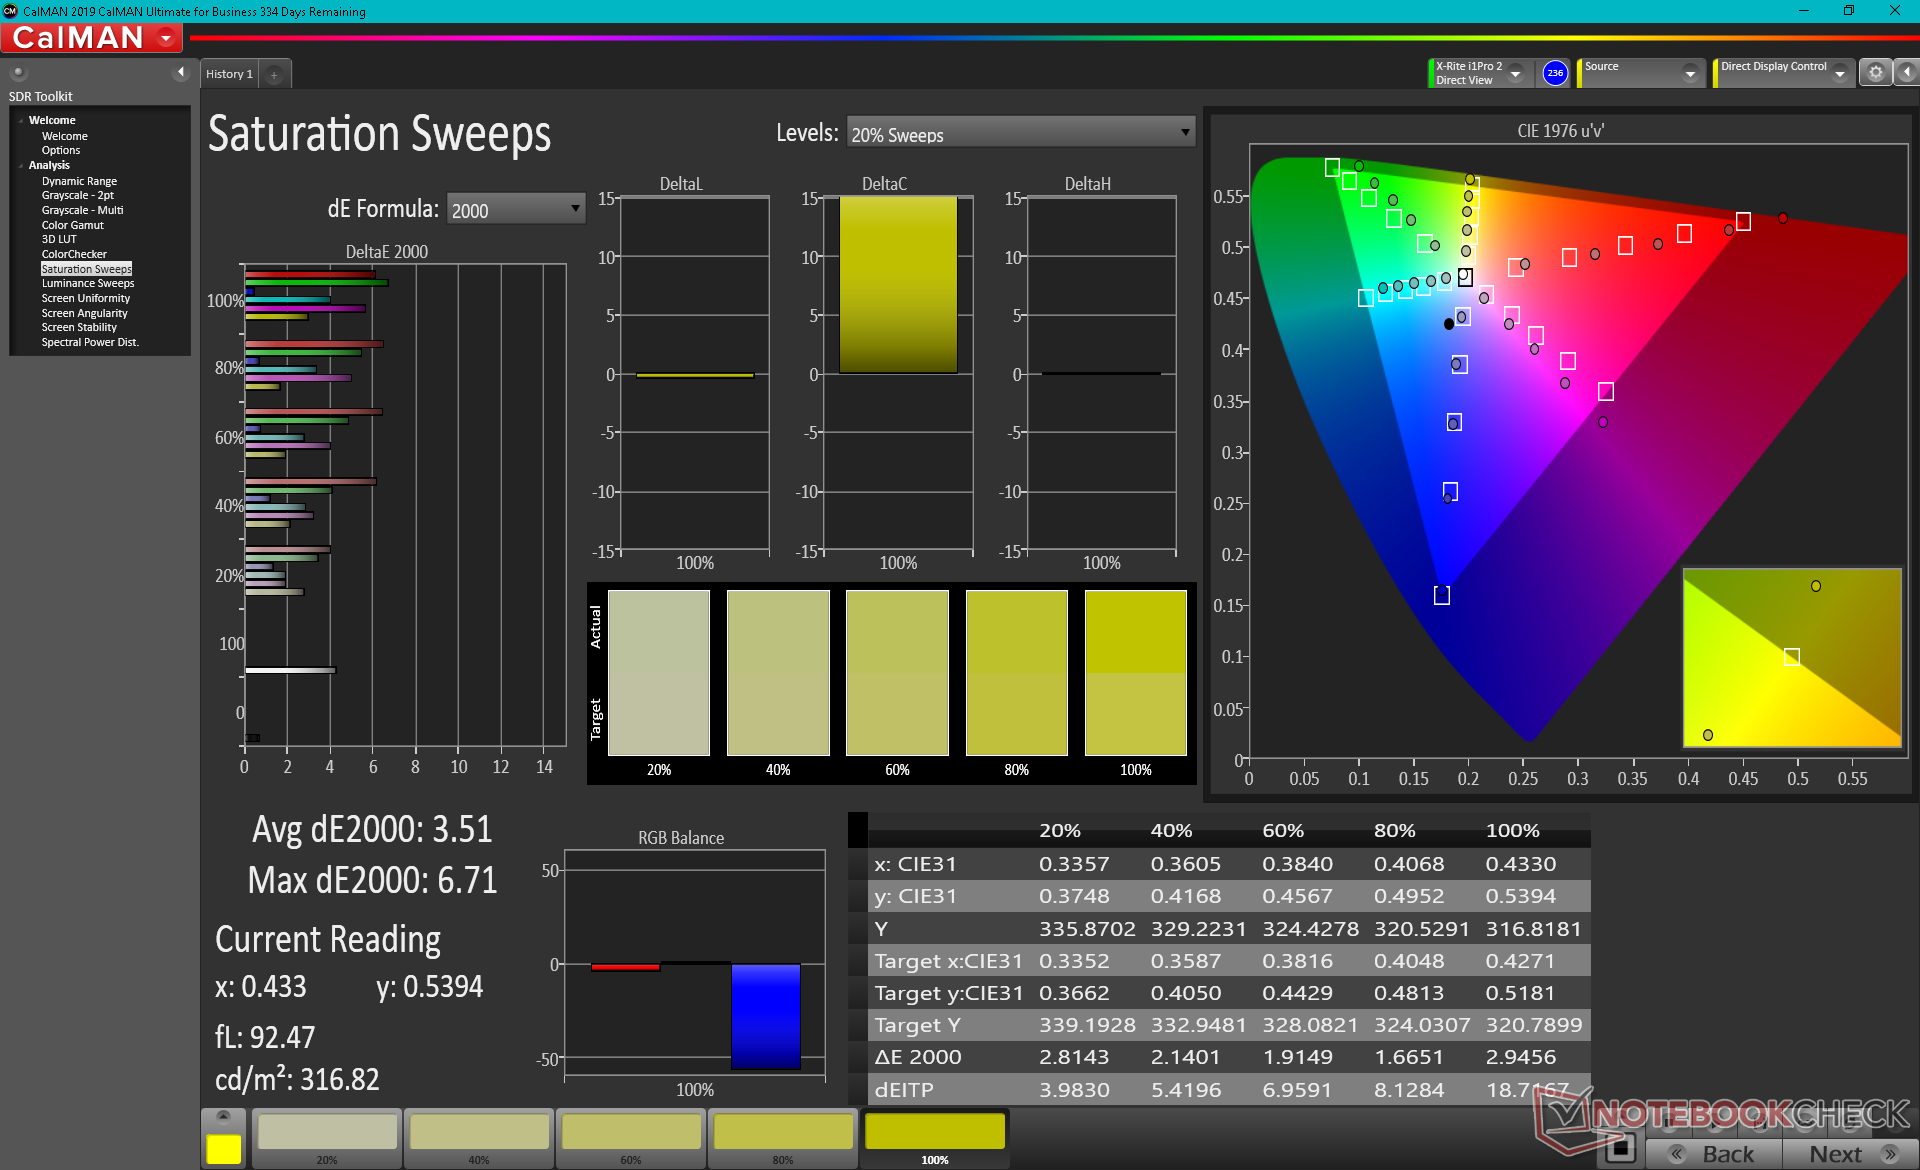
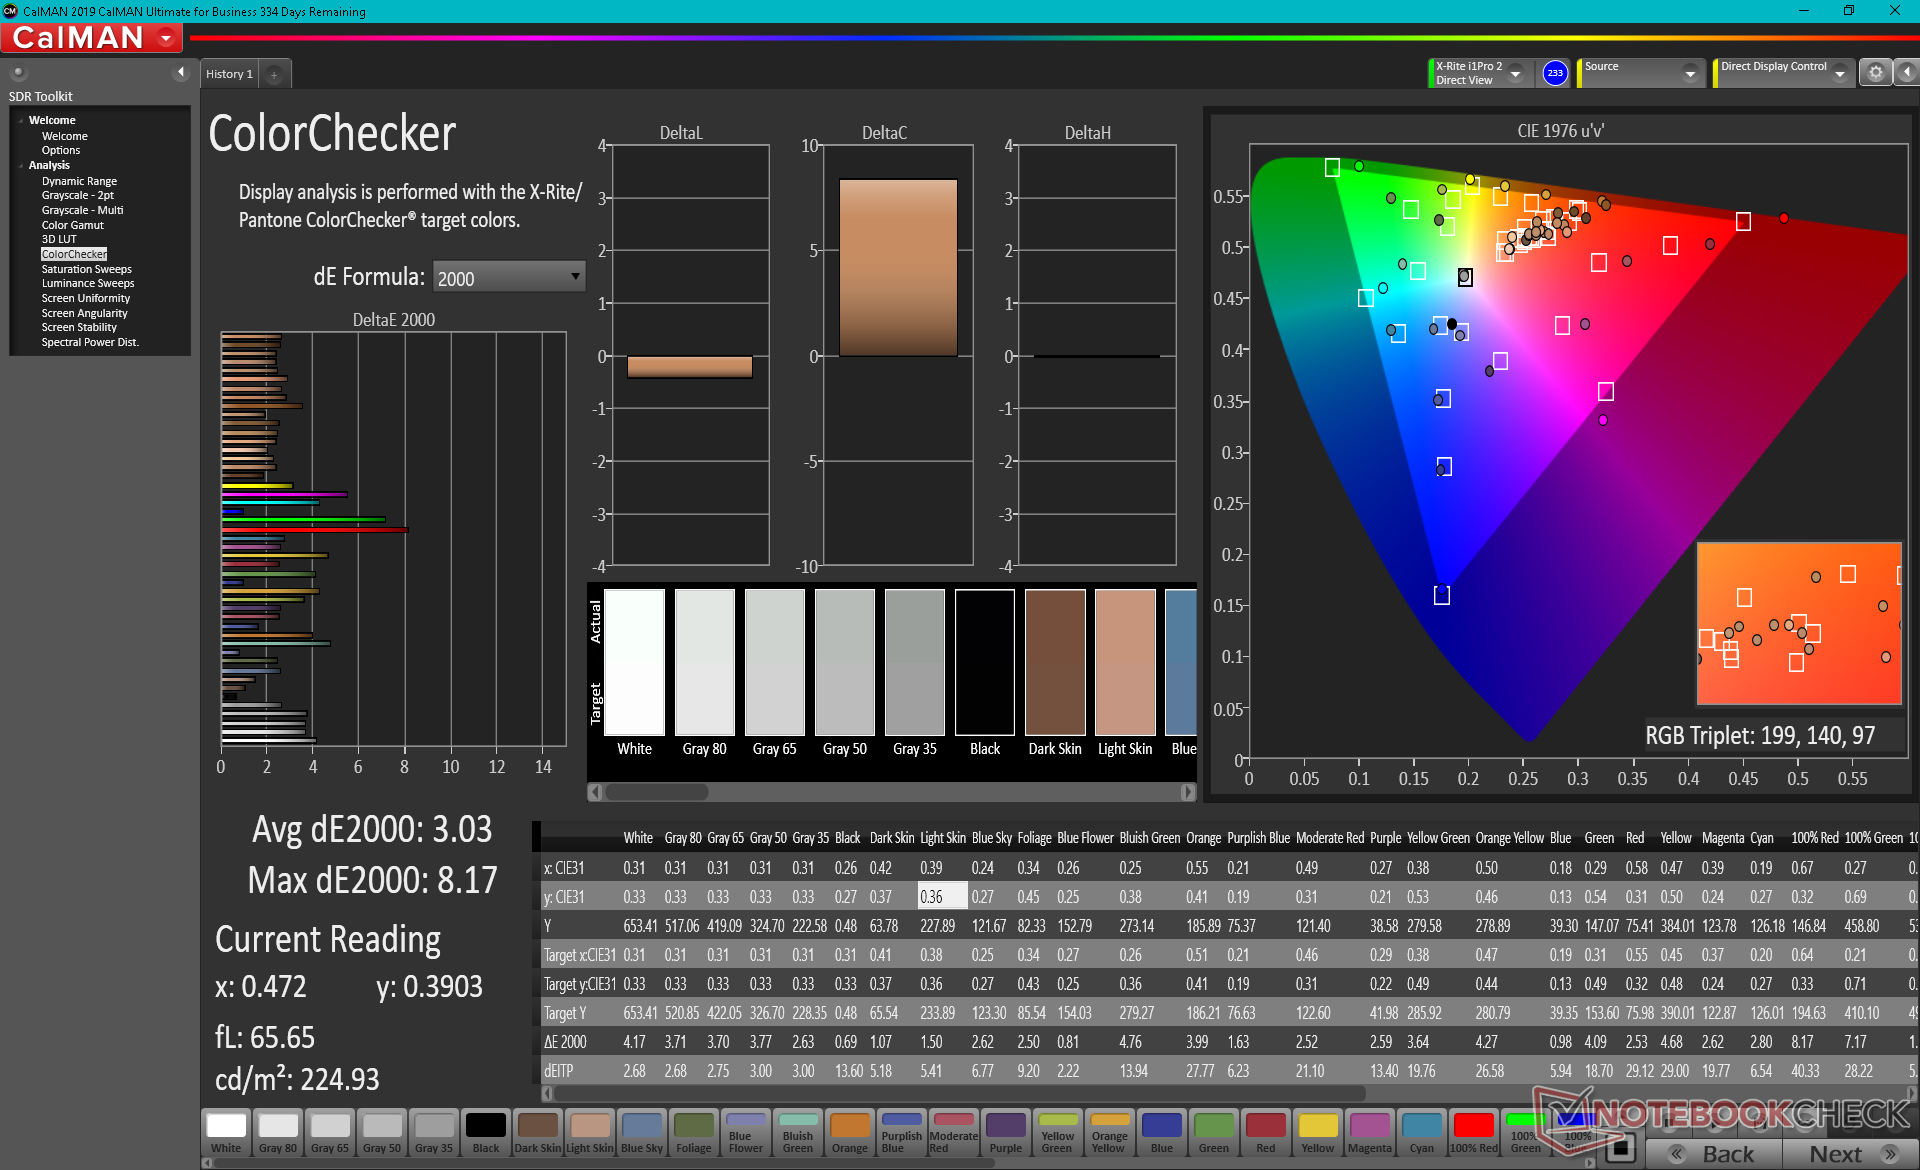
Lo spazio colore copre tutti gli sRGB e DCI-P3. Rispetto ad AdobeRGB, DCI-P3 copre più giallo e rosso che le nostre immagini qui sotto possono confermare per il nostro ZBook.
Le misurazioni del colorimetro X-Rite mostrano che la temperatura del colore è leggermente sul lato caldo. Calibrando noi stessi il display si risolve il piccolo problema del bilanciamento RGB più piatto e delle curve gamma. HP non offre alcun software di gestione del colore preinstallato, a differenza di Dell e del suo software Premier Color.

Tempi di risposta del Display
| ↔ Tempi di risposta dal Nero al Bianco | ||
|---|---|---|
| 36 ms ... aumenta ↗ e diminuisce ↘ combinato | ↗ 20.4 ms Incremento | 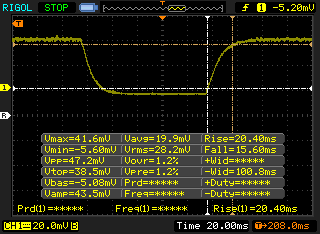 |
| ↘ 15.6 ms Calo | ||
| Lo schermo mostra tempi di risposta lenti nei nostri tests e sarà insoddisfacente per i gamers. In confronto, tutti i dispositivi di test variano da 0.1 (minimo) a 240 (massimo) ms. » 94 % di tutti i dispositivi è migliore. Questo significa che i tempi di risposta rilevati sono peggiori rispetto alla media di tutti i dispositivi testati (19.9 ms). | ||
| ↔ Tempo di risposta dal 50% Grigio all'80% Grigio | ||
| 56 ms ... aumenta ↗ e diminuisce ↘ combinato | ↗ 27.6 ms Incremento | 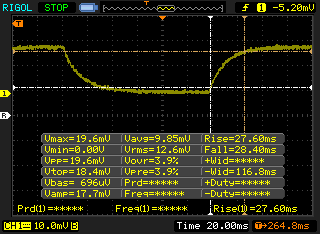 |
| ↘ 28.4 ms Calo | ||
| Lo schermo mostra tempi di risposta lenti nei nostri tests e sarà insoddisfacente per i gamers. In confronto, tutti i dispositivi di test variano da 0.165 (minimo) a 636 (massimo) ms. » 93 % di tutti i dispositivi è migliore. Questo significa che i tempi di risposta rilevati sono peggiori rispetto alla media di tutti i dispositivi testati (31.1 ms). | ||
Sfarfallio dello schermo / PWM (Pulse-Width Modulation)
| flickering dello schermo / PWM non rilevato |  | ||
In confronto: 52 % di tutti i dispositivi testati non utilizza PWM per ridurre la luminosita' del display. Se è rilevato PWM, una media di 7798 (minimo: 5 - massimo: 343500) Hz è stata rilevata. | |||
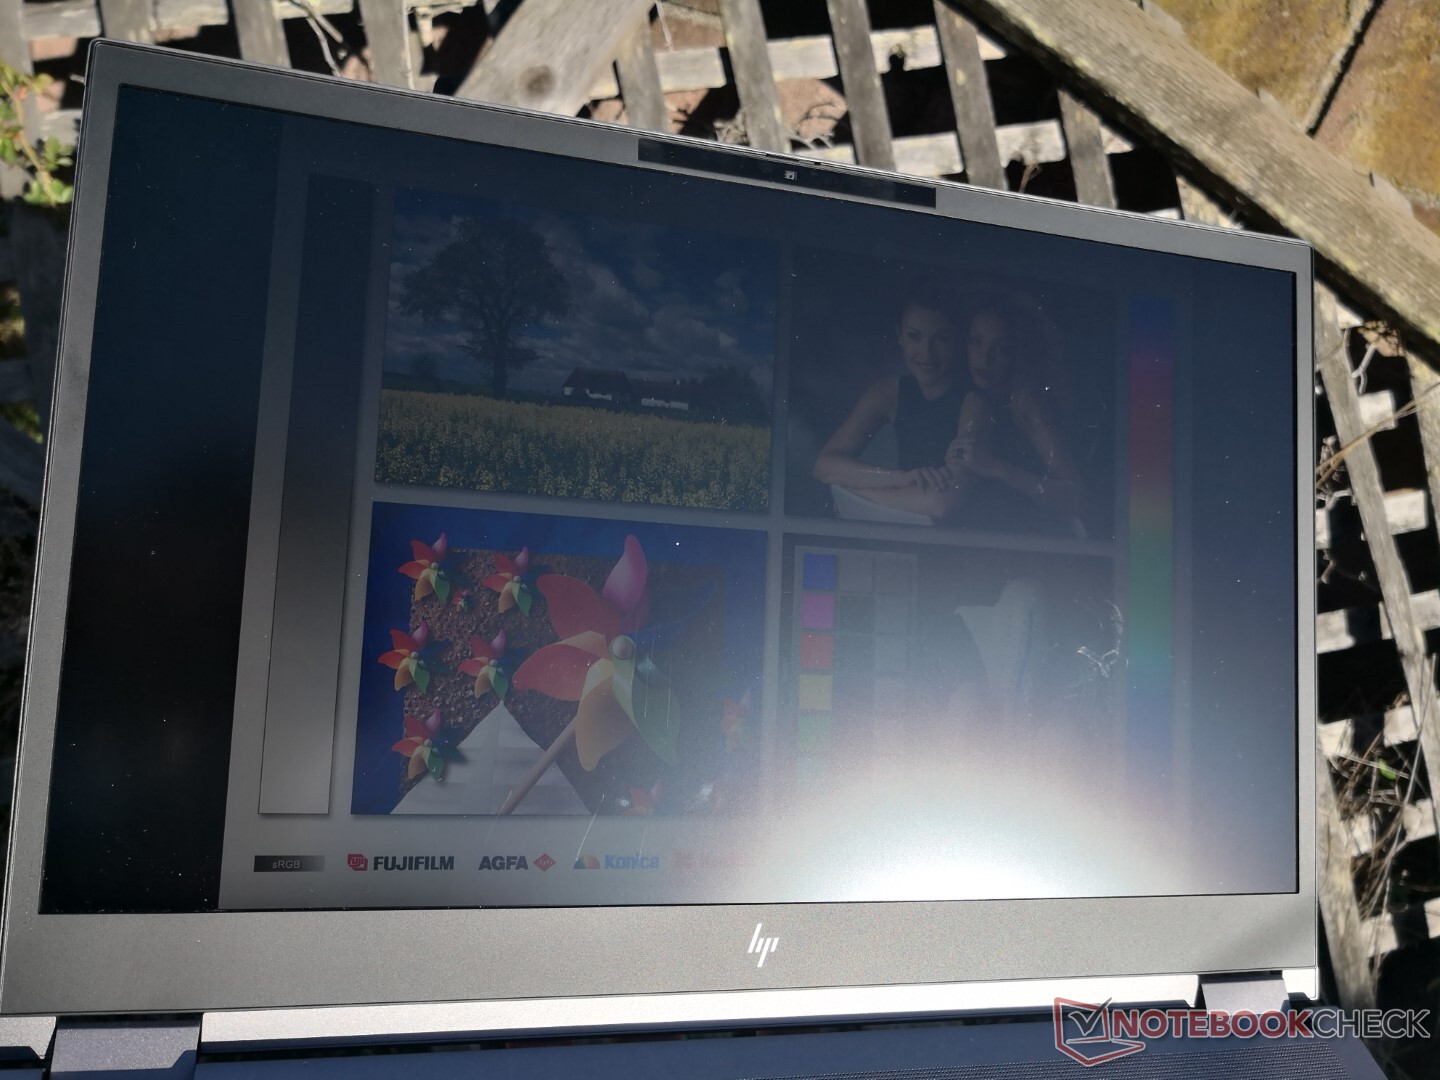
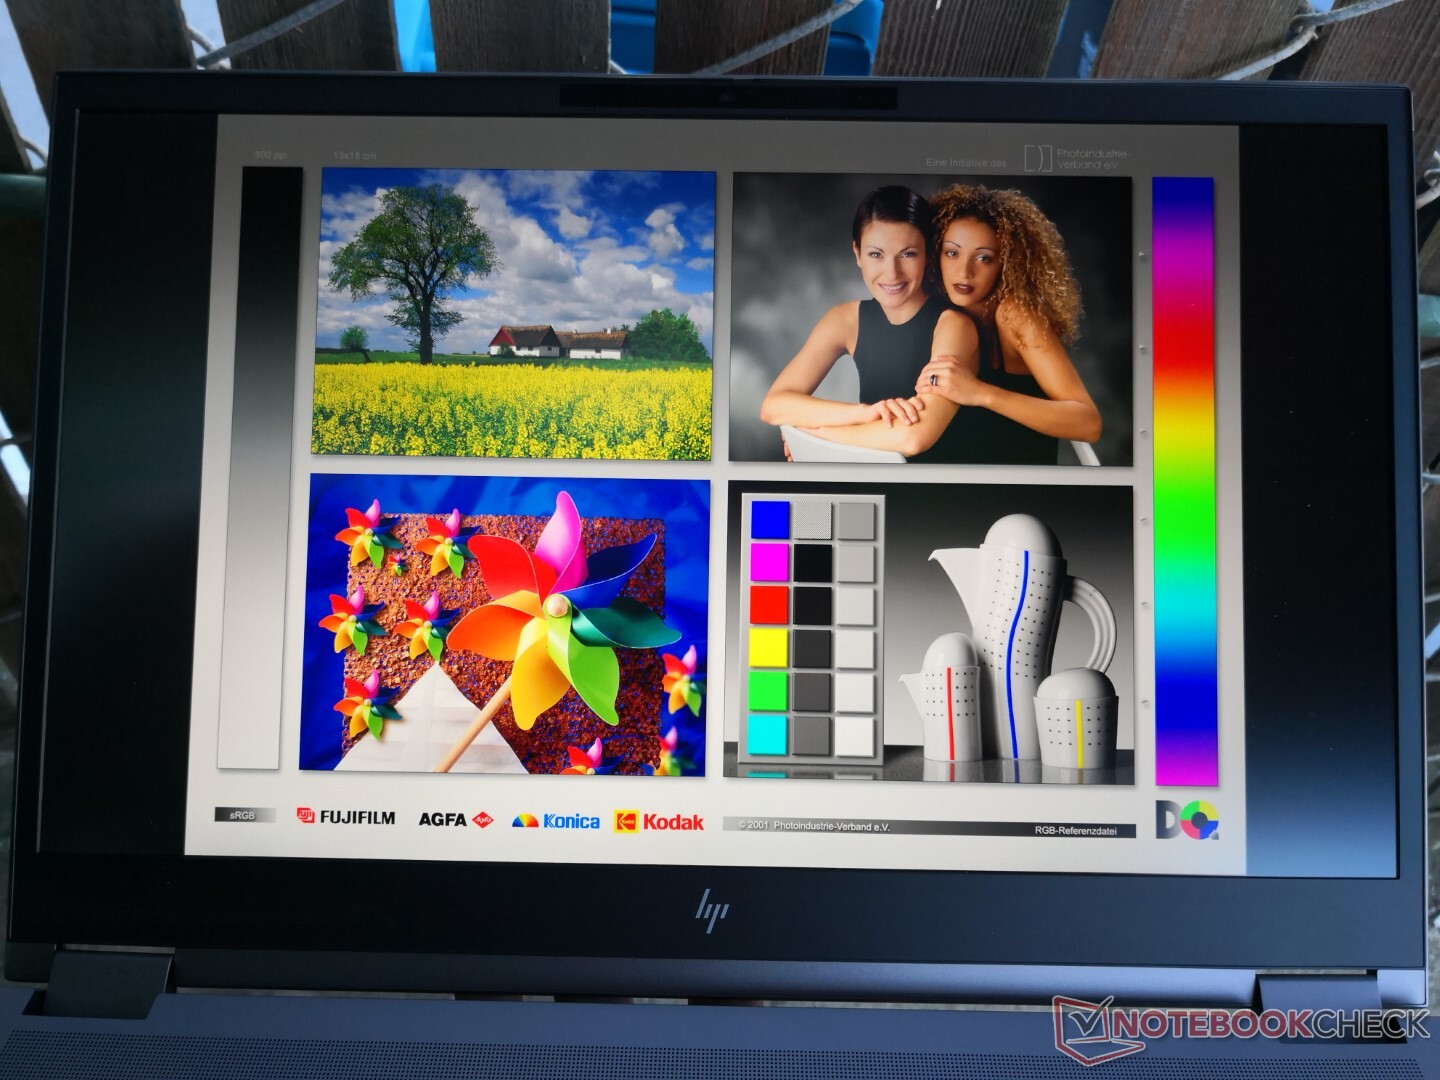
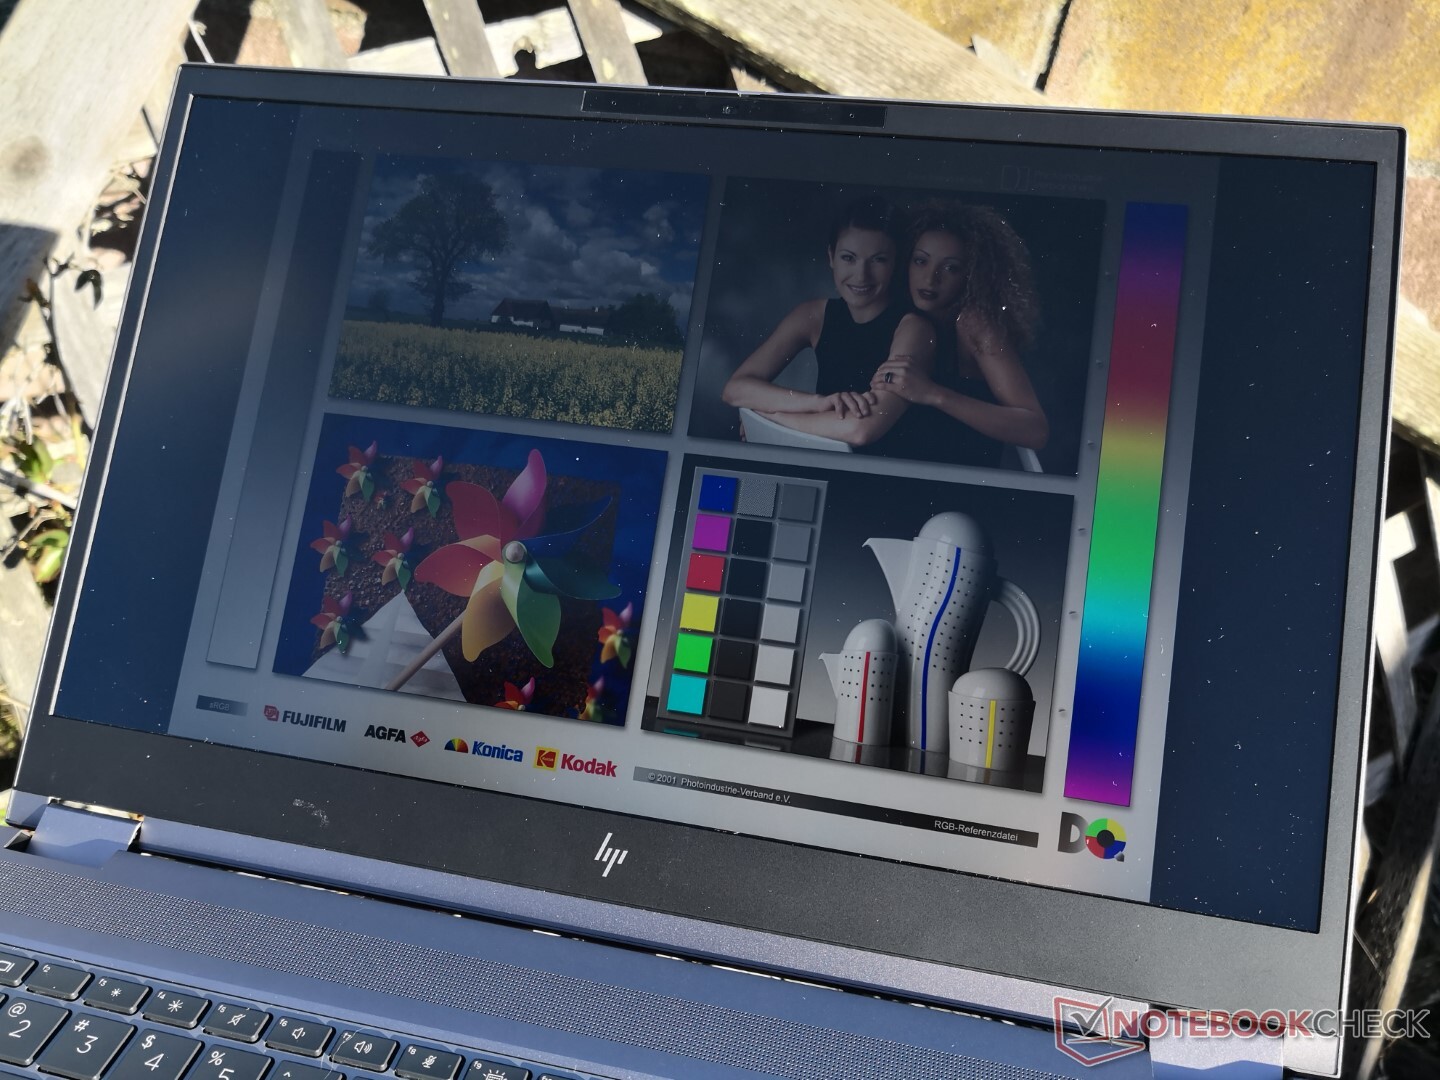
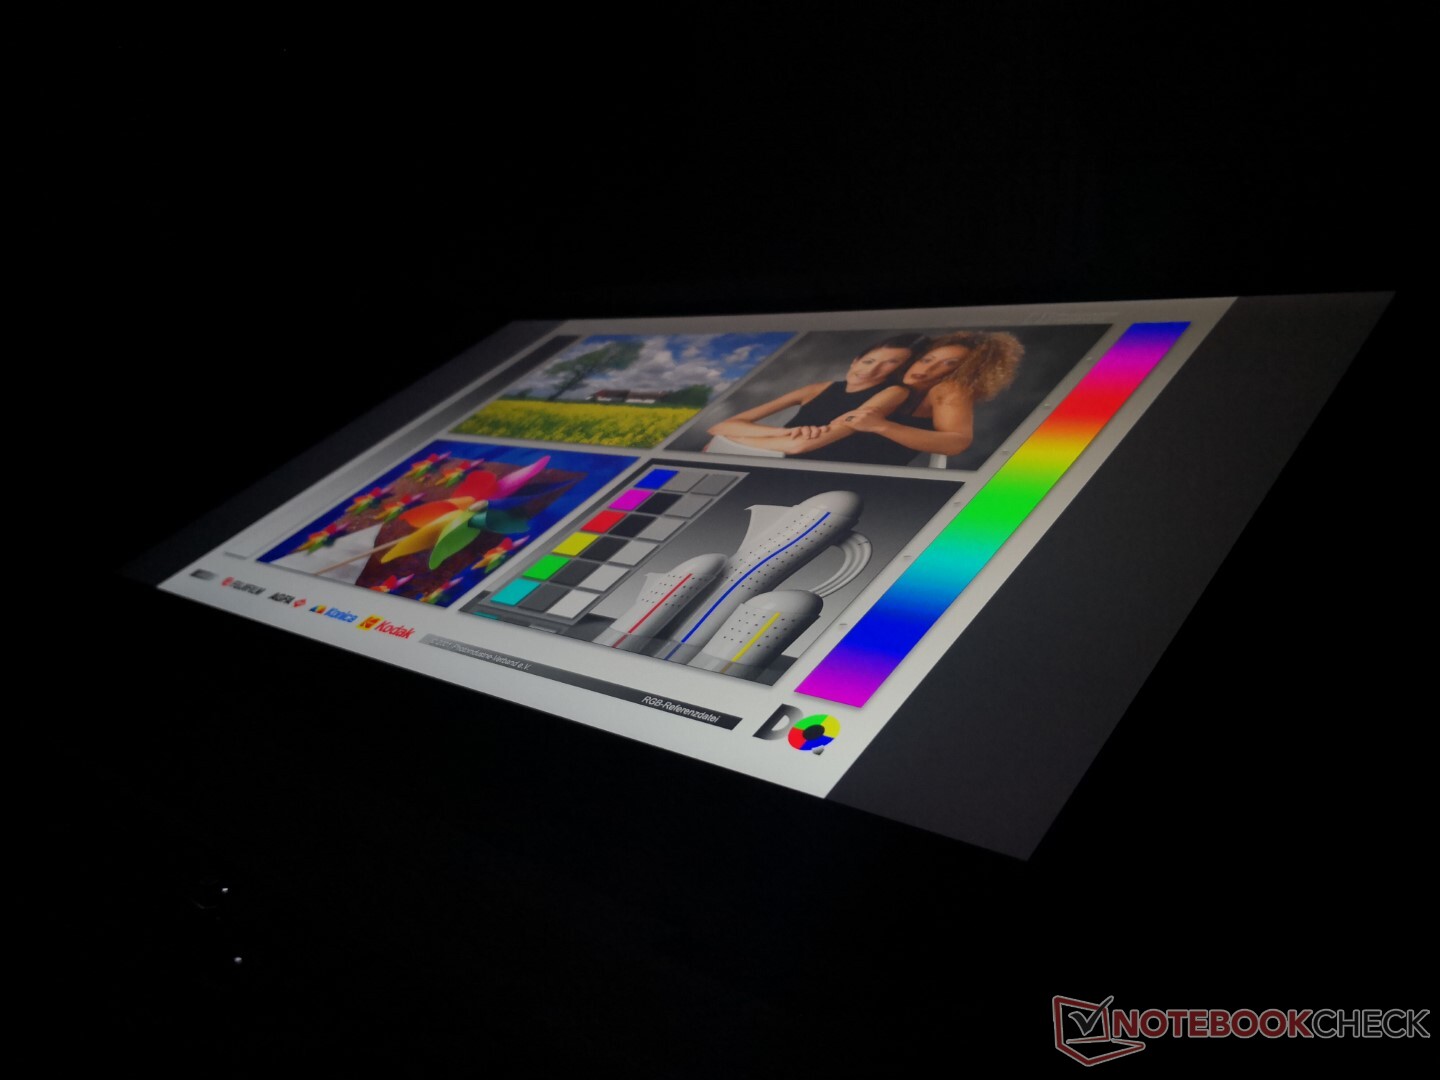
La visibilità all'esterno è buona se in ombra, soprattutto perché il display è significativamente più luminoso rispetto alla media di un laptop o di una workstation da 15,6 pollici. La luce diretta del sole continuerà comunque a schiarire via lo schermo.
Prestazioni
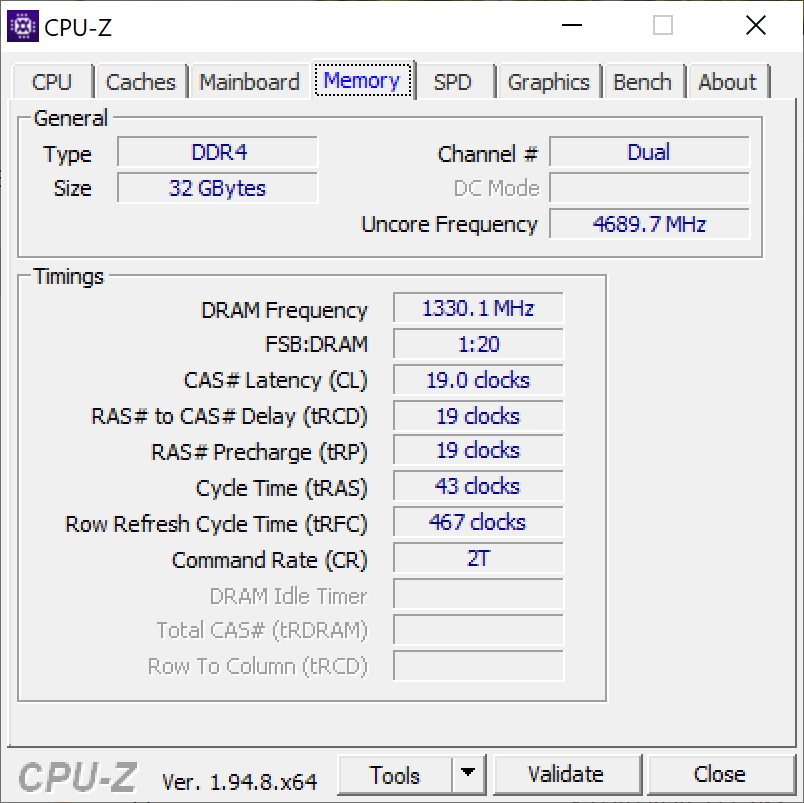
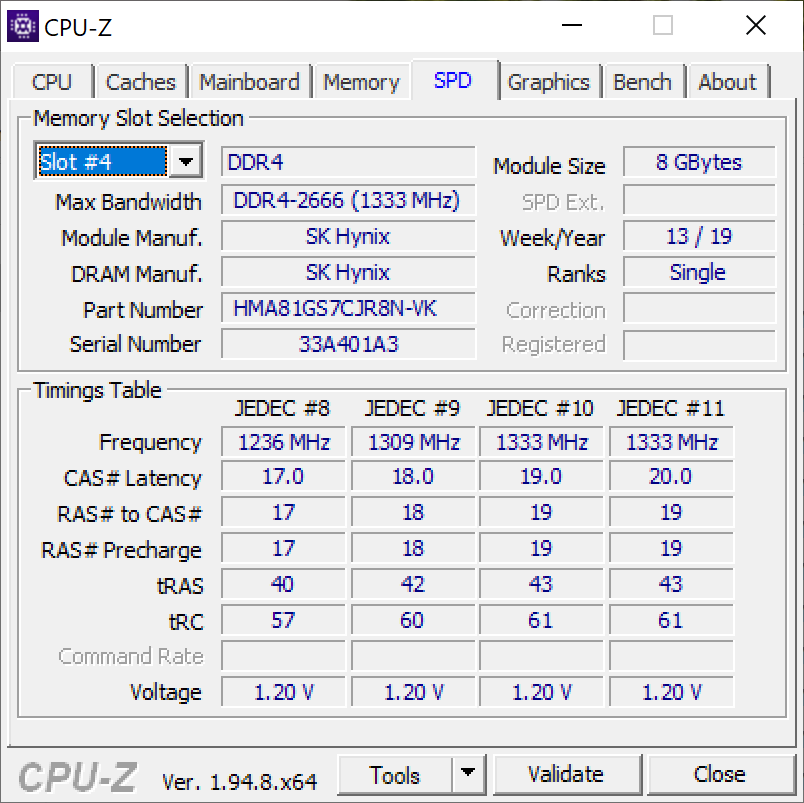
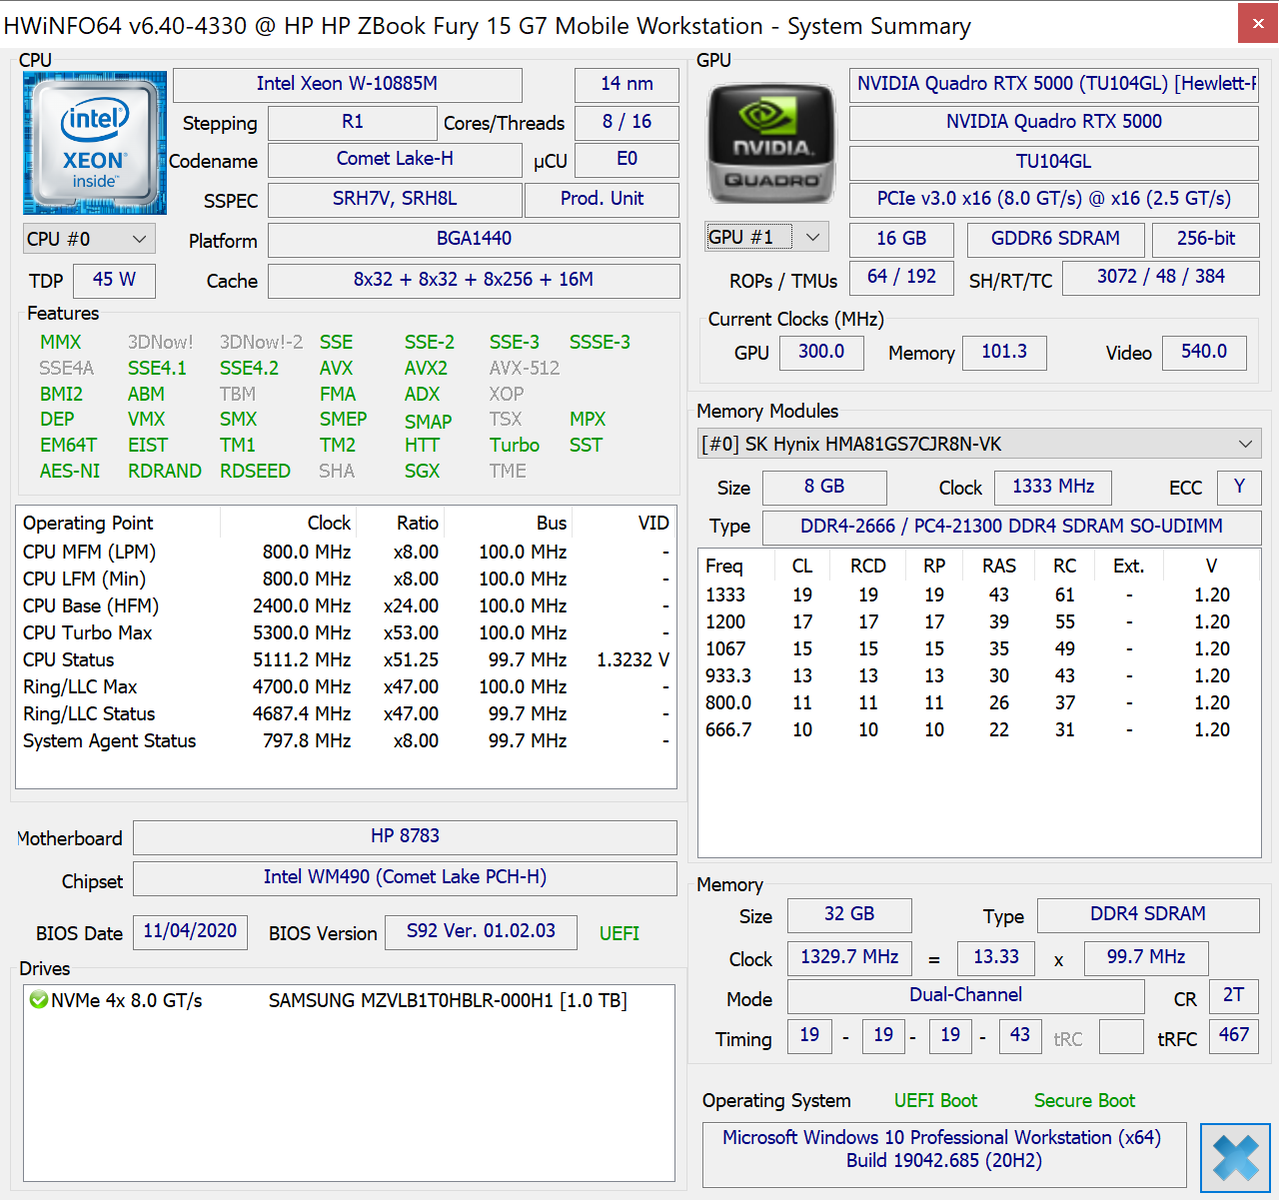
Come workstation mobile completa, lo ZBook Fury 15 può essere equipaggiato con il Core i9-10885H o Xeon W-10885M per il supporto della RAM ECC. Vale la pena notare che gli utenti possono configurare fino a 128 GB di RAM non ECC, mentre l'ECC sarà limitato a 64 GB. I professionisti che non sono utenti di potenza possono invece preferire il più piccolo e portatile HP ZBook Firefly.
La nostra unità è stata impostata in modalità High Performance via Windows prima di eseguire tutti i benchmarks sotto riportati per ottenere i punteggi più alti possibili.
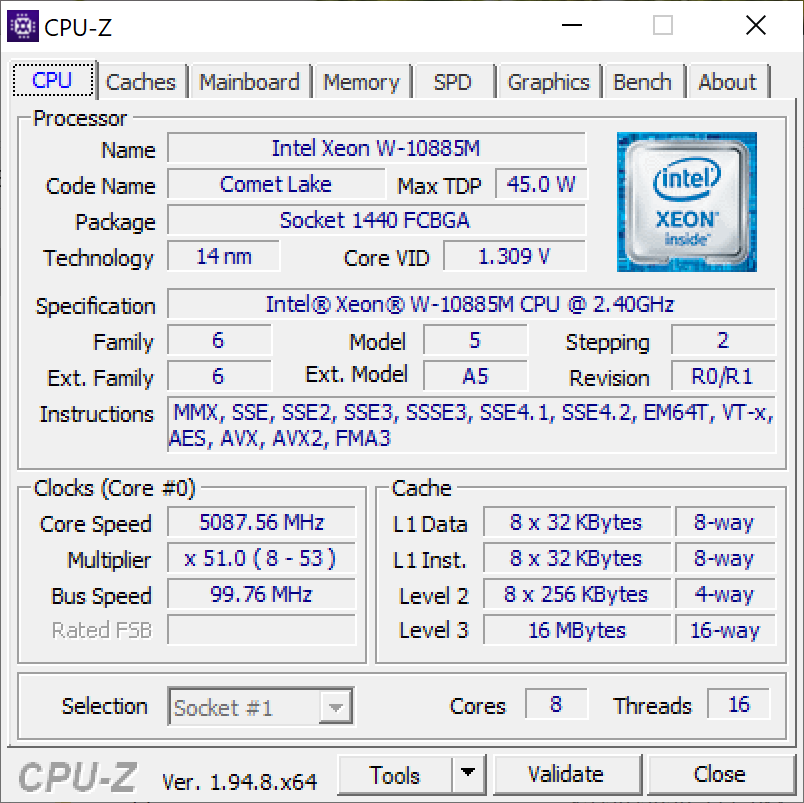
Processore
Le prestazioni del multi-thread pure sono più lente del previsto, circa il 30% in meno rispetto al Precision 7550 equipaggiato con la stessa CPU Xeon. I vantaggi del Turbo Boost sono minimi, come dimostrano i risultati del nostro CineBench R15 xT loop test di CineBench.
Le prestazioni migliorano significativamente dopo l'aggiornamento del BIOS alla 1.04.01, probabilmente a causa di un bug con la nostra versione precedente del BIOS. Le prestazioni del multithread pure salgono di quasi il 50% risultando essere più in linea con il Dell di cui sopra. Ciò ha un costo, tuttavia, che la nostra sezione Stress Test di seguito illustrerà in dettaglio.
Cinebench R15: CPU Multi 64Bit | CPU Single 64Bit
Blender: v2.79 BMW27 CPU
7-Zip 18.03: 7z b 4 -mmt1 | 7z b 4
Geekbench 5.5: Single-Core | Multi-Core
HWBOT x265 Benchmark v2.2: 4k Preset
LibreOffice : 20 Documents To PDF
R Benchmark 2.5: Overall mean
| HWBOT x265 Benchmark v2.2 / 4k Preset | |
| MSI WS66 10TMT-207US | |
| Media Intel Xeon W-10885M (8.89 - 13.6, n=3) | |
| Dell Precision 5540 | |
| Dell Precision 3000 3551 | |
| Dell Precision 5550 P91F | |
| Lenovo ThinkPad X1 Extreme Gen3-20TLS0UV00 | |
| Acer Nitro 5 AN515-44-R5FT | |
| HP ZBook Fury 15 G7 | |
| Asus ProArt StudioBook Pro 15 W500G5T | |
| Dell XPS 15 9500 Core i5 | |
| LibreOffice / 20 Documents To PDF | |
| Acer Nitro 5 AN515-44-R5FT | |
| Dell XPS 15 9500 Core i5 | |
| Asus ProArt StudioBook Pro 15 W500G5T | |
| HP ZBook Fury 15 G7 | |
| Media Intel Xeon W-10885M (44.4 - 58.1, n=3) | |
| Lenovo ThinkPad X1 Extreme Gen3-20TLS0UV00 | |
| Dell Precision 3000 3551 | |
| MSI WS66 10TMT-207US | |
| Dell Precision 5550 P91F | |
| R Benchmark 2.5 / Overall mean | |
| Dell XPS 15 9500 Core i5 | |
| Asus ProArt StudioBook Pro 15 W500G5T | |
| Acer Nitro 5 AN515-44-R5FT | |
| Lenovo ThinkPad X1 Extreme Gen3-20TLS0UV00 | |
| Dell Precision 5550 P91F | |
| MSI WS66 10TMT-207US | |
| Dell Precision 3000 3551 | |
| Media Intel Xeon W-10885M (0.551 - 0.57, n=3) | |
| HP ZBook Fury 15 G7 | |
* ... Meglio usare valori piccoli
Prestazioni del sistema
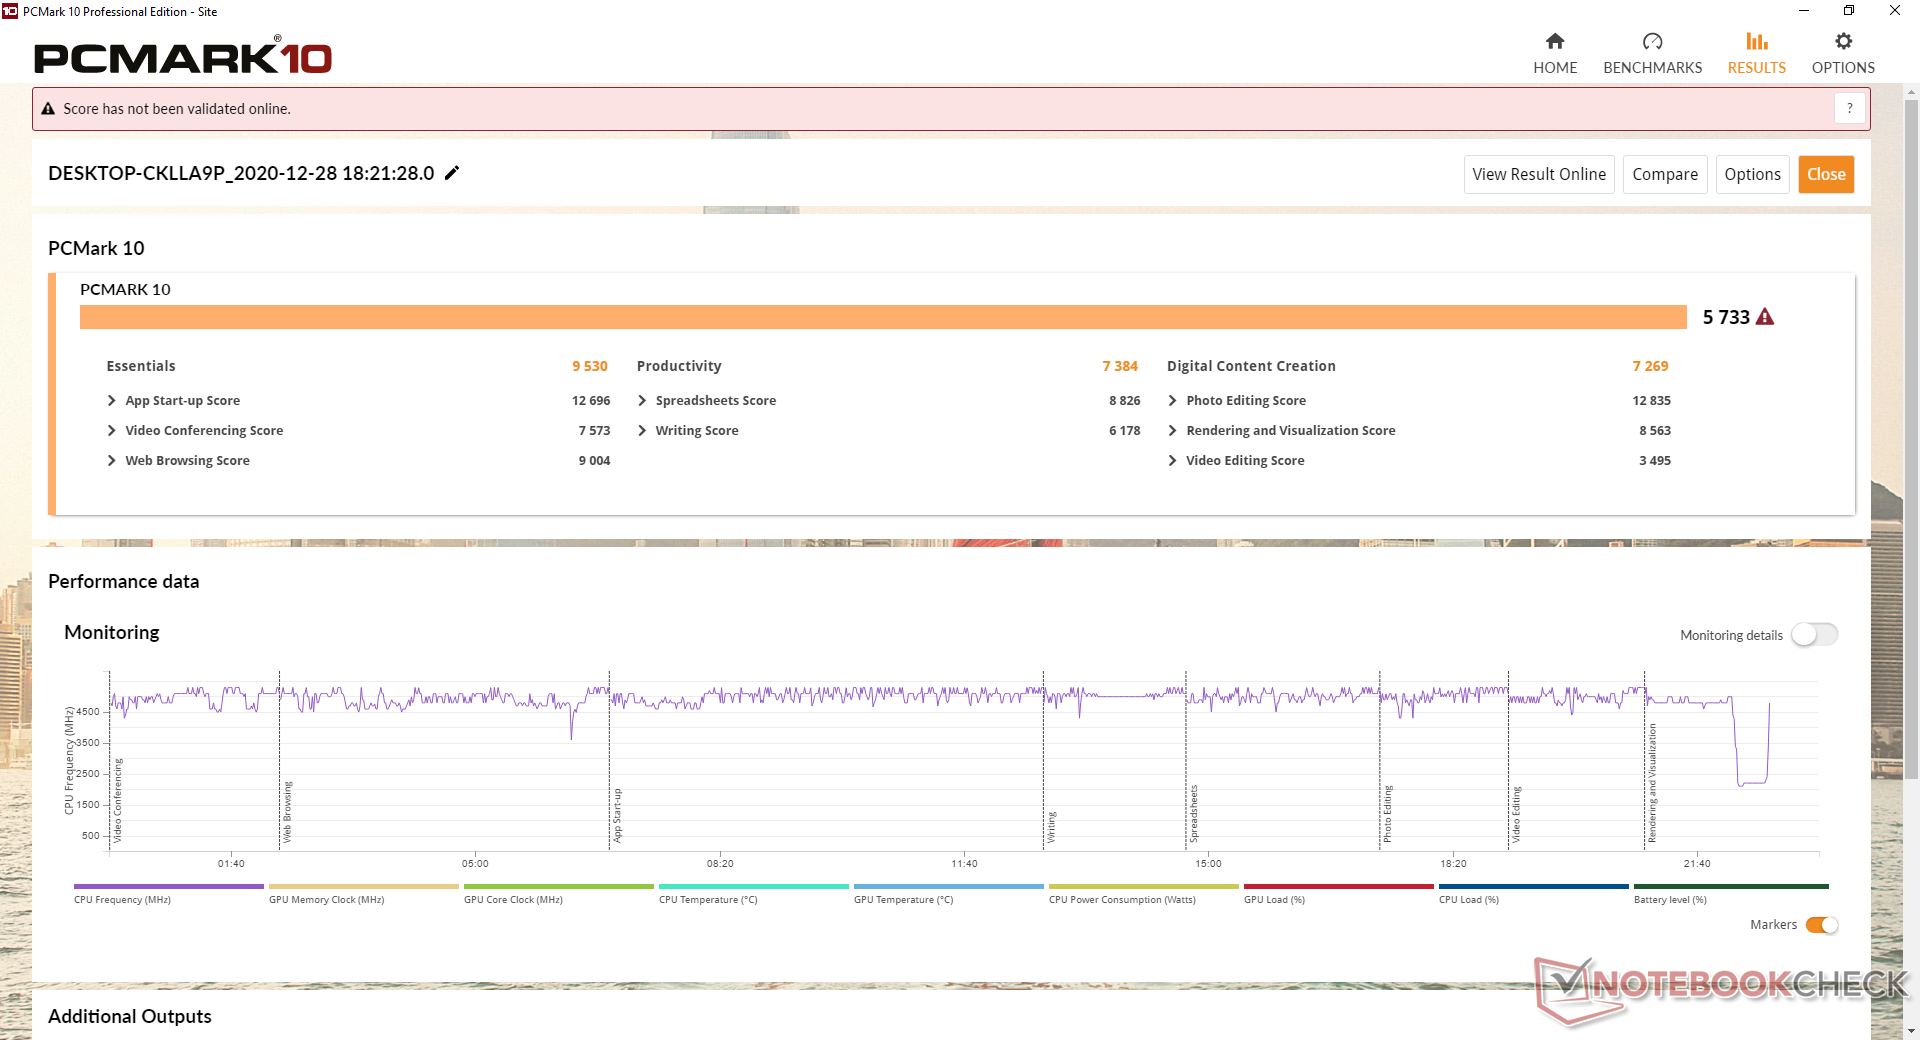
I benchmarks PCMark rispecchiano le attese in confronto ad altre workstations mobili. Il Precision 7550, che viene fornito con la stessa identica CPU e GPU del nostro HP, è in grado di limitare il nostro sistema di appena qualche punto percentuale.
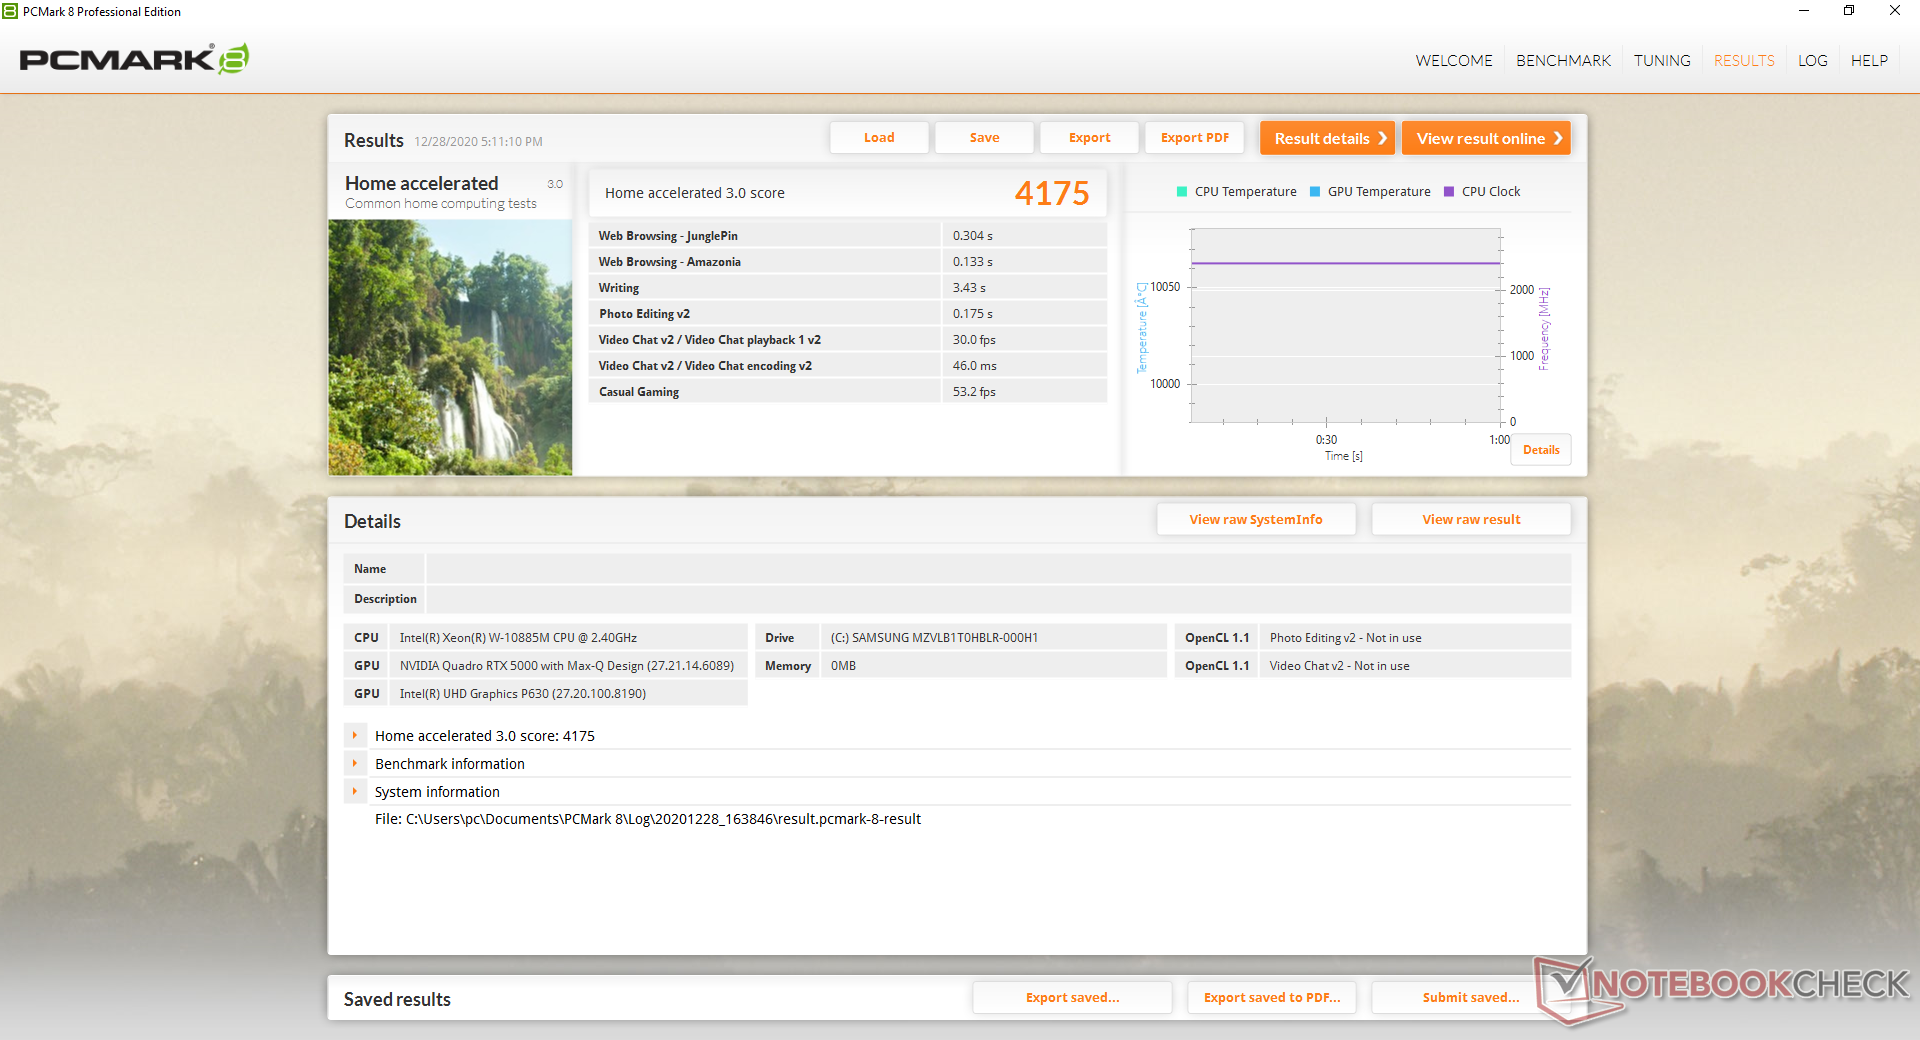
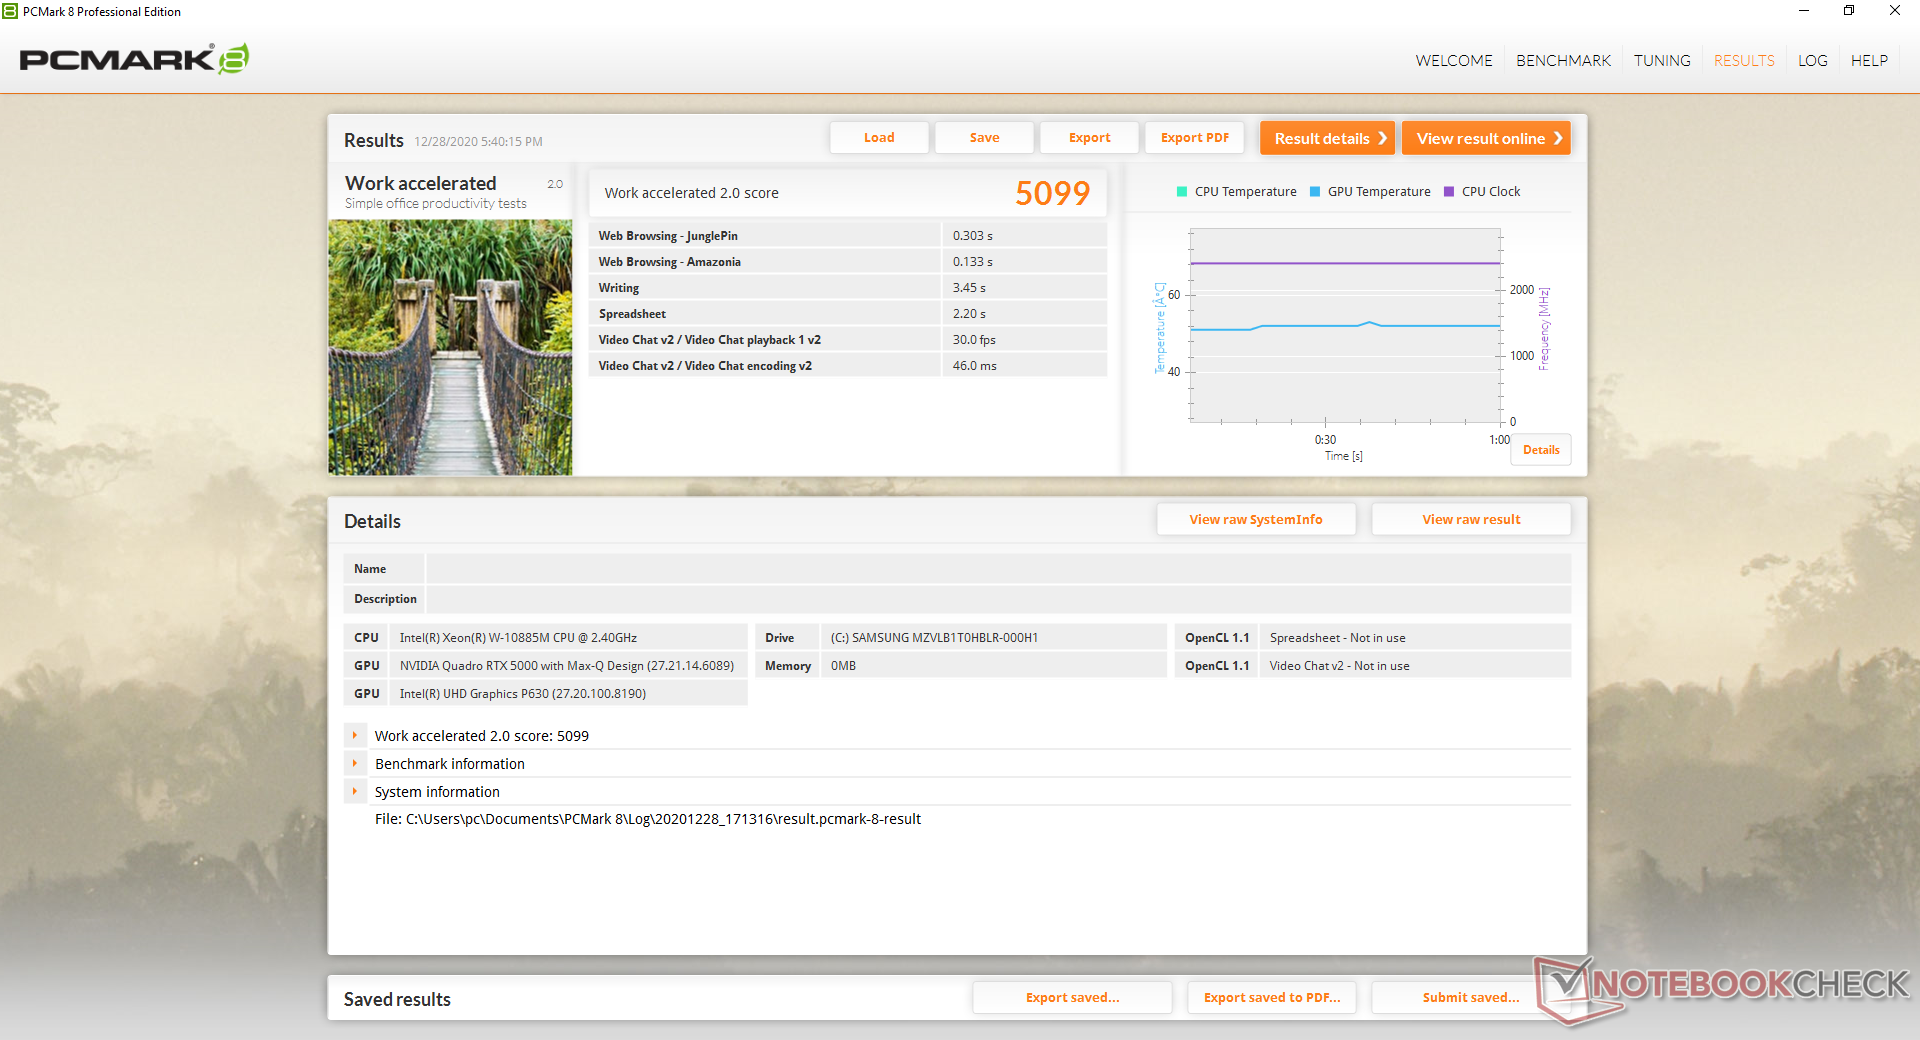
| PCMark 8 Home Score Accelerated v2 | 4175 punti | |
| PCMark 8 Work Score Accelerated v2 | 5099 punti | |
| PCMark 10 Score | 5733 punti | |
Aiuto | ||
Latenza DPC
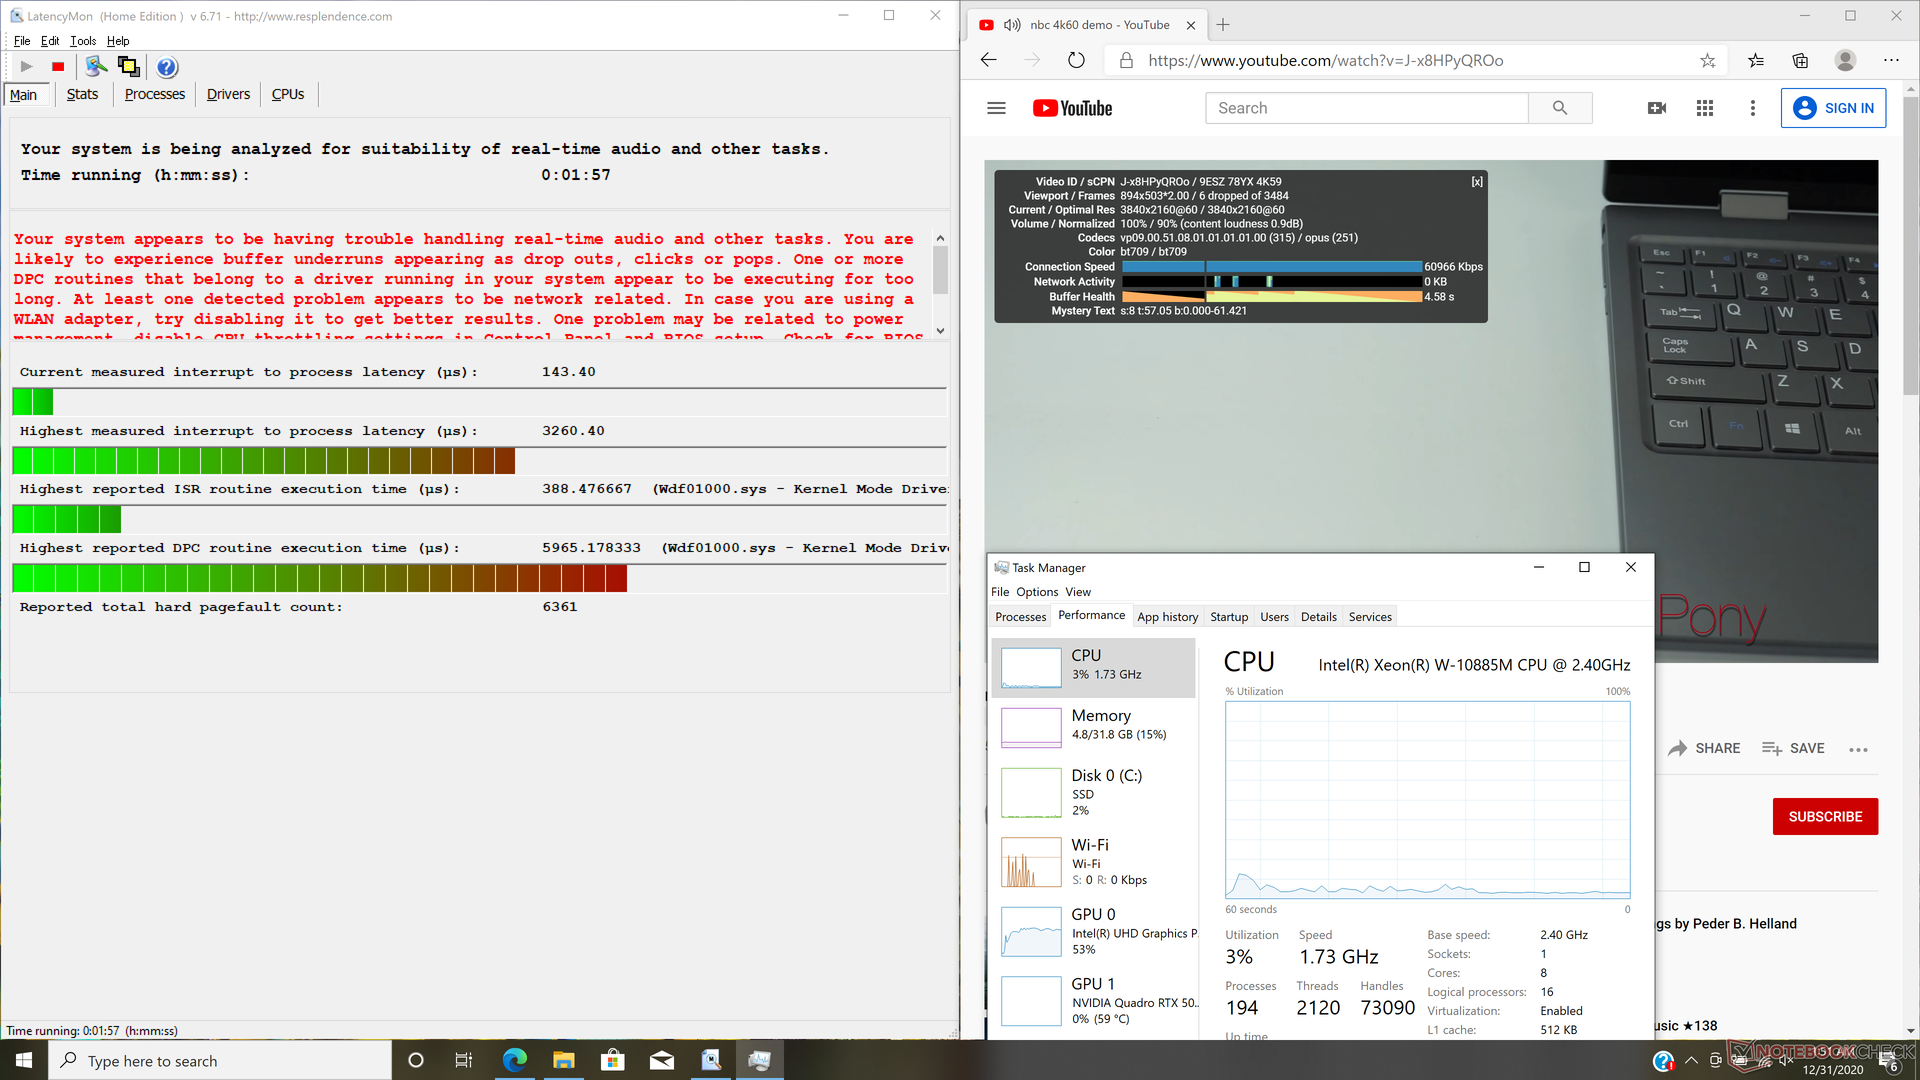
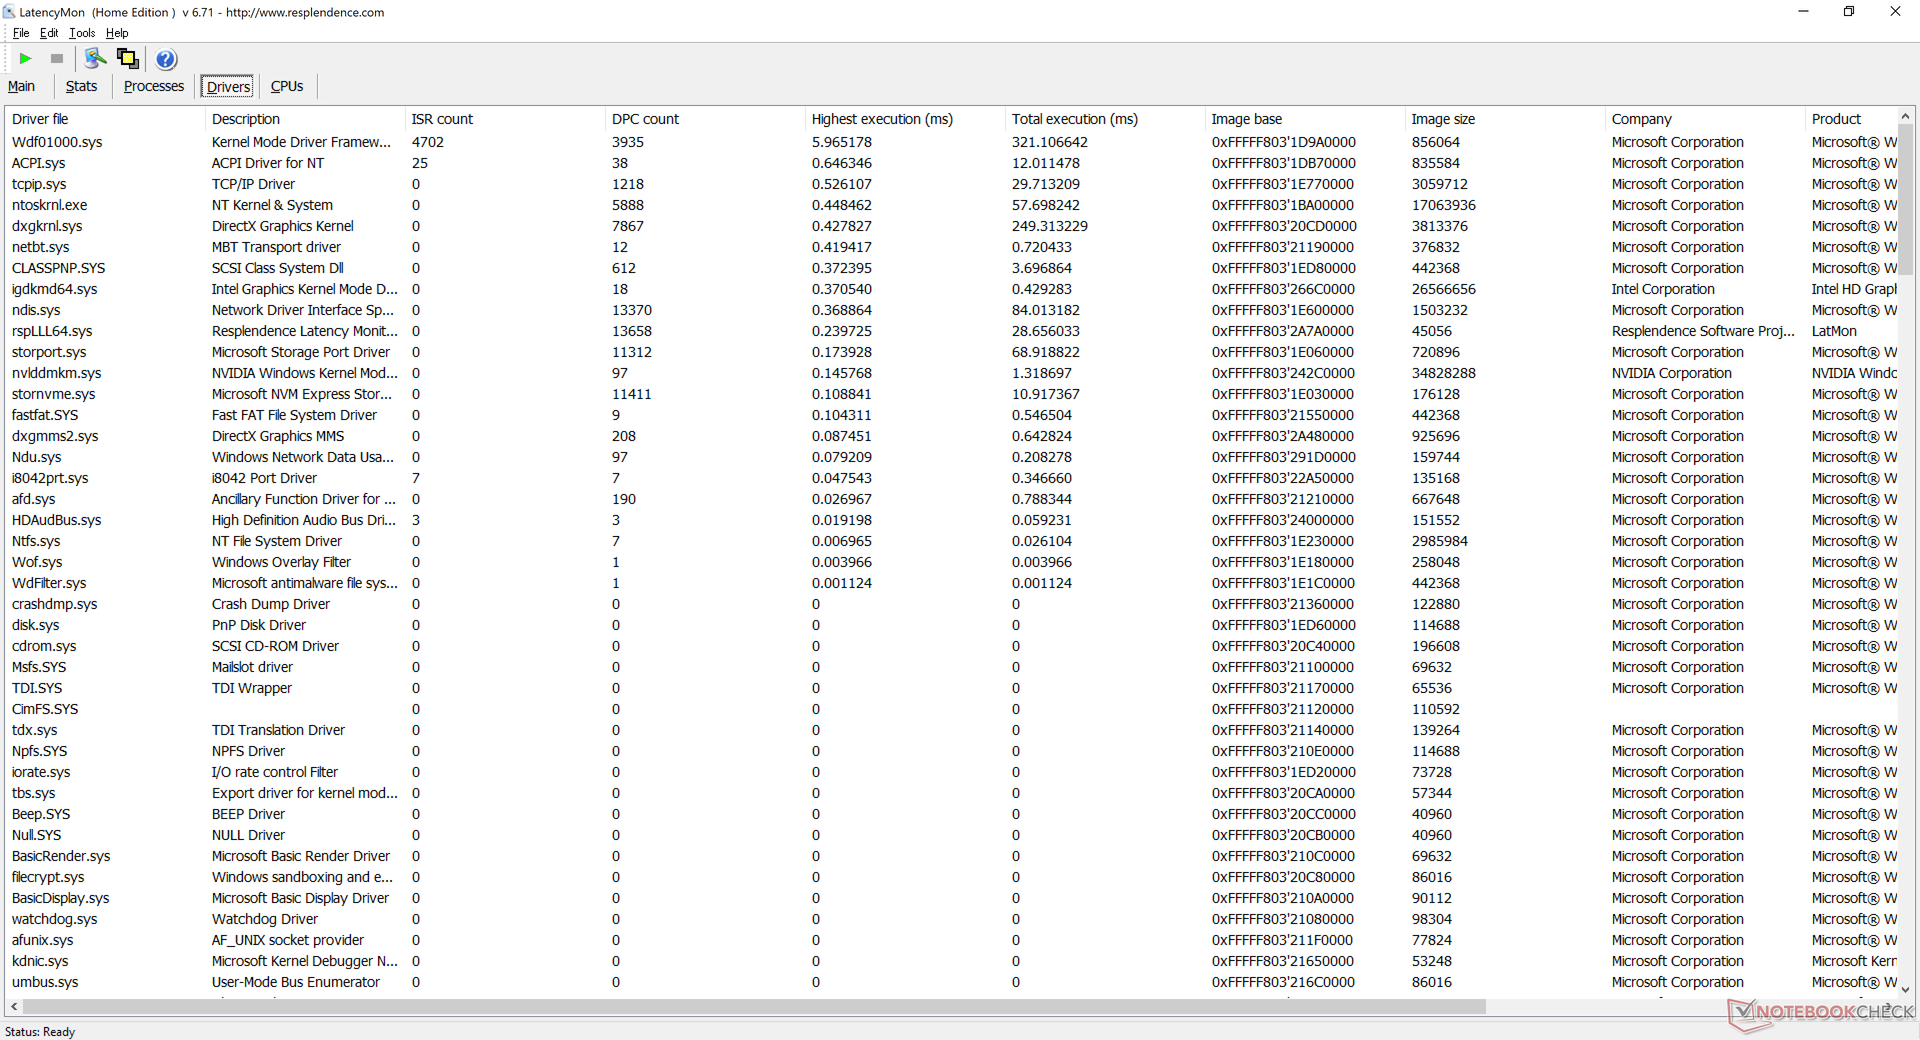
LatencyMon rivela problemi di latenza del DPC quando si aprono più schede del browser della nostra homepage anche dopo diversi test ripetuti. La riproduzione di video 4K a 60 FPS è fluida ma non perfetta, poiché abbiamo registrato 6 fotogrammi persi durante un video YouTube di un minuto.
| DPC Latencies / LatencyMon - interrupt to process latency (max), Web, Youtube, Prime95 | |
| Dell Precision 7550 | |
| MSI WS66 10TMT-207US | |
| HP ZBook Fury 15 G7 | |
| Asus ProArt StudioBook Pro 15 W500G5T | |
| Razer Blade 15 Studio Edition 2020 | |
* ... Meglio usare valori piccoli
Dispositivi di archiviazione
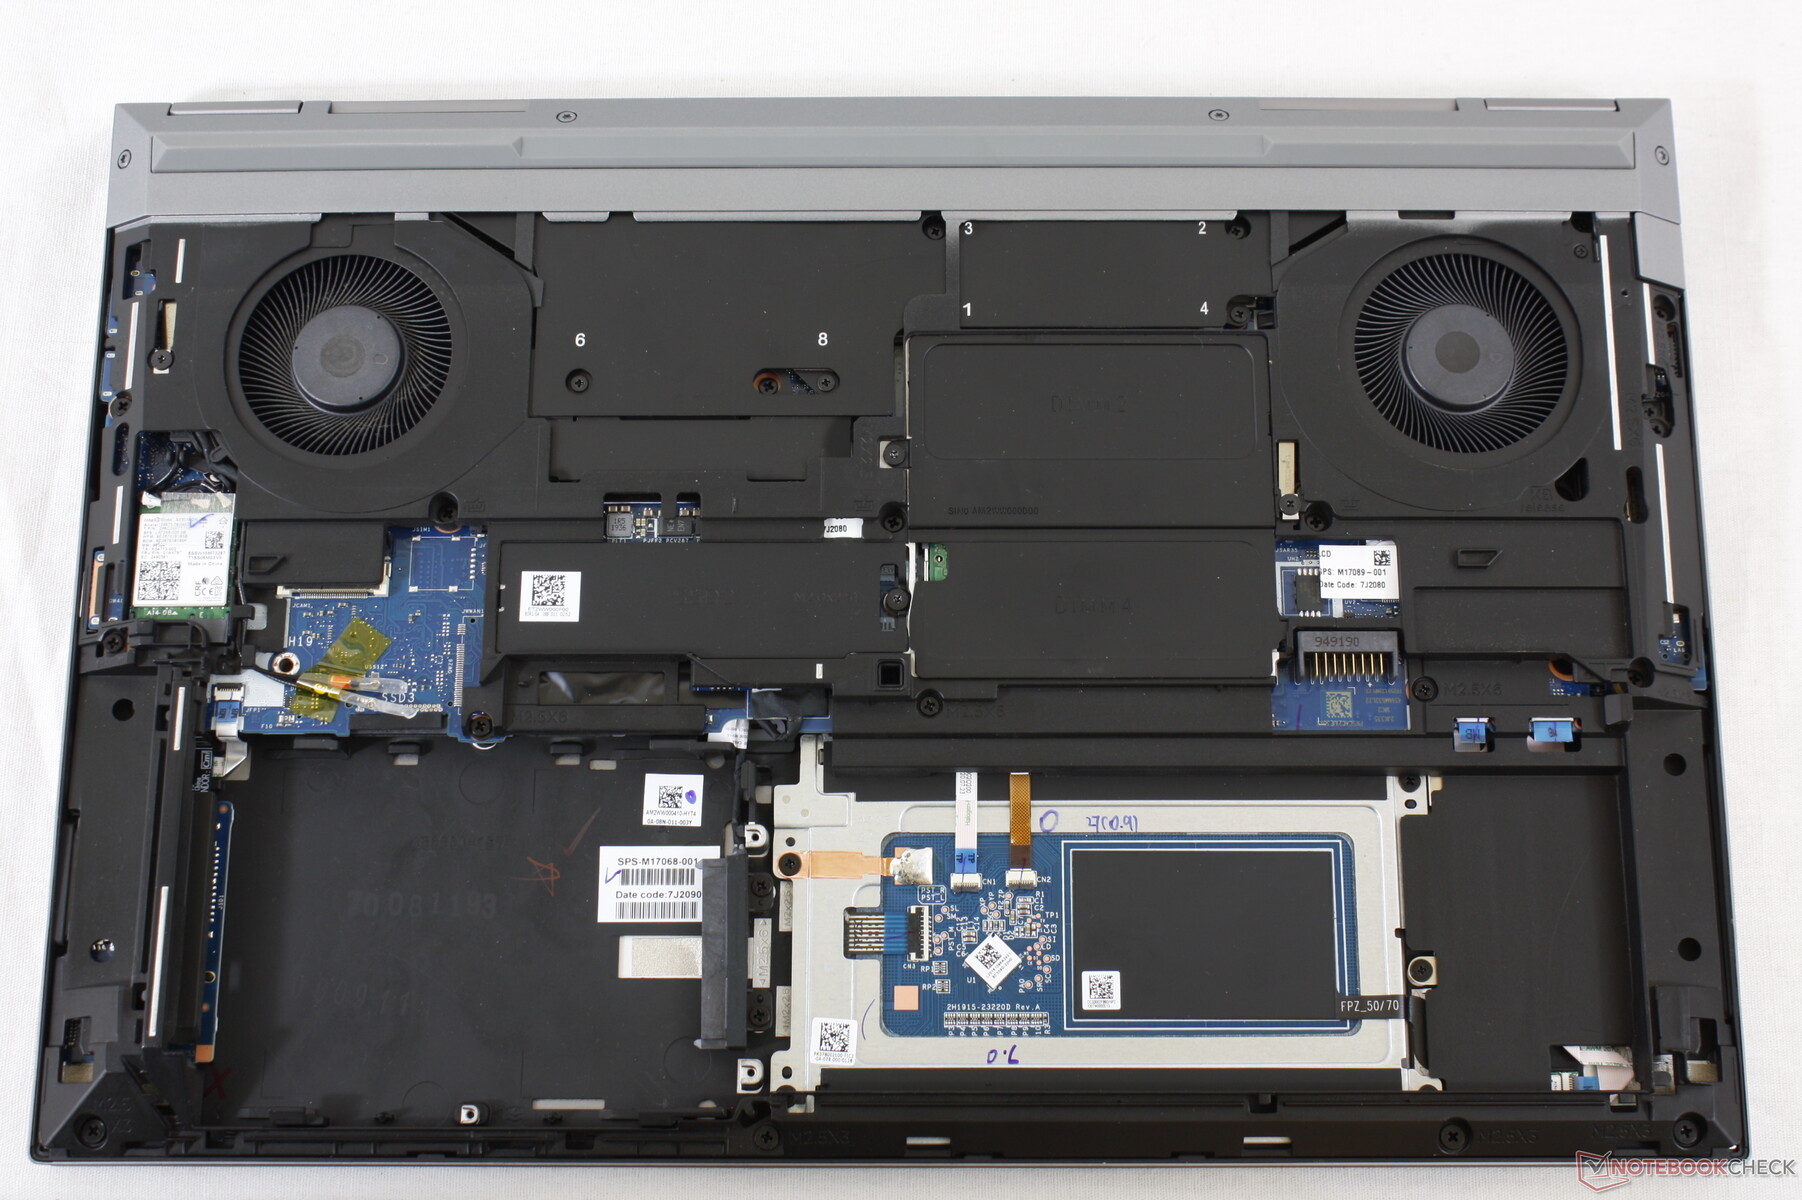
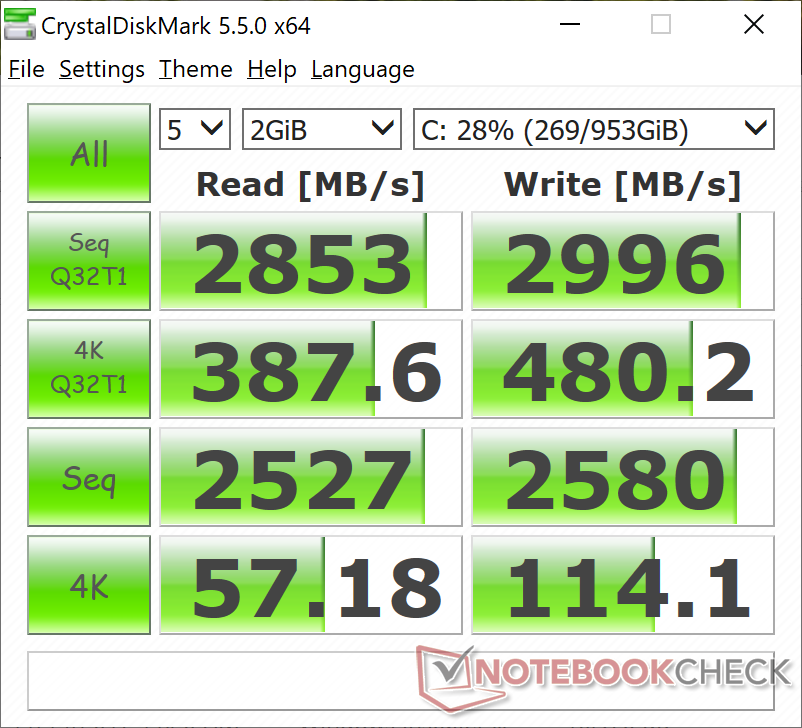
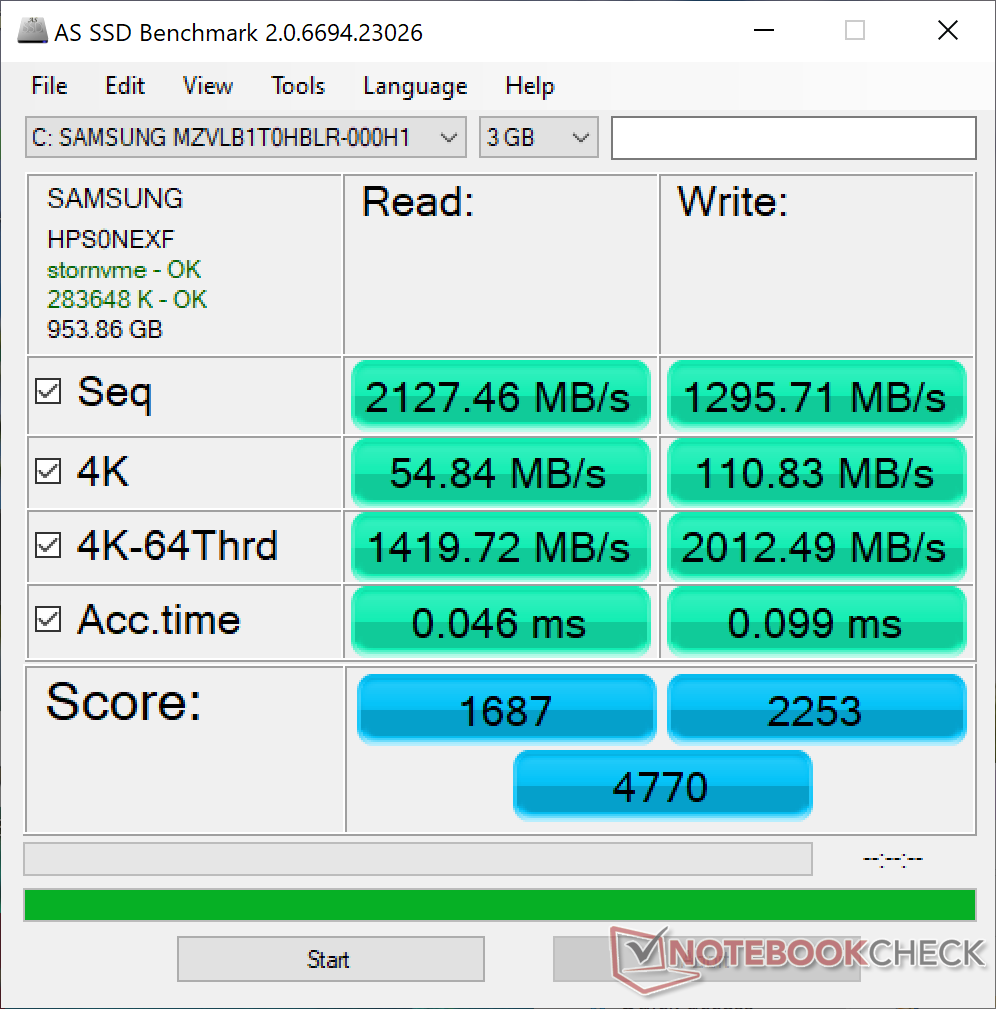
La nostra unità di test viene fornita con un Samsung PM981a da 1 TB che è uno dei più veloci SSD PCIe 3 x4 NVMe consumer disponibili. Gli utenti possono configurare con altre dimensioni o modelli con sicurezza SED, se lo desiderano.
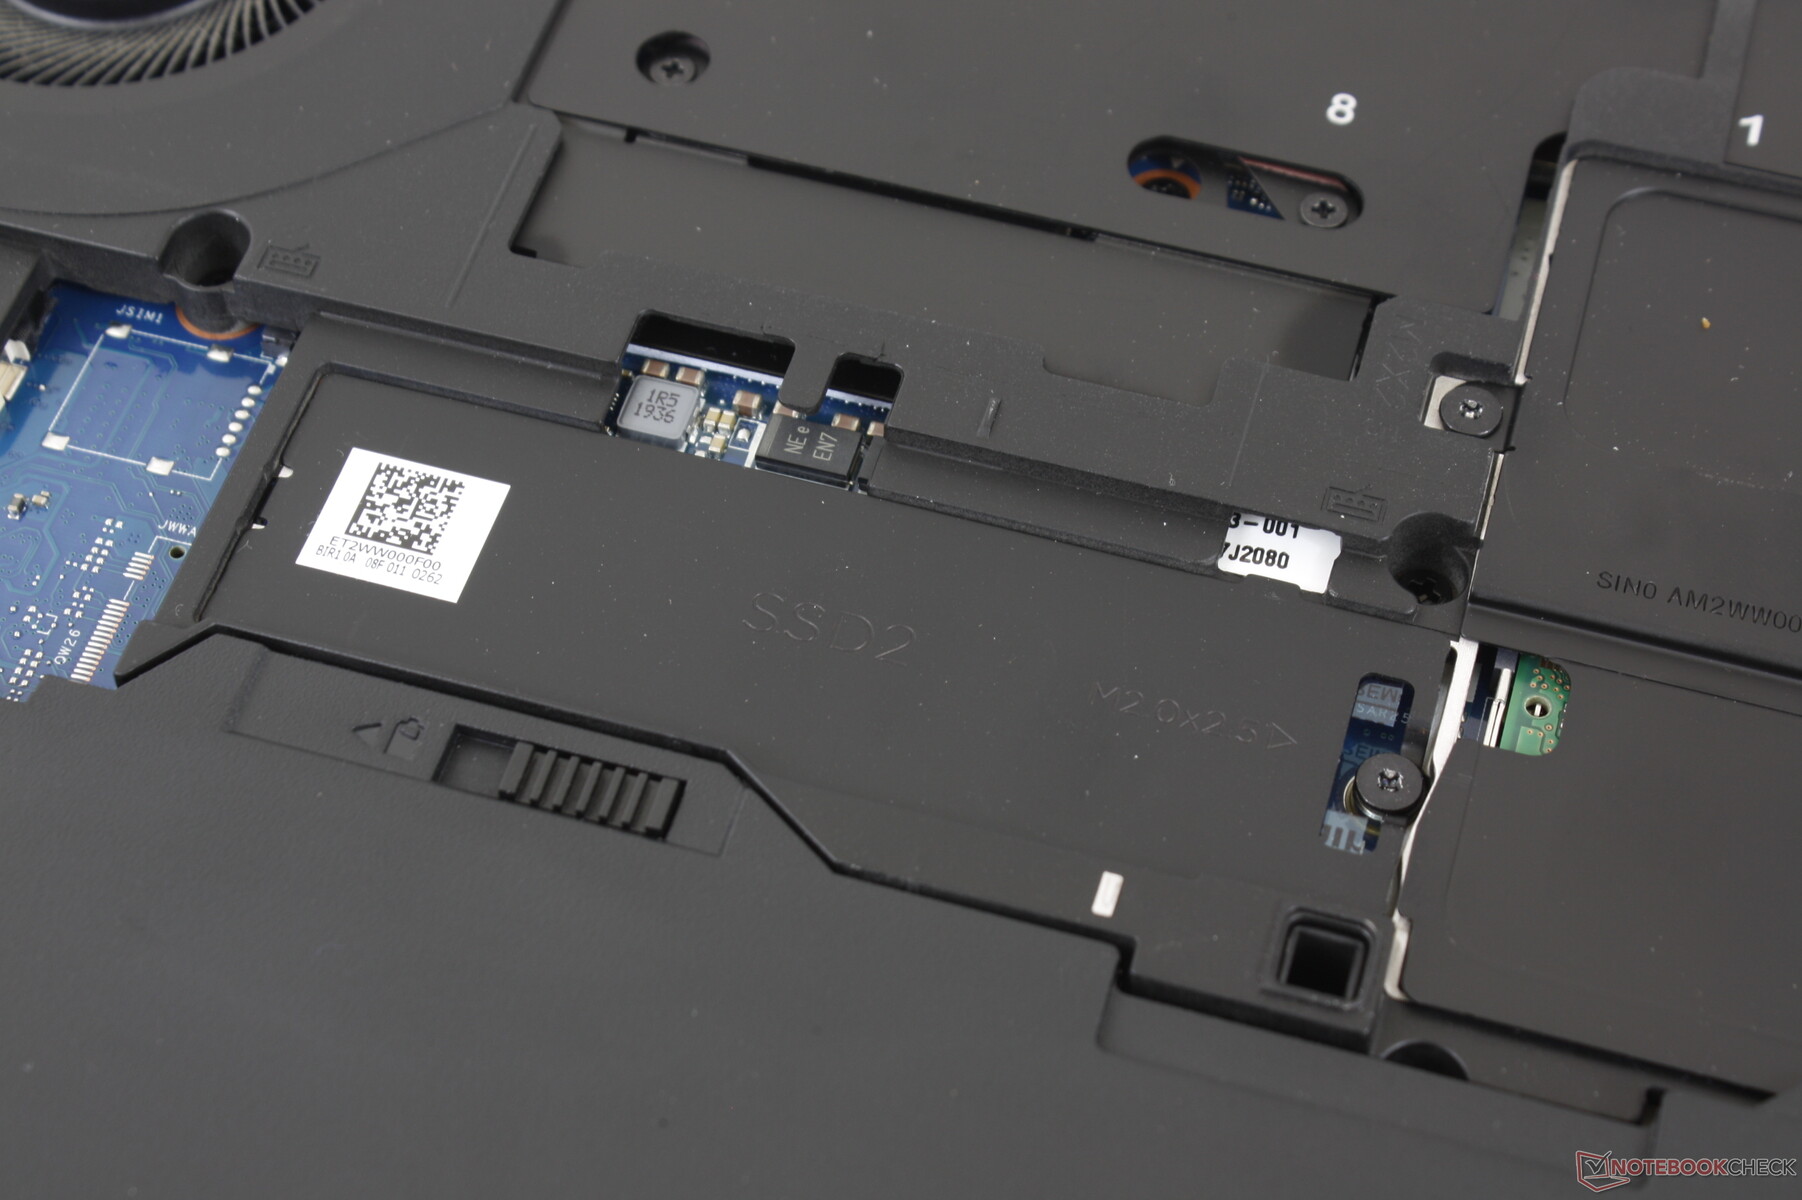
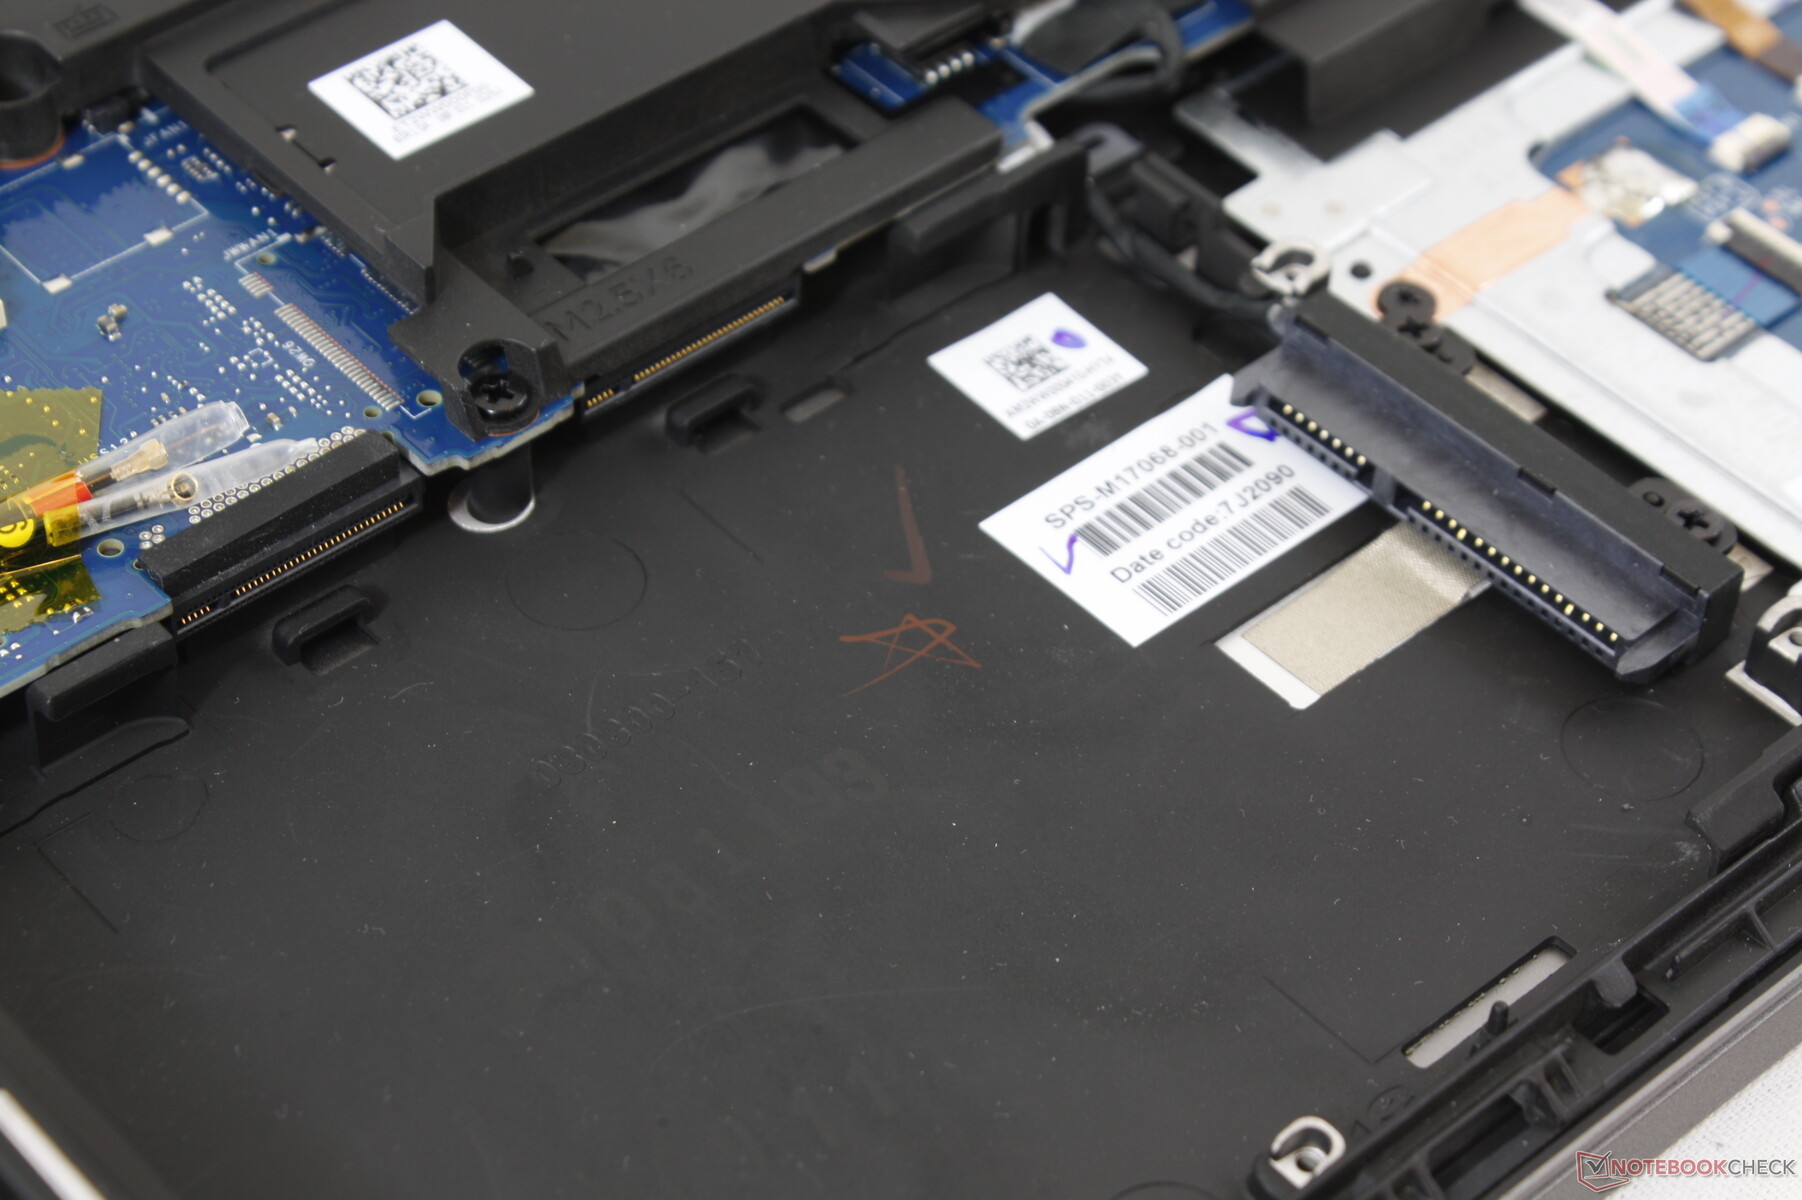
Sono disponibili un totale di quattro slot di memoria (3x M.2 2280 + 1x SATA III da 2,5 pollici). Tuttavia, l'alloggiamento da 2,5 pollici condivide lo stesso spazio di due slot M.2, il che significa che non c'è abbastanza spazio per installare quattro unità. Gli utenti possono installare fino a tre unità M.2 o un'unità M.2 più un'unità da 2,5 pollici.
Alcune versioni omettono il connettore da 2,5 pollici per un ulteriore slot M.2 per supportare fino a quattro unità M.2 contemporaneamente.
| HP ZBook Fury 15 G7 Samsung PM981a MZVLB1T0HBLR | MSI WS66 10TMT-207US WDC PC SN730 SDBPNTY-1T00 | Dell Precision 7550 SK Hynix PC601A NVMe 1TB | Razer Blade 15 Studio Edition 2020 Samsung PM981a MZVLB1T0HBLR | Lenovo ThinkPad P1 2019-20QT000RGE WDC PC SN720 SDAQNTW-512G | |
|---|---|---|---|---|---|
| AS SSD | 74% | 29% | 31% | 49% | |
| Seq Read (MB/s) | 2127 | 2321 9% | 2028 -5% | 1982 -7% | 2980 40% |
| Seq Write (MB/s) | 1296 | 2620 102% | 1193 -8% | 2252 74% | 2094 62% |
| 4K Read (MB/s) | 54.8 | 48.57 -11% | 42.31 -23% | 47.13 -14% | 45.05 -18% |
| 4K Write (MB/s) | 110.8 | 165.1 49% | 105.5 -5% | 88.2 -20% | 155.4 40% |
| 4K-64 Read (MB/s) | 1420 | 1712 21% | 1128 -21% | 1481 4% | 1291 -9% |
| 4K-64 Write (MB/s) | 2012 | 2174 8% | 1537 -24% | 1842 -8% | 1506 -25% |
| Access Time Read * (ms) | 0.046 | 0.057 -24% | 0.069 -50% | 0.087 -89% | 0.064 -39% |
| Access Time Write * (ms) | 0.099 | 0.068 31% | 0.106 -7% | 0.04 60% | 0.024 76% |
| Score Read (Points) | 1687 | 1993 18% | 1373 -19% | 1726 2% | 1634 -3% |
| Score Write (Points) | 2253 | 2601 15% | 1762 -22% | 2155 -4% | 1871 -17% |
| Score Total (Points) | 4770 | 5630 18% | 3801 -20% | 4781 0% | 4300 -10% |
| Copy ISO MB/s (MB/s) | 2779 | 2589 -7% | 1768 -36% | 1982 -29% | 2015 -27% |
| Copy Program MB/s (MB/s) | 123.3 | 791 542% | 627 409% | 501 306% | 597 384% |
| Copy Game MB/s (MB/s) | 440.8 | 1625 269% | 1477 235% | 1140 159% | 1449 229% |
| CrystalDiskMark 5.2 / 6 | 12% | -9% | 2% | 1% | |
| Write 4K (MB/s) | 114.1 | 185.8 63% | 121 6% | 132.9 16% | 162.2 42% |
| Read 4K (MB/s) | 57.2 | 47.21 -17% | 42.16 -26% | 46.73 -18% | 43.71 -24% |
| Write Seq (MB/s) | 2580 | 2874 11% | 2150 -17% | 2214 -14% | 2441 -5% |
| Read Seq (MB/s) | 2527 | 1786 -29% | 1755 -31% | 2018 -20% | 1753 -31% |
| Write 4K Q32T1 (MB/s) | 480.2 | 466.8 -3% | 395.3 -18% | 478.9 0% | 397.6 -17% |
| Read 4K Q32T1 (MB/s) | 387.6 | 563 45% | 381.8 -1% | 540 39% | 520 34% |
| Write Seq Q32T1 (MB/s) | 2996 | 3091 3% | 2730 -9% | 2975 -1% | 2519 -16% |
| Read Seq Q32T1 (MB/s) | 2853 | 3395 19% | 3468 22% | 3195 12% | 3448 21% |
| Write 4K Q8T8 (MB/s) | 1381 | ||||
| Read 4K Q8T8 (MB/s) | 1371 | ||||
| Media totale (Programma / Settaggio) | 43% /
51% | 10% /
15% | 17% /
20% | 25% /
31% |
* ... Meglio usare valori piccoli

Throttling Disco: DiskSpd Read Loop, Queue Depth 8
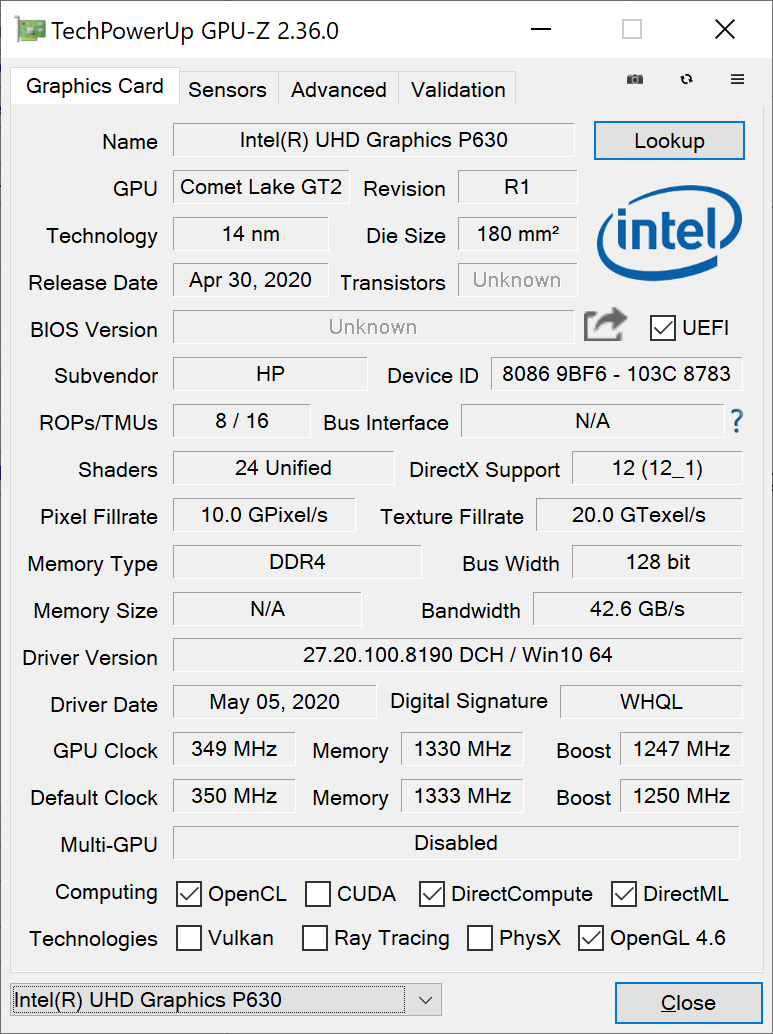
Prestazioni della GPU
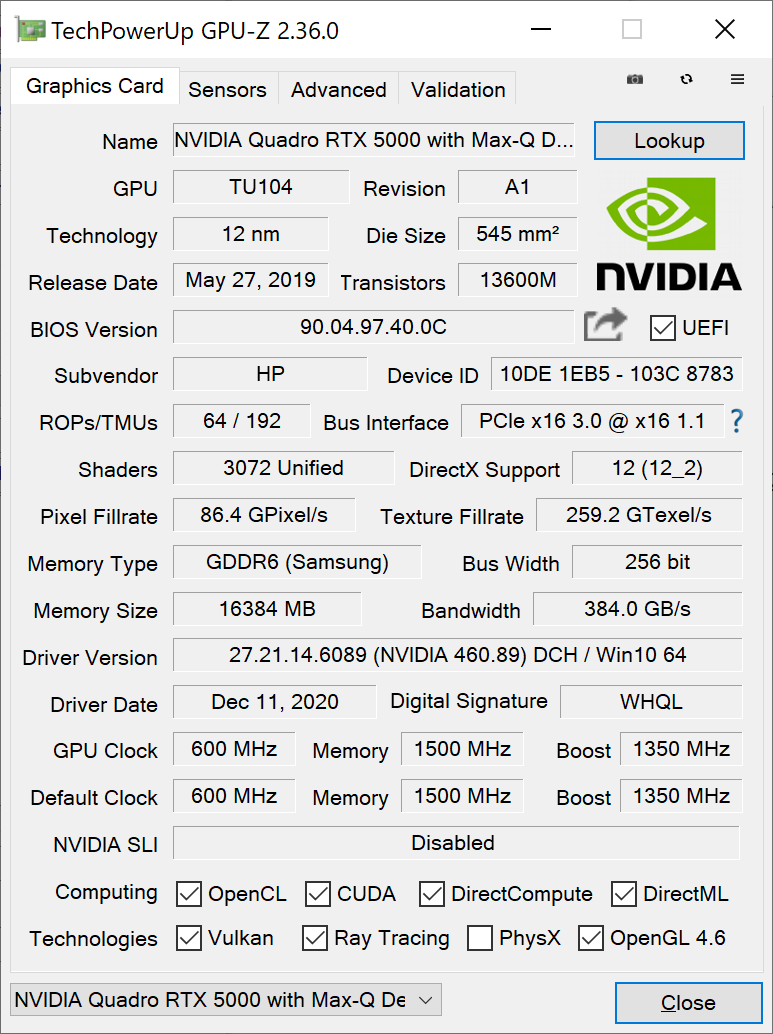
Il sistema utilizza una GPU Quadro RTX 5000 Max-Q al posto della più veloce Quadro RTX 5000 Max-P che è in grado di offrire fino al 30-35% di prestazioni in più rispetto alla nostra variante Max-Q. Gli utenti che vogliono le massime prestazioni dalla RTX 5000 dovrebbero invece prendere in considerazione la più grande Acer ConceptD 9 Pro.
Le prestazioni grafiche pure sono ancora eccellenti con risultati di benchmark appena inferiori a quelli di una Quadro RTX 4000 Max-P.
| 3DMark 11 Performance | 20890 punti | |
| 3DMark Cloud Gate Standard Score | 30434 punti | |
| 3DMark Fire Strike Score | 16005 punti | |
| 3DMark Time Spy Score | 7276 punti | |
Aiuto | ||
| basso | medio | alto | ultra | QHD | 4K | |
|---|---|---|---|---|---|---|
| The Witcher 3 (2015) | 298.9 | 235.8 | 149.8 | 79.5 | 55.4 | |
| Dota 2 Reborn (2015) | 142 | 126 | 119 | 112 | 96.7 | |
| Final Fantasy XV Benchmark (2018) | 132 | 101 | 79.4 | 58.4 | 33.9 | |
| X-Plane 11.11 (2018) | 96.1 | 86.9 | 73.4 | 60.6 |
Emissioni
Rumororosità di del sistema
Il rumore della ventola non è mai un problema quando i carichi sono bassi o medio-bassi. La prima scena del benchmark di 90 secondi di 3DMark 06, per esempio, induce un rumore della ventola di soli 31,7 dB(A) ad essere molto più silenzioso di quello che abbiamo osservato su Precision 7550 o MSI WS66. Il rumore della ventola raggiunge i 47 dB(A) quando si eseguono carichi più elevati.
Non possiamo notare alcun rumore elettronico provenire dalla nostra unità di prova.
| HP ZBook Fury 15 G7 Quadro RTX 5000 Max-Q, W-10885M, Samsung PM981a MZVLB1T0HBLR | Asus ProArt StudioBook Pro 15 W500G5T Quadro RTX 5000 Max-Q, i7-9750H, Samsung SSD PM981 MZVLB1T0HALR | MSI WS66 10TMT-207US Quadro RTX 5000 Max-Q, i9-10980HK, WDC PC SN730 SDBPNTY-1T00 | Dell Precision 7550 Quadro RTX 5000 Max-Q, W-10885M, SK Hynix PC601A NVMe 1TB | Razer Blade 15 Studio Edition 2020 Quadro RTX 5000 Max-Q, i7-10875H, Samsung PM981a MZVLB1T0HBLR | Lenovo ThinkPad P1 2019-20QT000RGE Quadro T1000 (Laptop), i7-9850H, WDC PC SN720 SDAQNTW-512G | |
|---|---|---|---|---|---|---|
| Noise | -10% | -17% | -11% | -12% | -5% | |
| off /ambiente * (dB) | 26.4 | 25.2 5% | 26 2% | 25.8 2% | 30.1 -14% | 28.8 -9% |
| Idle Minimum * (dB) | 26.4 | 27.9 -6% | 32 -21% | 25.8 2% | 30.1 -14% | 28.8 -9% |
| Idle Average * (dB) | 26.4 | 27.9 -6% | 32 -21% | 25.8 2% | 30.1 -14% | 28.8 -9% |
| Idle Maximum * (dB) | 26.4 | 27.9 -6% | 32 -21% | 25.9 2% | 30.1 -14% | 28.8 -9% |
| Load Average * (dB) | 31.7 | 47 -48% | 42 -32% | 51.2 -62% | 42.3 -33% | 36.1 -14% |
| Witcher 3 ultra * (dB) | 47 | 47.4 -1% | 51.9 -10% | 48.2 -3% | ||
| Load Maximum * (dB) | 47 | 46.9 -0% | 59.7 -27% | 51.9 -10% | 42.1 10% | 36.7 22% |
* ... Meglio usare valori piccoli
Rumorosità
| Idle |
| 26.4 / 26.4 / 26.4 dB(A) |
| Sotto carico |
| 31.7 / 47 dB(A) |
 | ||
30 dB silenzioso 40 dB(A) udibile 50 dB(A) rumoroso |
||
min: | ||
Temperatura
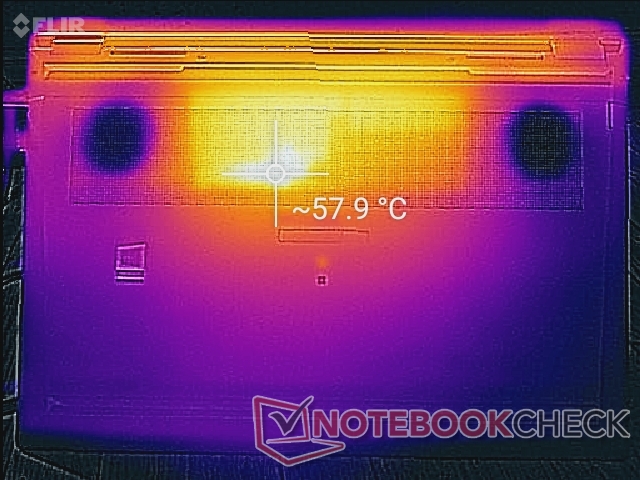
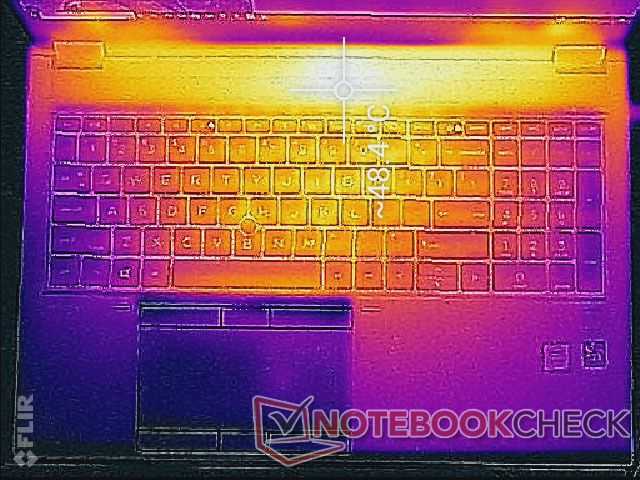
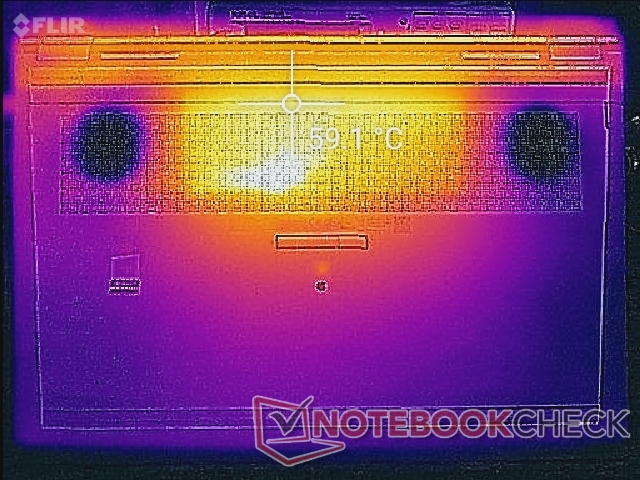
I punti caldi possono arrivare 49° C a 60° C rispettivamente sul lato superiore e inferiore del portatile. Per fortuna, queste aree sono verso la parte posteriore del laptop, dove gli utenti sono meno propensi a toccare. L'Asus ProArt StudioBook Pro 15, che viene fornito con la stessa GPU RTX 5000 Max-Q, diventa ancora più caldo fino a 66° C quando è in condizioni simili.
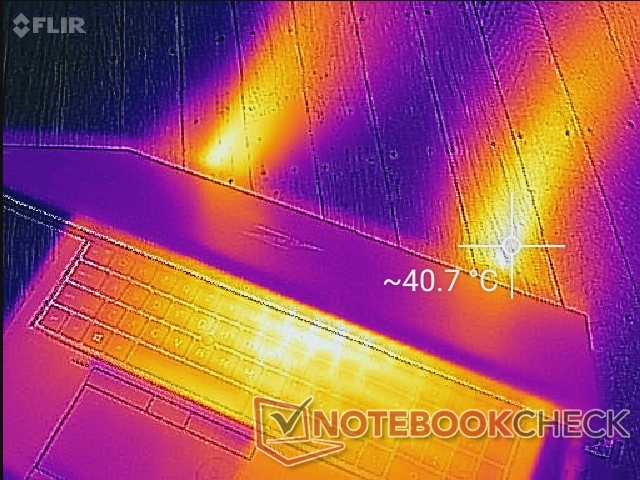
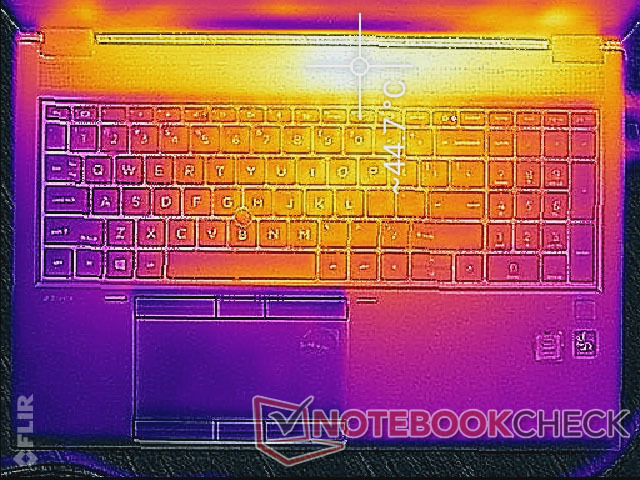
(-) La temperatura massima sul lato superiore è di 48.8 °C / 120 F, rispetto alla media di 38.2 °C / 101 F, che varia da 22.2 a 69.8 °C per questa classe Workstation.
(-) Il lato inferiore si riscalda fino ad un massimo di 62.6 °C / 145 F, rispetto alla media di 41.1 °C / 106 F
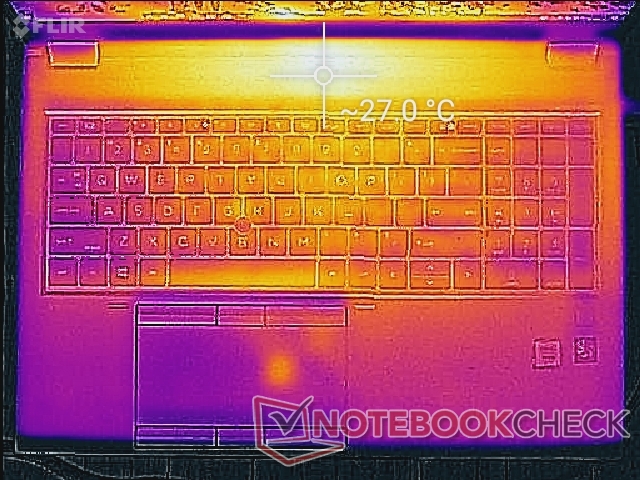
(+) In idle, la temperatura media del lato superiore è di 24.5 °C / 76 F, rispetto alla media deld ispositivo di 32 °C / 90 F.
(±) Riproducendo The Witcher 3, la temperatura media per il lato superiore e' di 33.9 °C / 93 F, rispetto alla media del dispositivo di 32 °C / 90 F.
(+) I poggiapolsi e il touchpad raggiungono la temperatura massima della pelle (33 °C / 91.4 F) e quindi non sono caldi.
(-) La temperatura media della zona del palmo della mano di dispositivi simili e'stata di 27.8 °C / 82 F (-5.2 °C / -9.4 F).

Stress Test
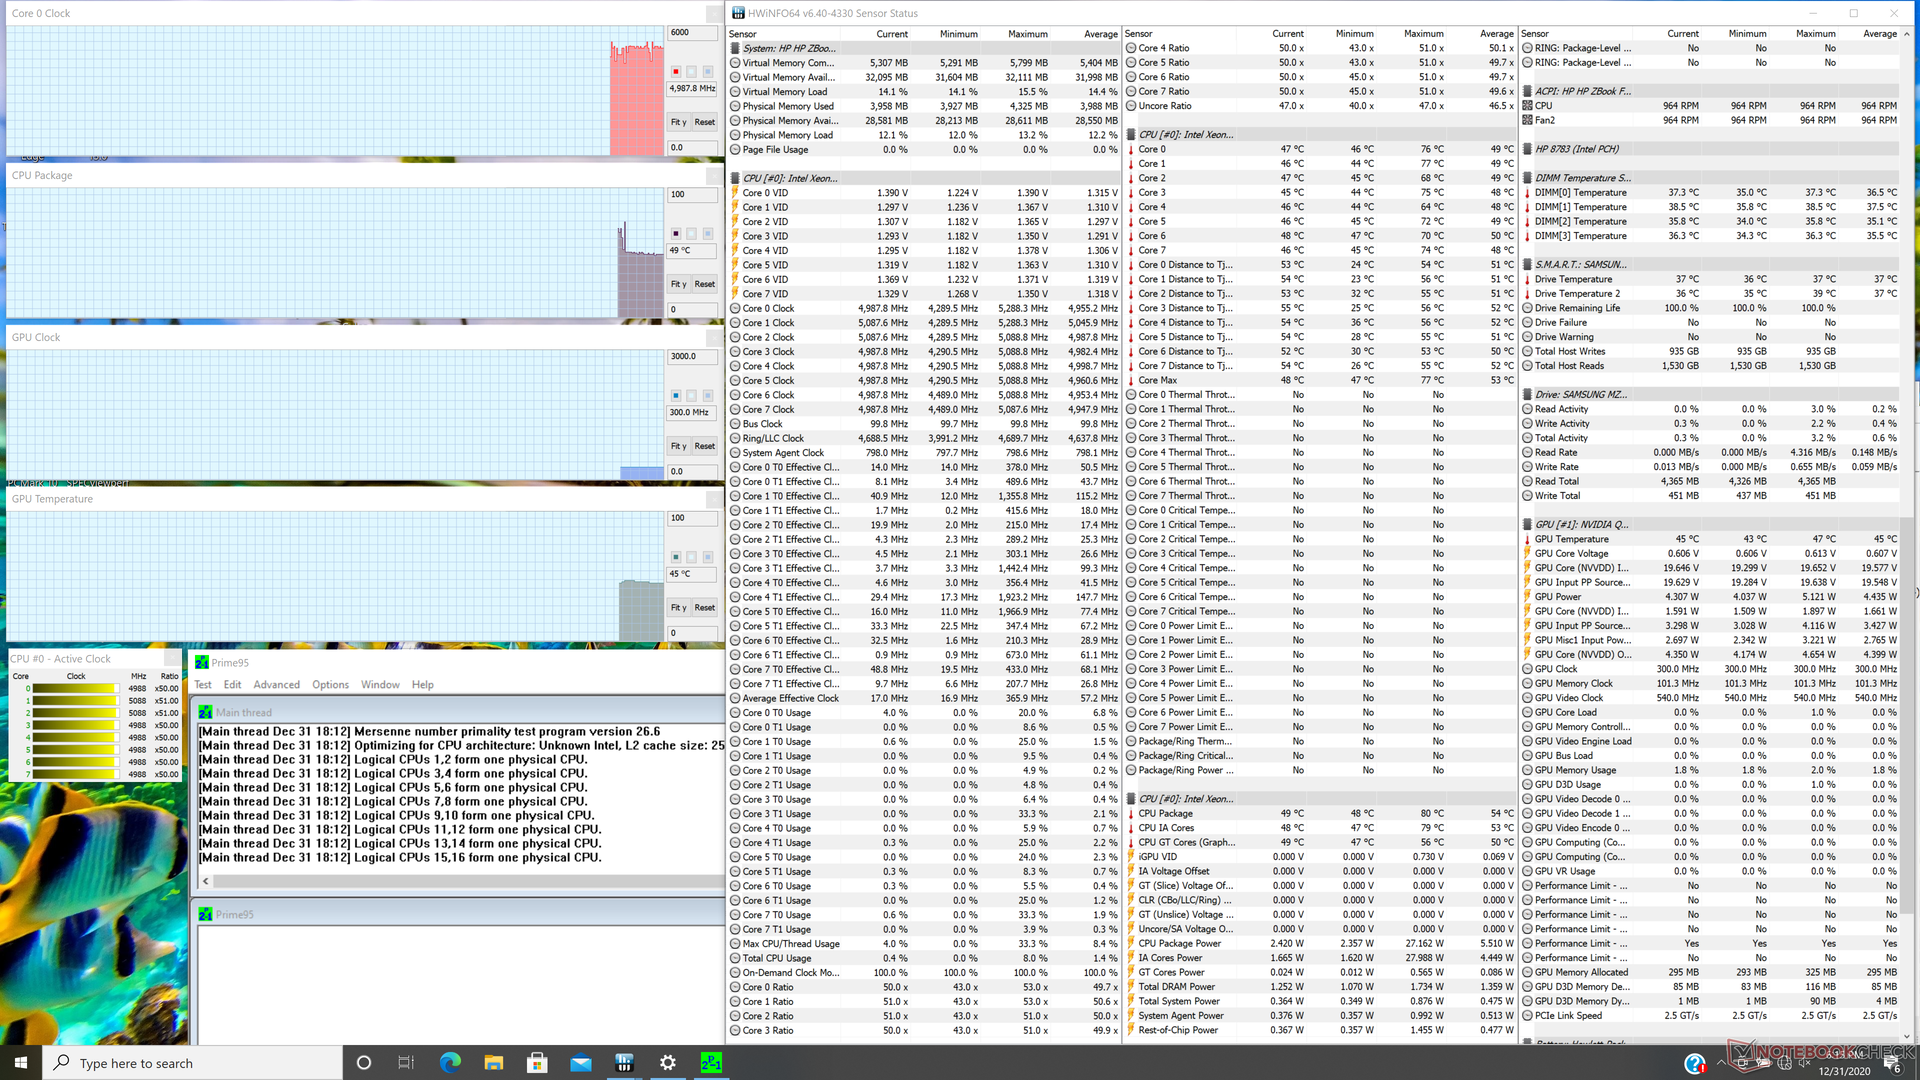
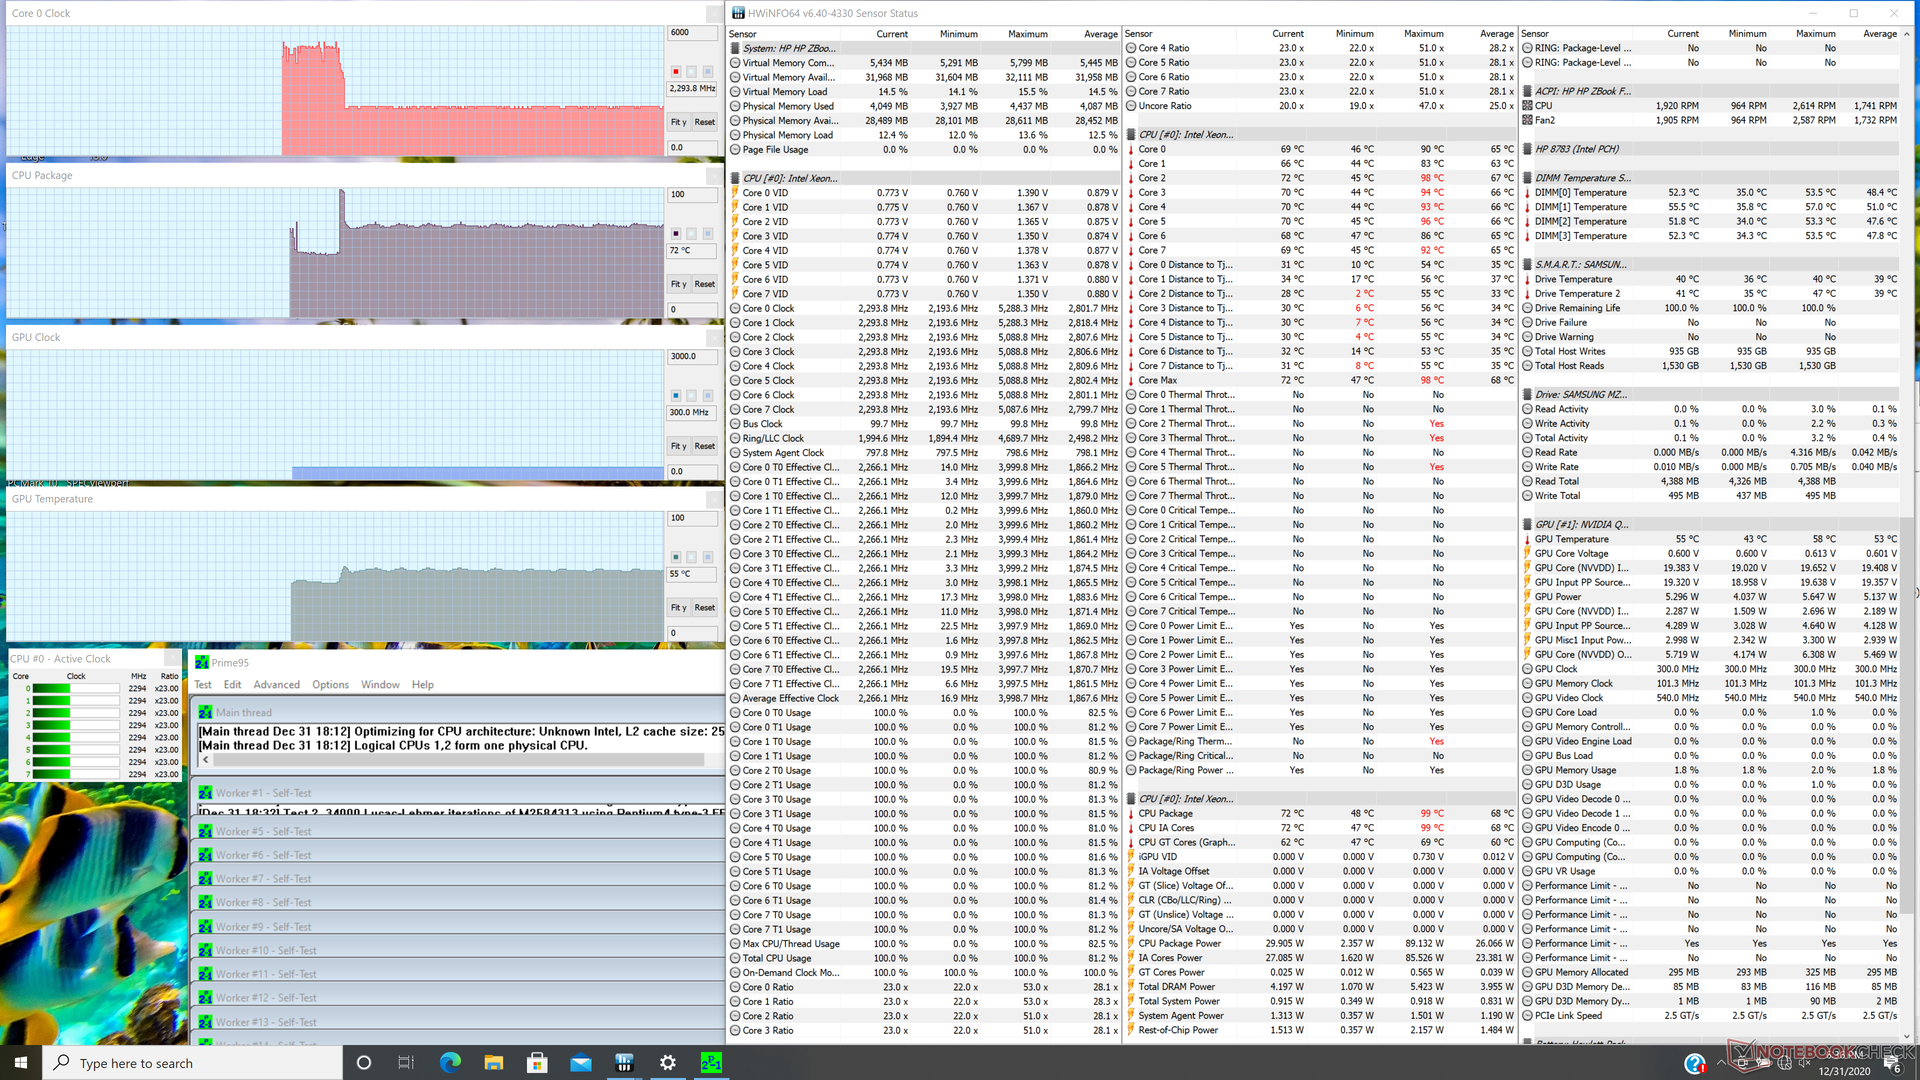
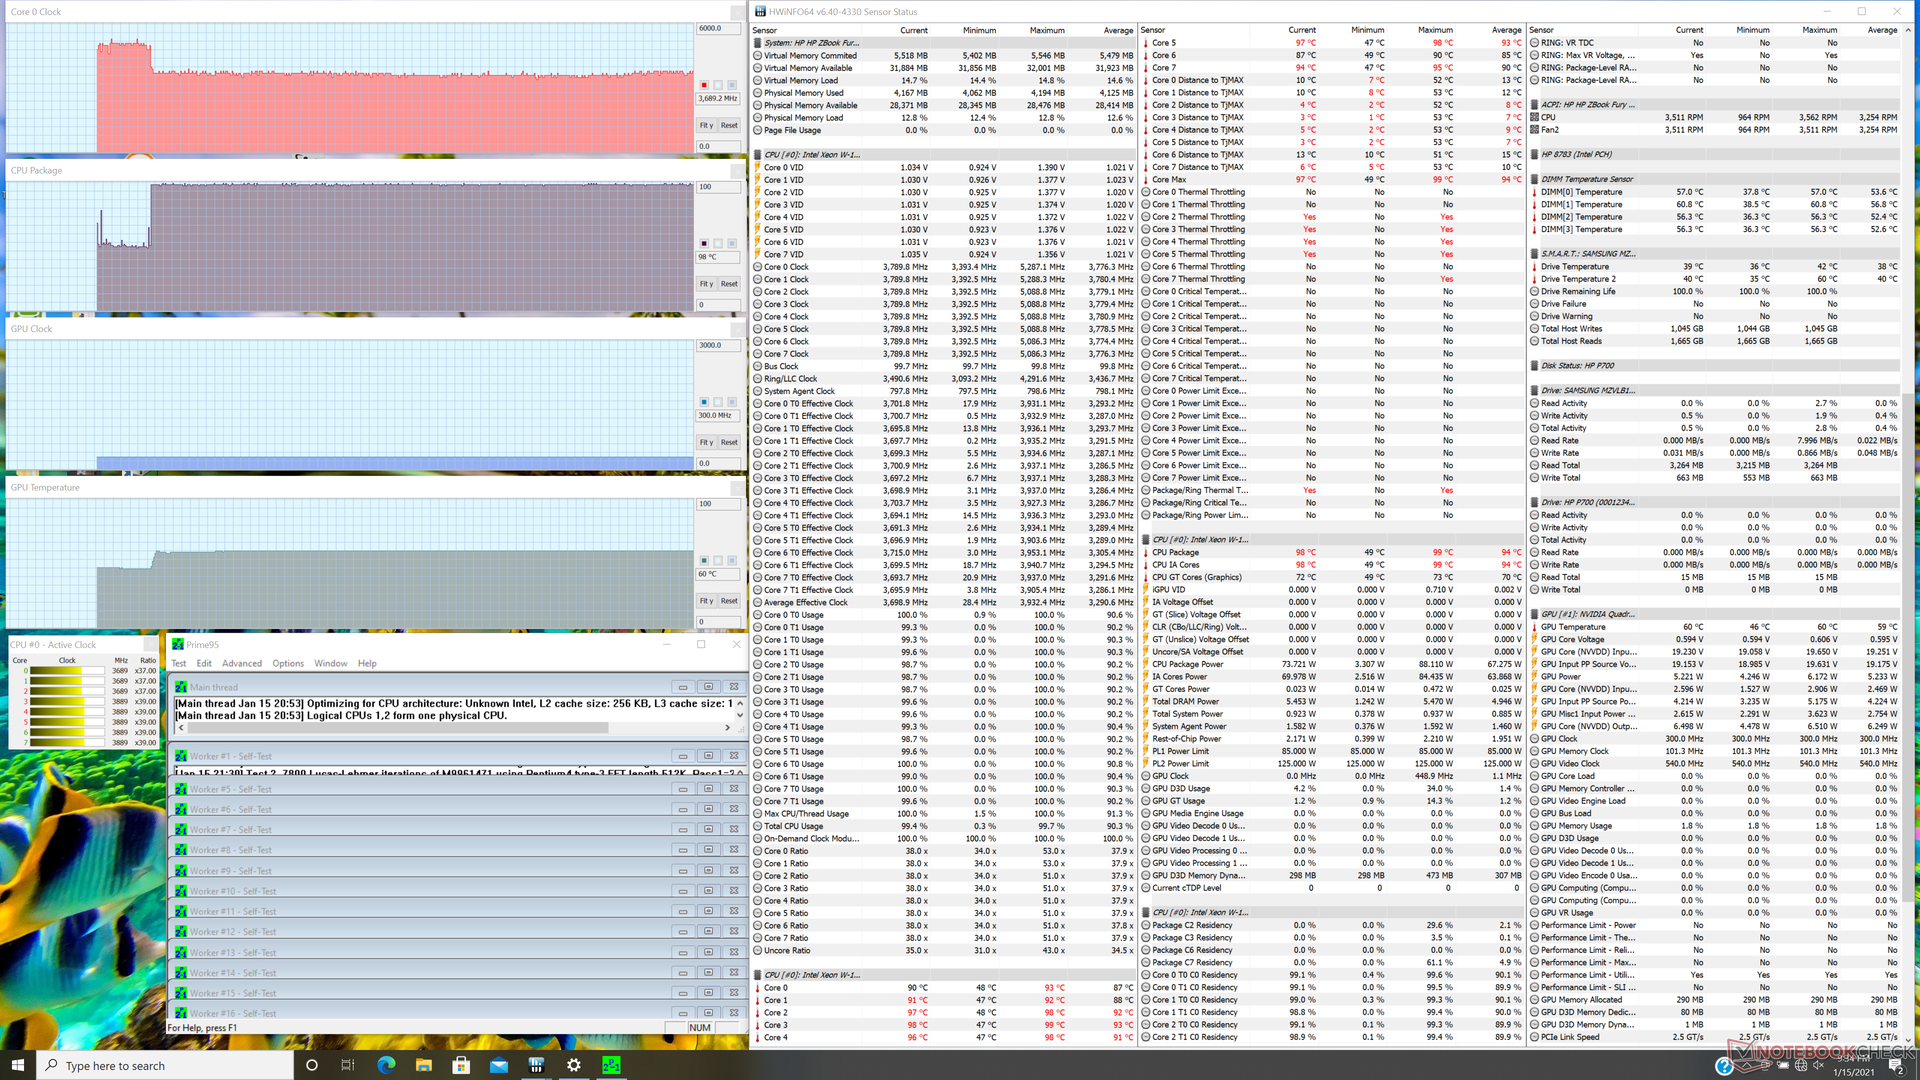
Stressiamo il sistema con carichi sintetici per identificare eventuali problemi di strozzamento o di stabilità. Quando si esegue il Prime95, la CPU accelera fino alla gamma da 3,6 a 4 GHz per pochi secondi e ad una temperatura del core di 99° C. Poi scende immediatamente ad appena 2,3 GHz per una temperatura del core molto più fredda di 72° C. Dopo l'aggiornamento del nostro BIOS, tuttavia, la CPU si stabilizza invece a circa 3,6 GHz e 98° C per prestazioni drammaticamente più veloci, anche se al costo di temperature del core molto più elevate. I risultati complessivi dopo l'aggiornamento sono simili a quelli che abbiamo osservato sul sito Precision 7550.
Il funzionamento a batteria influisce sulle prestazioni grafiche. Un Fire Strike con alimentazione a batteria porterebbe a punteggi di Physics e Graphics di 15724 e 9428 punti, rispettivamente, rispetto a 15118 e 19759 punti ottenuti con l'alimentazione da rete elettrica.
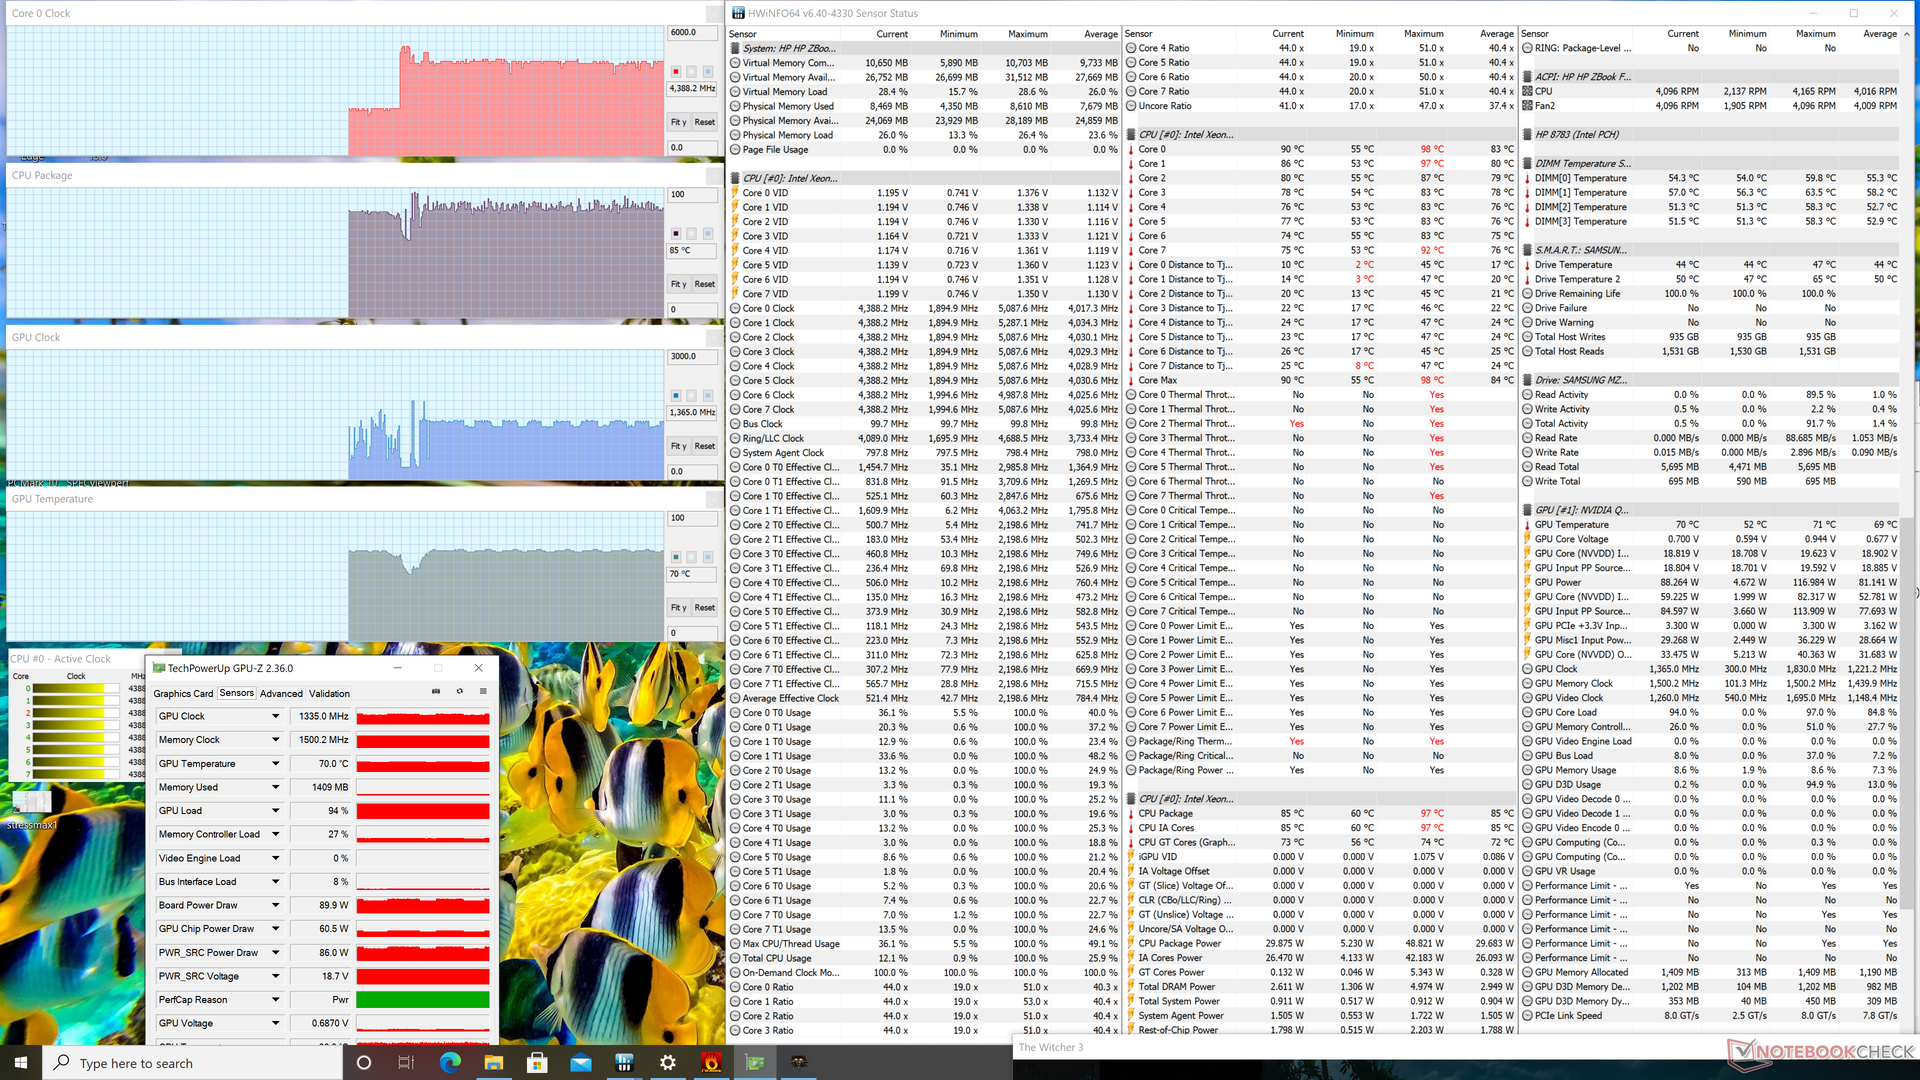
| Orologio PCU(GHz) | Orologio GPU (MHz) | Temperatura media dellaCPU (°C) | Temperatura media dellaGPU (°C) | |
| Sistema inattivo | -------- | 48 | 45 | |
| Prime95 Stress | 2,2 - 2,3 | -- | 72 | 55 |
| Prime95 Stress (BIOS 1.04.01) | 3.5 - 3.6 | -- | 98 | 60 |
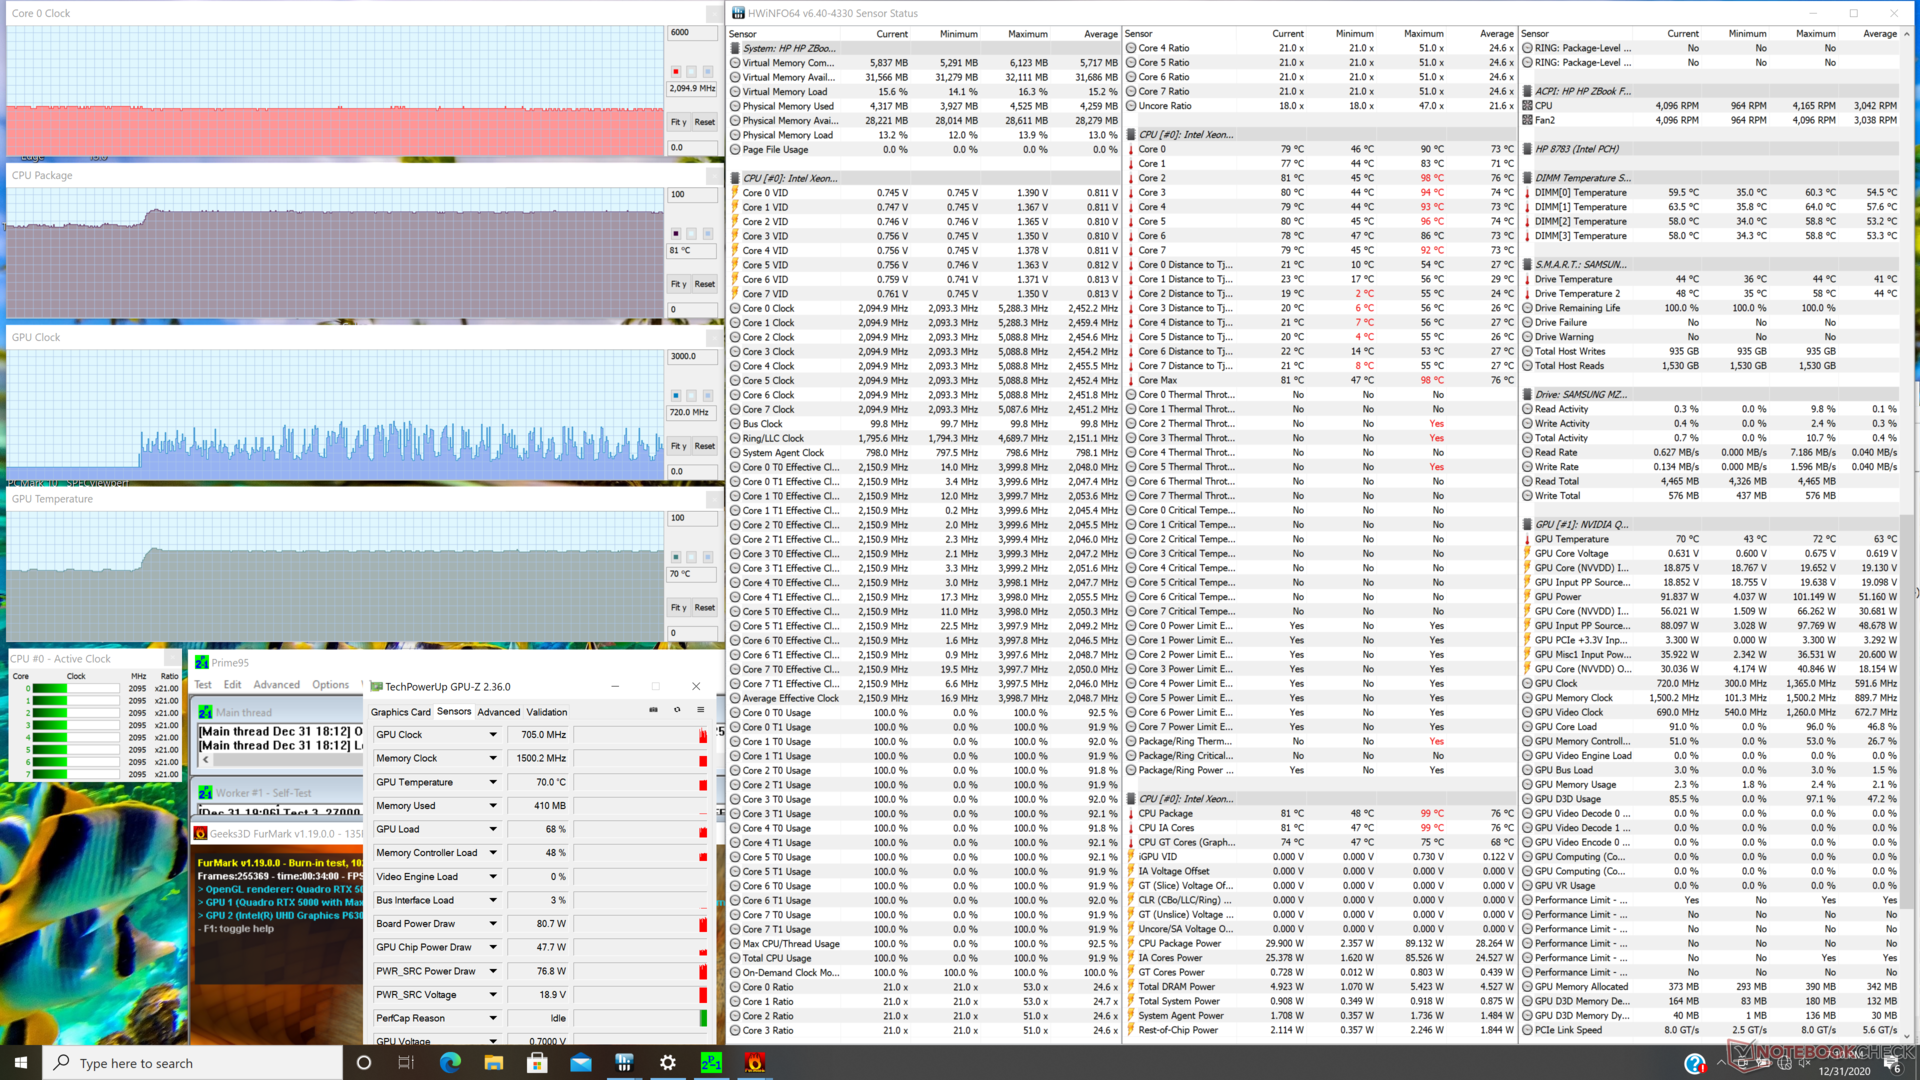
| Prime95 + FurMark Stress | 2.0 - 2.1 | ~510 - 1575 | 81 | 70 |
| Prime95 + FurMark Stress (BIOS 1.04.01) | 2.9 - 3.5 | ~510 - 1575 | 88 - 98 | 71 |
| Witcher 3 Stress | ~4.4 | 1230 - 1380 | 85 | 70 |
Altoparlanti

HP ZBook Fury 15 G7 analisi audio
(±) | potenza degli altiparlanti media ma buona (80.1 dB)
Bassi 100 - 315 Hz
(±) | bassi ridotti - in media 8% inferiori alla media
(±) | la linearità dei bassi è media (9.5% delta rispetto alla precedente frequenza)
Medi 400 - 2000 Hz
(+) | medi bilanciati - solo only 3.3% rispetto alla media
(+) | medi lineari (4.8% delta rispetto alla precedente frequenza)
Alti 2 - 16 kHz
(+) | Alti bilanciati - appena 2.2% dalla media
(+) | alti lineari (3.5% delta rispetto alla precedente frequenza)
Nel complesso 100 - 16.000 Hz
(+) | suono nel complesso lineare (10.1% differenza dalla media)
Rispetto alla stessa classe
» 6% di tutti i dispositivi testati in questa classe è stato migliore, 4% simile, 90% peggiore
» Il migliore ha avuto un delta di 7%, medio di 17%, peggiore di 35%
Rispetto a tutti i dispositivi testati
» 5% di tutti i dispositivi testati in questa classe è stato migliore, 1% similare, 94% peggiore
» Il migliore ha avuto un delta di 4%, medio di 24%, peggiore di 134%
Apple MacBook 12 (Early 2016) 1.1 GHz analisi audio
(+) | gli altoparlanti sono relativamente potenti (83.6 dB)
Bassi 100 - 315 Hz
(±) | bassi ridotti - in media 11.3% inferiori alla media
(±) | la linearità dei bassi è media (14.2% delta rispetto alla precedente frequenza)
Medi 400 - 2000 Hz
(+) | medi bilanciati - solo only 2.4% rispetto alla media
(+) | medi lineari (5.5% delta rispetto alla precedente frequenza)
Alti 2 - 16 kHz
(+) | Alti bilanciati - appena 2% dalla media
(+) | alti lineari (4.5% delta rispetto alla precedente frequenza)
Nel complesso 100 - 16.000 Hz
(+) | suono nel complesso lineare (10.2% differenza dalla media)
Rispetto alla stessa classe
» 7% di tutti i dispositivi testati in questa classe è stato migliore, 2% simile, 91% peggiore
» Il migliore ha avuto un delta di 5%, medio di 18%, peggiore di 53%
Rispetto a tutti i dispositivi testati
» 5% di tutti i dispositivi testati in questa classe è stato migliore, 1% similare, 94% peggiore
» Il migliore ha avuto un delta di 4%, medio di 24%, peggiore di 134%
Energy Management
Consumo energetico
In idle sul desktop assorbe tra 4 W e 22 W a seconda del livello di luminosità e se la GPU dedicata è attiva. La differenza tra la luminosità minima e massima è di 9 W, poiché il display è più luminoso della maggior parte degli altri portatili.
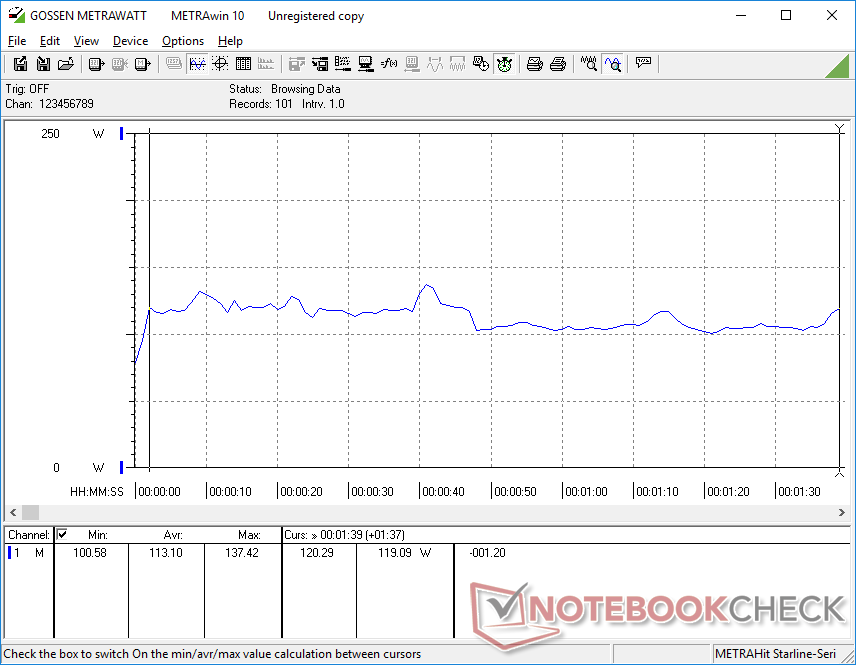
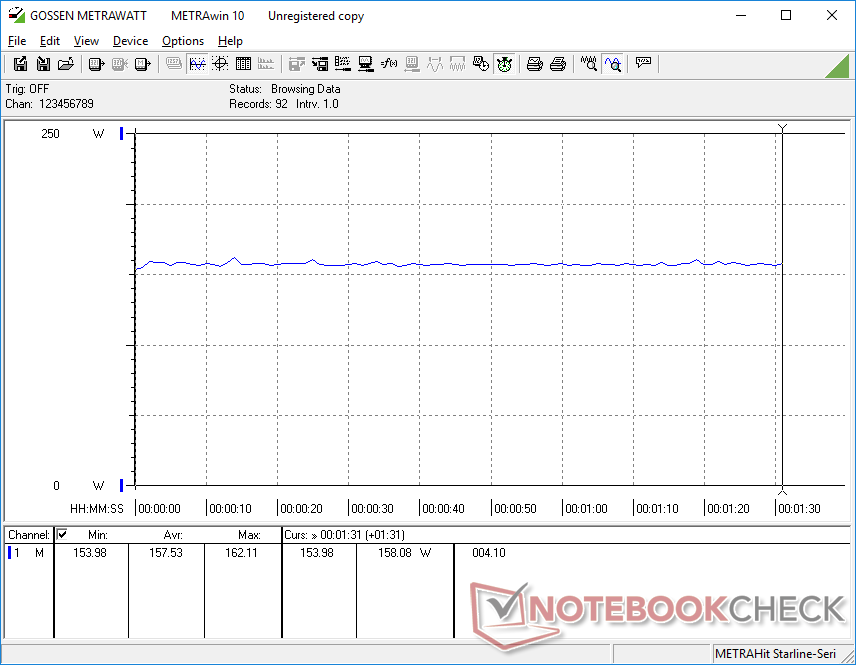
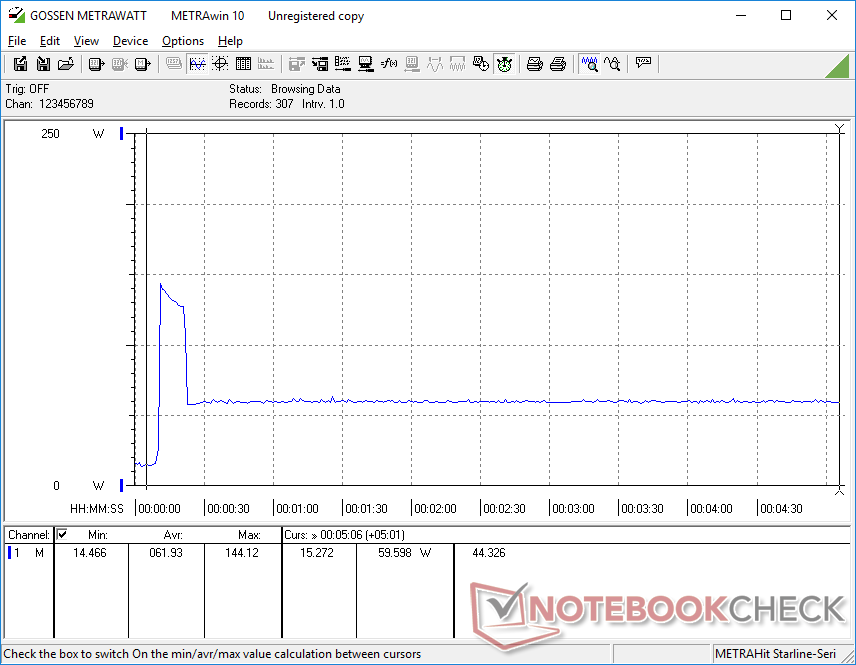
Carichi più elevati, equivalenti ai giochi, possono assorbire da 113 W a 158 W, che è quasi esattamente quello che abbiamo misurato sul sito Precision 7550 o MSI WS66, oltre a quello che abbiamo misurato sul sito MSI WS66, ognuno dotato della stessa CPU e della stessa GPU. Tuttavia, una differenza importante può essere notata quando si esegue Prime95. Il consumo di energia si stabilizza a soli 59,6 W sul nostro HP rispetto ai 135,3 W sul nostro Dell. Questo spiegherebbe anche il notevole deficit di prestazioni del nostro HP durante le sezioni di loop test CineBench e Stress Test di cui sopra.
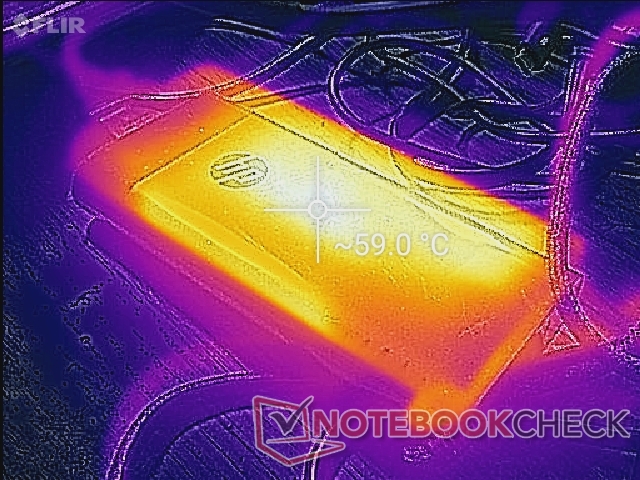
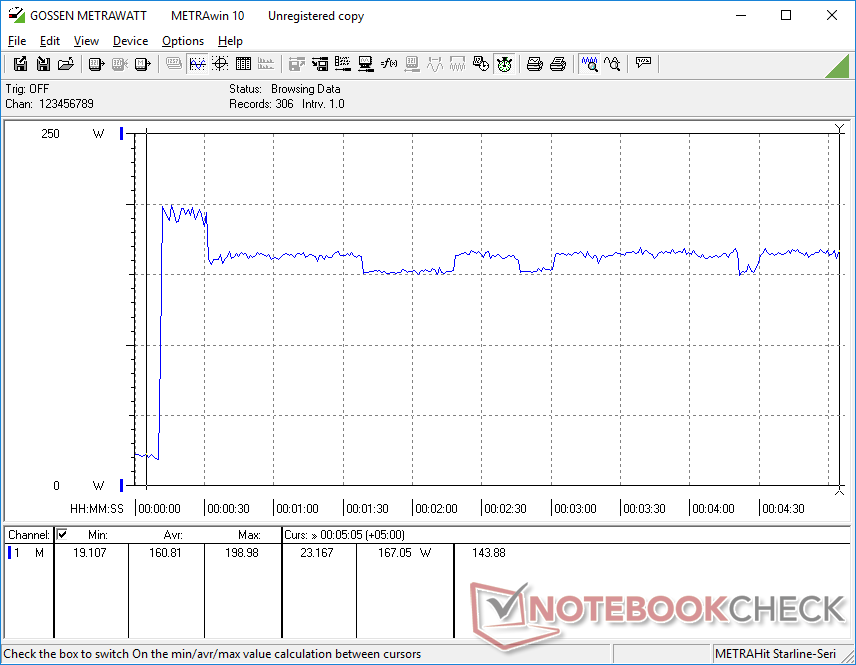
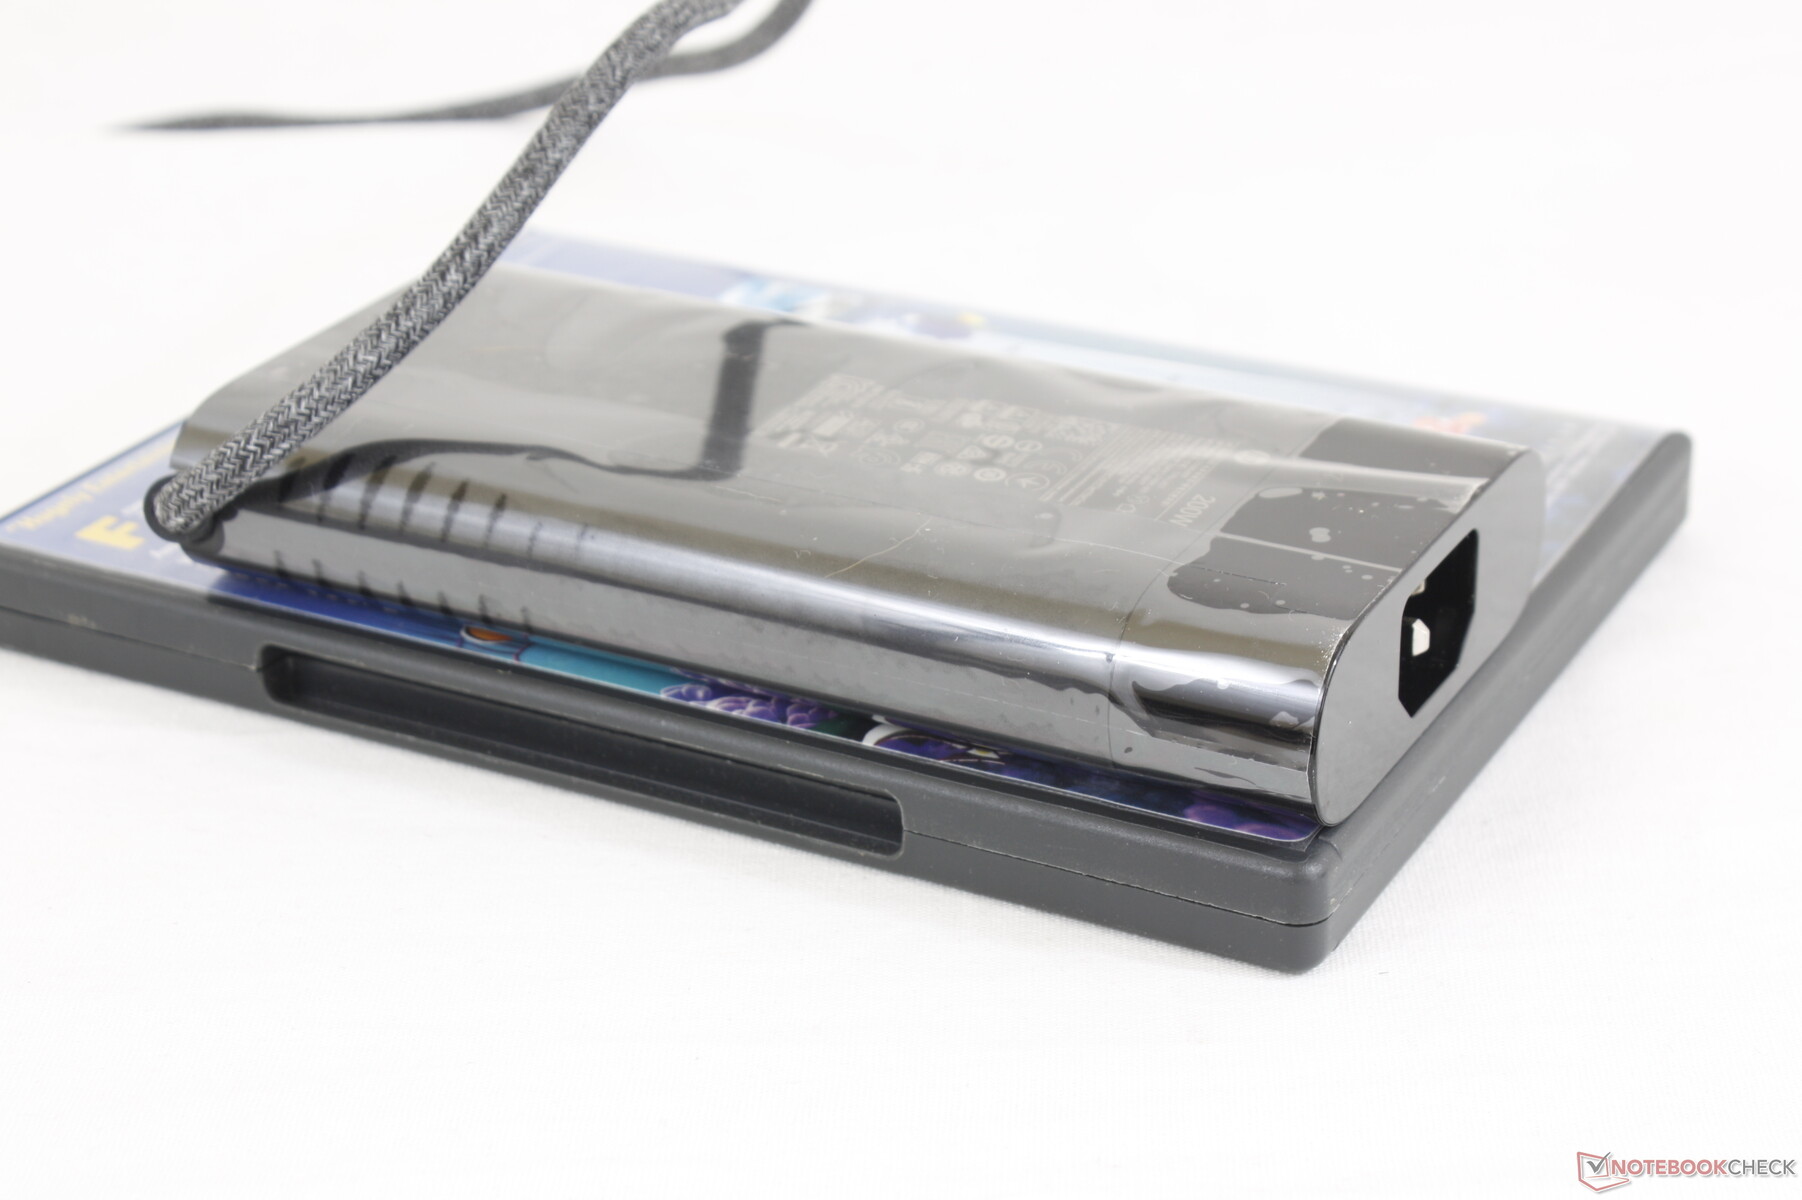
Siamo in grado di registrare un assorbimento massimo di 199 W dall'almentatore da 200 W di medie dimensioni (~15 x 7,2 x 2,4 cm). Questo valore è solo temporaneo, come mostrano i nostri grafici qui sotto, probabilmente per motivi termici. L'esecuzione di carichi estremi rallenta il valore di carica, ma non scarica la batteria, a differenza di alcuni dei primi modelli Dell Precision .
| Off / Standby | |
| Idle | |
| Sotto carico |
|
Leggenda:
min: | |
| HP ZBook Fury 15 G7 W-10885M, Quadro RTX 5000 Max-Q, Samsung PM981a MZVLB1T0HBLR, IPS, 3840x2160, 15.6" | Asus ProArt StudioBook Pro 15 W500G5T i7-9750H, Quadro RTX 5000 Max-Q, Samsung SSD PM981 MZVLB1T0HALR, IPS, 3840x2160, 15.6" | MSI WS66 10TMT-207US i9-10980HK, Quadro RTX 5000 Max-Q, WDC PC SN730 SDBPNTY-1T00, IPS, 1920x1080, 15.6" | Dell Precision 7550 W-10885M, Quadro RTX 5000 Max-Q, SK Hynix PC601A NVMe 1TB, IPS, 3840x2160, 15.6" | Razer Blade 15 Studio Edition 2020 i7-10875H, Quadro RTX 5000 Max-Q, Samsung PM981a MZVLB1T0HBLR, OLED, 3840x2160, 15.6" | Lenovo ThinkPad P1 2019-20QT000RGE i7-9850H, Quadro T1000 (Laptop), WDC PC SN720 SDAQNTW-512G, IPS LED, 1920x1080, 15.6" | |
|---|---|---|---|---|---|---|
| Power Consumption | -33% | -56% | -22% | -37% | -31% | |
| Idle Minimum * (Watt) | 4.6 | 11.6 -152% | 13.8 -200% | 8.2 -78% | 13.4 -191% | 13.7 -198% |
| Idle Average * (Watt) | 13.6 | 19 -40% | 18.4 -35% | 16.8 -24% | 18 -32% | 17.5 -29% |
| Idle Maximum * (Watt) | 21.5 | 20.6 4% | 41.5 -93% | 24.4 -13% | 26.1 -21% | 20.9 3% |
| Load Average * (Watt) | 113.1 | 102 10% | 110.5 2% | 131 -16% | 115 -2% | 77.2 32% |
| Witcher 3 ultra * (Watt) | 157.5 | 151.6 4% | 156.6 1% | 145 8% | ||
| Load Maximum * (Watt) | 199 | 178 11% | 227.1 -14% | 201.8 -1% | 165 17% | 123.7 38% |
* ... Meglio usare valori piccoli
Durata della batteria
Aspettatevi 8,5 ore di utilizzo della WLAN nel mondo reale. Anche la ricarica da vuoto a pieno è veloce nonostante la grande capacità della batteria da 94 Wh. Il sistema può essere caricato tramite USB-C, anche se ad un ritmo più lento.
| HP ZBook Fury 15 G7 W-10885M, Quadro RTX 5000 Max-Q, 94 Wh | Asus ProArt StudioBook Pro 15 W500G5T i7-9750H, Quadro RTX 5000 Max-Q, 76 Wh | MSI WS66 10TMT-207US i9-10980HK, Quadro RTX 5000 Max-Q, 99.99 Wh | Dell Precision 7550 W-10885M, Quadro RTX 5000 Max-Q, 95 Wh | Razer Blade 15 Studio Edition 2020 i7-10875H, Quadro RTX 5000 Max-Q, 80 Wh | Lenovo ThinkPad P1 2019-20QT000RGE i7-9850H, Quadro T1000 (Laptop), 80 Wh | |
|---|---|---|---|---|---|---|
| Autonomia della batteria | -45% | -18% | -12% | -4% | 2% | |
| Reader / Idle (h) | 13.2 | 8.3 -37% | 11.1 -16% | 8.8 -33% | ||
| WiFi v1.3 (h) | 8.6 | 4.7 -45% | 7.8 -9% | 8.9 3% | 5.7 -34% | 8.9 3% |
| Load (h) | 1.3 | 1.2 -8% | 1 -23% | 2 54% | 1.3 0% |
Pro
Contro
Valutazione complessiva
L'aspetto più notevole dello ZBook Fury 15 è la sua capacità di offrire essenzialmente tutte le caratteristiche e le opzioni di prestazioni del Dell Precision 7550, ma in un pacchetto notevolmente più leggero. Questo rende l'HP una buona soluzione di middle-ground per gli utenti che vogliono una workstation mobile senza sacrificare molte delle caratteristiche ausiliarie che modelli più sottili e leggeri come il Razer Blade Studio, MSI WS66, o Asus ProArt spesso omettono. È anche una delle pochissime workstation ad includere opzioni a pannello da 1000 nits per gli scenari occasionali all'aperto.
Espandibile e confortevole con numerose opzioni di configurazione tra cui scegliere. Lo ZBook Fury 15 riesce a contenere molte caratteristiche classiche delle workstation, nonostante il suo peso moderato.
L'esperienza di digitazione e di trackpad merita un elogio per essere una delle più confortevoli che abbiamo sperimentato su una workstation mobile. È fantastico che HP non abbia trovato la necessità di "ammutolire" la tastiera o il touchpad per adattarsi alle attuali tendenze dei portatili ultrasottili o ai design minimalisti. Questo è un sistema progettato da zero per i professionisti e non un semplice portatile gaming ricolorato.
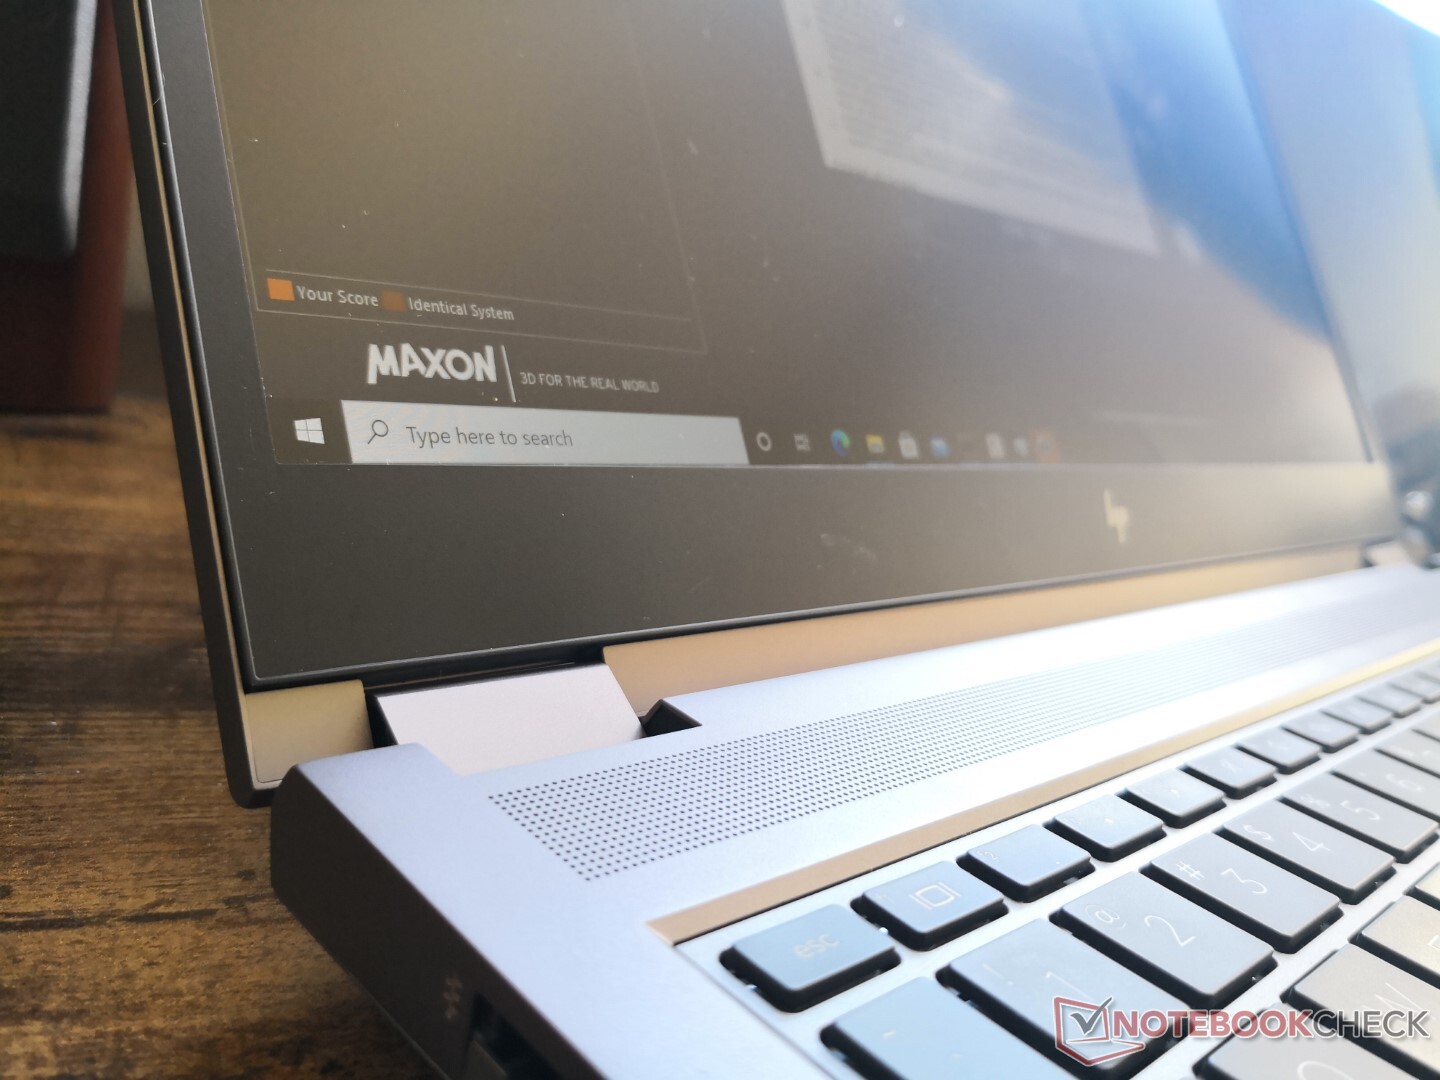
Chi desidera potenza non apprezzerà il fatto che il processore si stabilizzi a 98° C quando è a pieno carico e che la GPU Quadro RTX 5000 sia della varietà Max-Q. La WAN e alcune opzioni di memorizzazione possono essere escluse a seconda della versione, il che significa che non si può semplicemente acquistare una configurazione più economica e poi aggiornare alcuni componenti da soli perché i connettori mancheranno. Cerniere più solide per ridurre al minimo l'oscillazione del display durante la regolazione degli angoli farebbero apparire il telaio ancora migliore.
Prezzo e disponibilità
Lo ZBook Fury 15 è disponibile in una moltitudine di configurazioni che sono tutte molto diverse da quelle che abbiamo recensito. Sia Amazon che Walmart hanno uno SKU di fascia bassa per circa $1999 USD al momento o per iscritto.
Notebookcheck può ricevere una commissione dagli acquisti effettuati attraverso i nostri link di affiliazione
HP ZBook Fury 15 G7
- 01/16/2021 v7 (old)
Allen Ngo
Price comparison
