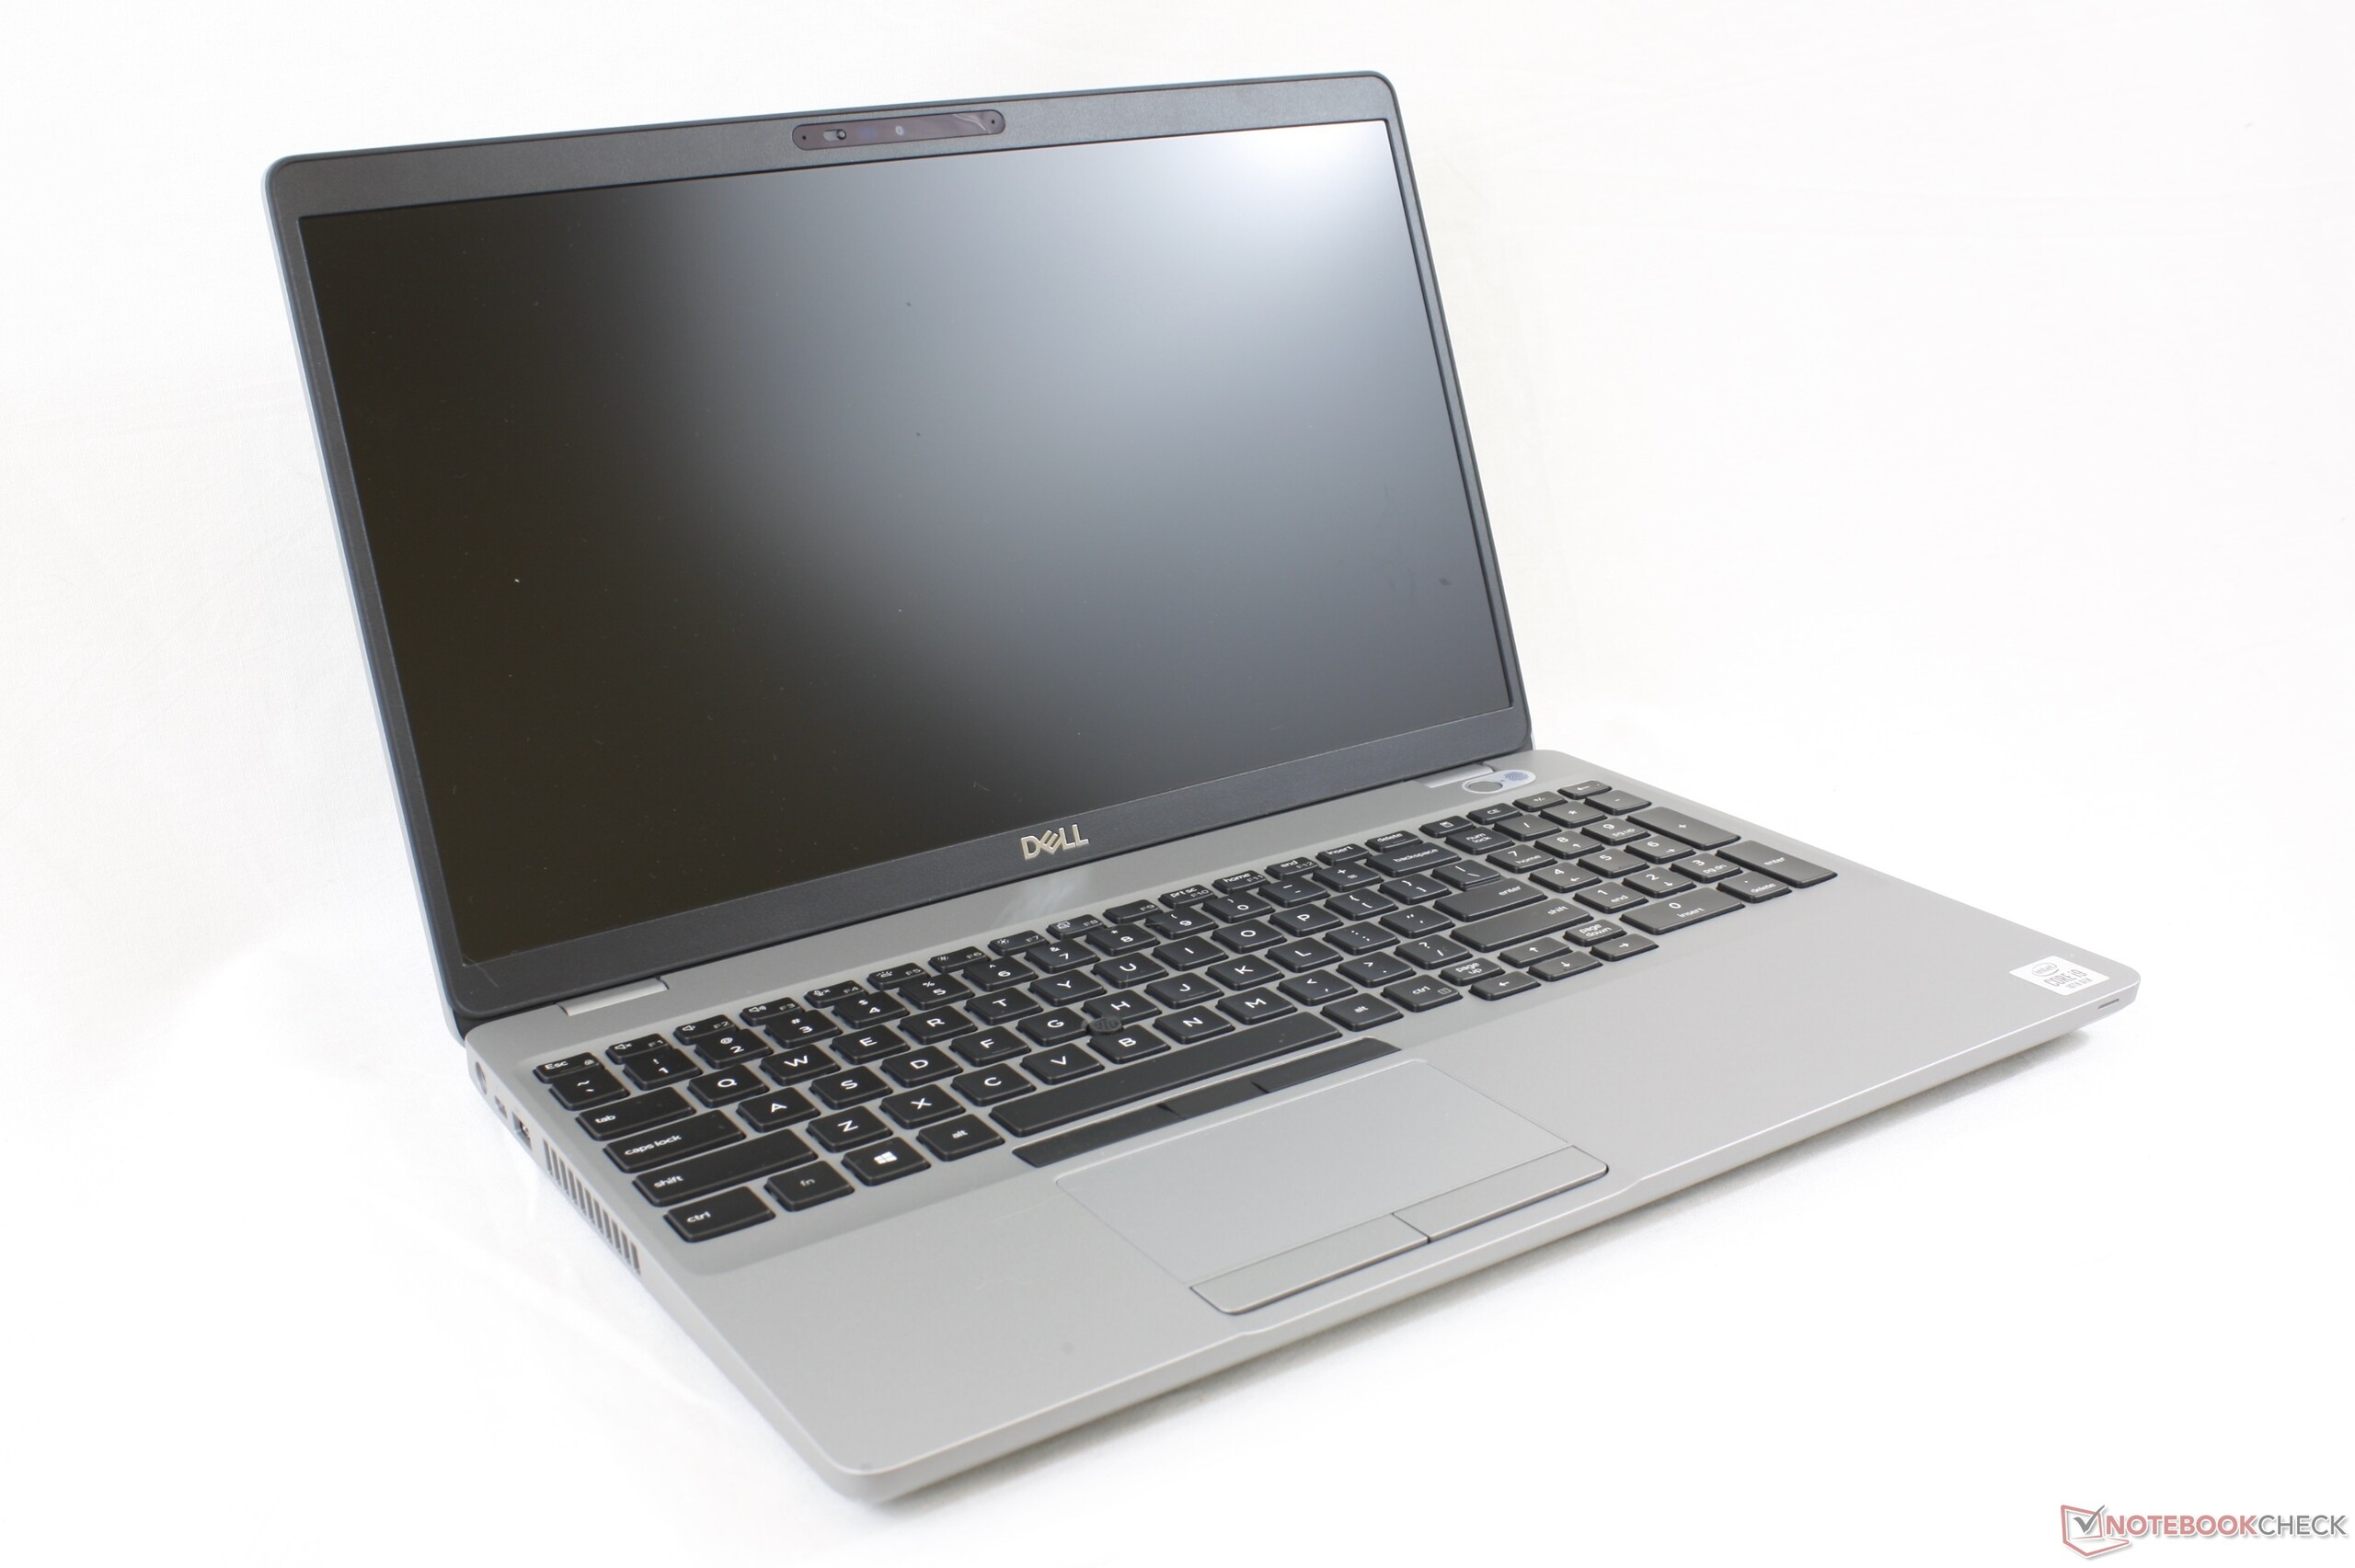
Recensione del Laptop Dell Precision 3551: il debutto dell'Intel Core i9-10885H
Punteggio | Data | Modello | Peso | Altezza | Dimensione | Risoluzione | Prezzo |
|---|---|---|---|---|---|---|---|
| 81.2 % v7 (old) | 10/2020 | Dell Precision 3000 3551 i9-10885H, Quadro P620 | 2.2 kg | 24.92 mm | 15.60" | 1920x1080 | |
| 82.7 % v7 (old) | 10/2020 | HP ZBook Firefly 15 G7 i7-10610U, Quadro P520 | 1.8 kg | 19.2 mm | 15.60" | 3840x2160 | |
| 86.3 % v7 (old) | 08/2020 | Dell Precision 5550 P91F i7-10875H, Quadro T2000 Max-Q | 2 kg | 18 mm | 15.60" | 3840x2400 | |
| 81.2 % v7 (old) | 11/2019 | Lenovo ThinkPad P53s-20N6001NGE i7-8565U, Quadro P520 | 1.9 kg | 19.95 mm | 15.60" | 1920x1080 | |
| 76 % v7 (old) | 10/2019 | MSI WP65 i7-9750H, Quadro P620 | 1.9 kg | 21.7 mm | 15.60" | 1920x1080 | |
| 84.3 % v6 (old) | 08/2018 | Dell Precision 3530 E-2176M, Quadro P600 | 2.3 kg | 24.3 mm | 15.60" | 1920x1080 |
| SD Card Reader | |
| average JPG Copy Test (av. of 3 runs) | |
| Dell Precision 5550 P91F (Toshiba Exceria Pro SDXC 64 GB UHS-II) | |
| Dell Precision 3530 (Toshiba Exceria Pro SDXC 64 GB UHS-II) | |
| Dell Precision 3000 3551 (Toshiba Exceria Pro M501 64 GB UHS-II) | |
| Lenovo ThinkPad P53s-20N6001NGE (Toshiba Exceria Pro M501 64 GB UHS-II) | |
| maximum AS SSD Seq Read Test (1GB) | |
| Dell Precision 3530 (Toshiba Exceria Pro SDXC 64 GB UHS-II) | |
| Dell Precision 5550 P91F (Toshiba Exceria Pro SDXC 64 GB UHS-II) | |
| Dell Precision 3000 3551 (Toshiba Exceria Pro M501 64 GB UHS-II) | |
| Lenovo ThinkPad P53s-20N6001NGE (Toshiba Exceria Pro M501 64 GB UHS-II) | |


| |||||||||||||||||||||||||
Distribuzione della luminosità: 89 %
Al centro con la batteria: 235.5 cd/m²
Contrasto: 942:1 (Nero: 0.25 cd/m²)
ΔE ColorChecker Calman: 5.44 | ∀{0.5-29.43 Ø4.72}
calibrated: 5.2
ΔE Greyscale Calman: 3.1 | ∀{0.09-98 Ø4.97}
56.1% sRGB (Argyll 1.6.3 3D)
35.5% AdobeRGB 1998 (Argyll 1.6.3 3D)
38.74% AdobeRGB 1998 (Argyll 3D)
56.5% sRGB (Argyll 3D)
37.5% Display P3 (Argyll 3D)
Gamma: 2.42
CCT: 7070 K
| Dell Precision 3000 3551 LG Philips 156WFD, IPS, 15.6", 1920x1080 | HP ZBook Firefly 15 G7 LGD064F, IPS LED, 15.6", 3840x2160 | Dell Precision 5550 P91F Sharp LQ156R1, IPS, 15.6", 3840x2400 | Lenovo ThinkPad P53s-20N6001NGE Lenovo LEN40BA, IPS, 15.6", 1920x1080 | MSI WP65 AU Optronics B156HAN02.1, IPS, 15.6", 1920x1080 | Dell Precision 3530 BOE BOE06F1, IPS, 15.6", 1920x1080 | |
|---|---|---|---|---|---|---|
| Display | 79% | 125% | 5% | 5% | 80% | |
| Display P3 Coverage (%) | 37.5 | 68.8 83% | 89.9 140% | 39.58 6% | 39.46 5% | 72.8 94% |
| sRGB Coverage (%) | 56.5 | 97.7 73% | 100 77% | 57.6 2% | 58.8 4% | 94.6 67% |
| AdobeRGB 1998 Coverage (%) | 38.74 | 69.8 80% | 99.9 158% | 40.89 6% | 40.69 5% | 69.3 79% |
| Response Times | -33% | -42% | -50% | -16% | -34% | |
| Response Time Grey 50% / Grey 80% * (ms) | 29.6 ? | 44 ? -49% | 46 ? -55% | 51.2 ? -73% | 37.6 ? -27% | 40.4 ? -36% |
| Response Time Black / White * (ms) | 26.4 ? | 30.8 ? -17% | 34 ? -29% | 33.6 ? -27% | 27.6 ? -5% | 34.8 ? -32% |
| PWM Frequency (Hz) | 1053 ? | |||||
| Screen | 51% | 33% | 4% | -2% | 10% | |
| Brightness middle (cd/m²) | 235.5 | 381 62% | 469.8 99% | 260 10% | 267.4 14% | 285.7 21% |
| Brightness (cd/m²) | 228 | 382 68% | 464 104% | 243 7% | 259 14% | 275 21% |
| Brightness Distribution (%) | 89 | 92 3% | 85 -4% | 88 -1% | 86 -3% | 85 -4% |
| Black Level * (cd/m²) | 0.25 | 0.21 16% | 0.42 -68% | 0.18 28% | 0.37 -48% | 0.31 -24% |
| Contrast (:1) | 942 | 1814 93% | 1119 19% | 1444 53% | 723 -23% | 922 -2% |
| Colorchecker dE 2000 * | 5.44 | 3 45% | 5.16 5% | 6 -10% | 4.21 23% | 5.84 -7% |
| Colorchecker dE 2000 max. * | 13.58 | 5.2 62% | 9.33 31% | 19.2 -41% | 21.1 -55% | 8.76 35% |
| Colorchecker dE 2000 calibrated * | 5.2 | 1.5 71% | 3.75 28% | 4.3 17% | 4.27 18% | 3.14 40% |
| Greyscale dE 2000 * | 3.1 | 3.5 -13% | 5.5 -77% | 4.2 -35% | 2.3 26% | 6.5 -110% |
| Gamma | 2.42 91% | 2.26 97% | 2 110% | 2.49 88% | 2.2 100% | 2.383 92% |
| CCT | 7070 92% | 7254 90% | 6198 105% | 6865 95% | 6578 99% | 7176 91% |
| Color Space (Percent of AdobeRGB 1998) (%) | 35.5 | 64.3 81% | 89.2 151% | 37.6 6% | 37.2 5% | 62 75% |
| Color Space (Percent of sRGB) (%) | 56.1 | 97.5 74% | 100 78% | 59.2 6% | 58.5 4% | 94 68% |
| Media totale (Programma / Settaggio) | 32% /
46% | 39% /
41% | -14% /
-3% | -4% /
-3% | 19% /
18% |
* ... Meglio usare valori piccoli
Tempi di risposta del Display
| ↔ Tempi di risposta dal Nero al Bianco | ||
|---|---|---|
| 26.4 ms ... aumenta ↗ e diminuisce ↘ combinato | ↗ 14 ms Incremento | 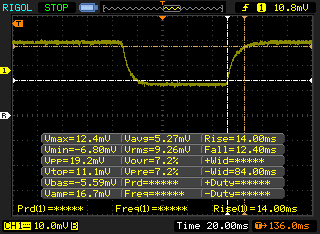 |
| ↘ 12.4 ms Calo | ||
| Lo schermo mostra tempi di risposta relativamente lenti nei nostri tests e potrebbe essere troppo lento per i gamers. In confronto, tutti i dispositivi di test variano da 0.1 (minimo) a 240 (massimo) ms. » 66 % di tutti i dispositivi è migliore. Questo significa che i tempi di risposta rilevati sono peggiori rispetto alla media di tutti i dispositivi testati (19.9 ms). | ||
| ↔ Tempo di risposta dal 50% Grigio all'80% Grigio | ||
| 29.6 ms ... aumenta ↗ e diminuisce ↘ combinato | ↗ 16.4 ms Incremento | 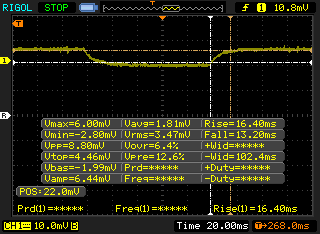 |
| ↘ 13.2 ms Calo | ||
| Lo schermo mostra tempi di risposta relativamente lenti nei nostri tests e potrebbe essere troppo lento per i gamers. In confronto, tutti i dispositivi di test variano da 0.165 (minimo) a 636 (massimo) ms. » 40 % di tutti i dispositivi è migliore. Questo significa che i tempi di risposta rilevati sono simili alla media di tutti i dispositivi testati (31.1 ms). | ||
Sfarfallio dello schermo / PWM (Pulse-Width Modulation)
| flickering dello schermo / PWM non rilevato |  | ||
In confronto: 52 % di tutti i dispositivi testati non utilizza PWM per ridurre la luminosita' del display. Se è rilevato PWM, una media di 7784 (minimo: 5 - massimo: 343500) Hz è stata rilevata. | |||
Cinebench R15: CPU Multi 64Bit | CPU Single 64Bit
Blender: v2.79 BMW27 CPU
7-Zip 18.03: 7z b 4 -mmt1 | 7z b 4
Geekbench 5.5: Single-Core | Multi-Core
HWBOT x265 Benchmark v2.2: 4k Preset
LibreOffice : 20 Documents To PDF
R Benchmark 2.5: Overall mean
| Cinebench R20 / CPU (Multi Core) | |
| MSI WS66 10TMT-207US | |
| Dell Precision 7550 | |
| Dell Precision 5550 P91F | |
| Media Intel Core i9-10885H (2798 - 3762, n=3) | |
| Dell Precision 3000 3551 | |
| Acer ConceptD 3 Pro CN315-71P-73W1 | |
| Lenovo ThinkPad P1 2019-20QT000RGE | |
| HP ZBook Firefly 15 G7 | |
| Acer TravelMate P215-52 | |
| Cinebench R20 / CPU (Single Core) | |
| MSI WS66 10TMT-207US | |
| Dell Precision 5550 P91F | |
| Dell Precision 7550 | |
| Media Intel Core i9-10885H (460 - 513, n=3) | |
| HP ZBook Firefly 15 G7 | |
| Dell Precision 3000 3551 | |
| Acer ConceptD 3 Pro CN315-71P-73W1 | |
| Lenovo ThinkPad P1 2019-20QT000RGE | |
| Acer TravelMate P215-52 | |
| Geekbench 5.5 / Single-Core | |
| MSI WS66 10TMT-207US | |
| Dell Precision 7550 | |
| Dell Precision 5550 P91F | |
| Media Intel Core i9-10885H (1216 - 1376, n=3) | |
| HP ZBook Firefly 15 G7 | |
| Dell Precision 3000 3551 | |
| Acer ConceptD 3 Pro CN315-71P-73W1 | |
| Acer TravelMate P215-52 | |
| Geekbench 5.5 / Multi-Core | |
| Dell Precision 5550 P91F | |
| Dell Precision 7550 | |
| MSI WS66 10TMT-207US | |
| Media Intel Core i9-10885H (6529 - 7693, n=3) | |
| Dell Precision 3000 3551 | |
| Acer ConceptD 3 Pro CN315-71P-73W1 | |
| HP ZBook Firefly 15 G7 | |
| Acer TravelMate P215-52 | |
| LibreOffice / 20 Documents To PDF | |
| HP ZBook Firefly 15 G7 | |
| Acer ConceptD 3 Pro CN315-71P-73W1 | |
| Acer TravelMate P215-52 | |
| Media Intel Core i9-10885H (45.9 - 59.6, n=3) | |
| Dell Precision 7550 | |
| Dell Precision 3000 3551 | |
| MSI WS66 10TMT-207US | |
| Dell Precision 5550 P91F | |
| R Benchmark 2.5 / Overall mean | |
| Acer TravelMate P215-52 | |
| Acer ConceptD 3 Pro CN315-71P-73W1 | |
| HP ZBook Firefly 15 G7 | |
| Dell Precision 5550 P91F | |
| MSI WS66 10TMT-207US | |
| Dell Precision 3000 3551 | |
| Dell Precision 7550 | |
| Media Intel Core i9-10885H (0.564 - 0.572, n=3) | |
Cinebench R15: CPU Multi 64Bit | CPU Single 64Bit
Blender: v2.79 BMW27 CPU
7-Zip 18.03: 7z b 4 -mmt1 | 7z b 4
Geekbench 5.5: Single-Core | Multi-Core
HWBOT x265 Benchmark v2.2: 4k Preset
LibreOffice : 20 Documents To PDF
R Benchmark 2.5: Overall mean
* ... Meglio usare valori piccoli
| PCMark 8 Home Score Accelerated v2 | 4246 punti | |
| PCMark 8 Work Score Accelerated v2 | 5287 punti | |
| PCMark 10 Score | 5127 punti | |
Aiuto | ||
| DPC Latencies / LatencyMon - interrupt to process latency (max), Web, Youtube, Prime95 | |
| Dell Precision 7550 | |
| HP ZBook Firefly 15 G7 | |
| MSI WS66 10TMT-207US | |
| Dell Precision 3000 3551 | |
| Dell Precision 5000 5750 P92F | |
| Dell Precision 5550 P91F | |
* ... Meglio usare valori piccoli
| Dell Precision 3000 3551 Toshiba Kioxia XG6 KXG60PNV512G | HP ZBook Firefly 15 G7 Toshiba XG6 KXG60ZNV1T02 | Dell Precision 5550 P91F SK Hynix PC601A NVMe 1TB | Lenovo ThinkPad P53s-20N6001NGE Intel SSD 760p SSDPEKKW256G8 | MSI WP65 Samsung SSD PM981 MZVLB512HAJQ | Dell Precision 3530 SK hynix PC400 512 GB | |
|---|---|---|---|---|---|---|
| AS SSD | 13% | -53% | 4% | 10% | -13% | |
| Seq Read (MB/s) | 1833 | 2666 45% | 2039 11% | 2283 25% | 1097 -40% | 2682 46% |
| Seq Write (MB/s) | 1283 | 1257 -2% | 1376 7% | 1042 -19% | 1838 43% | 1272 -1% |
| 4K Read (MB/s) | 44.56 | 48.04 8% | 44.11 -1% | 46.62 5% | 52.9 19% | 25.98 -42% |
| 4K Write (MB/s) | 112.4 | 137.5 22% | 113.3 1% | 172.6 54% | 108.4 -4% | 102.8 -9% |
| 4K-64 Read (MB/s) | 1106 | 977 -12% | 1094 -1% | 759 -31% | 1509 36% | 994 -10% |
| 4K-64 Write (MB/s) | 1262 | 1142 -10% | 1630 29% | 916 -27% | 1695 34% | 908 -28% |
| Access Time Read * (ms) | 0.084 | 0.053 37% | 0.059 30% | 0.06 29% | 0.067 20% | 0.099 -18% |
| Access Time Write * (ms) | 0.105 | 0.03 71% | 0.99 -843% | 0.022 79% | 0.103 2% | 0.053 50% |
| Score Read (Points) | 1334 | 1292 -3% | 1342 1% | 1034 -22% | 1671 25% | 1288 -3% |
| Score Write (Points) | 1503 | 1406 -6% | 1881 25% | 1192 -21% | 1988 32% | 1138 -24% |
| Score Total (Points) | 3498 | 3297 -6% | 3883 11% | 2705 -23% | 4558 30% | 3013 -14% |
| Copy ISO MB/s (MB/s) | 2940 | 2489 -15% | 1800 -39% | 1701 -42% | ||
| Copy Program MB/s (MB/s) | 733 | 682 -7% | 569 -22% | 346.1 -53% | ||
| Copy Game MB/s (MB/s) | 1442 | 1515 5% | 1409 -2% | 1050 -27% | ||
| CrystalDiskMark 5.2 / 6 | 8% | -2% | 16% | 3% | -14% | |
| Write 4K (MB/s) | 120.9 | 133.1 10% | 122.6 1% | 195.9 62% | 126.9 5% | 113.6 -6% |
| Read 4K (MB/s) | 46.79 | 51.6 10% | 42.4 -9% | 74.9 60% | 44.91 -4% | 41.18 -12% |
| Write Seq (MB/s) | 1916 | 1986 4% | 2167 13% | 1194 -38% | 1944 1% | 1417 -26% |
| Read Seq (MB/s) | 2216 | 2208 0% | 1747 -21% | 2309 4% | 1449 -35% | 1896 -14% |
| Write 4K Q32T1 (MB/s) | 393.9 | 462.3 17% | 388.8 -1% | 507 29% | 531 35% | 355 -10% |
| Read 4K Q32T1 (MB/s) | 375.1 | 400.2 7% | 367.3 -2% | 624 66% | 579 54% | 404.3 8% |
| Write Seq Q32T1 (MB/s) | 2795 | 3074 10% | 2629 -6% | 1206 -57% | 1970 -30% | 1411 -50% |
| Read Seq Q32T1 (MB/s) | 3106 | 3268 5% | 3460 11% | 3091 0% | 2990 -4% | 3095 0% |
| Media totale (Programma / Settaggio) | 11% /
11% | -28% /
-35% | 10% /
9% | 7% /
7% | -14% /
-13% |
* ... Meglio usare valori piccoli

Throttling disco: DiskSpd Read Loop, Queue Depth 8
| 3DMark 06 Standard Score | 35322 punti | |
| 3DMark 11 Performance | 6519 punti | |
| 3DMark Cloud Gate Standard Score | 24082 punti | |
| 3DMark Fire Strike Score | 4402 punti | |
| 3DMark Time Spy Score | 1593 punti | |
Aiuto | ||
| basso | medio | alto | ultra | |
|---|---|---|---|---|
| The Witcher 3 (2015) | 90.7 | 51.7 | 31.5 | 16.5 |
| Dota 2 Reborn (2015) | 156 | 139 | 90.2 | 82.8 |
| Final Fantasy XV Benchmark (2018) | 51.7 | 25.8 | 18.5 | |
| X-Plane 11.11 (2018) | 104 | 71.3 | 63.9 |
| Dell Precision 3000 3551 Quadro P620, i9-10885H, Toshiba Kioxia XG6 KXG60PNV512G | HP ZBook Firefly 15 G7 Quadro P520, i7-10610U, Toshiba XG6 KXG60ZNV1T02 | Dell Precision 5550 P91F Quadro T2000 Max-Q, i7-10875H, SK Hynix PC601A NVMe 1TB | Lenovo ThinkPad P53s-20N6001NGE Quadro P520, i7-8565U, Intel SSD 760p SSDPEKKW256G8 | MSI WP65 Quadro P620, i7-9750H, Samsung SSD PM981 MZVLB512HAJQ | Dell Precision 3530 Quadro P600, E-2176M, SK hynix PC400 512 GB | |
|---|---|---|---|---|---|---|
| Noise | 6% | 4% | 3% | -11% | -3% | |
| off /ambiente * (dB) | 25.8 | 29.3 -14% | 26.2 -2% | 29.2 -13% | 28.7 -11% | 28.1 -9% |
| Idle Minimum * (dB) | 26.2 | 29.3 -12% | 26.2 -0% | 29.2 -11% | 33.4 -27% | 28.3 -8% |
| Idle Average * (dB) | 26.2 | 29.3 -12% | 26.2 -0% | 29.2 -11% | 33.5 -28% | 28.3 -8% |
| Idle Maximum * (dB) | 26.2 | 30 -15% | 26.2 -0% | 30.8 -18% | 33.5 -28% | 28.4 -8% |
| Load Average * (dB) | 51.2 | 32.8 36% | 39.2 23% | 32.6 36% | 37 28% | 46.2 10% |
| Witcher 3 ultra * (dB) | 42.7 | 32.8 23% | 39 9% | 38.7 9% | ||
| Load Maximum * (dB) | 50.7 | 32.8 35% | 50.6 -0% | 33.8 33% | 59.5 -17% | 48.6 4% |
* ... Meglio usare valori piccoli
Rumorosità
| Idle |
| 26.2 / 26.2 / 26.2 dB(A) |
| Sotto carico |
| 51.2 / 50.7 dB(A) |
 | ||
30 dB silenzioso 40 dB(A) udibile 50 dB(A) rumoroso |
||
min: | ||
(-) La temperatura massima sul lato superiore è di 47 °C / 117 F, rispetto alla media di 38.2 °C / 101 F, che varia da 22.2 a 69.8 °C per questa classe Workstation.
(-) Il lato inferiore si riscalda fino ad un massimo di 54.6 °C / 130 F, rispetto alla media di 41.1 °C / 106 F
(+) In idle, la temperatura media del lato superiore è di 26.3 °C / 79 F, rispetto alla media deld ispositivo di 32 °C / 90 F.
(±) Riproducendo The Witcher 3, la temperatura media per il lato superiore e' di 35.1 °C / 95 F, rispetto alla media del dispositivo di 32 °C / 90 F.
(+) I poggiapolsi e il touchpad sono piu' freddi della temperatura della pelle con un massimo di 27.4 °C / 81.3 F e sono quindi freddi al tatto.
(±) La temperatura media della zona del palmo della mano di dispositivi simili e'stata di 27.8 °C / 82 F (+0.4 °C / 0.7 F).
Dell Precision 3000 3551 analisi audio
(+) | gli altoparlanti sono relativamente potenti (84.5 dB)
Bassi 100 - 315 Hz
(-) | quasi nessun basso - in media 19.8% inferiori alla media
(±) | la linearità dei bassi è media (10.1% delta rispetto alla precedente frequenza)
Medi 400 - 2000 Hz
(+) | medi bilanciati - solo only 4% rispetto alla media
(+) | medi lineari (5.4% delta rispetto alla precedente frequenza)
Alti 2 - 16 kHz
(+) | Alti bilanciati - appena 3.4% dalla media
(+) | alti lineari (2.9% delta rispetto alla precedente frequenza)
Nel complesso 100 - 16.000 Hz
(±) | la linearità complessiva del suono è media (15.5% di differenza rispetto alla media
Rispetto alla stessa classe
» 35% di tutti i dispositivi testati in questa classe è stato migliore, 10% simile, 55% peggiore
» Il migliore ha avuto un delta di 7%, medio di 17%, peggiore di 35%
Rispetto a tutti i dispositivi testati
» 23% di tutti i dispositivi testati in questa classe è stato migliore, 4% similare, 73% peggiore
» Il migliore ha avuto un delta di 4%, medio di 24%, peggiore di 134%
Apple MacBook 12 (Early 2016) 1.1 GHz analisi audio
(+) | gli altoparlanti sono relativamente potenti (83.6 dB)
Bassi 100 - 315 Hz
(±) | bassi ridotti - in media 11.3% inferiori alla media
(±) | la linearità dei bassi è media (14.2% delta rispetto alla precedente frequenza)
Medi 400 - 2000 Hz
(+) | medi bilanciati - solo only 2.4% rispetto alla media
(+) | medi lineari (5.5% delta rispetto alla precedente frequenza)
Alti 2 - 16 kHz
(+) | Alti bilanciati - appena 2% dalla media
(+) | alti lineari (4.5% delta rispetto alla precedente frequenza)
Nel complesso 100 - 16.000 Hz
(+) | suono nel complesso lineare (10.2% differenza dalla media)
Rispetto alla stessa classe
» 7% di tutti i dispositivi testati in questa classe è stato migliore, 2% simile, 91% peggiore
» Il migliore ha avuto un delta di 5%, medio di 18%, peggiore di 53%
Rispetto a tutti i dispositivi testati
» 5% di tutti i dispositivi testati in questa classe è stato migliore, 1% similare, 94% peggiore
» Il migliore ha avuto un delta di 4%, medio di 24%, peggiore di 134%
| Off / Standby | |
| Idle | |
| Sotto carico |
|
Leggenda:
min: | |
| Dell Precision 3000 3551 i9-10885H, Quadro P620, Toshiba Kioxia XG6 KXG60PNV512G, IPS, 1920x1080, 15.6" | HP ZBook Firefly 15 G7 i7-10610U, Quadro P520, Toshiba XG6 KXG60ZNV1T02, IPS LED, 3840x2160, 15.6" | Dell Precision 5550 P91F i7-10875H, Quadro T2000 Max-Q, SK Hynix PC601A NVMe 1TB, IPS, 3840x2400, 15.6" | Lenovo ThinkPad P53s-20N6001NGE i7-8565U, Quadro P520, Intel SSD 760p SSDPEKKW256G8, IPS, 1920x1080, 15.6" | MSI WP65 i7-9750H, Quadro P620, Samsung SSD PM981 MZVLB512HAJQ, IPS, 1920x1080, 15.6" | Dell Precision 3530 E-2176M, Quadro P600, SK hynix PC400 512 GB, IPS, 1920x1080, 15.6" | |
|---|---|---|---|---|---|---|
| Power Consumption | 26% | -31% | 33% | -43% | -10% | |
| Idle Minimum * (Watt) | 5.7 | 3.5 39% | 5.6 2% | 2.74 52% | 5.6 2% | 5.3 7% |
| Idle Average * (Watt) | 8.7 | 6.7 23% | 11.2 -29% | 6.4 26% | 8.6 1% | 10.7 -23% |
| Idle Maximum * (Watt) | 9 | 9.6 -7% | 18.4 -104% | 9.7 -8% | 30.7 -241% | 14.1 -57% |
| Load Average * (Watt) | 100.2 | 60 40% | 114 -14% | 55.2 45% | 78 22% | 85.4 15% |
| Witcher 3 ultra * (Watt) | 56 | 49.3 12% | 76.7 -37% | 63.5 -13% | 75.5 -35% | |
| Load Maximum * (Watt) | 133.2 | 68.6 48% | 134.2 -1% | 69.4 48% | 170.2 -28% | 91.9 31% |
* ... Meglio usare valori piccoli
| Dell Precision 3000 3551 i9-10885H, Quadro P620, 97 Wh | HP ZBook Firefly 15 G7 i7-10610U, Quadro P520, 53 Wh | Dell Precision 5550 P91F i7-10875H, Quadro T2000 Max-Q, 86 Wh | Lenovo ThinkPad P53s-20N6001NGE i7-8565U, Quadro P520, 57 Wh | MSI WP65 i7-9750H, Quadro P620, 51 Wh | Dell Precision 3530 E-2176M, Quadro P600, 92 Wh | |
|---|---|---|---|---|---|---|
| Autonomia della batteria | -33% | -34% | -37% | -56% | -32% | |
| WiFi v1.3 (h) | 13.6 | 9.1 -33% | 9 -34% | 8.6 -37% | 6 -56% | 9.3 -32% |
| Load (h) | 2 | 1.4 | 2.5 | 0.6 | 1.6 | |
| Reader / Idle (h) | 22.6 | 25.2 | 10.1 | 18.8 |
Pro
Contro
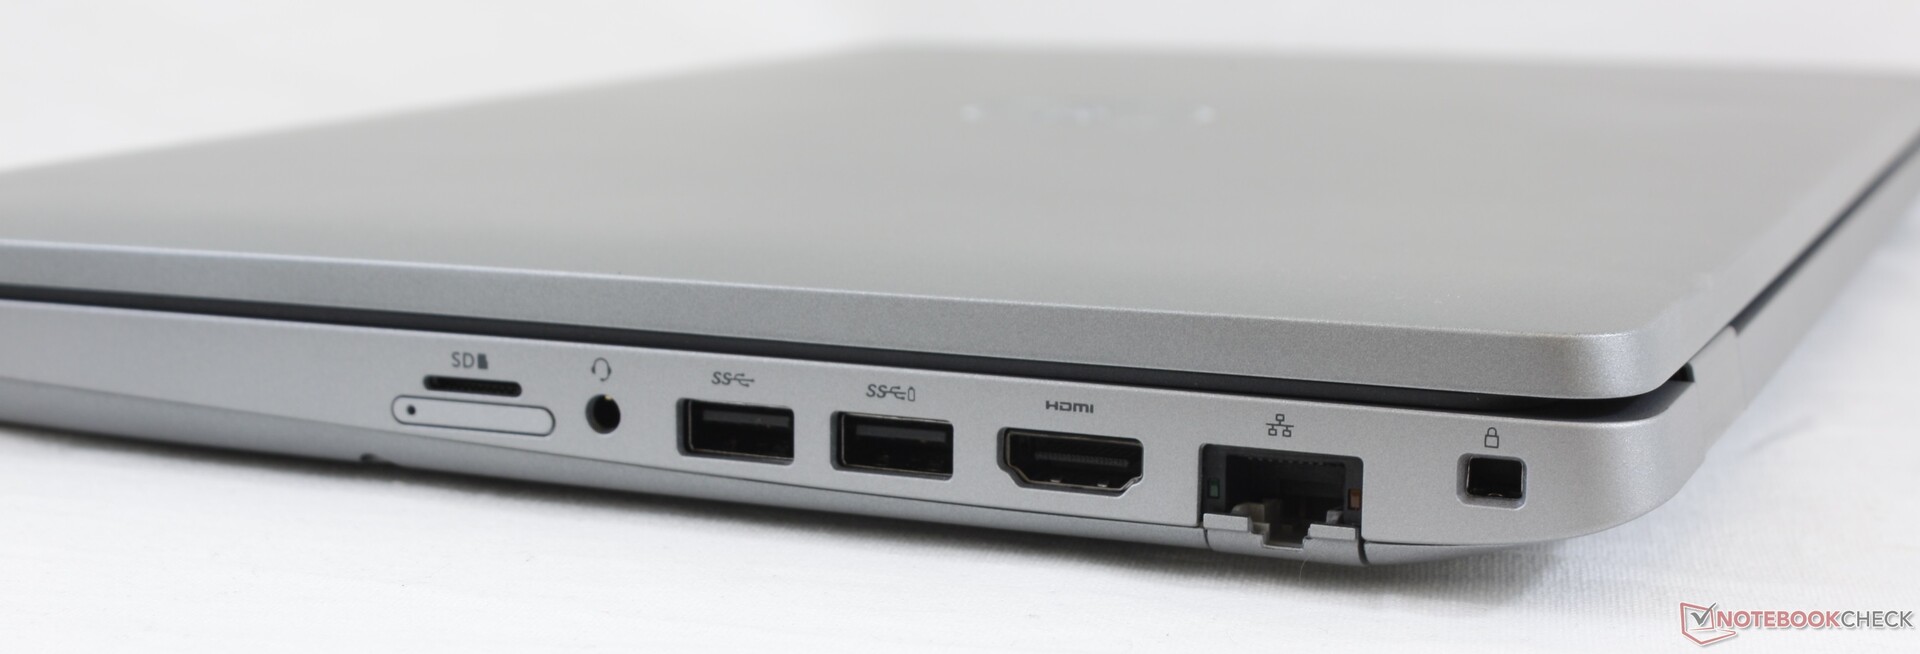
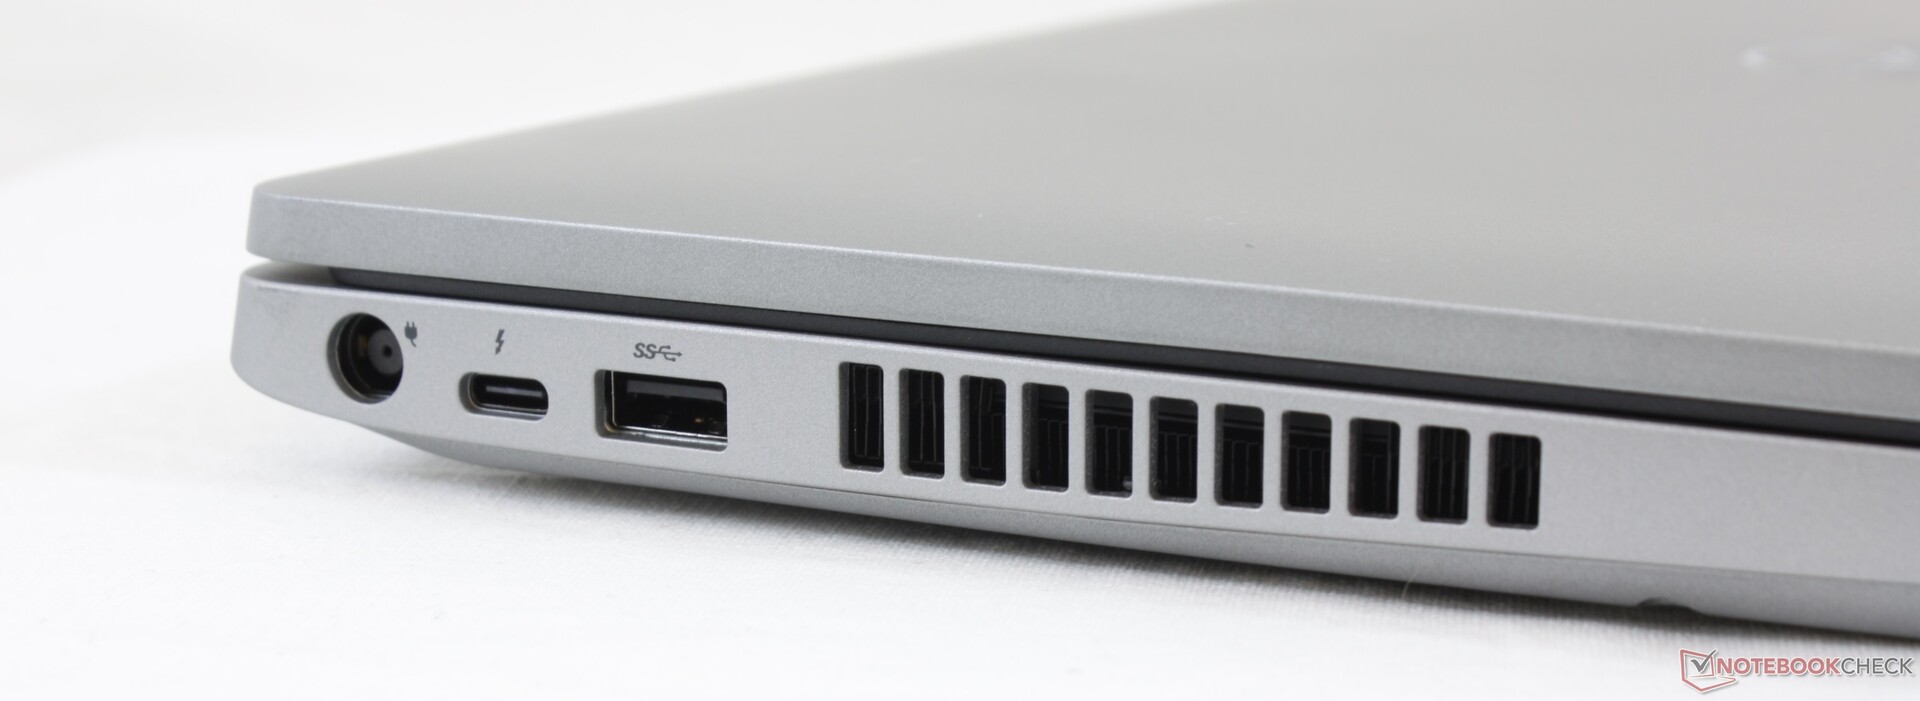
Il Precision 3551 ha tutte le basi di una classica workstation mobile. TrackPoint, pulsanti del mouse veri e propri, Smart Card, WWAN, manutenibilità e molte altre opzioni hardware tra cui la doppia memorizzazione. La Thunderbolt 3 è un tocco di classe soprattutto per quella che è considerata una workstation "low-end". Se la connettività e l'usabilità sono in cima alla vostra lista, allora il Precision 3551 senza fronzoli spunterà quelle caselle senza costare troppo.
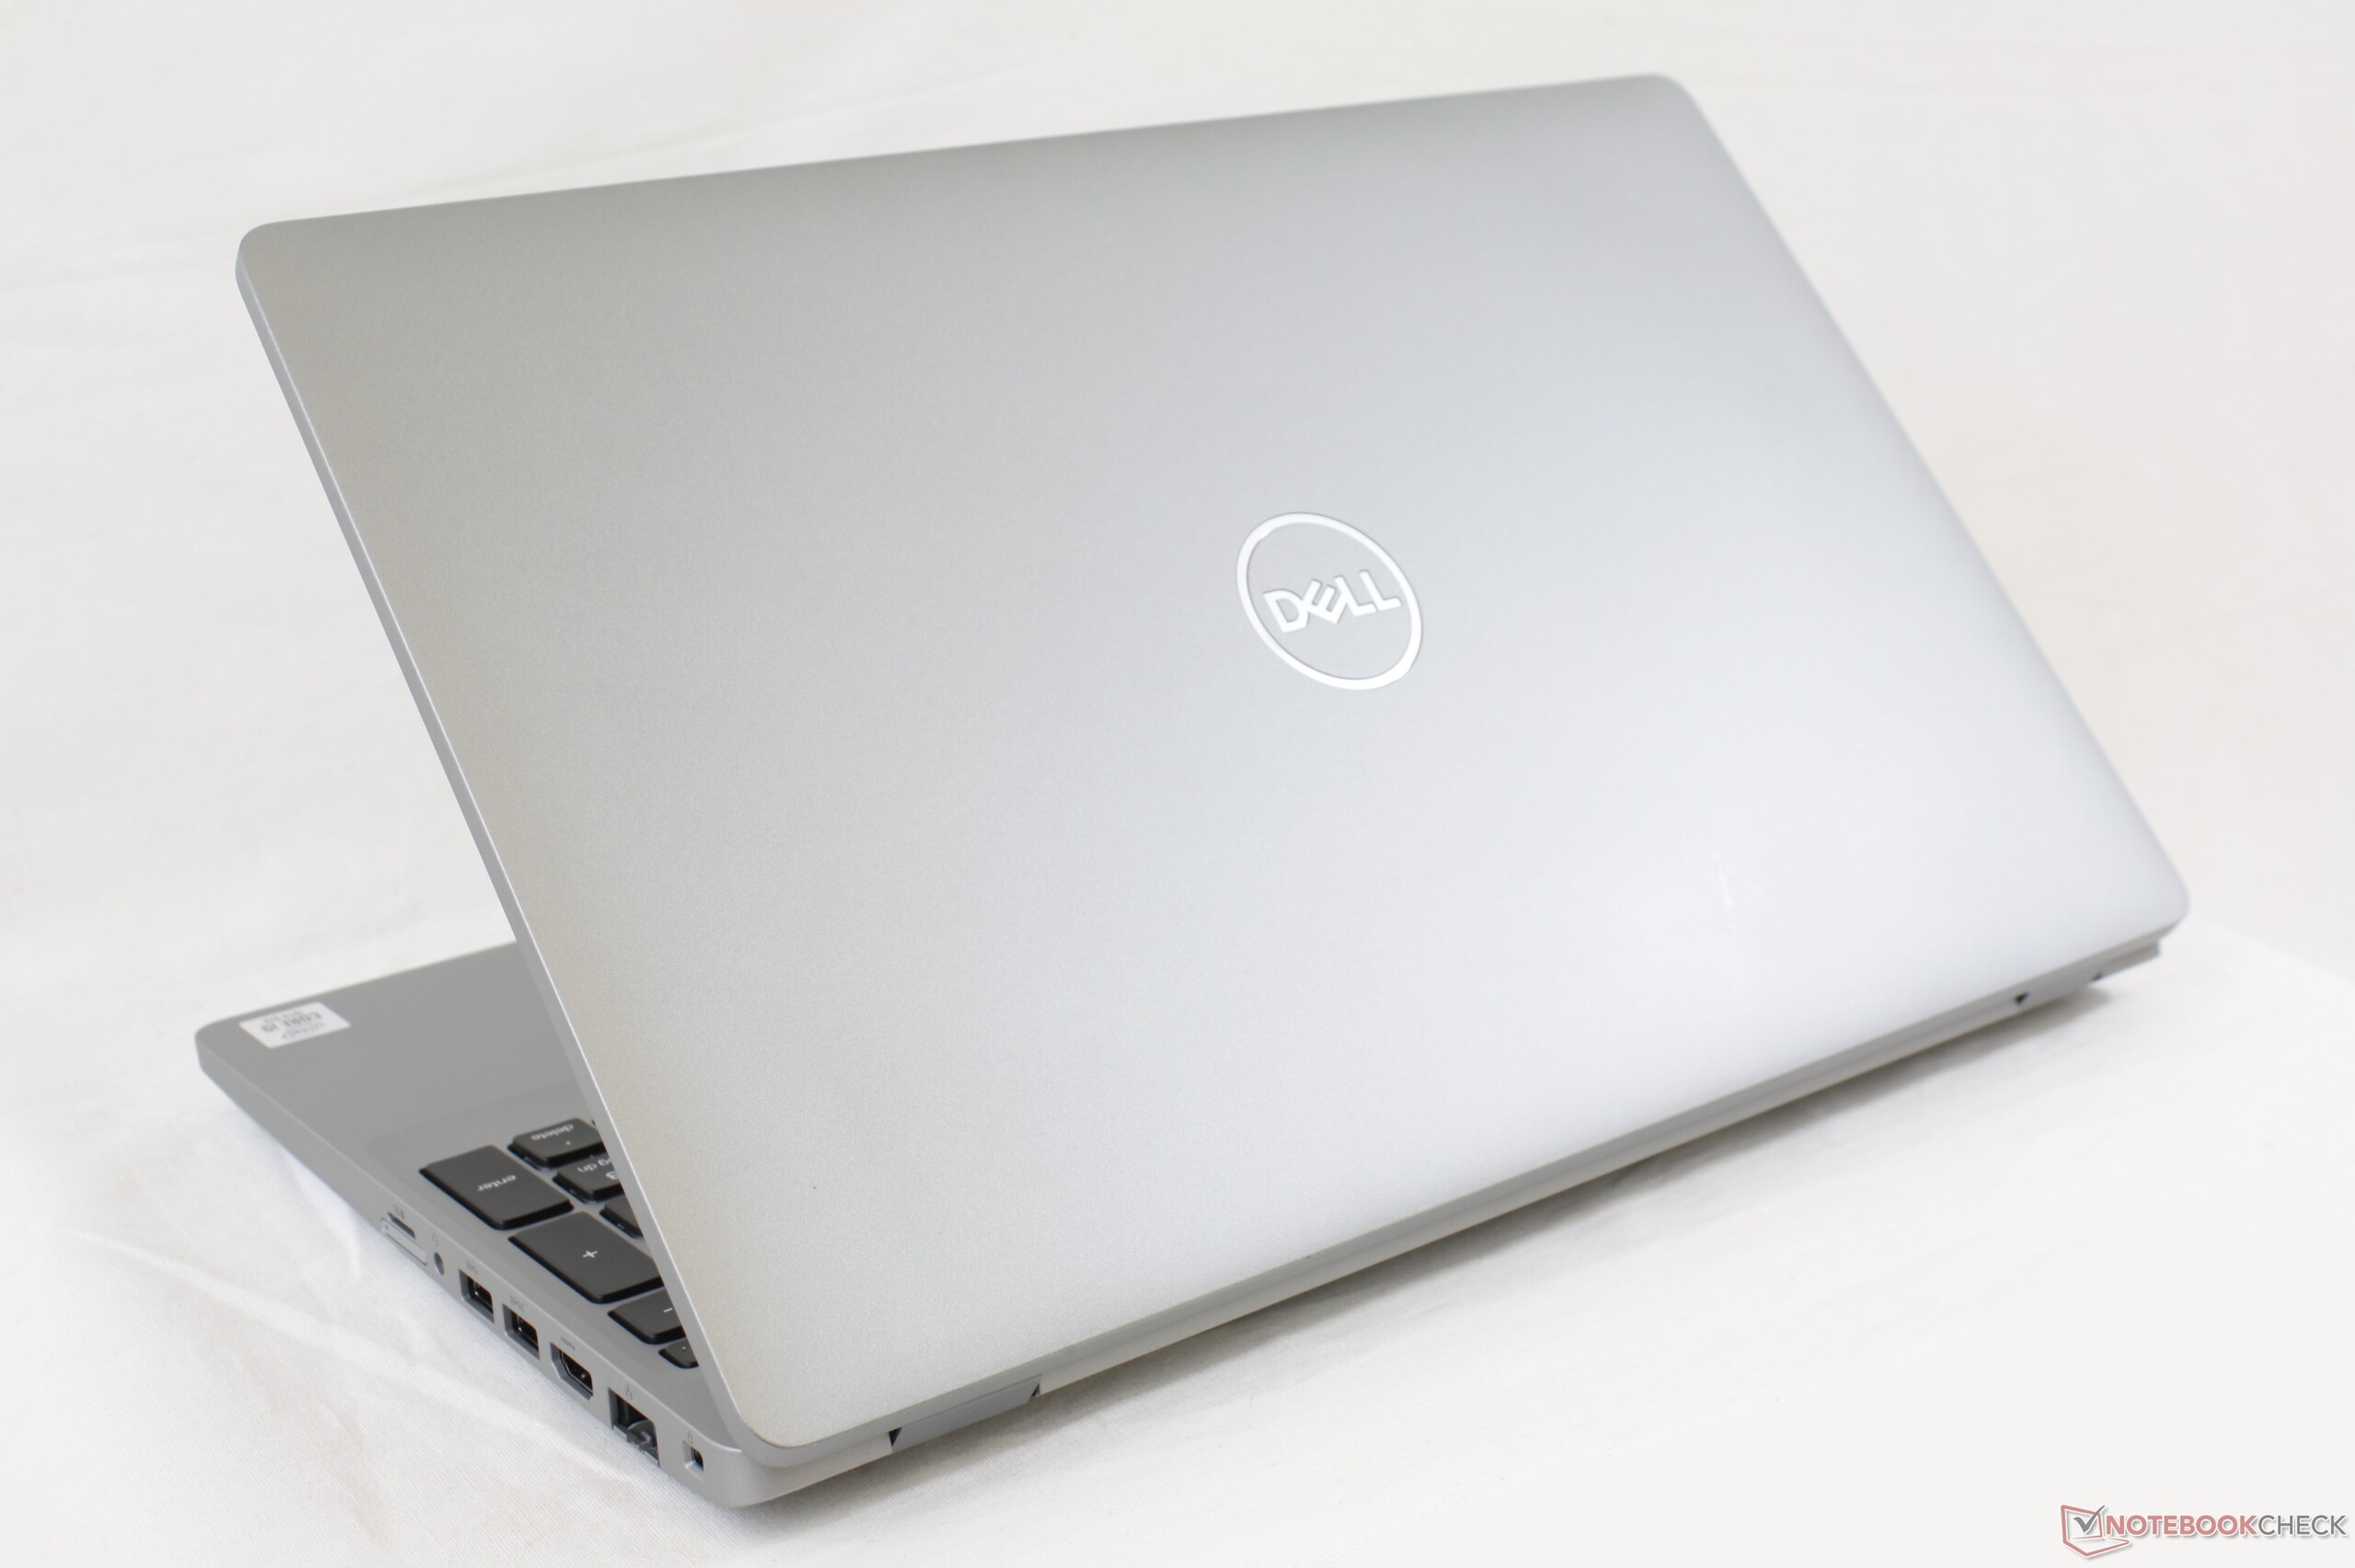
La workstation diventa meno impressionante quando si parla di prestazioni e design estetico. La grafica è limitata alla vecchia Quadro P620 e il Core i9-109880H avrebbe potuto essere migliore quando si è trattato di sostenibilità Turbo Boost. L'aspetto del sistema è funzionale, ma anche noioso. Dovrete cercare un po' più in alto nella pila attraverso la più costosa serie Precision 5000 o 7000 per ottenere sistemi più eleganti con prestazioni più veloci.
Grande varietà di porte e caratteristiche di usabilità anche se le prestazioni grafiche sono limitate e il design del telaio è antiquato.
Dell Precision 3000 3551
- 10/09/2020 v7 (old)
Allen Ngo
Price comparison
