Recensione della Workstation Dell Precision 5550: XPS 15 per professionisti
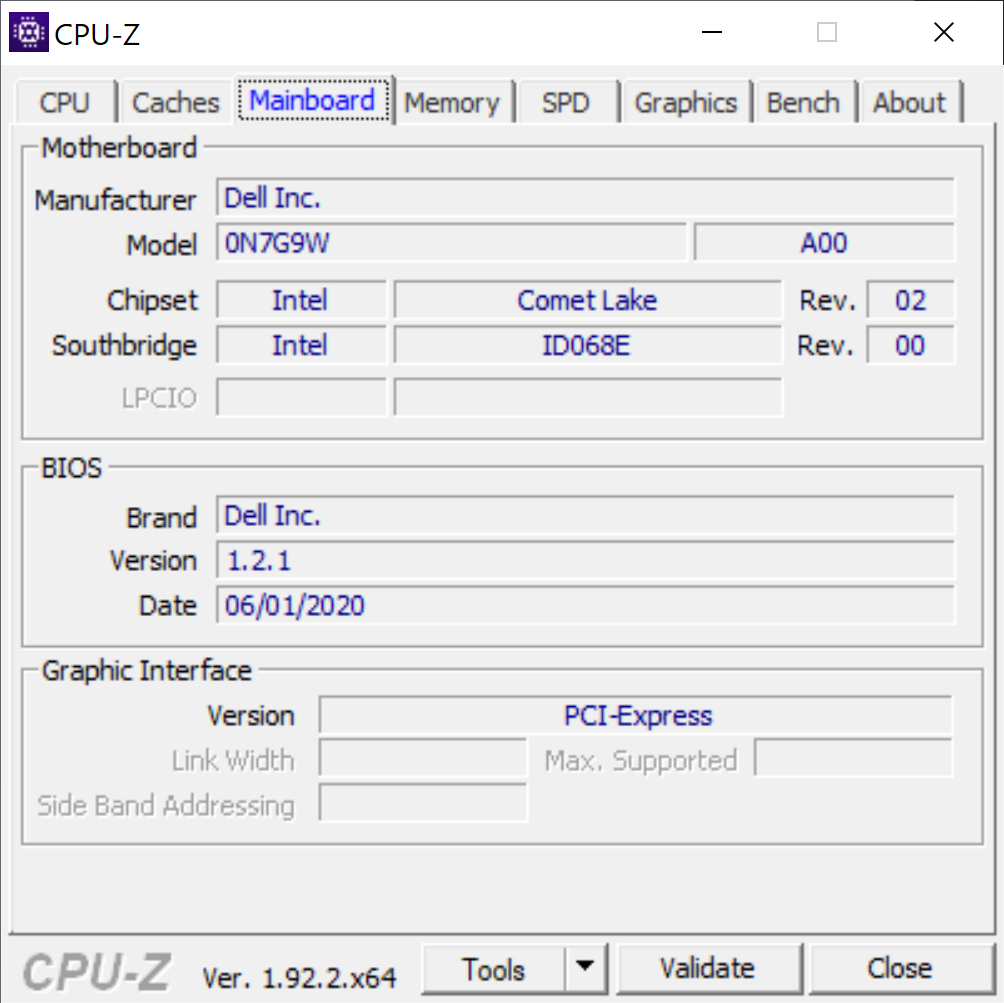
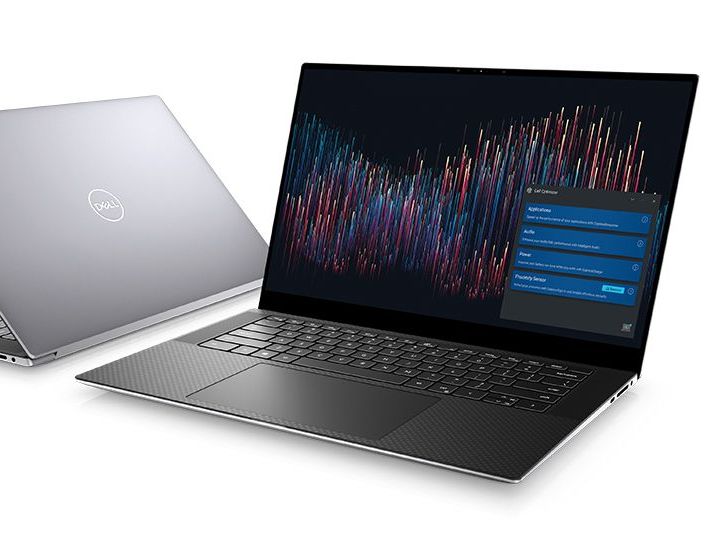
Proprio come il Precision 5540 è la versione workstation dell'XPS 15 7590, il nuovo Precision 5550 è la versione workstation dell'XPS 15 9500. L'ultimo modello è un aggiornamento completo del telaio dell'ultima generazione Precision 5540 con essenzialmente lo stesso design estetico e le stesse caratteristiche dell'XPS 15 9500. Pertanto, si consiglia di dare un'occhiata alla nostra recensione dell'XPS 15 9500 per saperne di più sulle caratteristiche fisiche del Precision 5550.
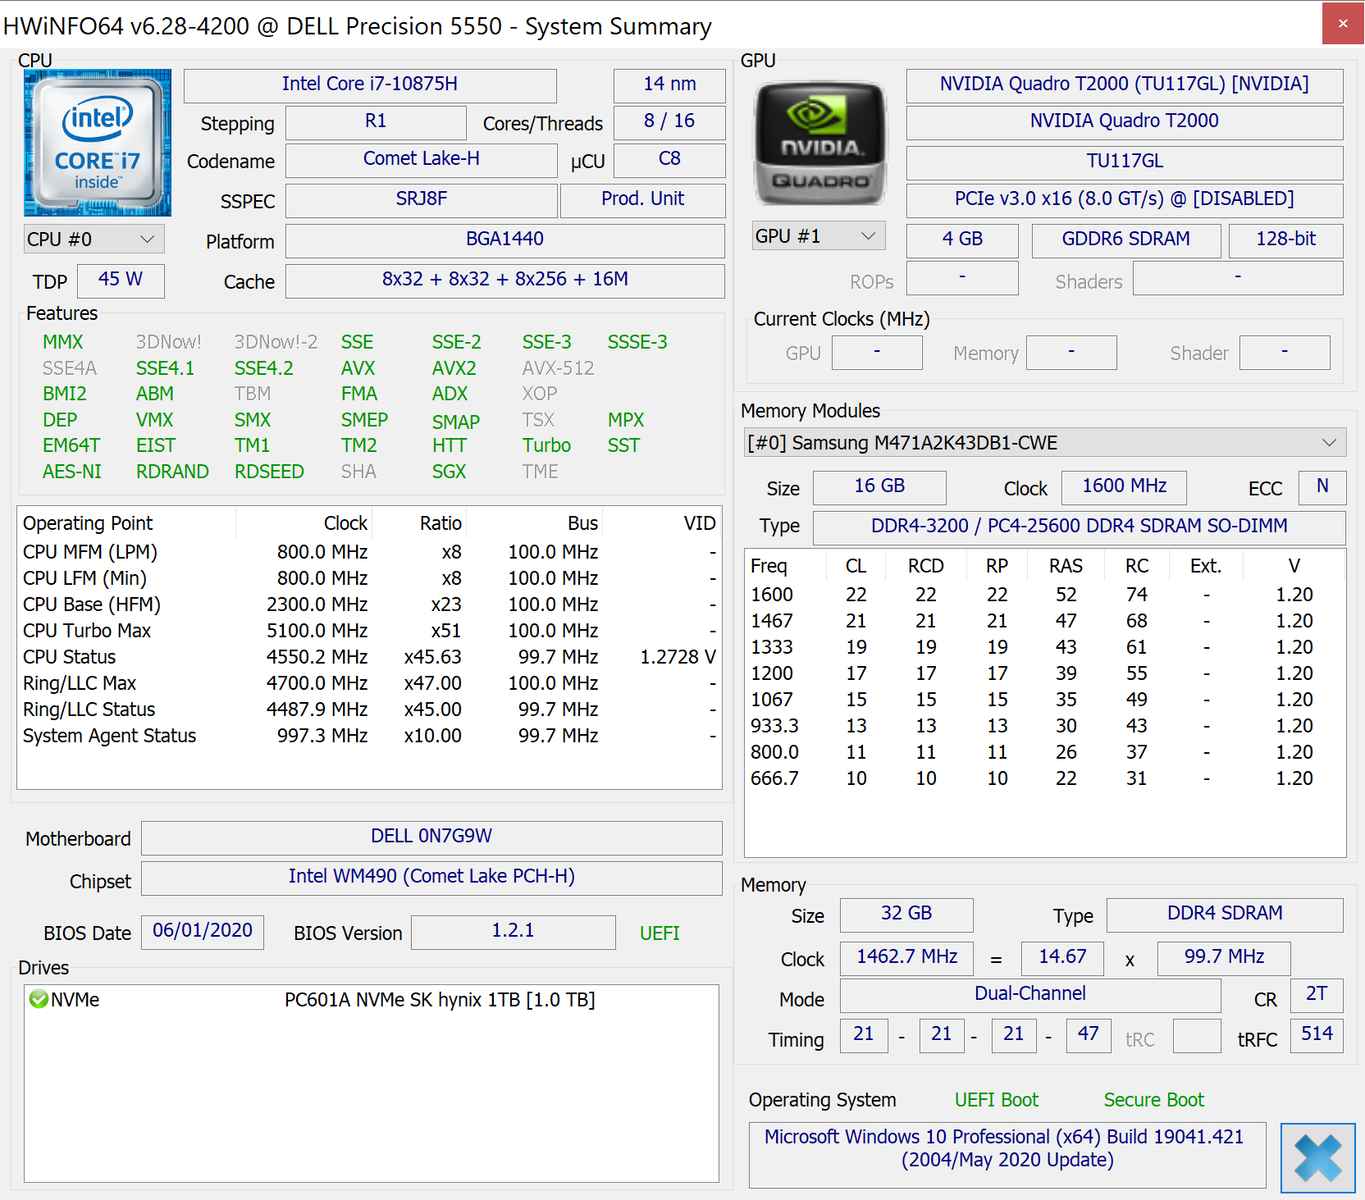
Le caratteristiche specifiche del Precision 5550 sono in gran parte interne, poiché include le opzioni Core i9-10885H vPro, Xeon W-10855M e Nvidia Quadro T1000 e T2000 Max-Q non si trovano su nessun sistema XPS. La nostra unità configurata viene fornita con Core i7-10875H e Quadro T2000 Max-Q per circa $3000 USD al dettaglio.
I concorrenti in questo settore includono altre workstations ultrasottili come la serie MSI WS, Acer ConceptD 3 Pro, Razer Blade Studio, o la serie ZBook 15u. Gli utenti nel mercato delle workstation più tradizionali dovrebbero invece guardare alla serie Precision 7000 di fascia più alta.
Altre recensioni Dell:
Punteggio | Data | Modello | Peso | Altezza | Dimensione | Risoluzione | Prezzo |
|---|---|---|---|---|---|---|---|
| 86.3 % v7 (old) | 08/2020 | Dell Precision 5550 P91F i7-10875H, Quadro T2000 Max-Q | 2 kg | 18 mm | 15.60" | 3840x2400 | |
| 86.9 % v7 (old) | 11/2019 | Dell Precision 5540 i9-9980HK, Quadro T2000 Max-Q | 2 kg | 17 mm | 15.60" | 3840x2160 | |
| 87 % v7 (old) | 08/2020 | Razer Blade 15 Studio Edition 2020 i7-10875H, Quadro RTX 5000 Max-Q | 2.2 kg | 13.98 mm | 15.60" | 3840x2160 | |
| 82.1 % v7 (old) | 06/2020 | Acer ConceptD 3 Pro CN315-71P-73W1 i7-9750H, Quadro T1000 (Laptop) | 2.4 kg | 23.4 mm | 15.60" | 1920x1080 | |
| 89.8 % v7 (old) | 11/2019 | Lenovo ThinkPad P53-20QN000YGE i7-9850H, Quadro RTX 5000 Max-Q | 2.7 kg | 29.4 mm | 15.60" | 1920x1080 | |
| 76 % v7 (old) | 10/2019 | MSI WP65 i7-9750H, Quadro P620 | 1.9 kg | 21.7 mm | 15.60" | 1920x1080 |
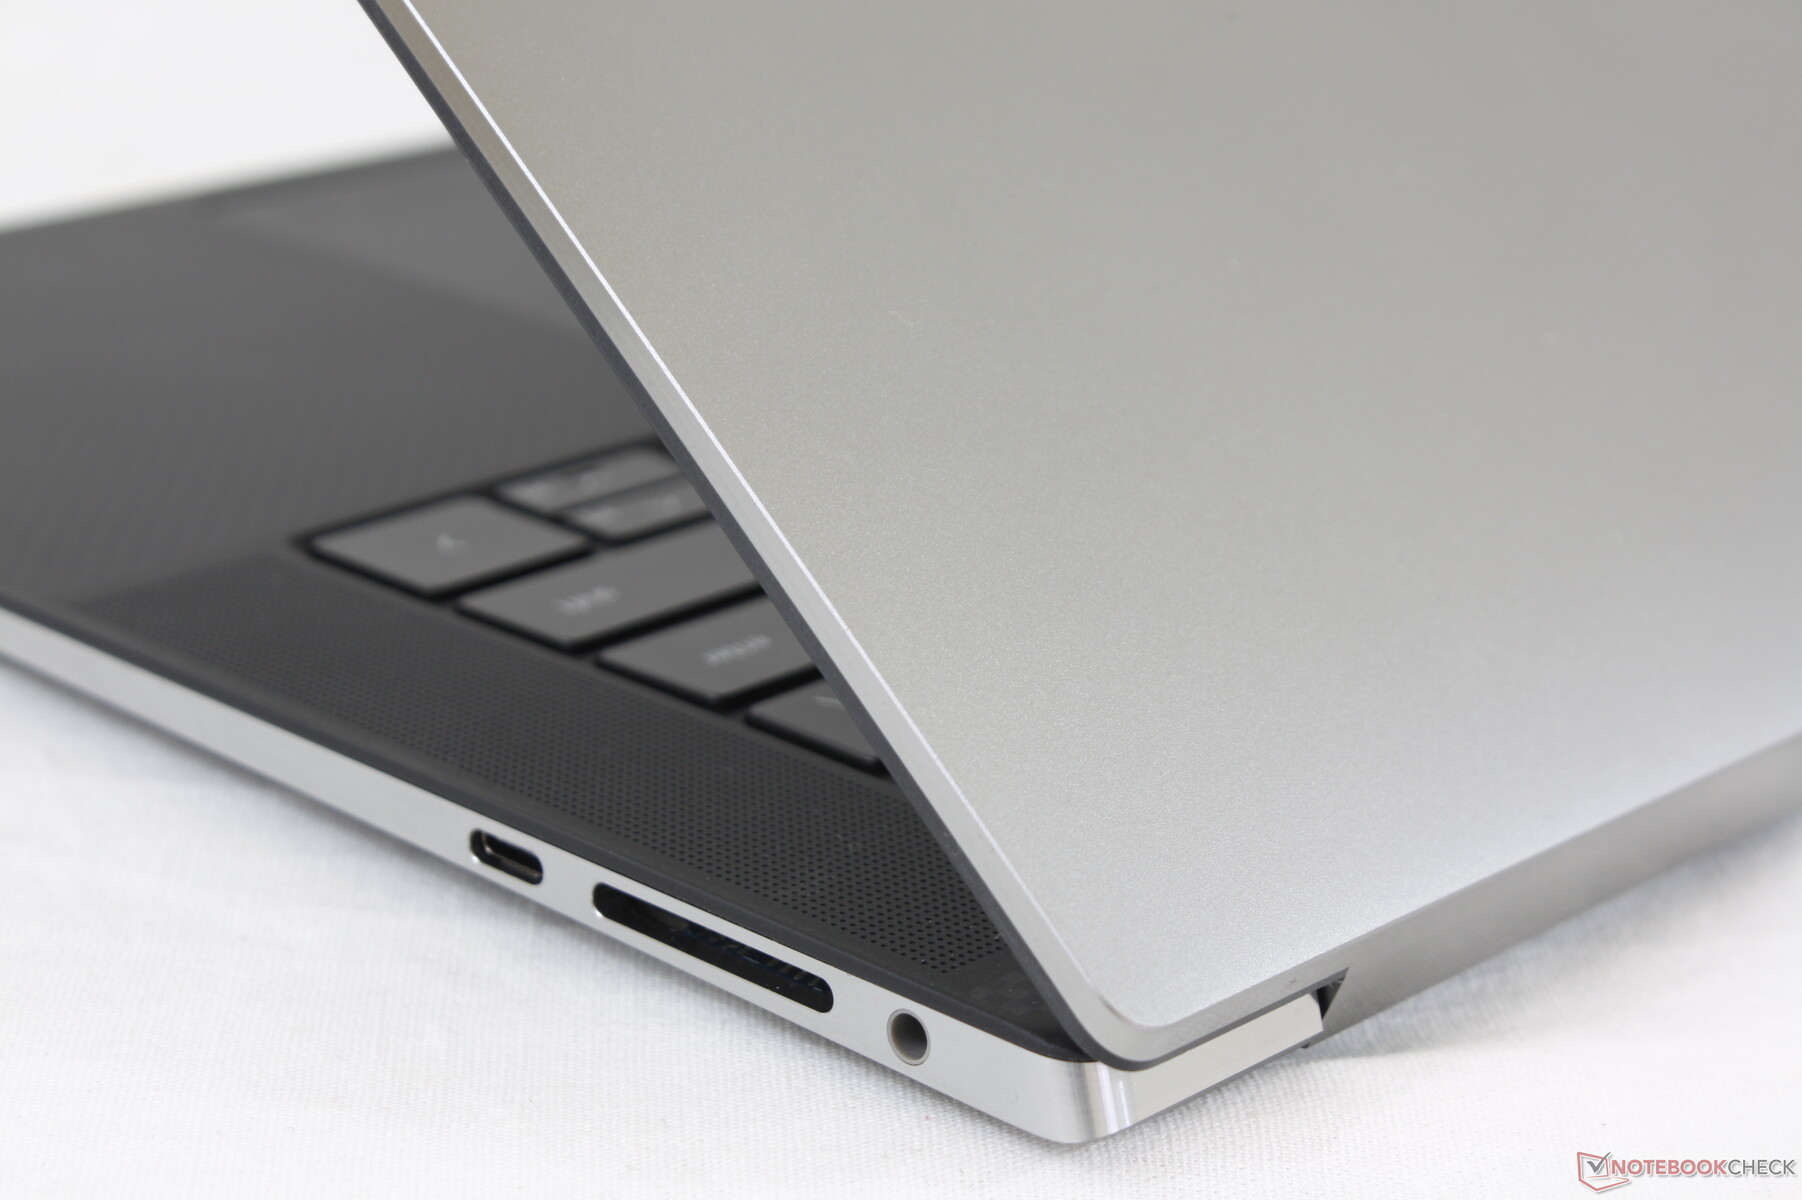
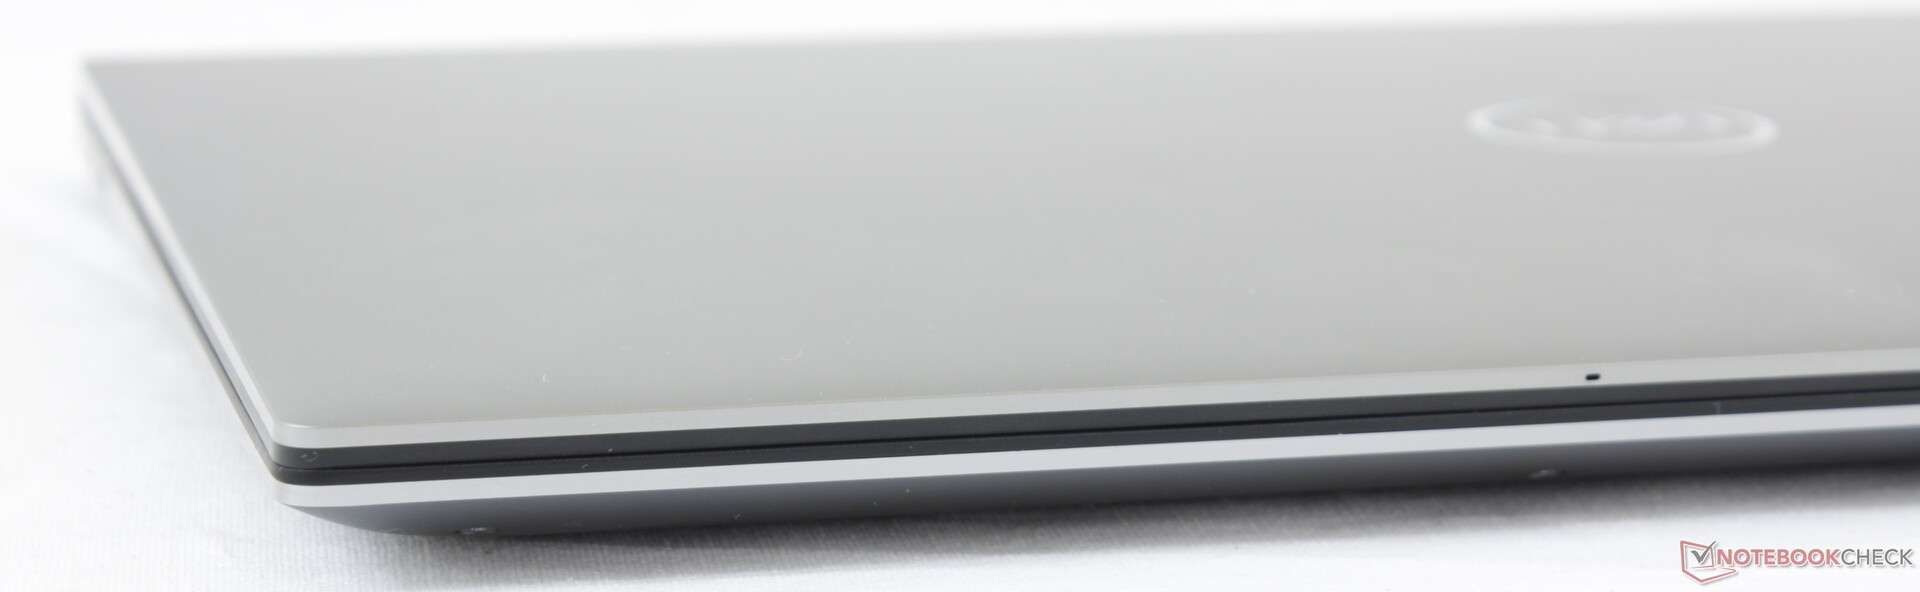
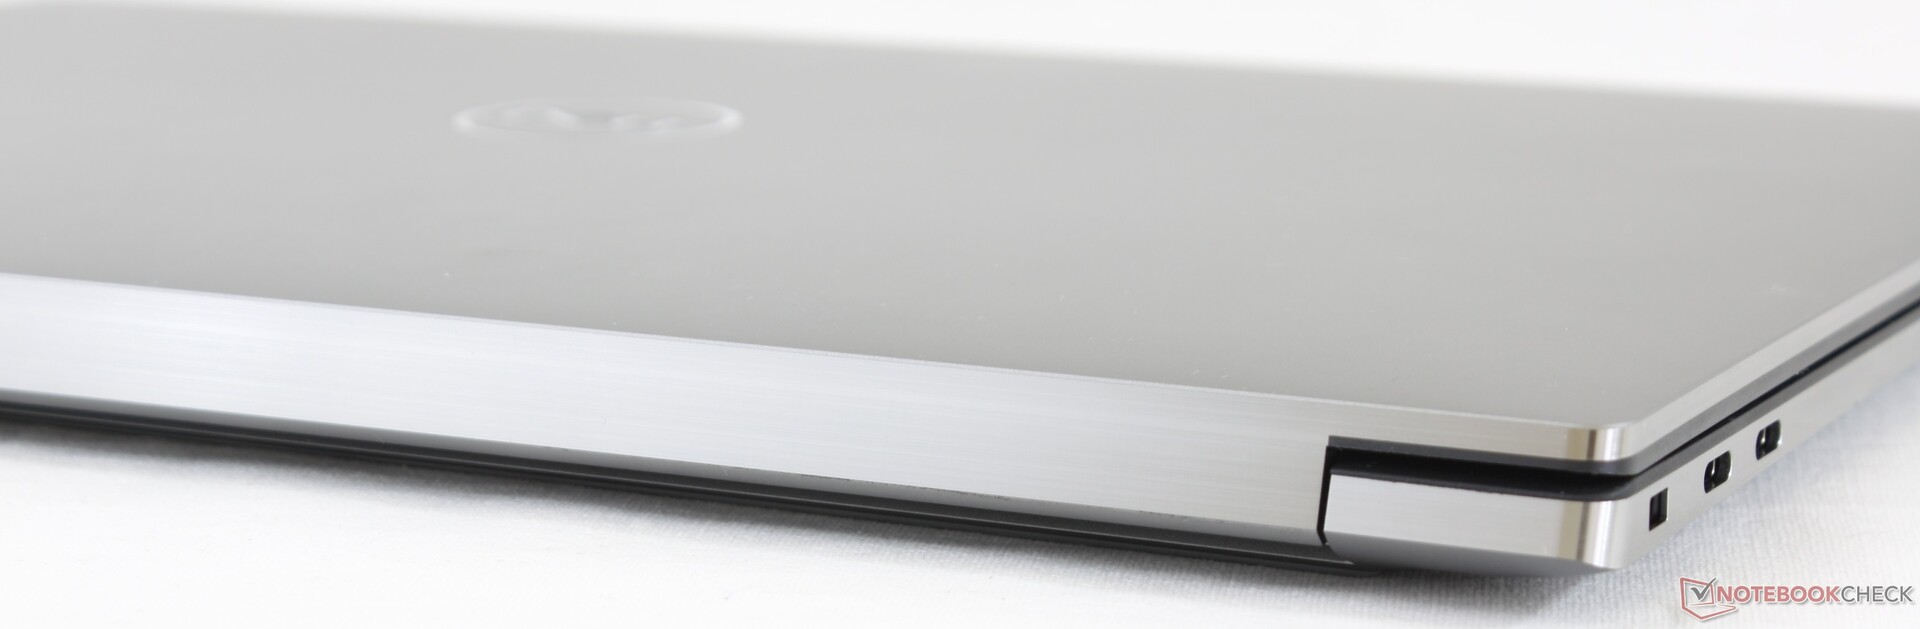
Case
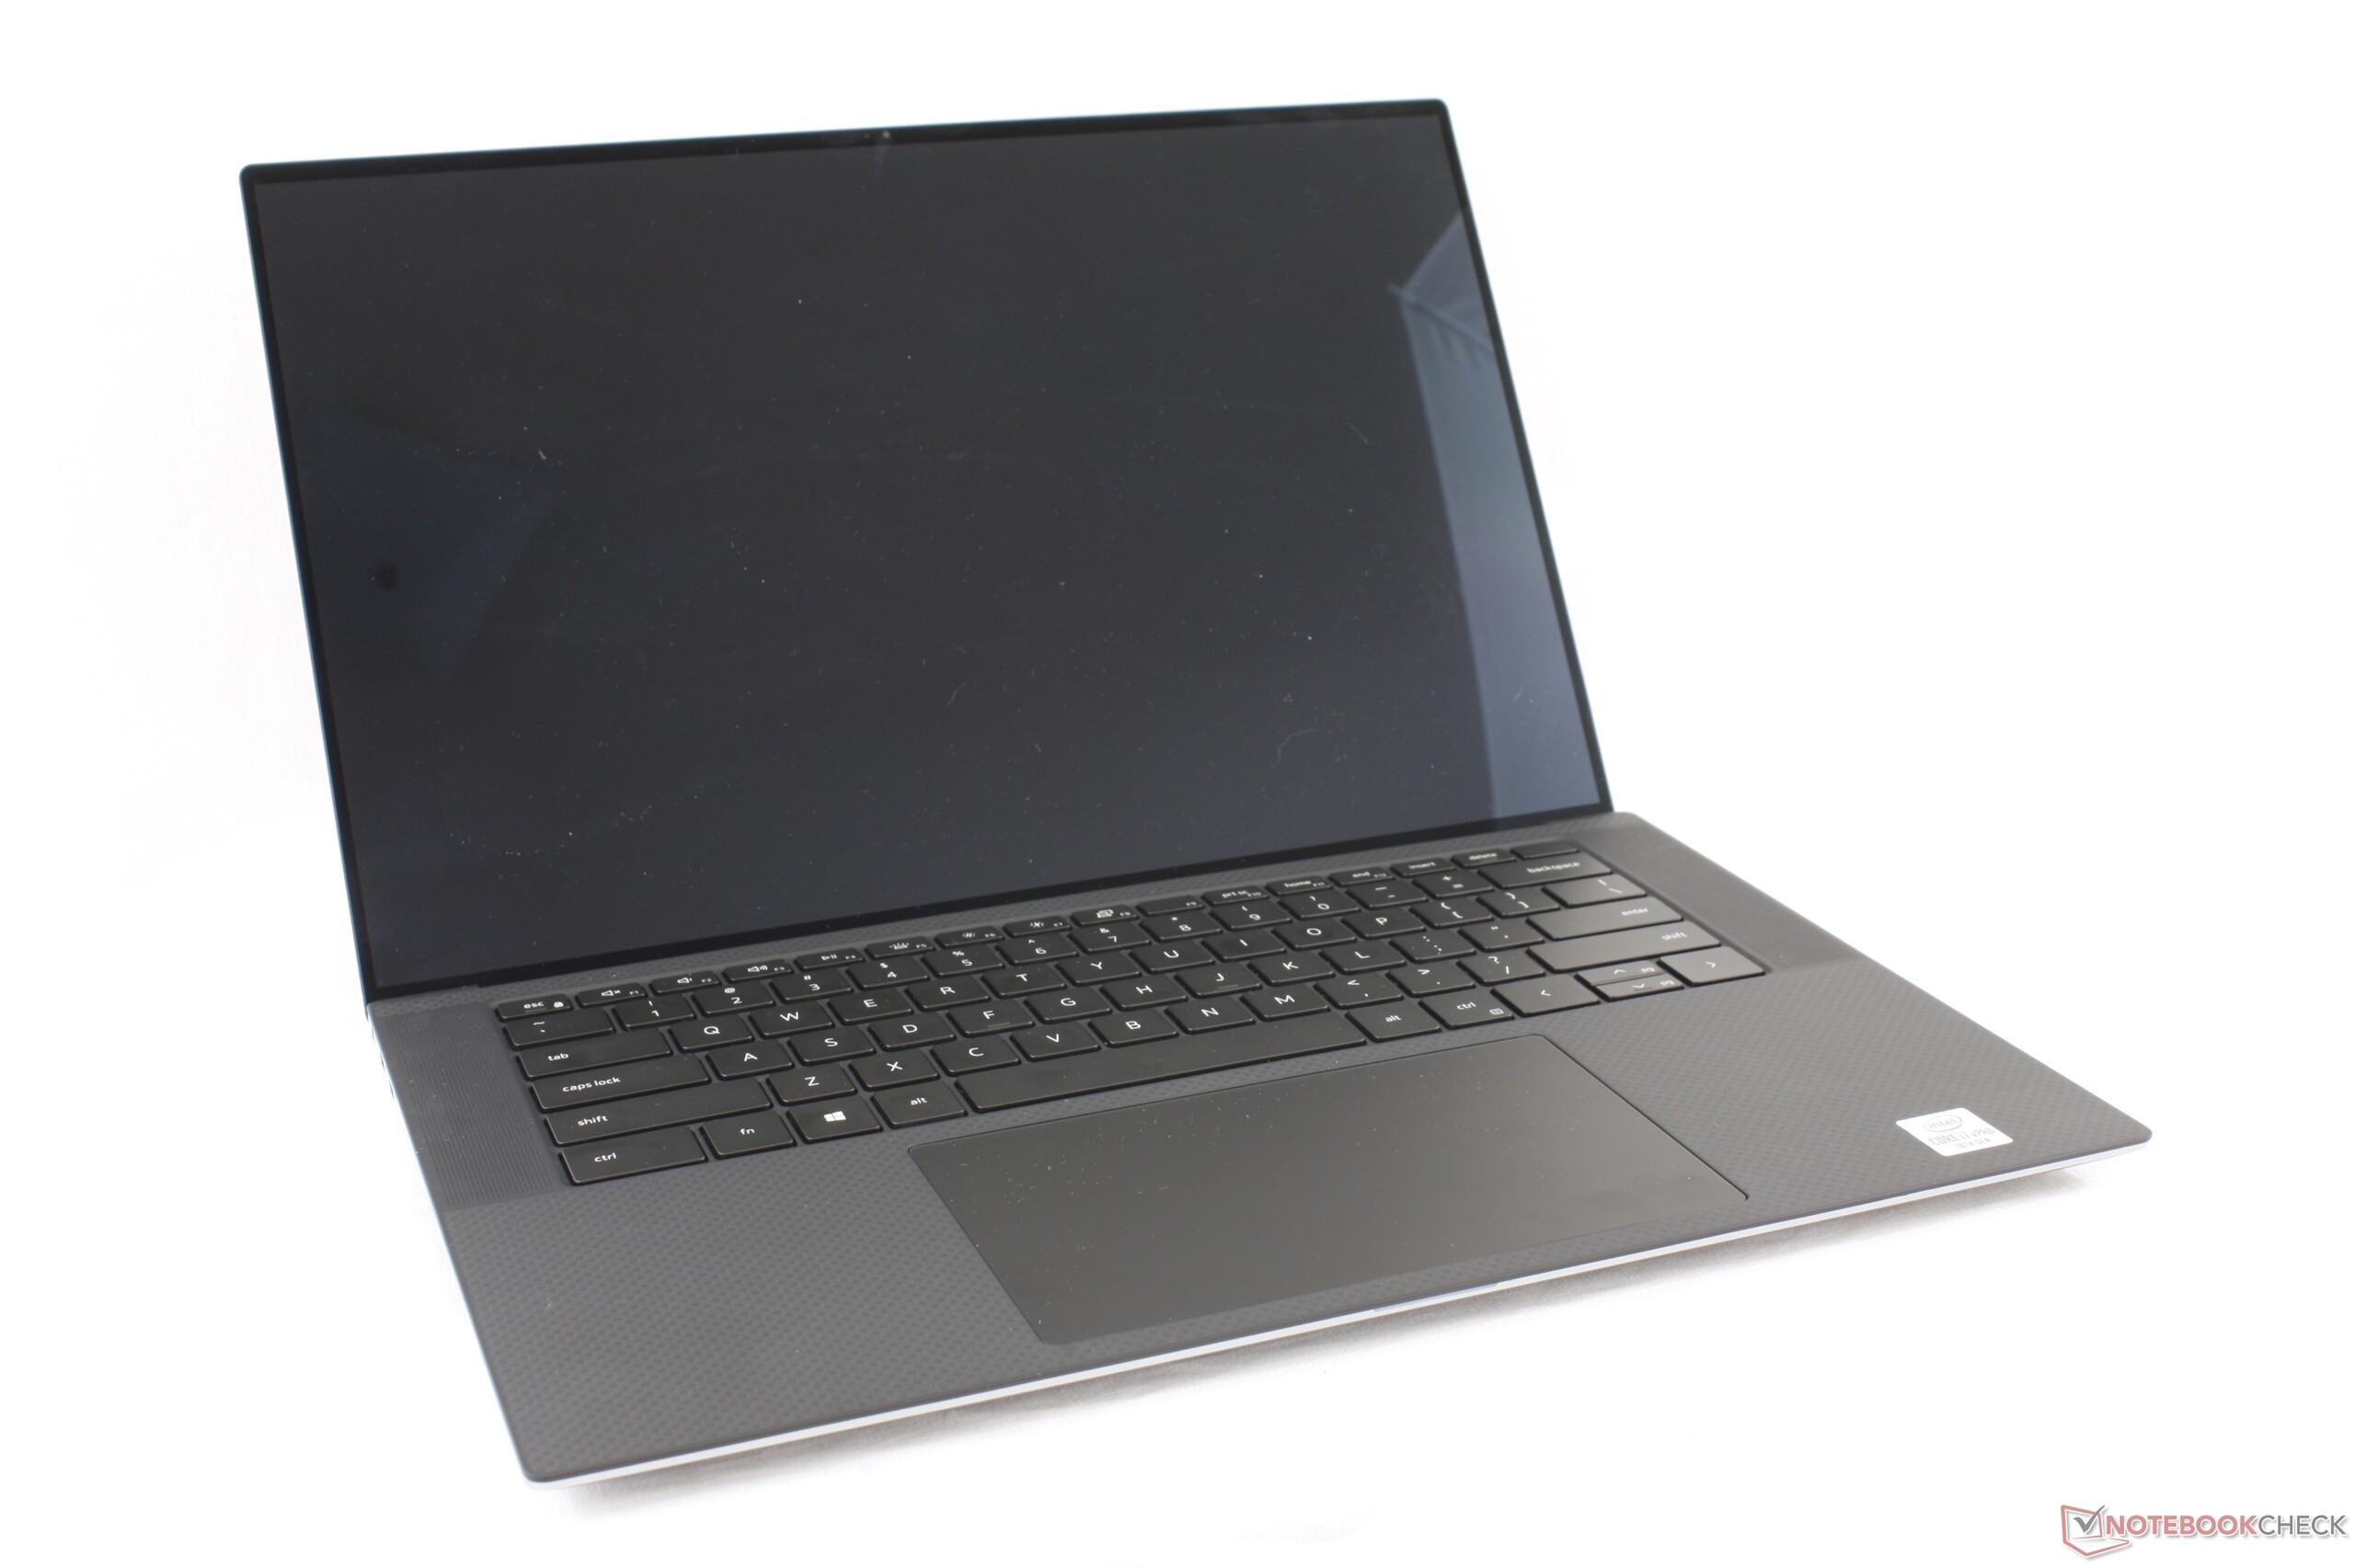
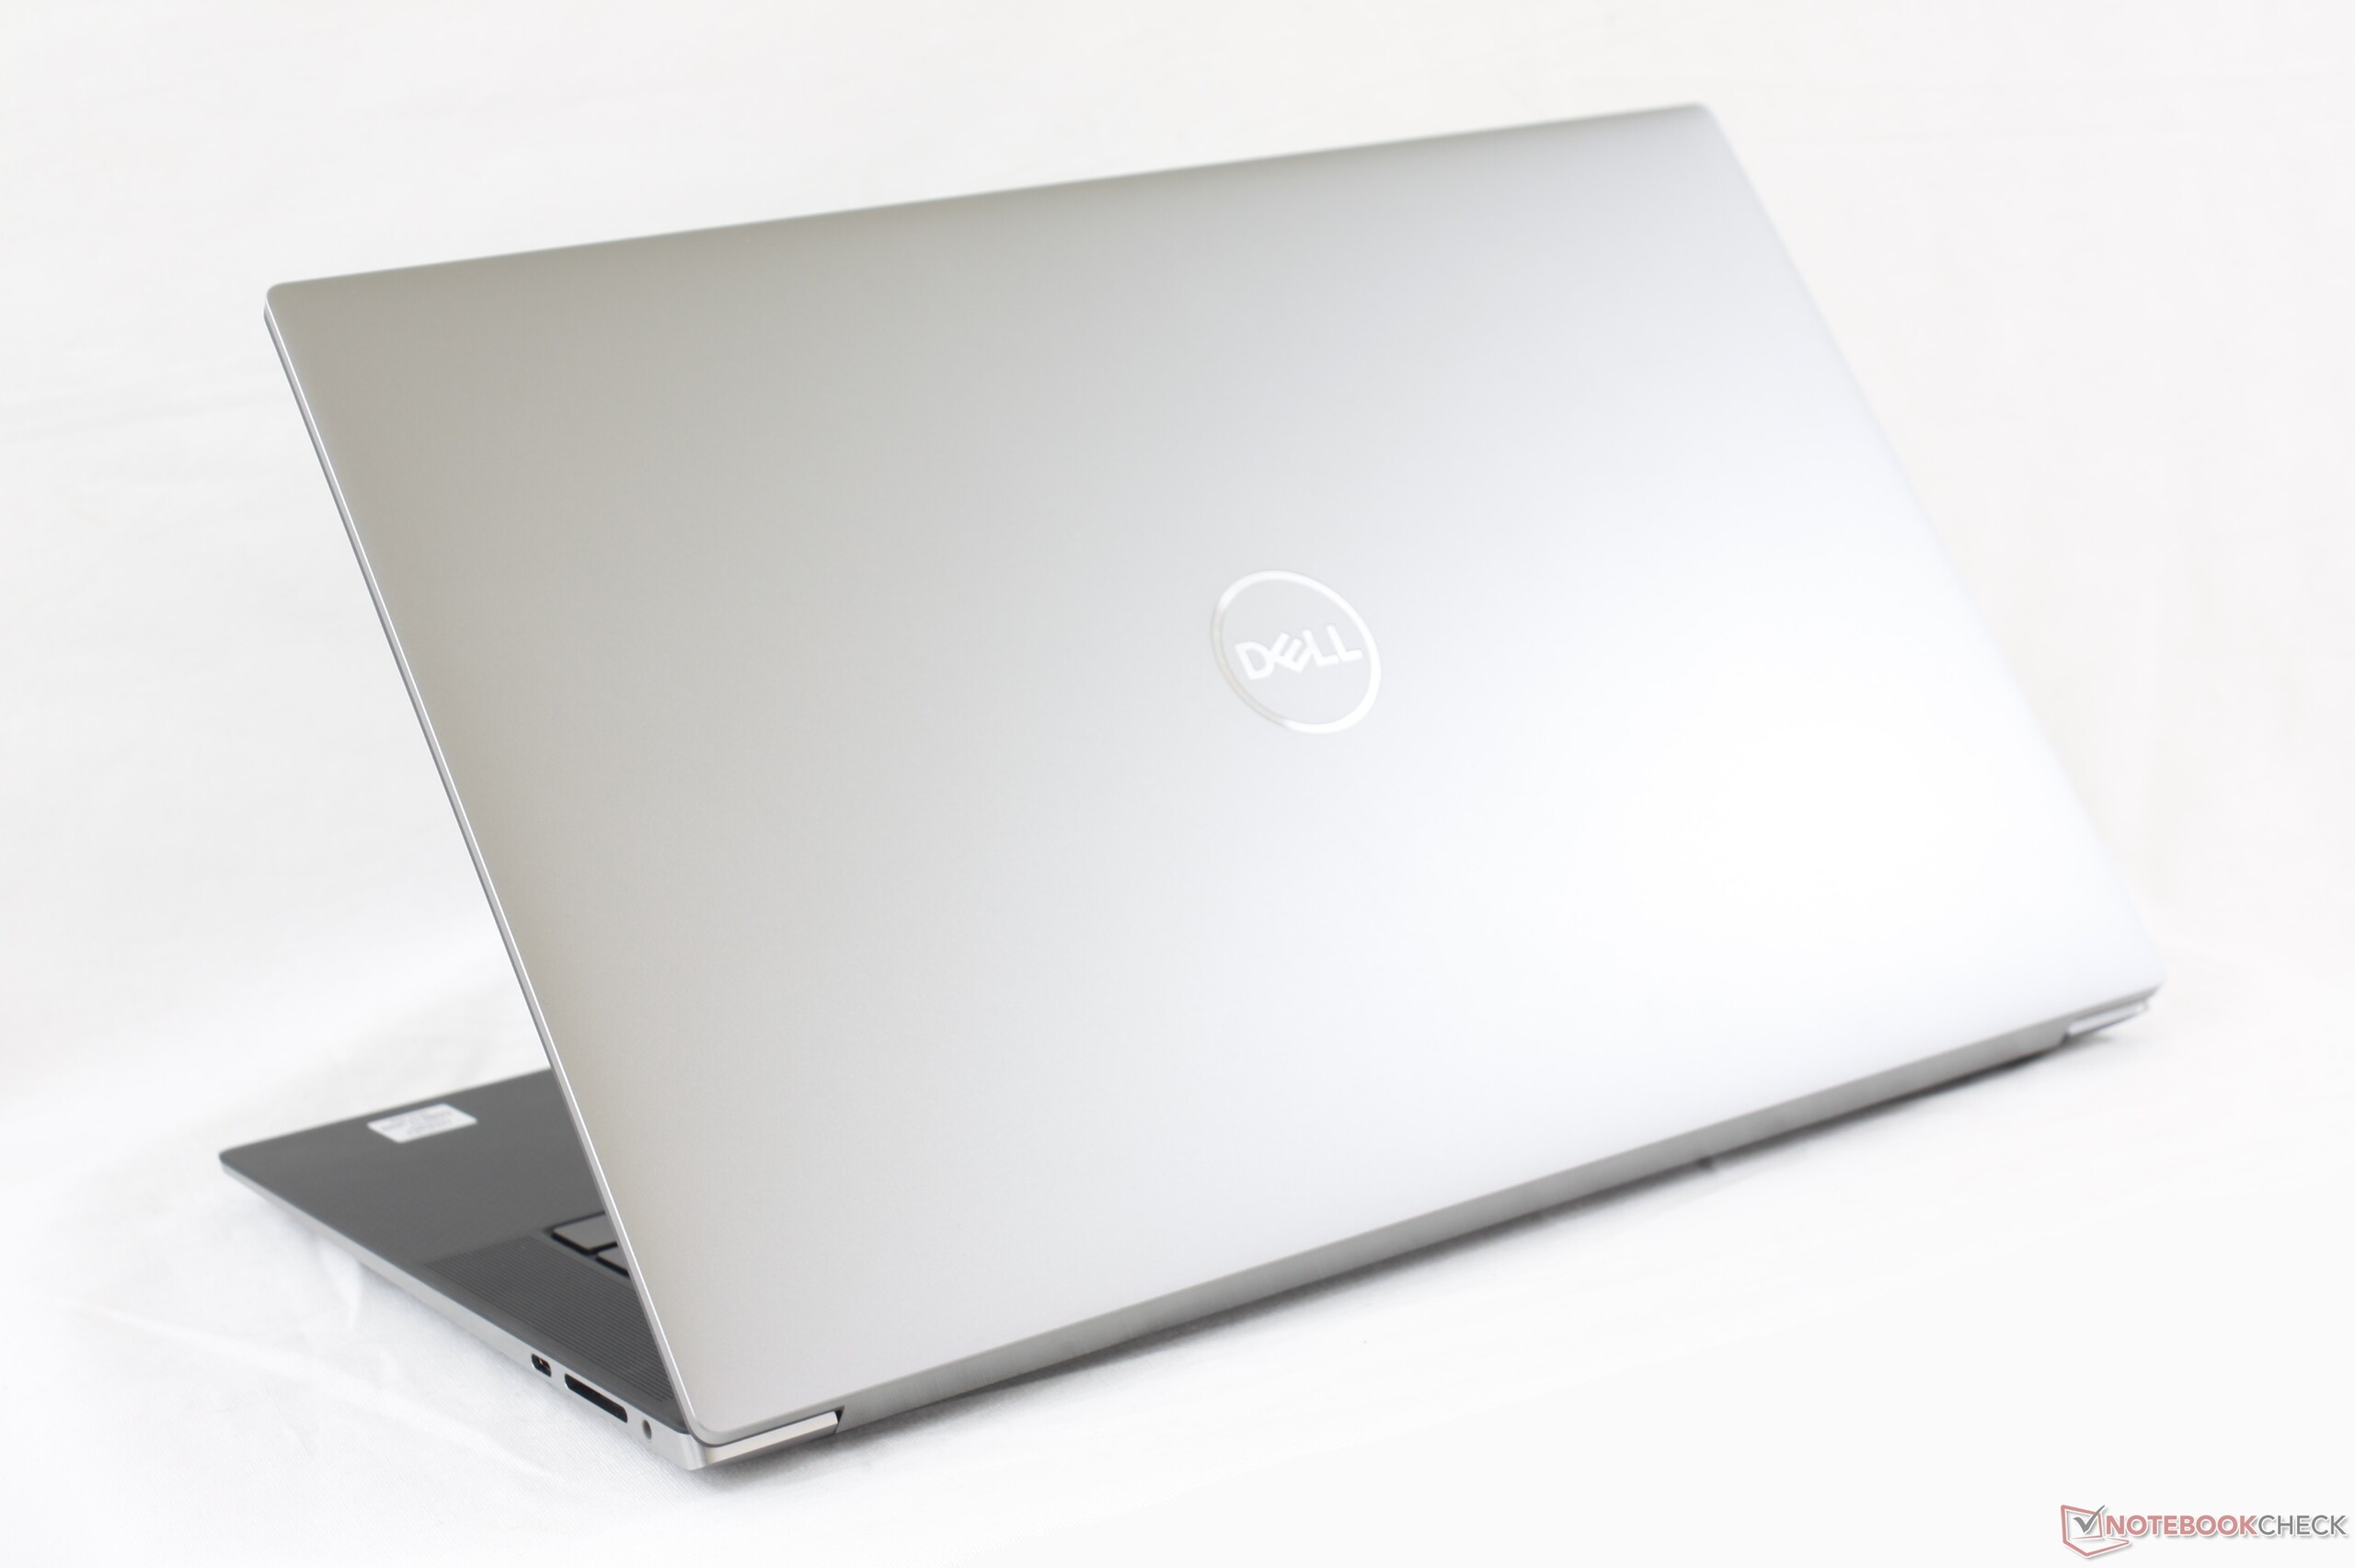
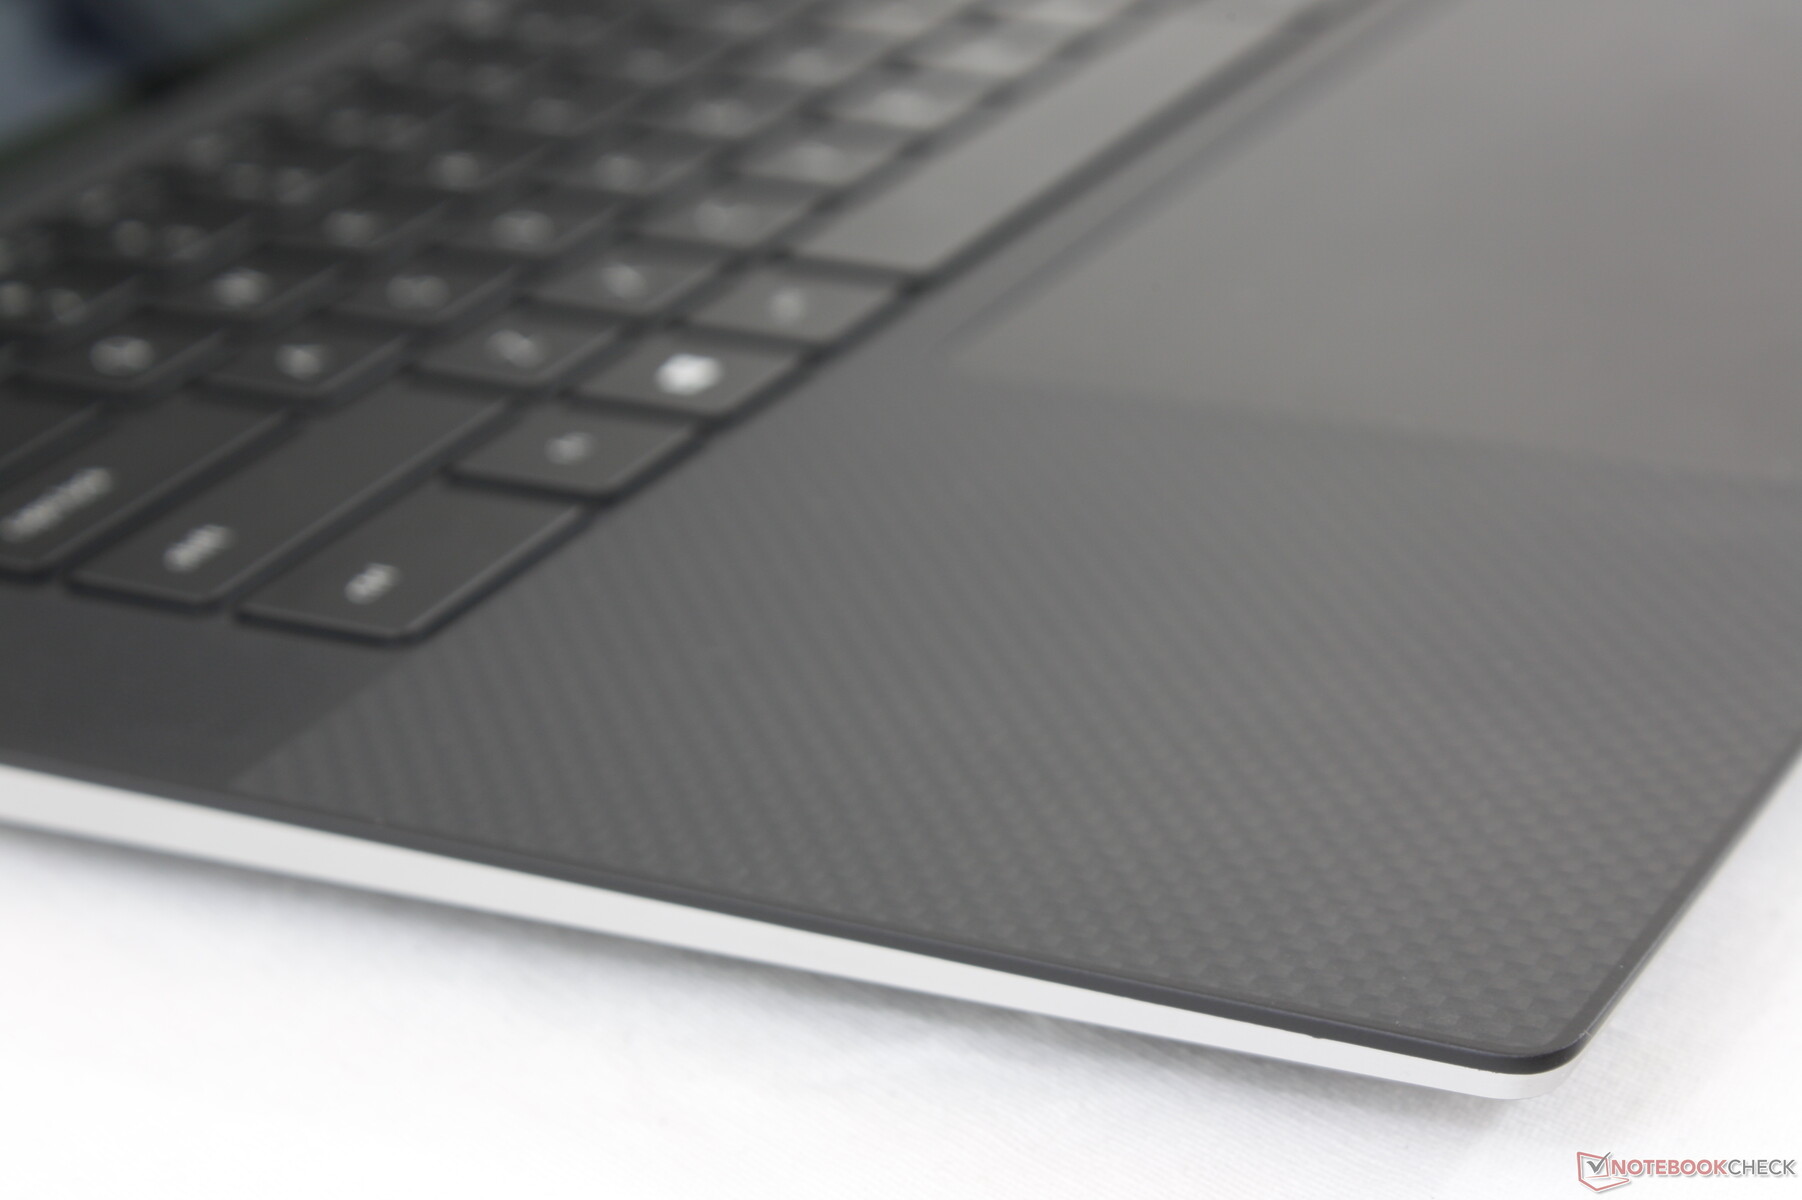
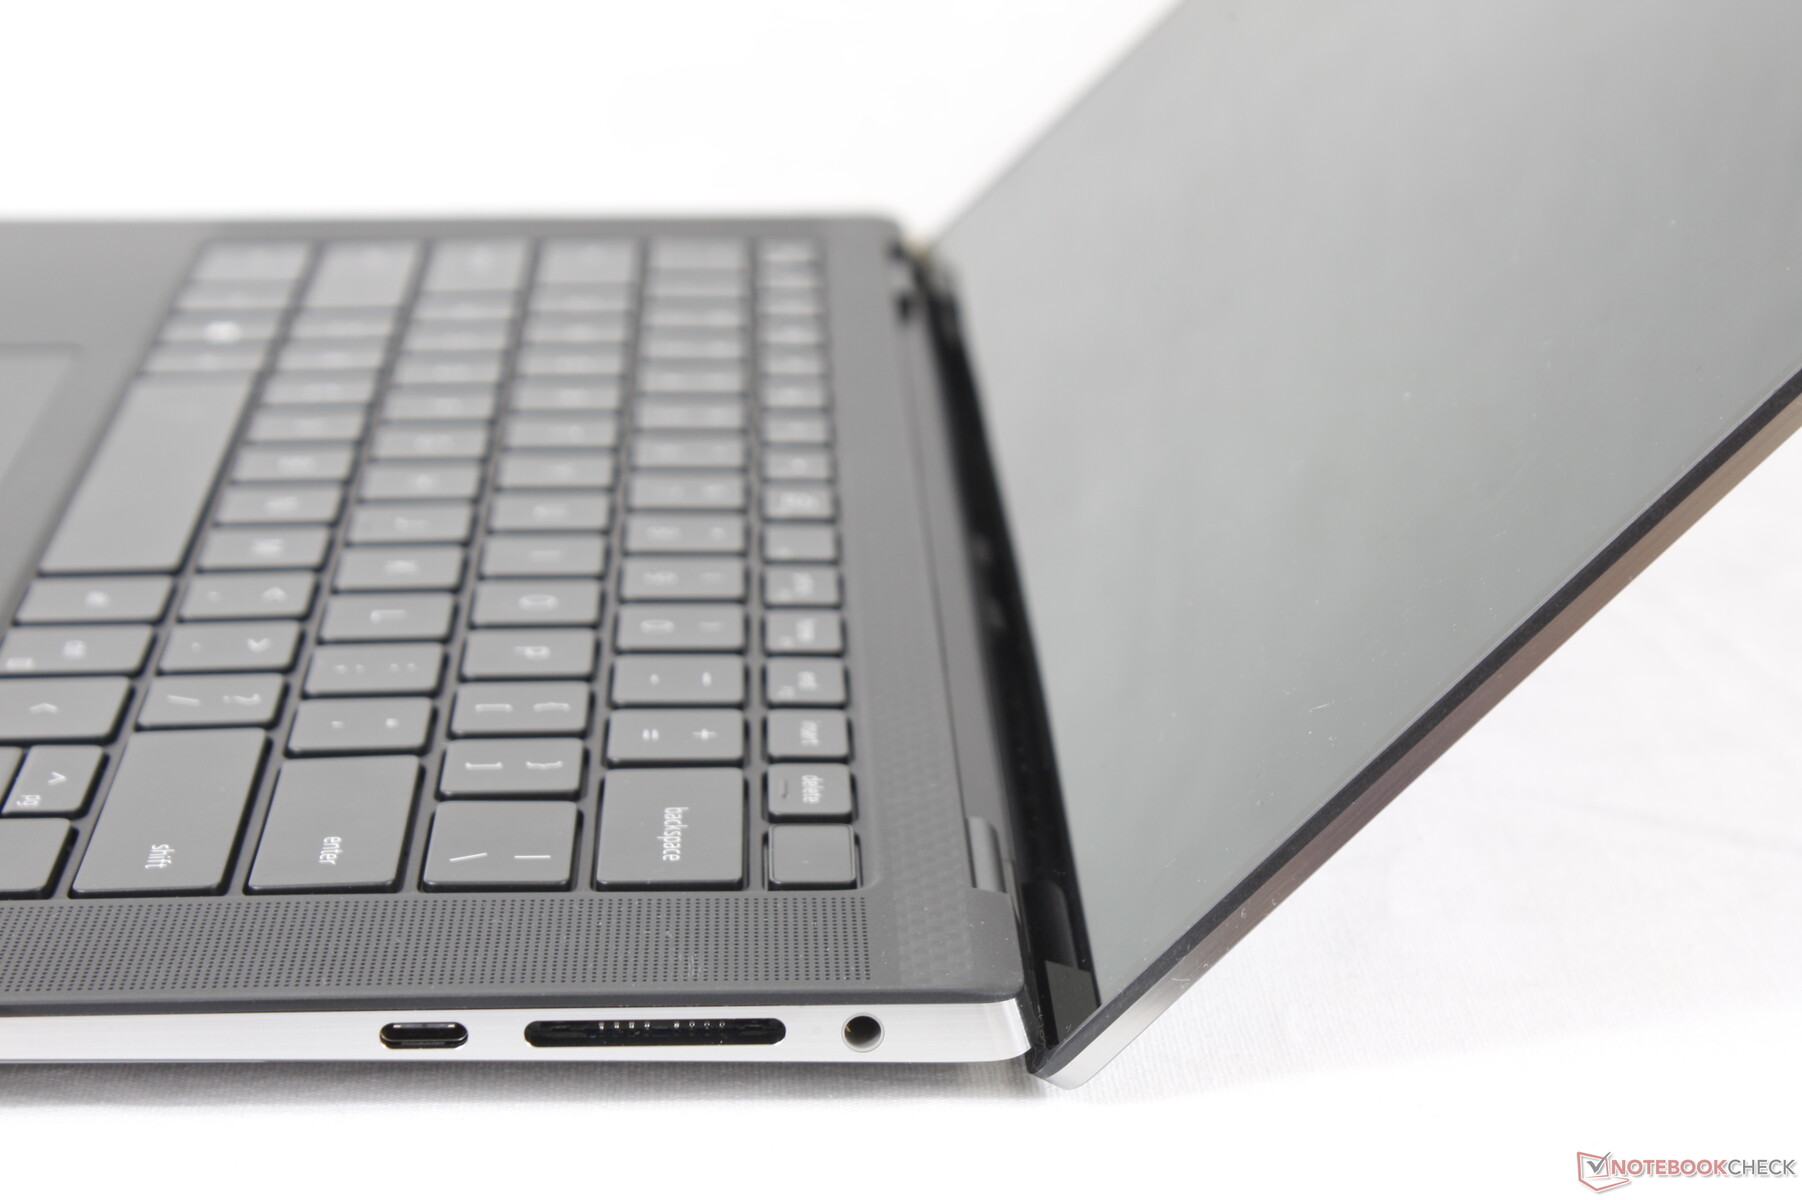
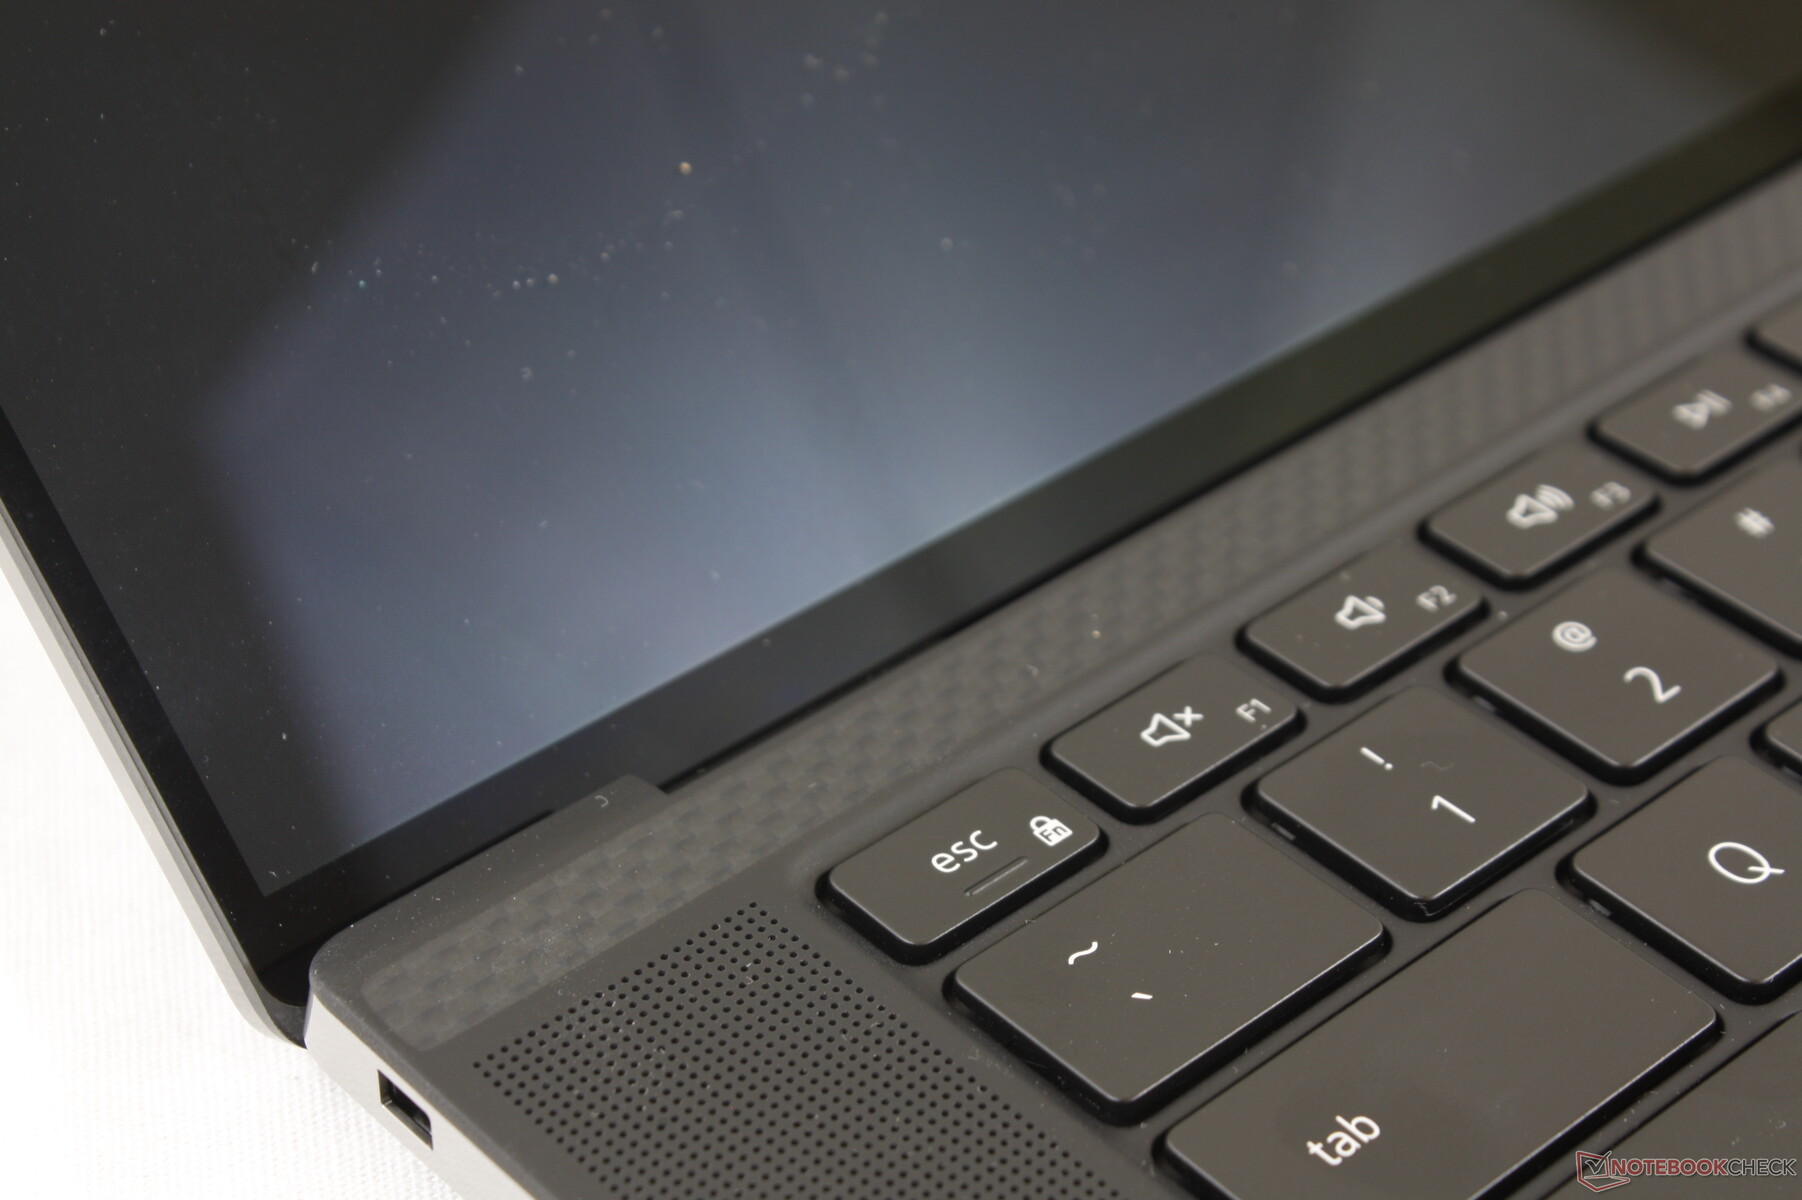
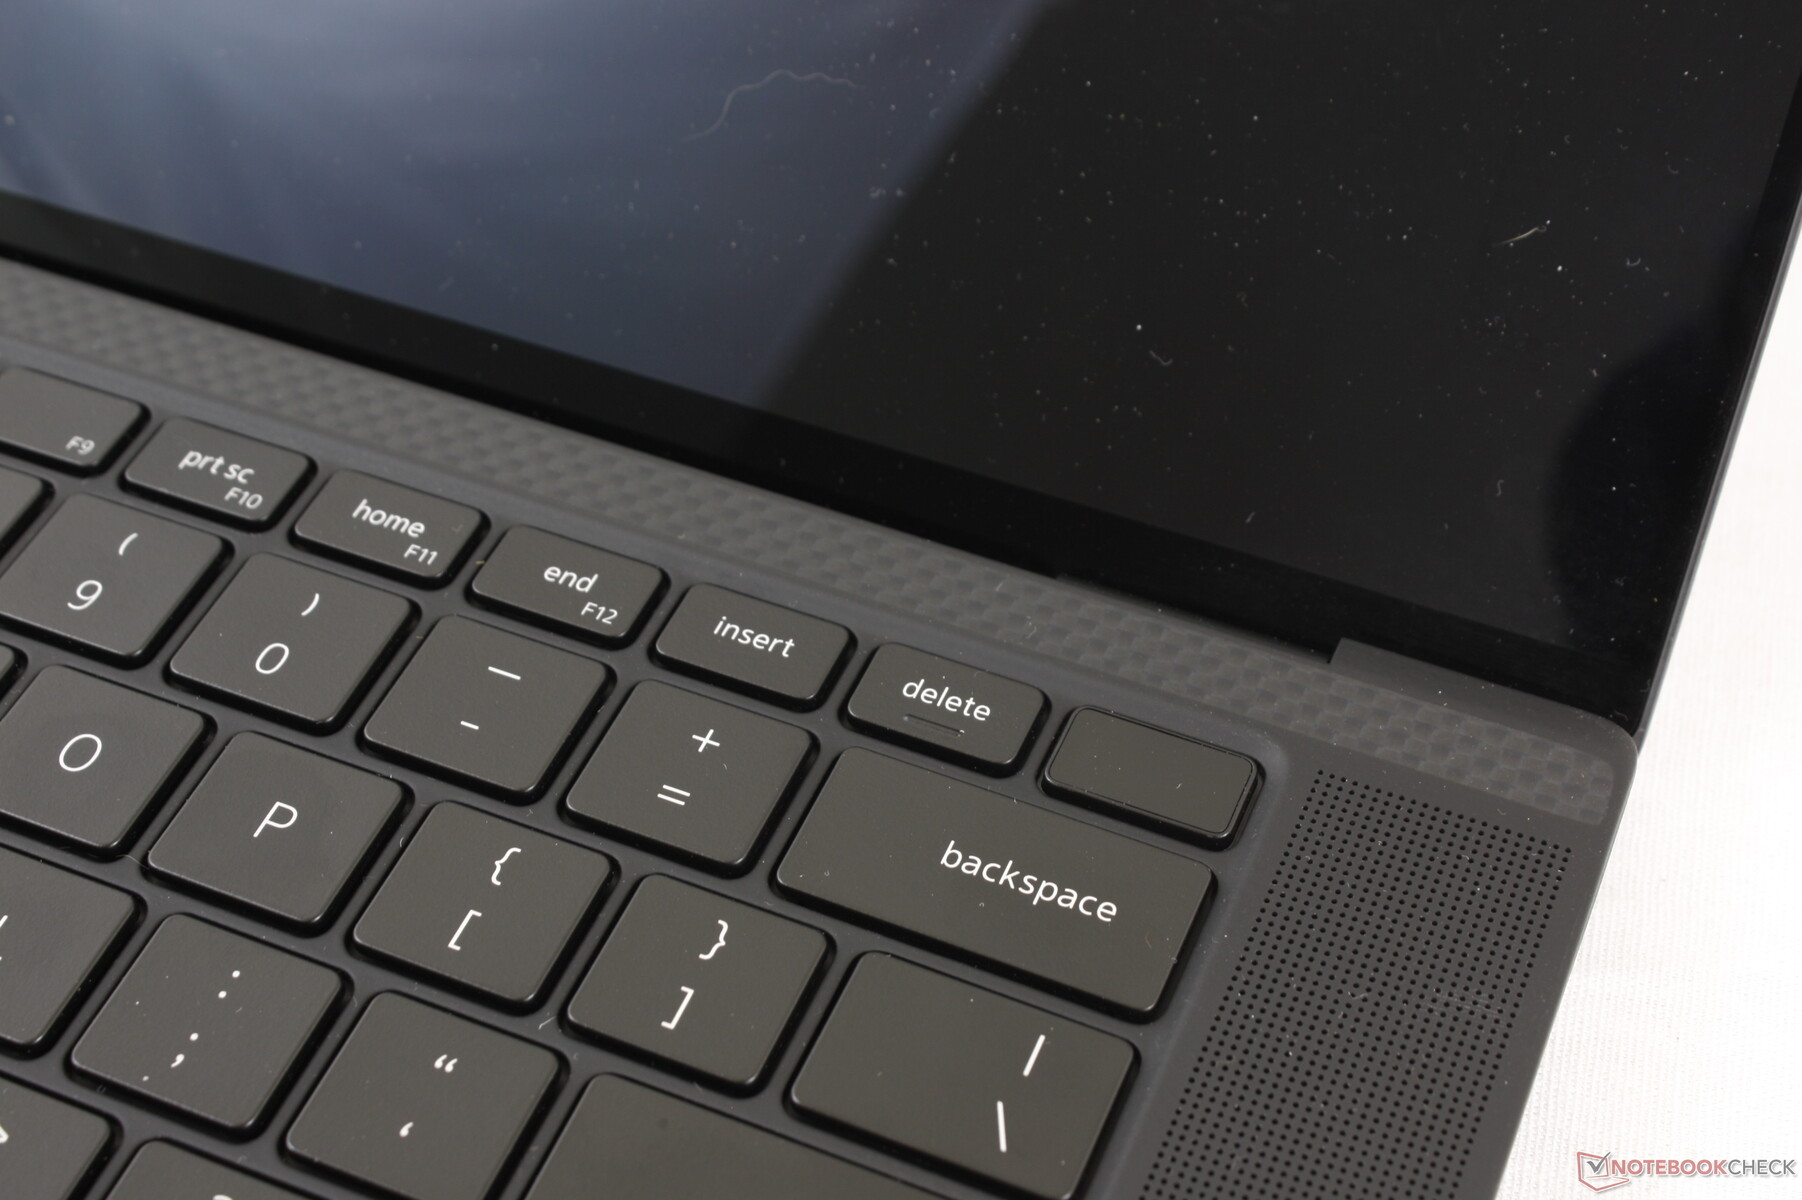
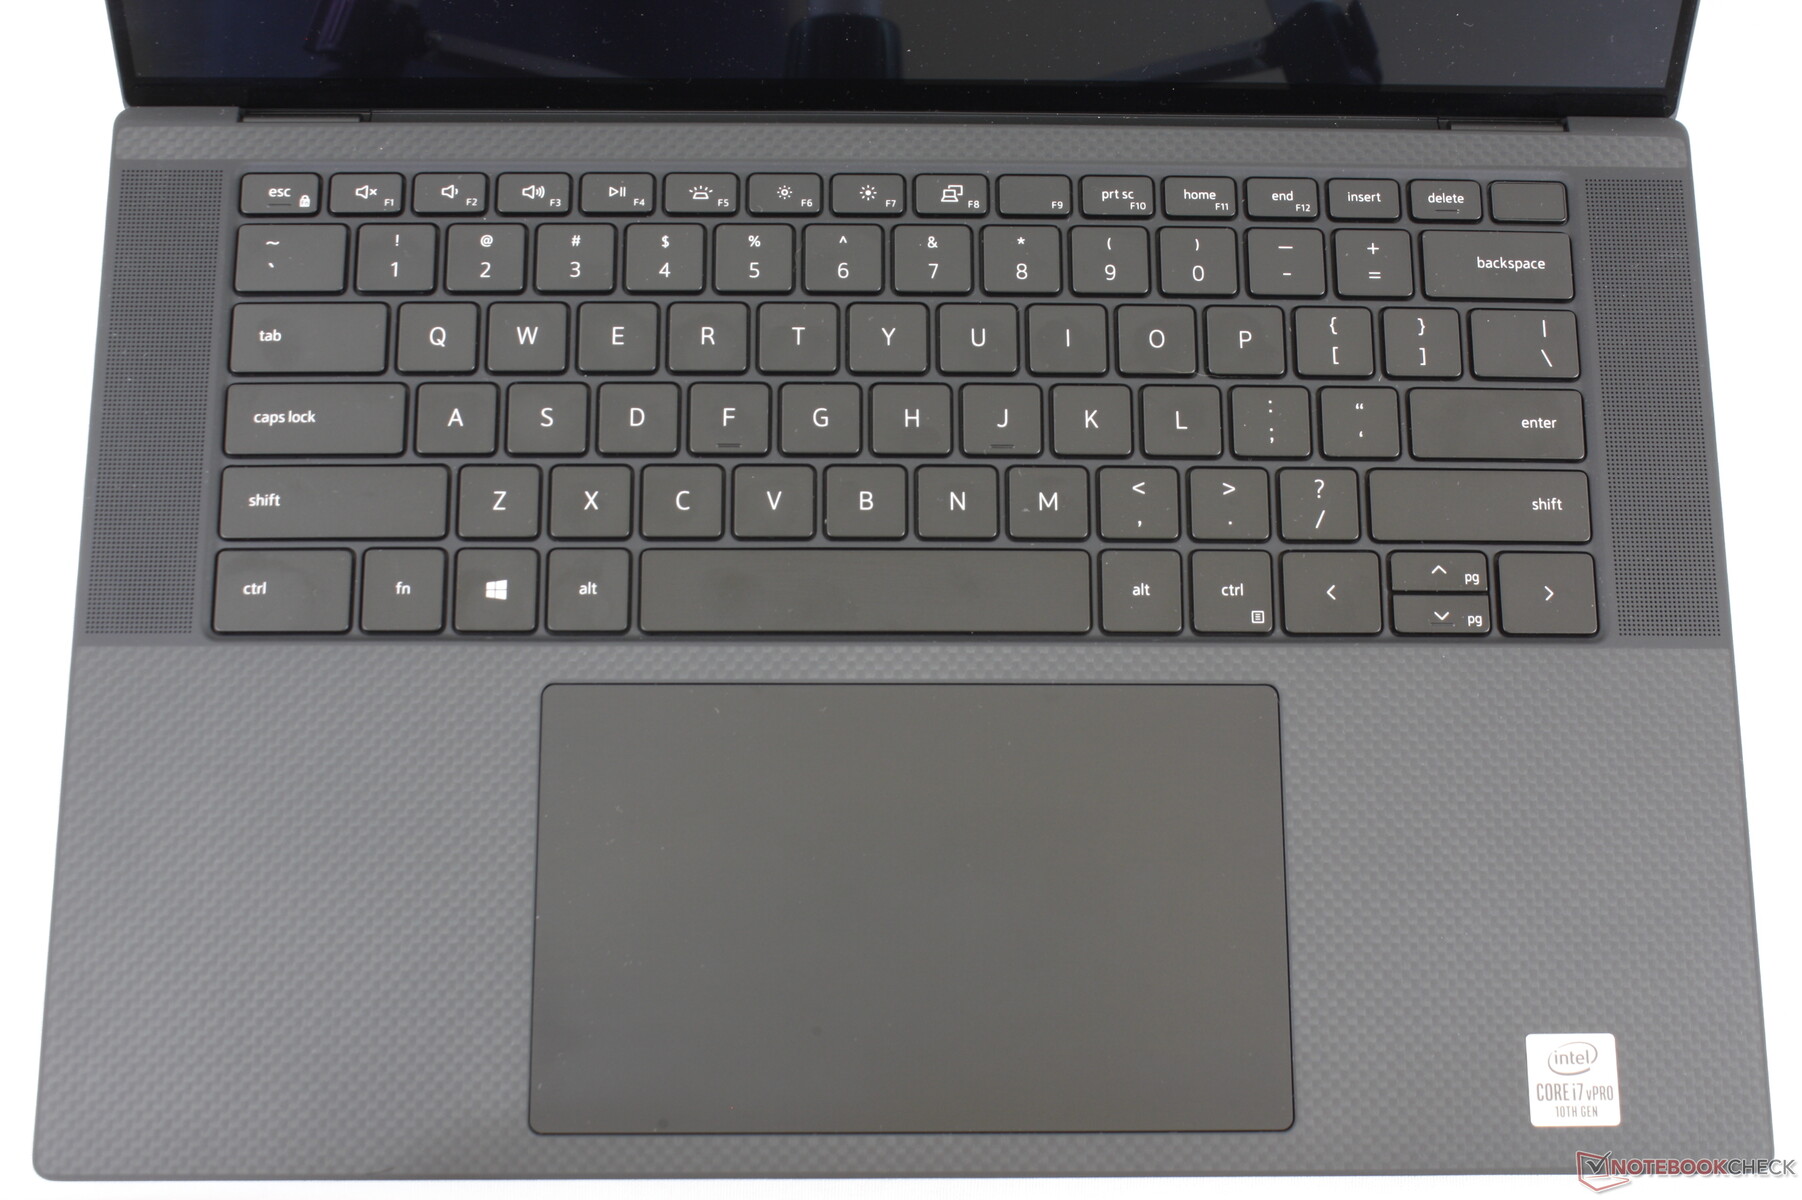
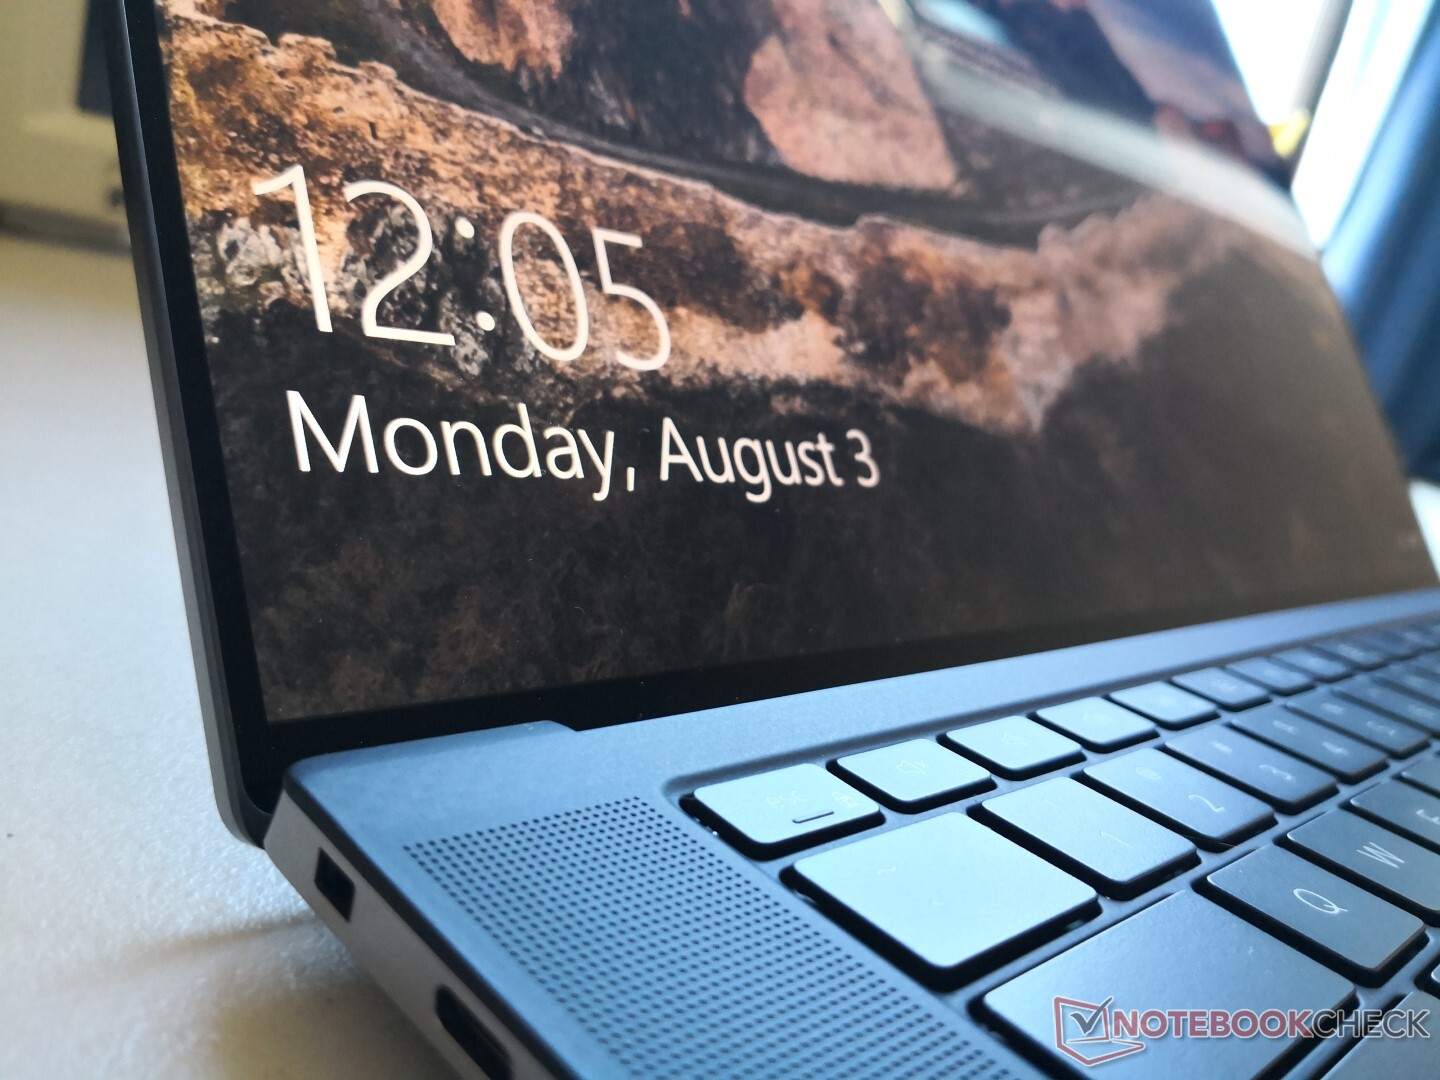
Il telaio è identico all'XPS 15 9500 ma in un tono di grigio opaco più scuro invece che argento. Sarebbe stato bello vedere questa stessa opzione di colore anche per l'XPS normale.
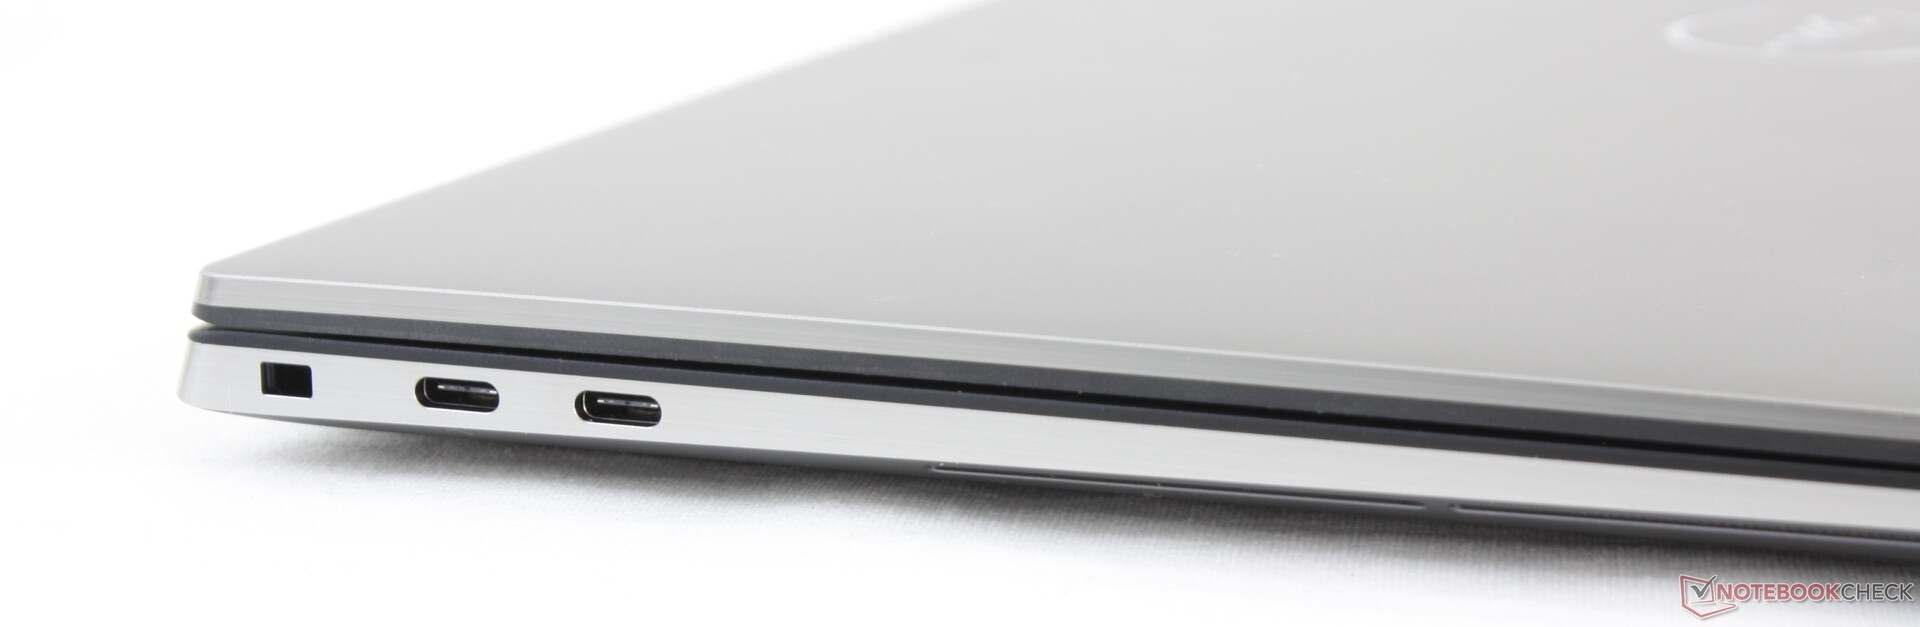
Connettività
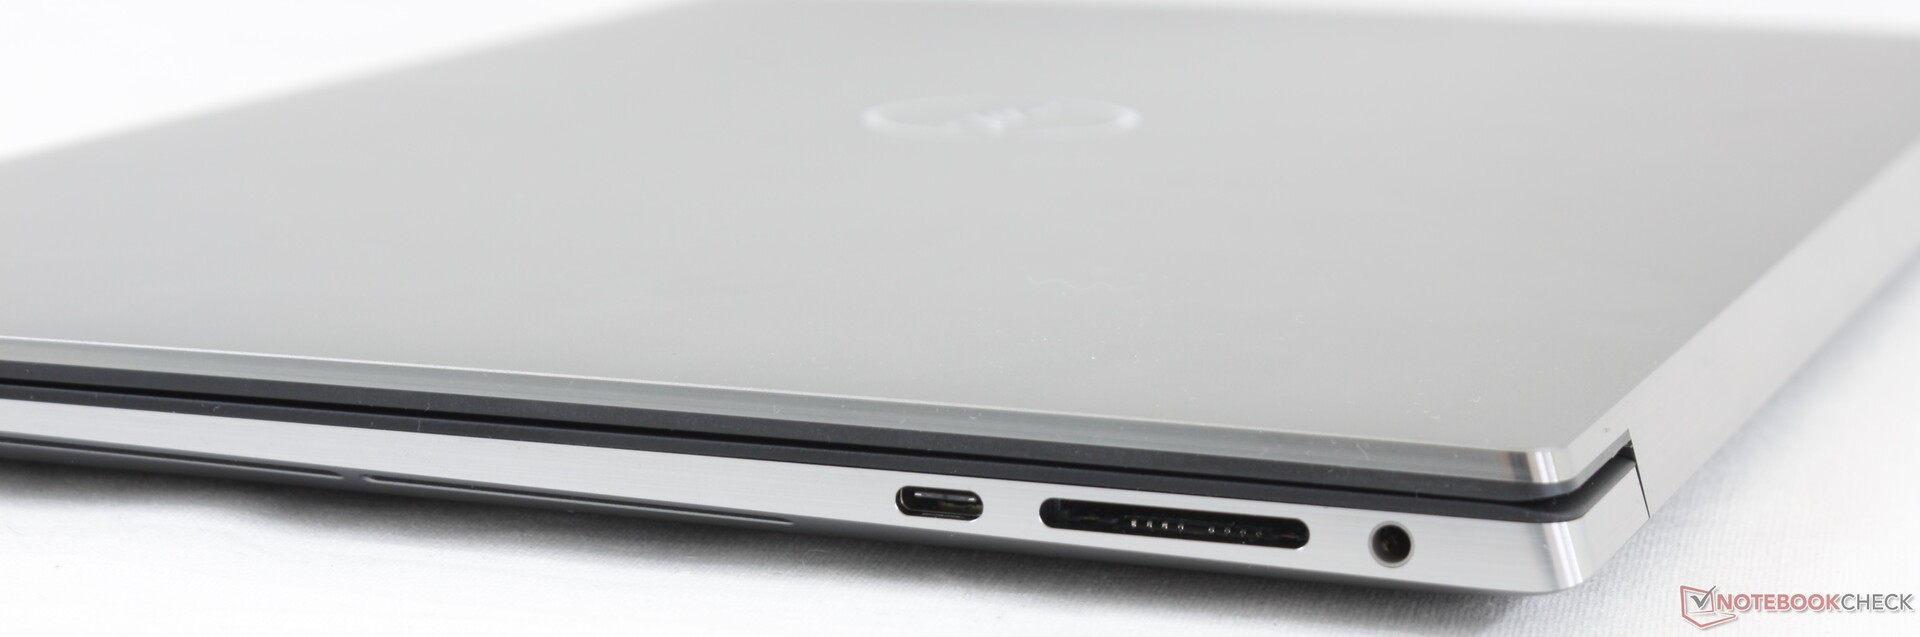
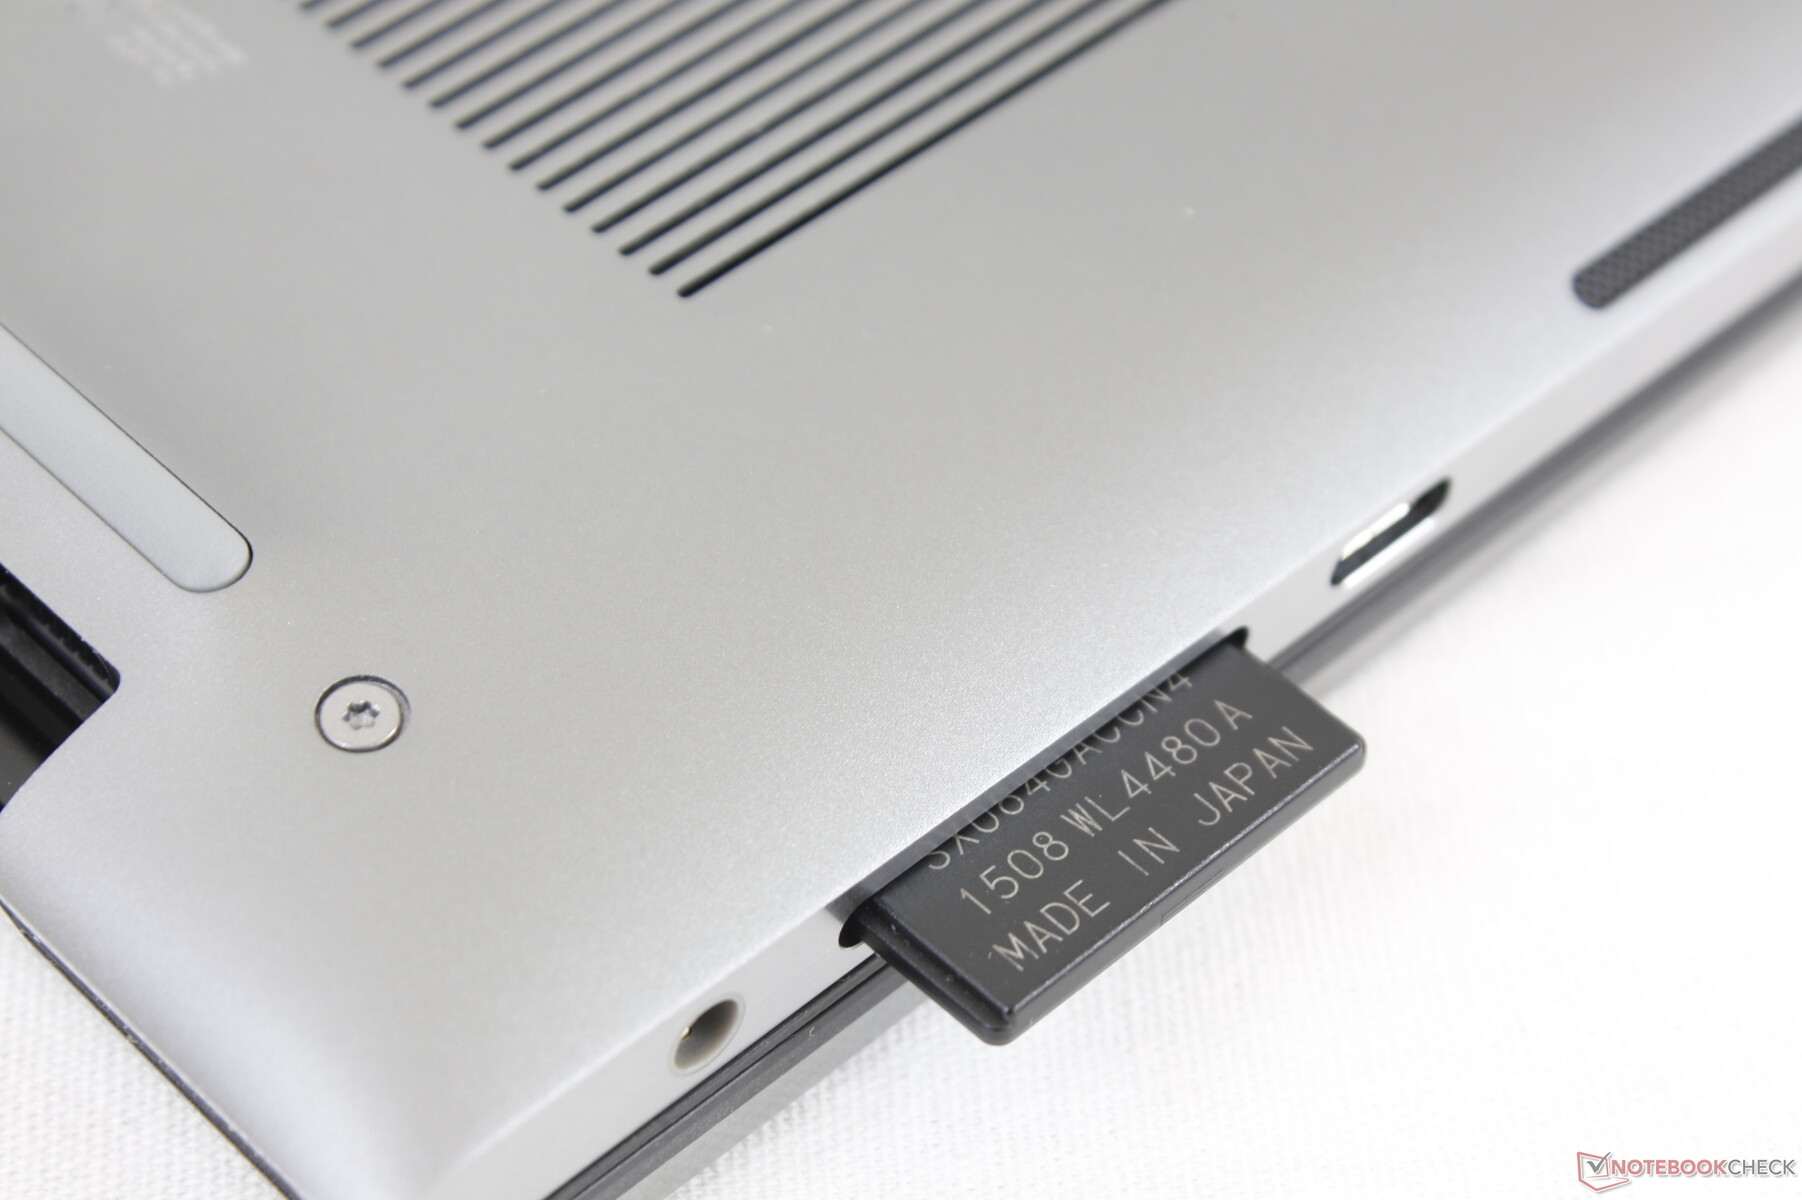
Lettore schede SD
Le velocità di trasferimento dal lettore di schede SD sono estremamente elevate come sull'XPS 15. Il trasferimento di 1 GB di immagini dalla nostra scheda di test UHS-II al desktop richiede solo circa 5-6 secondi.
| SD Card Reader - average JPG Copy Test (av. of 3 runs) | |
| Dell Precision 5550 P91F (Toshiba Exceria Pro SDXC 64 GB UHS-II) | |
| Lenovo ThinkPad P53-20QN000YGE (Toshiba Exceria Pro SDXC 64 GB UHS-II) | |
| Dell Precision 5540 (Toshiba Exceria Pro SDXC 64 GB UHS-II) | |
| Razer Blade 15 Studio Edition (Toshiba Exceria Pro SDXC 64 GB UHS-II) | |
Comunicazioni
L'Intel AX201 viene fornito di serie per la connettività Wi-Fi 6 e Bluetooth 5.1. Non abbiamo riscontrato alcun problema quando è stato accoppiato al nostro router di prova Netgear RAX200.
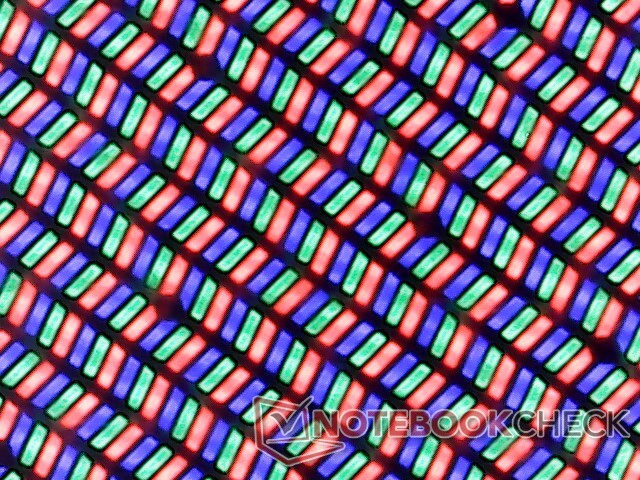
Webcam


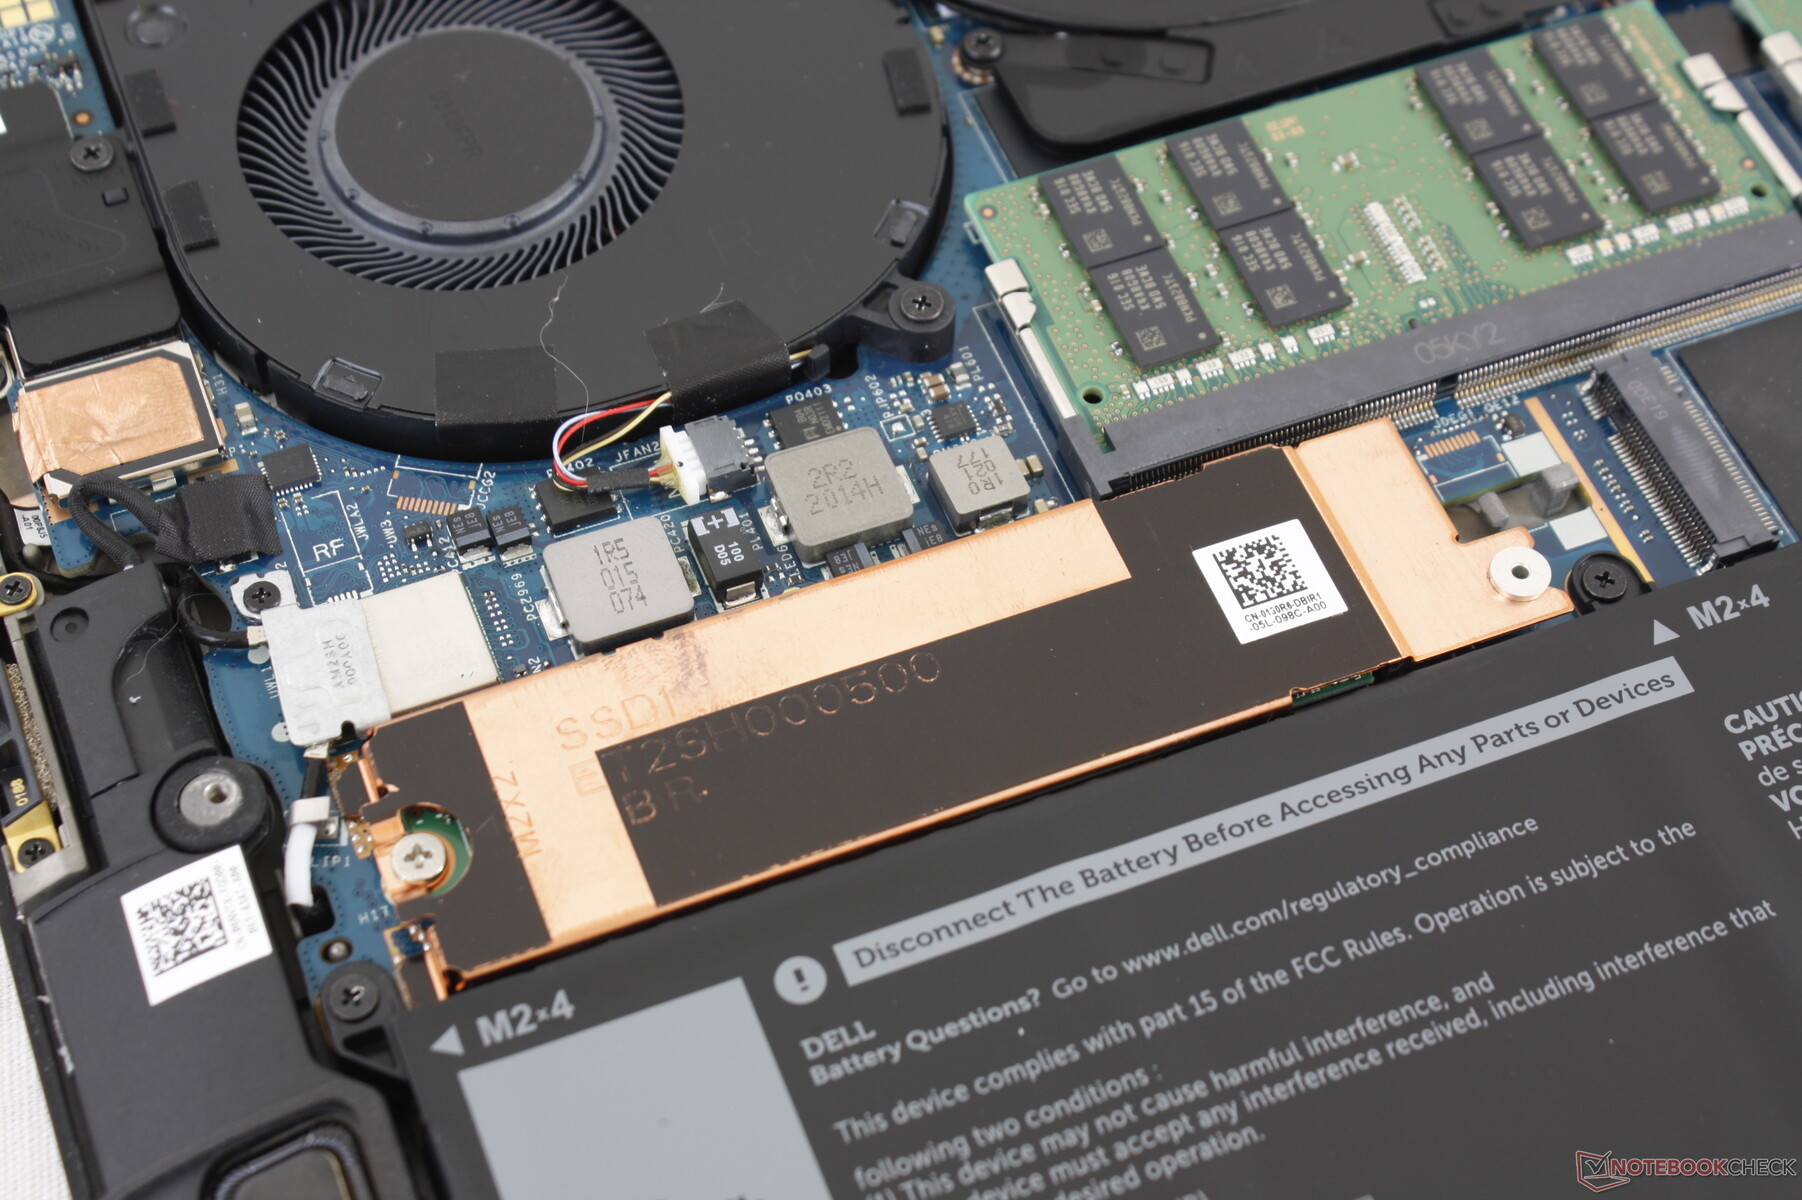
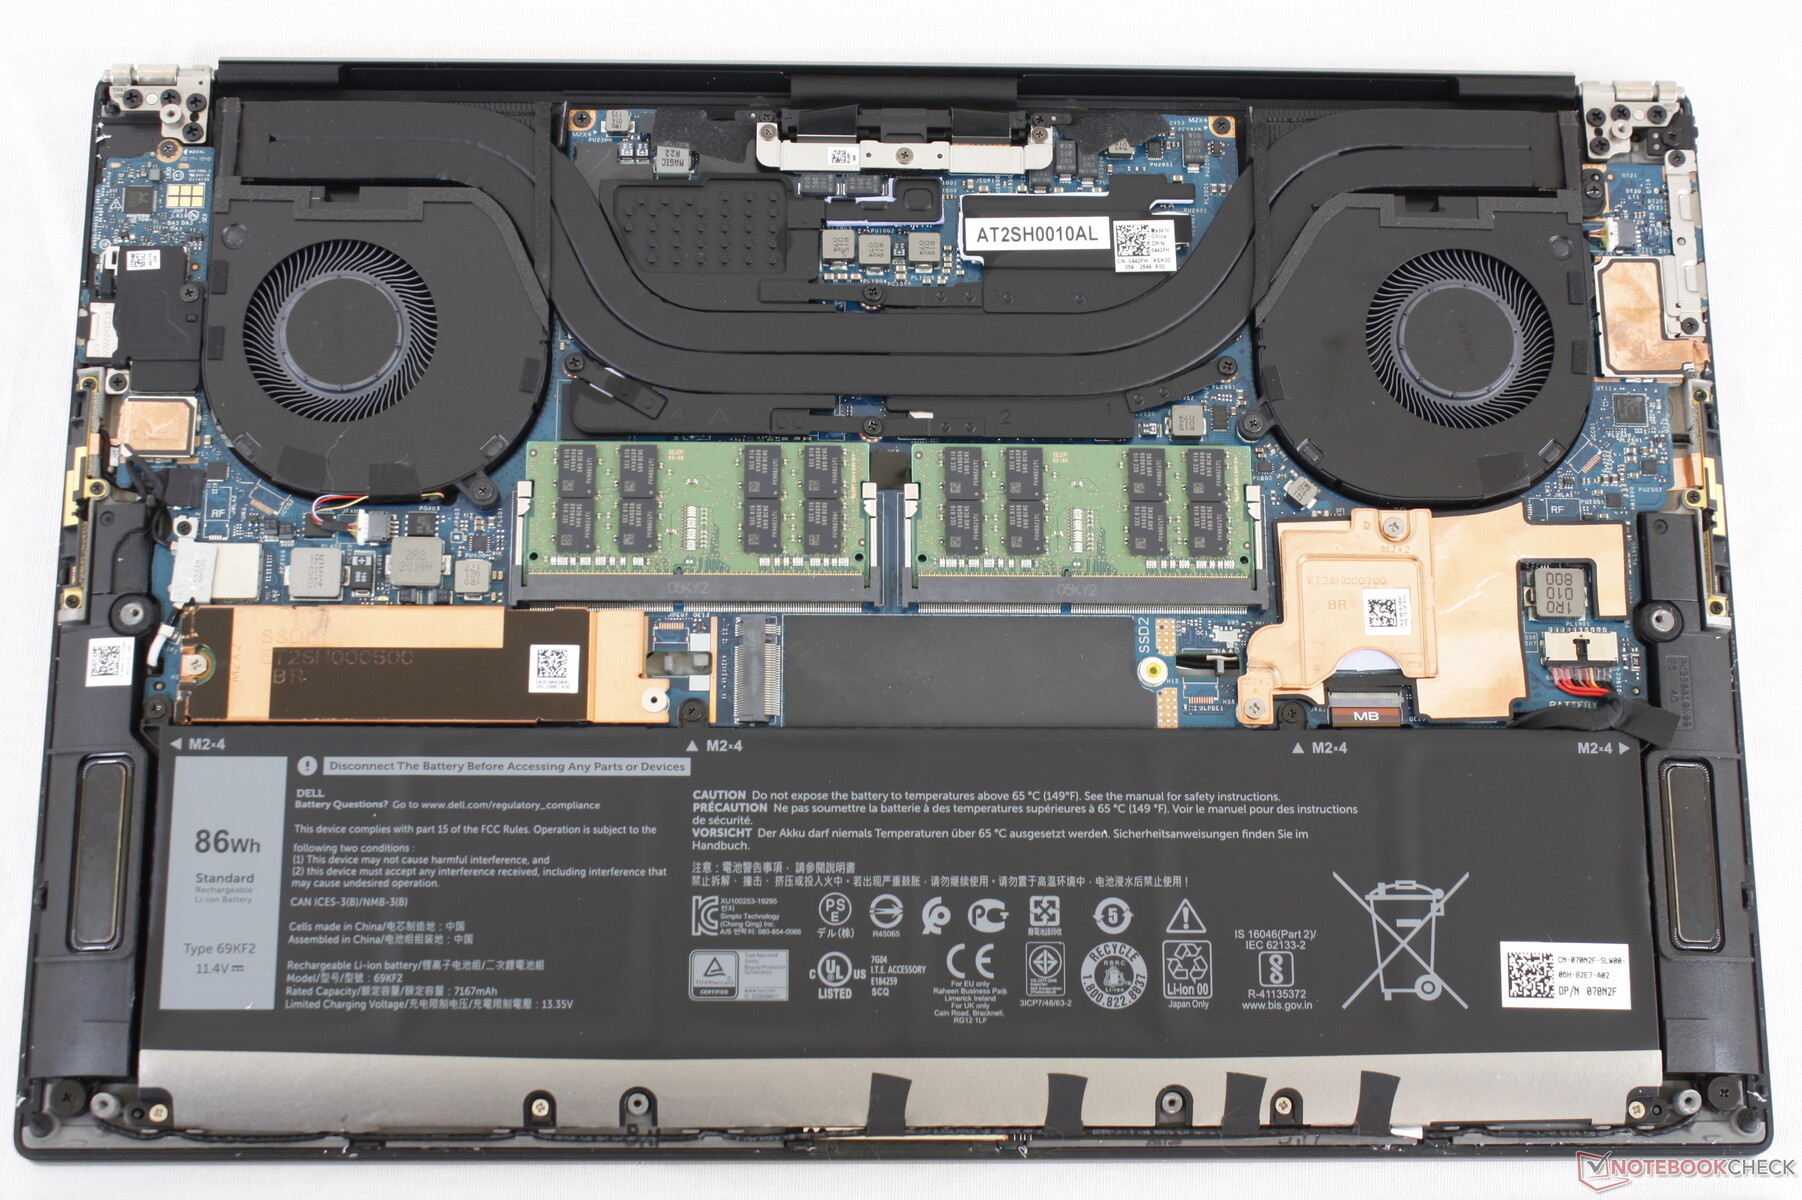
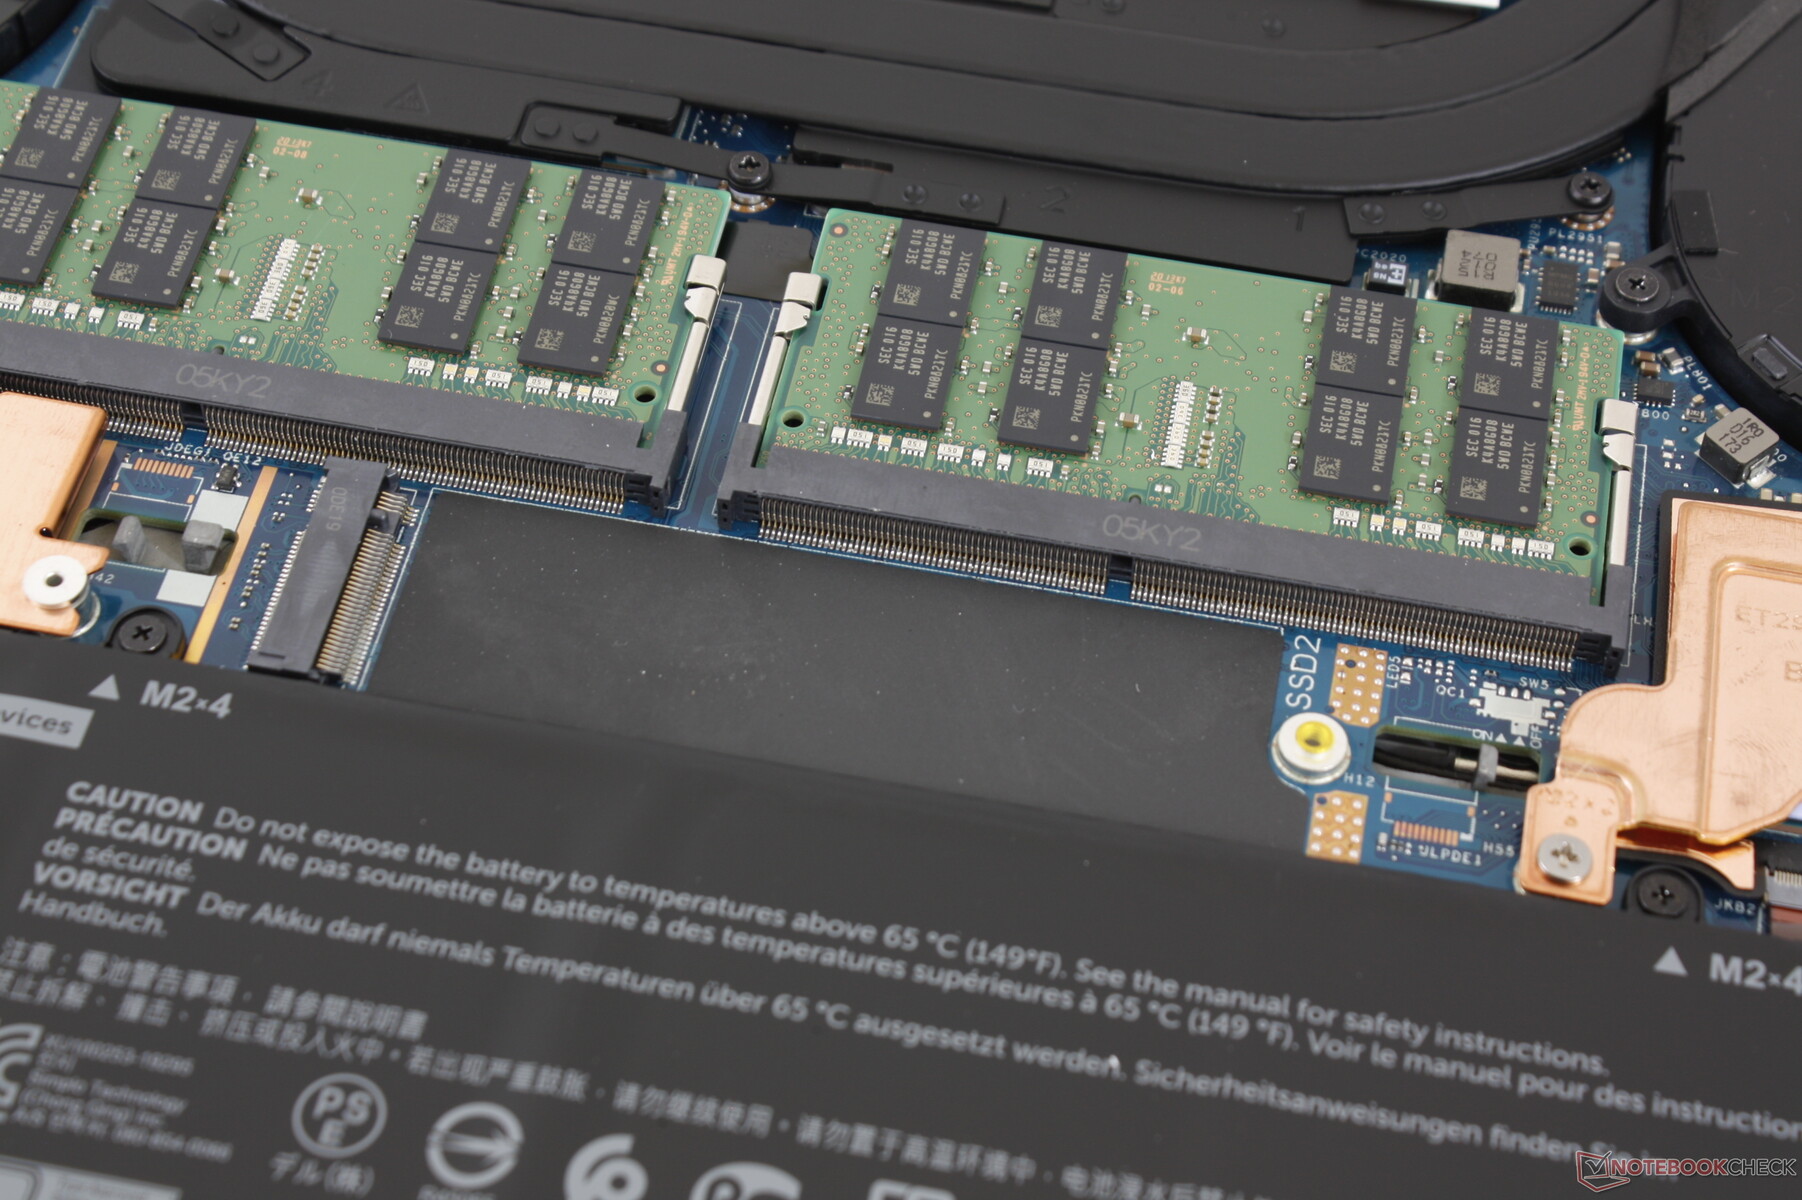
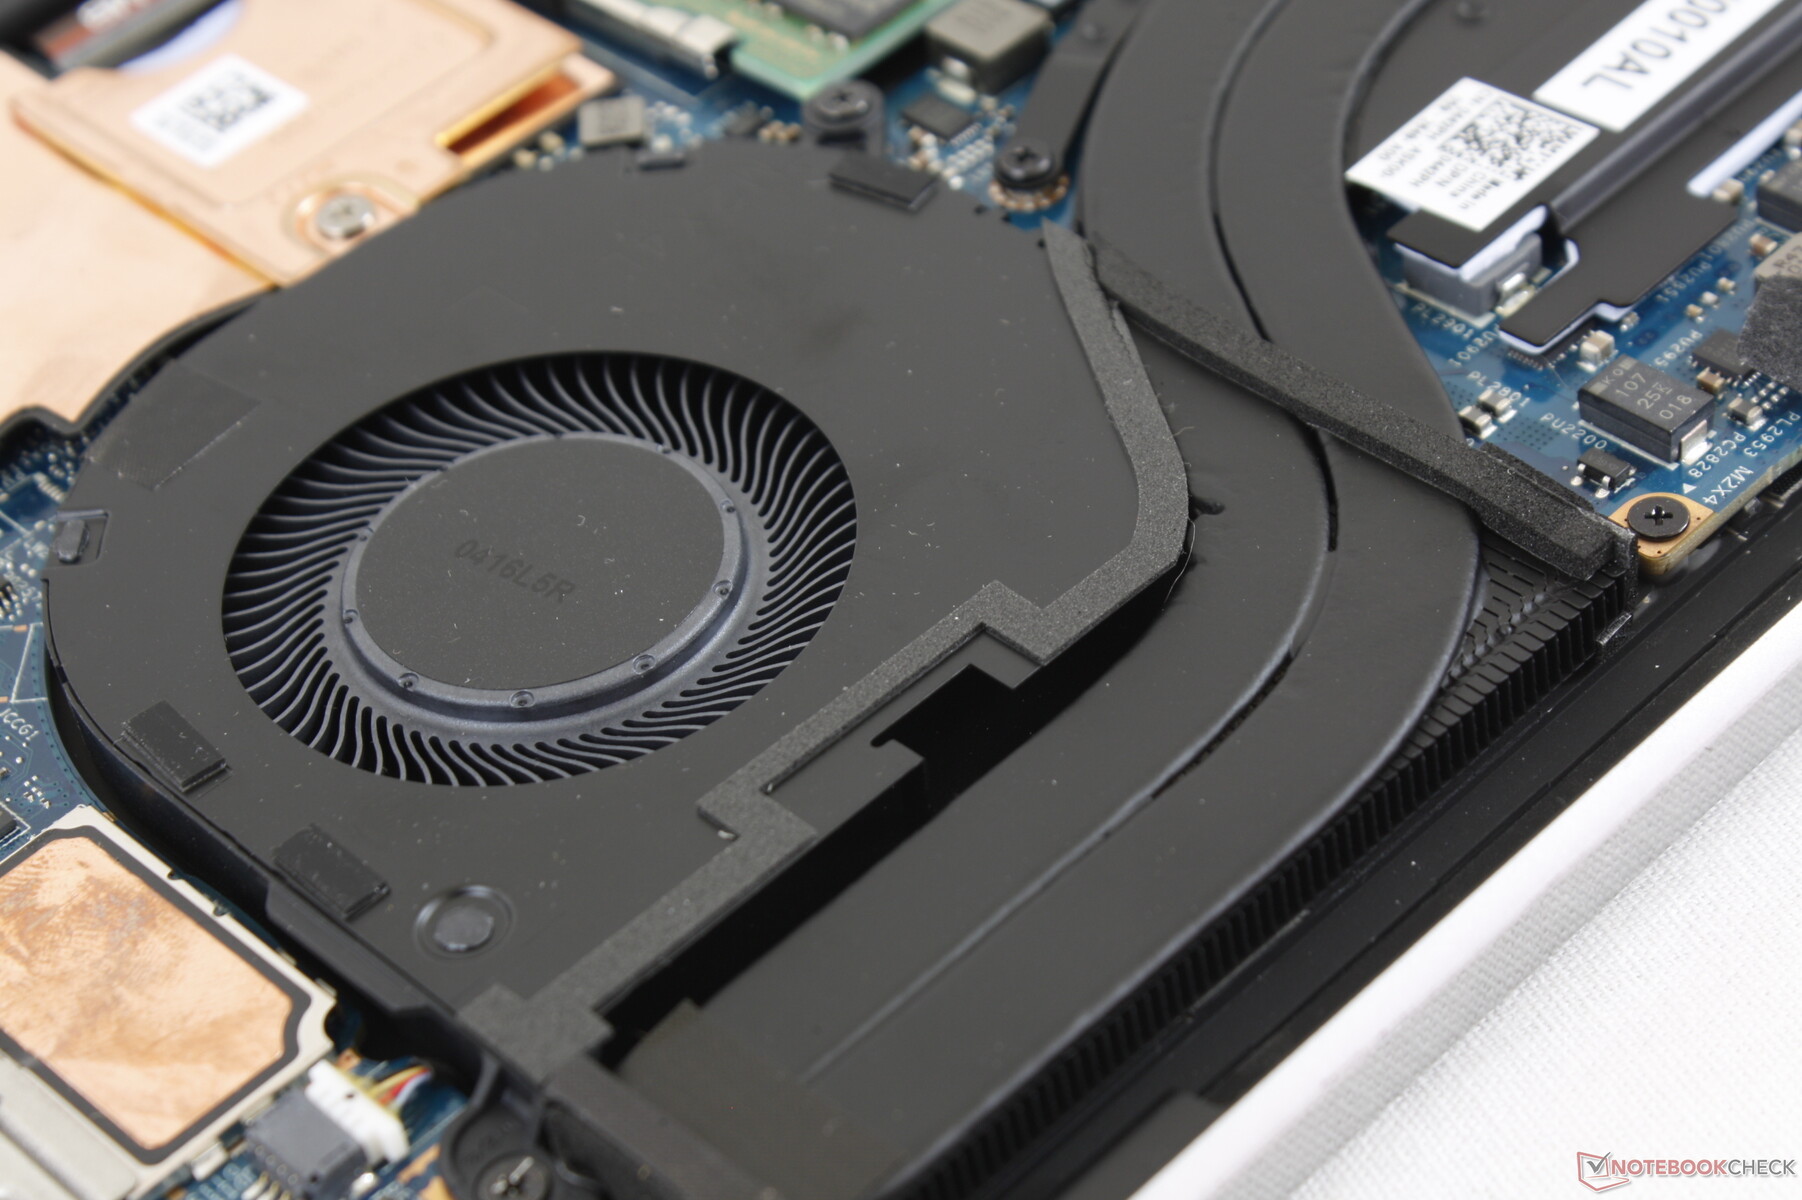
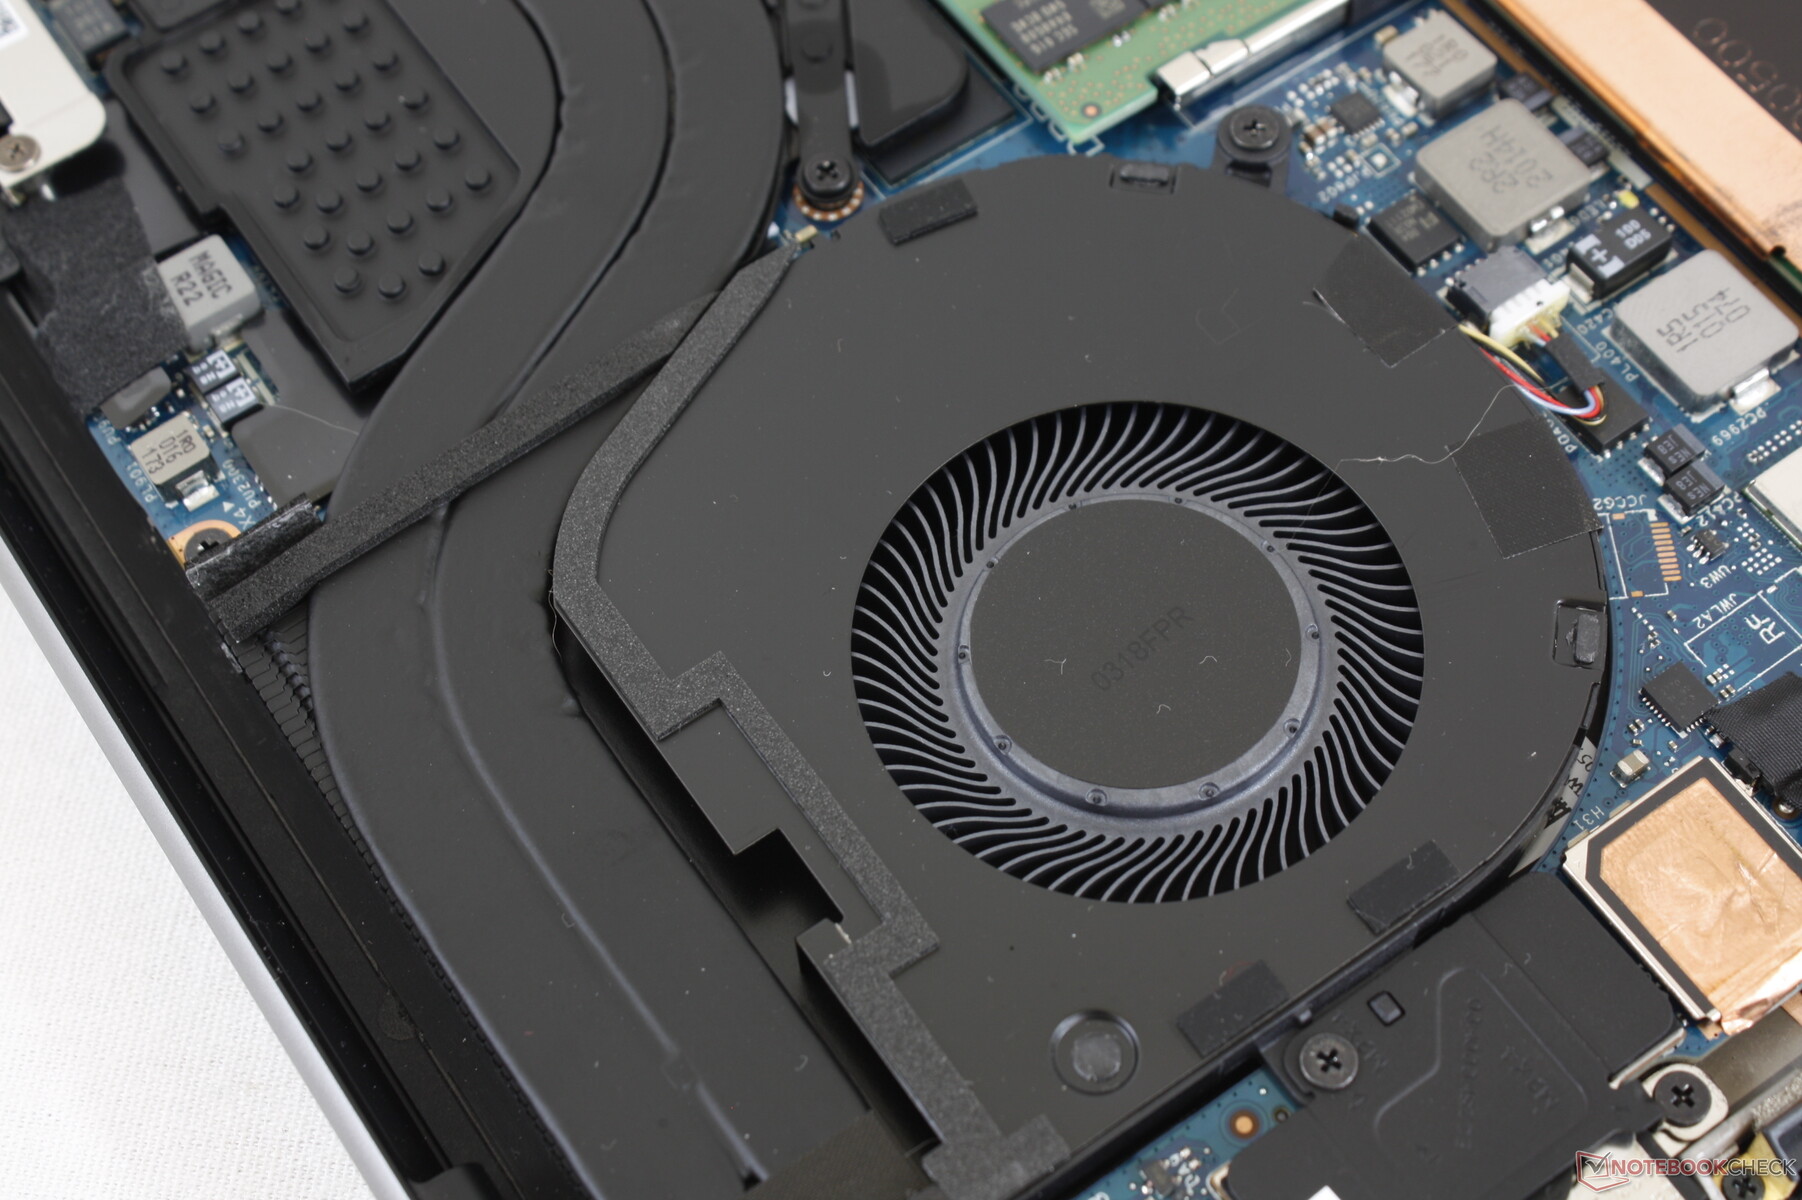
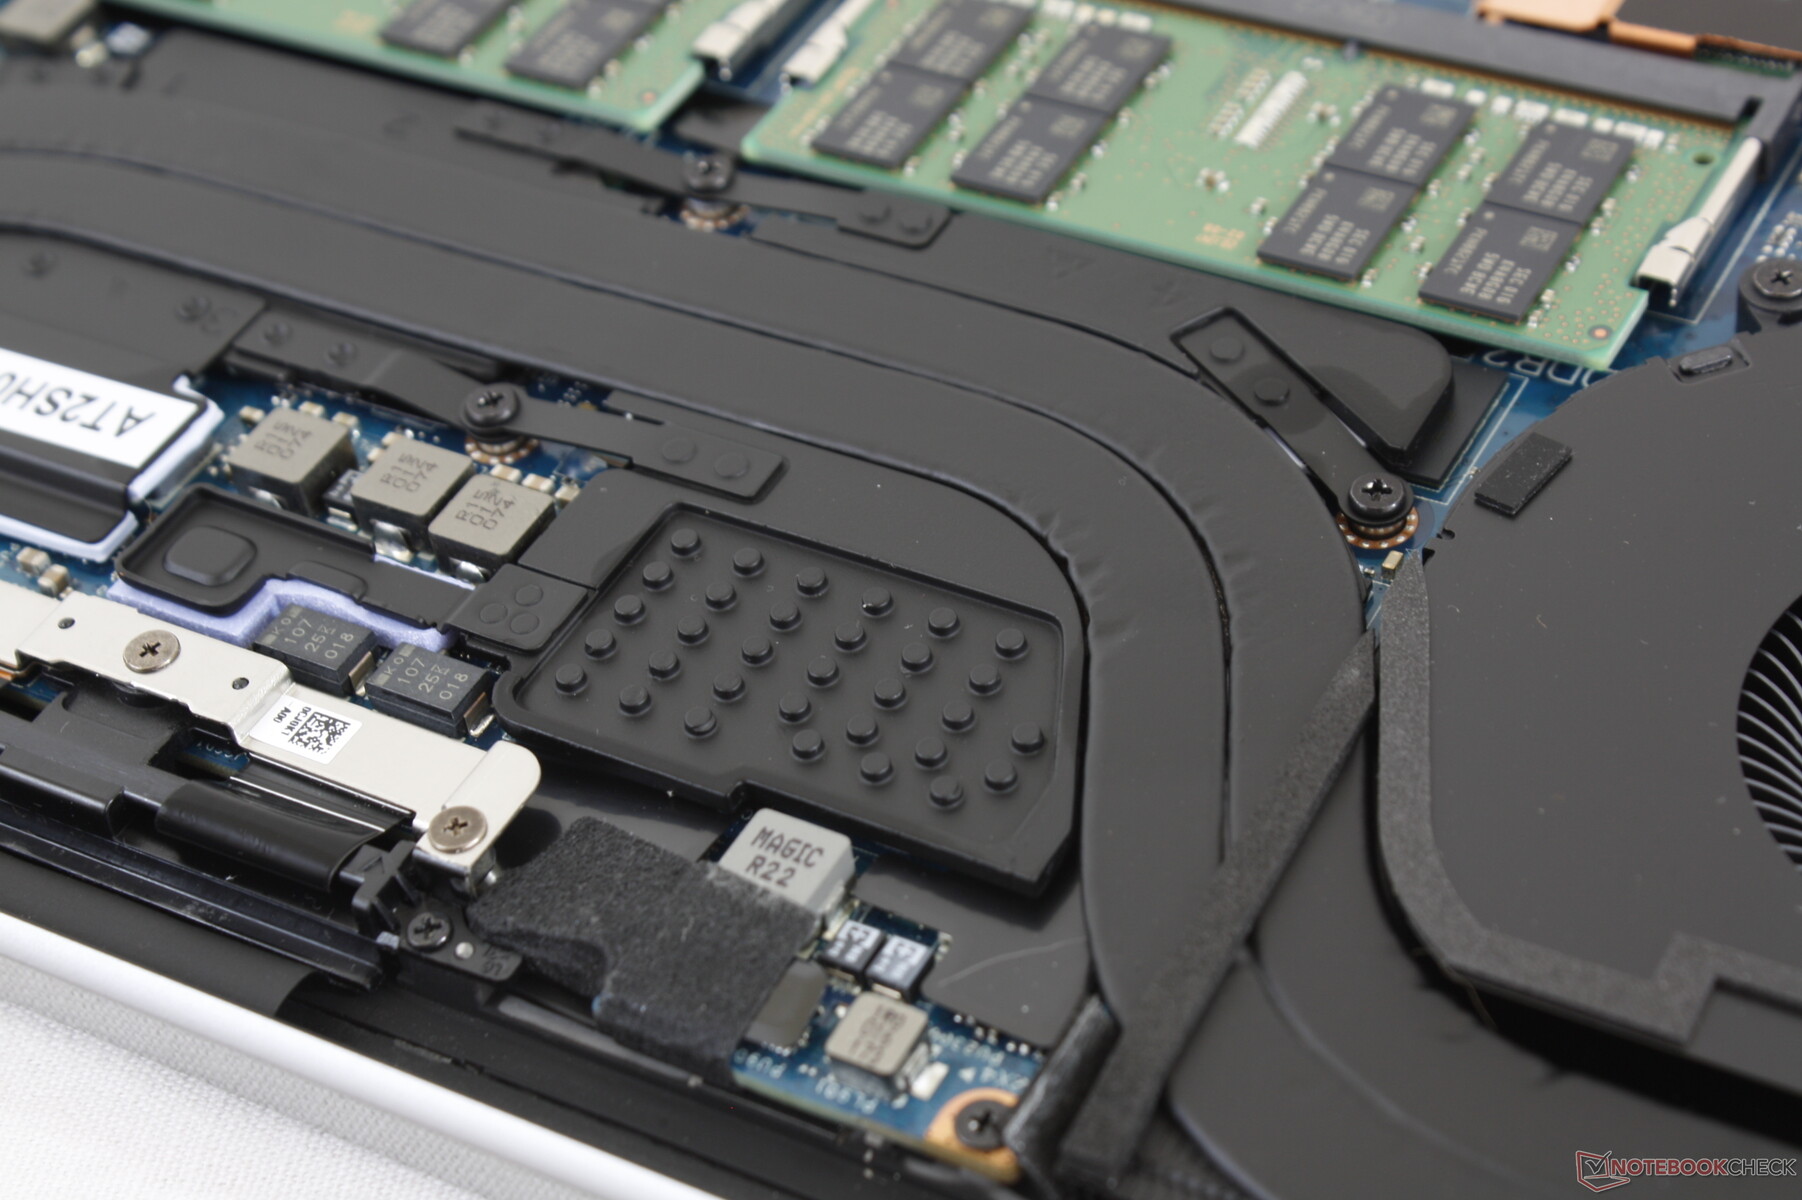
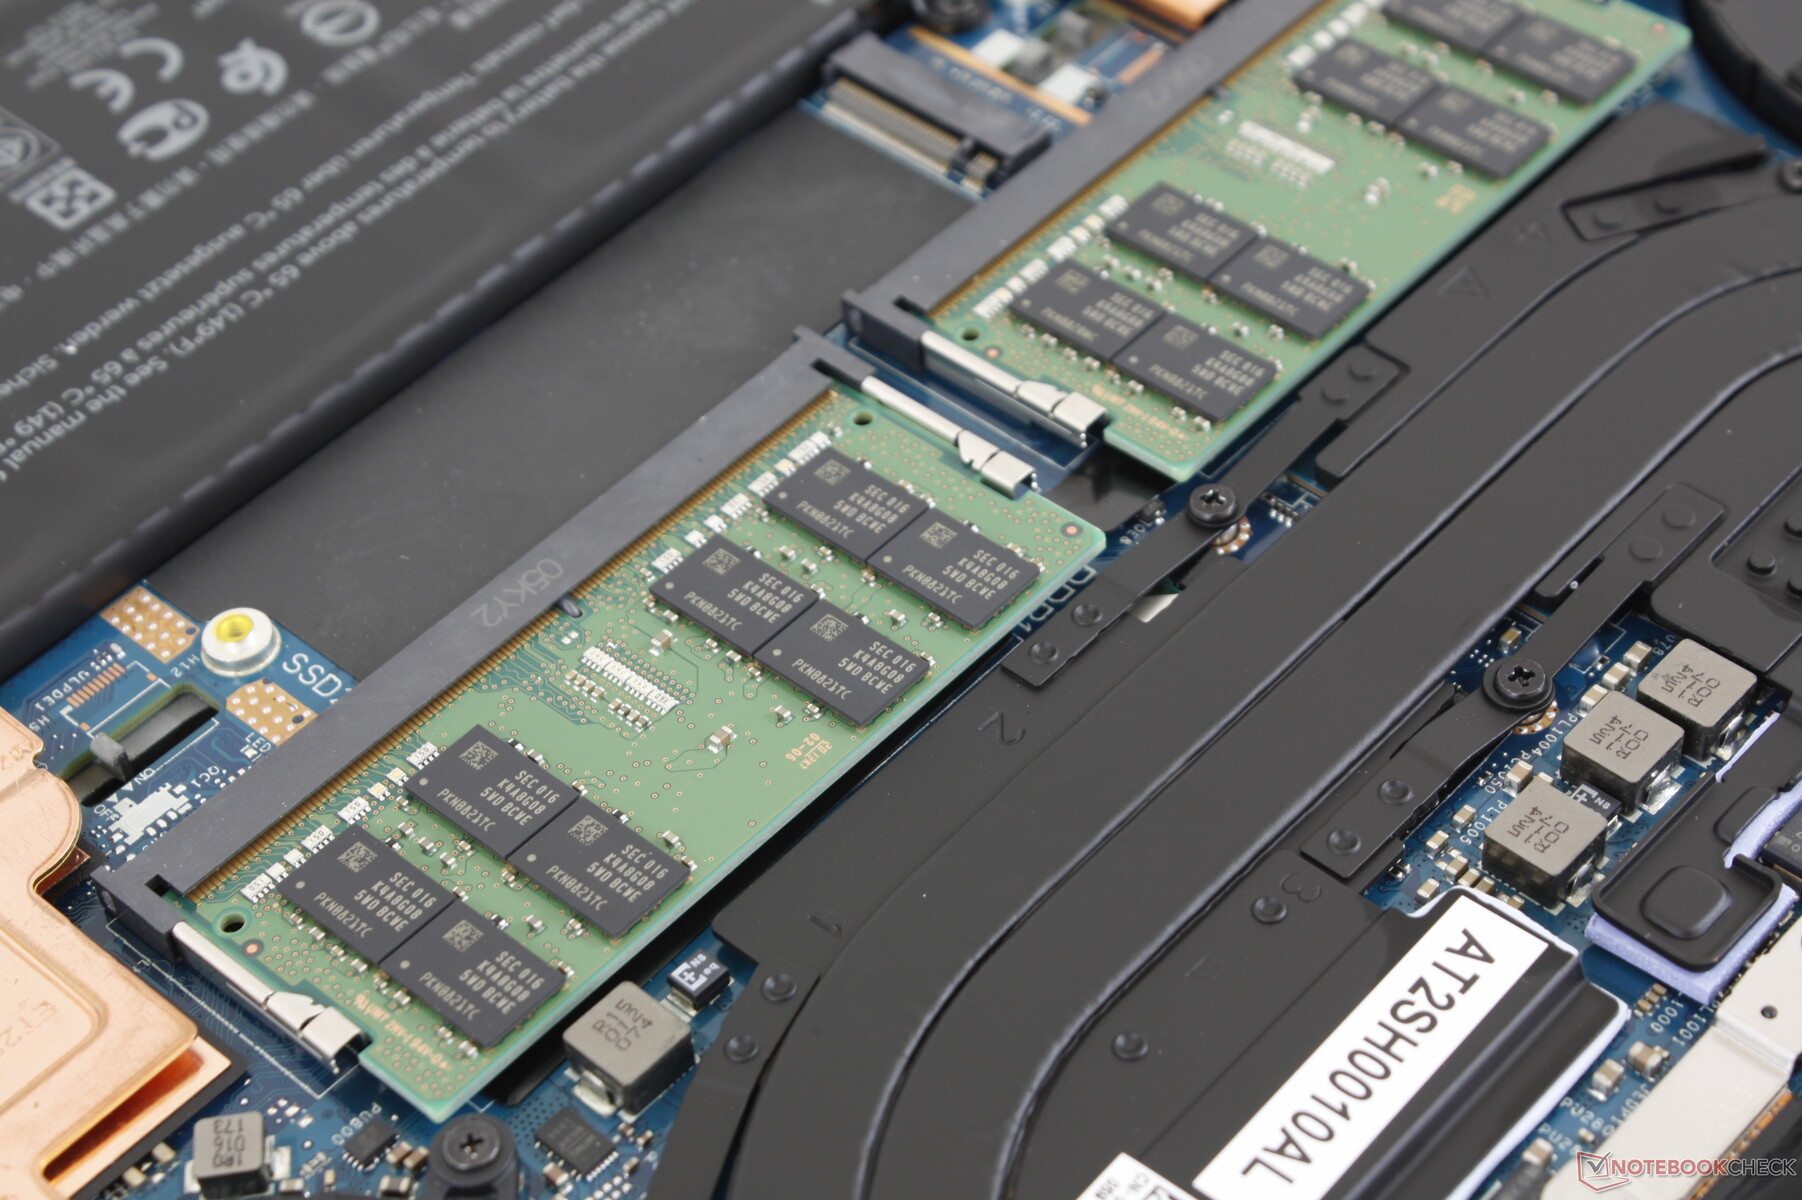
Manutenzione
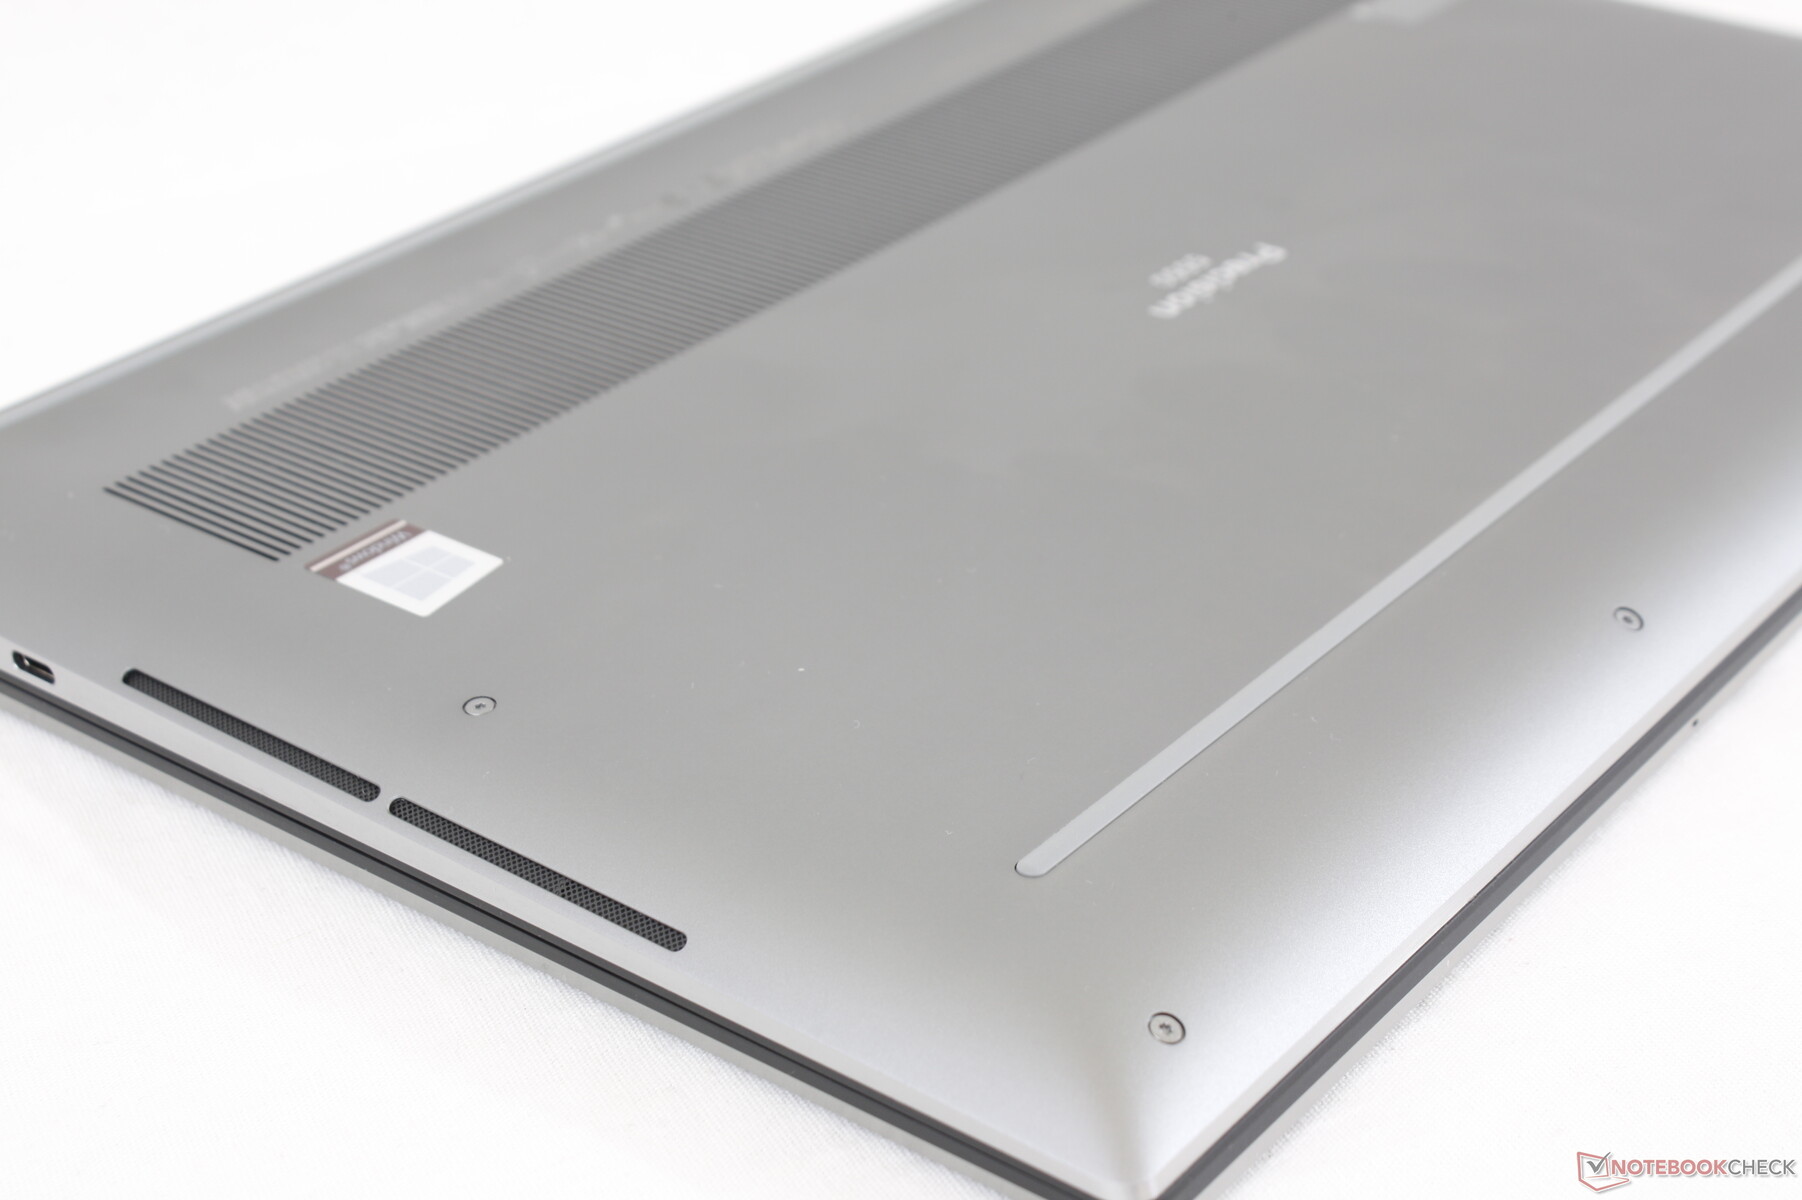
Il pannello inferiore in metallo è leggermente più difficile da rimuovere rispetto al Precision 5540 dell'anno scorso, in quanto è più affilato e stretto intorno ai bordi e agli angoli. Gli utenti non possono più effettuare la manutenzione del modulo WLAN in quanto ora è saldato.
Accessori e Garanzia
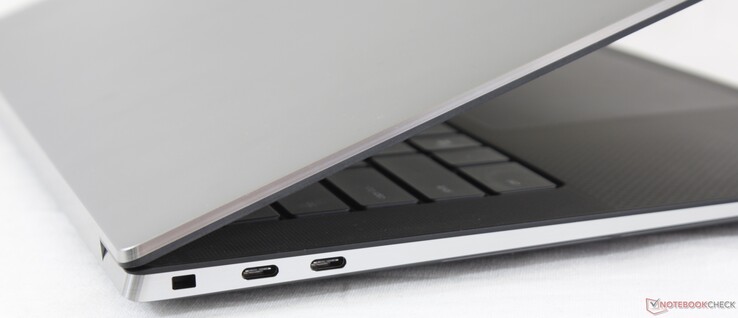
Tutte le versioni vengono fornite con lo stesso adattatore da USB-C a USB-A e HDMI che viene fornito anche con ogni ordine dell'XPS 15 9500. Una garanzia limitata di tre anni viene fornita di serie.
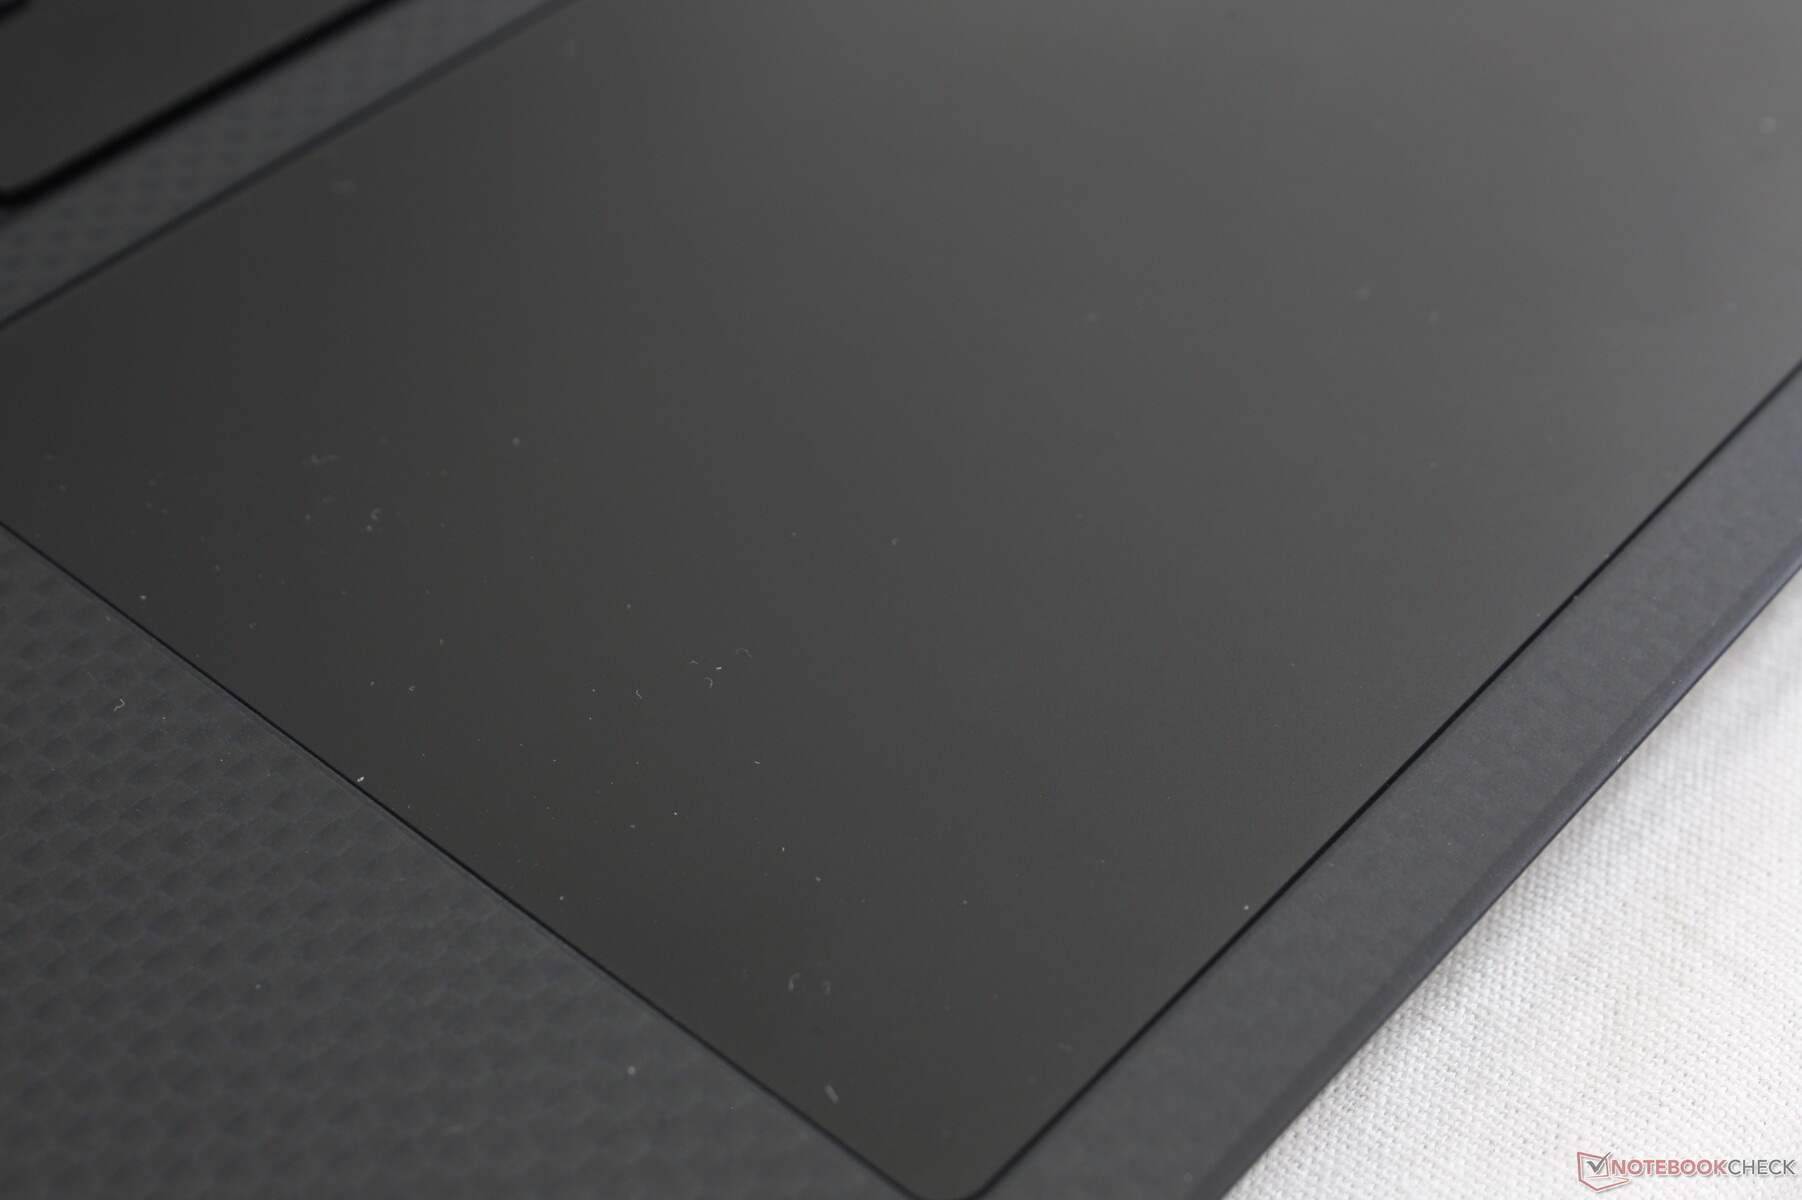
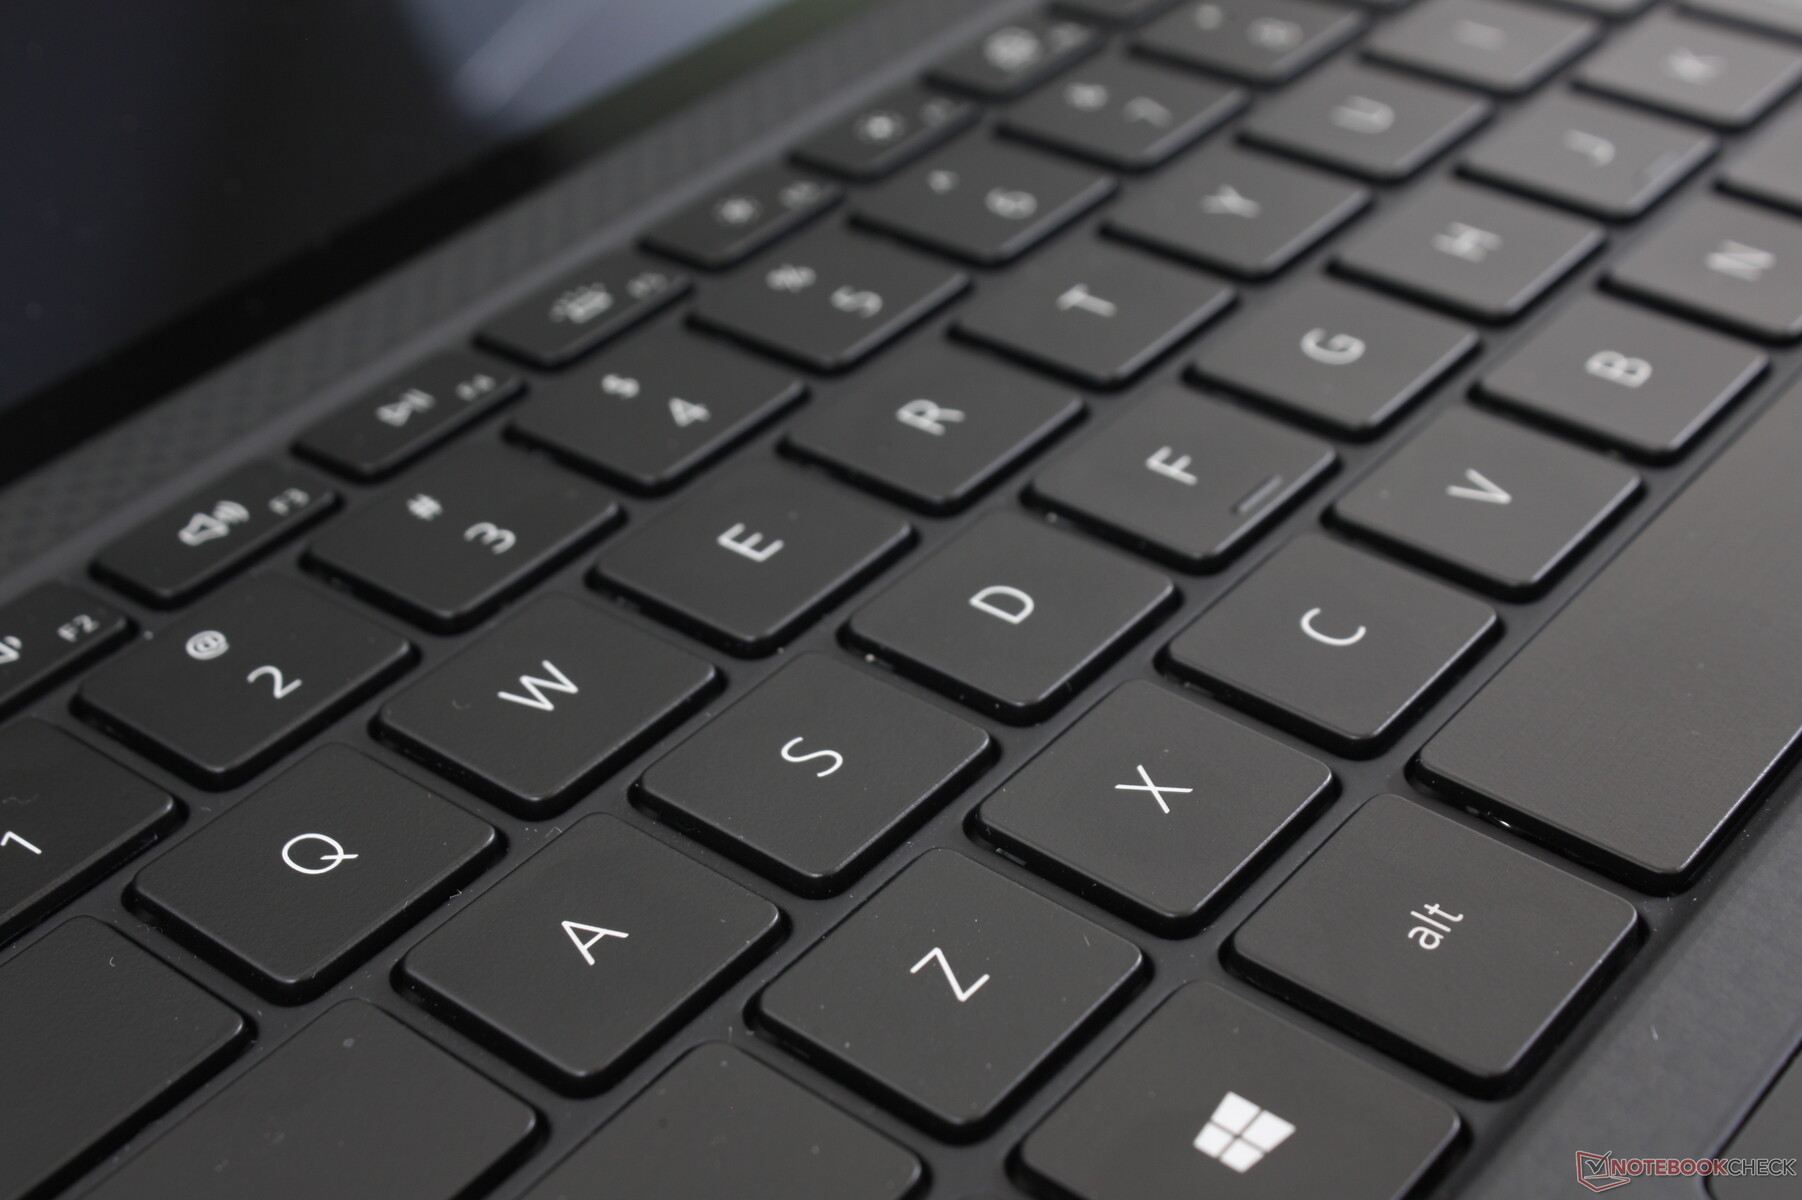
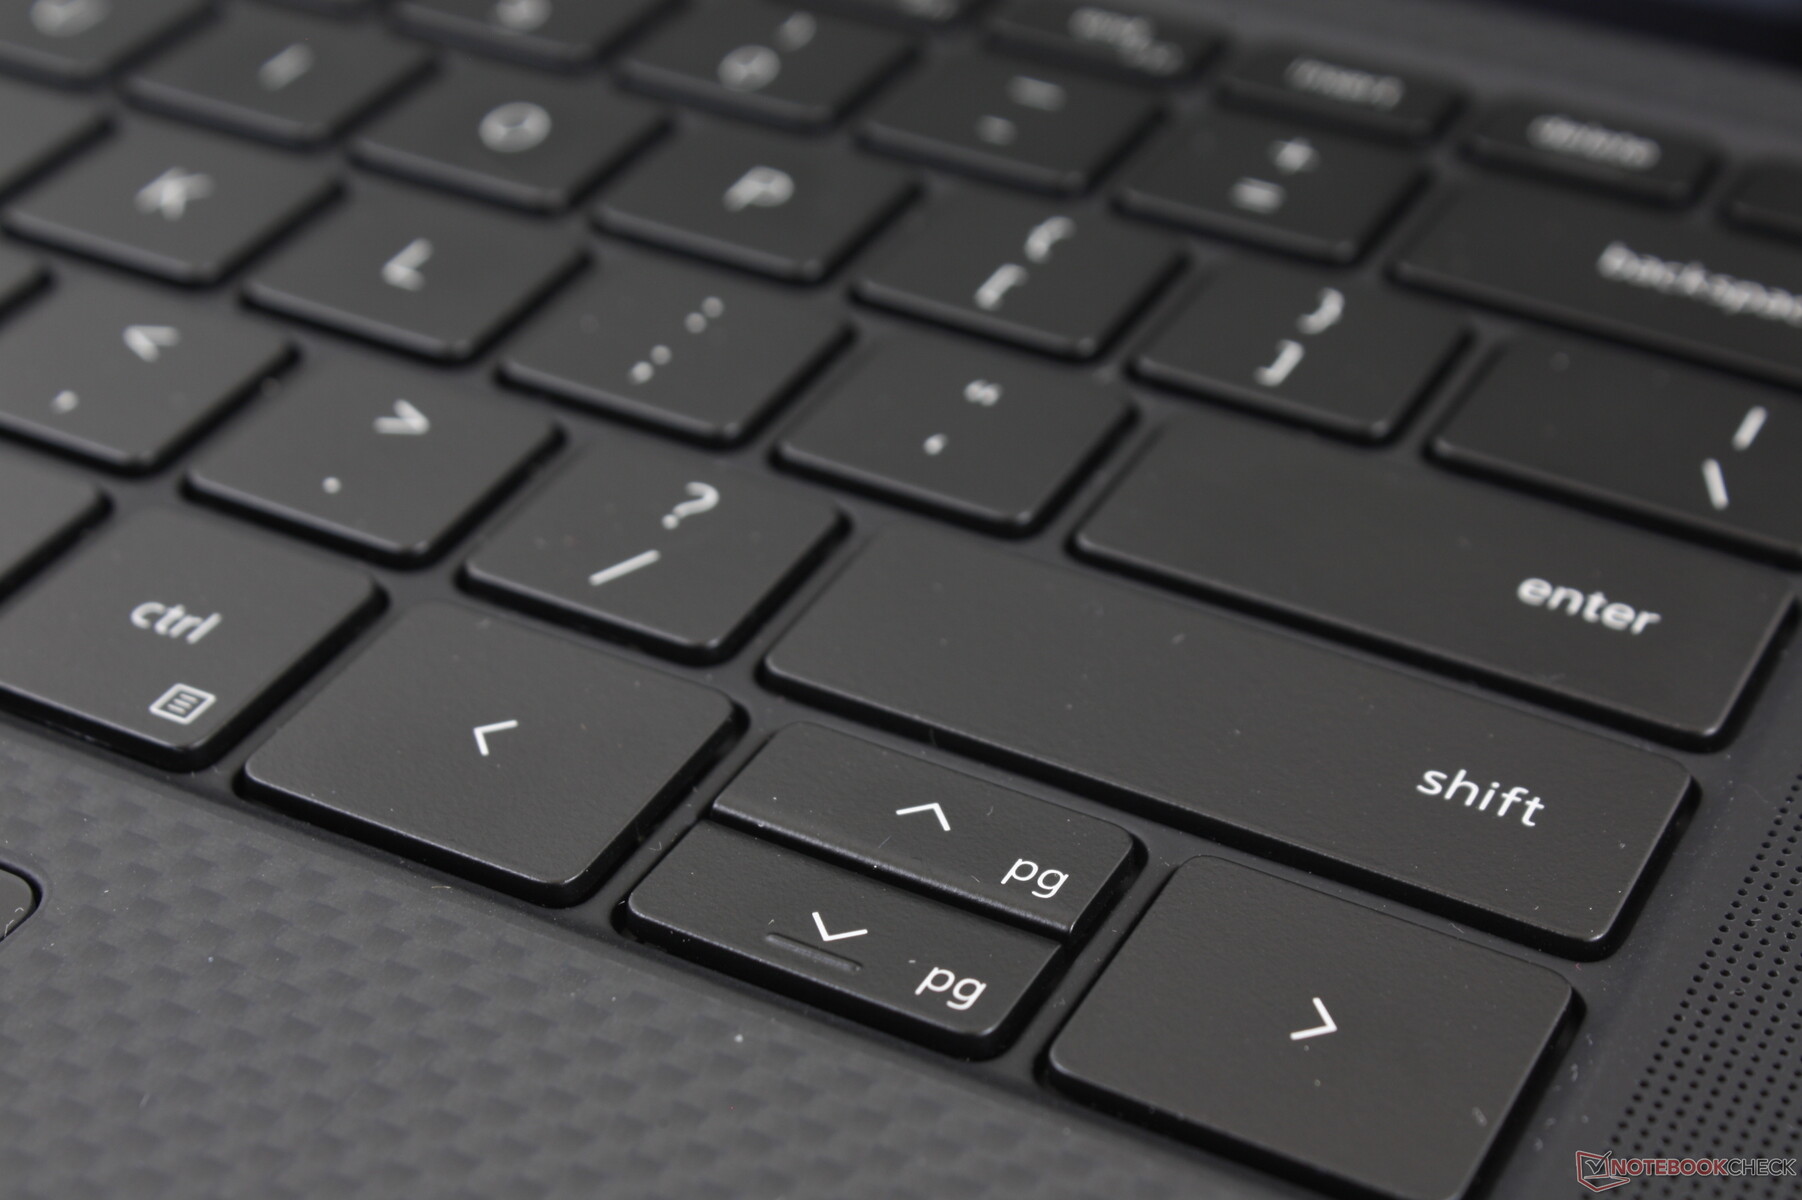
Dispositivi di Input
Tastiera e Touchpad
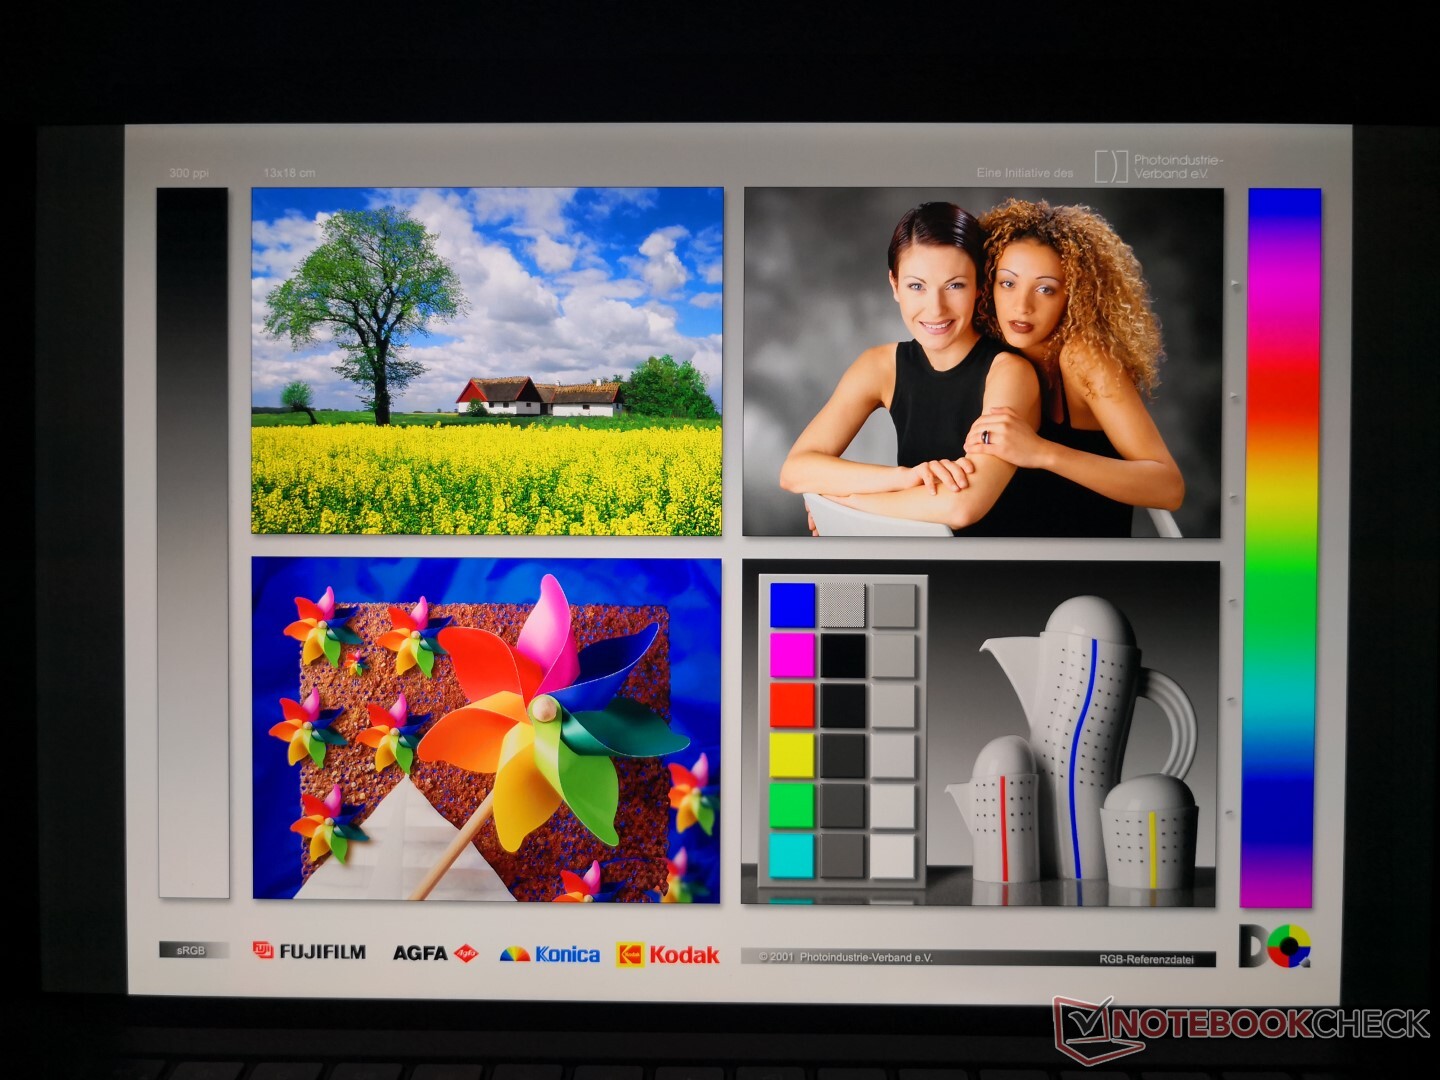
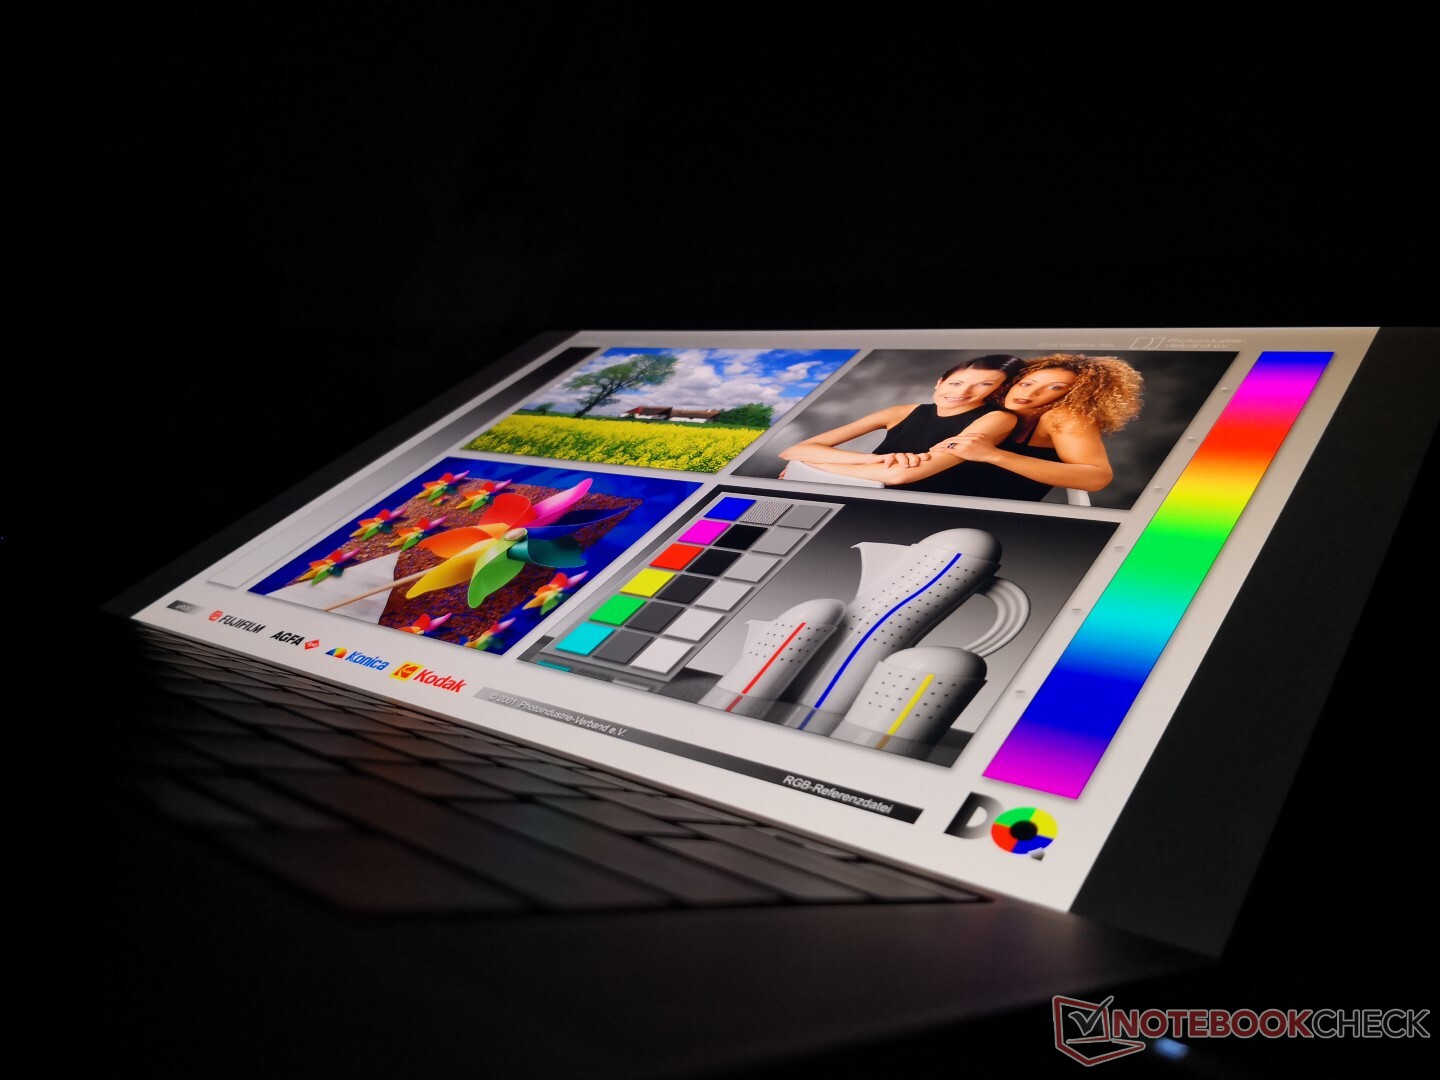
Display
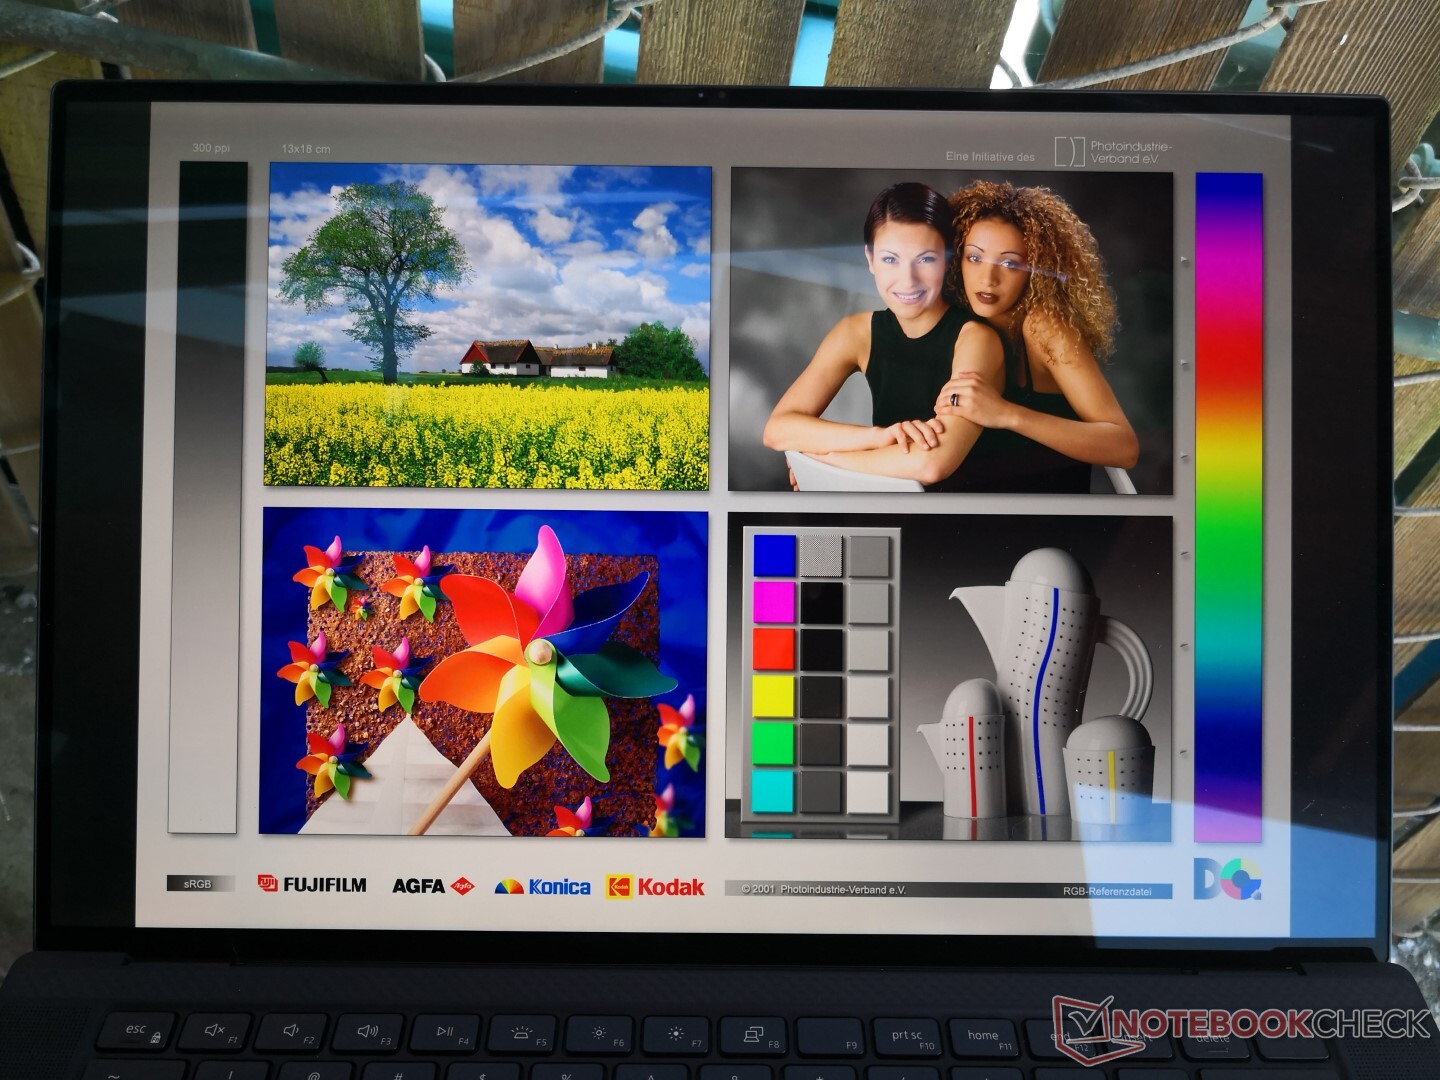
Lo stesso touchscreen IPS 4K UHD Sharp LQ156R1 dell'XPS 15 9500 si trova qui sul Precision 5550. Questo sarà probabilmente il display lucido più nitido che si possa trovare su qualsiasi workstation mobile. Il suo esclusivo rapporto d'aspetto 16:10, tuttavia, preclude al momento al Precision 5550 qualsiasi opzione OLED. Se una tale caratteristica è importante per voi, allora dovrete affidarvi al vecchio Precision 5540.
| |||||||||||||||||||||||||
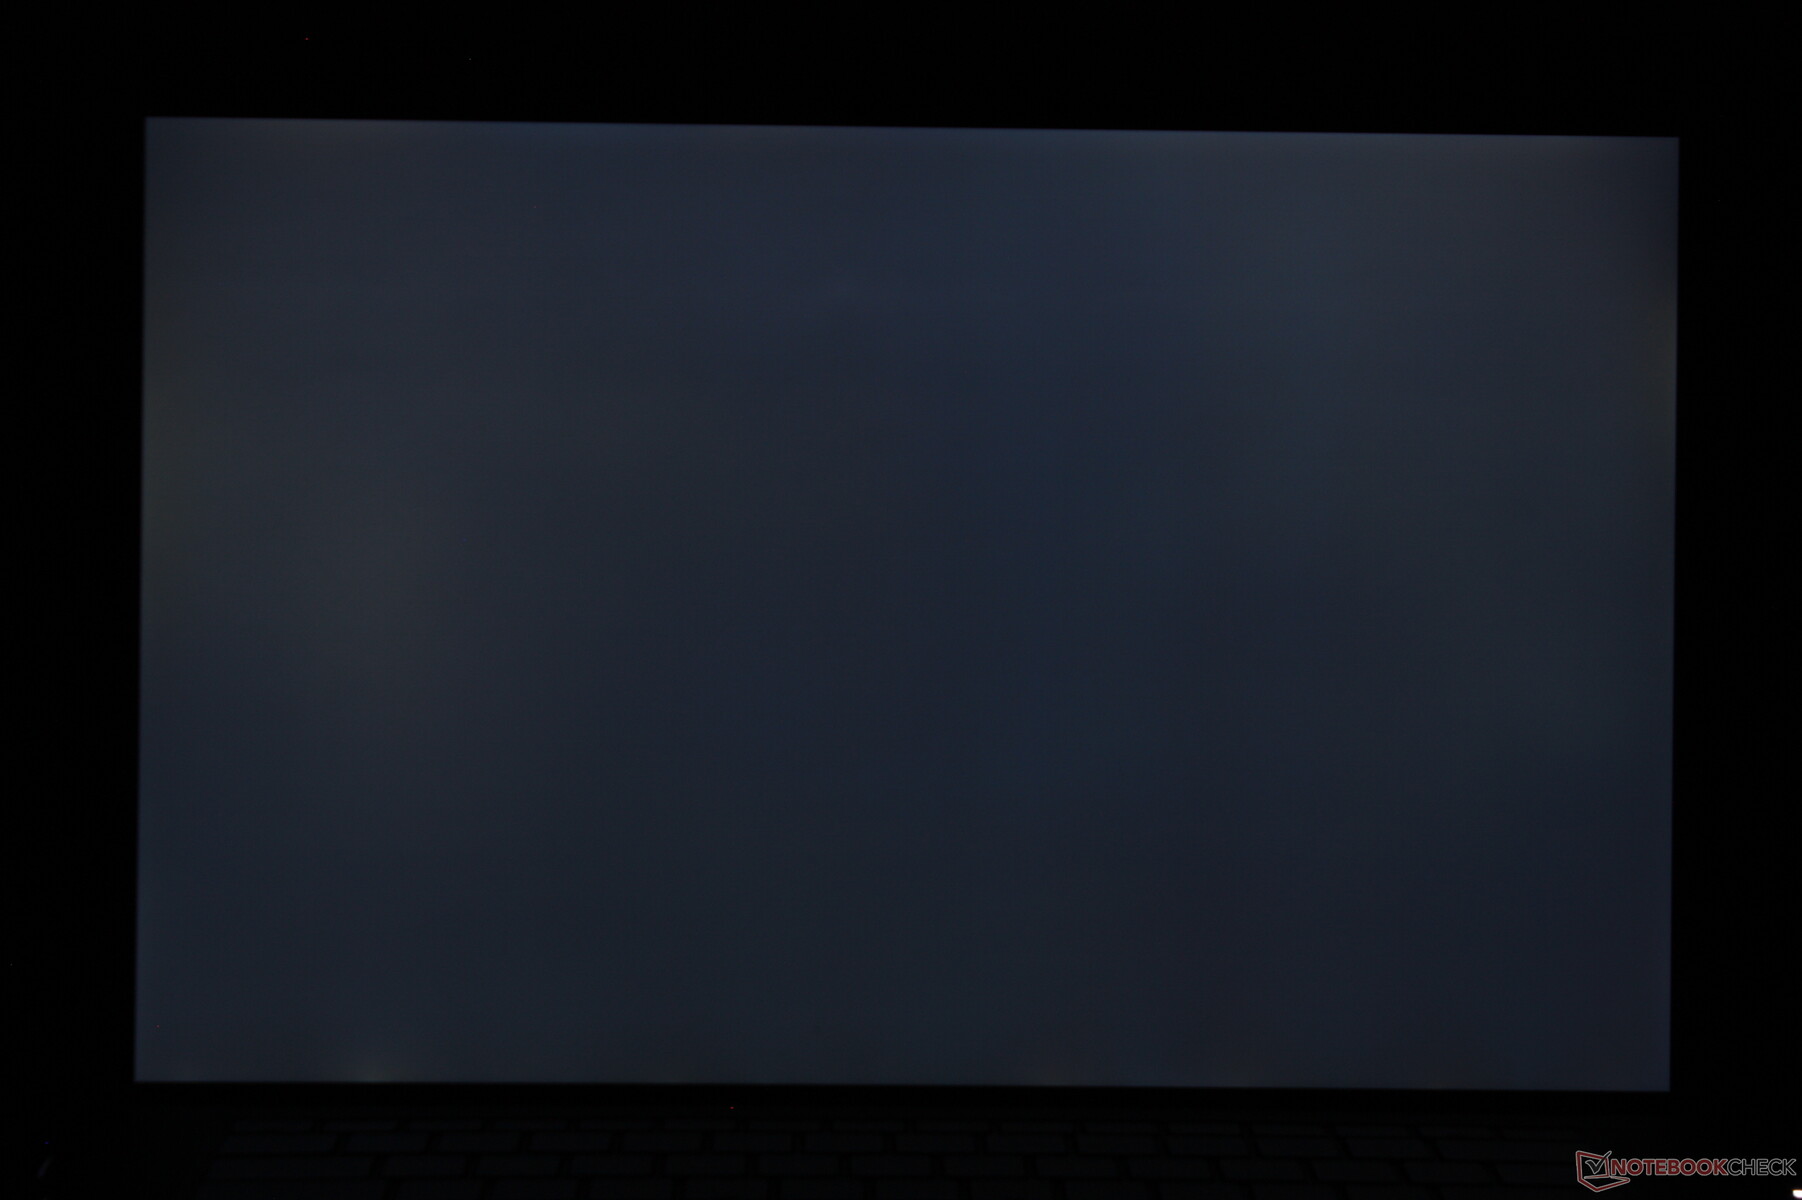
Distribuzione della luminosità: 85 %
Al centro con la batteria: 469.8 cd/m²
Contrasto: 1119:1 (Nero: 0.42 cd/m²)
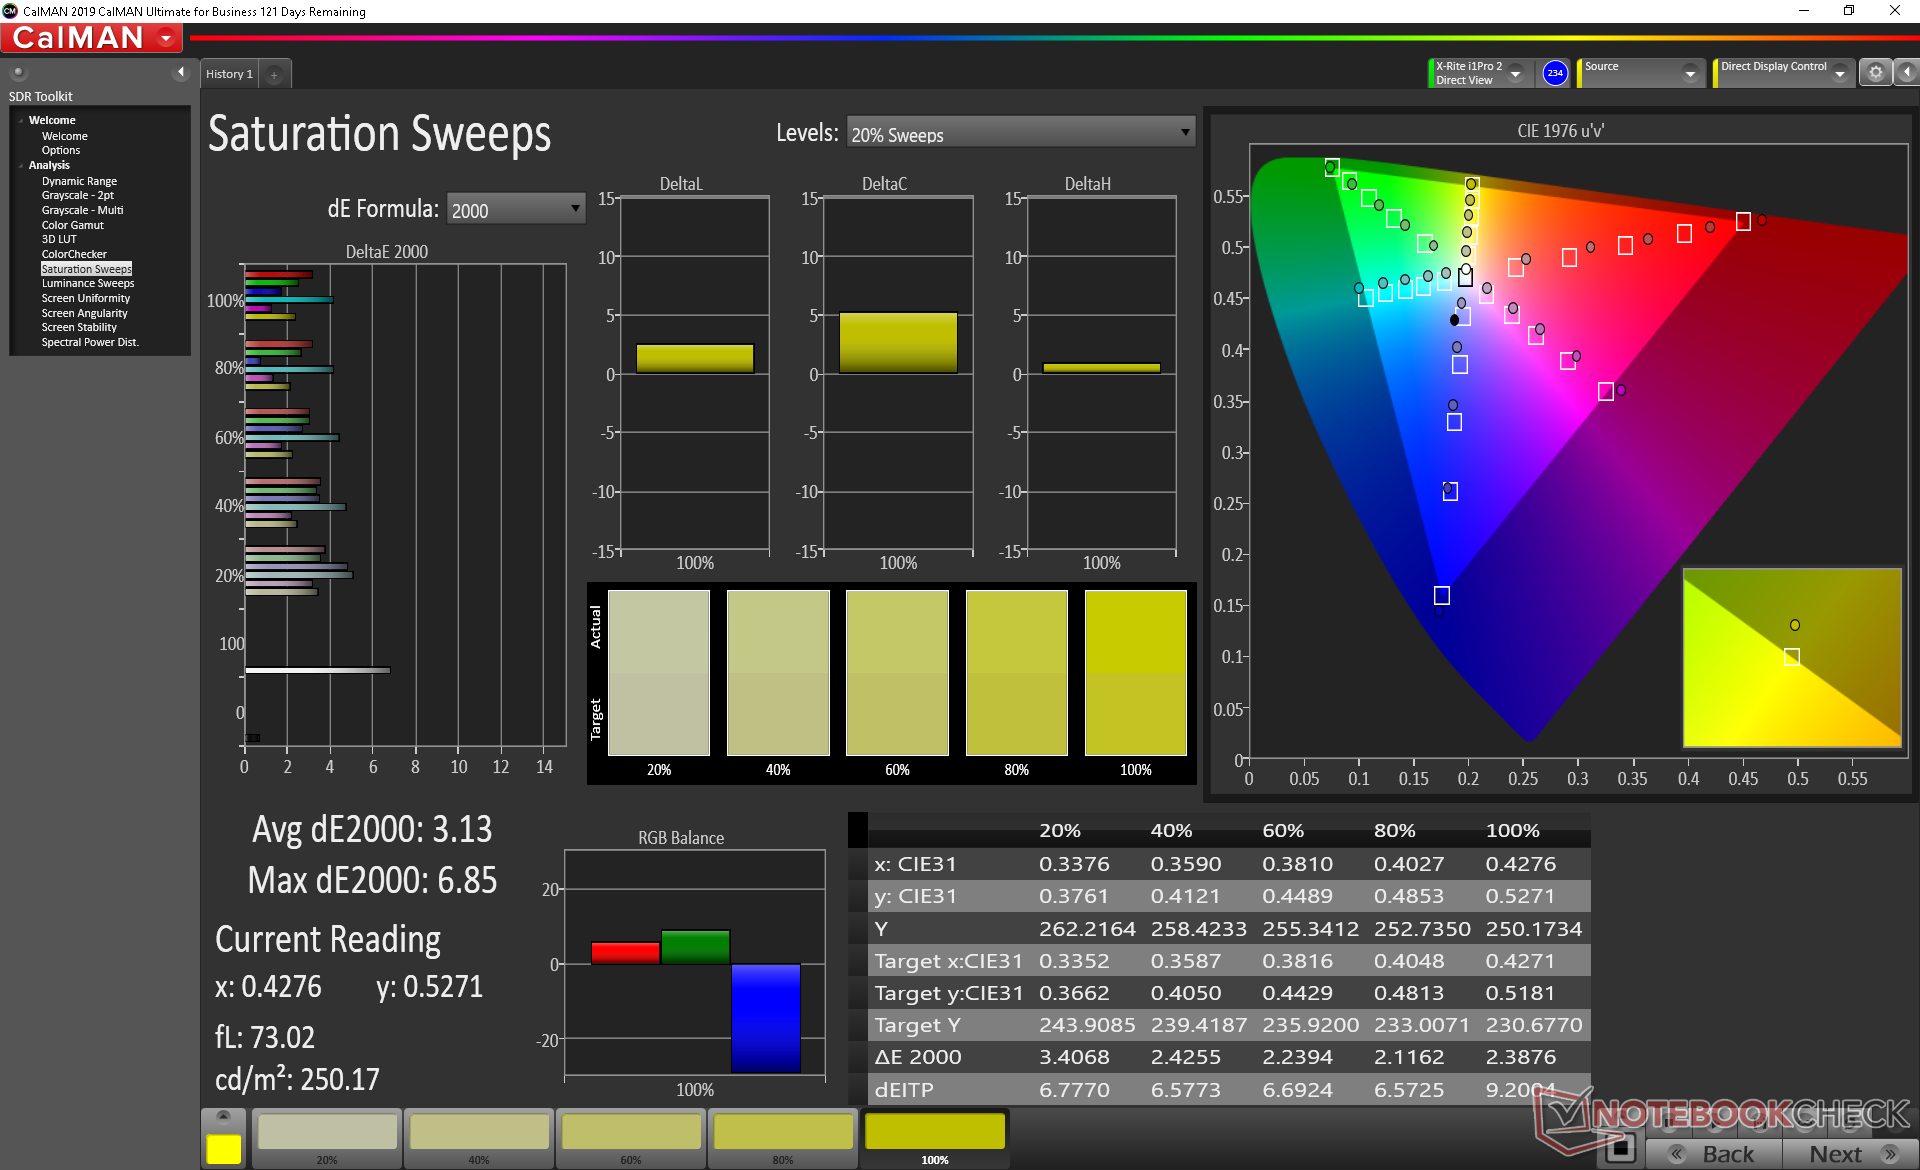
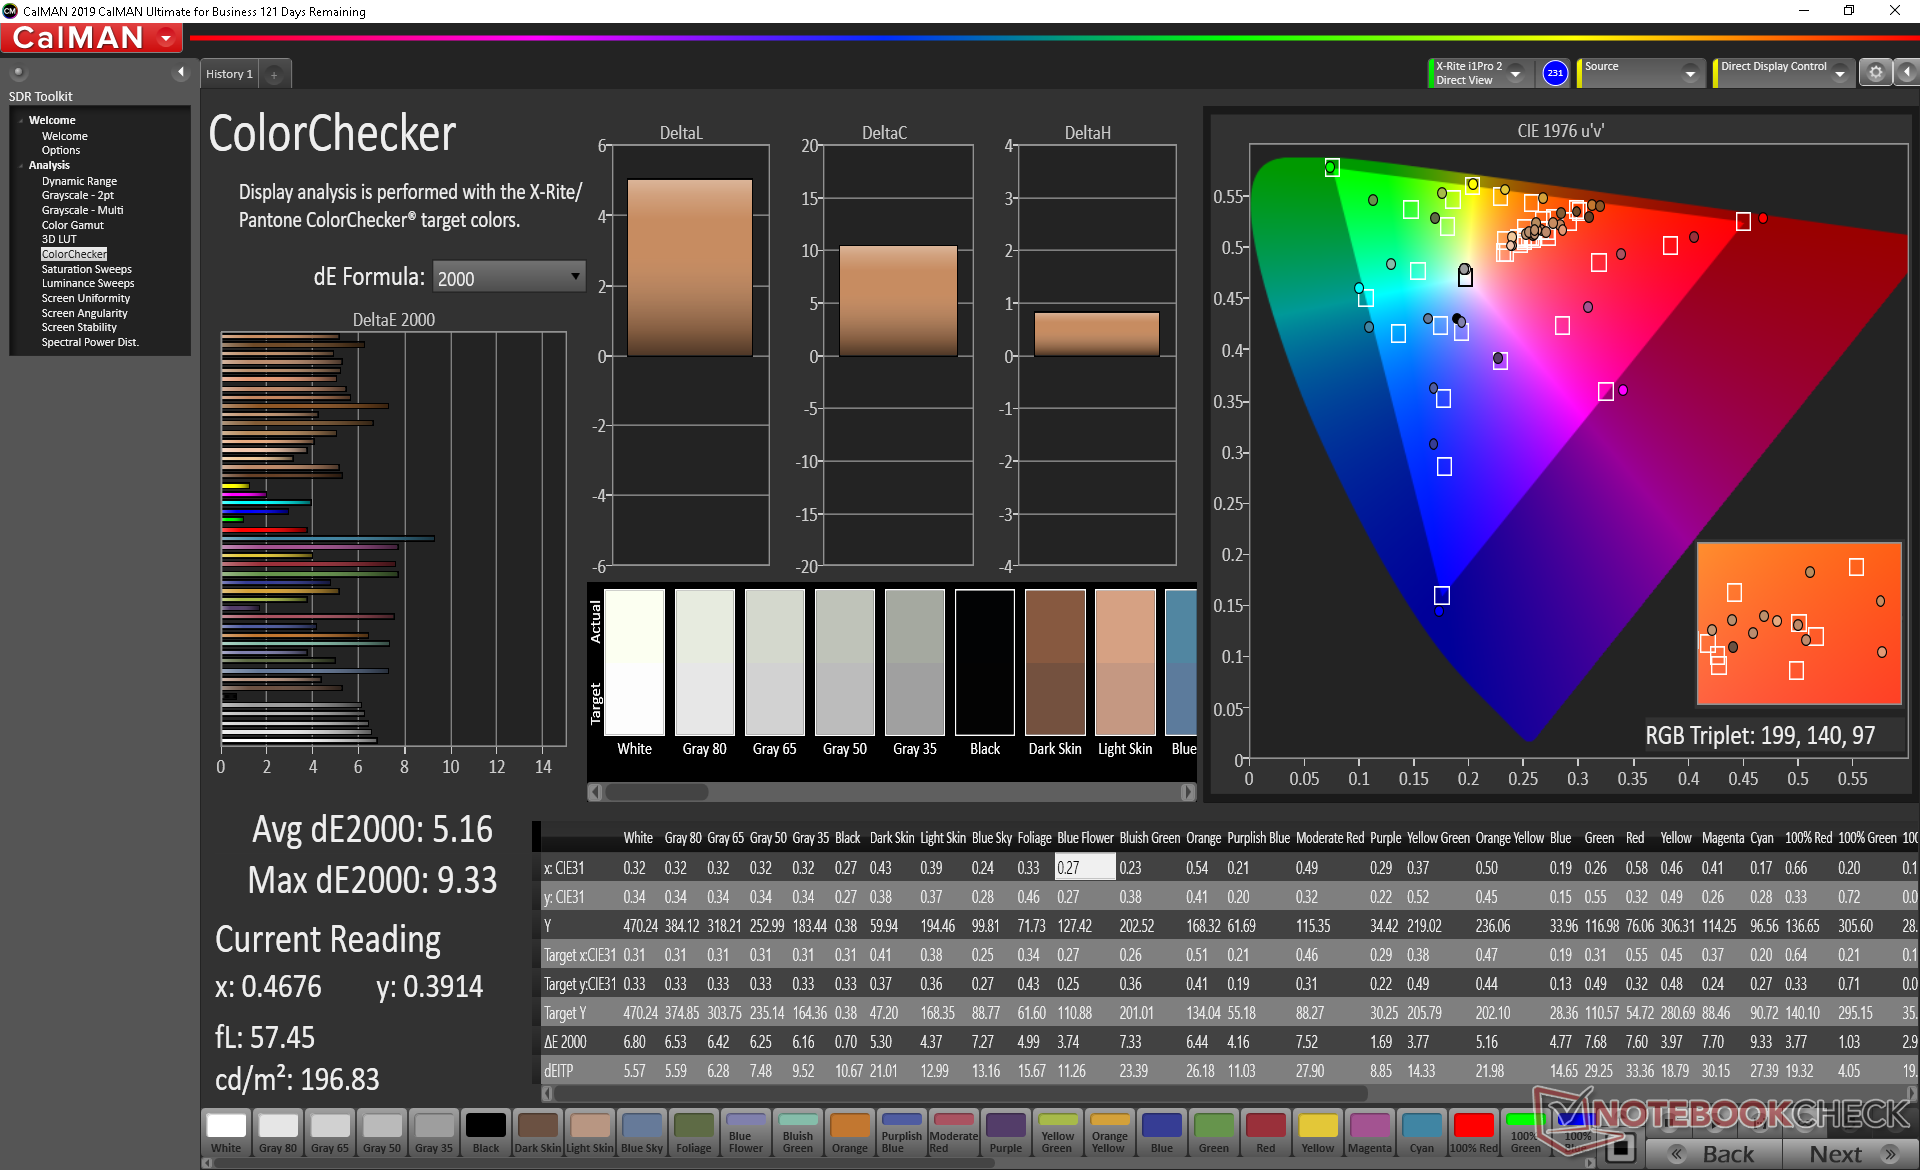
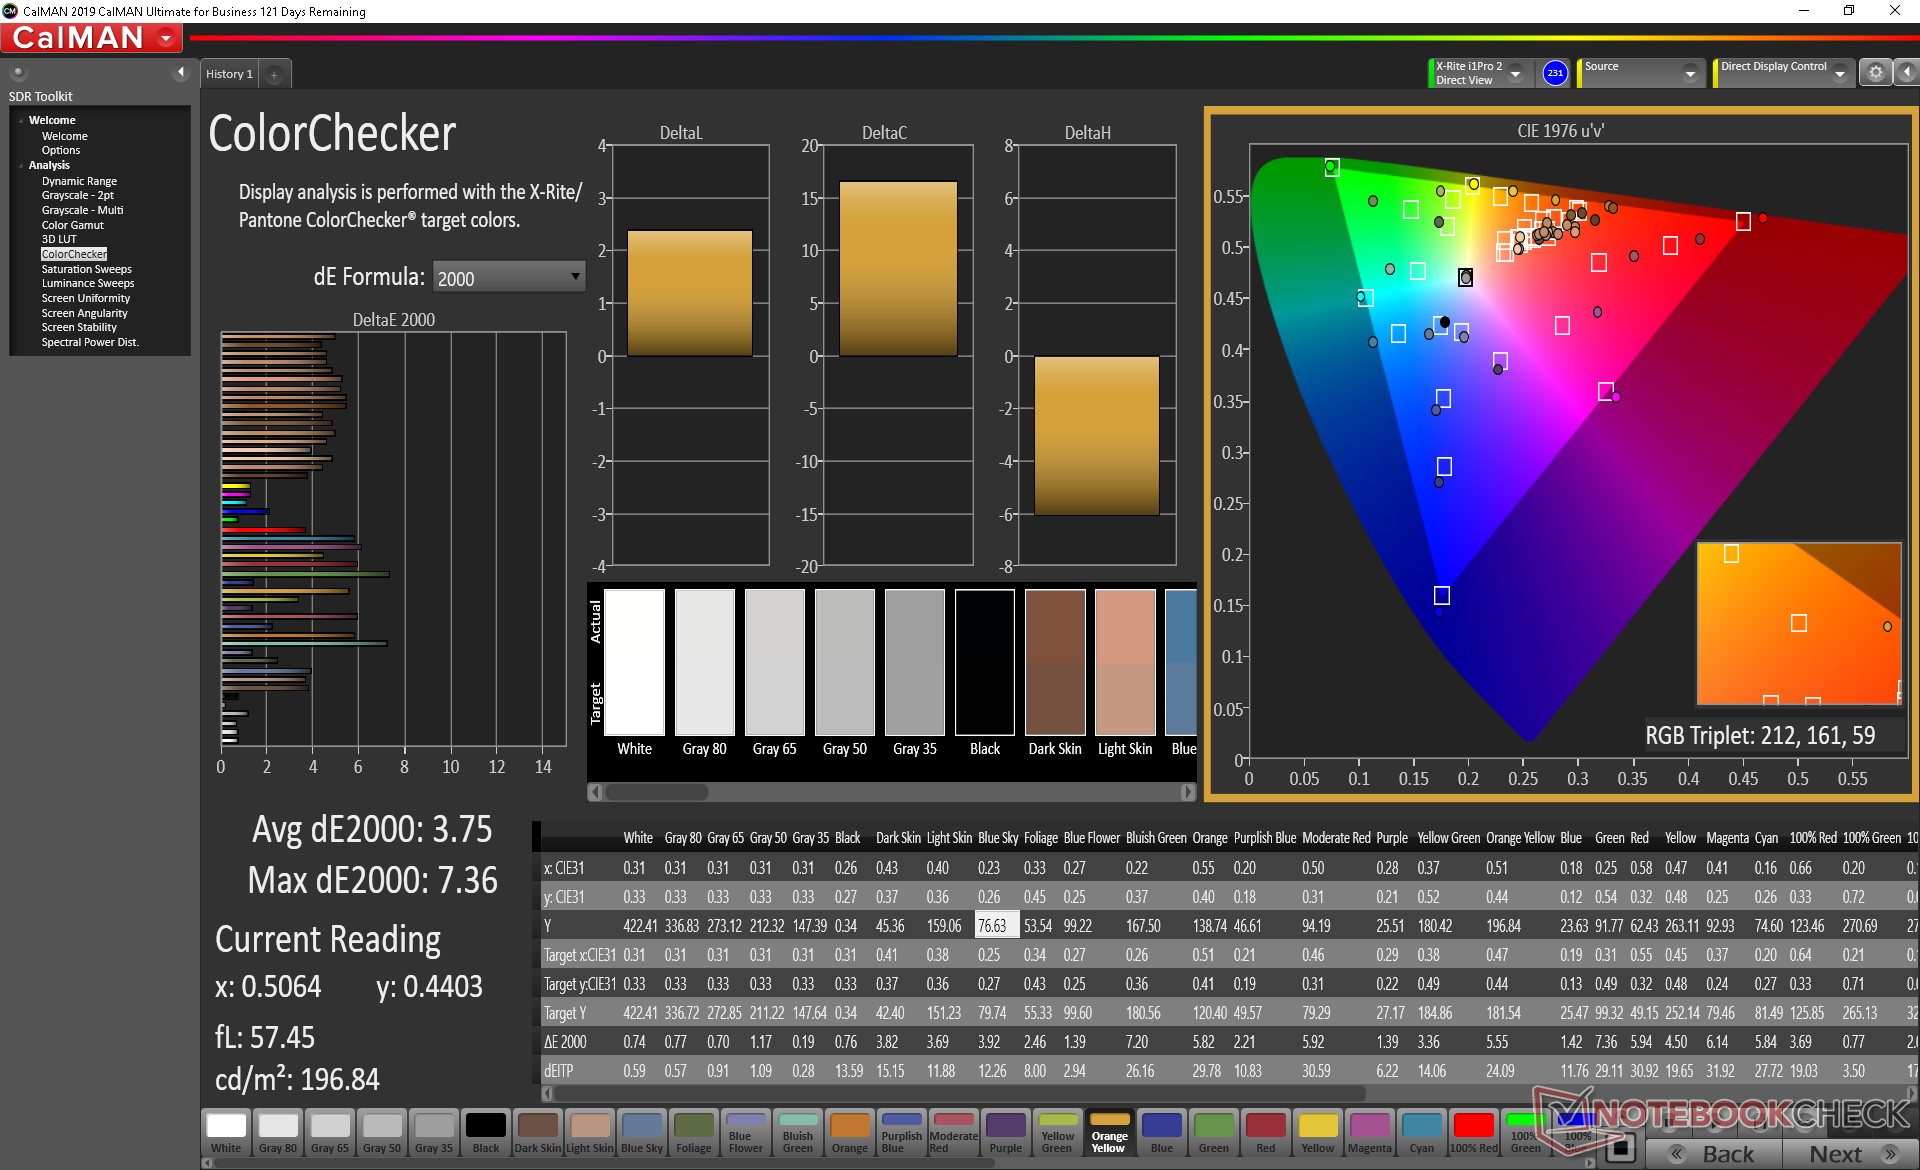
ΔE ColorChecker Calman: 5.16 | ∀{0.5-29.43 Ø4.72}
calibrated: 3.75
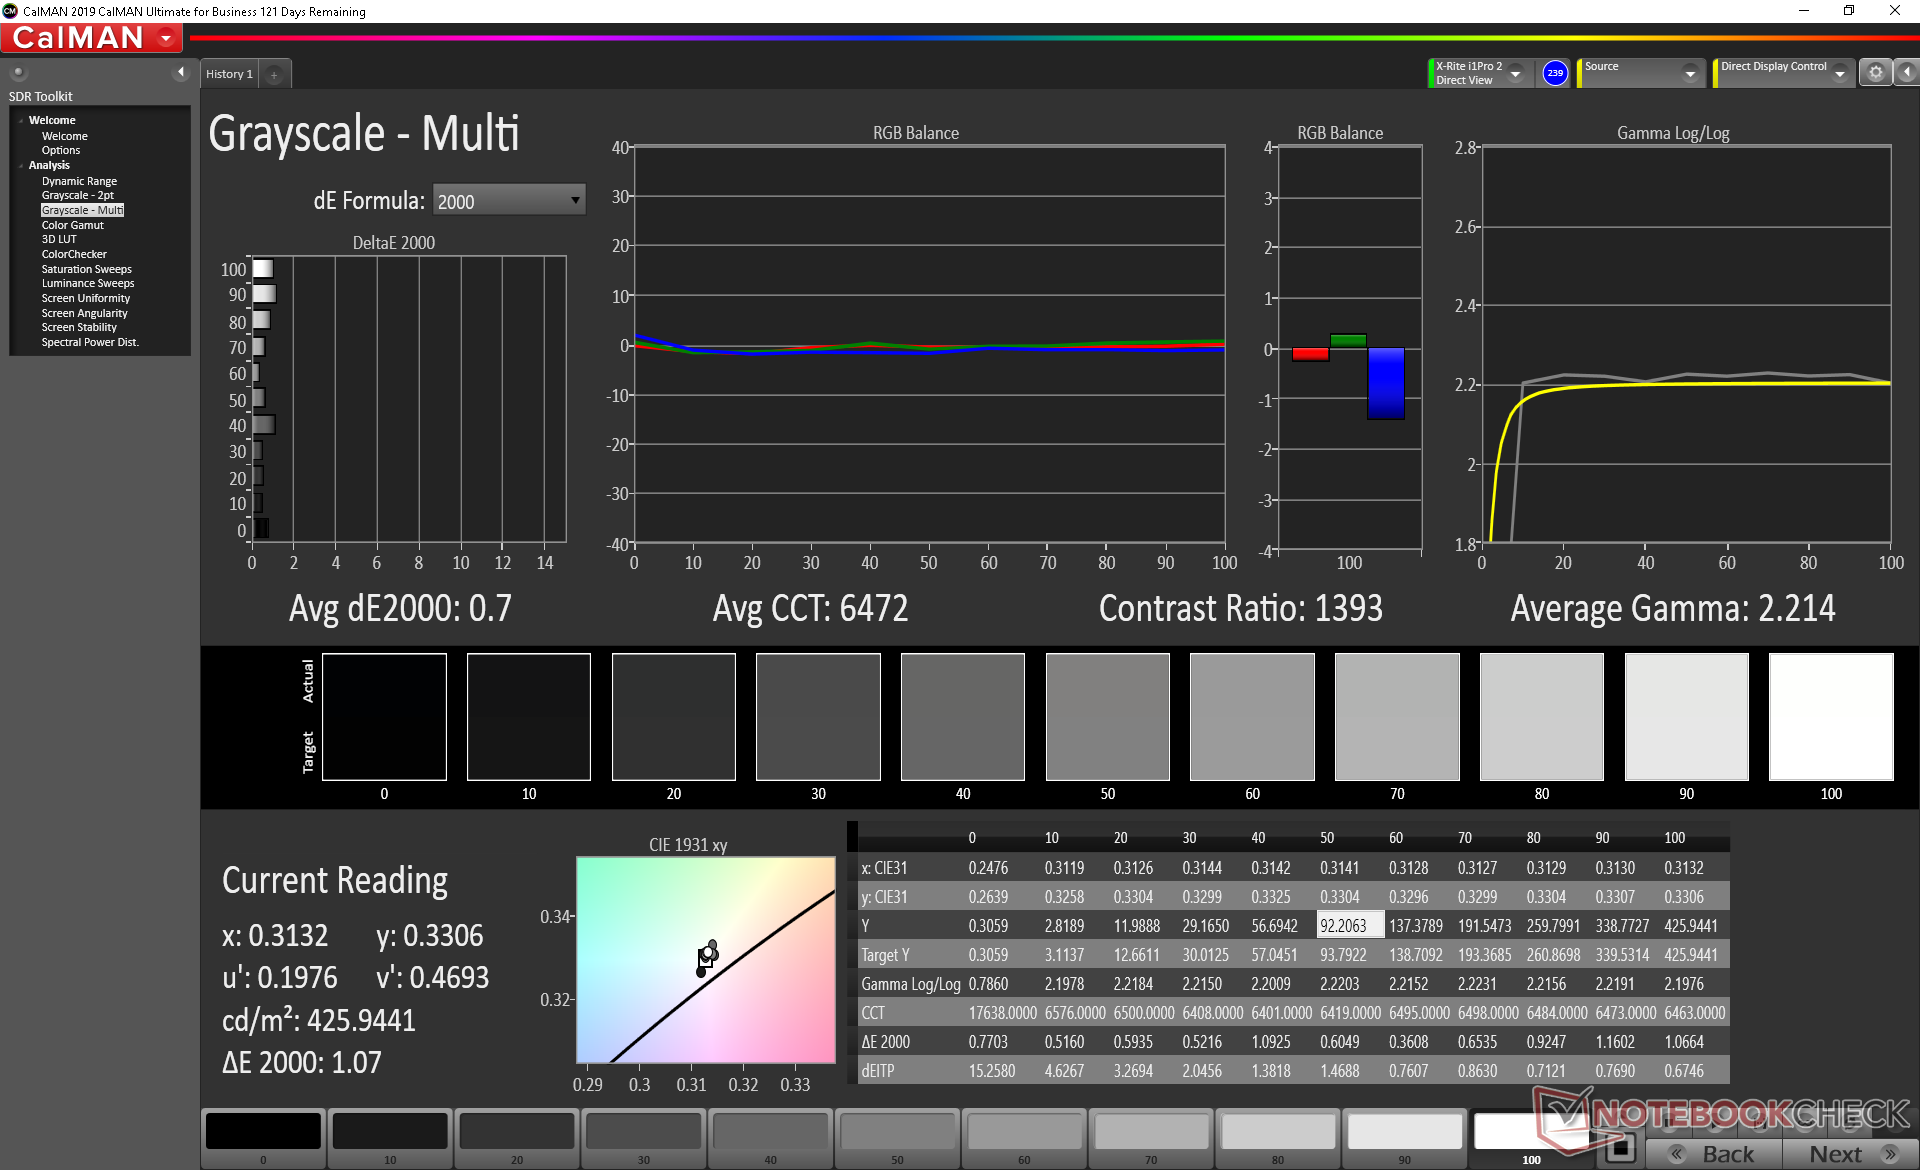
ΔE Greyscale Calman: 5.5 | ∀{0.09-98 Ø4.97}
100% sRGB (Argyll 1.6.3 3D)
89.2% AdobeRGB 1998 (Argyll 1.6.3 3D)
99.9% AdobeRGB 1998 (Argyll 3D)
100% sRGB (Argyll 3D)
89.9% Display P3 (Argyll 3D)
Gamma: 2
CCT: 6198 K
| Dell Precision 5550 P91F Sharp LQ156R1, IPS, 15.6", 3840x2400 | Dell Precision 5540 SDCA029, OLED, 15.6", 3840x2160 | Razer Blade 15 Studio Edition 2020 Samsung SDCA029, OLED, 15.6", 3840x2160 | Acer ConceptD 3 Pro CN315-71P-73W1 Chi Mei N156HCE-EN2, IPS, 15.6", 1920x1080 | Lenovo ThinkPad P53-20QN000YGE N156HCE-GN1, IPS, 15.6", 1920x1080 | MSI WP65 AU Optronics B156HAN02.1, IPS, 15.6", 1920x1080 | |
|---|---|---|---|---|---|---|
| Display | 3% | 3% | -1% | -24% | -52% | |
| Display P3 Coverage (%) | 89.9 | 99.9 11% | 99.9 11% | 97.9 9% | 63.2 -30% | 39.46 -56% |
| sRGB Coverage (%) | 100 | 100 0% | 100 0% | 99.9 0% | 92.9 -7% | 58.8 -41% |
| AdobeRGB 1998 Coverage (%) | 99.9 | 97.3 -3% | 97.3 -3% | 87.2 -13% | 64.3 -36% | 40.69 -59% |
| Response Times | 93% | 90% | 32% | 22% | 19% | |
| Response Time Grey 50% / Grey 80% * (ms) | 46 ? | 2.8 ? 94% | 4 ? 91% | 33 ? 28% | 38.4 ? 17% | 37.6 ? 18% |
| Response Time Black / White * (ms) | 34 ? | 3.2 ? 91% | 4 ? 88% | 22 ? 35% | 25.2 ? 26% | 27.6 ? 19% |
| PWM Frequency (Hz) | 240.9 ? | 26040 ? | ||||
| Screen | 14% | 171% | 14% | 20% | -25% | |
| Brightness middle (cd/m²) | 469.8 | 427 -9% | 380 -19% | 343 -27% | 510 9% | 267.4 -43% |
| Brightness (cd/m²) | 464 | 411 -11% | 388 -16% | 309 -33% | 468 1% | 259 -44% |
| Brightness Distribution (%) | 85 | 89 5% | 93 9% | 85 0% | 89 5% | 86 1% |
| Black Level * (cd/m²) | 0.42 | 0.018 96% | 0.22 48% | 0.36 14% | 0.37 12% | |
| Contrast (:1) | 1119 | 21111 1787% | 1559 39% | 1417 27% | 723 -35% | |
| Colorchecker dE 2000 * | 5.16 | 3.2 38% | 5.47 -6% | 3.73 28% | 2.3 55% | 4.21 18% |
| Colorchecker dE 2000 max. * | 9.33 | 8.4 10% | 8.19 12% | 6.51 30% | 5.5 41% | 21.1 -126% |
| Colorchecker dE 2000 calibrated * | 3.75 | 2.8 25% | 3.04 19% | 1.43 62% | 1.2 68% | 4.27 -14% |
| Greyscale dE 2000 * | 5.5 | 1.8 67% | 5.3 4% | 4.24 23% | 3.2 42% | 2.3 58% |
| Gamma | 2 110% | 2.15 102% | 2.15 102% | 2.2 100% | 2.34 94% | 2.2 100% |
| CCT | 6198 105% | 6176 105% | 6128 106% | 6329 103% | 7036 92% | 6578 99% |
| Color Space (Percent of AdobeRGB 1998) (%) | 89.2 | 86.8 -3% | 86 -4% | 78 -13% | 59.4 -33% | 37.2 -58% |
| Color Space (Percent of sRGB) (%) | 100 | 100 0% | 100 0% | 100 0% | 93.1 -7% | 58.5 -41% |
| Media totale (Programma / Settaggio) | 37% /
23% | 88% /
129% | 15% /
14% | 6% /
12% | -19% /
-24% |
* ... Meglio usare valori piccoli
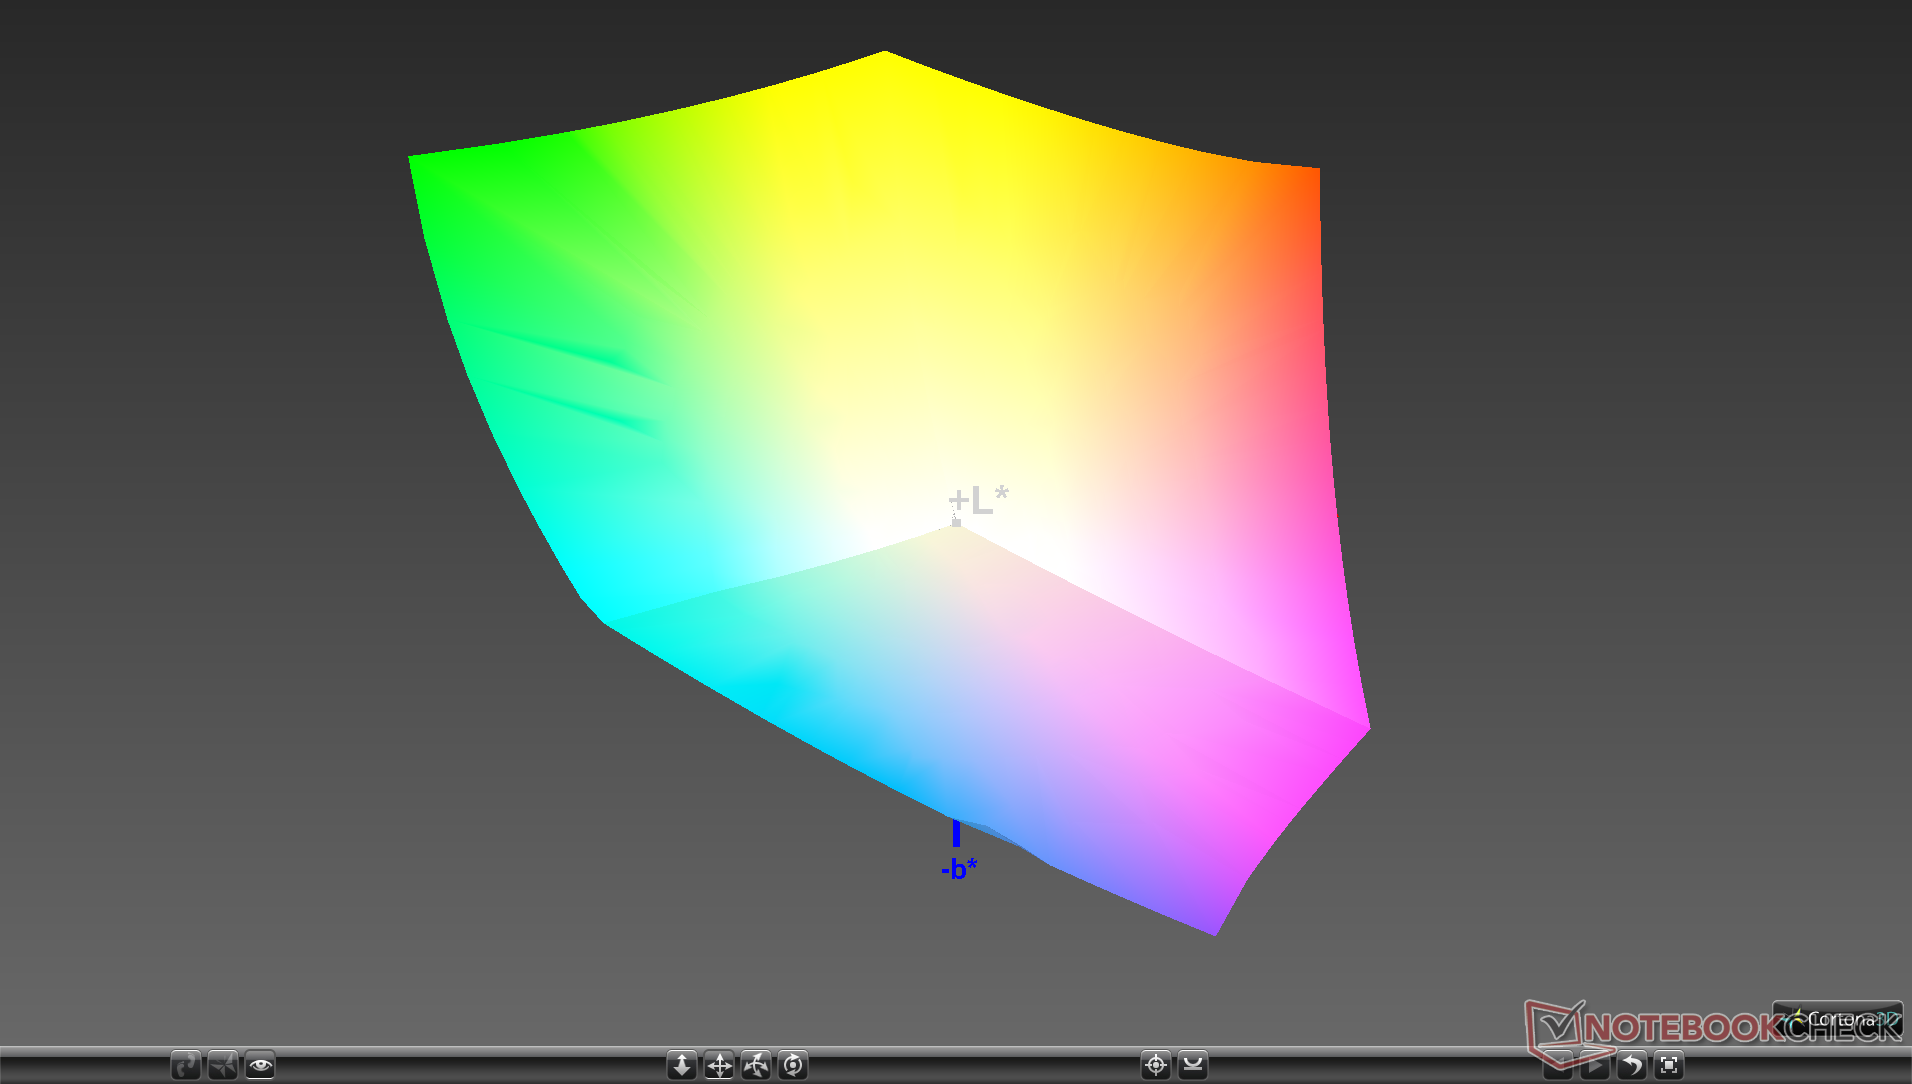
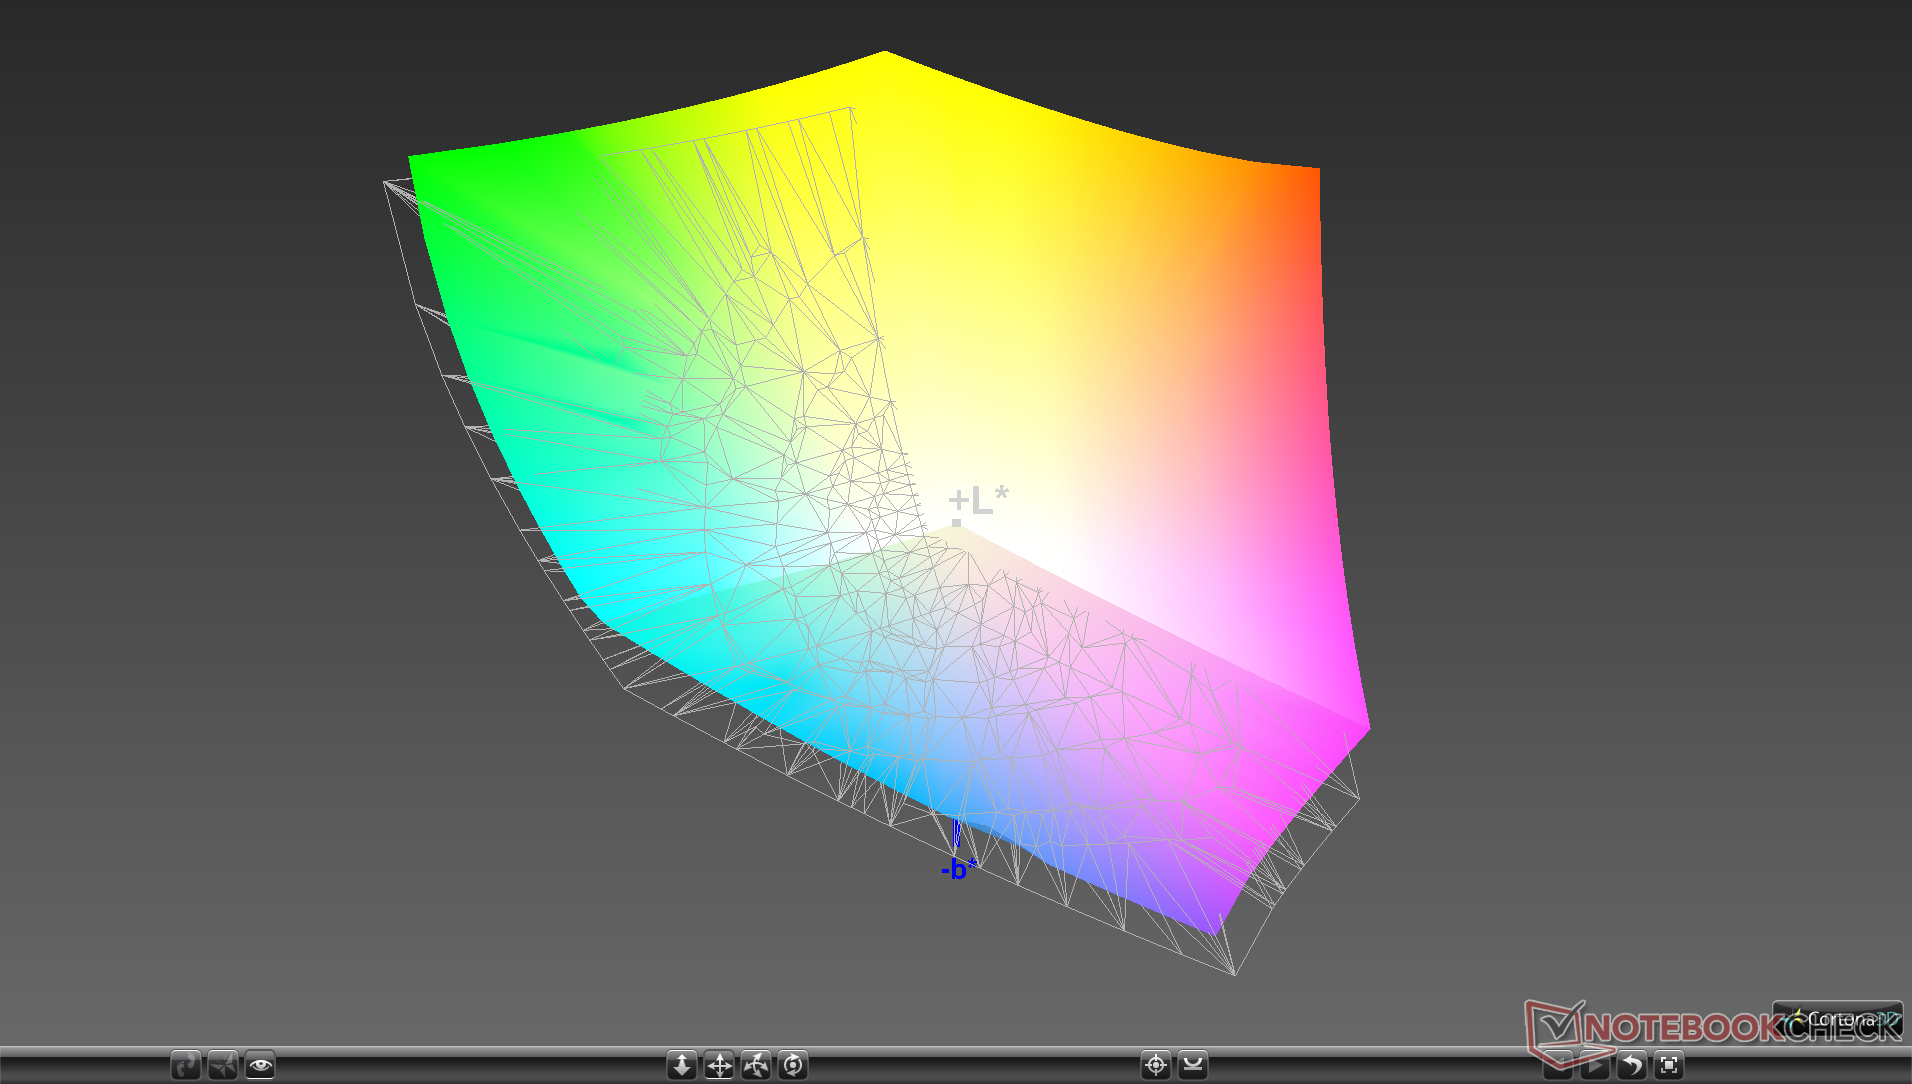
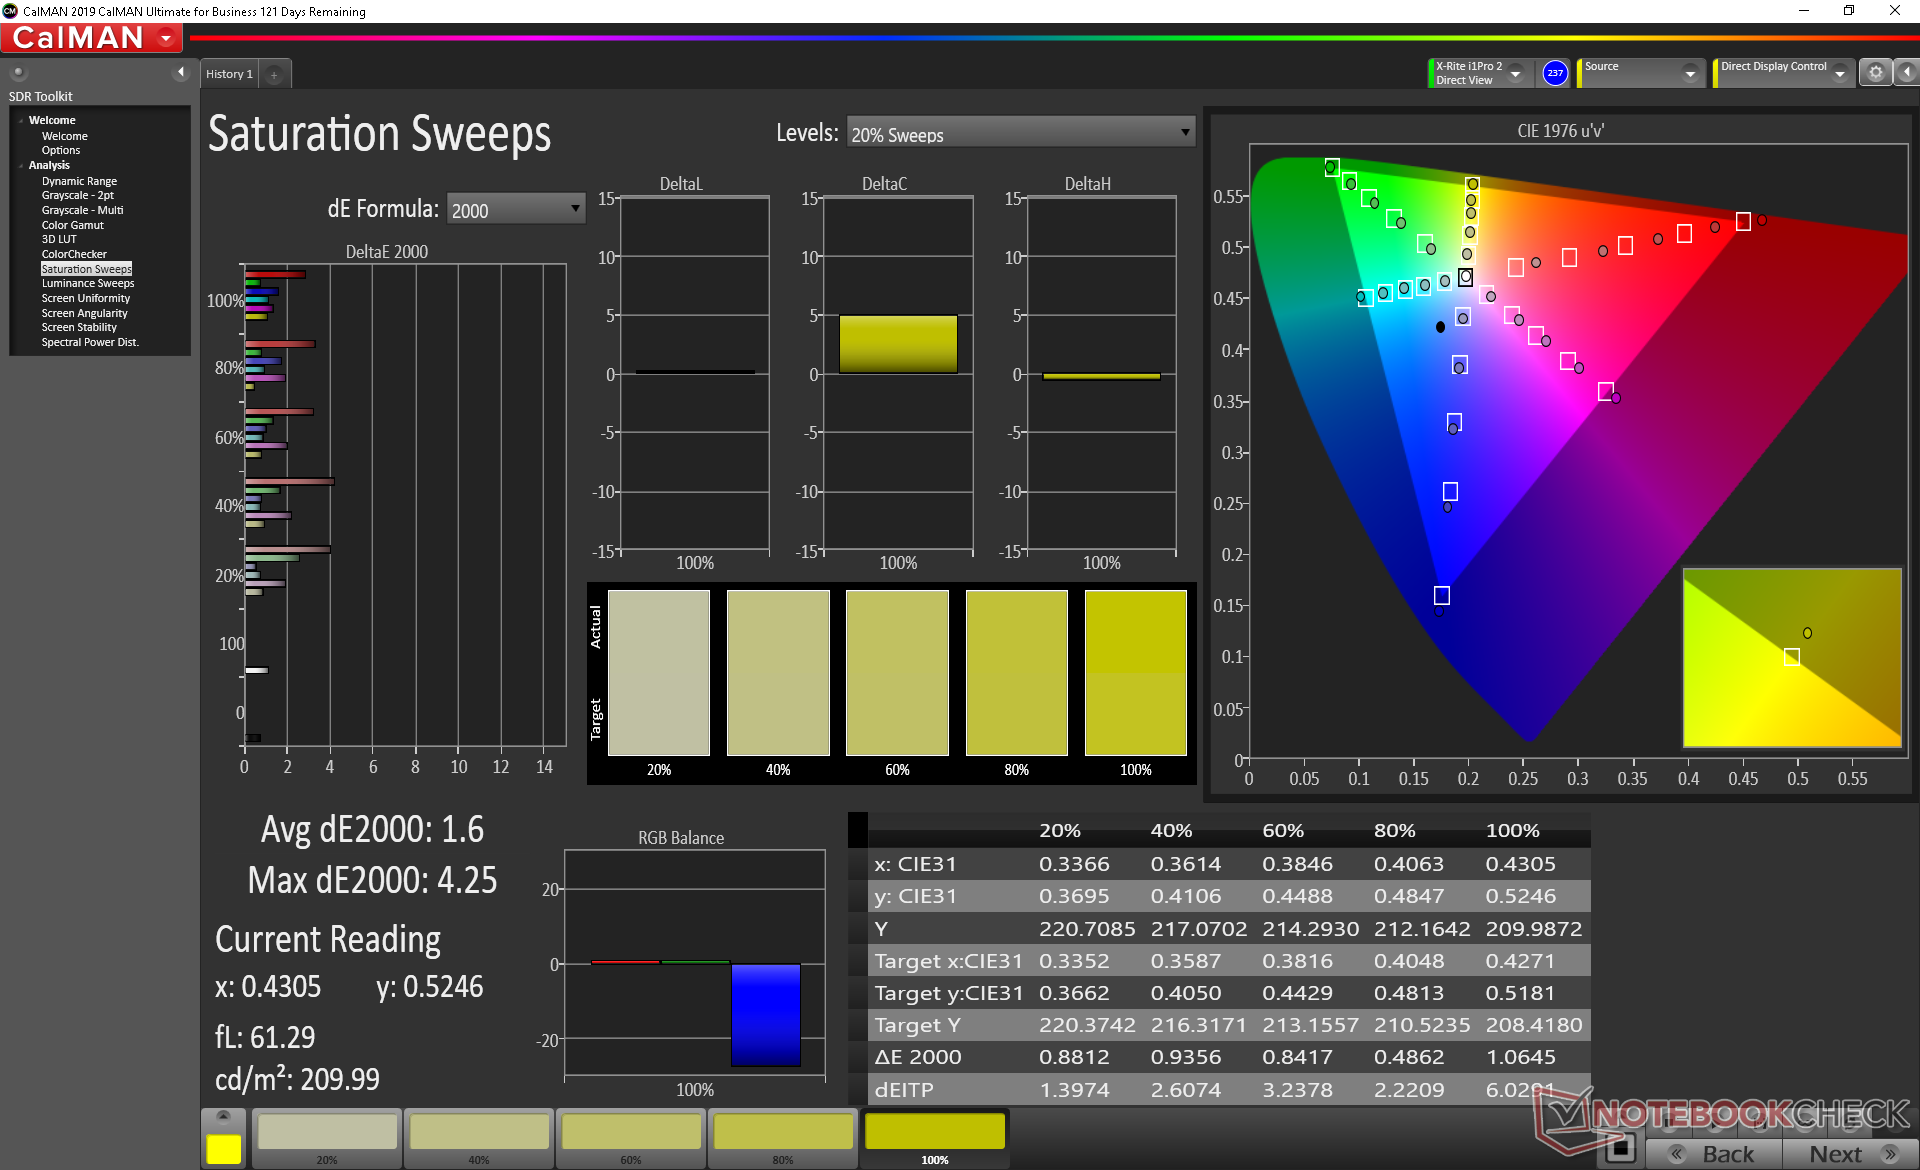
Lo spazio colore comprende tutta la gamma sRGB e circa il 90% della AdobeRGB, come nella maggior parte delle altre workstation di fascia alta o dei laptop multimediali.
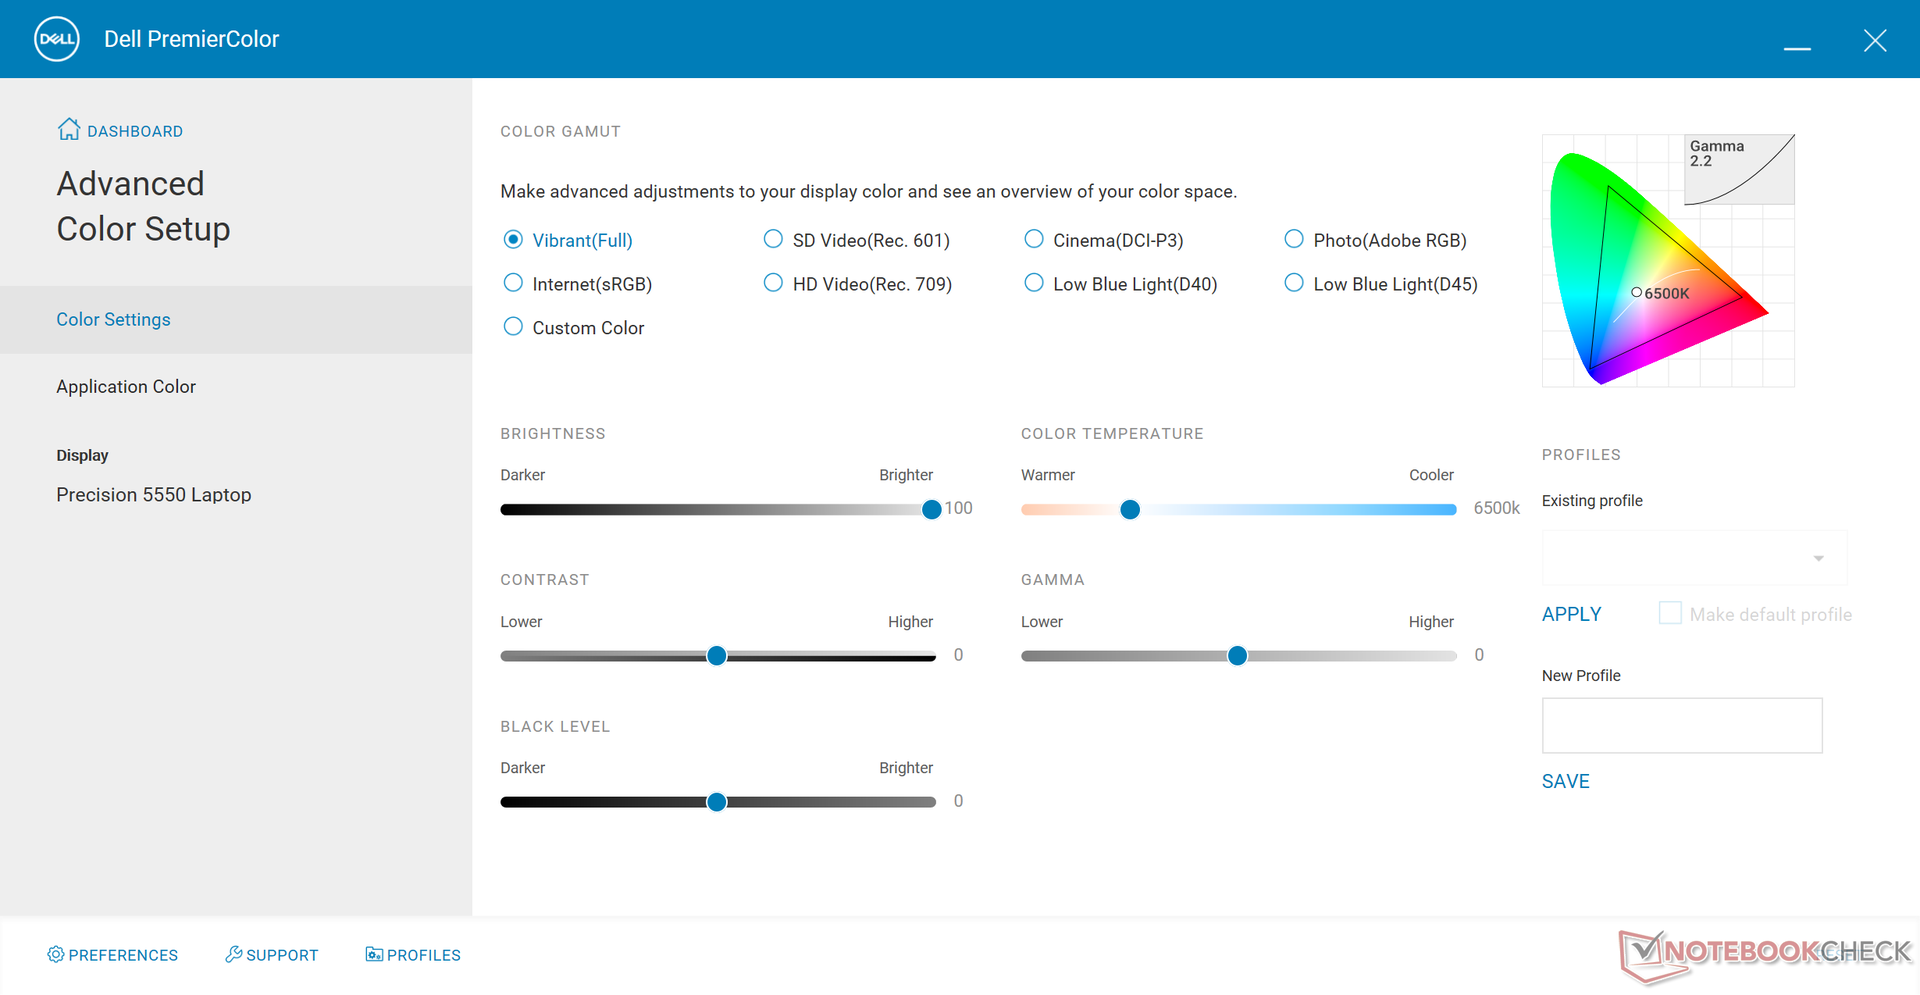
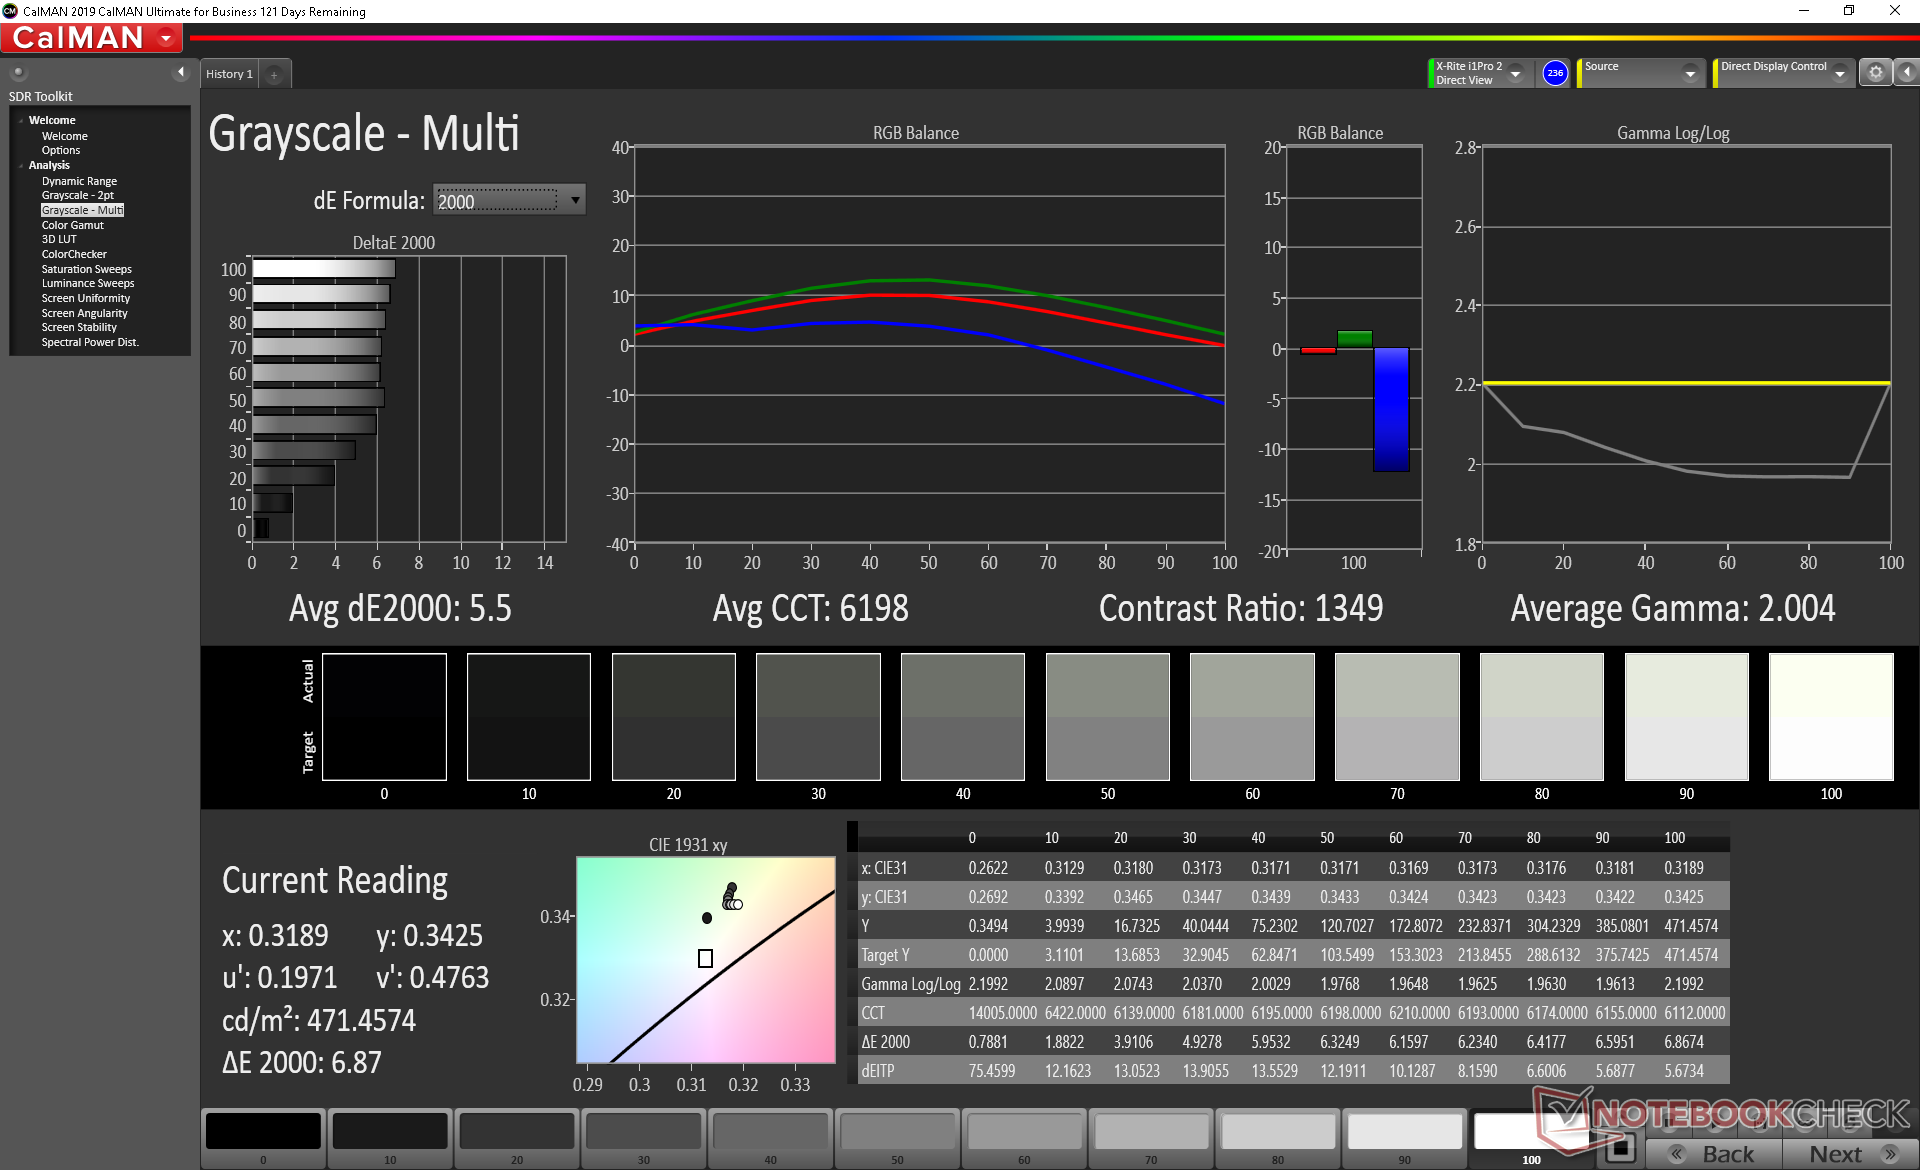
Ulteriori misurazioni con un colorimetro X-Rite rivelano una temperatura di colore troppo calda. Calibrando il pannello si riduce la scala di grigi media DeltaE da 5,5 ad appena 0,7, migliorando leggermente la precisione del colore nel processo. Gli utenti possono anche utilizzare Dell PremierColor per regolare manualmente i colori o salvare diversi profili.
Tempi di risposta del Display
| ↔ Tempi di risposta dal Nero al Bianco | ||
|---|---|---|
| 34 ms ... aumenta ↗ e diminuisce ↘ combinato | ↗ 17.6 ms Incremento | 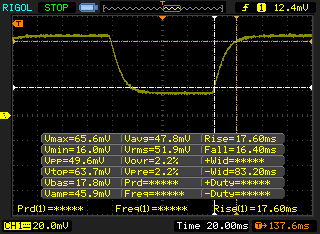 |
| ↘ 16.4 ms Calo | ||
| Lo schermo mostra tempi di risposta lenti nei nostri tests e sarà insoddisfacente per i gamers. In confronto, tutti i dispositivi di test variano da 0.1 (minimo) a 240 (massimo) ms. » 91 % di tutti i dispositivi è migliore. Questo significa che i tempi di risposta rilevati sono peggiori rispetto alla media di tutti i dispositivi testati (19.8 ms). | ||
| ↔ Tempo di risposta dal 50% Grigio all'80% Grigio | ||
| 46 ms ... aumenta ↗ e diminuisce ↘ combinato | ↗ 24 ms Incremento | 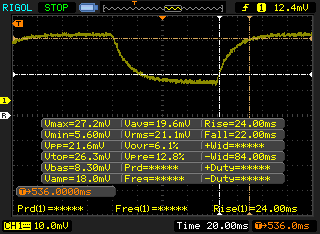 |
| ↘ 22 ms Calo | ||
| Lo schermo mostra tempi di risposta lenti nei nostri tests e sarà insoddisfacente per i gamers. In confronto, tutti i dispositivi di test variano da 0.165 (minimo) a 636 (massimo) ms. » 79 % di tutti i dispositivi è migliore. Questo significa che i tempi di risposta rilevati sono peggiori rispetto alla media di tutti i dispositivi testati (31 ms). | ||
Sfarfallio dello schermo / PWM (Pulse-Width Modulation)
| flickering dello schermo / PWM non rilevato | 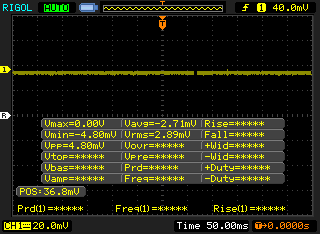 | ||
In confronto: 52 % di tutti i dispositivi testati non utilizza PWM per ridurre la luminosita' del display. Se è rilevato PWM, una media di 7781 (minimo: 5 - massimo: 343500) Hz è stata rilevata. | |||
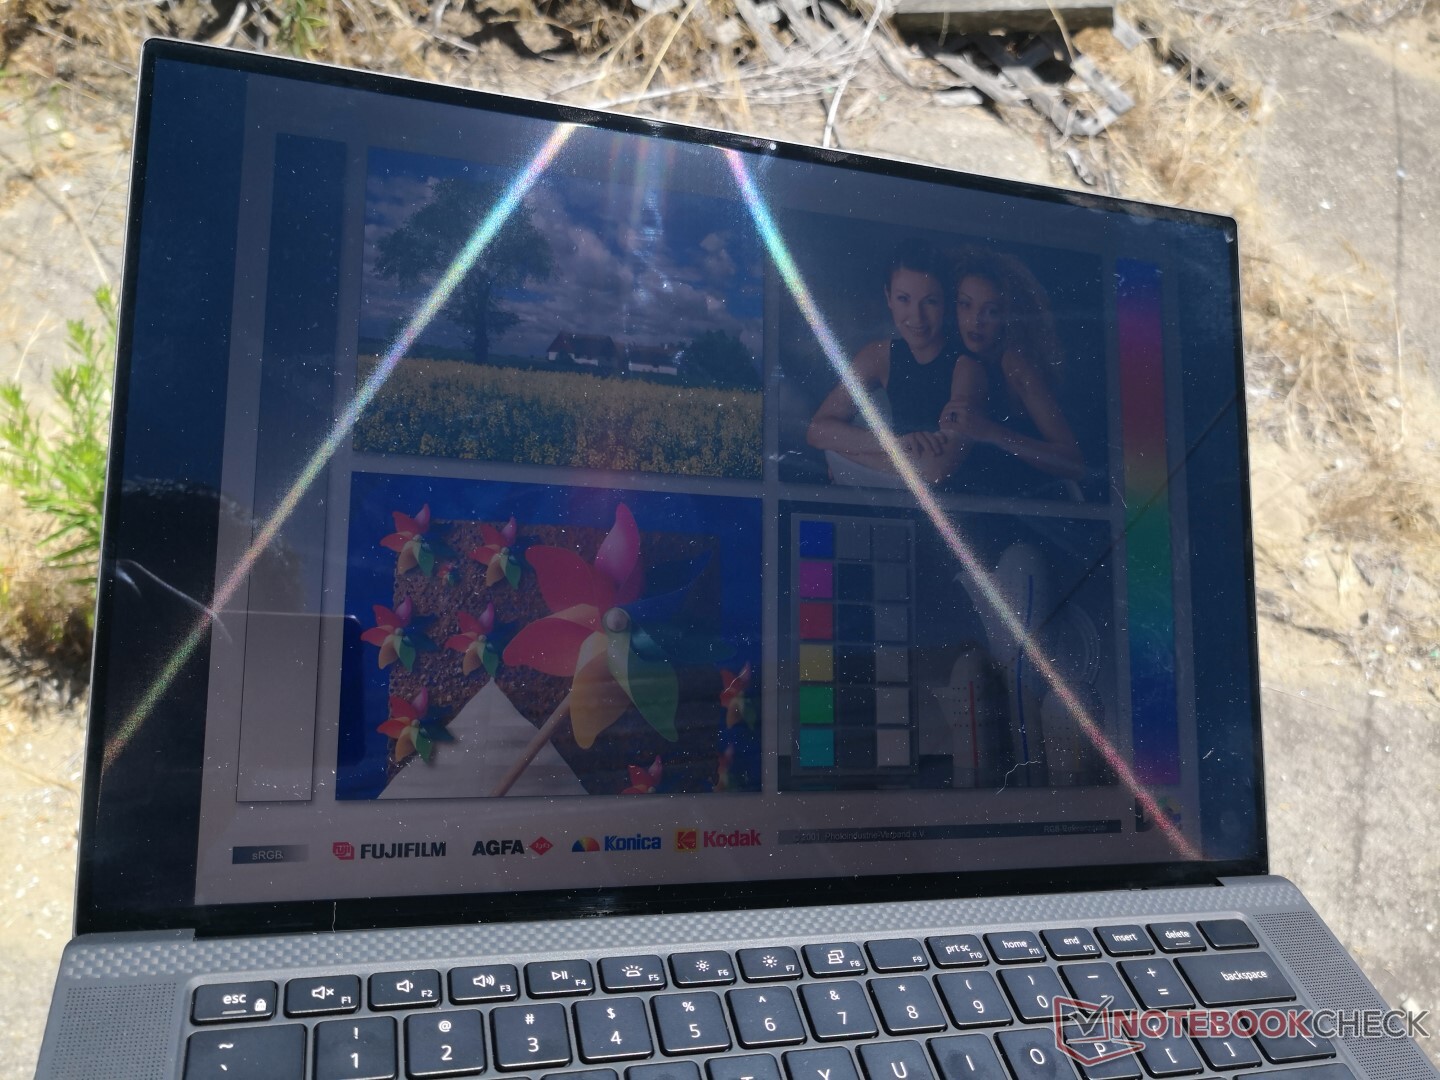
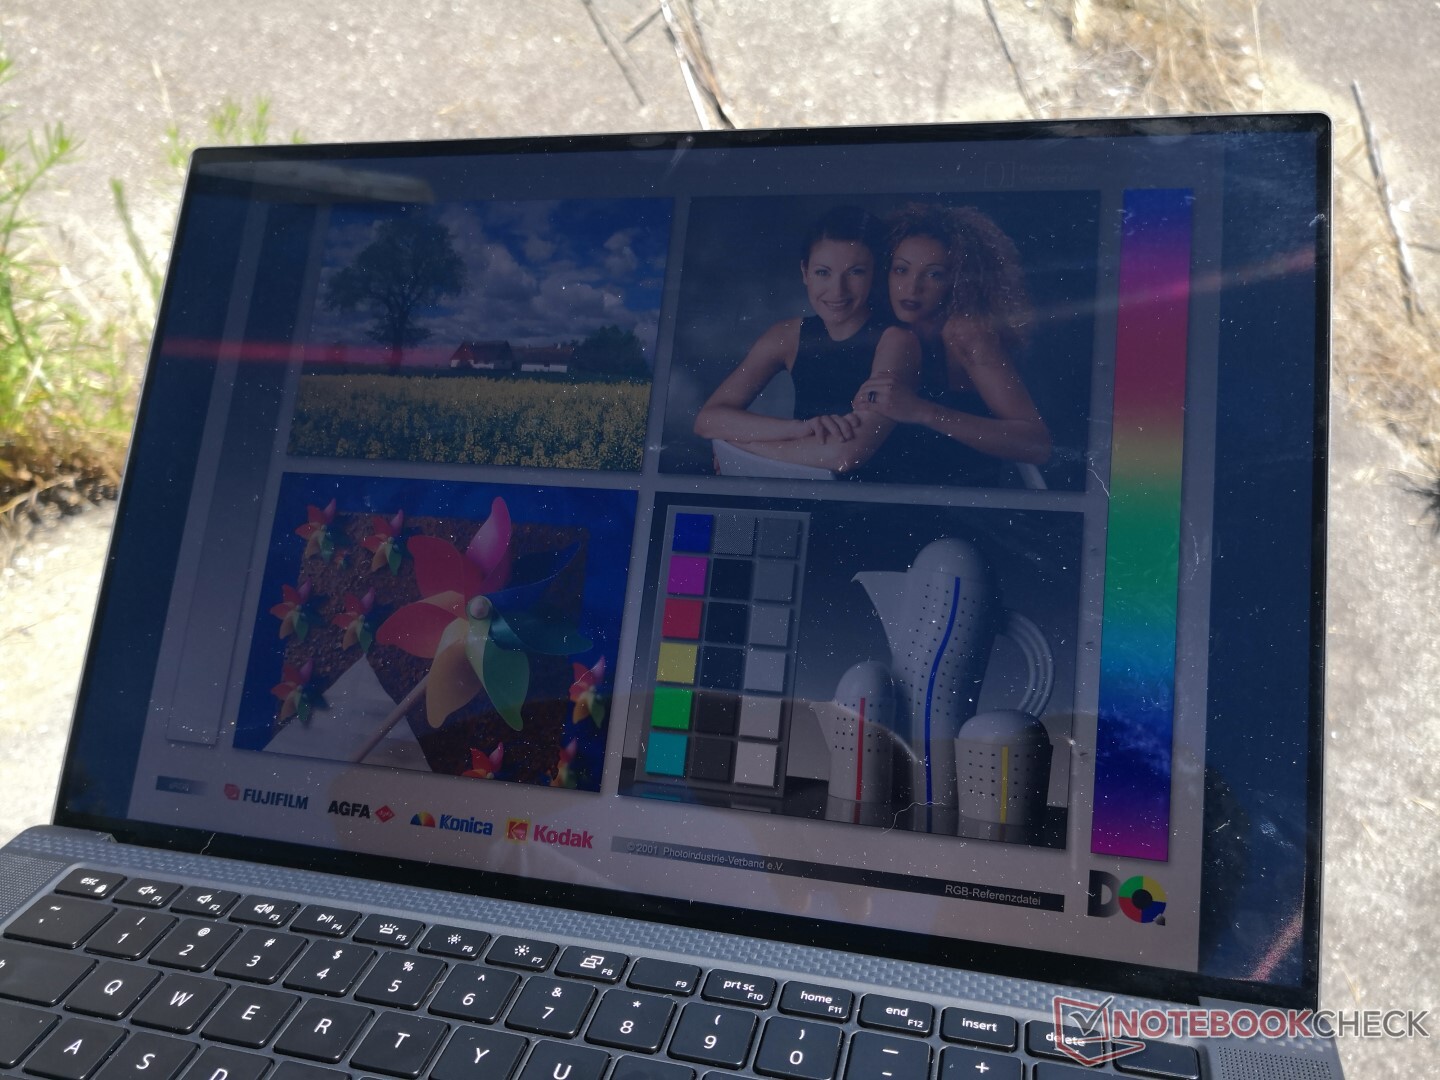
Anche se il display è più luminoso della maggior parte delle altre workstation mobili, la copertura lucida contribuisce a creare più riflessi del solito. Preferirete aumentare la luminosità e rimanere all'ombra quando possibile per massimizzare la visibilità.
Prestazioni
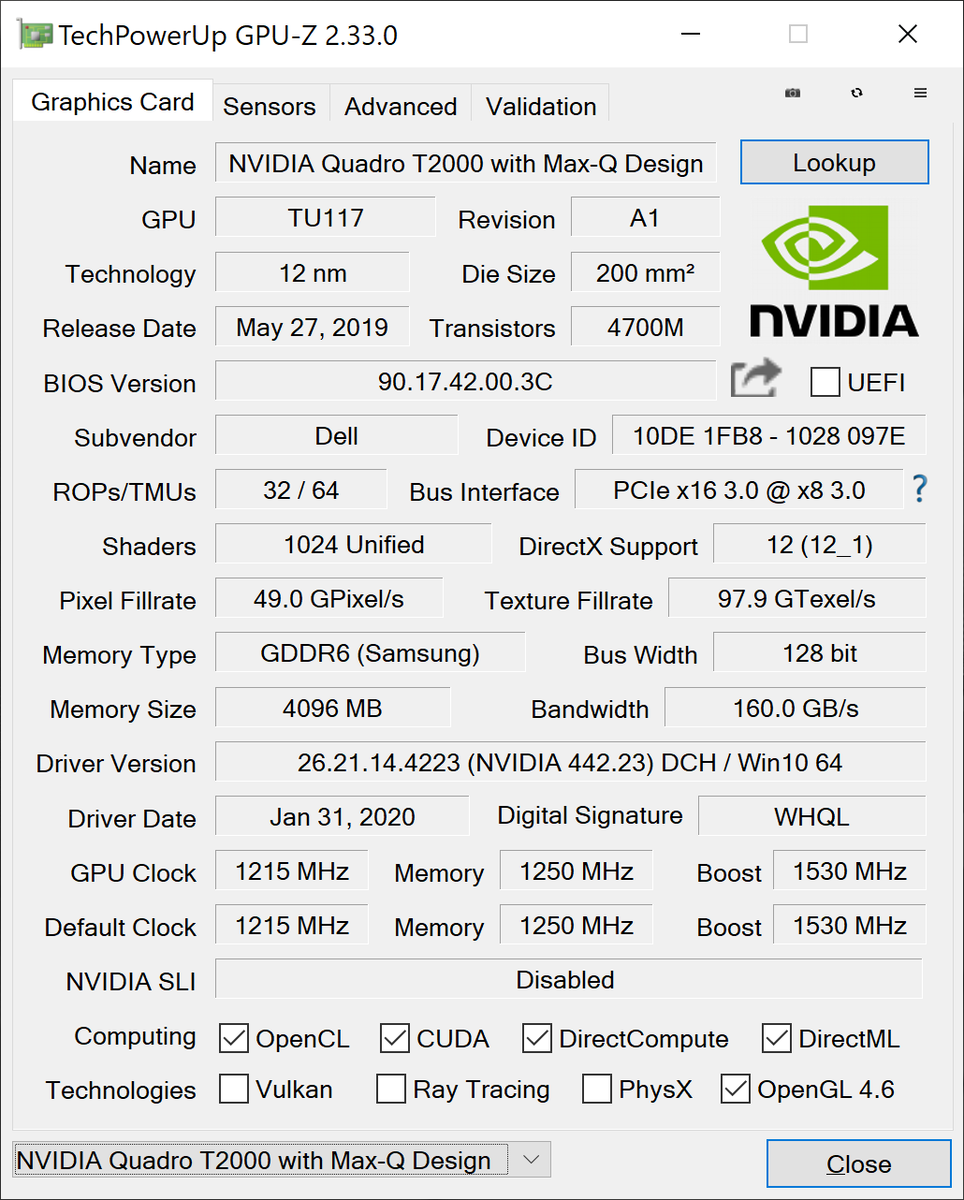
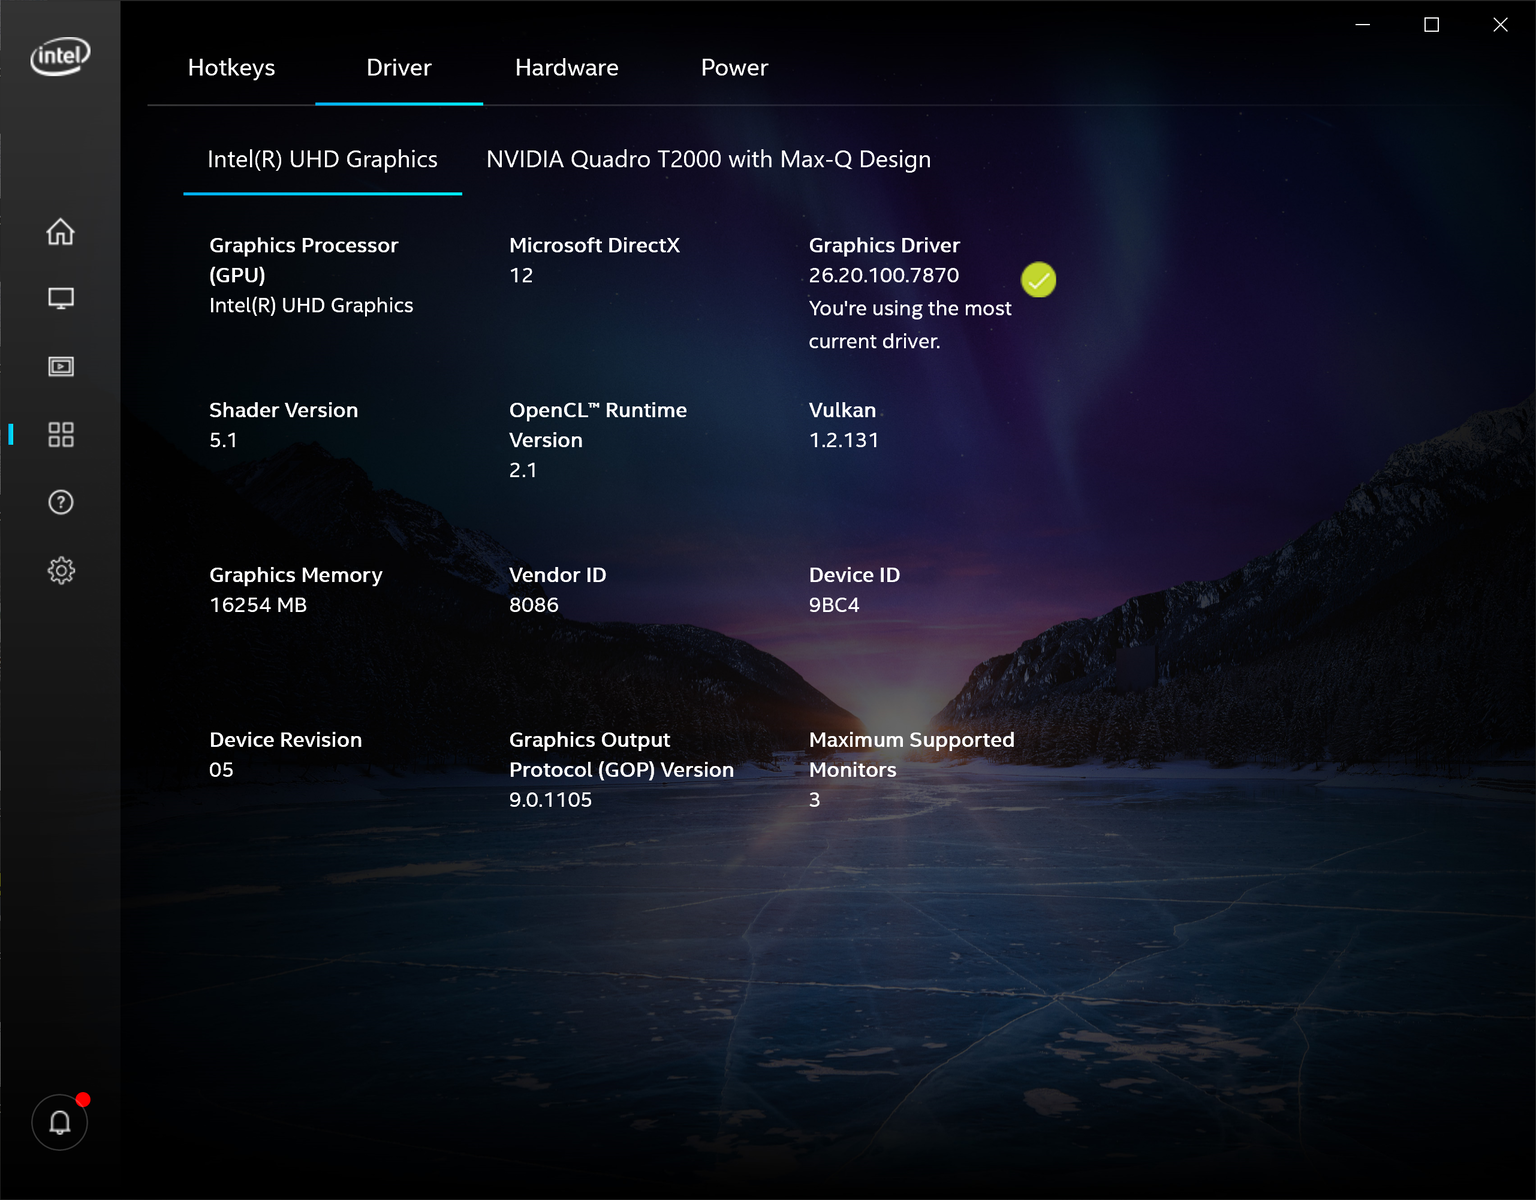
La nostra configurazione utilizza la Quadro T2000 Max-Q derivata dalla GeForce GTX 1650 Ti Max-Q sull'XPS 15 9500 originale. È disponibile anche un'opzione Quadro T1000, ma non possiamo dire con certezza se si tratta della T1000 standard o della T1000 Max-Q. Le GPU più veloci come la Quadro T3000 Max-Q e superiori sono riservate alla serie Precision 7550 di Dell, più spessa e di fascia alta.
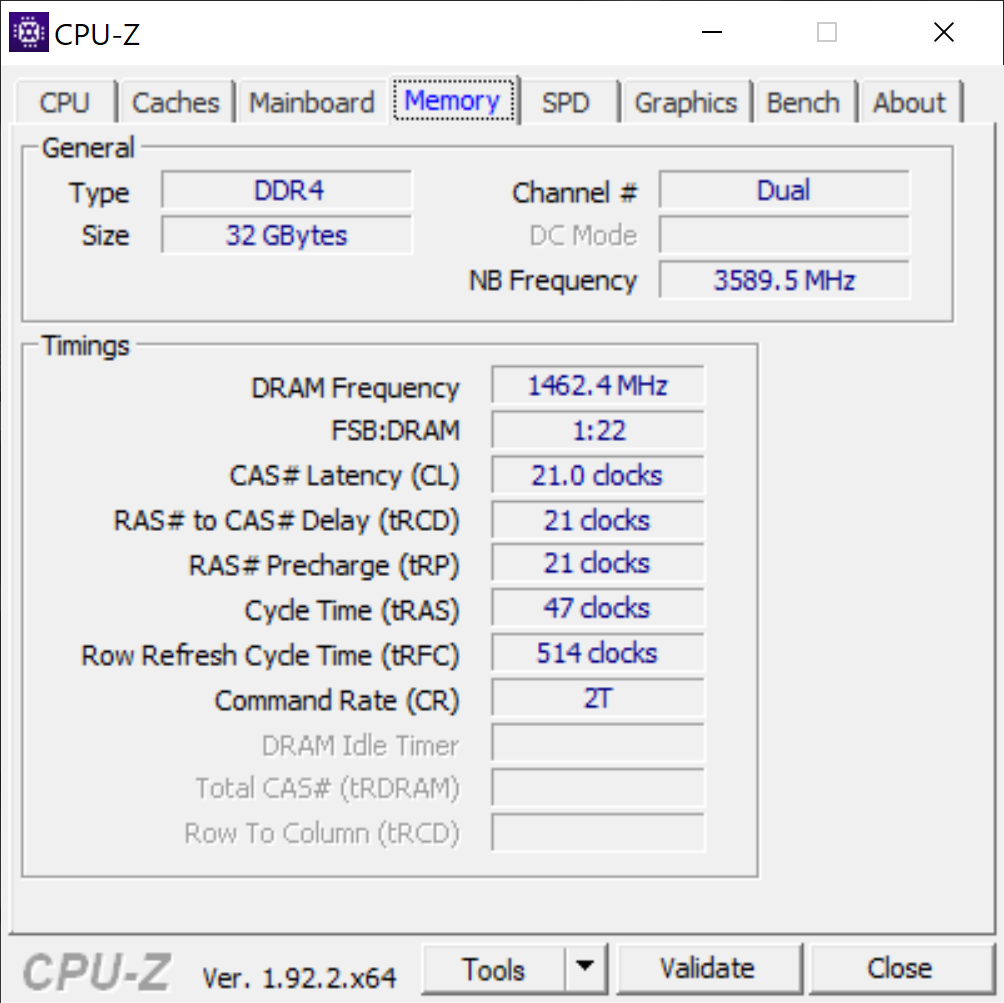
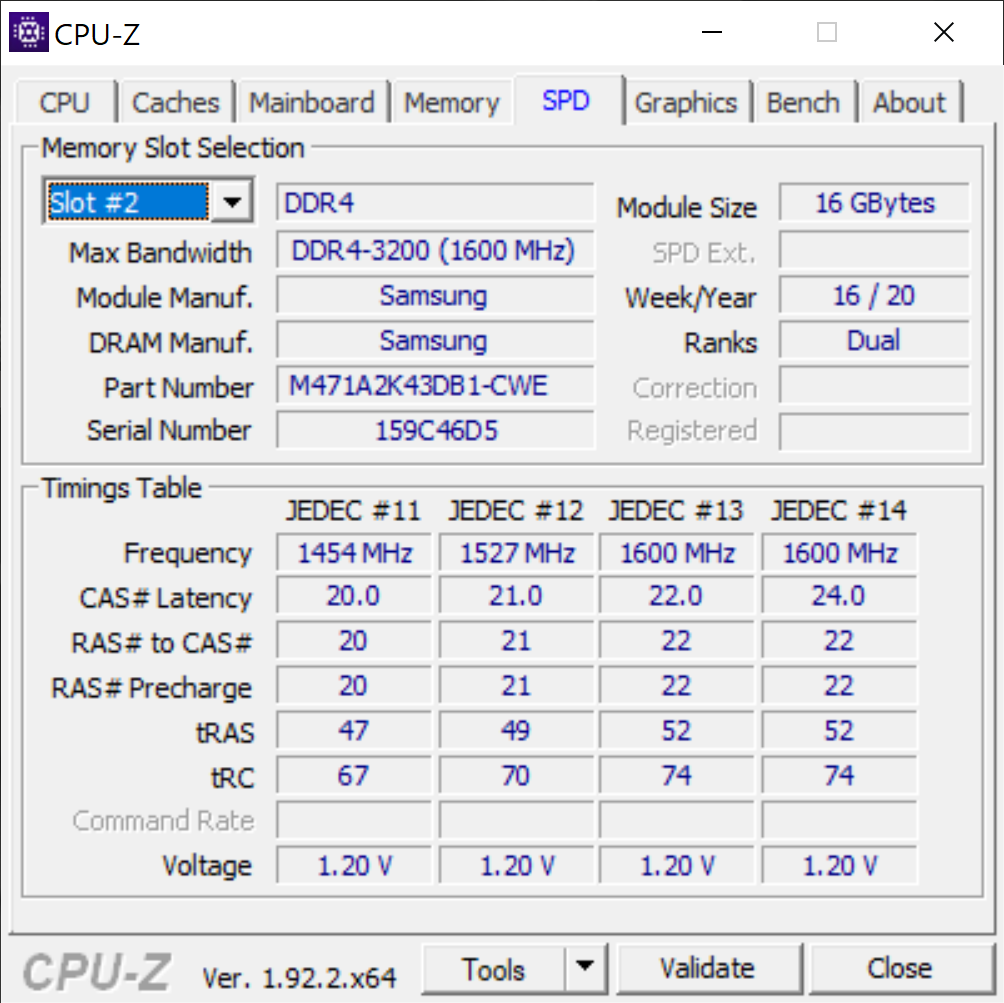
La RAM è aggiornabile fino a 64 GB con supporto ECC se configurata con una CPU Xeon. Nvidia Optimus viene fornito di serie sulle versioni Quadro per garantire lo switching automatico della grafica.
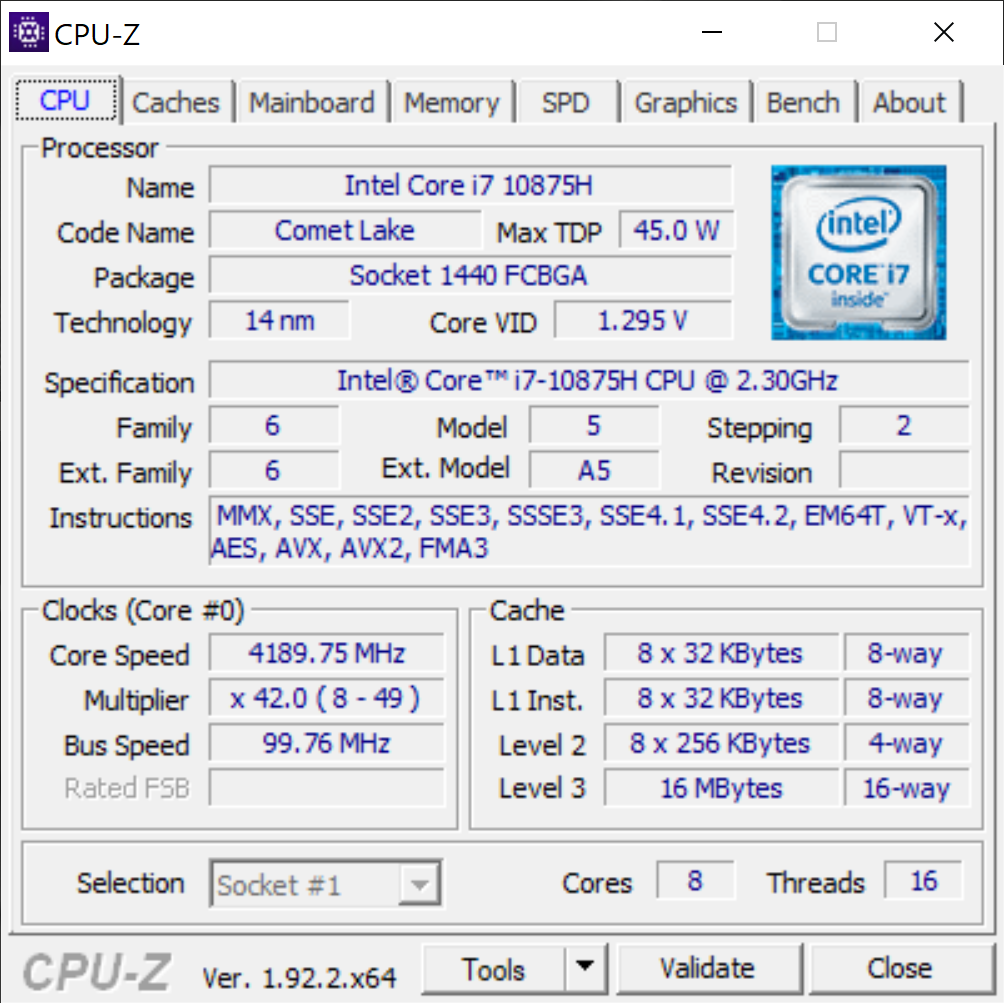
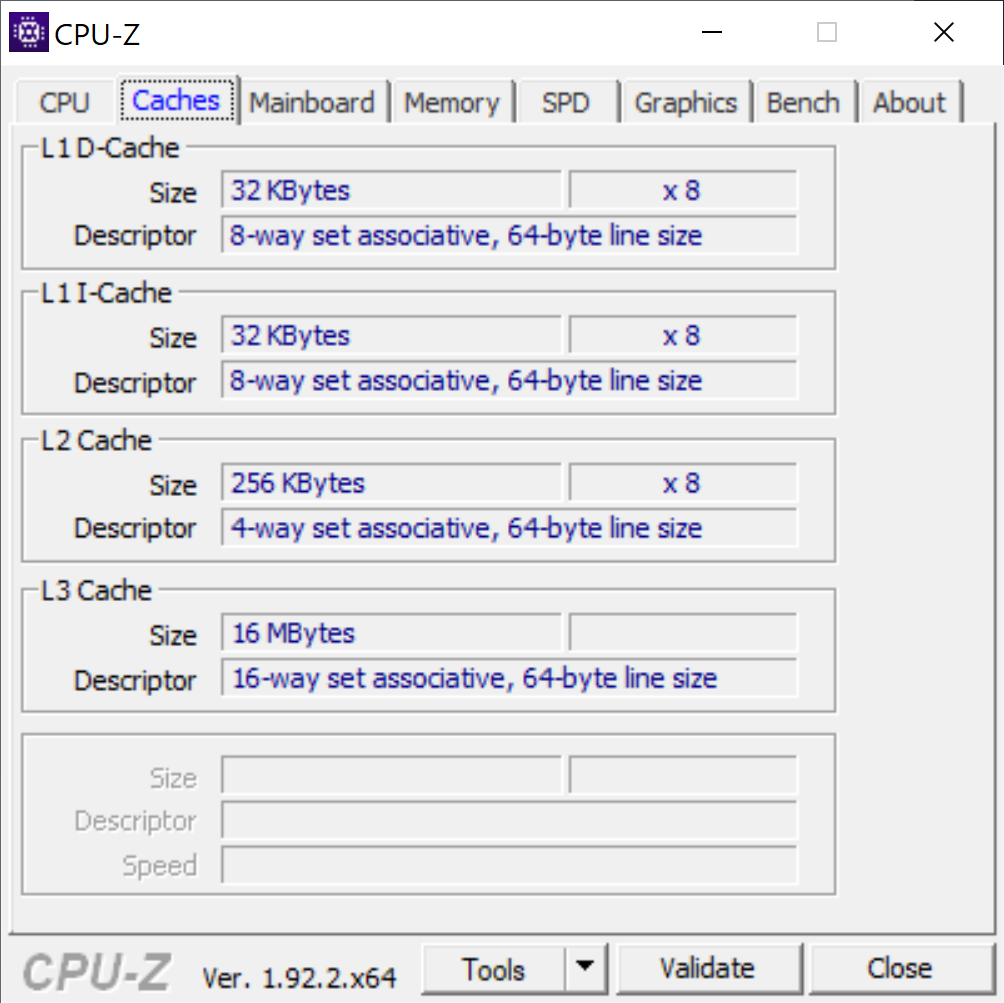
Processore
Forse non sorprende che le prestazioni della CPU siano molto simili a quelle che abbiamo registrato sull'XPS 15 9500, fino ad arrivare ad un throttling simile. La stessa identica CPU che abbiamo trovato sul Razer Blade 15 Studio Edition funziona quasi il 20% più lentamente che sul nostro Dell Precision. Gli utenti che passano dal quad-core Core i5-10400H o hexa-core Core i7-10750H al nostro octa-core Core i7-10875H vedranno circa il 60% e il 20% in più di prestazioni del processore, rispettivamente.
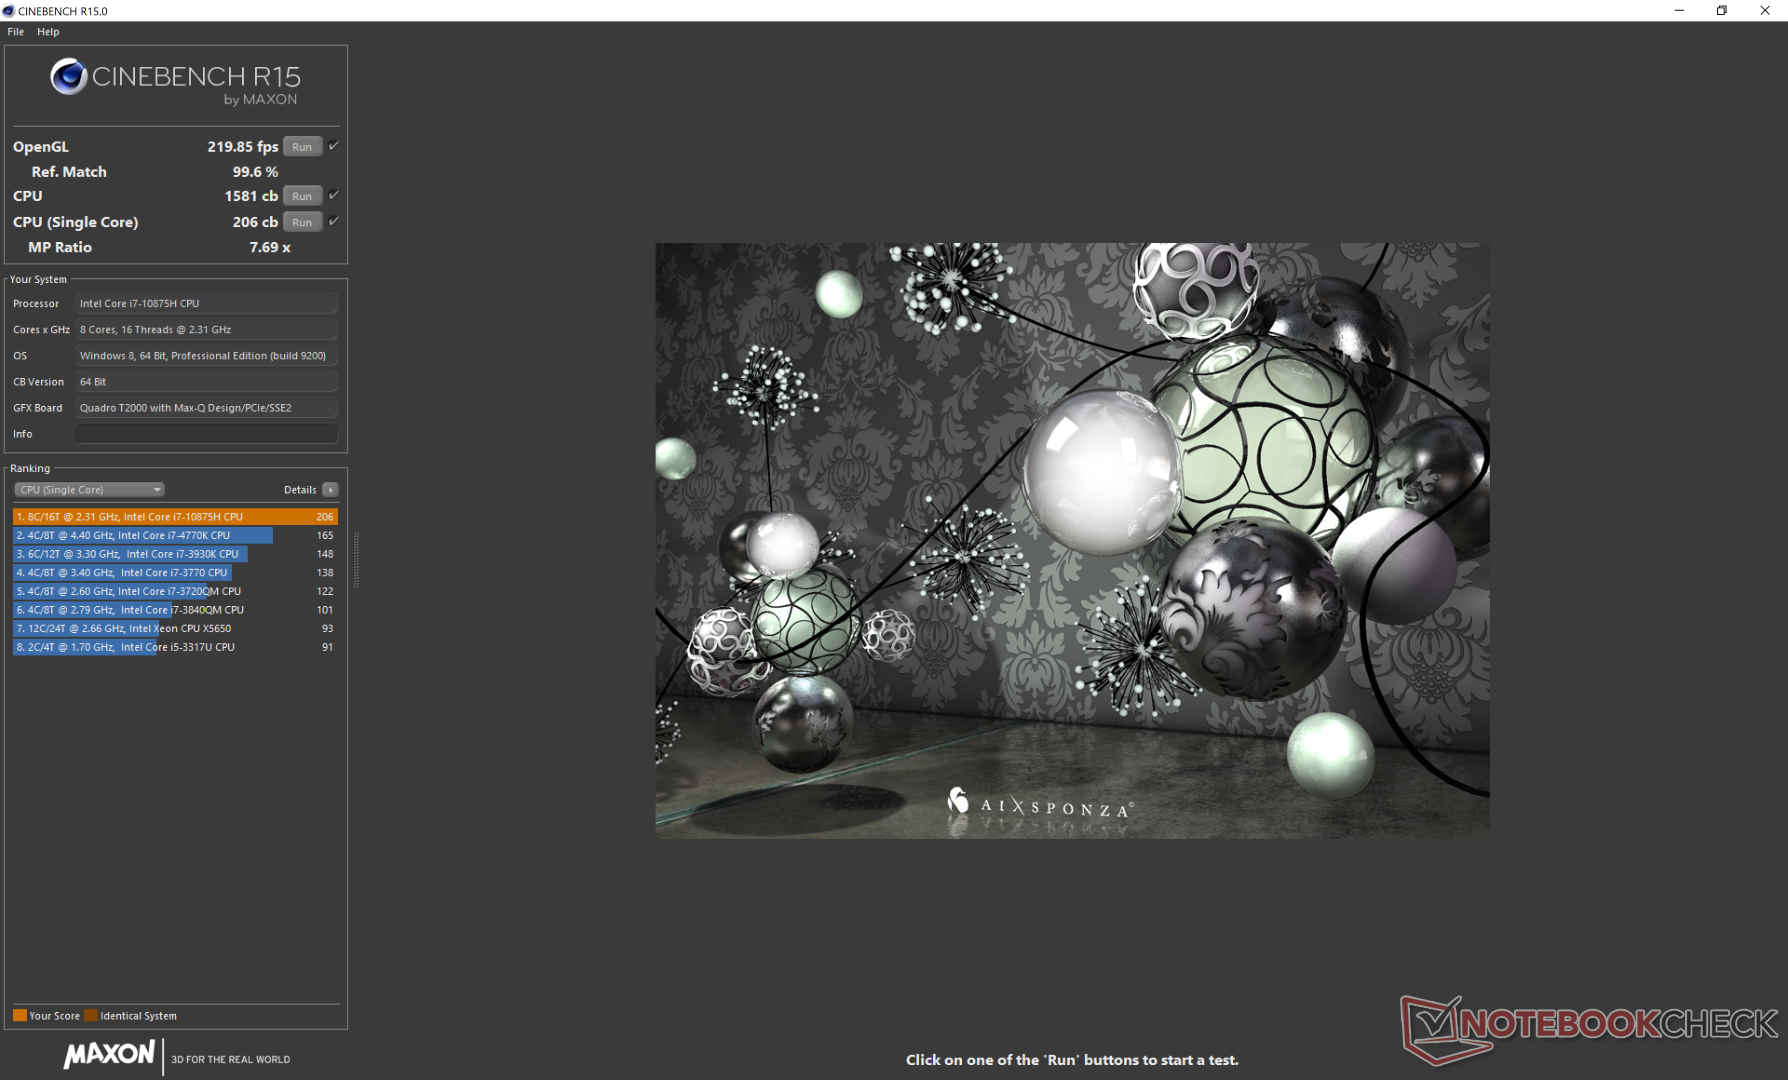
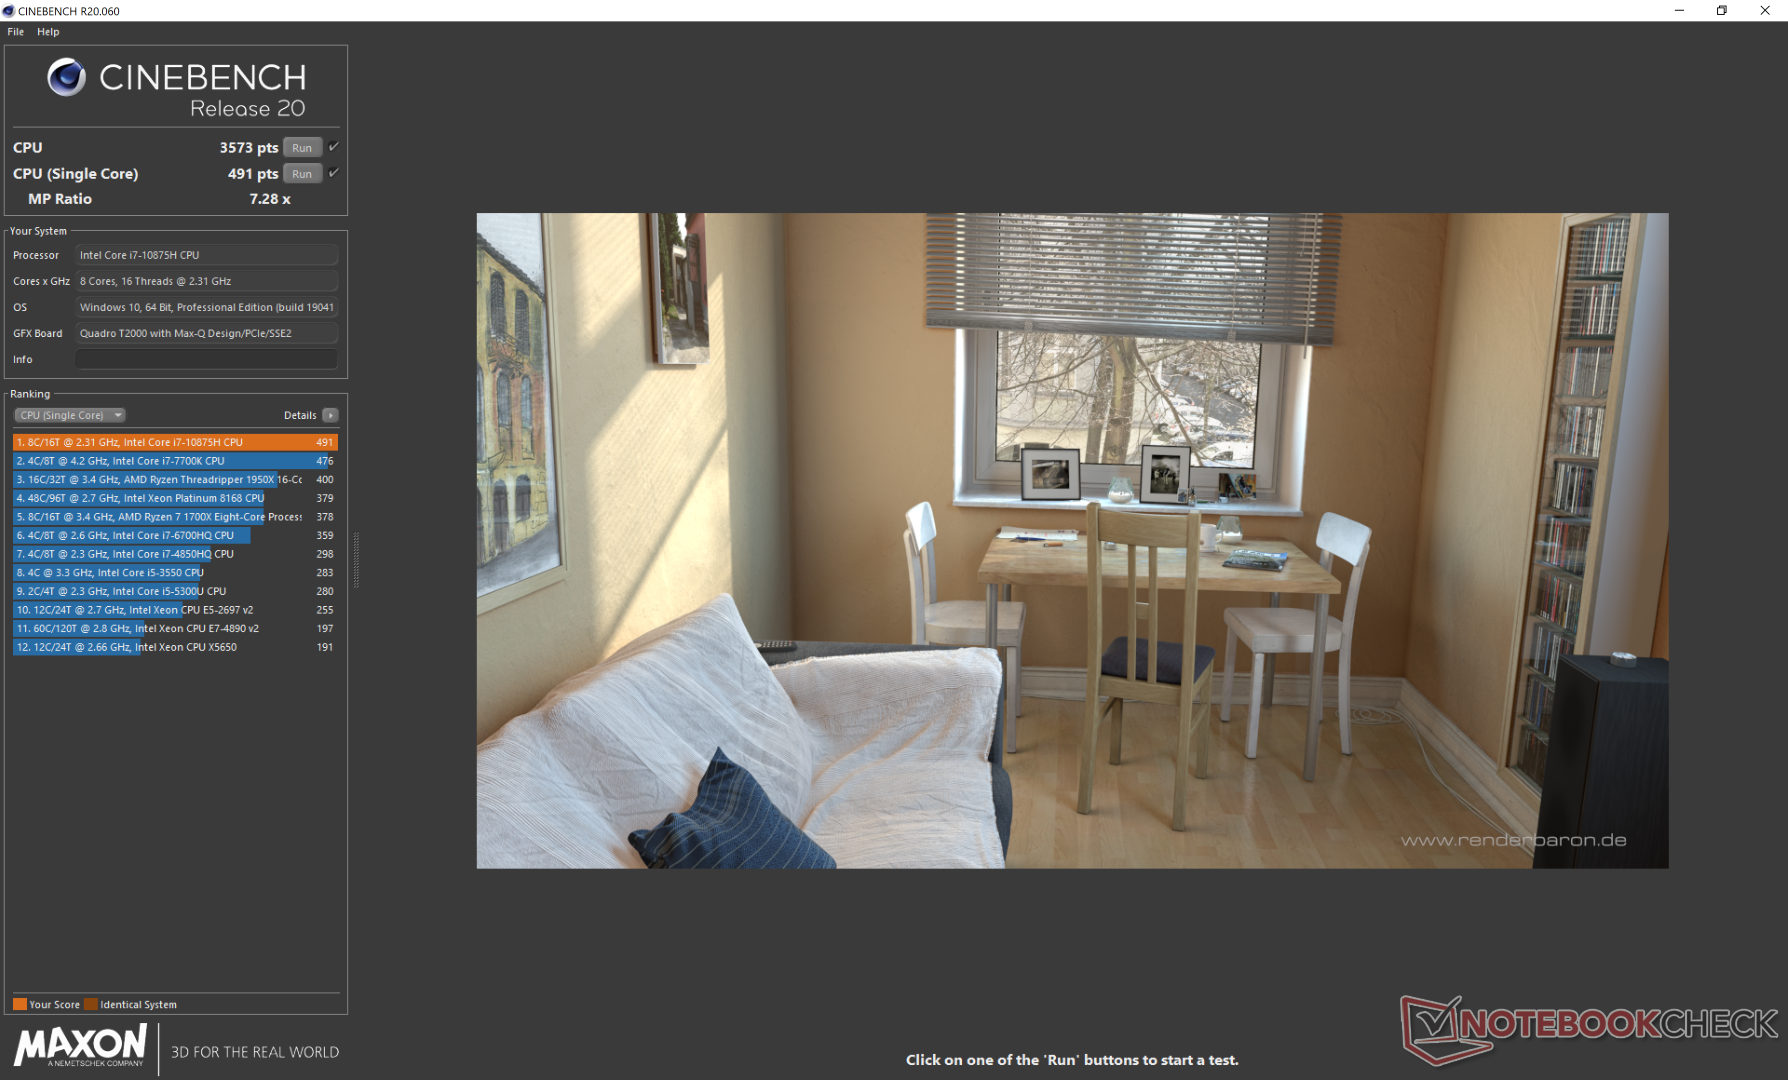
Cinebench R15: CPU Multi 64Bit | CPU Single 64Bit
Blender: v2.79 BMW27 CPU
7-Zip 18.03: 7z b 4 -mmt1 | 7z b 4
Geekbench 5.5: Single-Core | Multi-Core
HWBOT x265 Benchmark v2.2: 4k Preset
LibreOffice : 20 Documents To PDF
R Benchmark 2.5: Overall mean
| Geekbench 5.5 / Single-Core | |
| Asus ROG Zephyrus Duo 15 GX550LXS | |
| Dell Precision 5550 P91F | |
| Media Intel Core i7-10875H (1233 - 1371, n=29) | |
| Razer Blade 15 Studio Edition 2020 | |
| Eluktronics RP-15 | |
| MSI GS66 Stealth 10SE-045 | |
| Dell XPS 15 9500 Core i5 | |
| Geekbench 5.5 / Multi-Core | |
| Eluktronics RP-15 | |
| Asus ROG Zephyrus Duo 15 GX550LXS | |
| Dell Precision 5550 P91F | |
| Media Intel Core i7-10875H (5715 - 8620, n=29) | |
| Razer Blade 15 Studio Edition 2020 | |
| MSI GS66 Stealth 10SE-045 | |
| Dell XPS 15 9500 Core i5 | |
| HWBOT x265 Benchmark v2.2 / 4k Preset | |
| Eluktronics RP-15 | |
| Asus ROG Zephyrus Duo 15 GX550LXS | |
| Media Intel Core i7-10875H (7.27 - 14.1, n=27) | |
| Dell Precision 5540 | |
| Dell Precision 5550 P91F | |
| Razer Blade 15 Studio Edition 2020 | |
| MSI GS66 Stealth 10SE-045 | |
| Lenovo ThinkPad P53-20QN000YGE | |
| Schenker Work 15 | |
| Schenker Work 15 | |
| Dell XPS 15 9500 Core i5 | |
| LibreOffice / 20 Documents To PDF | |
| Dell XPS 15 9500 Core i5 | |
| Eluktronics RP-15 | |
| MSI GS66 Stealth 10SE-045 | |
| Asus ROG Zephyrus Duo 15 GX550LXS | |
| Media Intel Core i7-10875H (30.2 - 84.3, n=30) | |
| Razer Blade 15 Studio Edition 2020 | |
| Dell Precision 5550 P91F | |
| R Benchmark 2.5 / Overall mean | |
| Dell XPS 15 9500 Core i5 | |
| MSI GS66 Stealth 10SE-045 | |
| Dell Precision 5550 P91F | |
| Razer Blade 15 Studio Edition 2020 | |
| Asus ROG Zephyrus Duo 15 GX550LXS | |
| Media Intel Core i7-10875H (0.546 - 0.662, n=29) | |
| Eluktronics RP-15 | |
* ... Meglio usare valori piccoli
Prestazioni di sistema
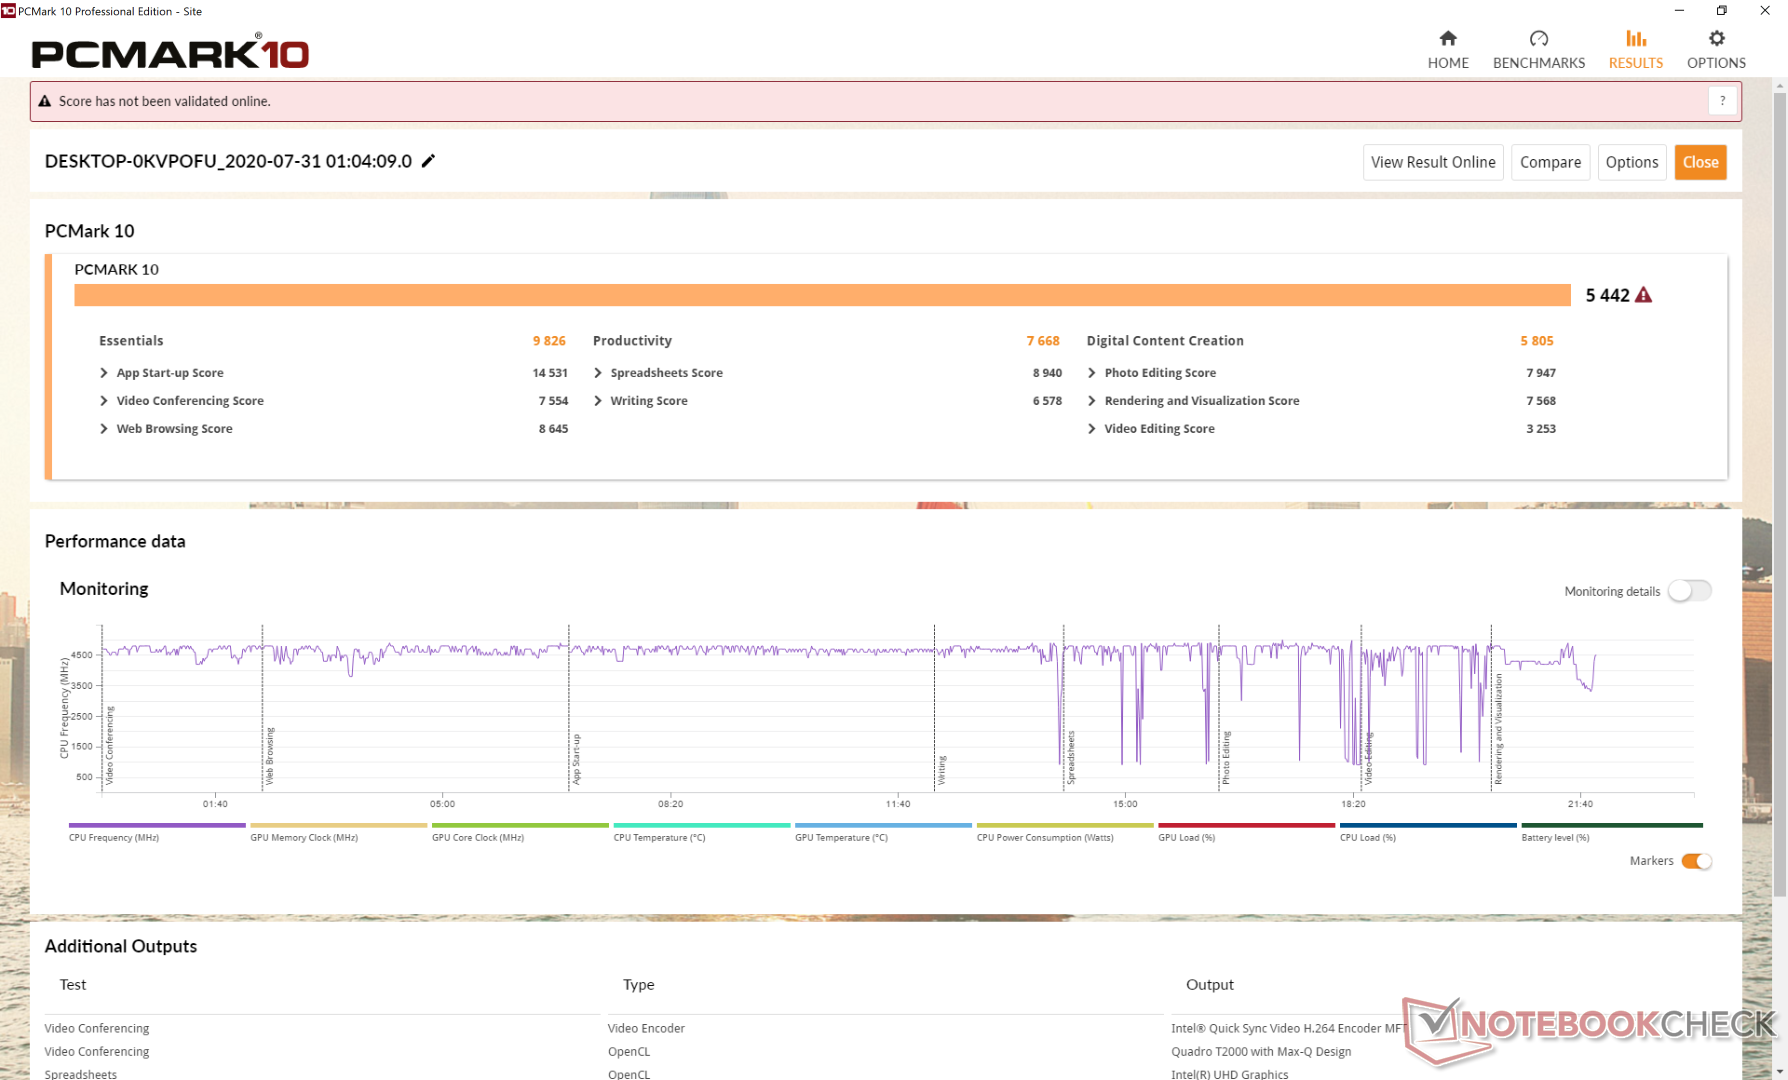
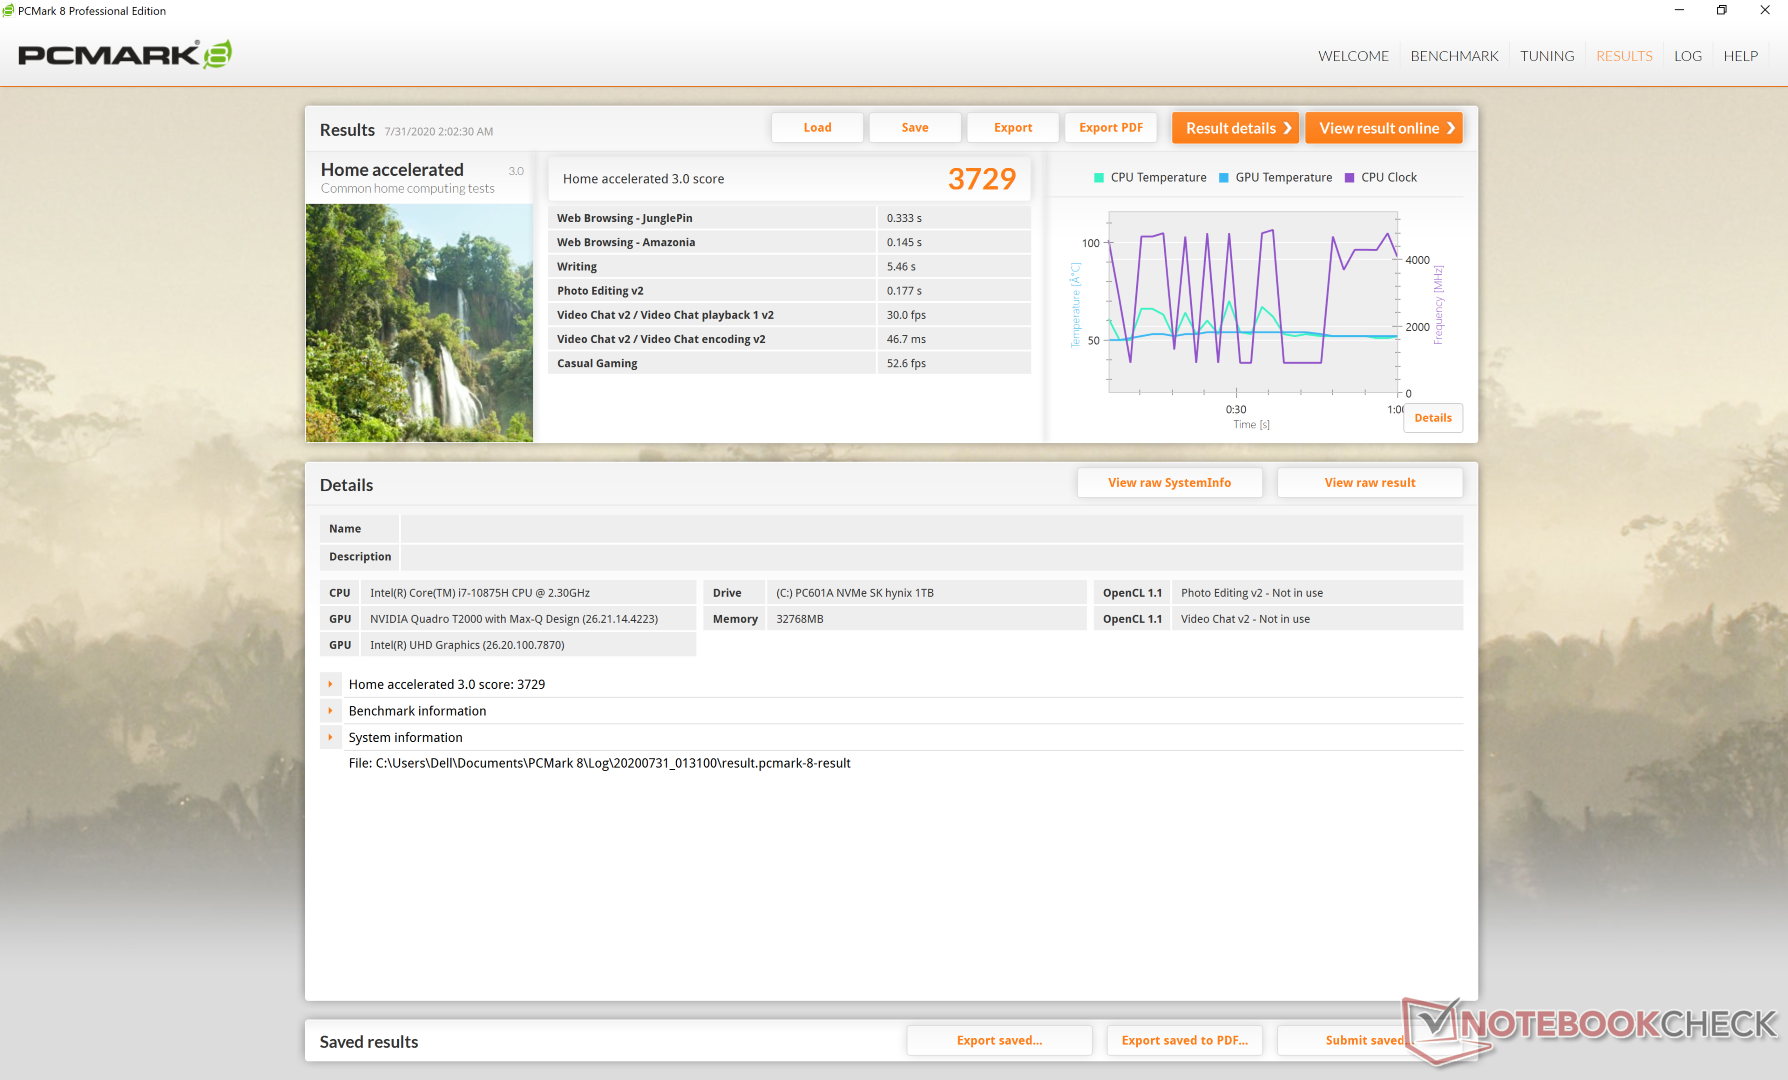
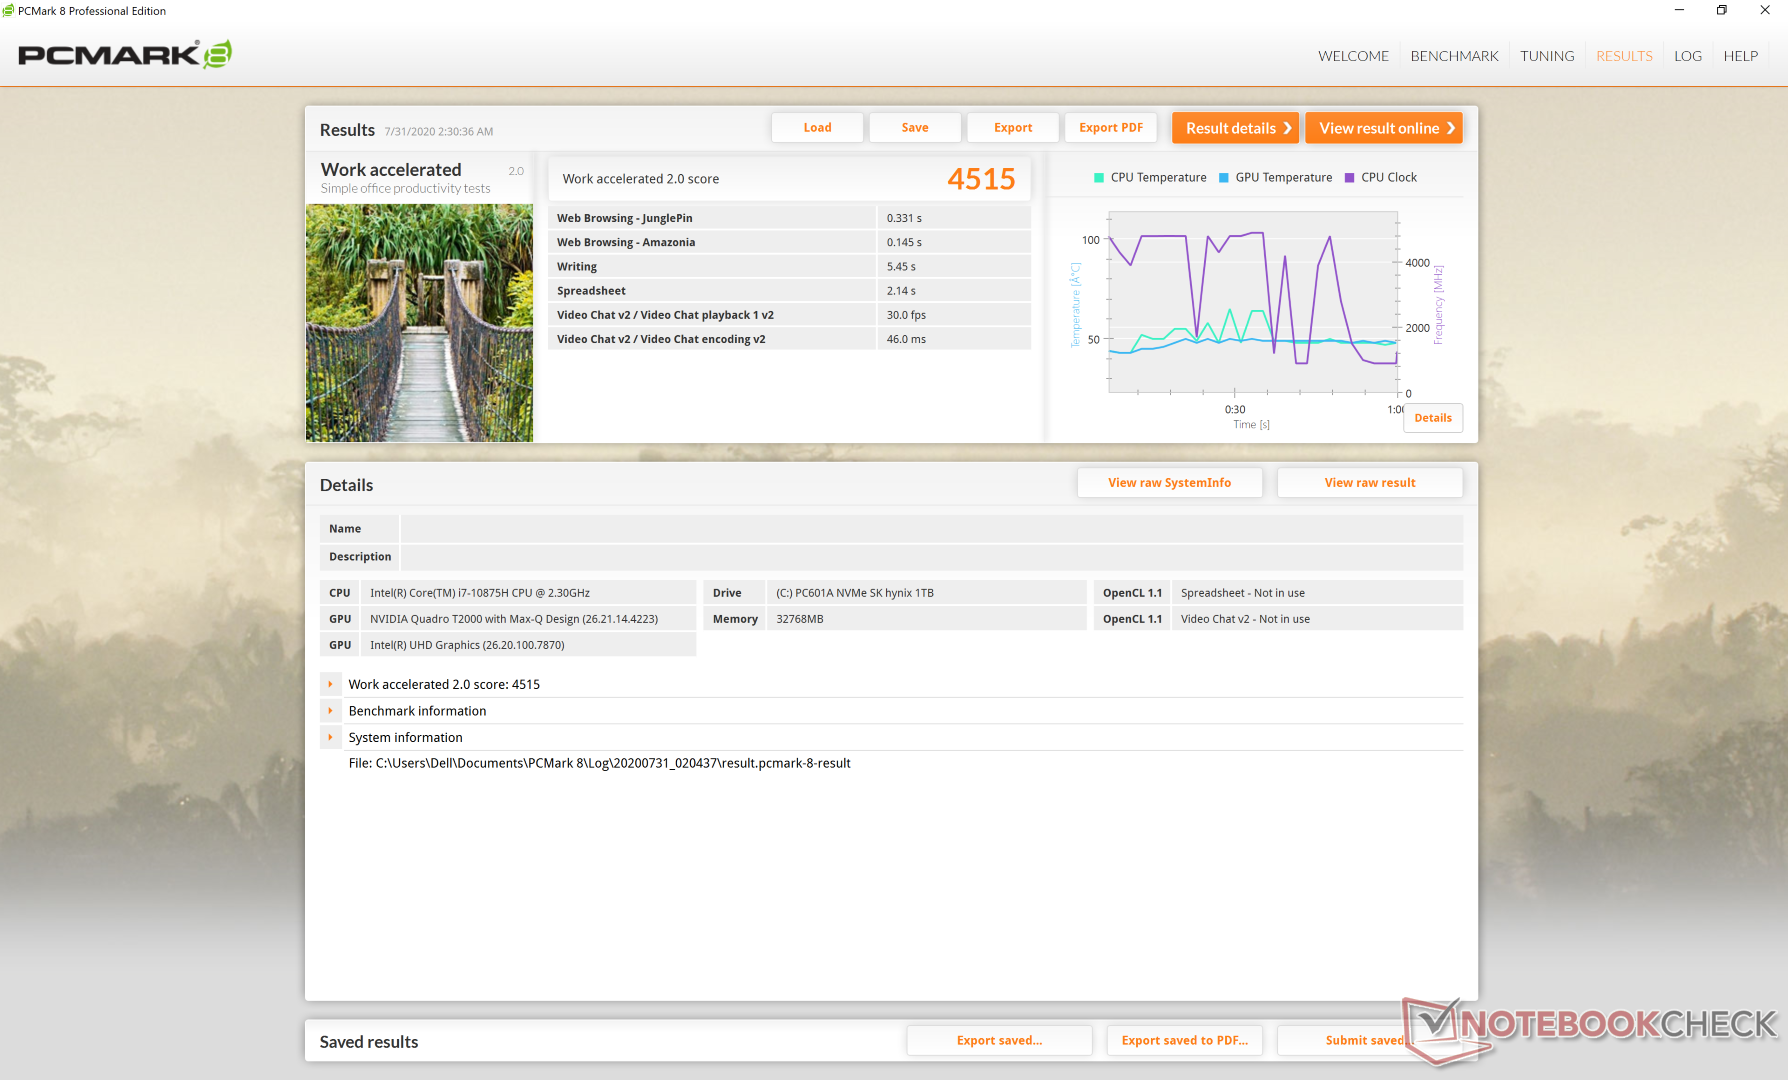
I benchmarks PCMark sono entro pochi punti percentuali rispetto al Precision 5540 dell'anno scorso il che suggerisce che si comportano in modo simile nei carichi giornalieri.
| PCMark 8 | |
| Home Score Accelerated v2 | |
| MSI WP65 | |
| Acer ConceptD 3 Pro CN315-71P-73W1 | |
| Dell Precision 5550 P91F | |
| Dell Precision 5540 | |
| Razer Blade 15 Studio Edition 2020 | |
| Work Score Accelerated v2 | |
| Acer ConceptD 3 Pro CN315-71P-73W1 | |
| MSI WP65 | |
| Razer Blade 15 Studio Edition 2020 | |
| Dell Precision 5540 | |
| Dell Precision 5550 P91F | |
| PCMark 8 Home Score Accelerated v2 | 3729 punti | |
| PCMark 8 Work Score Accelerated v2 | 4515 punti | |
| PCMark 10 Score | 5442 punti | |
Aiuto | ||
Latenza DPC
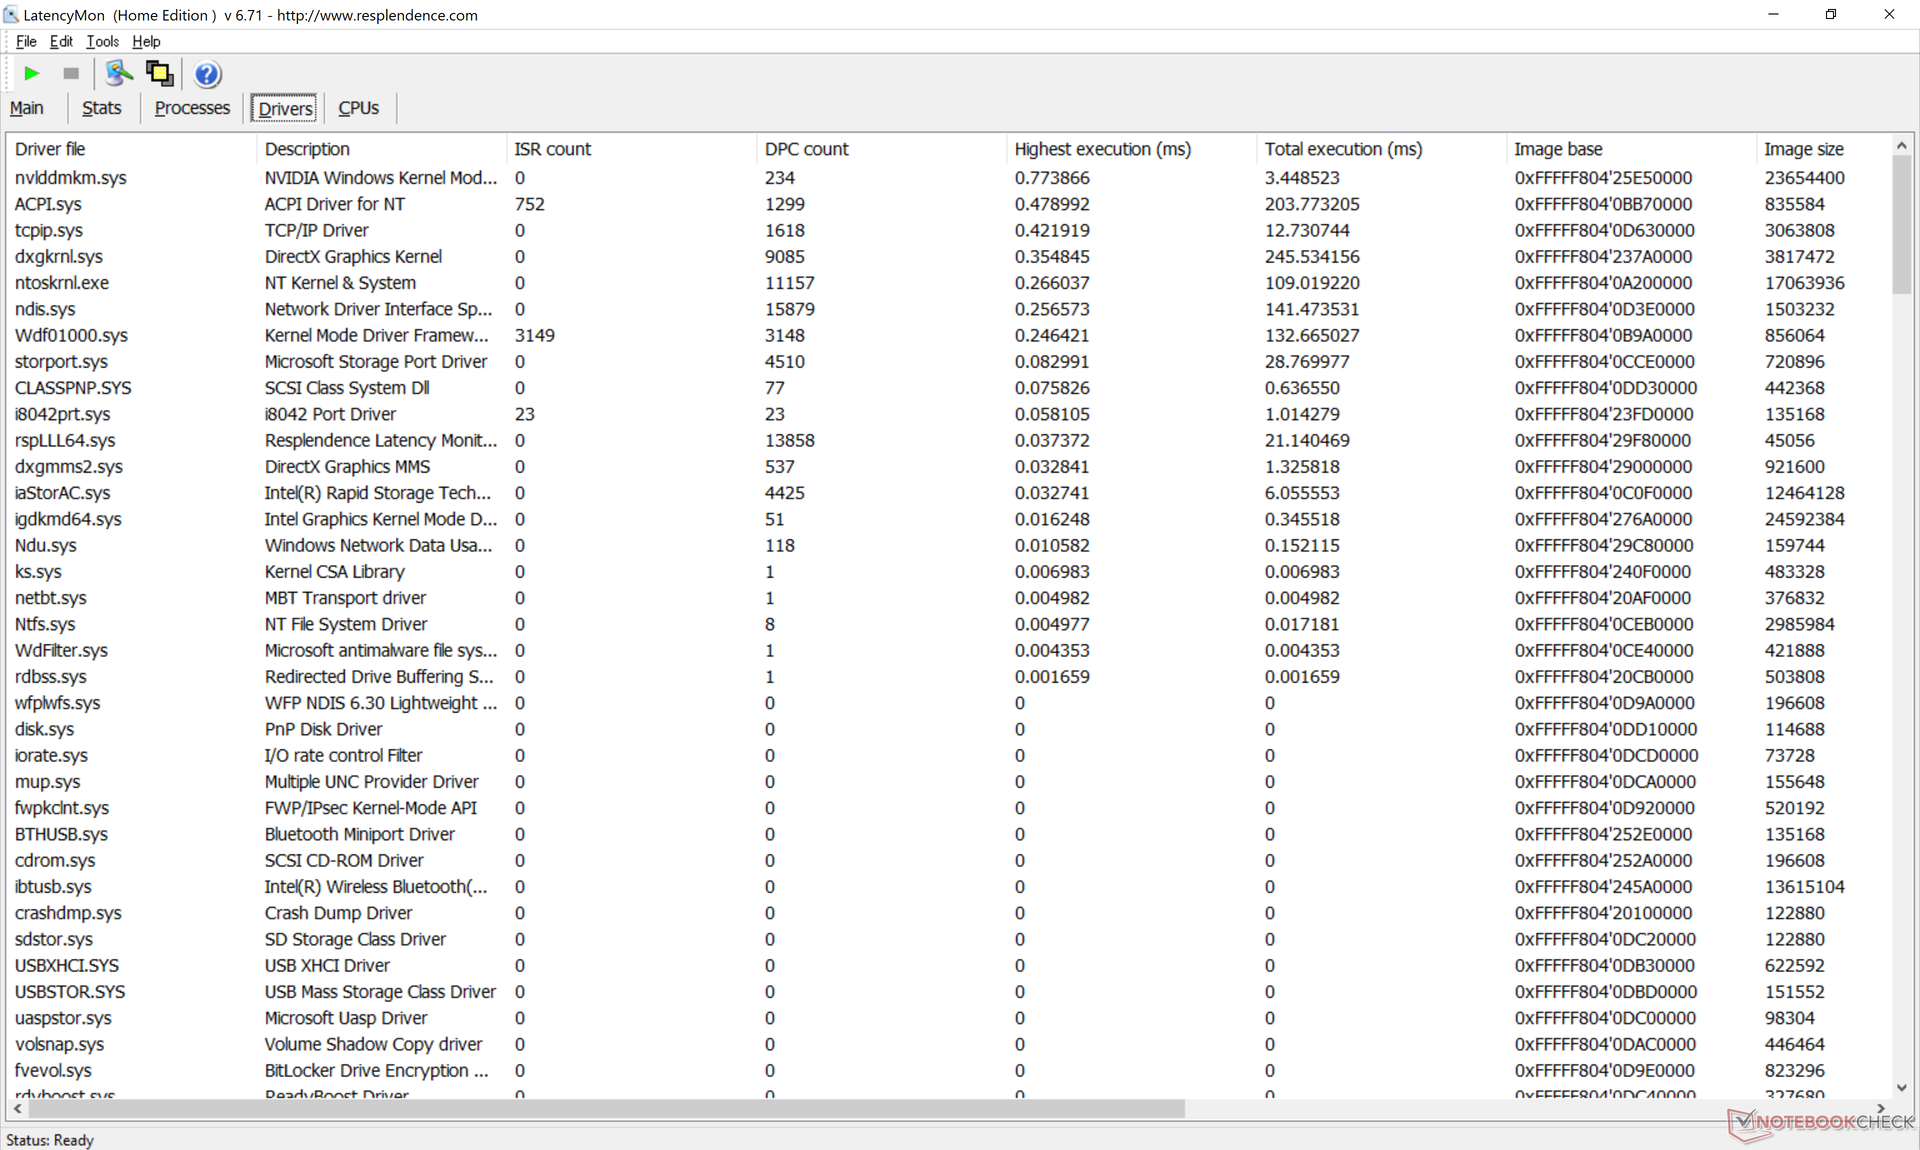
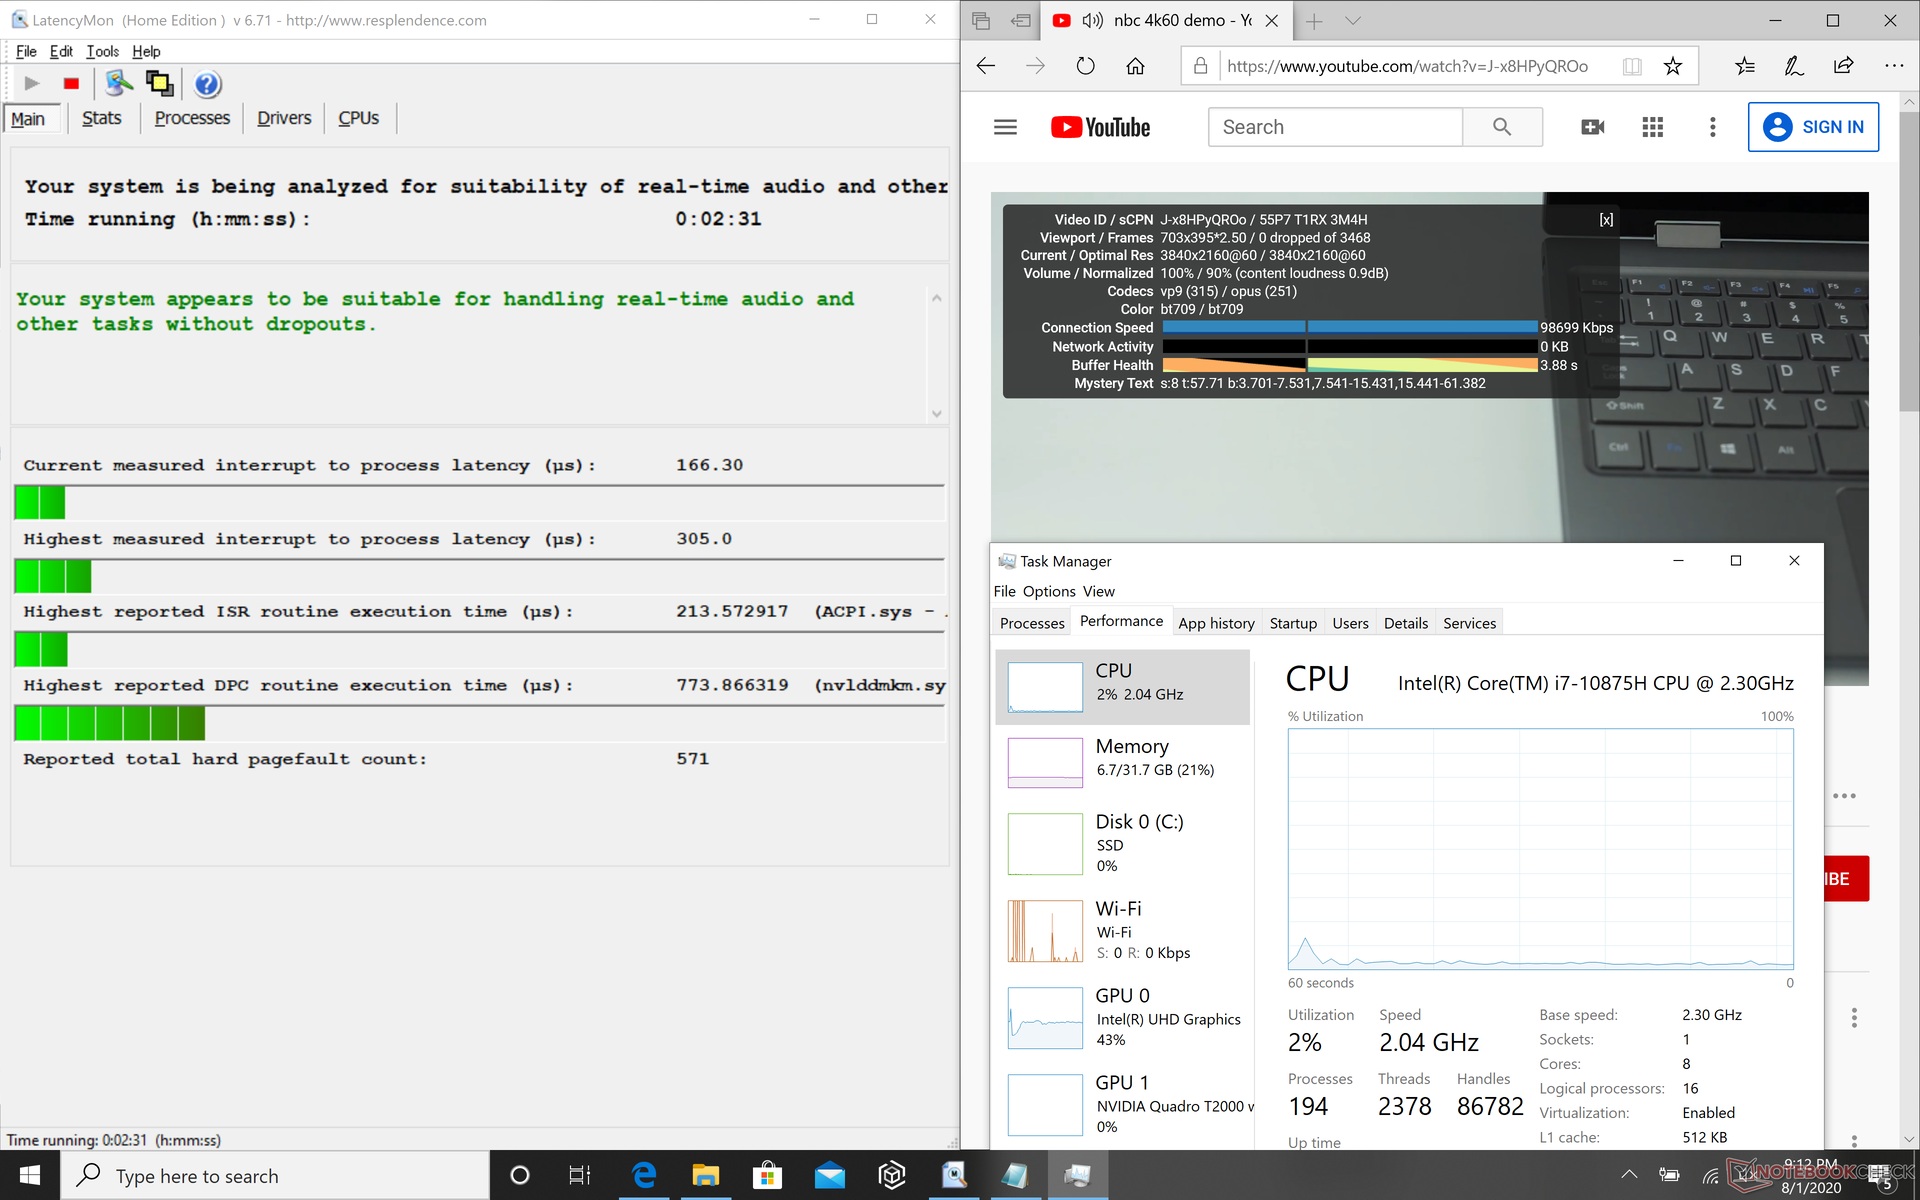
LatencyMon non rivela alcun problema di latenza del DPC sulla nostra unità di test e la riproduzione di video 4K UHD su YouTube è fluida senza che i fotogrammi diminuiscano durante il test.
| DPC Latencies / LatencyMon - interrupt to process latency (max), Web, Youtube, Prime95 | |
| Dell XPS 15 9500 Core i7 4K UHD | |
| Asus ROG Zephyrus Duo 15 GX550LXS | |
| Dell XPS 15 9500 Core i5 | |
| Acer ConceptD 3 Pro CN315-71P-73W1 | |
| Razer Blade 15 Studio Edition 2020 | |
| Eluktronics RP-15 | |
| Dell Precision 5550 P91F | |
* ... Meglio usare valori piccoli
Dispositivi di archiviazione
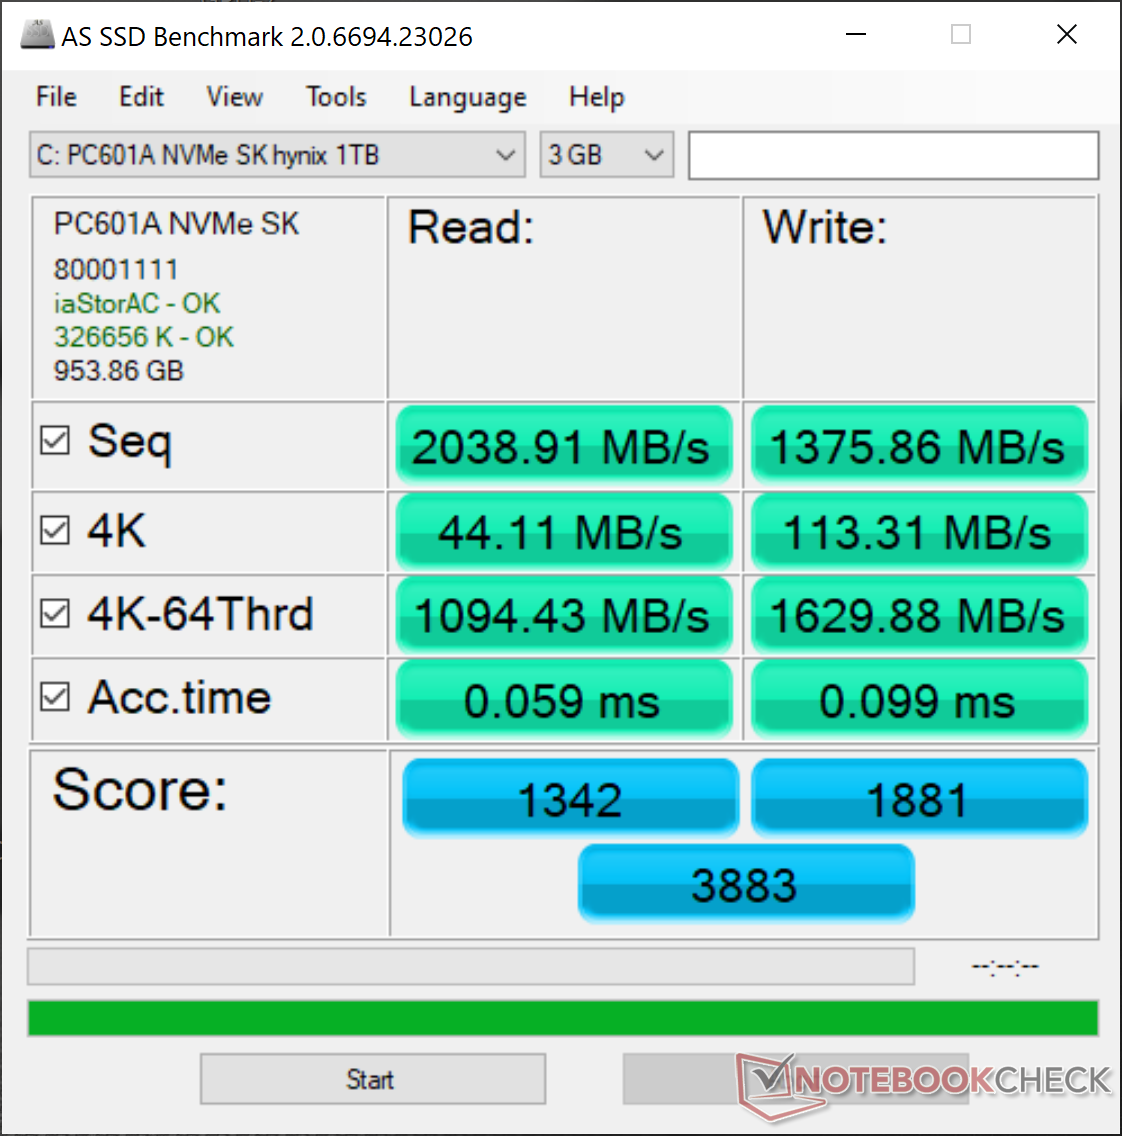
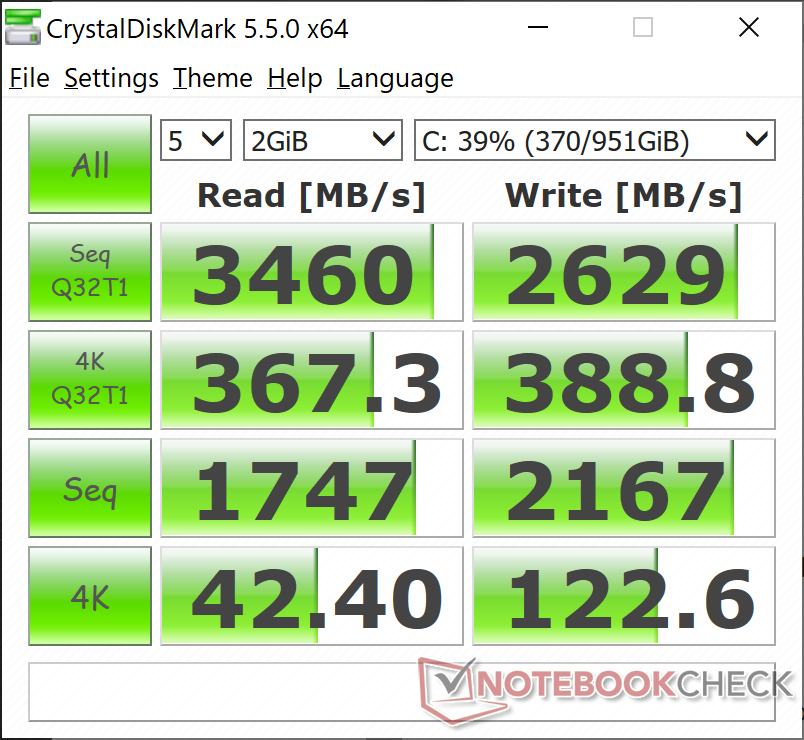
La nostra unità viene fornita con un SSD NVMe da 1 TB SK Hynix PC601A rispetto al più comune PC601. I risultati di CrystalDiskMark sono per il resto vicini a quelli che abbiamo registrato sul PC601 da 512 GB in RAID 0 come si trova su Alienware m15 R2 dell'anno scorso. Siamo in grado di raggiungere una lettura massima del disco di 3400 MB/s in condizioni ottimali.
| Dell Precision 5550 P91F SK Hynix PC601A NVMe 1TB | Dell Precision 5540 SK hynix PC400 512 GB | Razer Blade 15 Studio Edition 2020 Samsung PM981a MZVLB1T0HBLR | Acer ConceptD 3 Pro CN315-71P-73W1 WDC PC SN720 SDAPNTW-512G | MSI WP65 Samsung SSD PM981 MZVLB512HAJQ | |
|---|---|---|---|---|---|
| AS SSD | -14% | 10% | 4% | 8% | |
| Seq Read (MB/s) | 2039 | 1743 -15% | 1982 -3% | 2973 46% | 1097 -46% |
| Seq Write (MB/s) | 1376 | 930 -32% | 2252 64% | 2429 77% | 1838 34% |
| 4K Read (MB/s) | 44.11 | 39.1 -11% | 47.13 7% | 24.7 -44% | 52.9 20% |
| 4K Write (MB/s) | 113.3 | 92.1 -19% | 88.2 -22% | 115.3 2% | 108.4 -4% |
| 4K-64 Read (MB/s) | 1094 | 956 -13% | 1481 35% | 1243 14% | 1509 38% |
| 4K-64 Write (MB/s) | 1630 | 863 -47% | 1842 13% | 835 -49% | 1695 4% |
| Access Time Read * (ms) | 0.059 | 0.074 -25% | 0.087 -47% | 0.067 -14% | |
| Access Time Write * (ms) | 0.99 | 0.053 95% | 0.04 96% | 0.034 97% | 0.103 90% |
| Score Read (Points) | 1342 | 1170 -13% | 1726 29% | 1565 17% | 1671 25% |
| Score Write (Points) | 1881 | 1048 -44% | 2155 15% | 1193 -37% | 1988 6% |
| Score Total (Points) | 3883 | 2781 -28% | 4781 23% | 3525 -9% | 4558 17% |
| Copy ISO MB/s (MB/s) | 2489 | 1982 -20% | 2136 -14% | 1800 -28% | |
| Copy Program MB/s (MB/s) | 682 | 501 -27% | 489.6 -28% | 569 -17% | |
| Copy Game MB/s (MB/s) | 1515 | 1140 -25% | 1163 -23% | 1409 -7% | |
| CrystalDiskMark 5.2 / 6 | -18% | 14% | -3% | 5% | |
| Write 4K (MB/s) | 122.6 | 98 -20% | 132.9 8% | 113.2 -8% | 126.9 4% |
| Read 4K (MB/s) | 42.4 | 41.25 -3% | 46.73 10% | 31.1 -27% | 44.91 6% |
| Write Seq (MB/s) | 2167 | 1295 -40% | 2214 2% | 2540 17% | 1944 -10% |
| Read Seq (MB/s) | 1747 | 1441 -18% | 2018 16% | 2005 15% | 1449 -17% |
| Write 4K Q32T1 (MB/s) | 388.8 | 429.2 10% | 478.9 23% | 331.4 -15% | 531 37% |
| Read 4K Q32T1 (MB/s) | 367.3 | 400.1 9% | 540 47% | 368.3 0% | 579 58% |
| Write Seq Q32T1 (MB/s) | 2629 | 1366 -48% | 2975 13% | 2535 -4% | 1970 -25% |
| Read Seq Q32T1 (MB/s) | 3460 | 2201 -36% | 3195 -8% | 3427 -1% | 2990 -14% |
| Media totale (Programma / Settaggio) | -16% /
-16% | 12% /
11% | 1% /
1% | 7% /
7% |
* ... Meglio usare valori piccoli

Disk Throttling: DiskSpd Read Loop, Queue Depth 8
Prestazioni GPU
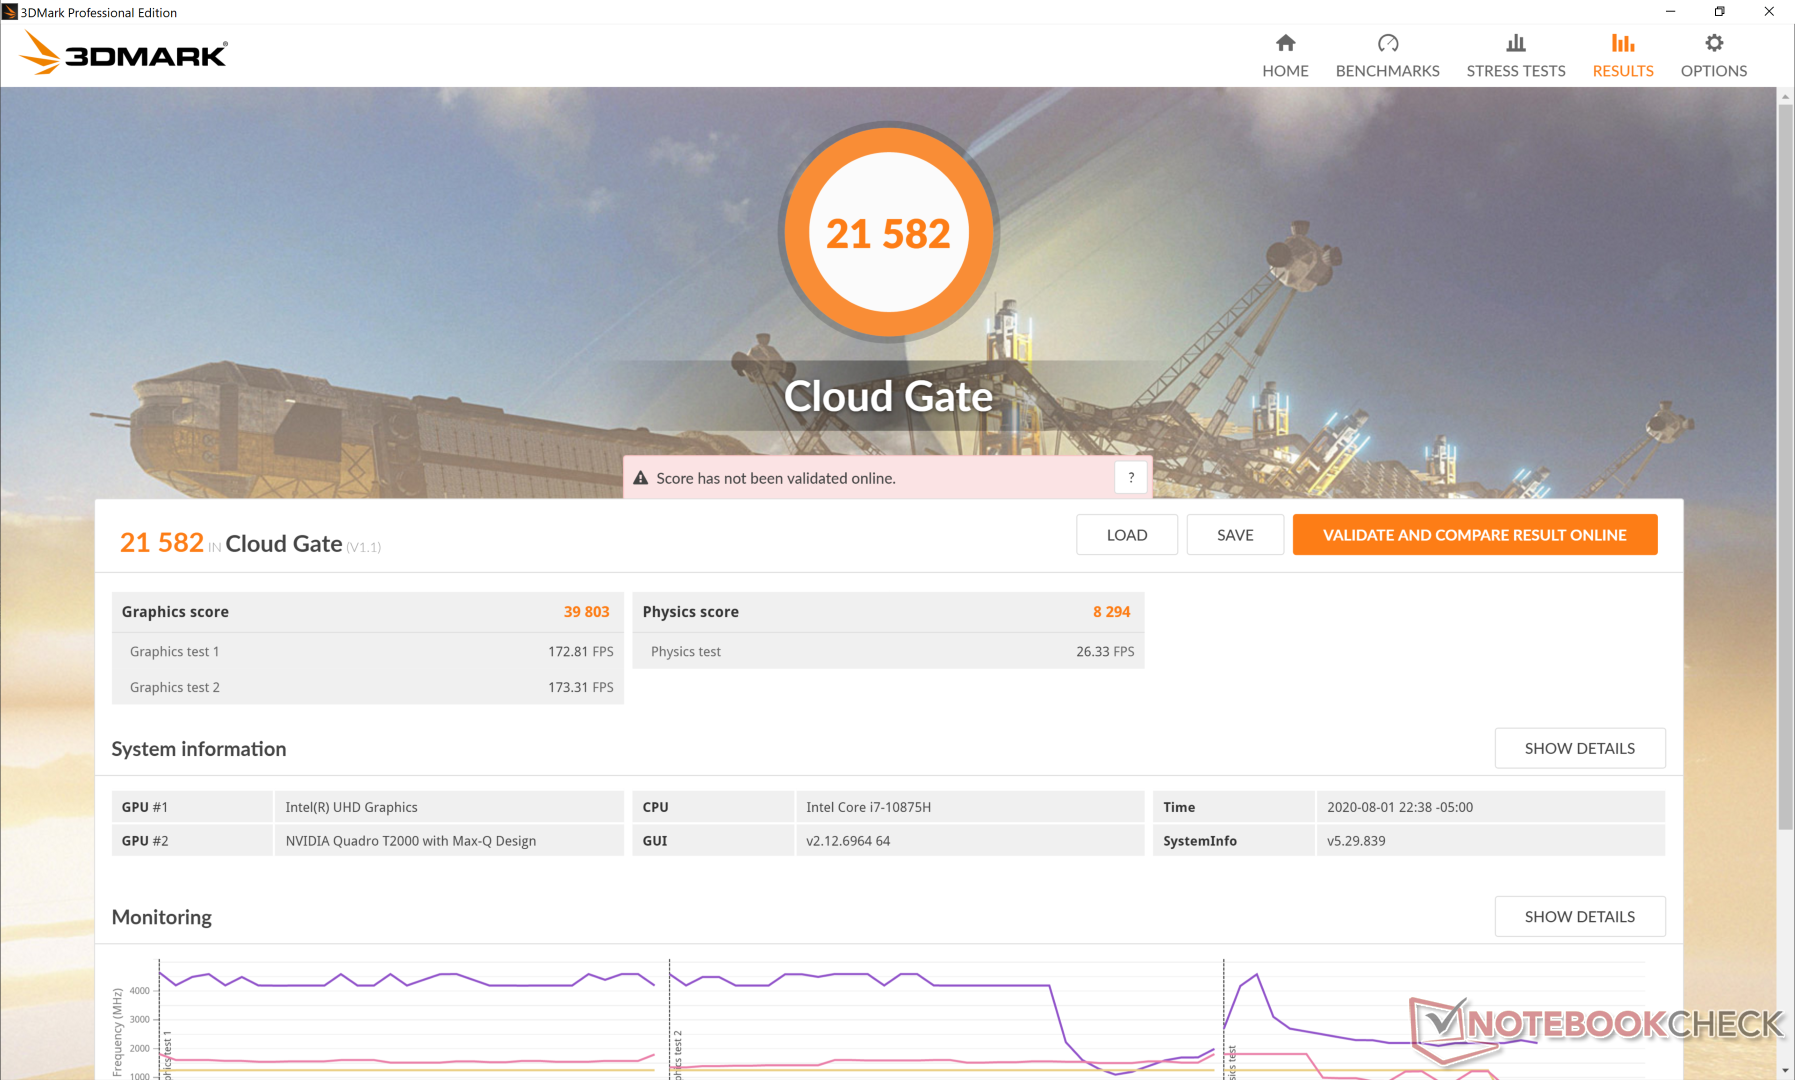
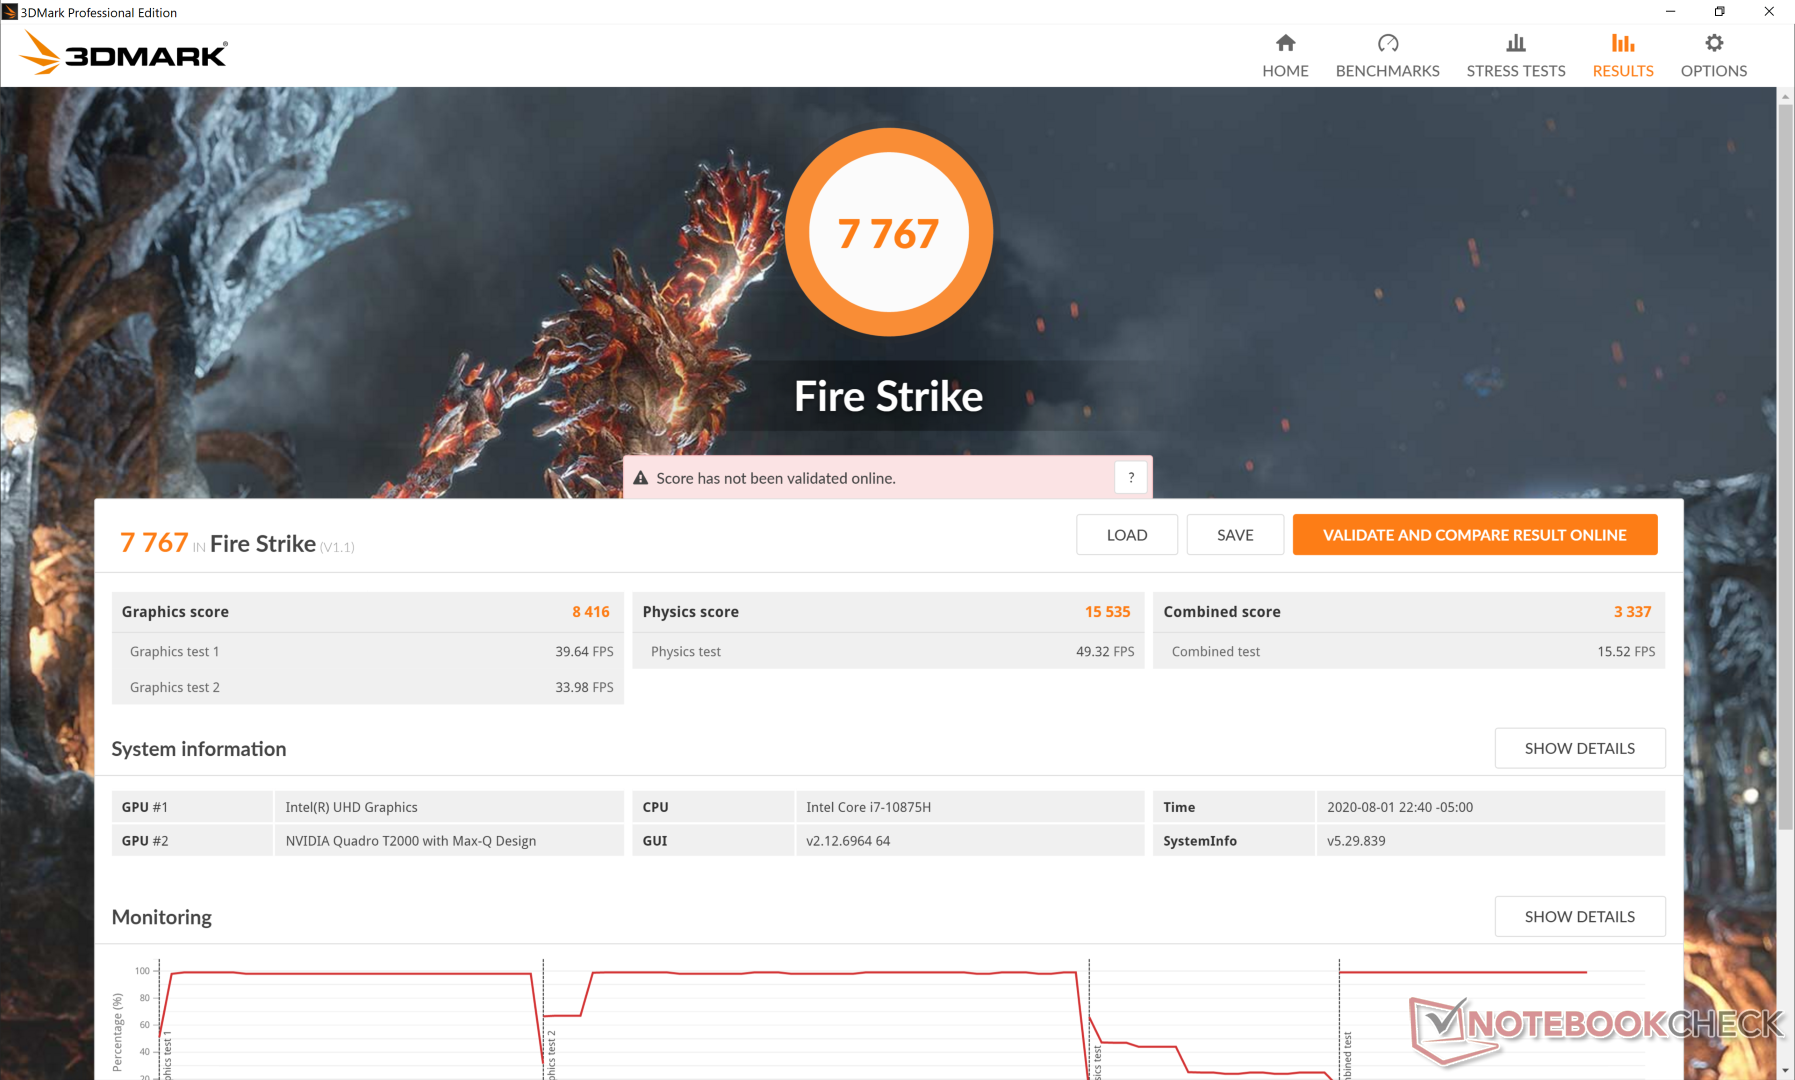
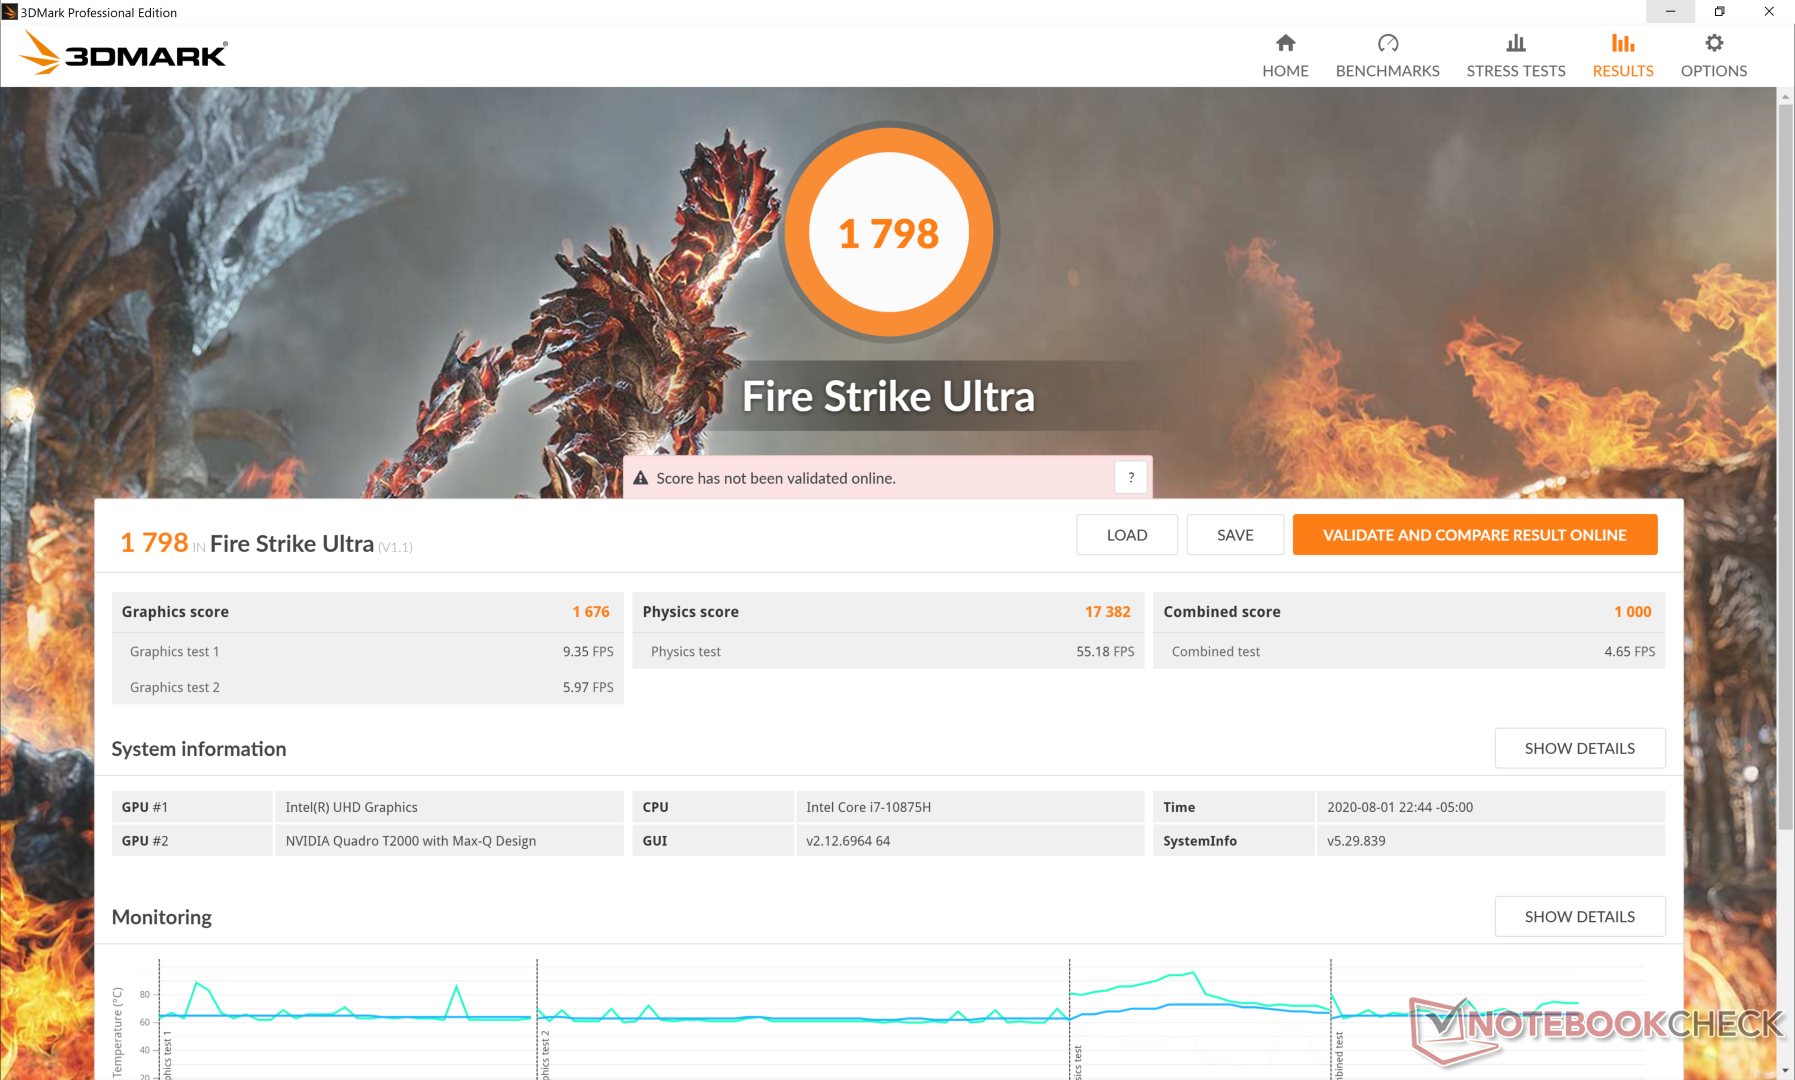
La Quadro T2000 Max-Q ha prestazioni quasi identiche a quelle della normale Quadro T1000 su quasi tutti i benchmarks che vanno da 3DMark a SpecViewPerf. È interessante notare che le prestazioni saranno migliori o peggiori rispetto alla vecchia Quadro P2000 a seconda del carico di lavoro in questione.
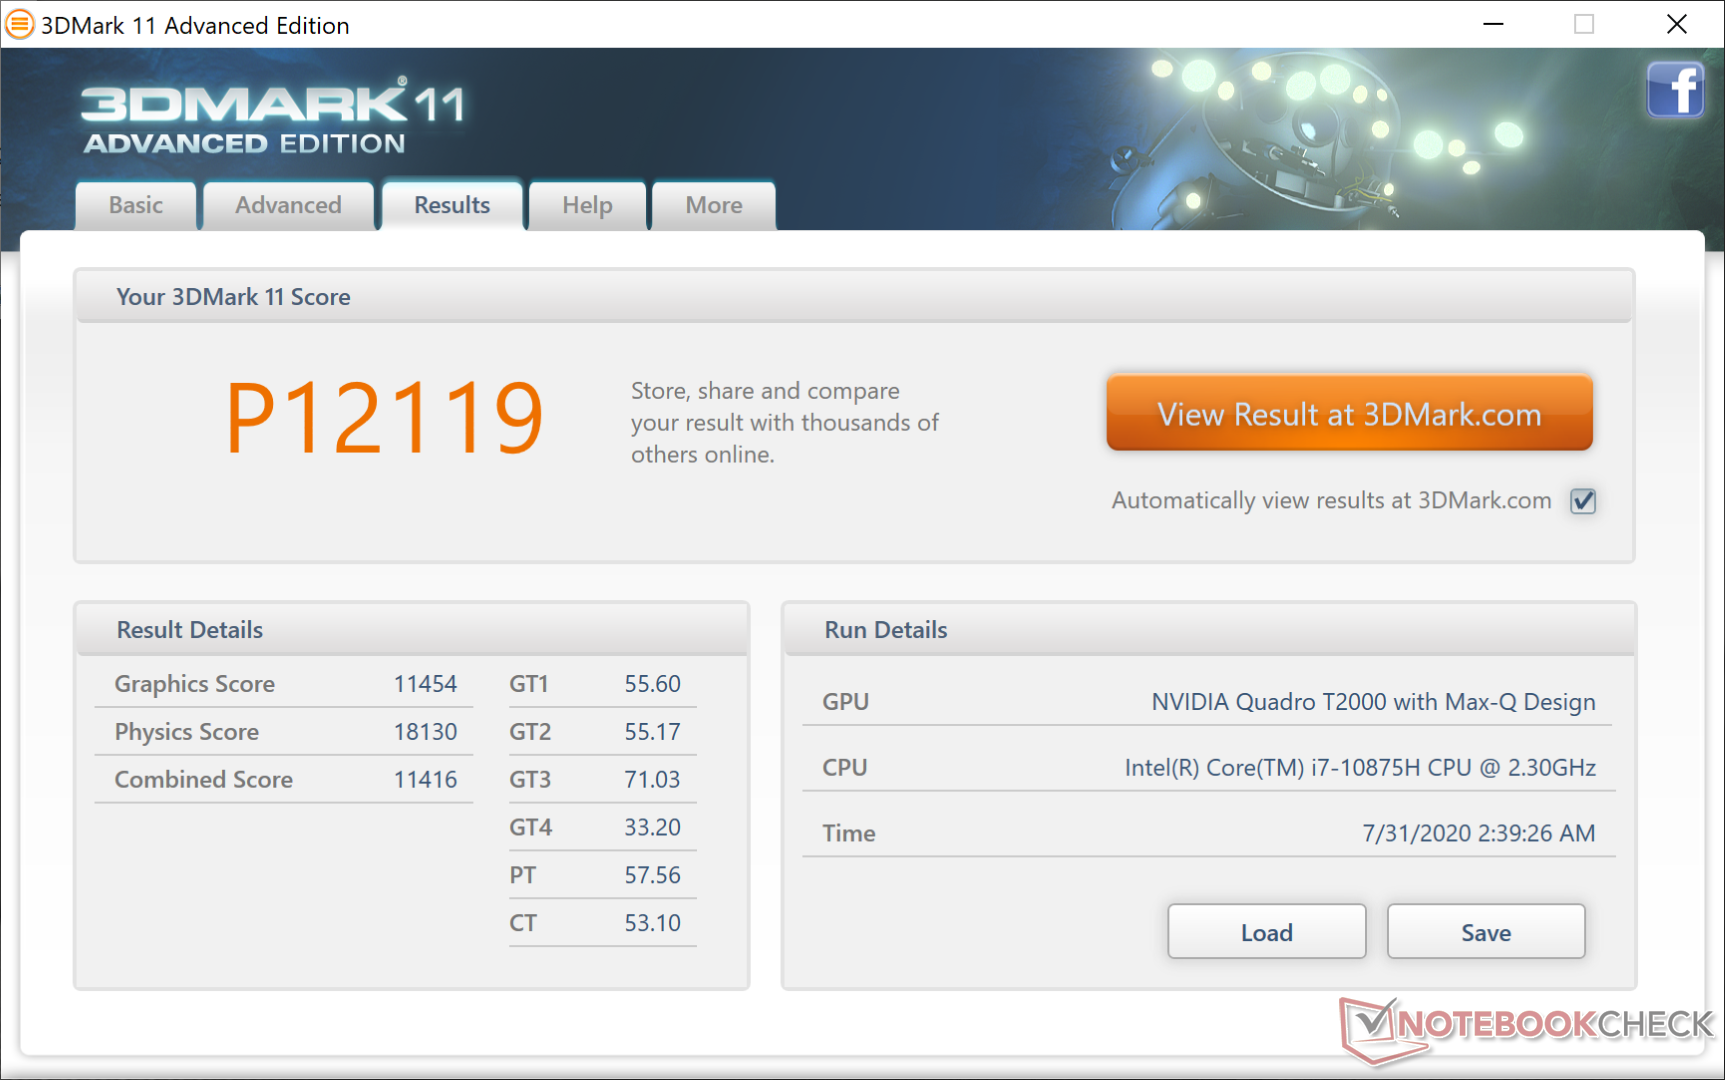
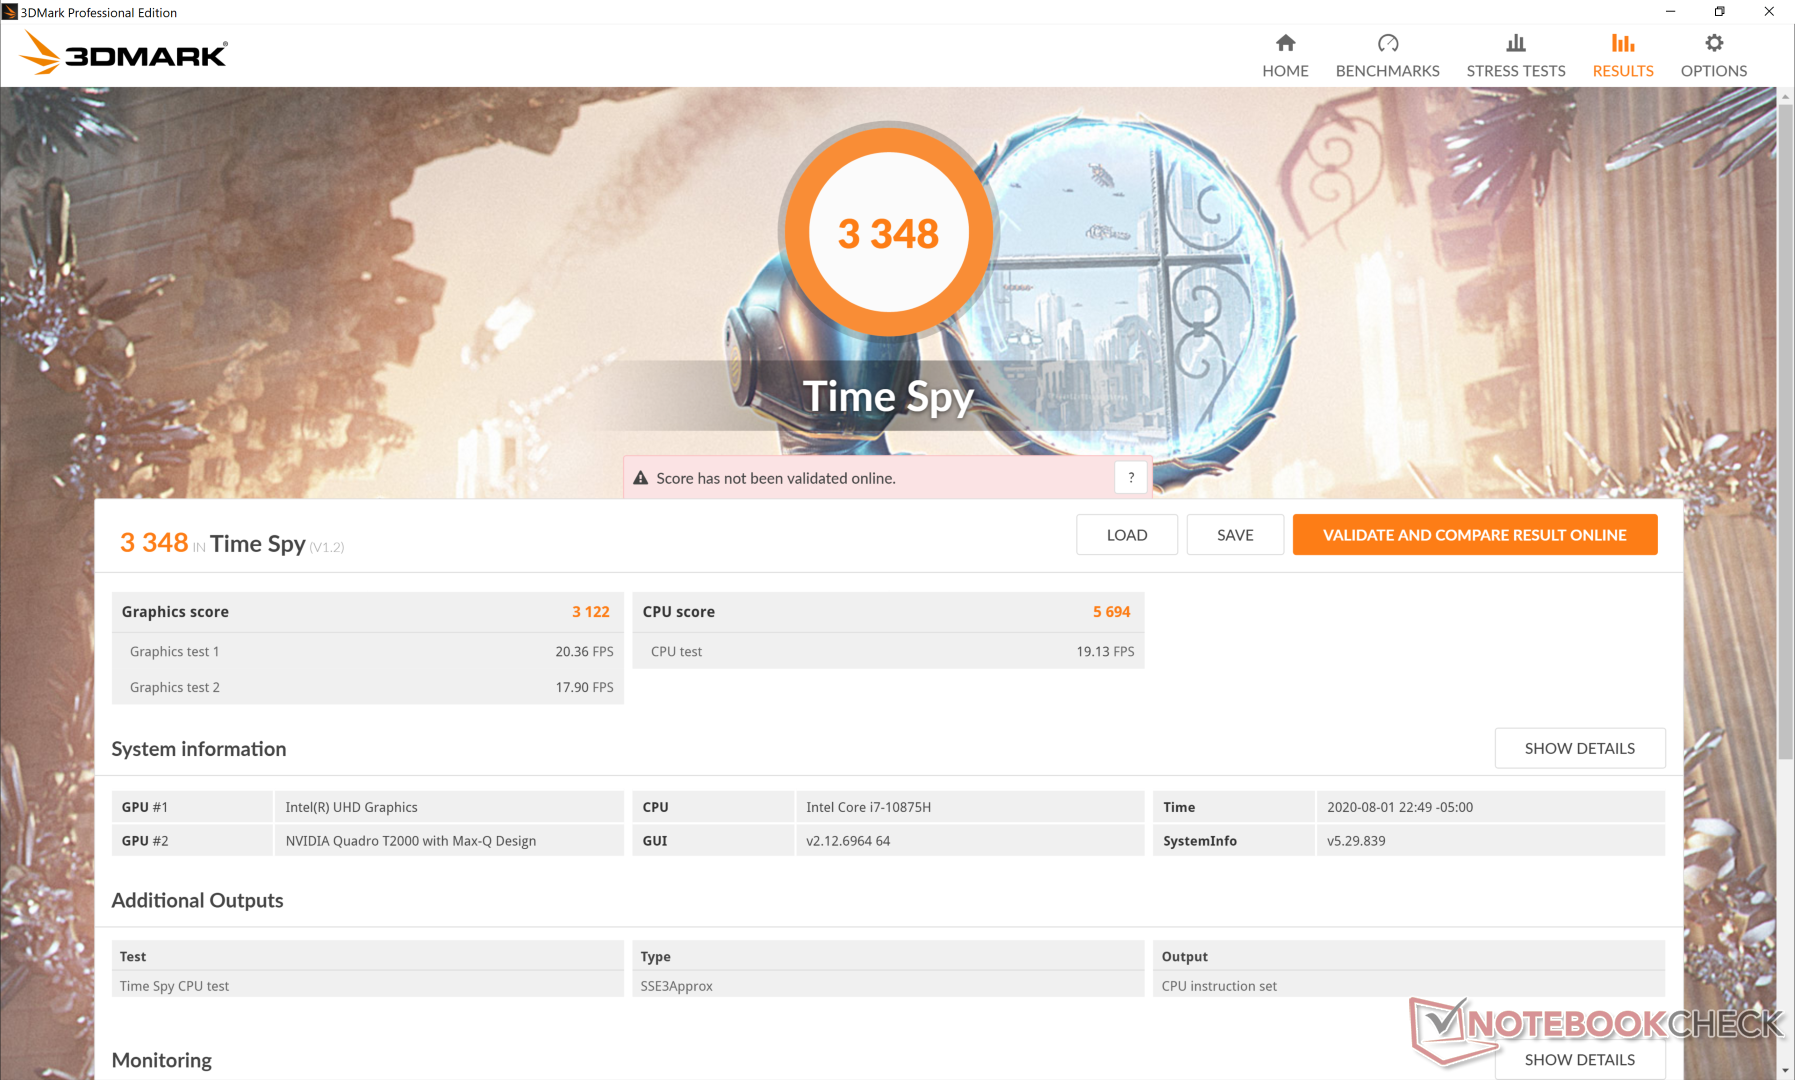
| 3DMark 11 Performance | 12119 punti | |
| 3DMark Cloud Gate Standard Score | 21582 punti | |
| 3DMark Fire Strike Score | 7767 punti | |
| 3DMark Time Spy Score | 3348 punti | |
Aiuto | ||
| basso | medio | alto | ultra | QHD | 4K | |
|---|---|---|---|---|---|---|
| The Witcher 3 (2015) | 181 | 107.6 | 62.5 | 33.4 | ||
| Dota 2 Reborn (2015) | 153 | 140 | 130 | 118 | 47.9 | |
| Final Fantasy XV Benchmark (2018) | 91 | 48.5 | 36.8 | 25.7 | 13.7 | |
| X-Plane 11.11 (2018) | 91.9 | 76 | 64.8 | 47.2 | ||
| Shadow of the Tomb Raider (2018) | 101 | 56 | 48 | 42 | ||
| Assassin´s Creed Odyssey (2018) | 71 | 53 | 45 | 25 | ||
| Apex Legends (2019) | 144 | 86.4 | 72.7 | 64.9 | ||
| Far Cry New Dawn (2019) | 83 | 58 | 55 | 50 | ||
| Metro Exodus (2019) | 91.5 | 41.74 | 31.2 | 24.6 | ||
| Dirt Rally 2.0 (2019) | 271 | 86.1 | 69.9 | 40.3 | ||
| Total War: Three Kingdoms (2019) | 148.4 | 60.3 | 36.3 | 24.4 | ||
| Control (2019) | 120.2 | 40.4 | 28.3 | |||
| Borderlands 3 (2019) | 123.4 | 56 | 35.8 | 27.3 | ||
| GRID 2019 (2019) | 179 | 94.7 | 77.7 | 51 | ||
| Star Wars Jedi Fallen Order (2019) | 64.2 | 53.1 | 47 | |||
| Hunt Showdown (2020) | 141.3 | 50.3 | 44.5 | |||
| Doom Eternal (2020) | 147.4 | 85.5 | 58.1 | |||
| Gears Tactics (2020) | 263.3 | 77.5 | 47.6 | 35.1 | ||
| F1 2020 (2020) | 182 | 96 | 78 | 55 |
Emissioni
Rumorosità di sistema
Anche se silenzioso durante la navigazione sul web o l'elaborazione di testi, i carichi più elevati indurranno un rumore di ventola molto elevato nella gamma da 40 dB(A) a 50 dB(A), che è più simile a quello dei portatili gaming. Preferirete provare le varie impostazioni della ventola e delle prestazioni tramite il software Dell Power Manager per trovare ciò che funziona meglio per i carichi di lavoro.
| Dell Precision 5550 P91F Quadro T2000 Max-Q, i7-10875H, SK Hynix PC601A NVMe 1TB | Dell Precision 5540 Quadro T2000 Max-Q, i9-9980HK, SK hynix PC400 512 GB | Razer Blade 15 Studio Edition 2020 Quadro RTX 5000 Max-Q, i7-10875H, Samsung PM981a MZVLB1T0HBLR | Acer ConceptD 3 Pro CN315-71P-73W1 Quadro T1000 (Laptop), i7-9750H, WDC PC SN720 SDAPNTW-512G | Lenovo ThinkPad P53-20QN000YGE Quadro RTX 5000 Max-Q, i7-9850H, Samsung PM981a MZVLB1T0HBLR | MSI WP65 Quadro P620, i7-9750H, Samsung SSD PM981 MZVLB512HAJQ | |
|---|---|---|---|---|---|---|
| Noise | 2% | -11% | -7% | 3% | -15% | |
| off /ambiente * (dB) | 26.2 | 28.6 -9% | 30.1 -15% | 31.2 -19% | 28.3 -8% | 28.7 -10% |
| Idle Minimum * (dB) | 26.2 | 28.6 -9% | 30.1 -15% | 31.2 -19% | 28.3 -8% | 33.4 -27% |
| Idle Average * (dB) | 26.2 | 28.6 -9% | 30.1 -15% | 31.2 -19% | 28.3 -8% | 33.5 -28% |
| Idle Maximum * (dB) | 26.2 | 28.6 -9% | 30.1 -15% | 31.5 -20% | 28.3 -8% | 33.5 -28% |
| Load Average * (dB) | 39.2 | 33.3 15% | 42.3 -8% | 38.4 2% | 29.8 24% | 37 6% |
| Witcher 3 ultra * (dB) | 39 | 34.7 11% | 48.2 -24% | 36.9 5% | 38.3 2% | 38.7 1% |
| Load Maximum * (dB) | 50.6 | 38 25% | 42.1 17% | 41.2 19% | 38.3 24% | 59.5 -18% |
* ... Meglio usare valori piccoli
Rumorosità
| Idle |
| 26.2 / 26.2 / 26.2 dB(A) |
| Sotto carico |
| 39.2 / 50.6 dB(A) |
 | ||
30 dB silenzioso 40 dB(A) udibile 50 dB(A) rumoroso |
||
min: | ||
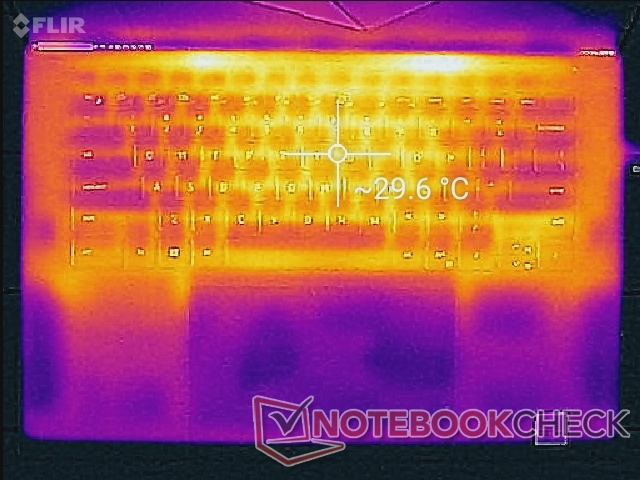
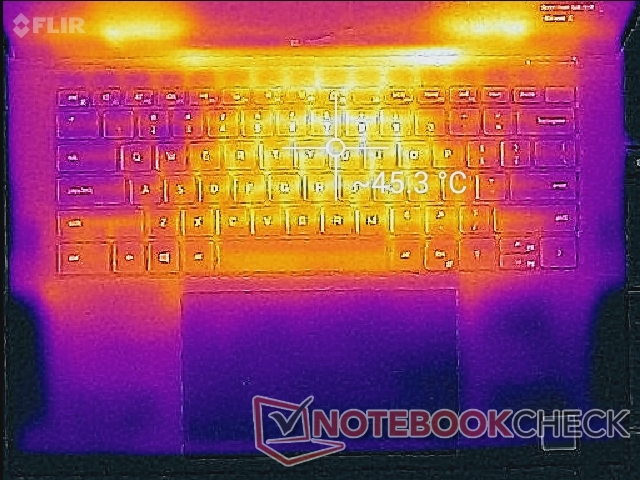
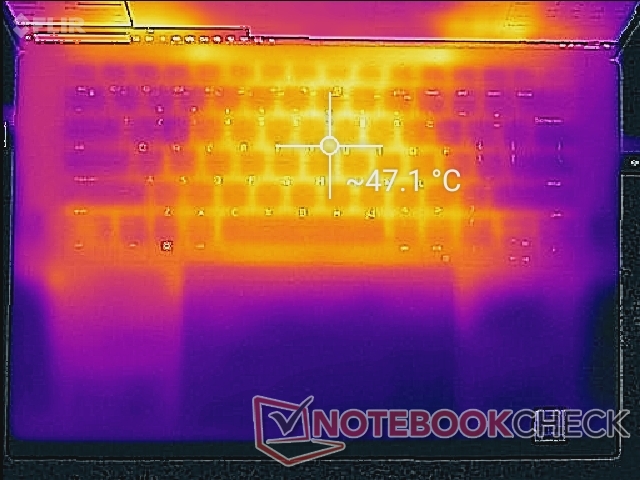
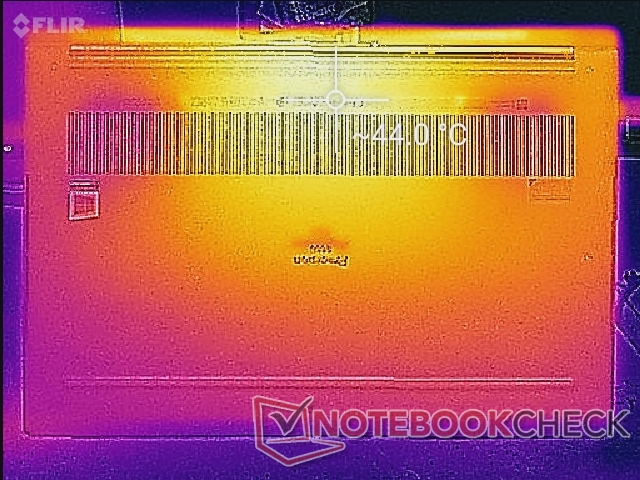
Temperature
Lo sviluppo della temperatura di superficie è in gran parte simmetrico, con punti caldi che raggiungono oltre 47 °C al centro della tastiera quando sono sottoposti a forti stress di elaborazione. I risultati sono comunque più bassi di quelli osservati sull'Acer ConceptD 3 Pro dove la tastiera può raggiungere oltre 53° C.
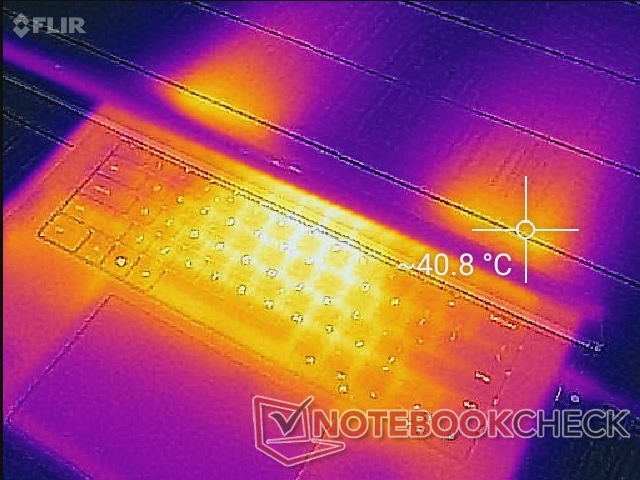
(-) La temperatura massima sul lato superiore è di 47 °C / 117 F, rispetto alla media di 38.2 °C / 101 F, che varia da 22.2 a 69.8 °C per questa classe Workstation.
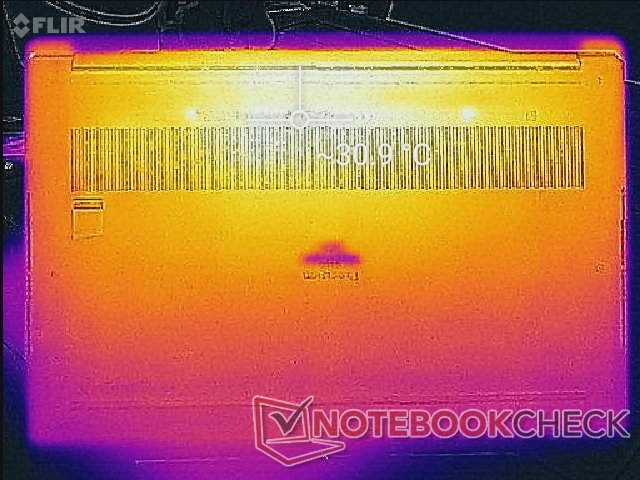
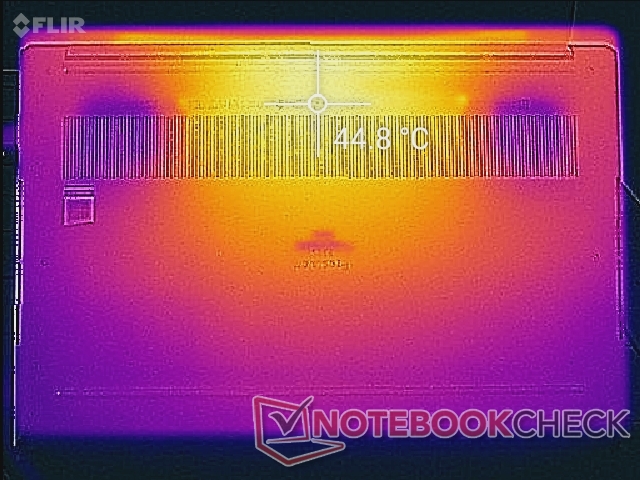
(±) Il lato inferiore si riscalda fino ad un massimo di 44 °C / 111 F, rispetto alla media di 41.1 °C / 106 F
(+) In idle, la temperatura media del lato superiore è di 27.1 °C / 81 F, rispetto alla media deld ispositivo di 32 °C / 90 F.
(±) Riproducendo The Witcher 3, la temperatura media per il lato superiore e' di 35.4 °C / 96 F, rispetto alla media del dispositivo di 32 °C / 90 F.
(+) I poggiapolsi e il touchpad raggiungono la temperatura massima della pelle (32.2 °C / 90 F) e quindi non sono caldi.
(-) La temperatura media della zona del palmo della mano di dispositivi simili e'stata di 27.8 °C / 82 F (-4.4 °C / -8 F).
Stress Test
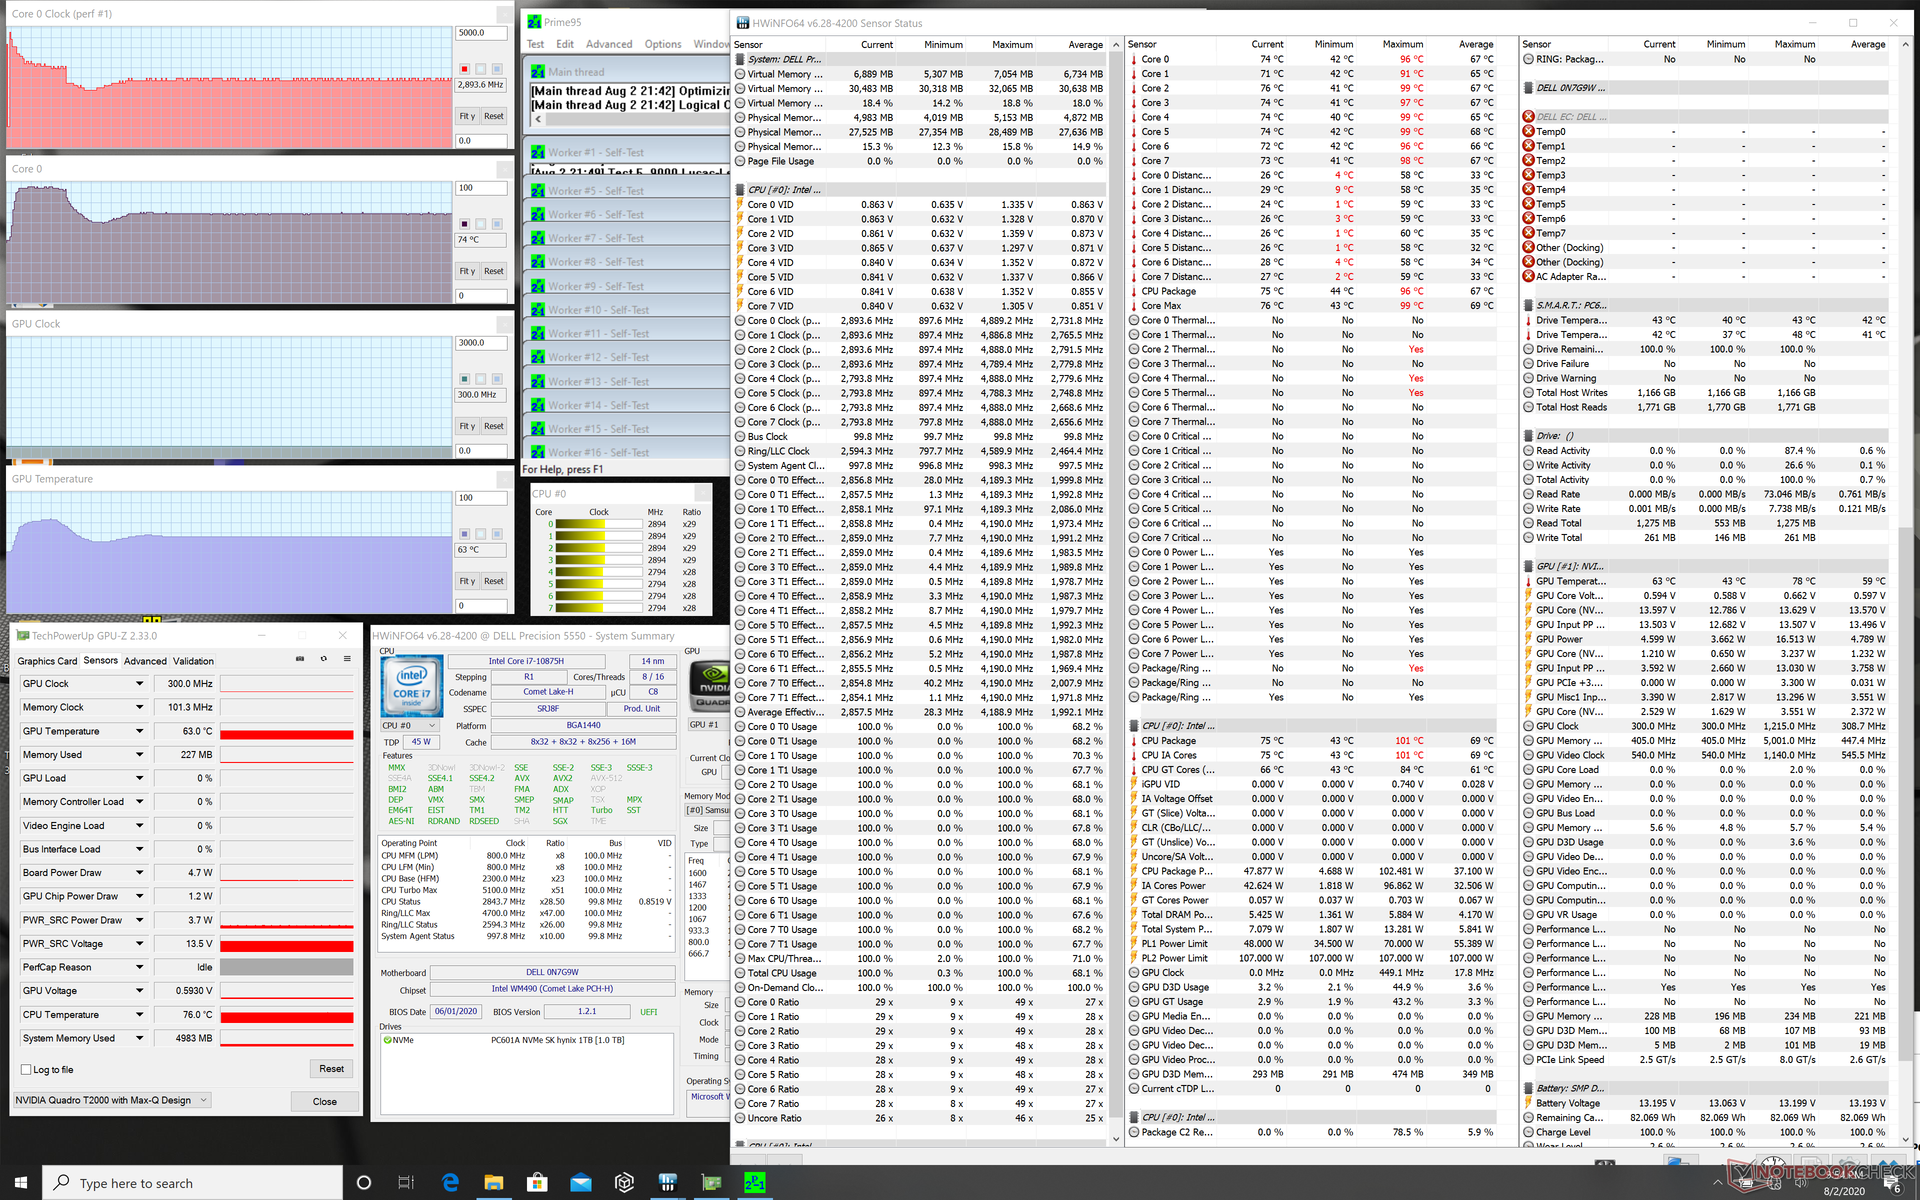
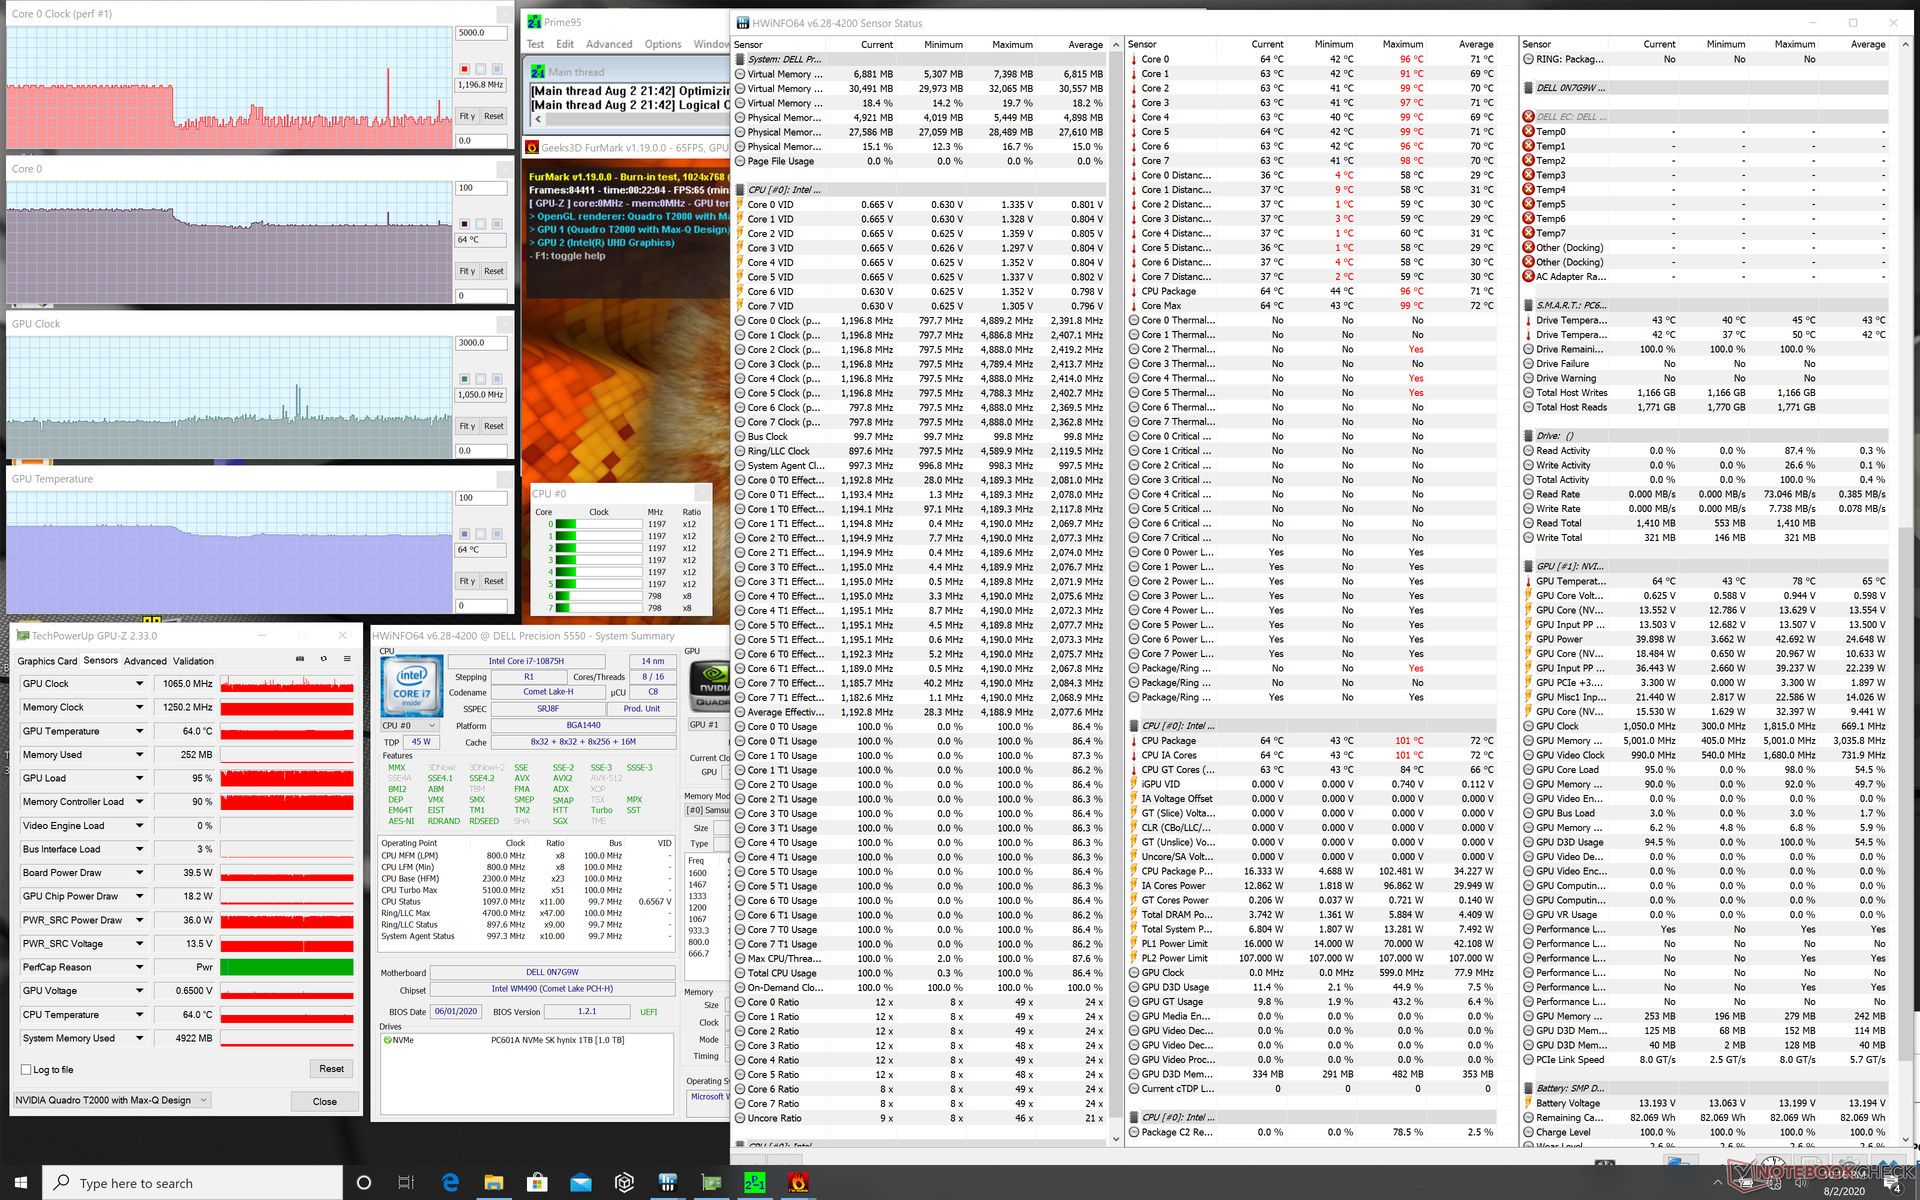
Quando si esegue Prime95 per osservare il comportamento della frequenza di clock, la CPU sale a 4,2 GHz per i primi secondi fino a raggiungere una temperatura del core di 100 °C. In seguito, la frequenza di clock scende a 3,4-3,5 GHz per il minuto successivo, prima di stabilizzarsi definitivamente a 2.8 - 2,9 GHz e ad una temperatura del core di 75 °C. Sotto il massimo stress di Prime95 e FurMark, la CPU alla fine rallenta a soli 1,2 GHz, il che è deludente da vedere su una workstation dove è più probabile che gli utenti vogliano ogni grammo di prestazioni che possono ottenere.
Il funzionamento a batteria limiterà le prestazioni grafiche. Un Fire Strike eseguito con la batteria restituisce punteggi Physics e Graphics di 20806 e 6475 punti, rispettivamente, rispetto ai 15535 e 8416 punti ottenuti con l'alimentazione di rete. I numeri più alti di CPU con la batteria sono il risultato di uno stato di CPU più freddo prima del test.
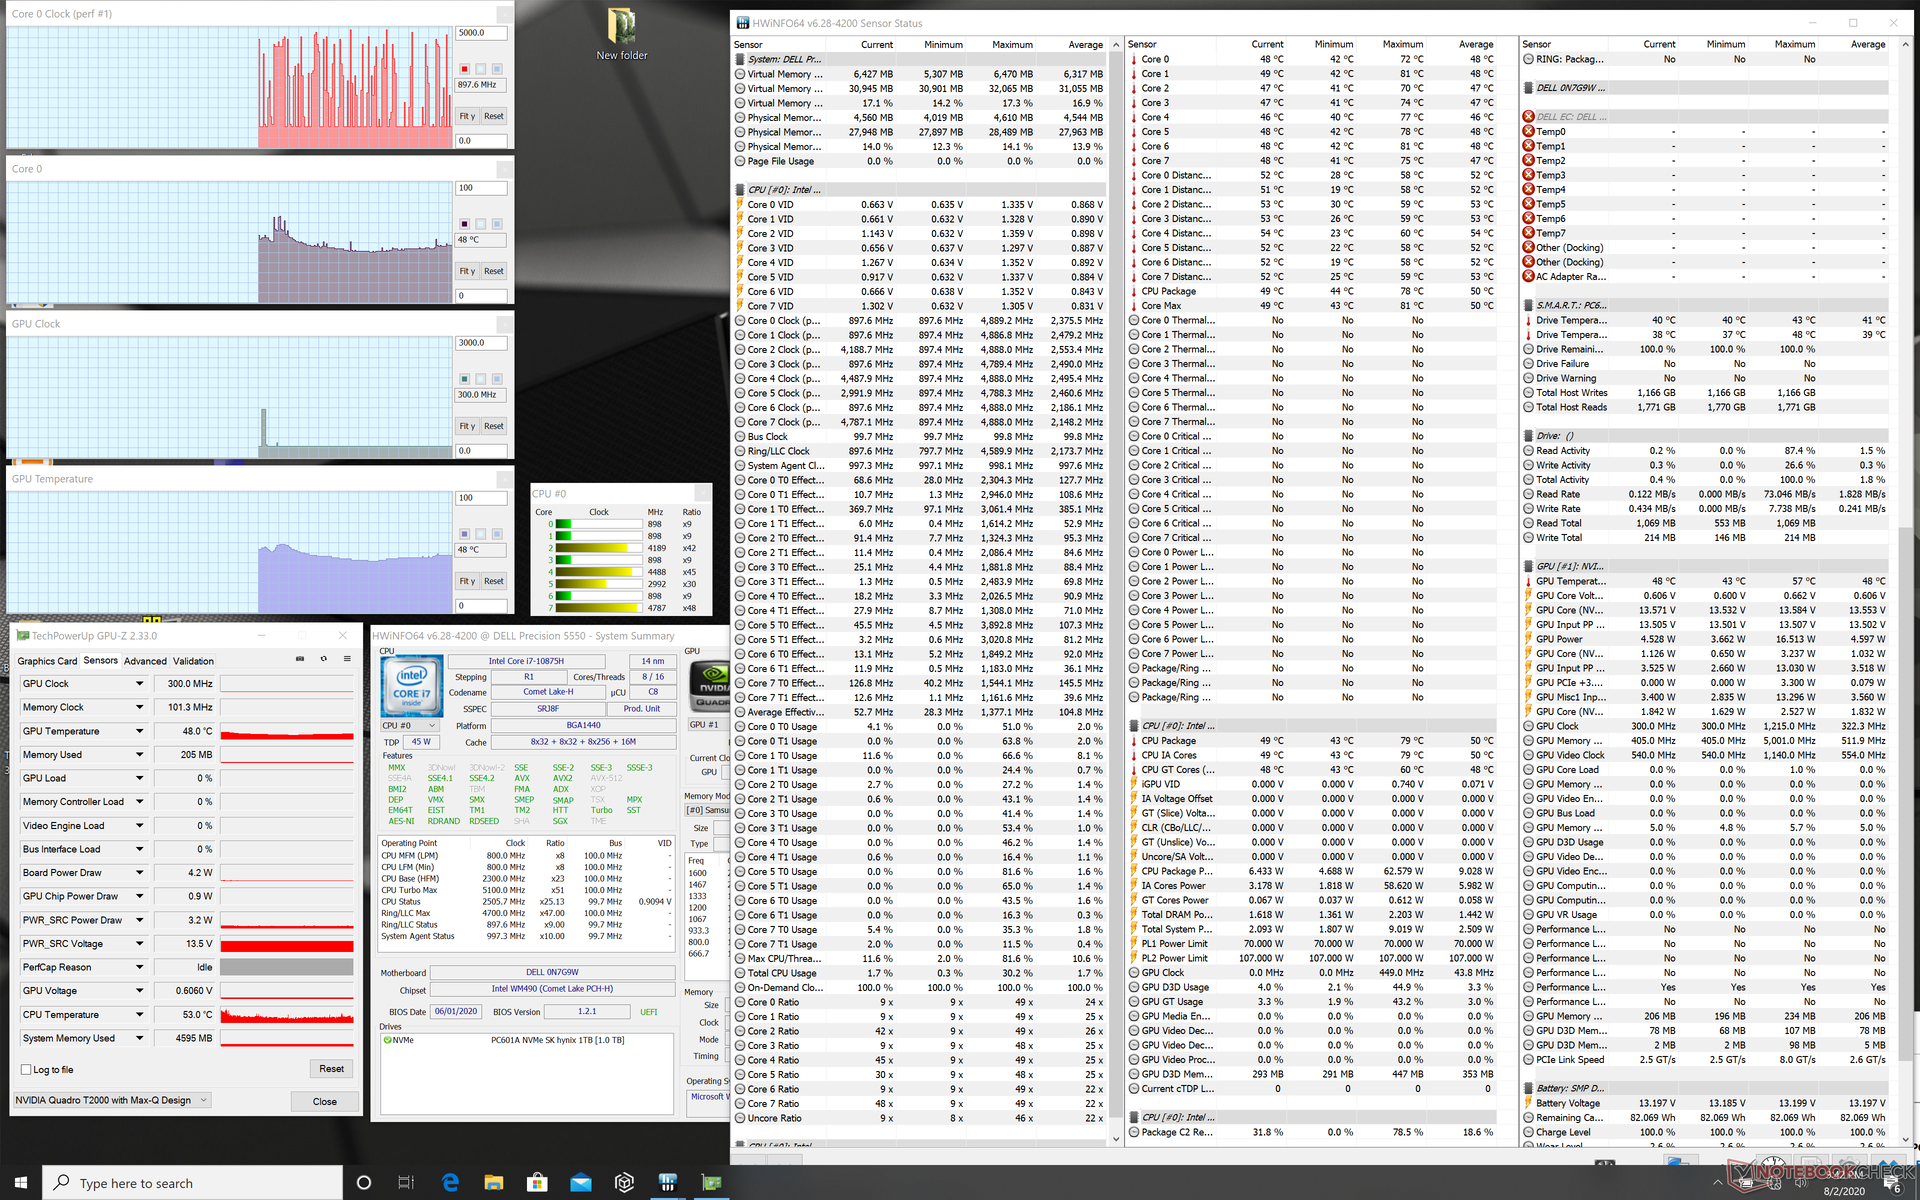
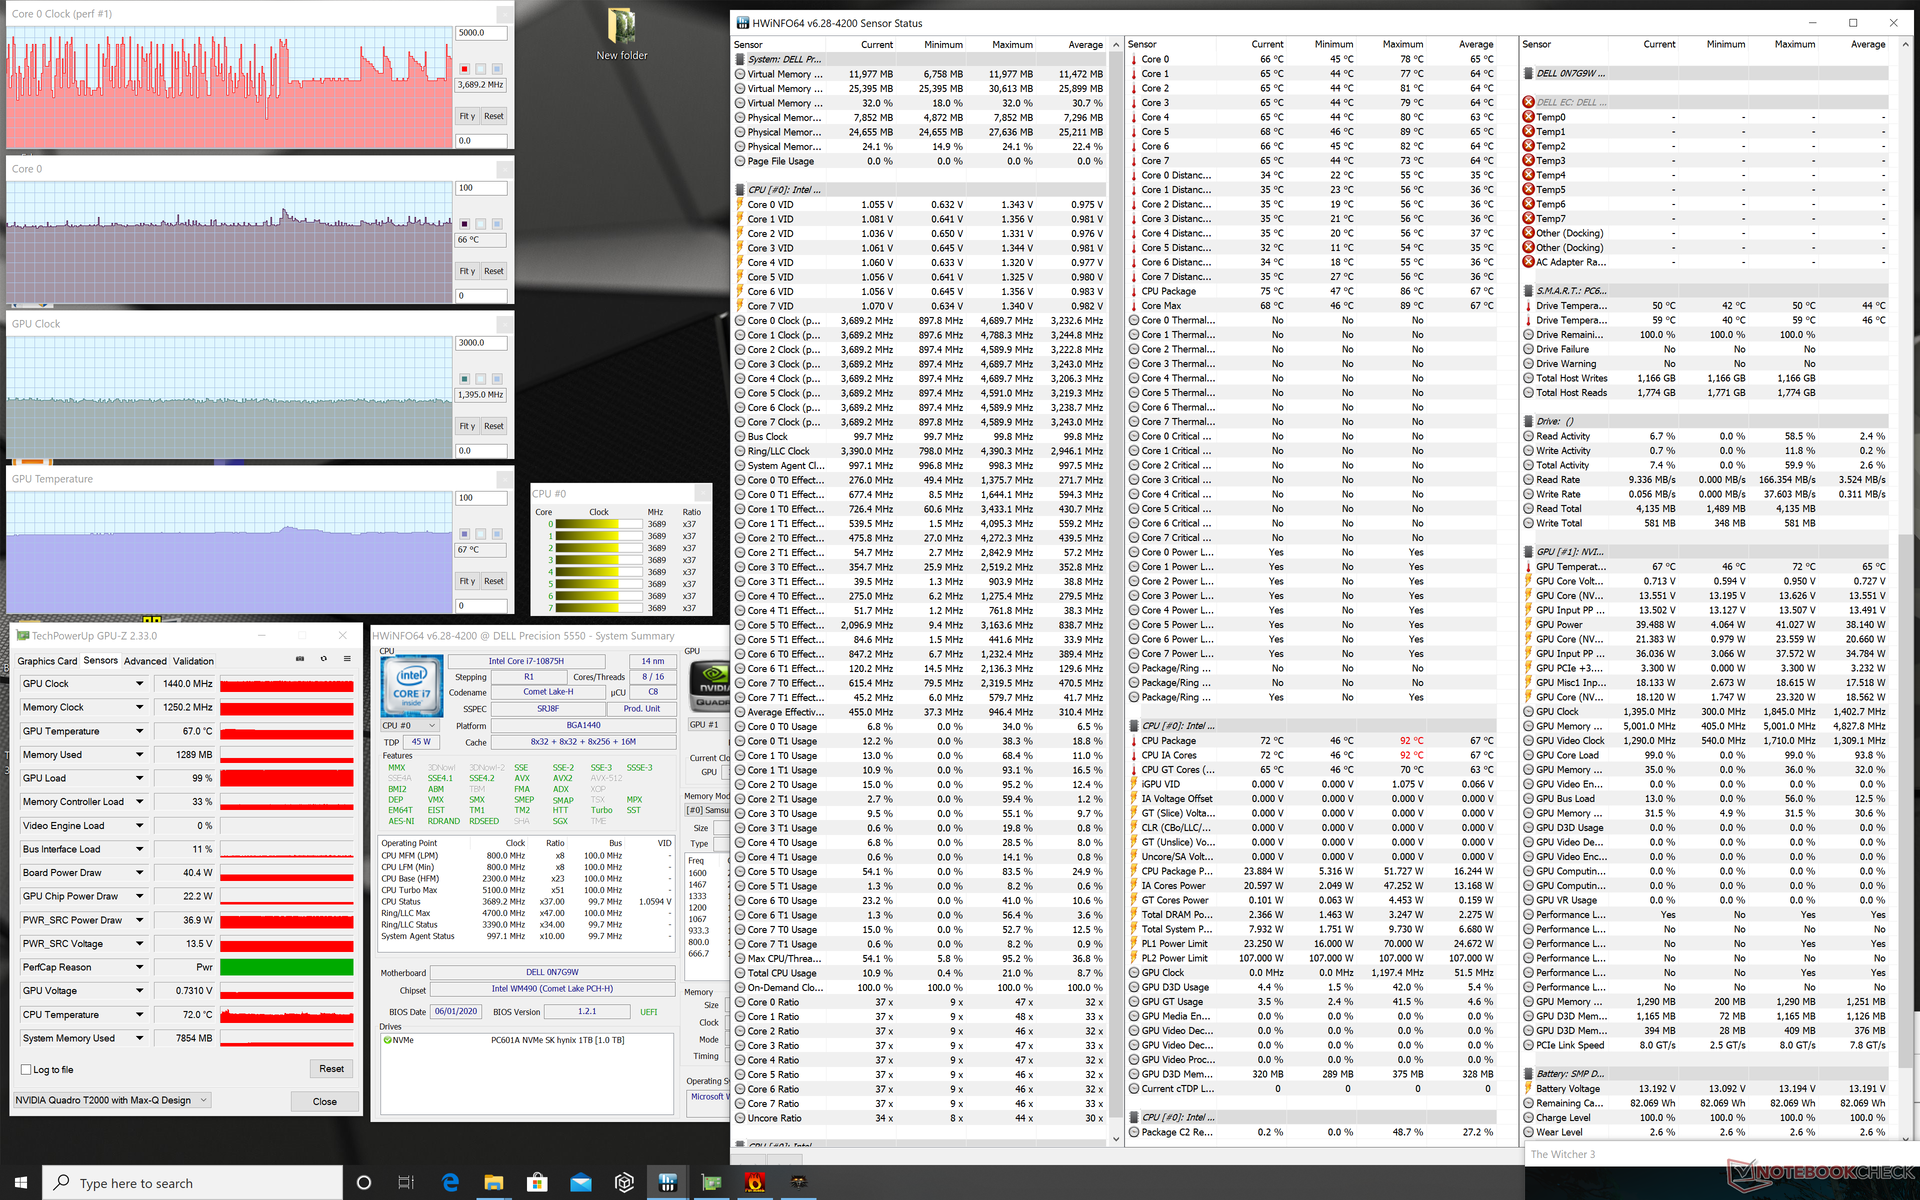
| CPU Clock (GHz) | GPU Clock (MHz) | Average CPU Temperature (°C) | Average GPU Temperature (°C) | |
| System Idle | -- | -- | 48 | 48 |
| Prime95 Stress | 2.8 - 2.9 | -- | 74 | 63 |
| Prime95 + FurMark Stress | ~1.1 - 1.2 | ~1065 | 64 | 64 |
| Witcher 3 Stress | ~3.7 | 1440 | ~66 | 67 |
Altoparlanti
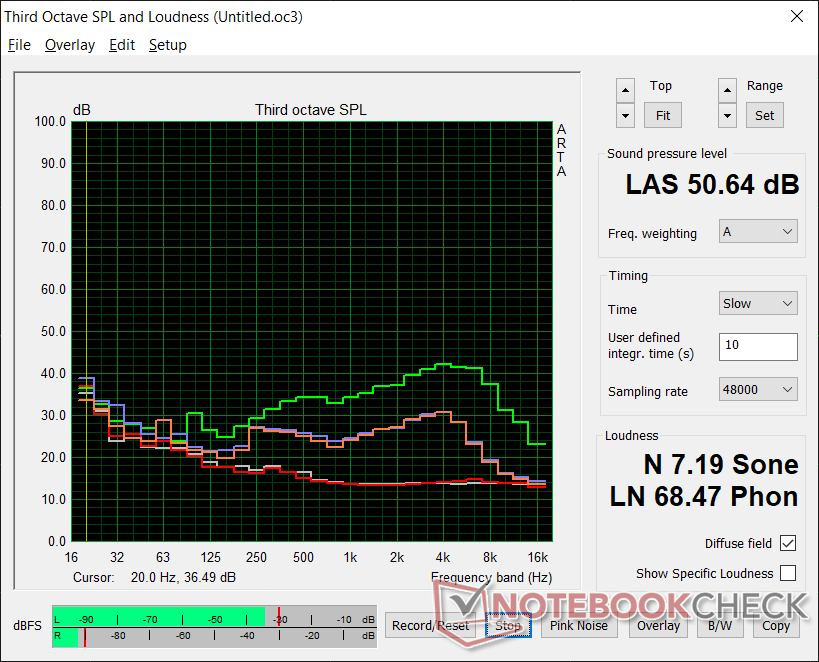
L'audio è superiore alla media per una postazione di lavoro, poiché il Precision 5550 è derivato da uno chassis consumer specializzato in qualità audio e visiva. Il sistema mantiene la configurazione degli altoparlanti da 8 W dell'XPS 15 9500 originale per una forte riproduzione audio.


Dell Precision 5550 P91F analisi audio
(+) | gli altoparlanti sono relativamente potenti (85 dB)
Bassi 100 - 315 Hz
(±) | bassi ridotti - in media 5.7% inferiori alla media
(±) | la linearità dei bassi è media (7.7% delta rispetto alla precedente frequenza)
Medi 400 - 2000 Hz
(+) | medi bilanciati - solo only 2.9% rispetto alla media
(+) | medi lineari (4.2% delta rispetto alla precedente frequenza)
Alti 2 - 16 kHz
(+) | Alti bilanciati - appena 2.3% dalla media
(+) | alti lineari (2.6% delta rispetto alla precedente frequenza)
Nel complesso 100 - 16.000 Hz
(+) | suono nel complesso lineare (6.7% differenza dalla media)
Rispetto alla stessa classe
» 0% di tutti i dispositivi testati in questa classe è stato migliore, 1% simile, 99% peggiore
» Il migliore ha avuto un delta di 7%, medio di 17%, peggiore di 35%
Rispetto a tutti i dispositivi testati
» 1% di tutti i dispositivi testati in questa classe è stato migliore, 0% similare, 99% peggiore
» Il migliore ha avuto un delta di 4%, medio di 24%, peggiore di 134%
Apple MacBook 12 (Early 2016) 1.1 GHz analisi audio
(+) | gli altoparlanti sono relativamente potenti (83.6 dB)
Bassi 100 - 315 Hz
(±) | bassi ridotti - in media 11.3% inferiori alla media
(±) | la linearità dei bassi è media (14.2% delta rispetto alla precedente frequenza)
Medi 400 - 2000 Hz
(+) | medi bilanciati - solo only 2.4% rispetto alla media
(+) | medi lineari (5.5% delta rispetto alla precedente frequenza)
Alti 2 - 16 kHz
(+) | Alti bilanciati - appena 2% dalla media
(+) | alti lineari (4.5% delta rispetto alla precedente frequenza)
Nel complesso 100 - 16.000 Hz
(+) | suono nel complesso lineare (10.2% differenza dalla media)
Rispetto alla stessa classe
» 7% di tutti i dispositivi testati in questa classe è stato migliore, 2% simile, 91% peggiore
» Il migliore ha avuto un delta di 5%, medio di 18%, peggiore di 53%
Rispetto a tutti i dispositivi testati
» 5% di tutti i dispositivi testati in questa classe è stato migliore, 1% similare, 94% peggiore
» Il migliore ha avuto un delta di 4%, medio di 24%, peggiore di 134%
Gestione energetica
Consumo Energetico
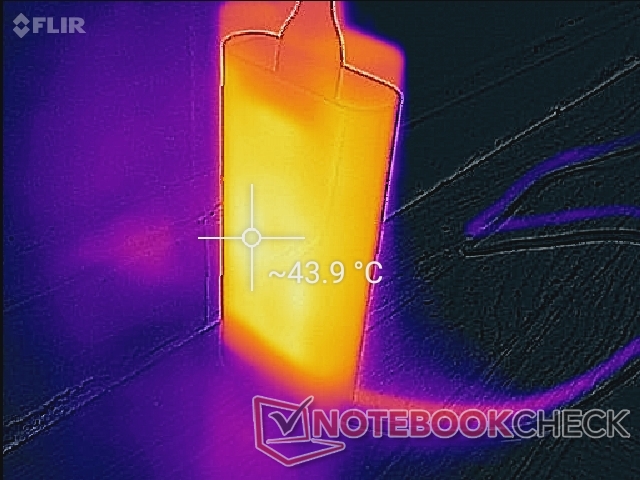
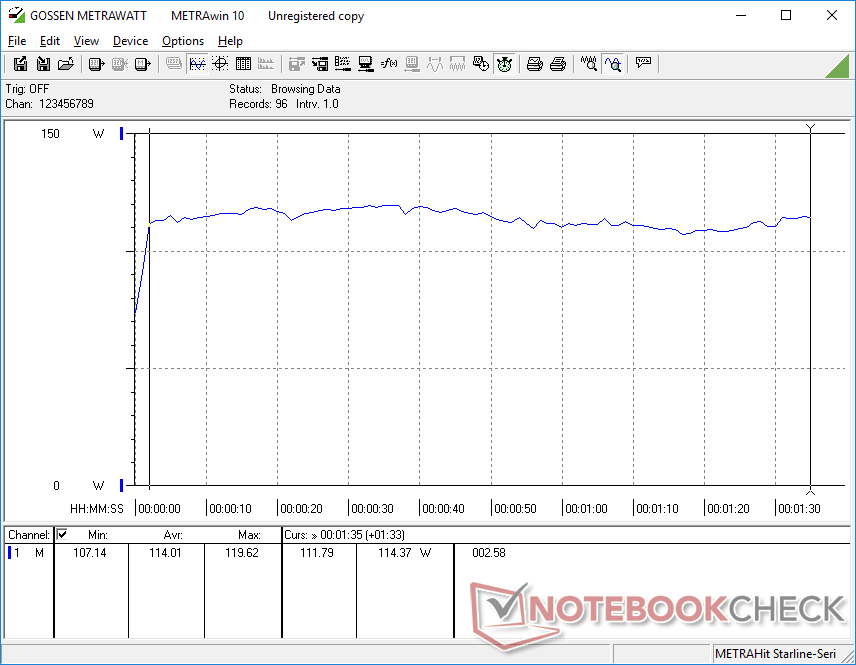
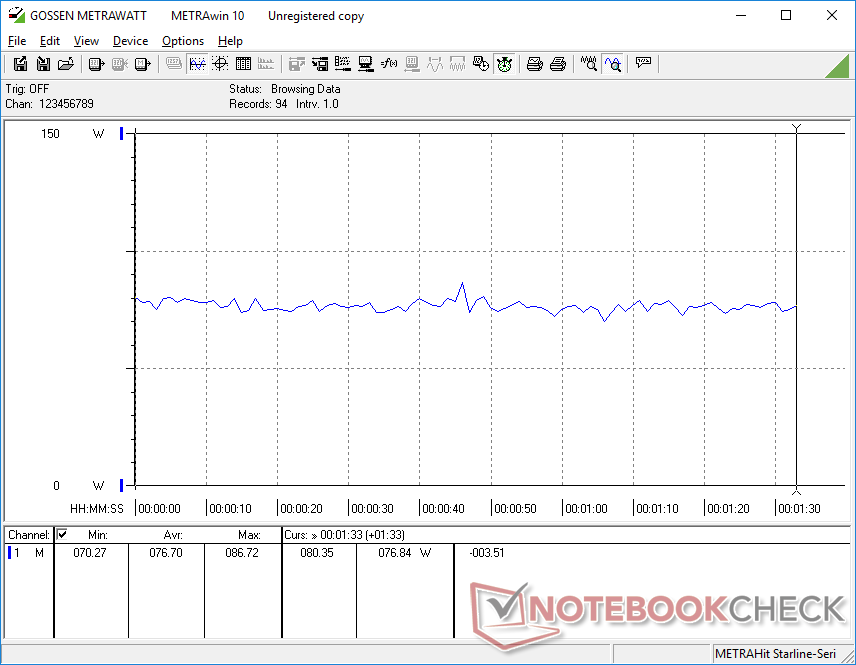
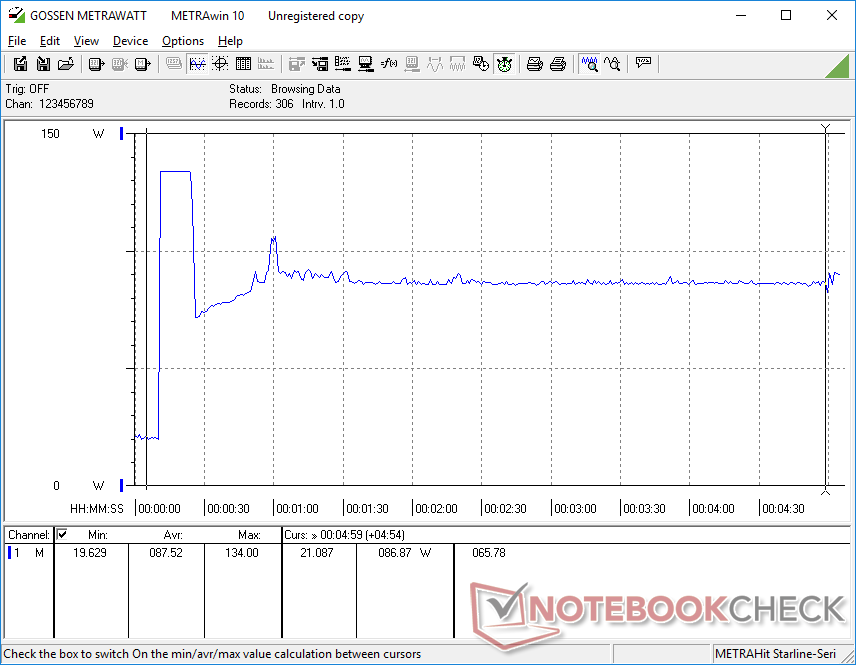
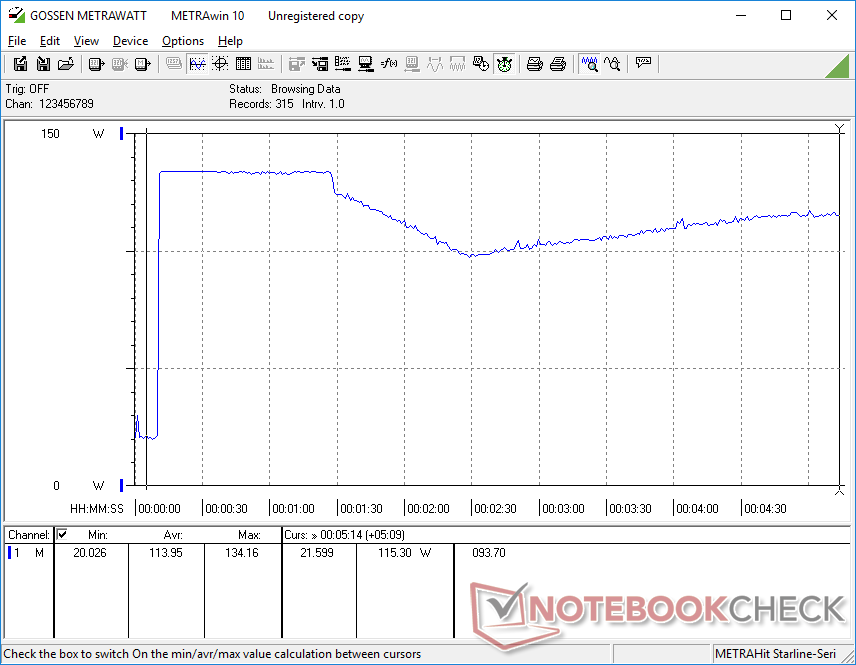
L'esecuzione di 3DMark 06 consuma in media 114 W, non diversamente da quanto abbiamo registrato sull'XPS 15 9500, ma il consumo energetico quando il gioco è inferiore a 77 W rispetto ai 93 W dell'XPS 15. La differenza è probabilmente attribuita alla GPU Quadro che funziona a velocità di clock più basse rispetto alla GTX 1660 Ti Max-Q e non è ottimizzata per il gaming.
Siamo in grado di registrare un consumo massimo temporaneo di 134,2 W dall'alimentatore medio-piccolo da 135 W (~14,3 x 6,5 x 2,2 cm) come mostrato dai nostri grafici qui sotto. Si noti che questo è esattamente lo stesso adattatore USB-C che viene fornito anche con l'XPS 15, XPS 17 e Precision 5750.
| Off / Standby | |
| Idle | |
| Sotto carico |
|
Leggenda:
min: | |
| Dell Precision 5550 P91F i7-10875H, Quadro T2000 Max-Q, SK Hynix PC601A NVMe 1TB, IPS, 3840x2400, 15.6" | Dell Precision 5540 i9-9980HK, Quadro T2000 Max-Q, SK hynix PC400 512 GB, OLED, 3840x2160, 15.6" | Razer Blade 15 Studio Edition 2020 i7-10875H, Quadro RTX 5000 Max-Q, Samsung PM981a MZVLB1T0HBLR, OLED, 3840x2160, 15.6" | Acer ConceptD 3 Pro CN315-71P-73W1 i7-9750H, Quadro T1000 (Laptop), WDC PC SN720 SDAPNTW-512G, IPS, 1920x1080, 15.6" | Lenovo ThinkPad P53-20QN000YGE i7-9850H, Quadro RTX 5000 Max-Q, Samsung PM981a MZVLB1T0HBLR, IPS, 1920x1080, 15.6" | MSI WP65 i7-9750H, Quadro P620, Samsung SSD PM981 MZVLB512HAJQ, IPS, 1920x1080, 15.6" | |
|---|---|---|---|---|---|---|
| Power Consumption | -2% | -59% | 31% | -27% | -4% | |
| Idle Minimum * (Watt) | 5.6 | 7.4 -32% | 13.4 -139% | 2.9 48% | 7.9 -41% | 5.6 -0% |
| Idle Average * (Watt) | 11.2 | 12.1 -8% | 18 -61% | 5.5 51% | 11.8 -5% | 8.6 23% |
| Idle Maximum * (Watt) | 18.4 | 12.7 31% | 26.1 -42% | 10.6 42% | 14.9 19% | 30.7 -67% |
| Load Average * (Watt) | 114 | 98 14% | 115 -1% | 86 25% | 96 16% | 78 32% |
| Witcher 3 ultra * (Watt) | 76.7 | 89.9 -17% | 145 -89% | 83 -8% | 149 -94% | 63.5 17% |
| Load Maximum * (Watt) | 134.2 | 135.1 -1% | 165 -23% | 100.7 25% | 207.8 -55% | 170.2 -27% |
* ... Meglio usare valori piccoli
Autonomia della batteria
La capacità della batteria è scesa da 97 Wh del Precision 5540 dello scorso anno a 86 Wh del nostro nuovo modello. L'autonomia, tuttavia, è maggiore arrivando a circa 9 ore di utilizzo della WLAN nel mondo reale e risulta molto vicina a quella che abbiamo osservato sull'XPS 15 9500.
La ricarica completa richiede circa 2 ore. Una qualsiasi delle tre porte USB-C può essere utilizzata per la ricarica.
| Dell Precision 5550 P91F i7-10875H, Quadro T2000 Max-Q, 86 Wh | Dell Precision 5540 i9-9980HK, Quadro T2000 Max-Q, 97 Wh | Razer Blade 15 Studio Edition 2020 i7-10875H, Quadro RTX 5000 Max-Q, 80 Wh | Acer ConceptD 3 Pro CN315-71P-73W1 i7-9750H, Quadro T1000 (Laptop), 58.7 Wh | Lenovo ThinkPad P53-20QN000YGE i7-9850H, Quadro RTX 5000 Max-Q, 90 Wh | MSI WP65 i7-9750H, Quadro P620, 51 Wh | |
|---|---|---|---|---|---|---|
| Autonomia della batteria | -9% | -18% | -10% | 33% | -48% | |
| Reader / Idle (h) | 22.6 | 15 -34% | 8.8 -61% | 10.1 -55% | ||
| WiFi v1.3 (h) | 9 | 7.7 -14% | 5.7 -37% | 8.1 -10% | 11.1 23% | 6 -33% |
| Load (h) | 1.4 | 1.7 21% | 2 43% | 2 43% | 0.6 -57% |
Pro
Contro
Giudizio Complessivo
Come la maggior parte degli altri laptop Studio ultra sottili e leggeri, il Precision 5550 dovrebbe essere apprezzato per il suo formato portatile, il design elegante e l'impressionante touchscreen lucido più che per le sue prestazioni grezze e le opzioni delle porte. Questo non vuol dire che sia un sistema debole, ma inevitabilmente si dovranno sacrificare alcune opzioni grafiche di fascia più alta per quell'attraente aspetto da Ultrabook.
Se non avete intenzione di spostarvi troppo o se potete concedervi più spazio, allora il più grande Precision 7550 avrà gambe molto più lunghe e migliori opzioni di prestazioni rispetto al Precision 5550. Questa macchina è costruita più per i viaggiatori e per le postazioni di lavoro ibride-Ultrabook piuttosto che come soluzione fissa destinata a far funzionare carichi elevati per ore e ore.
Più piccola, più sottile e più leggera della maggior parte delle workstation presenti oggi sul mercato. Il Dell Precision 5550 sacrifica le opzioni grafiche più elevate e la varietà di porte per un design adatto ai viaggi.
Dell Precision 5550 P91F
- 08/05/2020 v7 (old)
Allen Ngo
Price comparison
