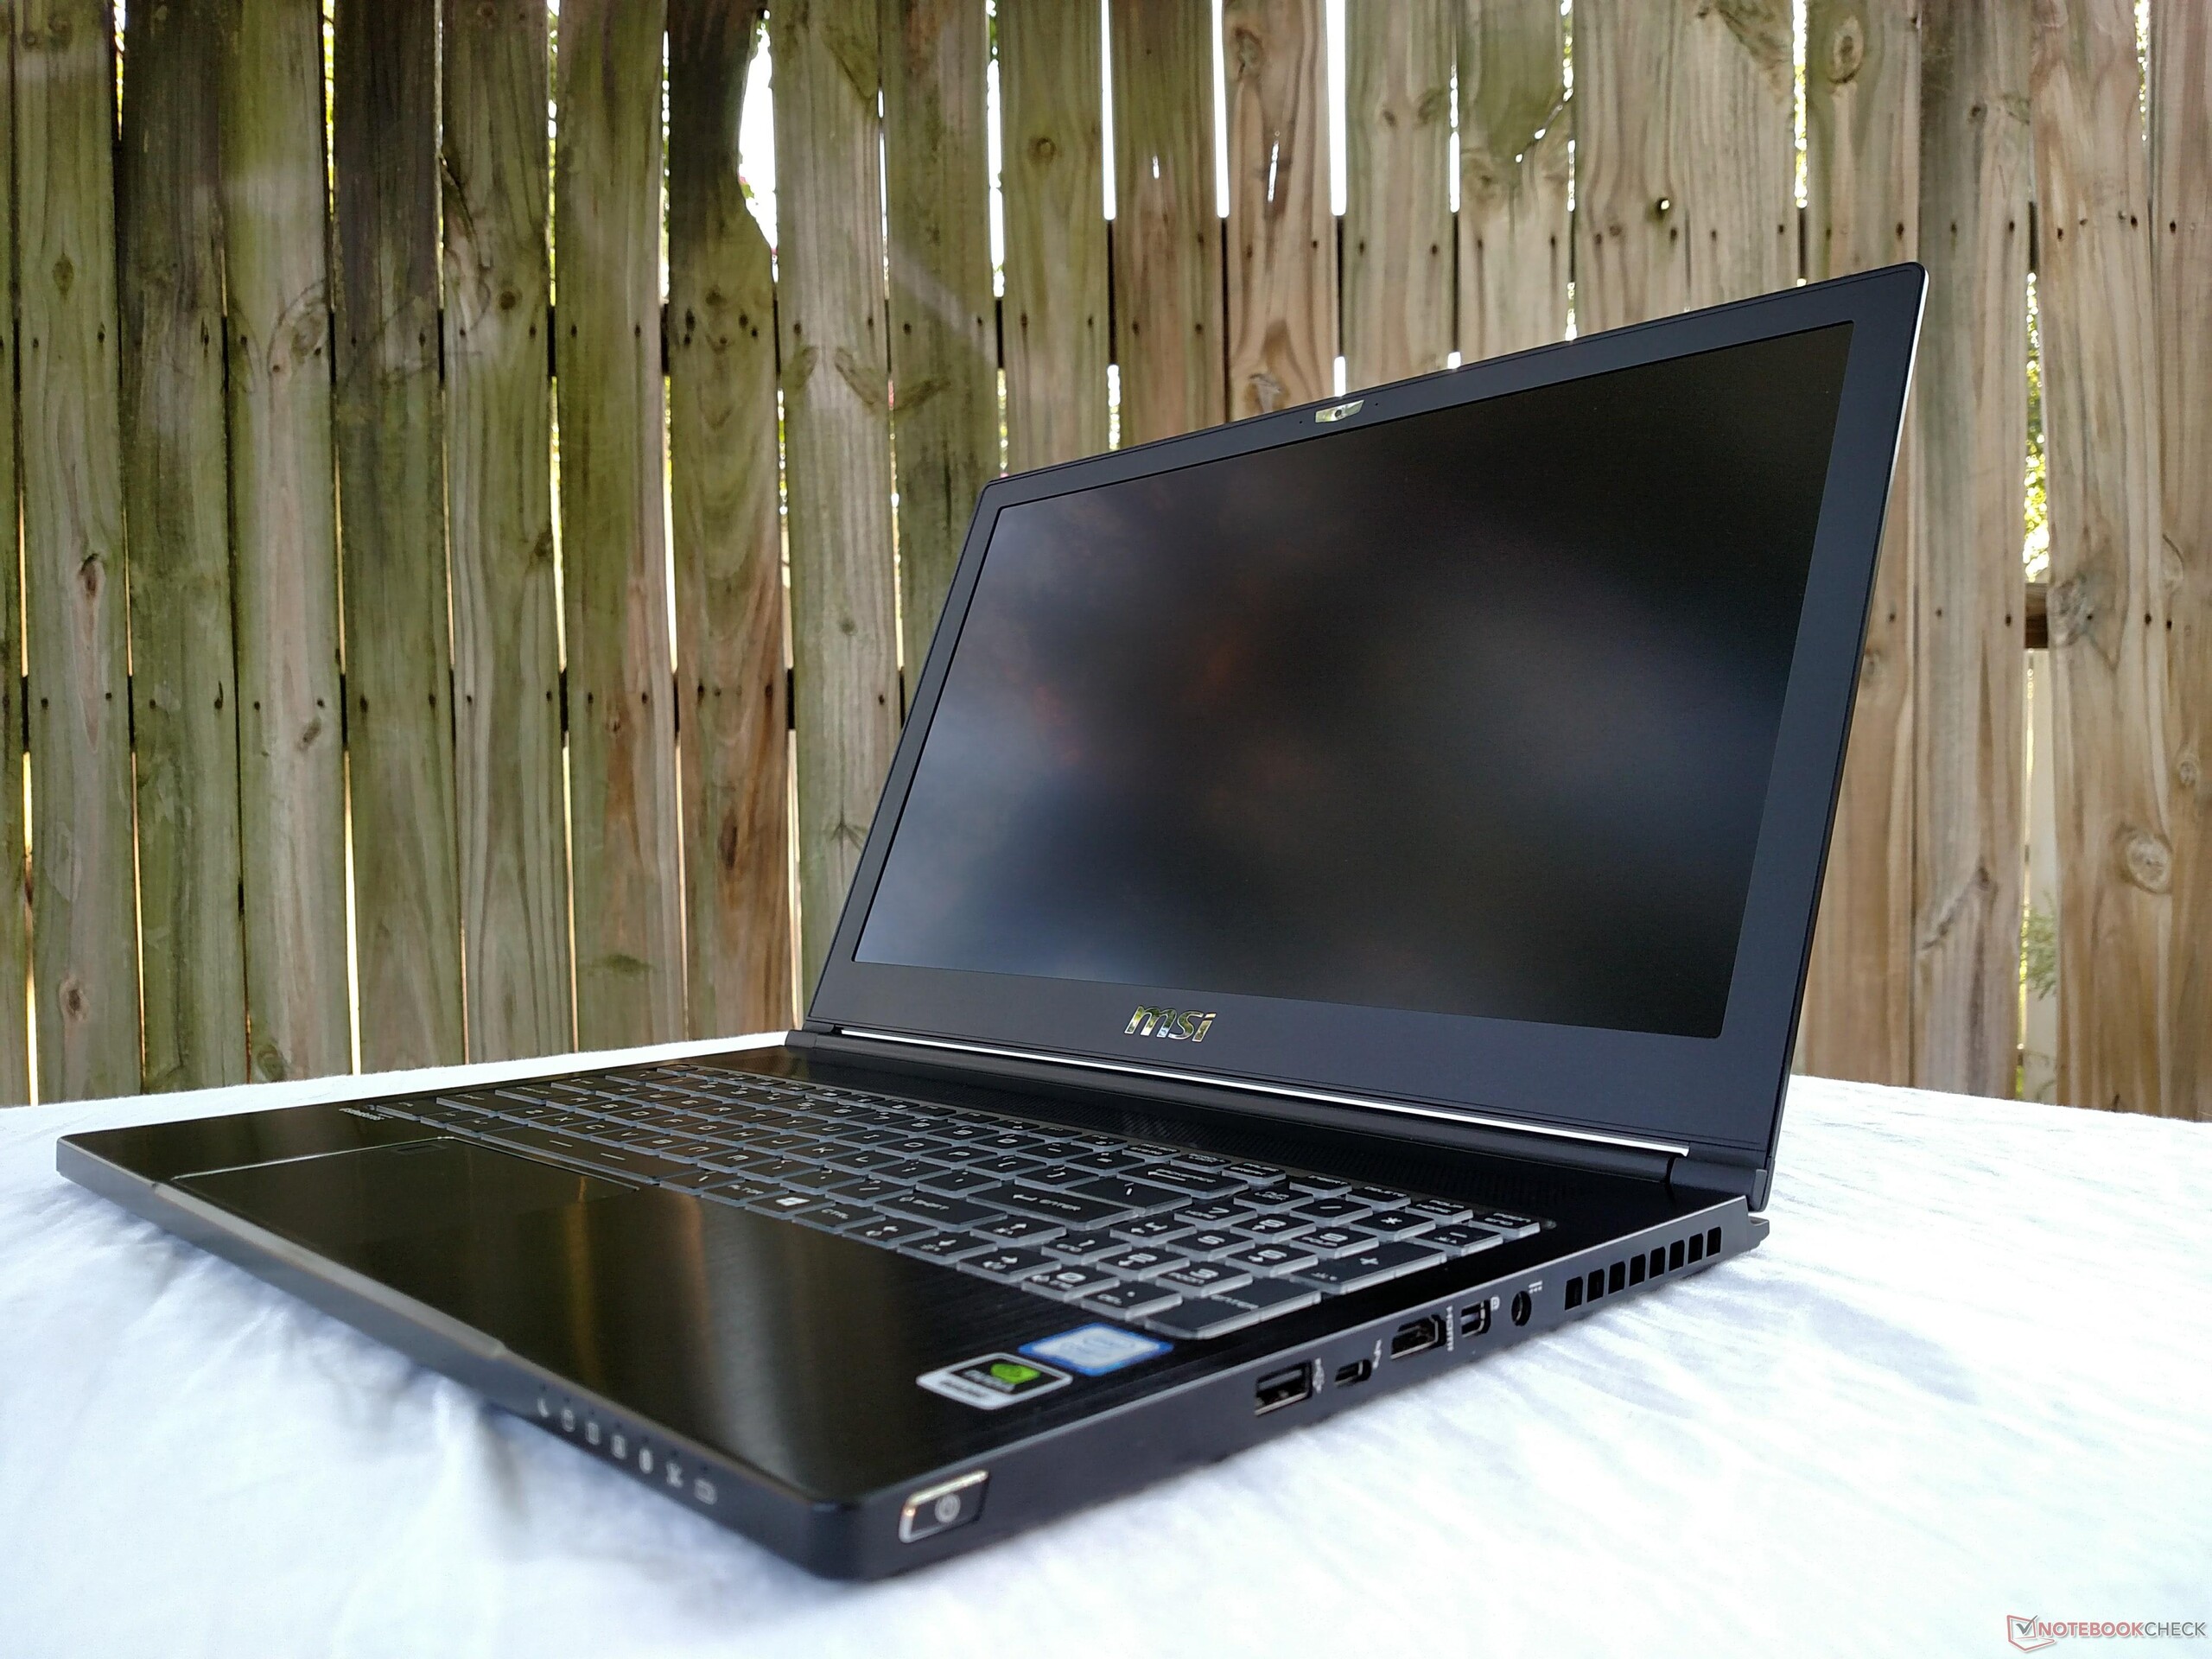
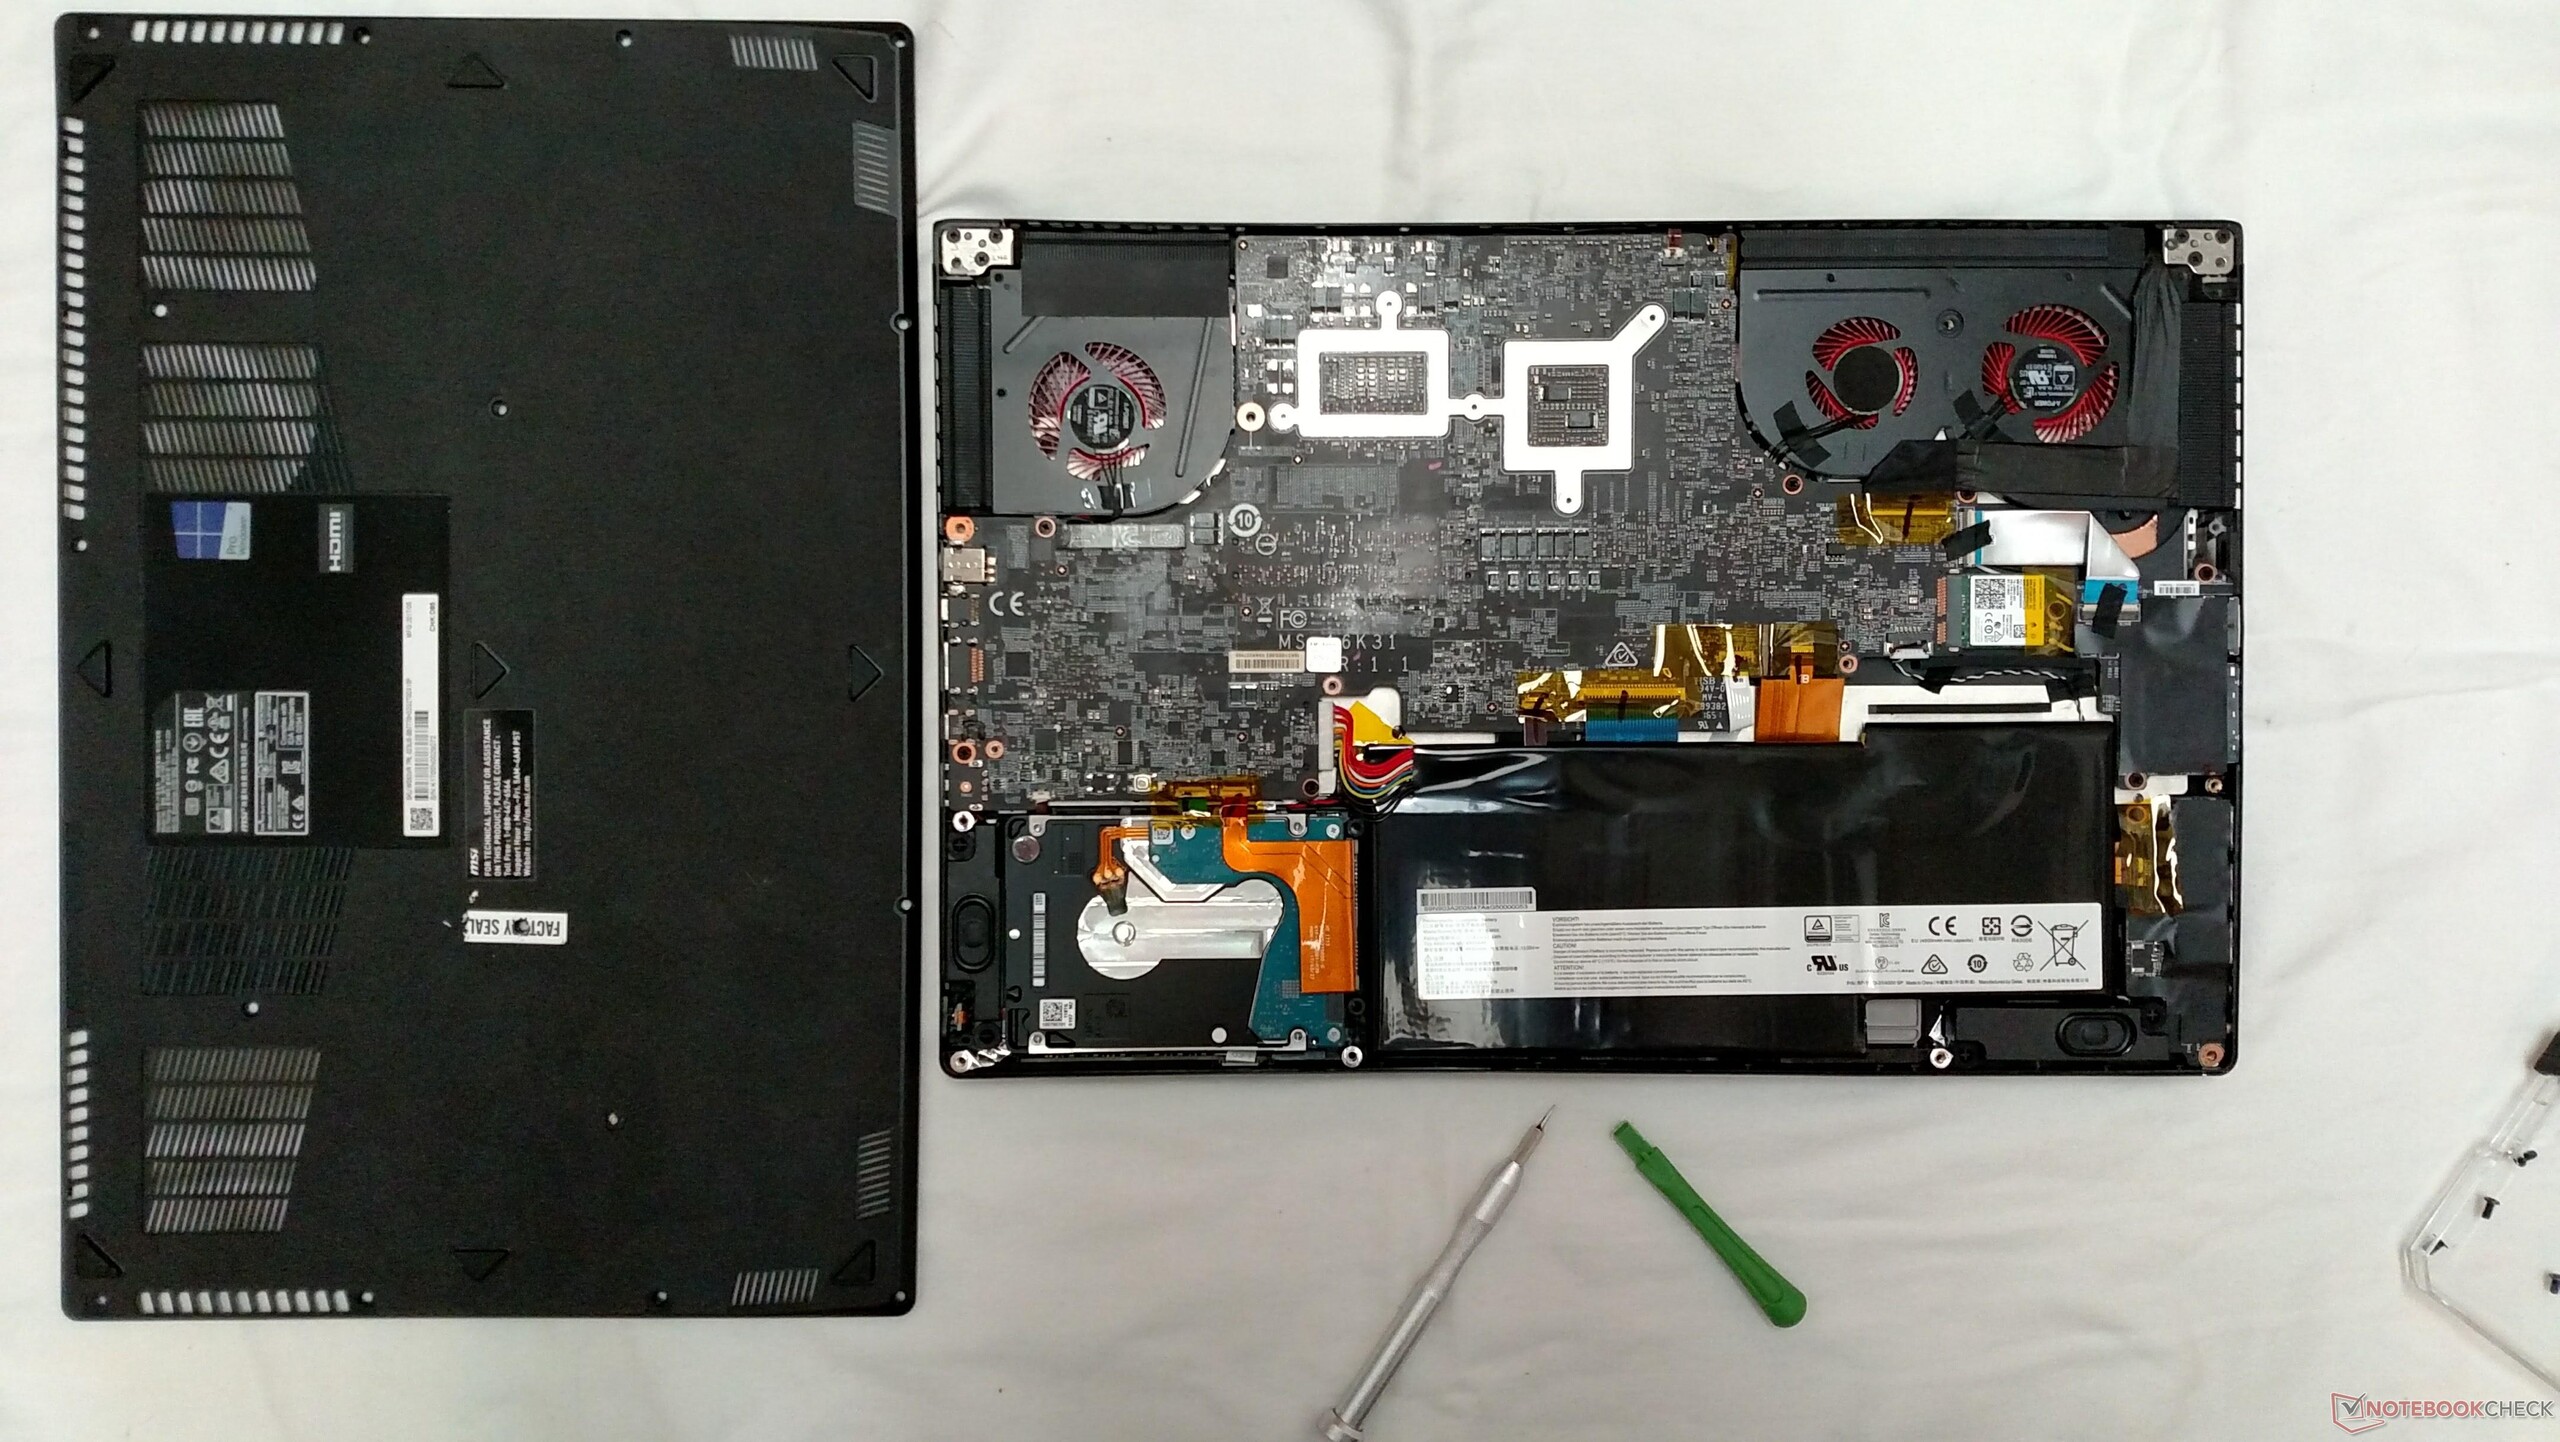
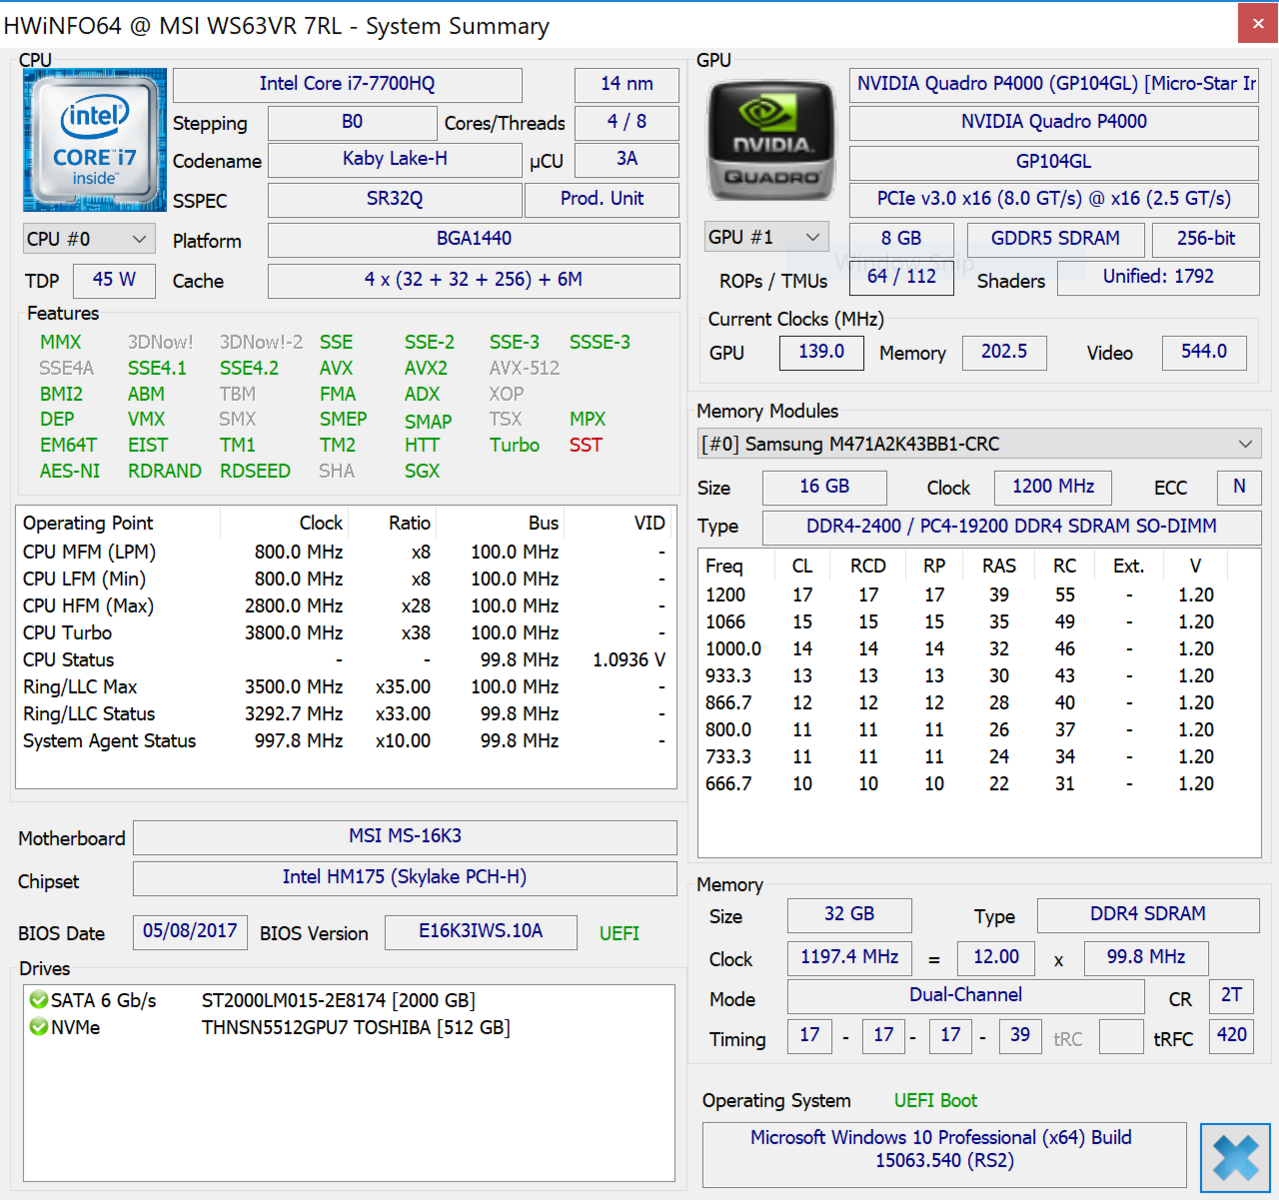
Recensione breve del Portatile MSI WS63VR (i7-7700HQ, 4K, Quadro P4000 Max-Q)
| SD Card Reader | |
| average JPG Copy Test (av. of 3 runs) | |
| HP ZBook 15 G4-Y4E80AV | |
| Dell Precision 5520 UHD | |
| Lenovo ThinkPad P51 20HH0016GE | |
| MSI WT72-6QM | |
| MSI WS63VR 7RL-023US | |
| Lenovo ThinkPad P51s 20HB000SGE | |
| MSI WS63 7RF-290US | |
| MSI GS63VR 7RF-228US | |
| maximum AS SSD Seq Read Test (1GB) | |
| Dell Precision 5520 UHD | |
| Lenovo ThinkPad P51 20HH0016GE | |
| MSI WS63VR 7RL-023US | |
| HP ZBook 15 G4-Y4E80AV | |
| MSI WT72-6QM | |
| Lenovo ThinkPad P51s 20HB000SGE | |
| MSI WS63 7RF-290US | |
| MSI GS63VR 7RF-228US | |
| |||||||||||||||||||||||||
Distribuzione della luminosità: 85 %
Al centro con la batteria: 259.4 cd/m²
Contrasto: 603:1 (Nero: 0.43 cd/m²)
ΔE ColorChecker Calman: 5.5 | ∀{0.5-29.43 Ø4.73}
ΔE Greyscale Calman: 3.6 | ∀{0.09-98 Ø4.97}
71% sRGB (Argyll 1.6.3 3D)
45% AdobeRGB 1998 (Argyll 1.6.3 3D)
49% AdobeRGB 1998 (Argyll 3D)
71.4% sRGB (Argyll 3D)
47.43% Display P3 (Argyll 3D)
Gamma: 2.24
CCT: 7163 K
| MSI WS63VR 7RL-023US SAMSUNG LƒFL156FL02-101 , IPS, 15.6", 3840x2160 | HP ZBook 15 G4-Y4E80AV LG Philips LGD057E, IPS, 15.6", 1920x1080 | MSI WS63 7RF-290US ID: LGD046F, Name: LG Philips LP156W6, Dell P/N: 3874Y, IPS, 15.6", 1920x1080 | Lenovo ThinkPad P51 20HH0016GE LEN40BD, B156ZAN02.1, IPS, 15.6", 3840x2160 | Lenovo ThinkPad P51s 20HB000SGE BOE NV156QUM-N44, IPS, 15.6", 3840x2160 | Dell Precision 5520 UHD SHP1476, IPS, 15.6", 3840x2160 | MSI GS63VR 7RF-228US IPS, 15.6", 3840x2160 | MSI WT72-6QM LG Philips LP173WF4-SPF1, IPS, 17.3", 1920x1080 | |
|---|---|---|---|---|---|---|---|---|
| Display | 25% | 26% | 75% | 37% | 40% | 2% | 30% | |
| Display P3 Coverage (%) | 47.43 | 64 35% | 63.6 34% | 86.3 82% | 69.7 47% | 67.4 42% | 48.21 2% | 67.3 42% |
| sRGB Coverage (%) | 71.4 | 82.7 16% | 84.2 18% | 99.5 39% | 91.2 28% | 98.5 38% | 72.6 2% | 85.4 20% |
| AdobeRGB 1998 Coverage (%) | 49 | 60.4 23% | 61.5 26% | 99.3 103% | 66.8 36% | 68.9 41% | 49.81 2% | 62.5 28% |
| Response Times | 2% | -10% | 0% | 5% | -54% | 21% | -3% | |
| Response Time Grey 50% / Grey 80% * (ms) | 36.8 ? | 39.2 ? -7% | 38 ? -3% | 40.8 ? -11% | 38.4 ? -4% | 59.2 ? -61% | 28 ? 24% | 42 ? -14% |
| Response Time Black / White * (ms) | 28.4 ? | 25.6 ? 10% | 33 ? -16% | 25.2 ? 11% | 24.8 ? 13% | 41.6 ? -46% | 23.6 ? 17% | 26 ? 8% |
| PWM Frequency (Hz) | 1351 ? | 20830 ? | 21740 ? | 980 ? | 1351 ? | 86 ? | ||
| Screen | 27% | 24% | 39% | 26% | 30% | -19% | 6% | |
| Brightness middle (cd/m²) | 259.4 | 321 24% | 302.5 17% | 317 22% | 317 22% | 372.4 44% | 274.2 6% | 303 17% |
| Brightness (cd/m²) | 247 | 320 30% | 295 19% | 309 25% | 290 17% | 368 49% | 263 6% | 298 21% |
| Brightness Distribution (%) | 85 | 89 5% | 92 8% | 89 5% | 85 0% | 90 6% | 92 8% | 94 11% |
| Black Level * (cd/m²) | 0.43 | 0.29 33% | 0.31 28% | 0.36 16% | 0.32 26% | 0.48 -12% | 0.44 -2% | 0.46 -7% |
| Contrast (:1) | 603 | 1107 84% | 976 62% | 881 46% | 991 64% | 776 29% | 623 3% | 659 9% |
| Colorchecker dE 2000 * | 5.5 | 4.5 18% | 4.3 22% | 2.7 51% | 3.6 35% | 2.6 53% | 8 -45% | 5.77 -5% |
| Colorchecker dE 2000 max. * | 12.7 | 9.5 25% | 9.4 26% | 4.1 68% | 6.6 48% | 5.6 56% | 14.6 -15% | |
| Greyscale dE 2000 * | 3.6 | 2.9 19% | 3.1 14% | 3 17% | 4.2 -17% | 3.7 -3% | 9.1 -153% | 4.87 -35% |
| Gamma | 2.24 98% | 2.27 97% | 2.16 102% | 2.27 97% | 2.24 98% | 2.14 103% | 2.24 98% | 1.99 111% |
| CCT | 7163 91% | 6519 100% | 7071 92% | 6077 107% | 6740 96% | 7096 92% | 5020 129% | 7363 88% |
| Color Space (Percent of AdobeRGB 1998) (%) | 45 | 54.2 20% | 55 22% | 87.6 95% | 59.5 32% | 63 40% | 45.7 2% | 56.04 25% |
| Color Space (Percent of sRGB) (%) | 71 | 82.6 16% | 84.3 19% | 99.5 40% | 91.1 28% | 99 39% | 72.1 2% | 85.27 20% |
| Media totale (Programma / Settaggio) | 18% /
23% | 13% /
20% | 38% /
41% | 23% /
25% | 5% /
21% | 1% /
-9% | 11% /
10% |
* ... Meglio usare valori piccoli
Tempi di risposta del Display
| ↔ Tempi di risposta dal Nero al Bianco | ||
|---|---|---|
| 28.4 ms ... aumenta ↗ e diminuisce ↘ combinato | ↗ 19.6 ms Incremento | 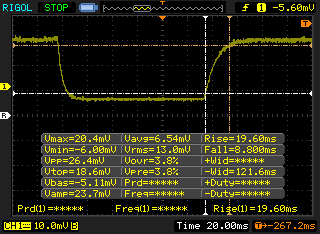 |
| ↘ 8.8 ms Calo | ||
| Lo schermo mostra tempi di risposta relativamente lenti nei nostri tests e potrebbe essere troppo lento per i gamers. In confronto, tutti i dispositivi di test variano da 0.1 (minimo) a 240 (massimo) ms. » 75 % di tutti i dispositivi è migliore. Questo significa che i tempi di risposta rilevati sono peggiori rispetto alla media di tutti i dispositivi testati (19.9 ms). | ||
| ↔ Tempo di risposta dal 50% Grigio all'80% Grigio | ||
| 36.8 ms ... aumenta ↗ e diminuisce ↘ combinato | ↗ 21.2 ms Incremento | 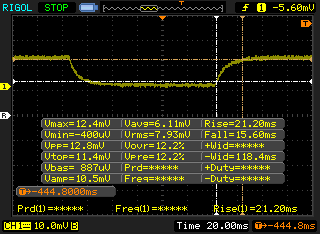 |
| ↘ 15.6 ms Calo | ||
| Lo schermo mostra tempi di risposta lenti nei nostri tests e sarà insoddisfacente per i gamers. In confronto, tutti i dispositivi di test variano da 0.165 (minimo) a 636 (massimo) ms. » 53 % di tutti i dispositivi è migliore. Questo significa che i tempi di risposta rilevati sono peggiori rispetto alla media di tutti i dispositivi testati (31.1 ms). | ||
Sfarfallio dello schermo / PWM (Pulse-Width Modulation)
| flickering dello schermo / PWM rilevato | 1351 Hz | ≤ 30 % settaggio luminosita' | 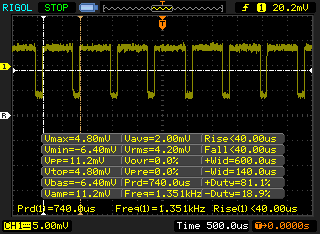 |
Il display sfarfalla a 1351 Hz (Probabilmente a causa dell'uso di PWM) Flickering rilevato ad una luminosita' di 30 % o inferiore. Non dovrebbe verificarsi flickering o PWM sopra questo valore di luminosita'. La frequenza di 1351 Hz è abbastanza alta, quindi la maggioranza degli utenti sensibili al PWM non dovrebbero notare alcun flickering. In confronto: 52 % di tutti i dispositivi testati non utilizza PWM per ridurre la luminosita' del display. Se è rilevato PWM, una media di 7794 (minimo: 5 - massimo: 343500) Hz è stata rilevata. | |||
| Cinebench R11.5 | |
| CPU Single 64Bit | |
| Dell Precision 5520 UHD | |
| Lenovo ThinkPad P51 20HH0016GE | |
| Lenovo ThinkPad P51s 20HB000SGE | |
| MSI WS63 7RF-290US | |
| MSI WT72-6QM | |
| MSI GS63VR 7RF-228US | |
| MSI WS63VR 7RL-023US | |
| CPU Multi 64Bit | |
| Lenovo ThinkPad P51 20HH0016GE | |
| MSI GS63VR 7RF-228US | |
| MSI WS63 7RF-290US | |
| MSI WS63VR 7RL-023US | |
| Dell Precision 5520 UHD | |
| MSI WT72-6QM | |
| Lenovo ThinkPad P51s 20HB000SGE | |
| Cinebench R10 | |
| Rendering Multiple CPUs 32Bit | |
| MSI WS63VR 7RL-023US | |
| Lenovo ThinkPad P51 20HH0016GE | |
| MSI WS63 7RF-290US | |
| MSI GS63VR 7RF-228US | |
| MSI WT72-6QM | |
| Lenovo ThinkPad P51s 20HB000SGE | |
| Rendering Single 32Bit | |
| Lenovo ThinkPad P51 20HH0016GE | |
| Lenovo ThinkPad P51s 20HB000SGE | |
| MSI WS63 7RF-290US | |
| MSI GS63VR 7RF-228US | |
| MSI WT72-6QM | |
| wPrime 2.10 - 1024m | |
| Lenovo ThinkPad P51 20HH0016GE | |
| Dell Precision 5520 UHD | |
| MSI GS63VR 7RF-228US | |
| MSI WS63 7RF-290US | |
| MSI WS63VR 7RL-023US | |
* ... Meglio usare valori piccoli
| PCMark 8 Home Score Accelerated v2 | 3739 punti | |
| PCMark 8 Creative Score Accelerated v2 | 5328 punti | |
| PCMark 8 Work Score Accelerated v2 | 4390 punti | |
| PCMark 10 Score | 4751 punti | |
Aiuto | ||
| MSI WS63VR 7RL-023US Toshiba NVMe THNSN5512GPU7 | MSI WS63 7RF-290US Samsung SM961 MZVKW512HMJP m.2 PCI-e | Lenovo ThinkPad P51 20HH0016GE Samsung PM961 NVMe MZVLW512HMJP | Lenovo ThinkPad P51s 20HB000SGE Samsung SSD PM961 1TB M.2 PCIe 3.0 x4 NVMe (MZVLW1T0) | Dell Precision 5520 UHD Samsung SM961 MZVKW512HMJP m.2 PCI-e | MSI GS63VR 7RF-228US Samsung SM961 MZVKW512HMJP m.2 PCI-e | MSI WT72-6QM Toshiba NVMe THNSN5256GPU7 | |
|---|---|---|---|---|---|---|---|
| AS SSD | 75% | 55% | 43% | 76% | 75% | 11% | |
| Copy Game MB/s (MB/s) | 1121 | 1140 | 721 | 921 | 1082 | 1025 | |
| Copy Program MB/s (MB/s) | 447.3 | 425.6 | 411.5 | 372.8 | 401.9 | 554 | |
| Copy ISO MB/s (MB/s) | 1760 | 1607 | 1200 | 1659 | 1666 | 1777 | |
| Score Total (Points) | 1979 | 3759 90% | 3424 73% | 2771 40% | 3681 86% | 3756 90% | 2433 23% |
| Score Write (Points) | 557 | 1440 159% | 917 65% | 1271 128% | 1379 148% | 1468 164% | 651 17% |
| Score Read (Points) | 962 | 1568 63% | 1690 76% | 990 3% | 1554 62% | 1549 61% | 1237 29% |
| Access Time Write * (ms) | 0.033 | 0.028 15% | 0.025 24% | 0.027 18% | 0.023 30% | 0.029 12% | 0.04 -21% |
| Access Time Read * (ms) | 0.128 | 0.036 72% | 0.032 75% | 0.082 36% | 0.038 70% | 0.041 68% | 0.092 28% |
| 4K-64 Write (MB/s) | 314 | 1151 267% | 623 98% | 1018 224% | 1055 236% | 1185 277% | 473.5 51% |
| 4K-64 Read (MB/s) | 710 | 1244 75% | 1372 93% | 792 12% | 1223 72% | 1229 73% | 935 32% |
| 4K Write (MB/s) | 114.6 | 128.5 12% | 143.1 25% | 130.8 14% | 155.3 36% | 127.6 11% | 96.4 -16% |
| 4K Read (MB/s) | 40.2 | 49.02 22% | 55.6 38% | 52.8 31% | 51.5 28% | 48.01 19% | 37.5 -7% |
| Seq Write (MB/s) | 1287 | 1603 25% | 1506 17% | 1217 -5% | 1694 32% | 1550 20% | 810 -37% |
| Seq Read (MB/s) | 2133 | 2750 29% | 2624 23% | 1450 -32% | 2799 31% | 2719 27% | 2638 24% |
* ... Meglio usare valori piccoli

| 3DMark 11 | |
| 1280x720 Performance GPU | |
| Aorus X7 v7 | |
| Asus Zephyrus GX501VS | |
| MSI WS63VR 7RL-023US | |
| Fujitsu Celsius H970 | |
| Acer Aspire 7 A717-71G-72VY | |
| MSI GS63VR 7RF-228US | |
| Lenovo Legion Y520-15IKBM 80YY001APB | |
| MSI WS63 7RF-290US | |
| MSI WT72-6QM | |
| Lenovo ThinkPad P71-20HK0004GE | |
| Lenovo ThinkPad P70-20ER000XUS | |
| Lenovo ThinkPad P51 20HH0016GE | |
| Dell Precision 5520 UHD | |
| Lenovo ThinkPad P51s 20HB000SGE | |
| 1280x720 Performance Combined | |
| Aorus X7 v7 | |
| Lenovo ThinkPad P71-20HK0004GE | |
| MSI WT72-6QM | |
| MSI WS63VR 7RL-023US | |
| Asus Zephyrus GX501VS | |
| MSI WS63 7RF-290US | |
| MSI GS63VR 7RF-228US | |
| Lenovo ThinkPad P70-20ER000XUS | |
| Fujitsu Celsius H970 | |
| Lenovo ThinkPad P51 20HH0016GE | |
| Acer Aspire 7 A717-71G-72VY | |
| Lenovo Legion Y520-15IKBM 80YY001APB | |
| Dell Precision 5520 UHD | |
| Lenovo ThinkPad P51s 20HB000SGE | |
| 3DMark | |
| 1280x720 Cloud Gate Standard Graphics | |
| Aorus X7 v7 | |
| Asus Zephyrus GX501VS | |
| MSI WS63VR 7RL-023US | |
| Acer Aspire 7 A717-71G-72VY | |
| MSI WS63 7RF-290US | |
| MSI WT72-6QM | |
| Lenovo ThinkPad P71-20HK0004GE | |
| Lenovo Legion Y520-15IKBM 80YY001APB | |
| Fujitsu Celsius H970 | |
| Lenovo ThinkPad P70-20ER000XUS | |
| HP ZBook 15 G4-Y4E80AV | |
| Lenovo ThinkPad P51 20HH0016GE | |
| MSI GS63VR 7RF-228US | |
| Dell Precision 5520 UHD | |
| Lenovo ThinkPad P51s 20HB000SGE | |
| 1920x1080 Fire Strike Graphics | |
| Aorus X7 v7 | |
| Asus Zephyrus GX501VS | |
| MSI WS63VR 7RL-023US | |
| Fujitsu Celsius H970 | |
| Acer Aspire 7 A717-71G-72VY | |
| MSI GS63VR 7RF-228US | |
| Lenovo Legion Y520-15IKBM 80YY001APB | |
| MSI WS63 7RF-290US | |
| MSI WT72-6QM | |
| Lenovo ThinkPad P71-20HK0004GE | |
| Lenovo ThinkPad P70-20ER000XUS | |
| Lenovo ThinkPad P51 20HH0016GE | |
| HP ZBook 15 G4-Y4E80AV | |
| Dell Precision 5520 UHD | |
| Lenovo ThinkPad P51s 20HB000SGE | |
| 1920x1080 Ice Storm Extreme Graphics | |
| Aorus X7 v7 | |
| MSI WT72-6QM | |
| Asus Zephyrus GX501VS | |
| Lenovo ThinkPad P70-20ER000XUS | |
| MSI WS63 7RF-290US | |
| Lenovo Legion Y520-15IKBM 80YY001APB | |
| Dell Precision 5520 UHD | |
| Lenovo ThinkPad P51s 20HB000SGE | |
| 3DMark 06 Standard Score | 28211 punti | |
| 3DMark 11 Performance | 13482 punti | |
| 3DMark Cloud Gate Standard Score | 25528 punti | |
| 3DMark Fire Strike Score | 10473 punti | |
Aiuto | ||
| The Witcher 3 | |
| 1920x1080 Ultra Graphics & Postprocessing (HBAO+) | |
| Aorus X7 v7 | |
| Asus Zephyrus GX501VS | |
| MSI WS63VR 7RL-023US | |
| Fujitsu Celsius H970 | |
| MSI GS63VR 7RF-228US | |
| Acer Aspire 7 A717-71G-72VY | |
| Lenovo Legion Y520-15IKBM 80YY001APB | |
| MSI WS63 7RF-290US | |
| Lenovo ThinkPad P71-20HK0004GE | |
| Lenovo ThinkPad P51 20HH0016GE | |
| HP ZBook 15 G4-Y4E80AV | |
| 3840x2160 High Graphics & Postprocessing (Nvidia HairWorks Off) | |
| MSI WS63VR 7RL-023US | |
| MSI GS63VR 7RF-228US | |
| Lenovo ThinkPad P71-20HK0004GE | |
| Lenovo ThinkPad P51 20HH0016GE | |
| Batman: Arkham Knight | |
| 3840x2160 High / On (Interactive Smoke & Paper Debris Off) AA:SM AF:8x | |
| MSI WS63VR 7RL-023US | |
| MSI GS63VR 7RF-228US | |
| Dell Precision 5520 UHD | |
| 1920x1080 High / On AA:SM AF:16x | |
| MSI WS63VR 7RL-023US | |
| Asus Zephyrus GX501VS | |
| MSI GS63VR 7RF-228US | |
| MSI WS63 7RF-290US | |
| Lenovo Legion Y520-15IKBM 80YY001APB | |
| Dell Precision 5520 UHD | |
| BioShock Infinite - 1920x1080 Ultra Preset, DX11 (DDOF) | |
| Aorus X7 v7 | |
| Asus Zephyrus GX501VS | |
| MSI WS63VR 7RL-023US | |
| MSI GS63VR 7RF-228US | |
| Fujitsu Celsius H970 | |
| MSI WS63 7RF-290US | |
| Lenovo ThinkPad P71-20HK0004GE | |
| Lenovo Legion Y520-15IKBM 80YY001APB | |
| Lenovo ThinkPad P70-20ER000XUS | |
| HP ZBook 15 G4-Y4E80AV | |
| Dell Precision 5520 UHD | |
| Lenovo ThinkPad P51s 20HB000SGE | |
| Metro: Last Light - 1920x1080 Very High (DX11) AF:16x | |
| Asus Zephyrus GX501VS | |
| MSI WS63VR 7RL-023US | |
| MSI GS63VR 7RF-228US | |
| MSI WS63 7RF-290US | |
| MSI WT72-6QM | |
| Rise of the Tomb Raider | |
| 3840x2160 High Preset AA:FX AF:4x | |
| MSI WS63VR 7RL-023US | |
| MSI GS63VR 7RF-228US | |
| Lenovo ThinkPad P71-20HK0004GE | |
| Lenovo ThinkPad P70-20ER000XUS | |
| Lenovo ThinkPad P51 20HH0016GE | |
| 1920x1080 Very High Preset AA:FX AF:16x | |
| Asus Zephyrus GX501VS | |
| Fujitsu Celsius H970 | |
| MSI WS63VR 7RL-023US | |
| MSI GS63VR 7RF-228US | |
| MSI WS63 7RF-290US | |
| Lenovo ThinkPad P71-20HK0004GE | |
| Lenovo ThinkPad P70-20ER000XUS | |
| Lenovo ThinkPad P51 20HH0016GE | |
| HP ZBook 15 G4-Y4E80AV | |
| Lenovo ThinkPad P51s 20HB000SGE | |
| Ashes of the Singularity | |
| 1920x1080 high | |
| Asus Zephyrus GX501VS | |
| MSI WS63VR 7RL-023US | |
| MSI WS63 7RF-290US | |
| Lenovo ThinkPad P51s 20HB000SGE | |
| 3840x2160 extreme | |
| MSI WS63VR 7RL-023US | |
| 3840x2160 crazy | |
| MSI WS63VR 7RL-023US | |
| Civilization 6 | |
| 3840x2160 High Preset | |
| MSI WS63VR 7RL-023US | |
| 1920x1080 Ultra Preset AA:4xMS | |
| MSI WS63VR 7RL-023US | |
| Fujitsu Celsius H970 | |
| Lenovo ThinkPad P51s 20HB000SGE | |
| basso | medio | alto | ultra | 4K | |
|---|---|---|---|---|---|
| Batman: Arkham City (2011) | 195 | 170 | 144 | 106 | |
| BioShock Infinite (2013) | 256 | 218 | 202 | 113 | |
| Metro: Last Light (2013) | 129 | 79 | 78 | 84 | |
| Company of Heroes 2 (2013) | 69 | 63 | 62 | 50 | |
| Batman: Arkham Origins (2013) | 330 | 270 | 177 | 82 | |
| Thief (2014) | 96 | 94 | 93 | 79 | |
| Middle-earth: Shadow of Mordor (2014) | 123 | 112 | 107 | 90 | |
| Alien: Isolation (2014) | 250 | 212 | 192 | 148 | |
| Ryse: Son of Rome (2014) | 121 | 111 | 88 | 82 | |
| The Witcher 3 (2015) | 162 | 119 | 79 | 42 | 29 |
| Batman: Arkham Knight (2015) | 171 | 152 | 96 | 94 | 32 |
| Metal Gear Solid V (2015) | 60 | 60 | 60 | 60 | 50 |
| Call of Duty: Black Ops 3 (2015) | 145 | 133 | 85 | 82 | 32 |
| Fallout 4 (2015) | 156 | 151 | 93 | 76 | 30 |
| Just Cause 3 (2015) | 140 | 133 | 89 | 77 | 35 |
| Rise of the Tomb Raider (2016) | 176 | 144 | 77 | 65 | 28 |
| Ashes of the Singularity (2016) | 76 | 67 | 62 | 26 | |
| Doom (2016) | 130 | 121 | 97 | 92 | 35 |
| Deus Ex Mankind Divided (2016) | 129 | 106 | 60 | 32 | 21 |
| Mafia 3 (2016) | 84 | 104 | 43 | 17 | |
| Civilization 6 (2016) | 80 | 76 | 63 | 60 | 44 |
| Resident Evil 7 (2017) | 354 | 195 | 161 | 135 | 60 |
| Prey (2017) | 142 | 129 | 125 | 109 | 38 |
| Rocket League (2017) | 244 | 223 | 163 | ||
| Dirt 4 (2017) | 220 | 164 | 93 | 55 | 34 |
| F1 2017 (2017) | 193 | 140 | 105 | 72 | 34 |
| Ark Survival Evolved (2017) | 92 | 52 | 51 | 27 | 27 |
Rumorosità
| Idle |
| 33.2 / 33.2 / 33.2 dB(A) |
| Sotto carico |
| 41.4 / 43.5 dB(A) |
 | ||
30 dB silenzioso 40 dB(A) udibile 50 dB(A) rumoroso |
||
min: | ||
| MSI WS63VR 7RL-023US Quadro P4000 Max-Q, i7-7700HQ, Toshiba NVMe THNSN5512GPU7 | HP ZBook 15 G4-Y4E80AV Quadro M2200, E3-1535M v6, Samsung SSD SM961 1TB M.2 MZVKW1T0HMLH | MSI WS63 7RF-290US Quadro P3000, i7-7700HQ, Samsung SM961 MZVKW512HMJP m.2 PCI-e | Lenovo ThinkPad P51 20HH0016GE Quadro M2200, E3-1505M v6, Samsung PM961 NVMe MZVLW512HMJP | Lenovo ThinkPad P51s 20HB000SGE Quadro M520, i7-7600U, Samsung SSD PM961 1TB M.2 PCIe 3.0 x4 NVMe (MZVLW1T0) | Dell Precision 5520 UHD Quadro M1200, E3-1505M v6, Samsung SM961 MZVKW512HMJP m.2 PCI-e | MSI GS63VR 7RF-228US GeForce GTX 1060 Mobile, i7-7700HQ, Samsung SM961 MZVKW512HMJP m.2 PCI-e | MSI WT72-6QM Quadro M5000M, E3-1505M v5, Toshiba NVMe THNSN5256GPU7 | |
|---|---|---|---|---|---|---|---|---|
| Noise | 7% | 6% | 11% | 8% | -1% | -3% | 2% | |
| off /ambiente * (dB) | 28 | 29.5 -5% | 28.1 -0% | 29.6 -6% | 29.2 -4% | 28.7 -2% | 28.8 -3% | |
| Idle Minimum * (dB) | 33.2 | 29.5 11% | 28.1 15% | 29.6 11% | 29.2 12% | 28.7 14% | 33.1 -0% | 33.3 -0% |
| Idle Average * (dB) | 33.2 | 29.5 11% | 28.1 15% | 29.6 11% | 29.2 12% | 32.1 3% | 33.1 -0% | 33.4 -1% |
| Idle Maximum * (dB) | 33.2 | 30 10% | 32 4% | 29.6 11% | 31.1 6% | 32.1 3% | 34 -2% | 33.5 -1% |
| Load Average * (dB) | 41.4 | 39.5 5% | 38 8% | 32.2 22% | 36.7 11% | 41.3 -0% | 37.2 10% | 38.8 6% |
| Witcher 3 ultra * (dB) | 38.4 | 39.5 -3% | 35.8 7% | 45.5 -18% | 46.1 -20% | |||
| Load Maximum * (dB) | 43.5 | 36 17% | 47.2 -9% | 36.6 16% | 39.4 9% | 45.5 -5% | 47.1 -8% | 40.2 8% |
* ... Meglio usare valori piccoli
(±) La temperatura massima sul lato superiore è di 45 °C / 113 F, rispetto alla media di 38.2 °C / 101 F, che varia da 22.2 a 69.8 °C per questa classe Workstation.
(-) Il lato inferiore si riscalda fino ad un massimo di 56.8 °C / 134 F, rispetto alla media di 41.1 °C / 106 F
(+) In idle, la temperatura media del lato superiore è di 25.9 °C / 79 F, rispetto alla media deld ispositivo di 32 °C / 90 F.
(±) Riproducendo The Witcher 3, la temperatura media per il lato superiore e' di 37.1 °C / 99 F, rispetto alla media del dispositivo di 32 °C / 90 F.
(+) I poggiapolsi e il touchpad raggiungono la temperatura massima della pelle (35.4 °C / 95.7 F) e quindi non sono caldi.
(-) La temperatura media della zona del palmo della mano di dispositivi simili e'stata di 27.8 °C / 82 F (-7.6 °C / -13.7 F).
MSI WS63VR 7RL-023US analisi audio
(±) | potenza degli altiparlanti media ma buona (73.2 dB)
Bassi 100 - 315 Hz
(±) | bassi ridotti - in media 11.6% inferiori alla media
(+) | bassi in lineaa (6% delta rispetto alla precedente frequenza)
Medi 400 - 2000 Hz
(±) | medi elevati - circa 6.7% superiore alla media
(±) | linearità dei medi adeguata (14% delta rispetto alla precedente frequenza)
Alti 2 - 16 kHz
(+) | Alti bilanciati - appena 1.4% dalla media
(+) | alti lineari (5.5% delta rispetto alla precedente frequenza)
Nel complesso 100 - 16.000 Hz
(±) | la linearità complessiva del suono è media (26% di differenza rispetto alla media
Rispetto alla stessa classe
» 87% di tutti i dispositivi testati in questa classe è stato migliore, 6% simile, 6% peggiore
» Il migliore ha avuto un delta di 7%, medio di 17%, peggiore di 35%
Rispetto a tutti i dispositivi testati
» 80% di tutti i dispositivi testati in questa classe è stato migliore, 4% similare, 16% peggiore
» Il migliore ha avuto un delta di 4%, medio di 24%, peggiore di 134%
Lenovo ThinkPad P51 20HH0016GE analisi audio
(-) | altoparlanti non molto potenti (64.5 dB)
Bassi 100 - 315 Hz
(±) | bassi ridotti - in media 12.3% inferiori alla media
(±) | la linearità dei bassi è media (10.4% delta rispetto alla precedente frequenza)
Medi 400 - 2000 Hz
(+) | medi bilanciati - solo only 3.9% rispetto alla media
(+) | medi lineari (6.4% delta rispetto alla precedente frequenza)
Alti 2 - 16 kHz
(+) | Alti bilanciati - appena 2.7% dalla media
(±) | la linearità degli alti è media (13.3% delta rispetto alla precedente frequenza)
Nel complesso 100 - 16.000 Hz
(±) | la linearità complessiva del suono è media (24.7% di differenza rispetto alla media
Rispetto alla stessa classe
» 86% di tutti i dispositivi testati in questa classe è stato migliore, 2% simile, 12% peggiore
» Il migliore ha avuto un delta di 7%, medio di 17%, peggiore di 35%
Rispetto a tutti i dispositivi testati
» 75% di tutti i dispositivi testati in questa classe è stato migliore, 5% similare, 20% peggiore
» Il migliore ha avuto un delta di 4%, medio di 24%, peggiore di 134%
Dell Precision 5520 UHD analisi audio
(±) | potenza degli altiparlanti media ma buona (79.6 dB)
Bassi 100 - 315 Hz
(±) | bassi ridotti - in media 12.8% inferiori alla media
(±) | la linearità dei bassi è media (14.2% delta rispetto alla precedente frequenza)
Medi 400 - 2000 Hz
(+) | medi bilanciati - solo only 4% rispetto alla media
(±) | linearità dei medi adeguata (9.9% delta rispetto alla precedente frequenza)
Alti 2 - 16 kHz
(+) | Alti bilanciati - appena 3.3% dalla media
(±) | la linearità degli alti è media (12% delta rispetto alla precedente frequenza)
Nel complesso 100 - 16.000 Hz
(±) | la linearità complessiva del suono è media (16.7% di differenza rispetto alla media
Rispetto alla stessa classe
» 46% di tutti i dispositivi testati in questa classe è stato migliore, 9% simile, 45% peggiore
» Il migliore ha avuto un delta di 7%, medio di 17%, peggiore di 35%
Rispetto a tutti i dispositivi testati
» 29% di tutti i dispositivi testati in questa classe è stato migliore, 7% similare, 64% peggiore
» Il migliore ha avuto un delta di 4%, medio di 24%, peggiore di 134%
| Off / Standby | |
| Idle | |
| Sotto carico |
|
Leggenda:
min: | |
| MSI WS63VR 7RL-023US i7-7700HQ, Quadro P4000 Max-Q, Toshiba NVMe THNSN5512GPU7, IPS, 3840x2160, 15.6" | Fujitsu Celsius H970 E3-1535M v6, Quadro P4000, Samsung SM961 MZVKW512HMJP m.2 PCI-e, IPS LED, 1920x1080, 17.3" | MSI WS63 7RF-290US i7-7700HQ, Quadro P3000, Samsung SM961 MZVKW512HMJP m.2 PCI-e, IPS, 1920x1080, 15.6" | MSI GS63VR 7RF-228US i7-7700HQ, GeForce GTX 1060 Mobile, Samsung SM961 MZVKW512HMJP m.2 PCI-e, IPS, 3840x2160, 15.6" | MSI WT72-6QM E3-1505M v5, Quadro M5000M, Toshiba NVMe THNSN5256GPU7, IPS, 1920x1080, 17.3" | HP ZBook 15 G4-Y4E80AV E3-1535M v6, Quadro M2200, Samsung SSD SM961 1TB M.2 MZVKW1T0HMLH, IPS, 1920x1080, 15.6" | Lenovo ThinkPad P51 20HH0016GE E3-1505M v6, Quadro M2200, Samsung PM961 NVMe MZVLW512HMJP, IPS, 3840x2160, 15.6" | Lenovo ThinkPad P51s 20HB000SGE i7-7600U, Quadro M520, Samsung SSD PM961 1TB M.2 PCIe 3.0 x4 NVMe (MZVLW1T0), IPS, 3840x2160, 15.6" | Dell Precision 5520 UHD E3-1505M v6, Quadro M1200, Samsung SM961 MZVKW512HMJP m.2 PCI-e, IPS, 3840x2160, 15.6" | |
|---|---|---|---|---|---|---|---|---|---|
| Power Consumption | -0% | 5% | -9% | -64% | 16% | 1% | 36% | 8% | |
| Idle Minimum * (Watt) | 13.3 | 10.7 20% | 11 17% | 14.5 -9% | 24.8 -86% | 5.9 56% | 8.6 35% | 5.8 56% | 8.9 33% |
| Idle Average * (Watt) | 17.2 | 15.8 8% | 14.2 17% | 17.3 -1% | 29.7 -73% | 8.9 48% | 15.9 8% | 10.4 40% | 13.6 21% |
| Idle Maximum * (Watt) | 17.9 | 17.8 1% | 14.6 18% | 17.4 3% | 30.1 -68% | 12.7 29% | 22.1 -23% | 13.5 25% | 14.1 21% |
| Load Average * (Watt) | 83.7 | 92 -10% | 77.7 7% | 93 -11% | 105.2 -26% | 95.2 -14% | 84.4 -1% | 62.4 25% | 100.3 -20% |
| Witcher 3 ultra * (Watt) | 101.9 | 89.1 13% | 128.8 -26% | 87.7 14% | 100.2 2% | ||||
| Load Maximum * (Watt) | 114.3 | 137 -20% | 161.7 -41% | 192.2 -68% | 154 -35% | 130.6 -14% | 73.1 36% | 126.3 -10% |
* ... Meglio usare valori piccoli
| MSI WS63VR 7RL-023US i7-7700HQ, Quadro P4000 Max-Q, 48 Wh | MSI WS63 7RF-290US i7-7700HQ, Quadro P3000, 65 Wh | Lenovo ThinkPad P51 20HH0016GE E3-1505M v6, Quadro M2200, 90 Wh | Lenovo ThinkPad P51s 20HB000SGE i7-7600U, Quadro M520, 104 Wh | Dell Precision 5520 UHD E3-1505M v6, Quadro M1200, 97 Wh | MSI GS63VR 7RF-228US i7-7700HQ, GeForce GTX 1060 Mobile, 65 Wh | MSI WT72-6QM E3-1505M v5, Quadro M5000M, Wh | |
|---|---|---|---|---|---|---|---|
| Autonomia della batteria | 59% | 179% | 462% | 89% | 47% | 54% | |
| Reader / Idle (h) | 3.9 | 7.1 82% | 16.4 321% | 26.4 577% | 12.1 210% | 6.4 64% | 6.9 77% |
| WiFi v1.3 (h) | 2.9 | 4.7 62% | 6.9 138% | 11.9 310% | 4.2 45% | 3.9 34% | 4.1 41% |
| Load (h) | 0.9 | 1.2 33% | 1.6 78% | 5.4 500% | 1 11% | 1.3 44% | 1.3 44% |
Pro
Contro
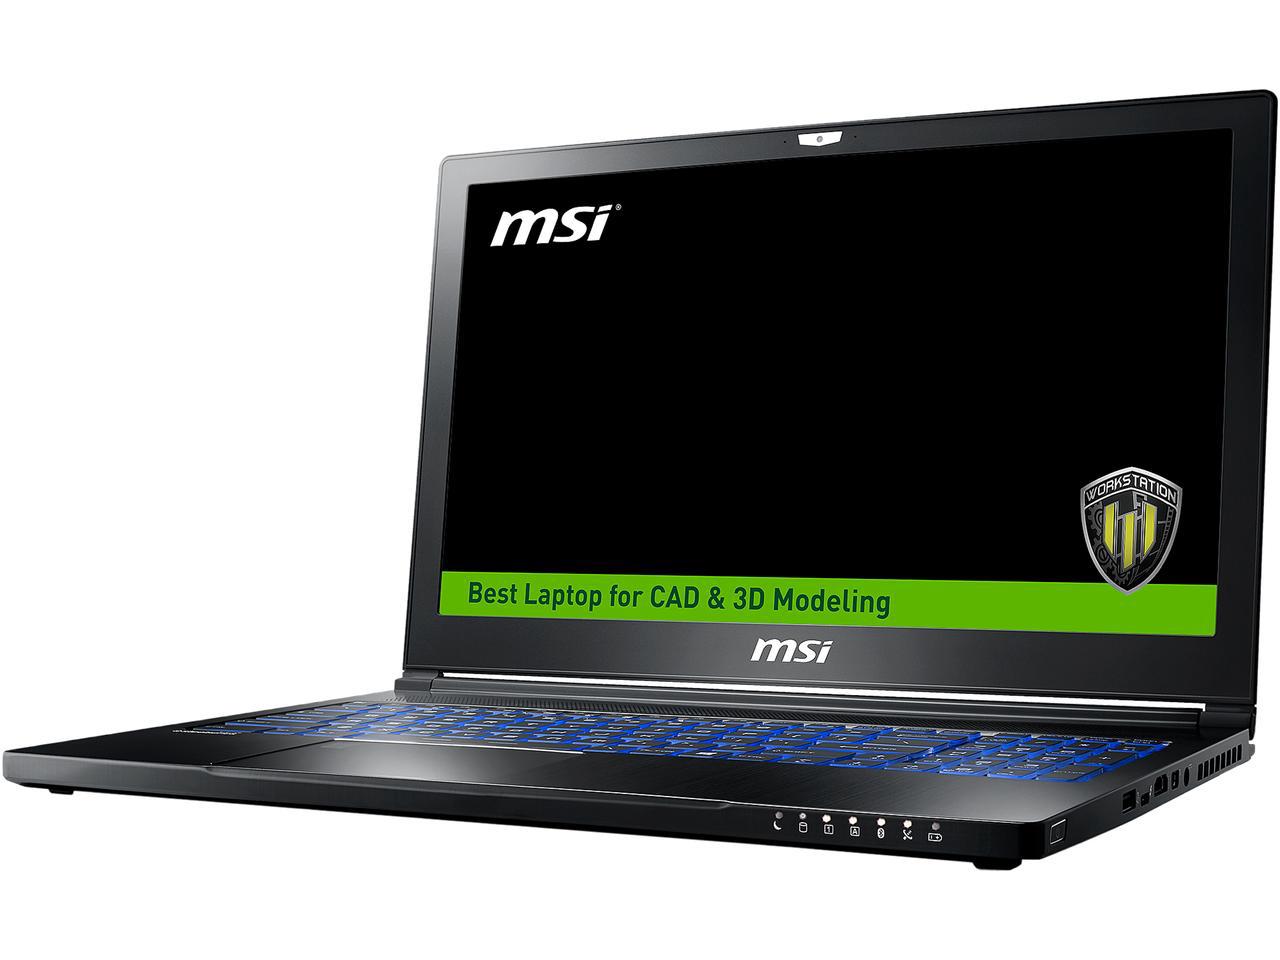
L'MSI WS63VR è un eccellente esempio di quello che offre la Max-Q nel segmento professionale. La Nvidia Quadro P4000 Max-Q offre incredibili prestazioni considerando il poco calore generato e il TDP da 80 Watt; le performance sono alla pari con la standard P4000 e molto avanti alla Quadro M5000M dell'anno scorso. Anche il calore è gestito bene, cosa non semplice in uno chassis sottile e leggero. Unite questo alle prestazioni di una eccellente tastiera, numerose connessioni, e design carino, e l'MSI risulta essere vincente.
Le principali pecche sono quelle delle macchine MSI: trackpad, schermo scuro e poca gamma di colore, autonomia breve. I fotografi professionisti che puntano su colori precisi ad ampia autonomia devono guardare al passato, in particolare al Lenovo ThinkPad P51. La perdita di prestazione viene bilanciata dall'autonomia e dalla precisione del colore del display.
Tuttavia, gli impiegati possono dare ad MSI una seconda chance. A questo prezzo (~USD $3400), scegliere una workstation mobile richiede un investimento notevole. MSI ha sviluppato un buon concorrente per Lenovo, Dell, e HP. I potenziali clienti possono pensare di risparmiare e scegliere un display Full HD; una risoluzione inferiore migliora l'autonomia e non porta al limite la GPU. Anche i giocatori possono mettere gli occhi sull'MSI GS63VR, che forse sarà aggiornato con GPUs Max-Q in futuro. L'Asus Zephyrus GX501 è un altro tentativo di mettere in luce la GPU Max-Q.
L'MSI WS63VR beneficia del design Nvidia Max-Q.Se potete accettare schermo scuro, trackpad impreciso, e poca autonomia, il WS63VR è una workstation da considerare.
Nota: si tratta di una recensione breve, con alcune sezioni non tradotte, per la versione integrale in inglese guardate qui.
MSI WS63VR 7RL-023US
- 09/18/2017 v6 (old)
Sam Medley
Price comparison
