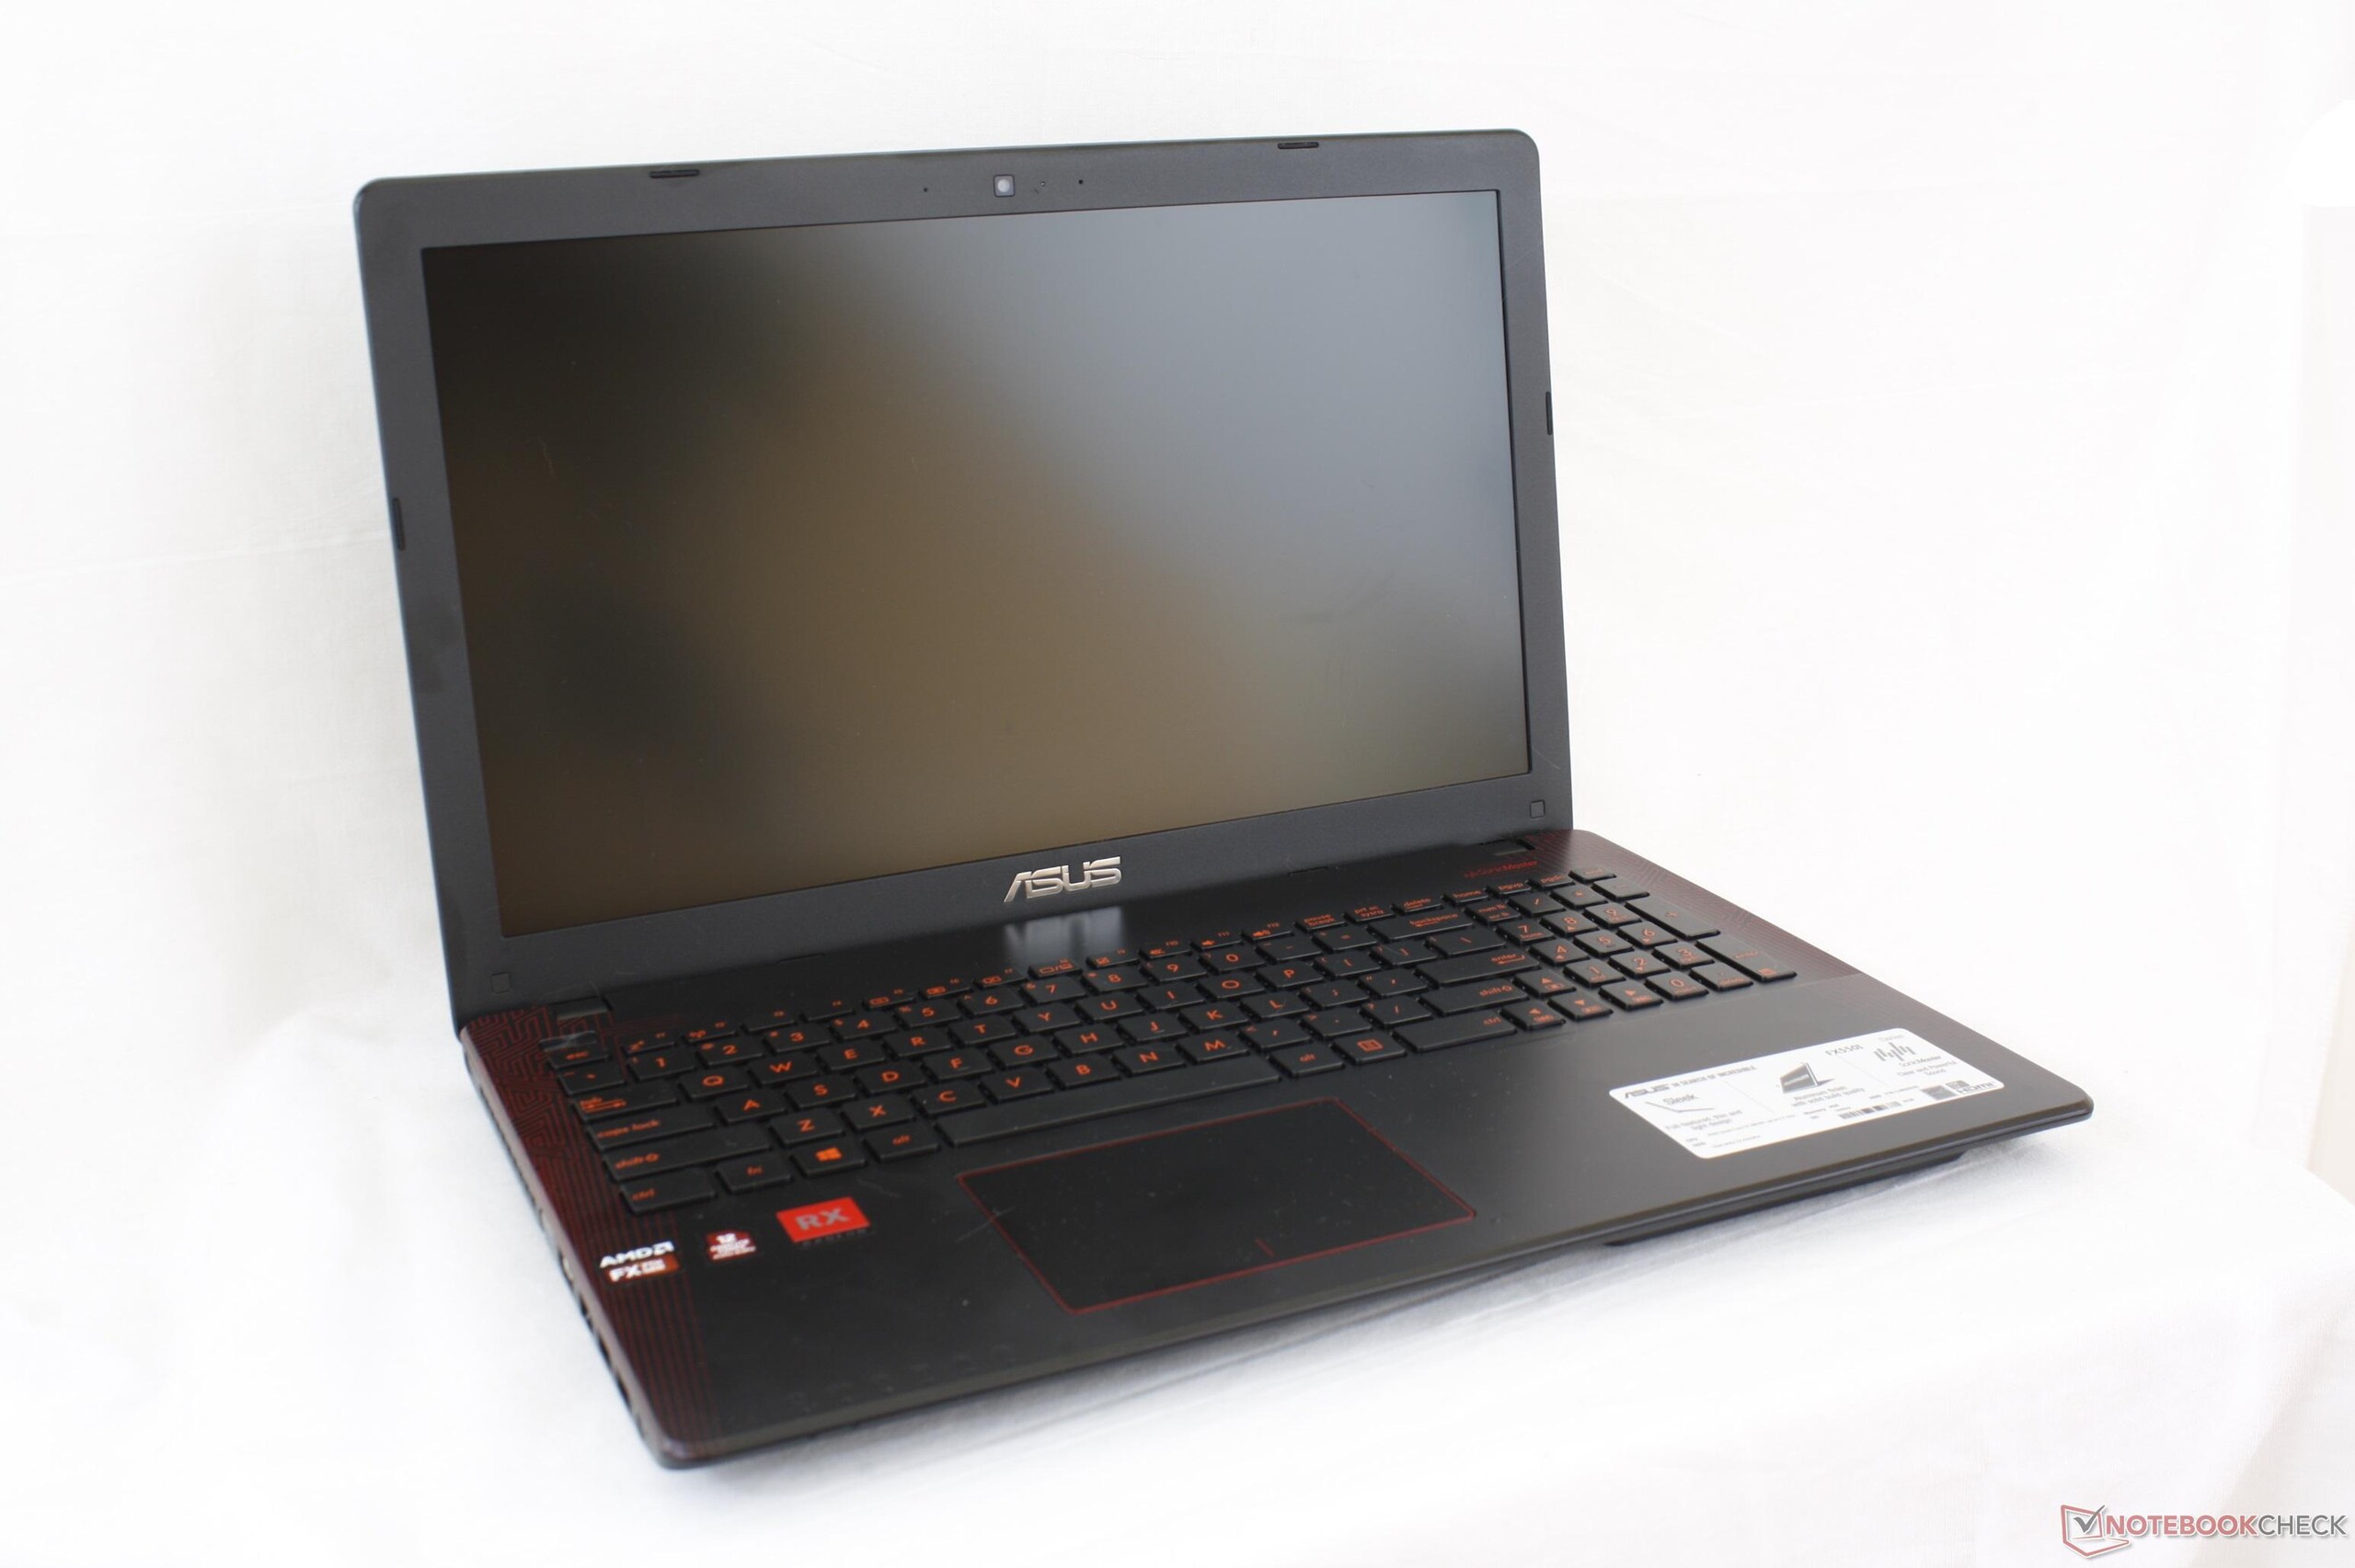
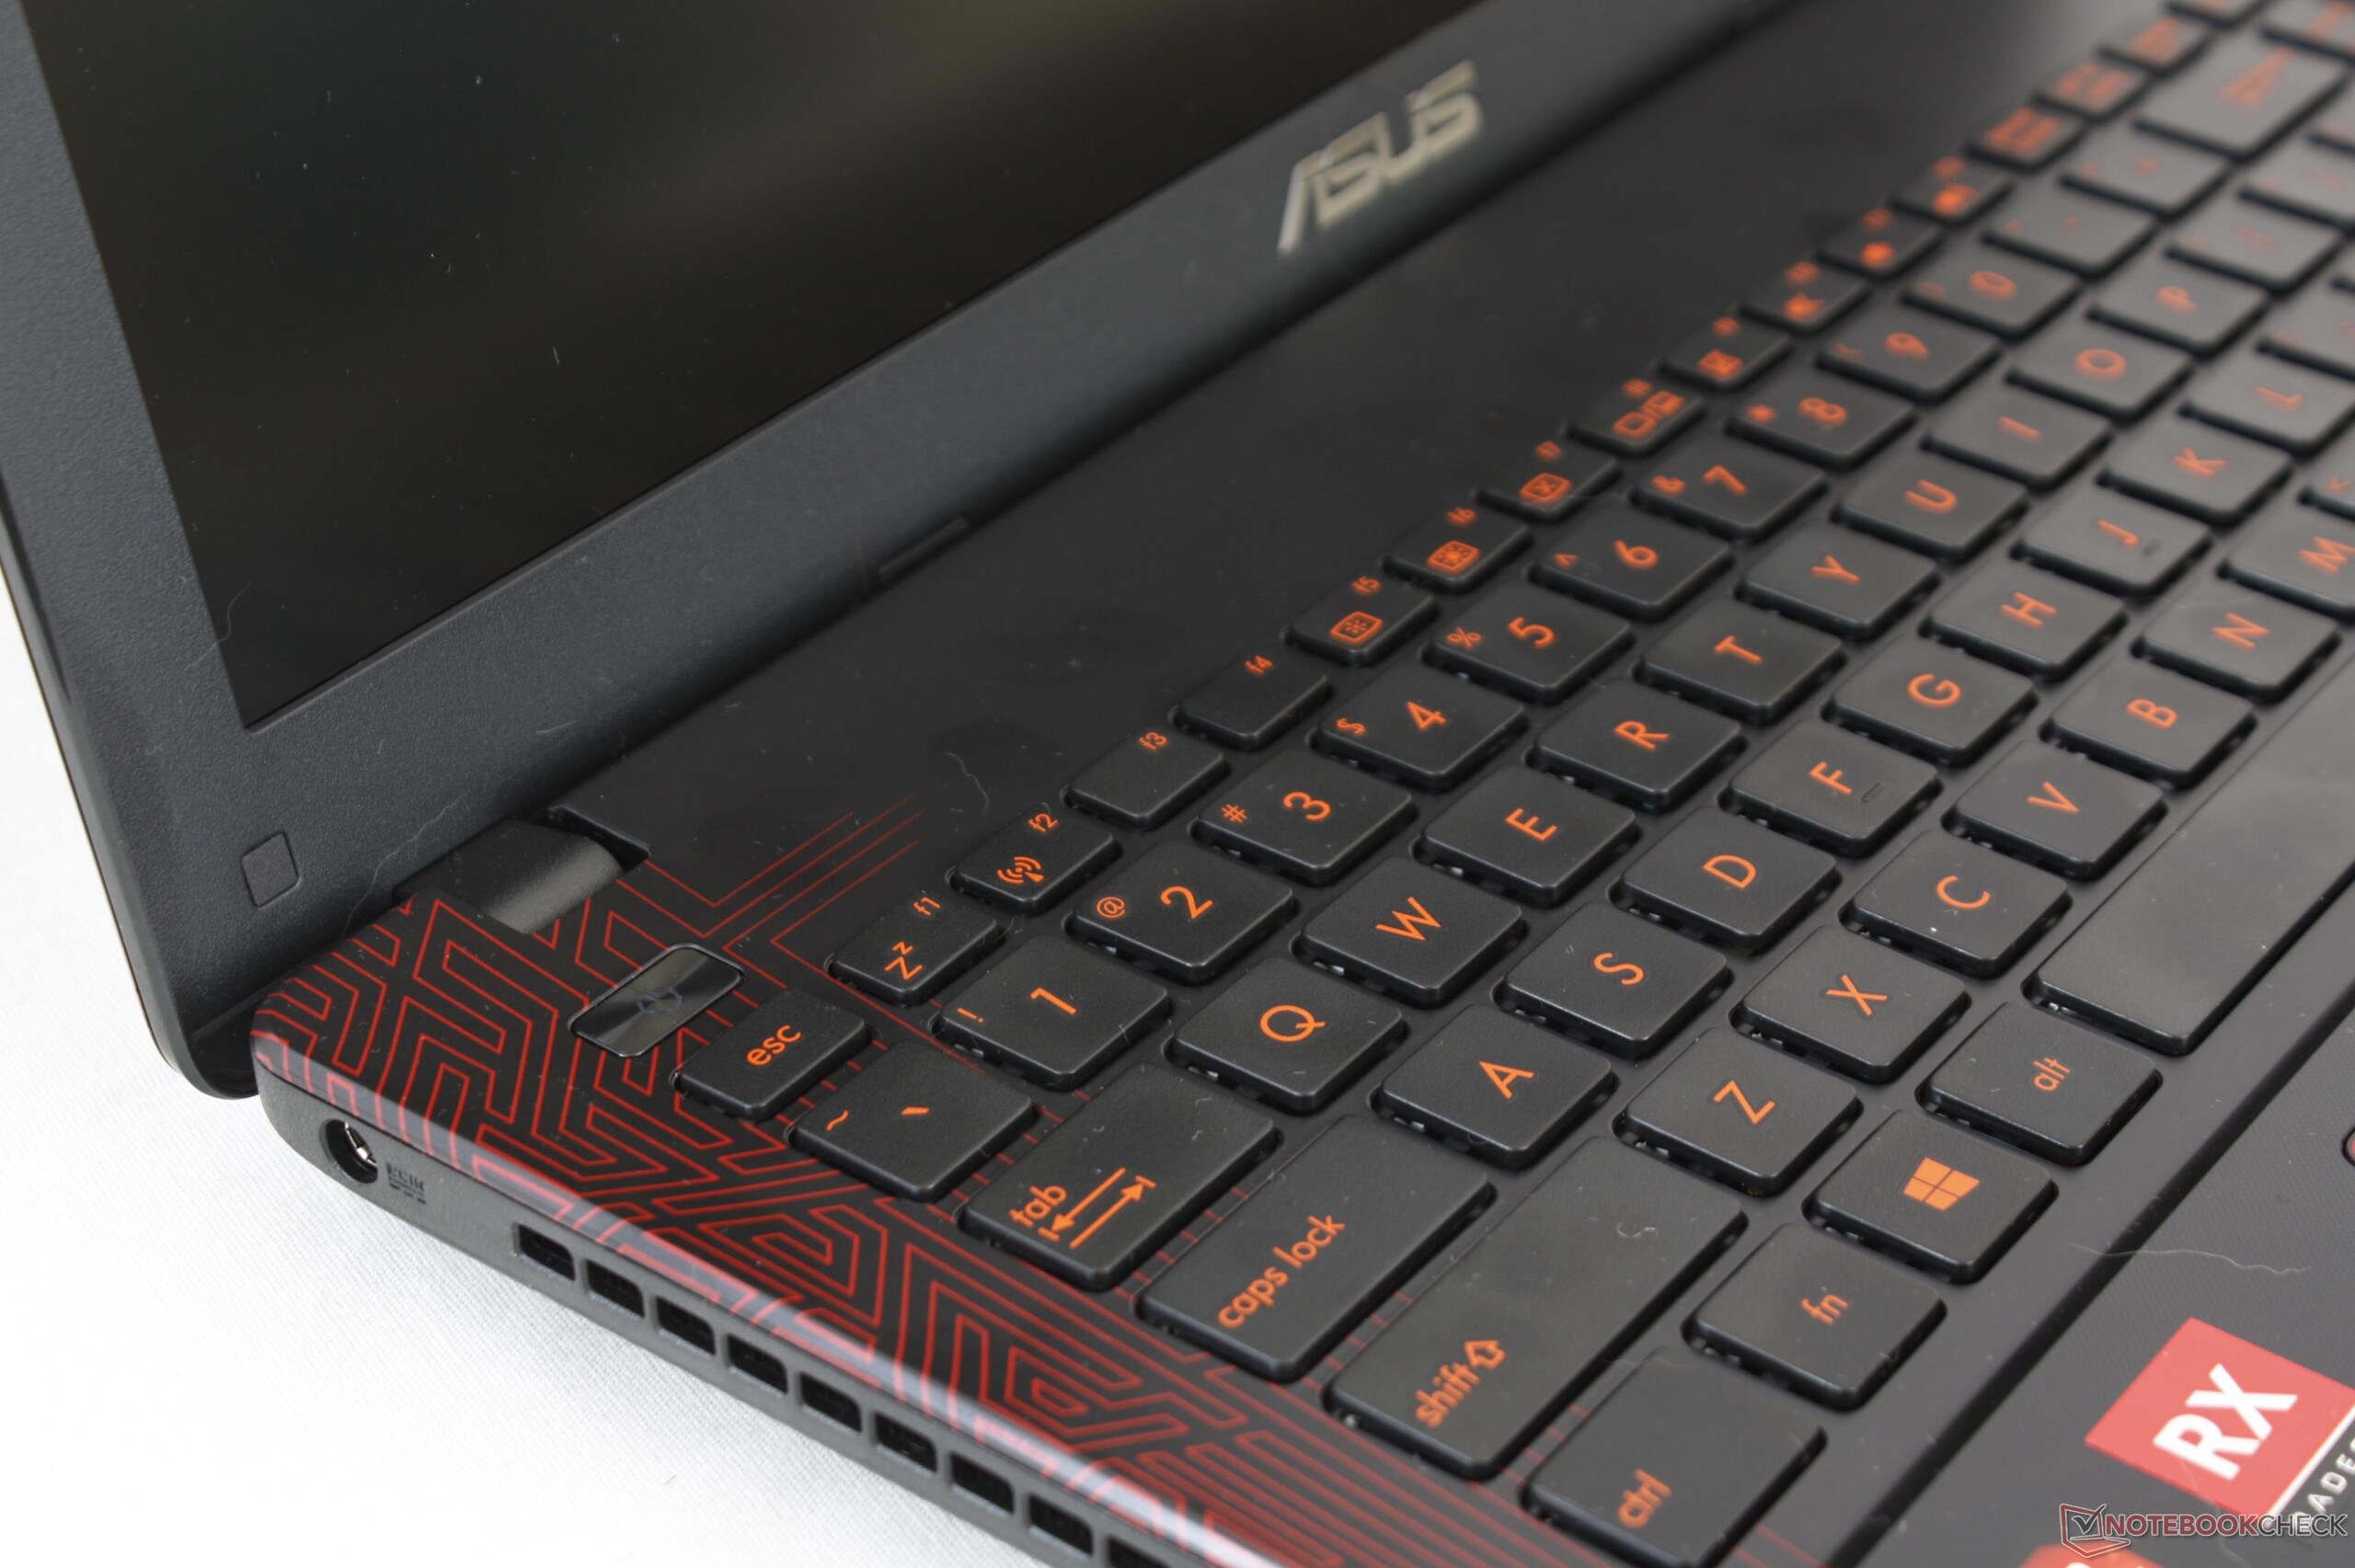
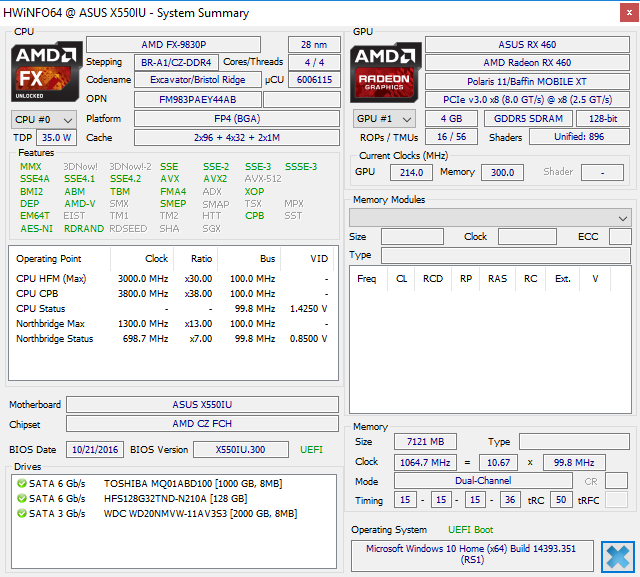
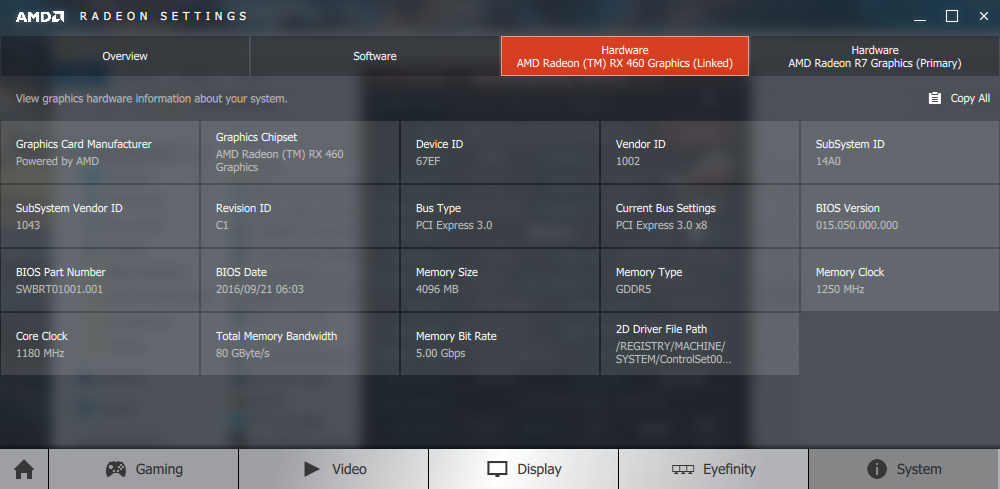
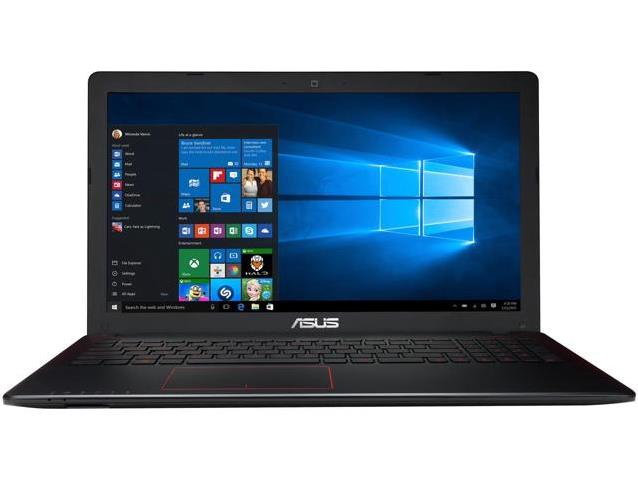
Recensione breve del portatile Asus FX550IU (FX-9830P, Radeon RX 460)

| SD Card Reader | |
| average JPG Copy Test (av. of 3 runs) | |
| Asus G701VIK-BA049T | |
| Asus FX550IU-WSFX | |
| Dell Inspiron 15 7000 7567 | |
| maximum AS SSD Seq Read Test (1GB) | |
| Asus G701VIK-BA049T | |
| Asus FX550IU-WSFX | |
| Dell Inspiron 15 7000 7567 | |
| Networking | |
| iperf3 transmit AX12 | |
| Dell XPS 15 9560 (i7-7700HQ, UHD) | |
| Gigabyte Sabre 15G | |
| Asus FX550IU-WSFX | |
| iperf3 receive AX12 | |
| Dell XPS 15 9560 (i7-7700HQ, UHD) | |
| Asus FX550IU-WSFX | |
| Gigabyte Sabre 15G | |
| |||||||||||||||||||||||||
Distribuzione della luminosità: 88 %
Al centro con la batteria: 231.9 cd/m²
Contrasto: 515:1 (Nero: 0.45 cd/m²)
ΔE ColorChecker Calman: 12 | ∀{0.5-29.43 Ø4.73}
ΔE Greyscale Calman: 14 | ∀{0.09-98 Ø4.97}
54.8% sRGB (Argyll 1.6.3 3D)
34.8% AdobeRGB 1998 (Argyll 1.6.3 3D)
37.46% AdobeRGB 1998 (Argyll 3D)
54.6% sRGB (Argyll 3D)
36.26% Display P3 (Argyll 3D)
Gamma: 2.09
CCT: 16348 K
| Asus FX550IU-WSFX ID: AUO38ED, Name: AU Optronics B156HTN03.8, TN LED, 15.6", 1920x1080 | Asus ZenBook Pro UX550VD CMN15E8 (N156HCE-EN1), IPS, 15.6", 1920x1080 | Dell Inspiron 15 7000 7567 AU Optronics AUO38ED B156HTN 28H80, TN, 15.6", 1920x1080 | Gigabyte Sabre 15G ID: LGD0533, Name: LG Display LP156WF6-SPK3, IPS, 15.6", 1920x1080 | HP Omen 15-ce002ng AUO42ED, IPS, 15.6", 1920x1080 | |
|---|---|---|---|---|---|
| Display | 74% | 0% | 7% | 75% | |
| Display P3 Coverage (%) | 36.26 | 65.7 81% | 36.42 0% | 38.97 7% | 65.8 81% |
| sRGB Coverage (%) | 54.6 | 90.3 65% | 54.9 1% | 58.2 7% | 90.9 66% |
| AdobeRGB 1998 Coverage (%) | 37.46 | 65.9 76% | 37.62 0% | 40.3 8% | 66.5 78% |
| Response Times | 1% | -12% | 12% | -13% | |
| Response Time Grey 50% / Grey 80% * (ms) | 39.2 ? | 38.8 ? 1% | 36 ? 8% | 32 ? 18% | 43.2 ? -10% |
| Response Time Black / White * (ms) | 27.2 ? | 27.2 ? -0% | 36 ? -32% | 25.6 ? 6% | 31.2 ? -15% |
| PWM Frequency (Hz) | 25910 ? | 20000 ? | |||
| Screen | 58% | -3% | 19% | 58% | |
| Brightness middle (cd/m²) | 231.9 | 335 44% | 246 6% | 248.4 7% | 304 31% |
| Brightness (cd/m²) | 221 | 313 42% | 235 6% | 241 9% | 289 31% |
| Brightness Distribution (%) | 88 | 83 -6% | 75 -15% | 84 -5% | 86 -2% |
| Black Level * (cd/m²) | 0.45 | 0.27 40% | 0.55 -22% | 0.3 33% | 0.26 42% |
| Contrast (:1) | 515 | 1241 141% | 447 -13% | 828 61% | 1169 127% |
| Colorchecker dE 2000 * | 12 | 4.7 61% | 10.97 9% | 7.5 37% | 3.46 71% |
| Colorchecker dE 2000 max. * | 21.6 | 8.1 63% | 25.2 -17% | 7.72 64% | |
| Greyscale dE 2000 * | 14 | 5.8 59% | 14.25 -2% | 6.5 54% | 2.46 82% |
| Gamma | 2.09 105% | 2.06 107% | 1.83 120% | 2.19 100% | 2.38 92% |
| CCT | 16348 40% | 6518 100% | 11200 58% | 7852 83% | 6915 94% |
| Color Space (Percent of AdobeRGB 1998) (%) | 34.8 | 58.7 69% | 35 1% | 37 6% | 59 70% |
| Color Space (Percent of sRGB) (%) | 54.8 | 90.1 64% | 55 0% | 57.9 6% | 91 66% |
| Media totale (Programma / Settaggio) | 44% /
53% | -5% /
-4% | 13% /
16% | 40% /
52% |
* ... Meglio usare valori piccoli
Tempi di risposta del Display
| ↔ Tempi di risposta dal Nero al Bianco | ||
|---|---|---|
| 27.2 ms ... aumenta ↗ e diminuisce ↘ combinato | ↗ 22.8 ms Incremento | 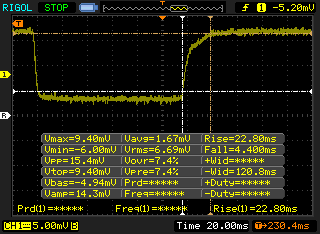 |
| ↘ 4.4 ms Calo | ||
| Lo schermo mostra tempi di risposta relativamente lenti nei nostri tests e potrebbe essere troppo lento per i gamers. In confronto, tutti i dispositivi di test variano da 0.1 (minimo) a 240 (massimo) ms. » 69 % di tutti i dispositivi è migliore. Questo significa che i tempi di risposta rilevati sono peggiori rispetto alla media di tutti i dispositivi testati (19.9 ms). | ||
| ↔ Tempo di risposta dal 50% Grigio all'80% Grigio | ||
| 39.2 ms ... aumenta ↗ e diminuisce ↘ combinato | ↗ 21.2 ms Incremento | 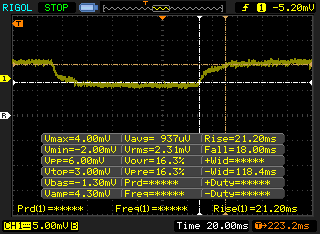 |
| ↘ 18 ms Calo | ||
| Lo schermo mostra tempi di risposta lenti nei nostri tests e sarà insoddisfacente per i gamers. In confronto, tutti i dispositivi di test variano da 0.165 (minimo) a 636 (massimo) ms. » 60 % di tutti i dispositivi è migliore. Questo significa che i tempi di risposta rilevati sono peggiori rispetto alla media di tutti i dispositivi testati (31.1 ms). | ||
Sfarfallio dello schermo / PWM (Pulse-Width Modulation)
| flickering dello schermo / PWM non rilevato | 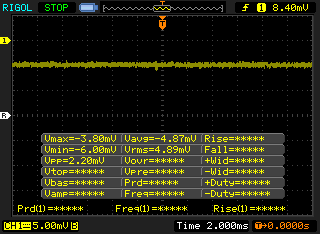 | ||
In confronto: 52 % di tutti i dispositivi testati non utilizza PWM per ridurre la luminosita' del display. Se è rilevato PWM, una media di 7794 (minimo: 5 - massimo: 343500) Hz è stata rilevata. | |||
| wPrime 2.10 - 1024m | |
| Medion Akoya E6422 | |
| Lenovo Thinkpad 13-20J1001BUS | |
| Samsung Notebook 9 NP900X3N-K01US | |
| HP Pavilion 15z-bw000 | |
| HP Pavilion 17z 1EX13AV | |
| Asus FX550IU-WSFX | |
| Acer Spin 5 SP513-52N-566U | |
| Eurocom Q5 | |
* ... Meglio usare valori piccoli
| PCMark 8 | |
| Home Score Accelerated v2 | |
| HP Omen 15-ce002ng | |
| Dell Inspiron 15 7000 7567 | |
| Asus FX553VD-DM249T | |
| Gigabyte Sabre 15G | |
| Asus FX550IU-WSFX | |
| Work Score Accelerated v2 | |
| HP Omen 15-ce002ng | |
| Dell Inspiron 15 7000 7567 | |
| Gigabyte Sabre 15G | |
| Asus FX553VD-DM249T | |
| Asus FX550IU-WSFX | |
| PCMark 10 | |
| Essentials | |
| HP Omen 15-ce002ng | |
| Gigabyte Sabre 15G | |
| Asus FX550IU-WSFX | |
| Score | |
| HP Omen 15-ce002ng | |
| Gigabyte Sabre 15G | |
| Asus FX550IU-WSFX | |
| PCMark 8 Home Score Accelerated v2 | 3384 punti | |
| PCMark 8 Creative Score Accelerated v2 | 4640 punti | |
| PCMark 8 Work Score Accelerated v2 | 4260 punti | |
| PCMark 10 Score | 2603 punti | |
Aiuto | ||
| Asus FX550IU-WSFX SK Hynix HFS128G32TND | Dell Inspiron 15 7000 7567 Intel SSDSCKKF256H6 | Gigabyte Sabre 15G Liteonit CV3-8D128 | Asus FX553VD-DM249T Hynix HFS128G39TND | MSI GP62 7REX-1045US Toshiba NVMe THNSN5128GP | |
|---|---|---|---|---|---|
| AS SSD | 76% | 79% | 19% | 246% | |
| Copy Game MB/s (MB/s) | 110.6 | 286.2 159% | 323.5 192% | 442.8 300% | |
| Copy Program MB/s (MB/s) | 70.8 | 224 216% | 195.3 176% | 326.3 361% | |
| Copy ISO MB/s (MB/s) | 150.8 | 425.4 182% | 446.8 196% | 1128 648% | |
| Score Total (Points) | 587 | 734 25% | 752 28% | 798 36% | 1829 212% |
| Score Write (Points) | 177 | 227 28% | 234 32% | 175 -1% | 600 239% |
| Score Read (Points) | 278 | 332 19% | 337 21% | 419 51% | 849 205% |
| Access Time Write * (ms) | 0.27 | 0.057 79% | 0.073 73% | 0.273 -1% | 0.034 87% |
| Access Time Read * (ms) | 0.145 | 0.094 35% | 0.141 3% | 0.119 18% | 0.079 46% |
| 4K-64 Write (MB/s) | 114.5 | 118.3 3% | 132.2 15% | 97 -15% | 428.2 274% |
| 4K-64 Read (MB/s) | 208.7 | 258.6 24% | 257 23% | 342.1 64% | 628 201% |
| 4K Write (MB/s) | 50.6 | 66.6 32% | 53.8 6% | 65.5 29% | 112 121% |
| 4K Read (MB/s) | 22.09 | 25.16 14% | 28.3 28% | 26.34 19% | 35.84 62% |
| Seq Write (MB/s) | 120.1 | 416.1 246% | 479.8 300% | 129.1 7% | 601 400% |
| Seq Read (MB/s) | 468.5 | 481.6 3% | 516 10% | 503 7% | 1848 294% |
* ... Meglio usare valori piccoli

| 3DMark | |
| 1280x720 Cloud Gate Standard Graphics | |
| AMD Radeon RX 480 8 GB Reference | |
| Gigabyte Sabre 15G | |
| XFX RX-460P4DFG5 Double Dissipation 4 GB | |
| HP Omen 17-w010ng | |
| Asus FX550IU-WSFX | |
| Asus Zenbook UX510UW-CN044T | |
| Acer Aspire E5-575G-549D | |
| Acer Aspire 5 A515-51G-51RL | |
| Samsung Notebook 9 NP900X5N-X01US | |
| 1920x1080 Fire Strike Graphics | |
| AMD Radeon RX 480 8 GB Reference | |
| Gigabyte Sabre 15G | |
| HP Omen 17-w010ng | |
| XFX RX-460P4DFG5 Double Dissipation 4 GB | |
| Asus FX550IU-WSFX | |
| Asus Zenbook UX510UW-CN044T | |
| Acer Aspire 5 A515-51G-51RL | |
| Acer Aspire E5-575G-549D | |
| Samsung Notebook 9 NP900X5N-X01US | |
| 3DMark 11 | |
| 1280x720 Performance GPU | |
| AMD Radeon RX 480 8 GB Reference | |
| XFX RX-460P4DFG5 Double Dissipation 4 GB | |
| HP Omen 17-w010ng | |
| Asus FX550IU-WSFX | |
| Gigabyte Sabre 15G | |
| Asus Zenbook UX510UW-CN044T | |
| Acer Aspire 5 A515-51G-51RL | |
| Acer Aspire E5-575G-549D | |
| Samsung Notebook 9 NP900X5N-X01US | |
| 1280x720 Performance Combined | |
| AMD Radeon RX 480 8 GB Reference | |
| XFX RX-460P4DFG5 Double Dissipation 4 GB | |
| HP Omen 17-w010ng | |
| Gigabyte Sabre 15G | |
| Asus Zenbook UX510UW-CN044T | |
| Acer Aspire 5 A515-51G-51RL | |
| Acer Aspire E5-575G-549D | |
| Asus FX550IU-WSFX | |
| Samsung Notebook 9 NP900X5N-X01US | |
| 3DMark 11 Performance | 5537 punti | |
| 3DMark Ice Storm Standard Score | 60282 punti | |
| 3DMark Cloud Gate Standard Score | 9968 punti | |
| 3DMark Fire Strike Score | 3962 punti | |
| 3DMark Fire Strike Extreme Score | 2148 punti | |
Aiuto | ||
| BioShock Infinite - 1920x1080 Ultra Preset, DX11 (DDOF) | |
| Gigabyte Sabre 15G | |
| XFX RX-460P4DFG5 Double Dissipation 4 GB | |
| Gigabyte P55K v5 | |
| MSI GL72 6QF | |
| Asus FX550IU-WSFX | |
| Acer Aspire E5-575G-549D | |
| Acer Aspire 5 A515-51G-51RL | |
| Samsung Notebook 9 NP900X5N-X01US | |
| Apple MacBook Pro 13 2017 | |
| Rise of the Tomb Raider - 1920x1080 Very High Preset AA:FX AF:16x | |
| Gigabyte Sabre 15G | |
| Gigabyte P55K v5 | |
| XFX RX-460P4DFG5 Double Dissipation 4 GB | |
| MSI GL72 6QF | |
| Asus FX550IU-WSFX | |
| Acer Aspire 5 A515-51G-51RL | |
| Acer Aspire E5-575G-549D | |
| basso | medio | alto | ultra | |
|---|---|---|---|---|
| StarCraft II: Heart of the Swarm (2013) | 175.3 | 48.7 | ||
| BioShock Infinite (2013) | 96 | 41.4 | ||
| Metro: Last Light (2013) | 42.6 | 29.5 | ||
| Thief (2014) | 24.7 | |||
| The Witcher 3 (2015) | 71.7 | 29.6 | 17.2 | |
| Batman: Arkham Knight (2015) | 43 | 35 | ||
| Fallout 4 (2015) | 55.4 | 32.3 | 27.7 | |
| Rise of the Tomb Raider (2016) | 61.5 | 28.4 | 19.7 | |
| Ashes of the Singularity (2016) | 24.2 | 21 | ||
| Overwatch (2016) | 100 | 79.7 | 43 | |
| Prey (2017) | 57.5 | 49.2 | 36.4 | 30.3 |
| Dirt 4 (2017) | 95.4 | 60.7 | 39.6 | 22.4 |
| F1 2017 (2017) | 37 | 27 | 24 | 20 |
Rumorosità
| Idle |
| 30.2 / 30.3 / 30.3 dB(A) |
| Sotto carico |
| 41.6 / 45.3 dB(A) |
 | ||
30 dB silenzioso 40 dB(A) udibile 50 dB(A) rumoroso |
||
min: | ||
| Asus FX550IU-WSFX Radeon RX 460 (Laptop), FX-9830P, SK Hynix HFS128G32TND | Dell Inspiron 15 7000 7567 GeForce GTX 1050 Ti Mobile, i7-7700HQ, Intel SSDSCKKF256H6 | Gigabyte Sabre 15G GeForce GTX 1050 Mobile, i7-7700HQ, Liteonit CV3-8D128 | HP Omen 15-ce002ng GeForce GTX 1060 Max-Q, i7-7700HQ, Samsung PM961 MZVLW256HEHP | Asus FX553VD-DM249T GeForce GTX 1050 Mobile, i7-7700HQ, Hynix HFS128G39TND | |
|---|---|---|---|---|---|
| Noise | -5% | -10% | -6% | -8% | |
| off /ambiente * (dB) | 28.2 | 30.3 -7% | 28.2 -0% | 30 -6% | 30.8 -9% |
| Idle Minimum * (dB) | 30.2 | 30.9 -2% | 33 -9% | 30 1% | 32.9 -9% |
| Idle Average * (dB) | 30.3 | 30.9 -2% | 33.3 -10% | 33 -9% | 32.9 -9% |
| Idle Maximum * (dB) | 30.3 | 31 -2% | 34.7 -15% | 37 -22% | 33.5 -11% |
| Load Average * (dB) | 41.6 | 46.5 -12% | 44.5 -7% | 41 1% | 43.7 -5% |
| Witcher 3 ultra * (dB) | 43.7 | 49.2 -13% | 42 4% | 46.2 -6% | |
| Load Maximum * (dB) | 45.3 | 46.8 -3% | 52.8 -17% | 50 -10% | 47 -4% |
* ... Meglio usare valori piccoli
(-) La temperatura massima sul lato superiore è di 46.2 °C / 115 F, rispetto alla media di 40.4 °C / 105 F, che varia da 21.2 a 68.8 °C per questa classe Gaming.
(-) Il lato inferiore si riscalda fino ad un massimo di 51.2 °C / 124 F, rispetto alla media di 43.2 °C / 110 F
(+) In idle, la temperatura media del lato superiore è di 26.6 °C / 80 F, rispetto alla media deld ispositivo di 33.9 °C / 93 F.
(±) Riproducendo The Witcher 3, la temperatura media per il lato superiore e' di 35.7 °C / 96 F, rispetto alla media del dispositivo di 33.9 °C / 93 F.
(±) I poggiapolsi e il touchpad possono diventare molto caldi al tatto con un massimo di 36.2 °C / 97.2 F.
(-) La temperatura media della zona del palmo della mano di dispositivi simili e'stata di 28.8 °C / 83.8 F (-7.4 °C / -13.4 F).
Asus FX550IU-WSFX analisi audio
(-) | altoparlanti non molto potenti (66.3 dB)
Bassi 100 - 315 Hz
(-) | quasi nessun basso - in media 18.5% inferiori alla media
(±) | la linearità dei bassi è media (9.4% delta rispetto alla precedente frequenza)
Medi 400 - 2000 Hz
(+) | medi bilanciati - solo only 2.3% rispetto alla media
(±) | linearità dei medi adeguata (9.4% delta rispetto alla precedente frequenza)
Alti 2 - 16 kHz
(±) | alti elevati - circa 6.6% superiori alla media
(±) | la linearità degli alti è media (7.9% delta rispetto alla precedente frequenza)
Nel complesso 100 - 16.000 Hz
(±) | la linearità complessiva del suono è media (29.9% di differenza rispetto alla media
Rispetto alla stessa classe
» 95% di tutti i dispositivi testati in questa classe è stato migliore, 2% simile, 3% peggiore
» Il migliore ha avuto un delta di 6%, medio di 18%, peggiore di 132%
Rispetto a tutti i dispositivi testati
» 88% di tutti i dispositivi testati in questa classe è stato migliore, 3% similare, 9% peggiore
» Il migliore ha avuto un delta di 4%, medio di 24%, peggiore di 134%
Apple MacBook 12 (Early 2016) 1.1 GHz analisi audio
(+) | gli altoparlanti sono relativamente potenti (83.6 dB)
Bassi 100 - 315 Hz
(±) | bassi ridotti - in media 11.3% inferiori alla media
(±) | la linearità dei bassi è media (14.2% delta rispetto alla precedente frequenza)
Medi 400 - 2000 Hz
(+) | medi bilanciati - solo only 2.4% rispetto alla media
(+) | medi lineari (5.5% delta rispetto alla precedente frequenza)
Alti 2 - 16 kHz
(+) | Alti bilanciati - appena 2% dalla media
(+) | alti lineari (4.5% delta rispetto alla precedente frequenza)
Nel complesso 100 - 16.000 Hz
(+) | suono nel complesso lineare (10.2% differenza dalla media)
Rispetto alla stessa classe
» 7% di tutti i dispositivi testati in questa classe è stato migliore, 2% simile, 91% peggiore
» Il migliore ha avuto un delta di 5%, medio di 18%, peggiore di 53%
Rispetto a tutti i dispositivi testati
» 5% di tutti i dispositivi testati in questa classe è stato migliore, 1% similare, 94% peggiore
» Il migliore ha avuto un delta di 4%, medio di 24%, peggiore di 134%
| Off / Standby | |
| Idle | |
| Sotto carico |
|
Leggenda:
min: | |
| Asus FX550IU-WSFX FX-9830P, Radeon RX 460 (Laptop), SK Hynix HFS128G32TND, TN LED, 1920x1080, 15.6" | Dell Inspiron 15 7000 7567 Gaming (Core i5-7300HQ, GTX 1050) i5-7300HQ, GeForce GTX 1050 Mobile, Toshiba MQ02ABD100H, TN, 1920x1080, 15.6" | MSI GP62 7REX-1045US i7-7700HQ, GeForce GTX 1050 Ti Mobile, Toshiba NVMe THNSN5128GP, TN LED, 1920x1080, 15.6" | HP Omen 15-ce002ng i7-7700HQ, GeForce GTX 1060 Max-Q, Samsung PM961 MZVLW256HEHP, IPS, 1920x1080, 15.6" | Asus FX553VD-DM249T i7-7700HQ, GeForce GTX 1050 Mobile, Hynix HFS128G39TND, TN, 1920x1080, 15.6" | Asus Zenbook UX510UW-CN044T 6500U, GeForce GTX 960M, SanDisk SD8SNAT256G1002, IPS, 1920x1080, 15.6" | |
|---|---|---|---|---|---|---|
| Power Consumption | -13% | -56% | -101% | 14% | 9% | |
| Idle Minimum * (Watt) | 5.9 | 9.1 -54% | 14.6 -147% | 18 -205% | 4 32% | 5 15% |
| Idle Average * (Watt) | 8.8 | 10.3 -17% | 17.2 -95% | 23 -161% | 6.7 24% | 8.9 -1% |
| Idle Maximum * (Watt) | 9.7 | 13 -34% | 17.3 -78% | 30 -209% | 9.6 1% | 11.8 -22% |
| Load Average * (Watt) | 78.1 | 75.6 3% | 82.7 -6% | 85 -9% | 81 -4% | 55 30% |
| Witcher 3 ultra * (Watt) | 112.4 | 83.8 25% | 107 5% | 96 15% | 90 20% | |
| Load Maximum * (Watt) | 117 | 115.2 2% | 136.7 -17% | 158 -35% | 107 9% | 93 21% |
* ... Meglio usare valori piccoli
| Asus FX550IU-WSFX FX-9830P, Radeon RX 460 (Laptop), 44 Wh | Asus ZenBook Pro UX550VD i7-7700HQ, GeForce GTX 1050 Mobile, 73 Wh | Dell Inspiron 15 7000 7567 i7-7700HQ, GeForce GTX 1050 Ti Mobile, 74 Wh | Gigabyte Sabre 15G i7-7700HQ, GeForce GTX 1050 Mobile, 47 Wh | HP Omen 15-ce002ng i7-7700HQ, GeForce GTX 1060 Max-Q, 70 Wh | Asus FX553VD-DM249T i7-7700HQ, GeForce GTX 1050 Mobile, 48 Wh | |
|---|---|---|---|---|---|---|
| Autonomia della batteria | 82% | 108% | 14% | -10% | 18% | |
| Reader / Idle (h) | 9.1 | 17.7 95% | 19.6 115% | 8.2 -10% | 4.3 -53% | 9.8 8% |
| WiFi v1.3 (h) | 4.1 | 8.9 117% | 10.4 154% | 4.4 7% | 3.3 -20% | 6 46% |
| Load (h) | 0.9 | 1.2 33% | 1.4 56% | 1.3 44% | 1.3 44% | 0.9 0% |
| Witcher 3 ultra (h) | 1.1 |
Pro
Contro
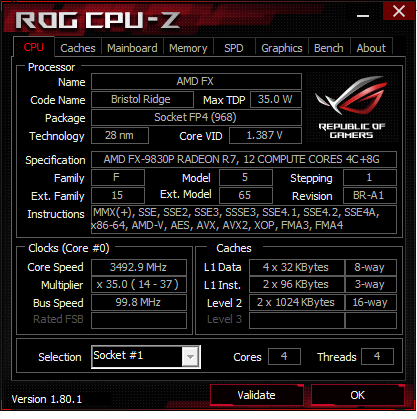
L'FX550UI soffre degli stessi problemi dei vecchi portatili gaming AMD-based. In questo caso, l'APU FX-9830P con prestazioni basse è il collo di bottiglia rispetto alla decente GPU RX 460 e le performance-per-Watt del sistema sono nettamente inferiori rispetto a quanto offre attualmente Nvidia. I consumi sono simili ai portatili concorrenti con CPUs Intel HQ-class molto più potenti e scheda grafica GTX 1050. Pertanto, l'FX550UI non è più fresco, duraturo o silenzioso rispetto alle alternative Intel/Nvidia nonostante le prestazioni inferiori.
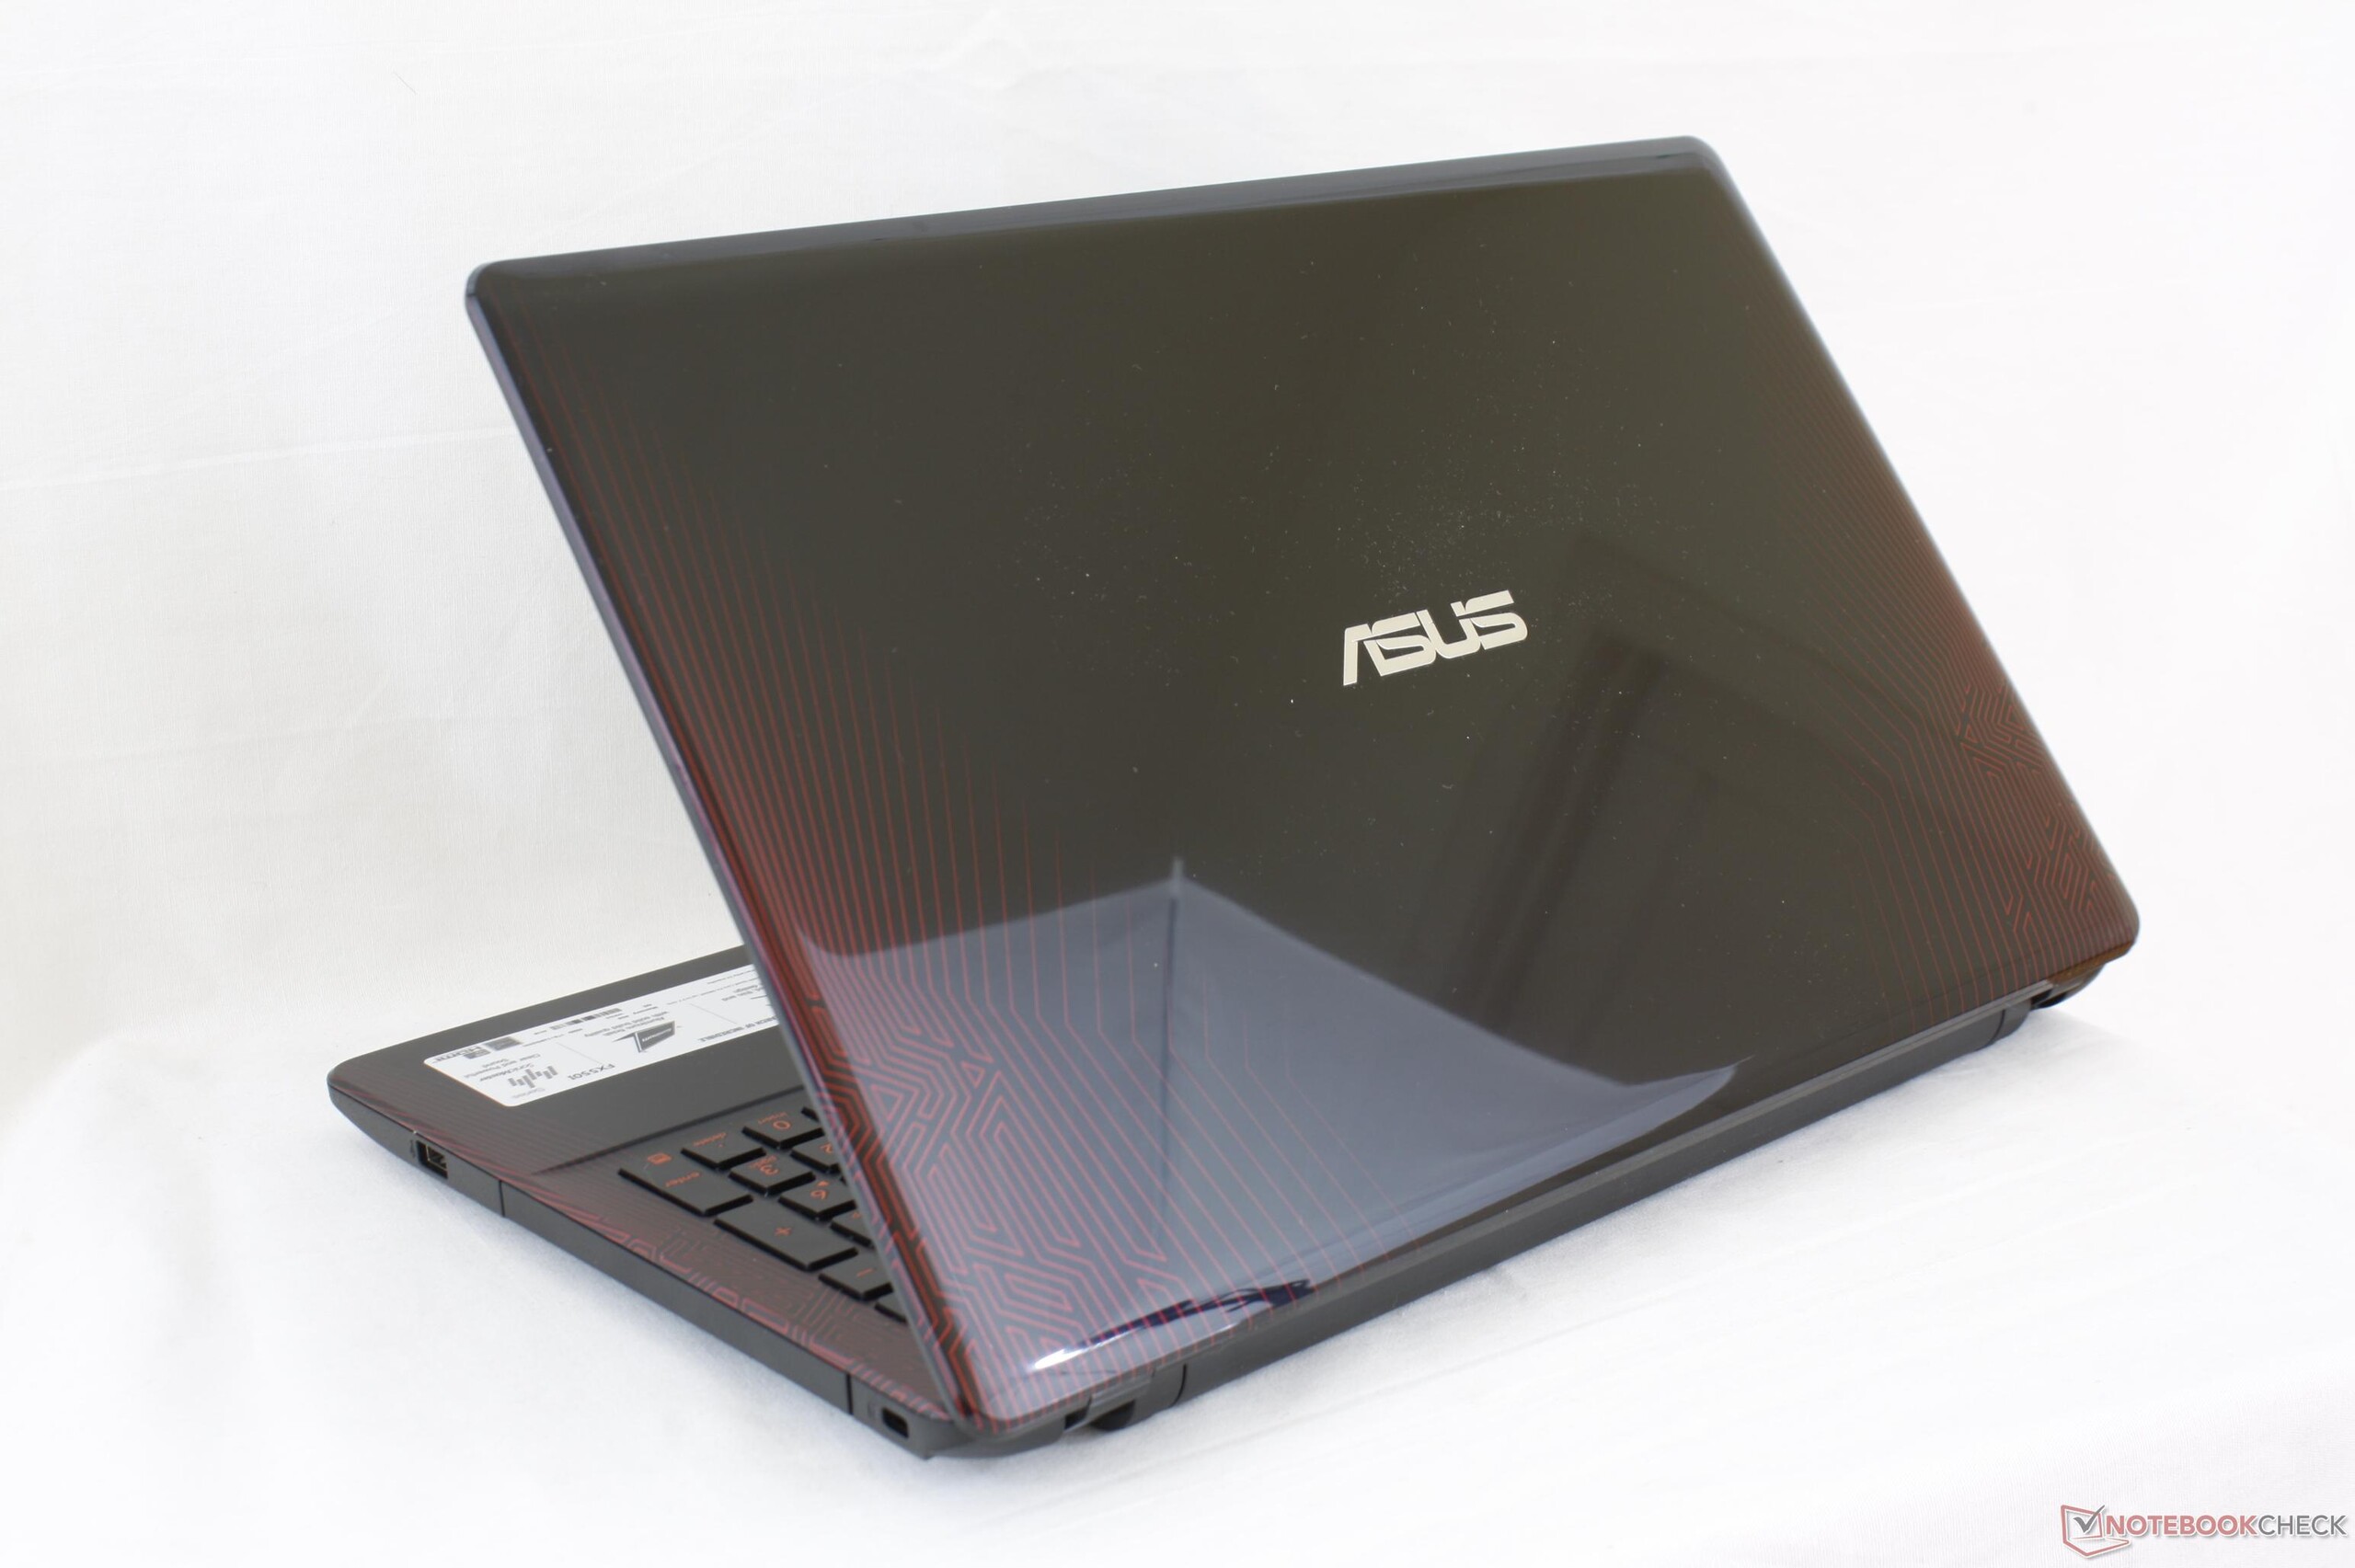
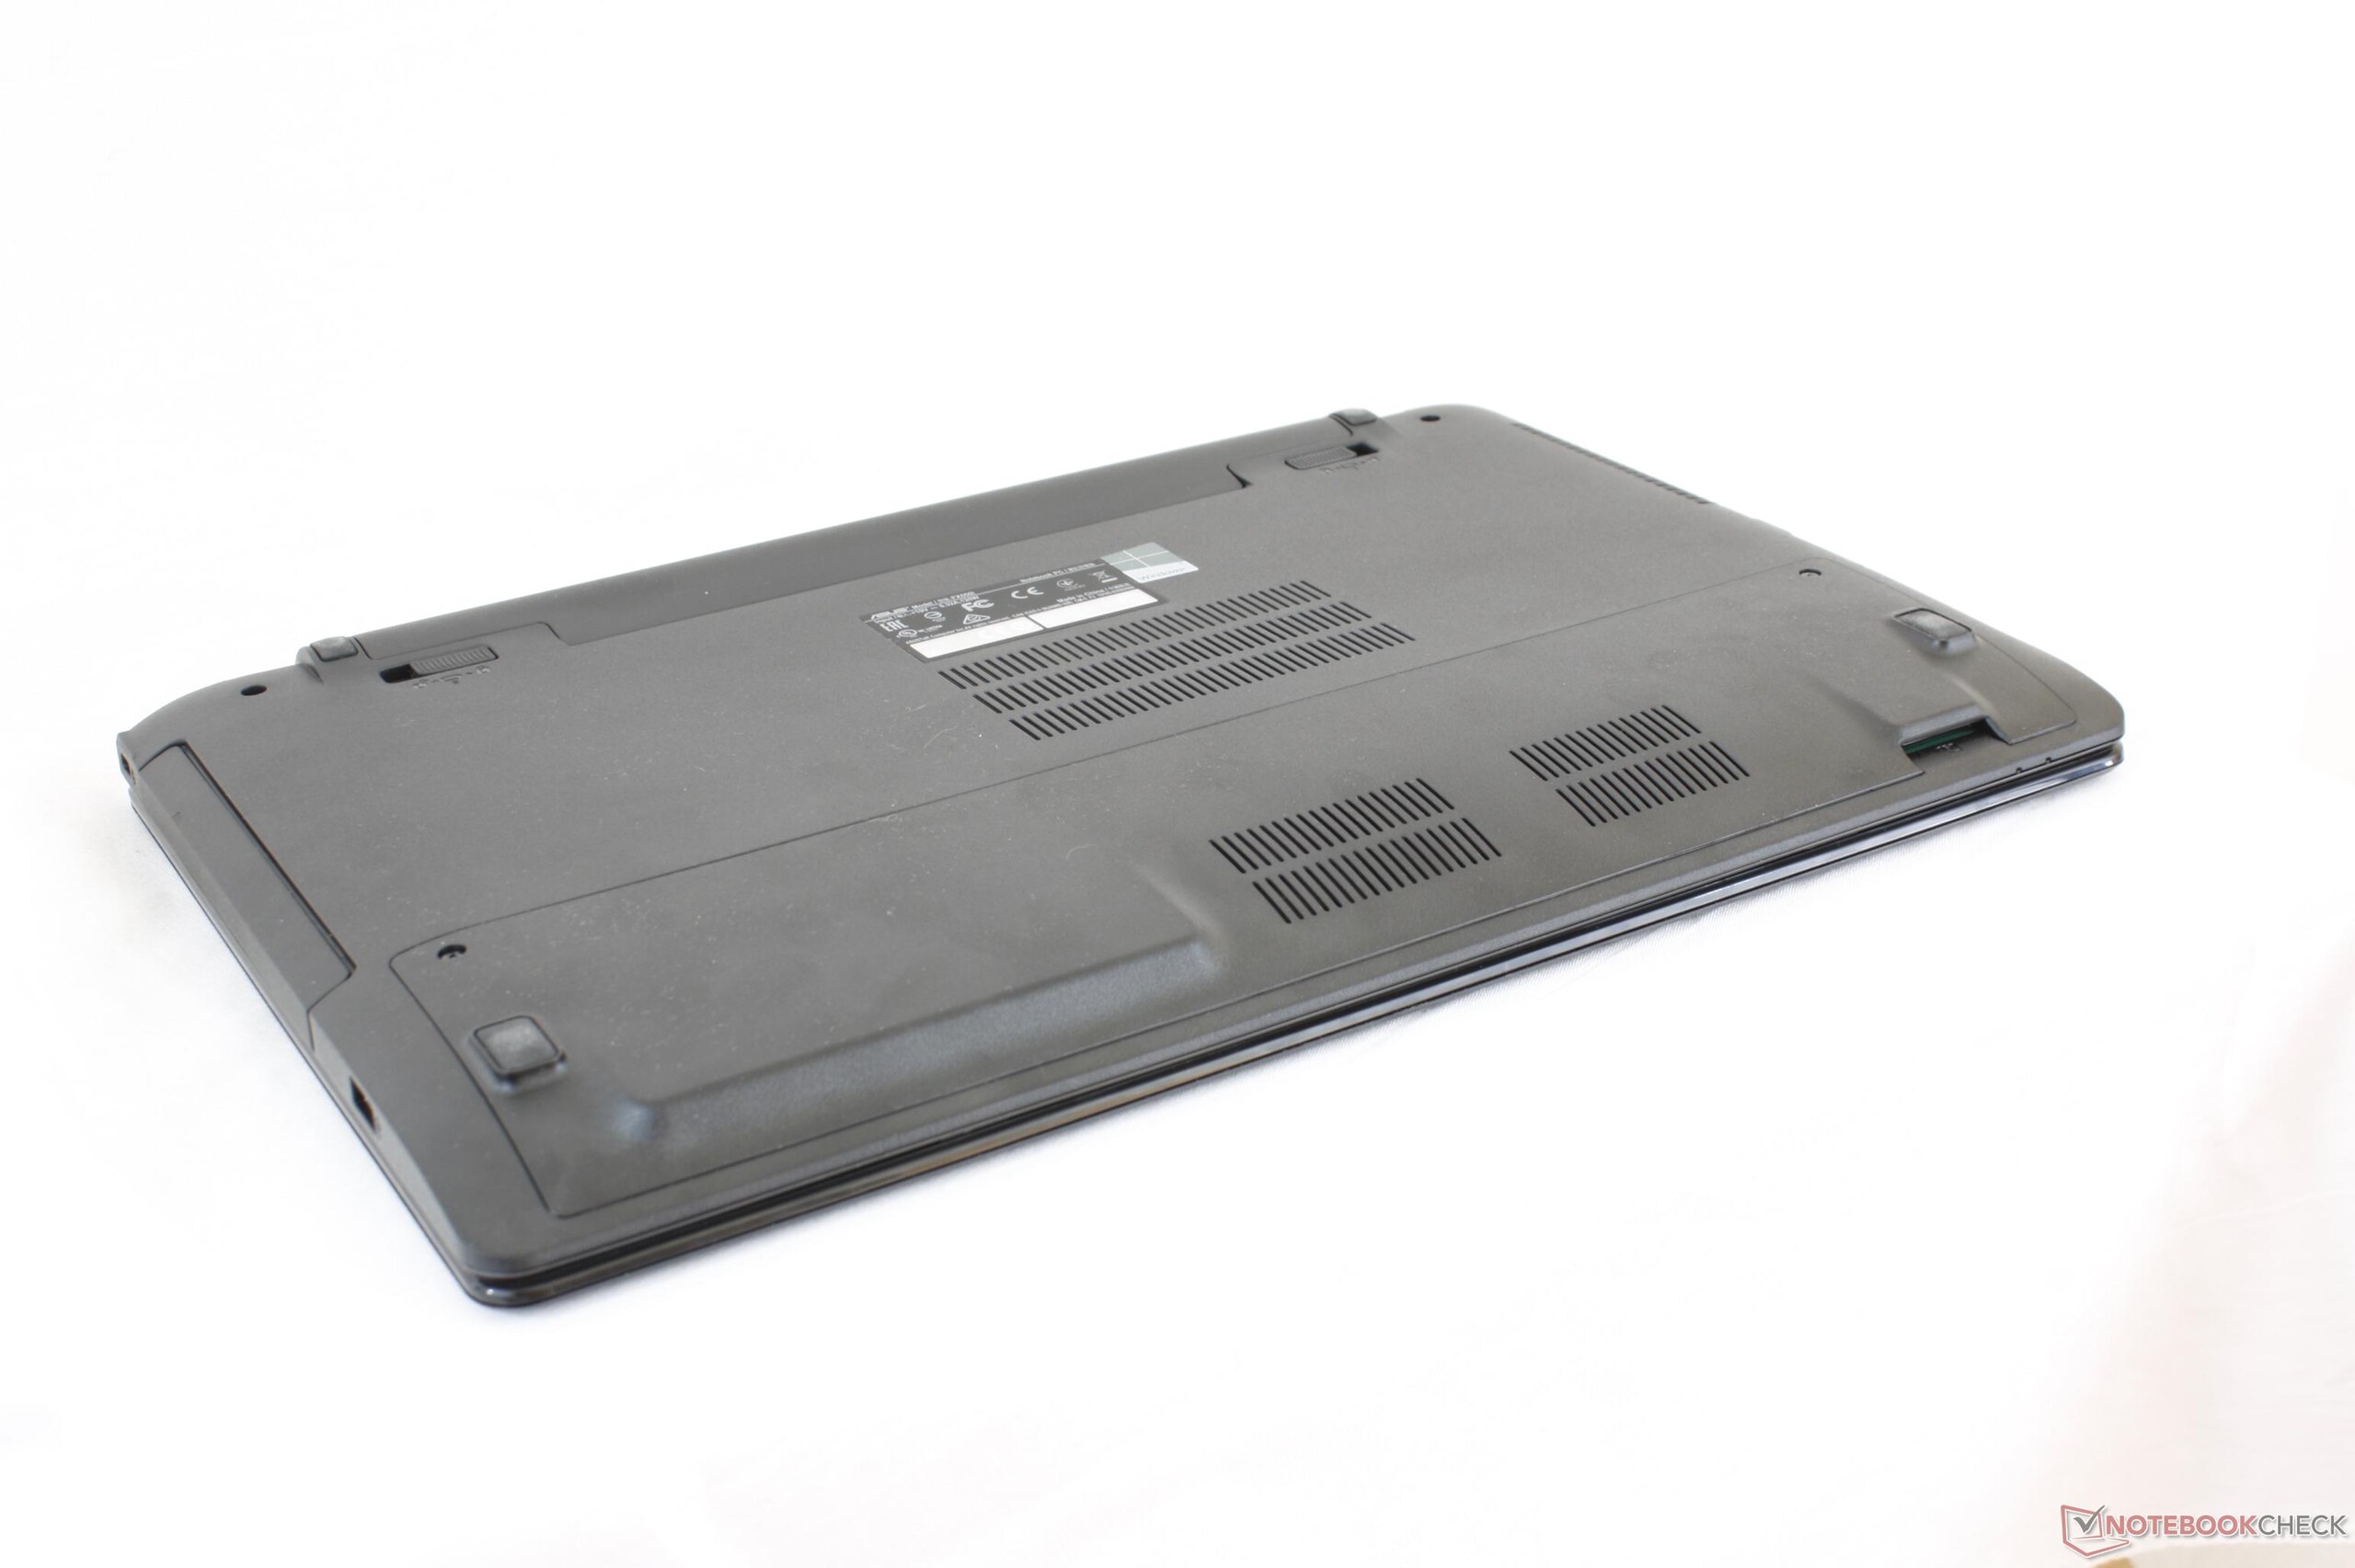
L'incompatibilità tra Bristol Ridge e Polaris 11 non è l'unico punto debole. Il fatto che l'FX550UI è una versione alterata del vecchissimo FX550DM e sembra come ci fosse stato un ripensamento. Il vano ottico vuoto è una perdita di spazio e il display TN è sotto la media. AMD ha sicuramente hardware migliore nei simili Asus UX550 o ROG Strix G501. Iniziamo a vedere maggiori investimenti nei portatili AMD ora che è disponibile l'GL702ZC e speriamo che sia l'inizio di un nuovo corso.
Il prezzo continua ad essere il principale vantaggio dell'FX550UI rispetto alle alternative Nvidia. Con $700 USD, l'Asus è di circa $200 - $300 più economico rispetto ad un Pavilion 15 o un Sabre 15 con i7-7700HQ e scheda grafica GTX 1050. Coloro che vogliono investire in un sistema mainstream Nvidia avranno un netto vantaggio rispetto all'FX550UI, specialmente come potenza CPU.
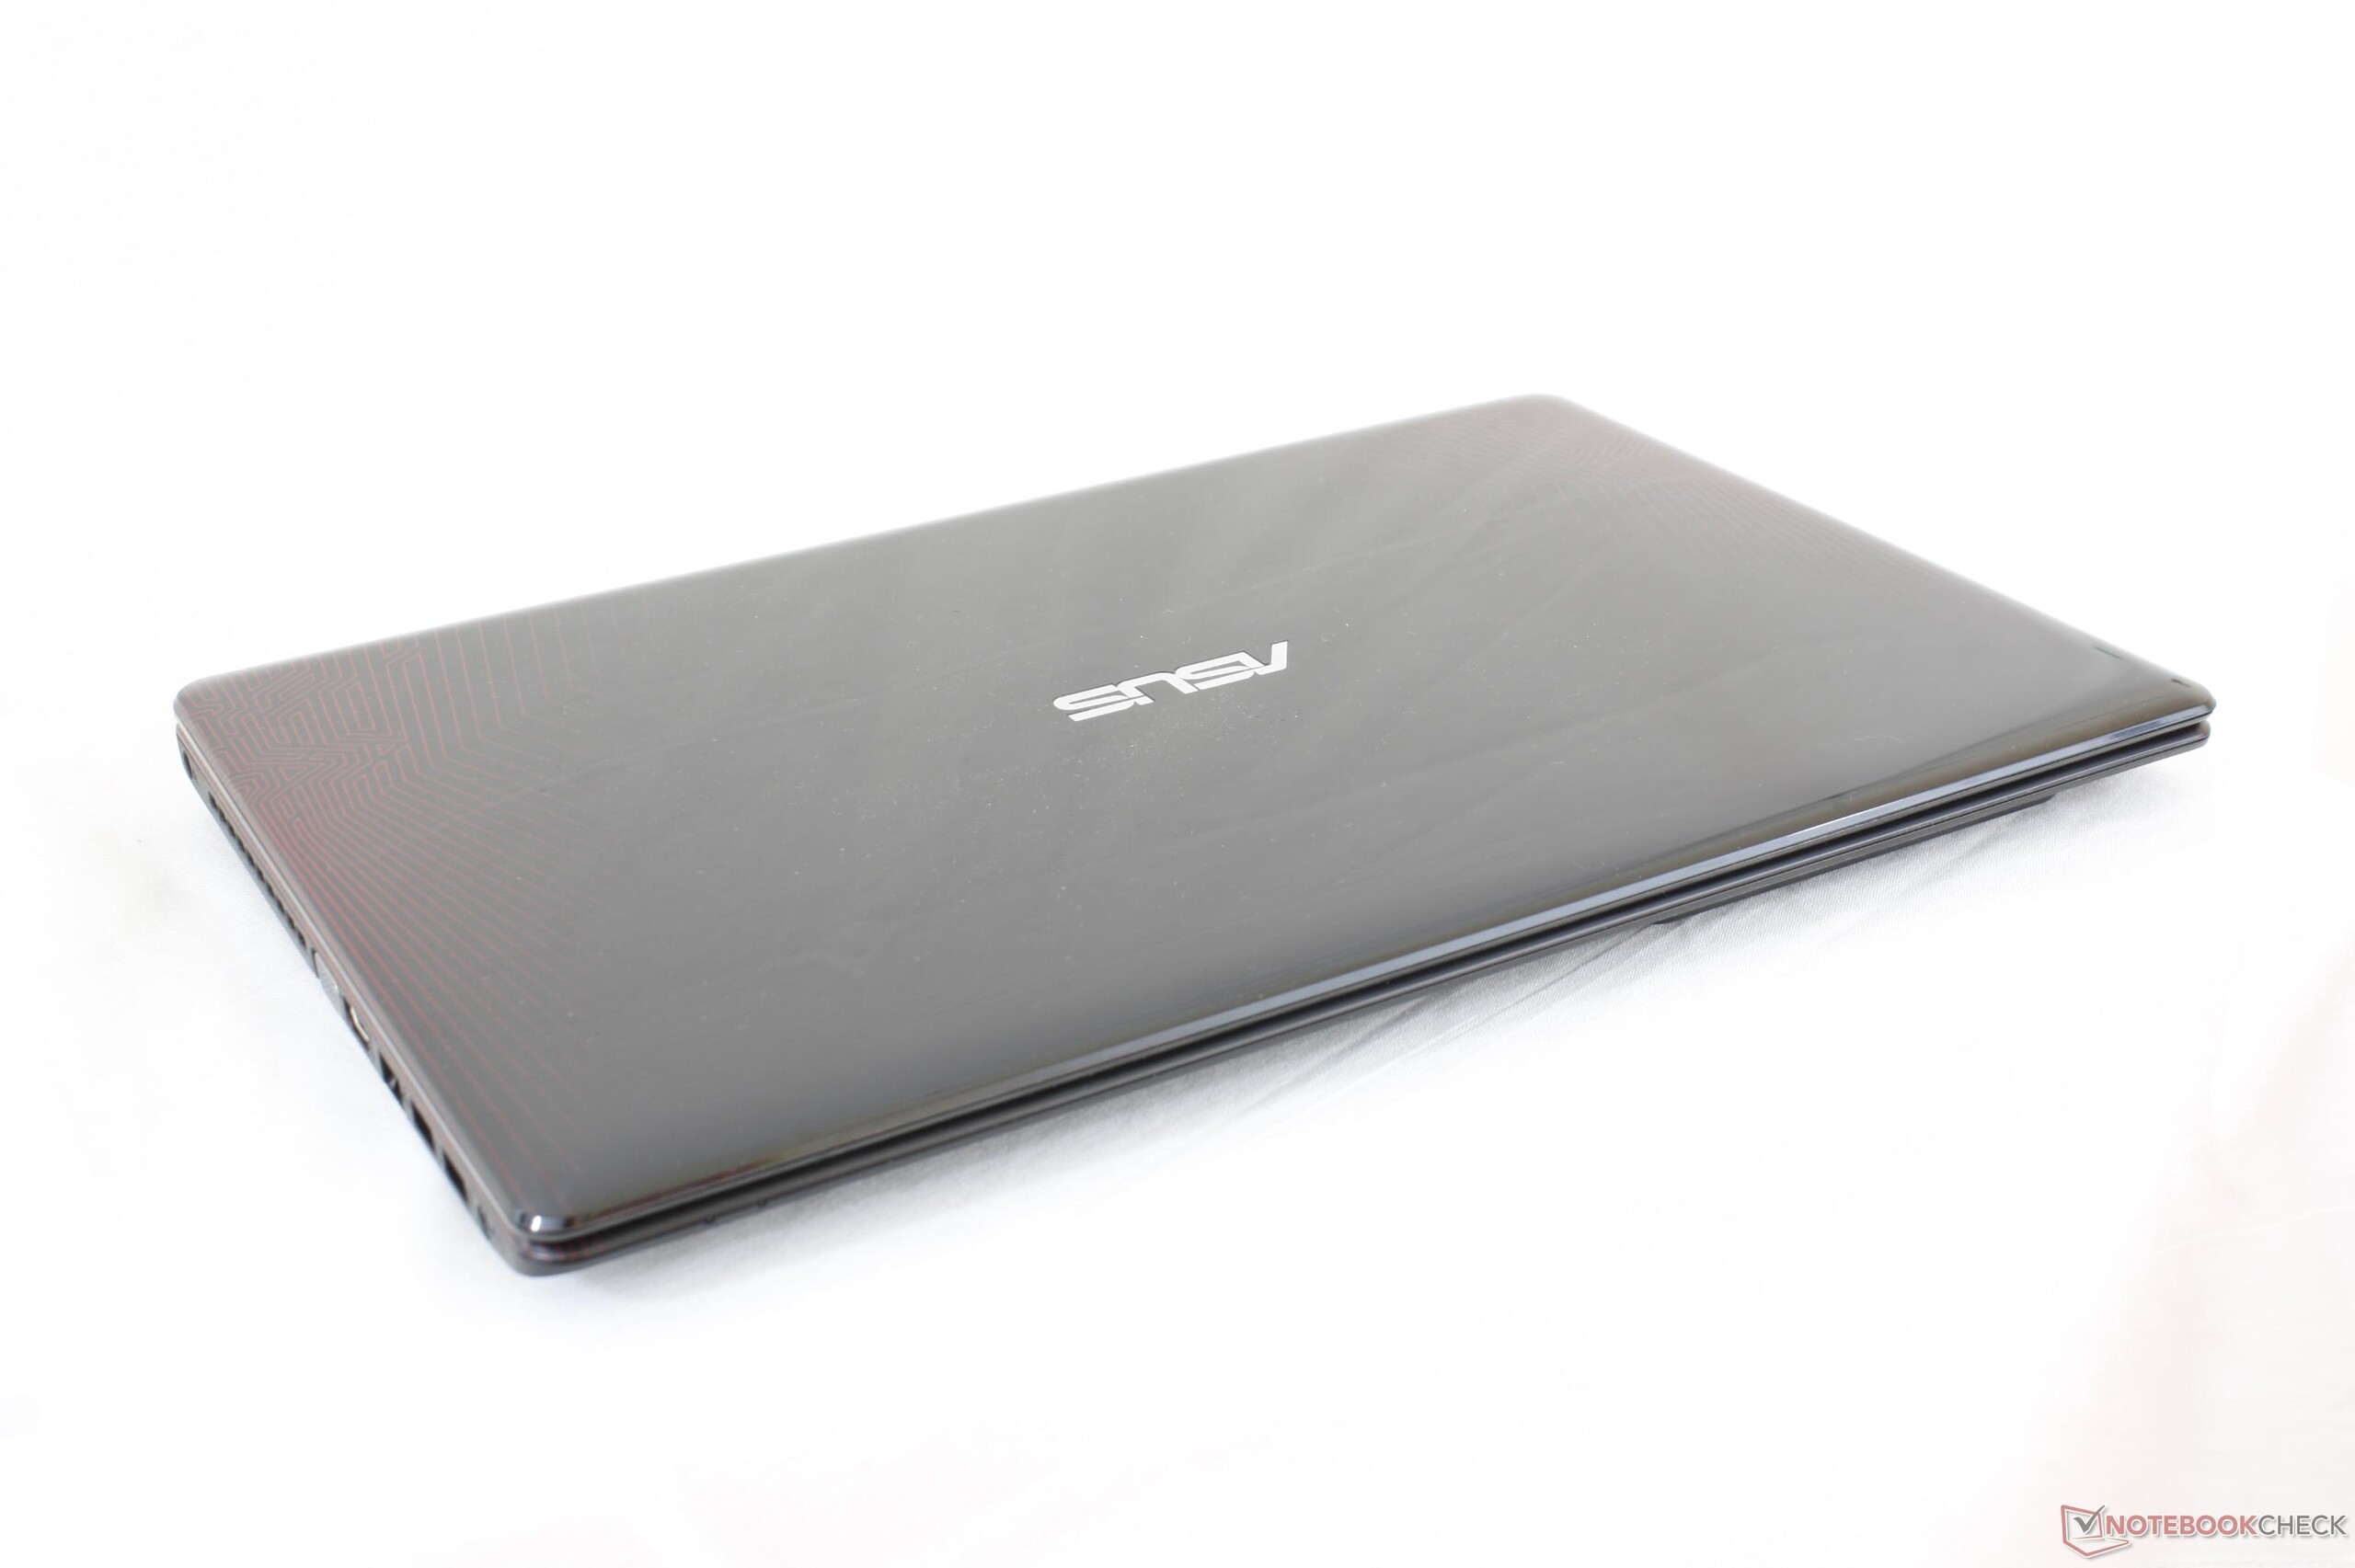
E' dura raccomandare l'FX550UI a causa dell'economico chassis in plastica, il processore lento, e lo scarso display TN. I gamers che hanno un budget molto limitato farebbero meglio a risparmiare un paio di centinaia di euro in più per un portatile GTX 1050 più recente o un più vecchio o meno costoso portatile GTX 965M.
Nota: si tratta di una recensione breve, con alcune sezioni non tradotte, per la versione integrale in inglese guardate qui.
Asus FX550IU-WSFX
- 09/16/2017 v6 (old)
Allen Ngo
Price comparison
