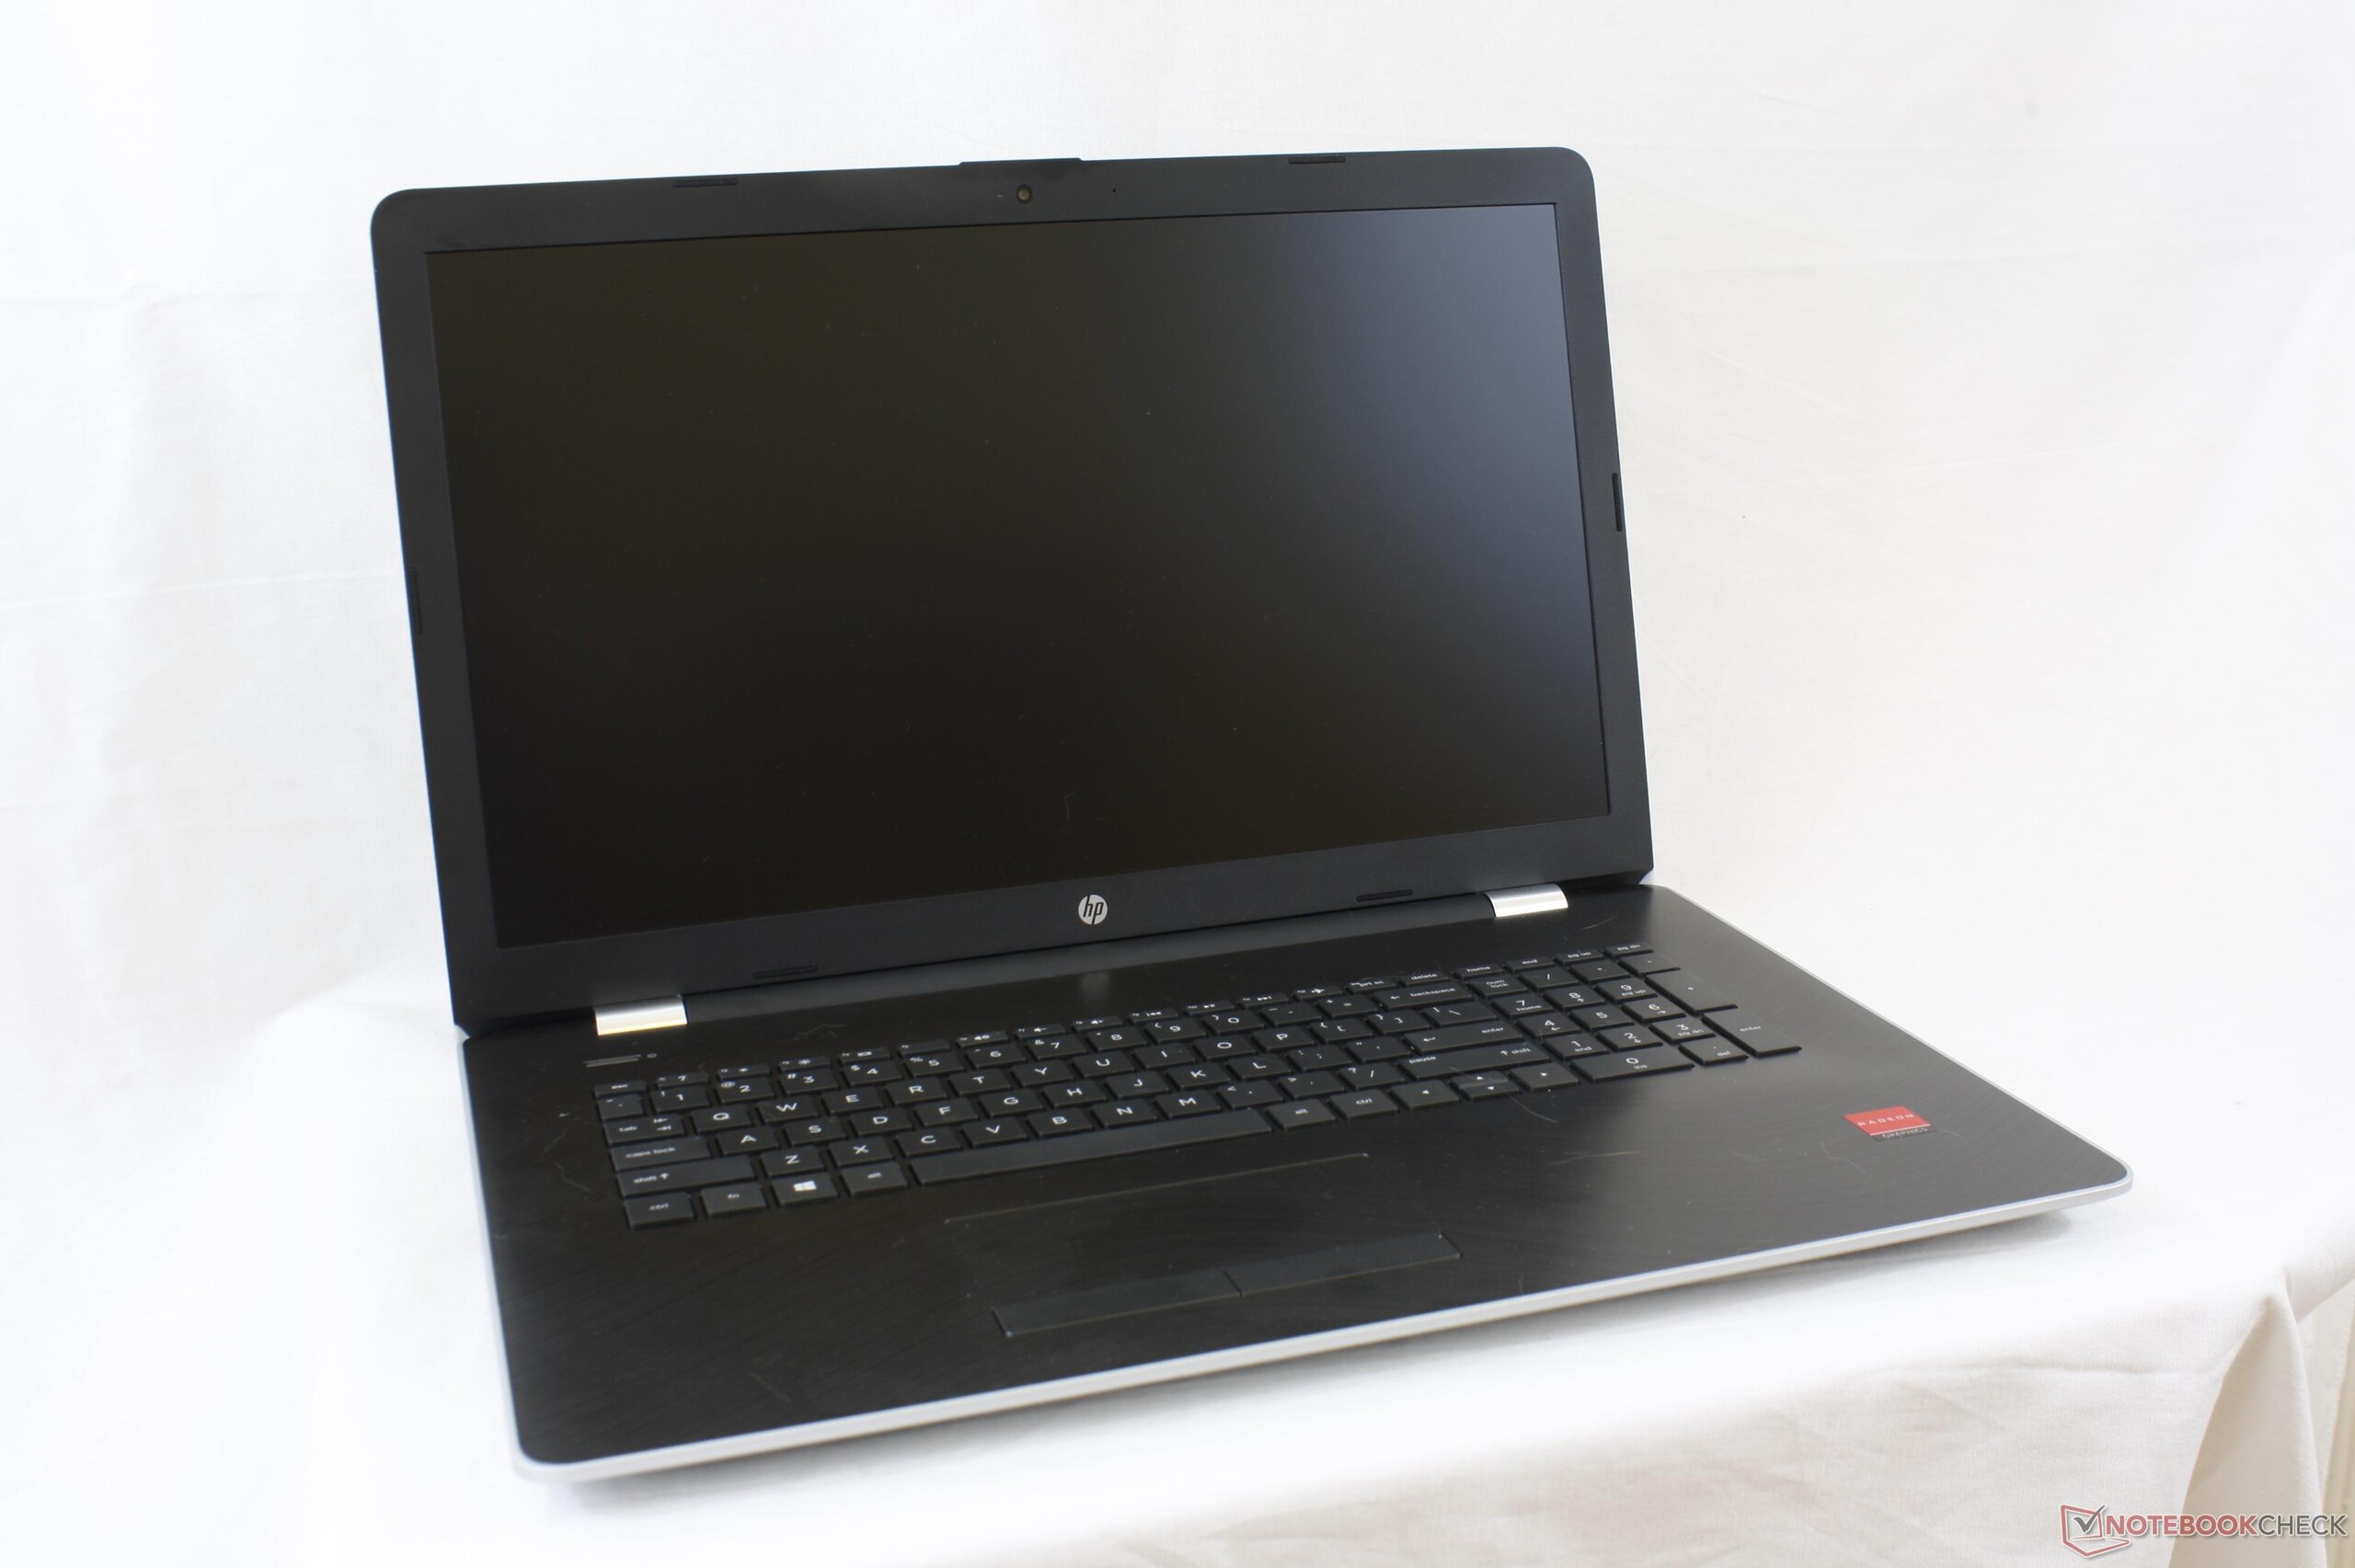
Recensione breve del Portatile HP Pavilion 17z (A12-9720P, Radeon R7 M340)
| SD Card Reader | |
| average JPG Copy Test (av. of 3 runs) | |
| Dell XPS 15 9560 (i7-7700HQ, UHD) | |
| HP Pavilion 17z 1EX13AV | |
| Dell Inspiron 17 5759-5118 | |
| maximum AS SSD Seq Read Test (1GB) | |
| Dell XPS 15 9560 (i7-7700HQ, UHD) | |
| HP Pavilion 17z 1EX13AV | |
| Dell Inspiron 17 5759-5118 | |
| Networking | |
| iperf3 transmit AX12 | |
| Lenovo Ideapad 110-17IKB 80VK0001GE | |
| HP Pavilion 17-x110ng | |
| HP Pavilion 17z 1EX13AV | |
| iperf3 receive AX12 | |
| Lenovo Ideapad 110-17IKB 80VK0001GE | |
| HP Pavilion 17z 1EX13AV | |
| HP Pavilion 17-x110ng | |
| |||||||||||||||||||||||||
Distribuzione della luminosità: 91 %
Al centro con la batteria: 333.5 cd/m²
Contrasto: 1042:1 (Nero: 0.32 cd/m²)
ΔE ColorChecker Calman: 4 | ∀{0.5-29.43 Ø4.71}
ΔE Greyscale Calman: 4.5 | ∀{0.09-98 Ø4.96}
88.1% sRGB (Argyll 1.6.3 3D)
57.5% AdobeRGB 1998 (Argyll 1.6.3 3D)
64.6% AdobeRGB 1998 (Argyll 3D)
88.5% sRGB (Argyll 3D)
64.3% Display P3 (Argyll 3D)
Gamma: 2.19
CCT: 6386 K
| HP Pavilion 17z 1EX13AV ID: AUO109D, Name: AU Optronics B173HW01 V0, IPS, 17.3", 1920x1080 | HP Pavilion 17-x110ng Chi Mei CMN1738, IPS, WLED, 17.3", 1920x1080 | Lenovo Ideapad 110-17IKB 80VK0001GE AU Optronics B173RTN02.2, TN LED, 17.3", 1600x900 | Asus F756UX-T7013T Chi Mei CMN1735 / N173HGE-E11, TN LED, 17.3", 1920x1080 | Dell Inspiron 17 5759-5118 AU Optronics B173HTN, TN LED, 17.3", 1920x1080 | MSI GL72 7RDX-602 Chi Mei CMN1735 N173HGE-E11, TN LED, 17.3", 1920x1080 | |
|---|---|---|---|---|---|---|
| Display | -2% | -19% | 2% | 4% | 3% | |
| Display P3 Coverage (%) | 64.3 | 63.6 -1% | 51.1 -21% | 63.9 -1% | 69.3 8% | 65.2 1% |
| sRGB Coverage (%) | 88.5 | 86.5 -2% | 73.4 -17% | 93.7 6% | 90.6 2% | 94.3 7% |
| AdobeRGB 1998 Coverage (%) | 64.6 | 63.3 -2% | 52.6 -19% | 64.6 0% | 66.3 3% | 65.6 2% |
| Response Times | -7% | -3% | 9% | -51% | 16% | |
| Response Time Grey 50% / Grey 80% * (ms) | 40.8 ? | 41 ? -0% | 50 ? -23% | 42 ? -3% | 86 ? -111% | 29 ? 29% |
| Response Time Black / White * (ms) | 26.4 ? | 30 ? -14% | 22 ? 17% | 21 ? 20% | 24 ? 9% | 26 ? 2% |
| PWM Frequency (Hz) | 200 ? | 50 ? | 1000 ? | 200 ? | 961 | |
| Screen | -23% | -65% | -17% | -43% | -59% | |
| Brightness middle (cd/m²) | 333.5 | 288 -14% | 231 -31% | 268 -20% | 304 -9% | 299 -10% |
| Brightness (cd/m²) | 323 | 285 -12% | 210 -35% | 255 -21% | 292 -10% | 274 -15% |
| Brightness Distribution (%) | 91 | 88 -3% | 83 -9% | 83 -9% | 84 -8% | 80 -12% |
| Black Level * (cd/m²) | 0.32 | 0.61 -91% | 0.37 -16% | 0.17 47% | 0.37 -16% | 0.25 22% |
| Contrast (:1) | 1042 | 472 -55% | 624 -40% | 1576 51% | 822 -21% | 1196 15% |
| Colorchecker dE 2000 * | 4 | 4.56 -14% | 9.83 -146% | 7.18 -80% | 10.62 -166% | 12.92 -223% |
| Colorchecker dE 2000 max. * | 6.9 | 7.76 -12% | 18.35 -166% | 11.67 -69% | 19.91 -189% | |
| Greyscale dE 2000 * | 4.5 | 4.95 -10% | 12.46 -177% | 7.97 -77% | 11.78 -162% | 13.16 -192% |
| Gamma | 2.19 100% | 2.48 89% | 2.43 91% | 2.34 94% | 2.39 92% | 2.36 93% |
| CCT | 6386 102% | 7669 85% | 13115 50% | 8541 76% | 12997 50% | 15046 43% |
| Color Space (Percent of AdobeRGB 1998) (%) | 57.5 | 48 -17% | 59 3% | 59 3% | 60 4% | |
| Color Space (Percent of sRGB) (%) | 88.1 | 93 6% | 73 -17% | 94 7% | 90 2% | 94 7% |
| Media totale (Programma / Settaggio) | -11% /
-16% | -29% /
-48% | -2% /
-10% | -30% /
-34% | -13% /
-37% |
* ... Meglio usare valori piccoli
Tempi di risposta del Display
| ↔ Tempi di risposta dal Nero al Bianco | ||
|---|---|---|
| 26.4 ms ... aumenta ↗ e diminuisce ↘ combinato | ↗ 14 ms Incremento | 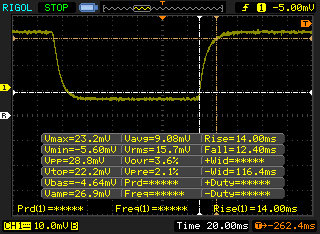 |
| ↘ 12.4 ms Calo | ||
| Lo schermo mostra tempi di risposta relativamente lenti nei nostri tests e potrebbe essere troppo lento per i gamers. In confronto, tutti i dispositivi di test variano da 0.1 (minimo) a 240 (massimo) ms. » 66 % di tutti i dispositivi è migliore. Questo significa che i tempi di risposta rilevati sono peggiori rispetto alla media di tutti i dispositivi testati (19.8 ms). | ||
| ↔ Tempo di risposta dal 50% Grigio all'80% Grigio | ||
| 40.8 ms ... aumenta ↗ e diminuisce ↘ combinato | ↗ 22 ms Incremento | 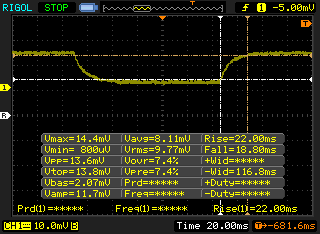 |
| ↘ 18.8 ms Calo | ||
| Lo schermo mostra tempi di risposta lenti nei nostri tests e sarà insoddisfacente per i gamers. In confronto, tutti i dispositivi di test variano da 0.165 (minimo) a 636 (massimo) ms. » 64 % di tutti i dispositivi è migliore. Questo significa che i tempi di risposta rilevati sono peggiori rispetto alla media di tutti i dispositivi testati (31 ms). | ||
Sfarfallio dello schermo / PWM (Pulse-Width Modulation)
| flickering dello schermo / PWM non rilevato | 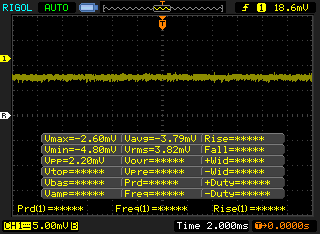 | ||
In confronto: 52 % di tutti i dispositivi testati non utilizza PWM per ridurre la luminosita' del display. Se è rilevato PWM, una media di 7747 (minimo: 5 - massimo: 343500) Hz è stata rilevata. | |||
| Cinebench R11.5 | |
| CPU Single 64Bit | |
| HP Pavilion 17-x110ng | |
| Acer TravelMate P249-M-5452 | |
| Lenovo ThinkPad X1 Tablet Gen 2 | |
| HP 15-ba077ng | |
| HP Pavilion 17z 1EX13AV | |
| HP Pavilion 14t-ab000 K9E07AV | |
| HP EliteBook 755 G4 | |
| HP Pavilion 15-aw004ng W8Y60EA | |
| Asus X555DA-BB11 | |
| Asus X555LD-XX283H | |
| CPU Multi 64Bit | |
| HP Pavilion 17-x110ng | |
| Acer TravelMate P249-M-5452 | |
| HP EliteBook 755 G4 | |
| HP Pavilion 17z 1EX13AV | |
| HP 15-ba077ng | |
| HP Pavilion 15-aw004ng W8Y60EA | |
| Lenovo ThinkPad X1 Tablet Gen 2 | |
| HP Pavilion 14t-ab000 K9E07AV | |
| Asus X555DA-BB11 | |
| Asus X555LD-XX283H | |
| Cinebench R10 | |
| Rendering Multiple CPUs 32Bit | |
| HP Pavilion 17-x110ng | |
| Acer TravelMate P249-M-5452 | |
| HP EliteBook 755 G4 | |
| HP Pavilion 17z 1EX13AV | |
| HP 15-ba077ng | |
| Lenovo Ideapad 110-15ACL 80TJ00H0GE | |
| HP Pavilion 15-aw004ng W8Y60EA | |
| Asus X555LD-XX283H | |
| Asus X555DA-BB11 | |
| Rendering Single 32Bit | |
| HP Pavilion 17-x110ng | |
| Acer TravelMate P249-M-5452 | |
| HP Pavilion 17z 1EX13AV | |
| HP 15-ba077ng | |
| HP EliteBook 755 G4 | |
| HP Pavilion 15-aw004ng W8Y60EA | |
| Asus X555LD-XX283H | |
| Asus X555DA-BB11 | |
| Lenovo Ideapad 110-15ACL 80TJ00H0GE | |
| wPrime 2.10 - 1024m | |
| Lenovo ThinkPad X1 Tablet Gen 2 | |
| HP Pavilion 14t-ab000 K9E07AV | |
| Asus X555DA-BB11 | |
| HP Pavilion 17z 1EX13AV | |
* ... Meglio usare valori piccoli
| PCMark 8 Home Score Accelerated v2 | 2783 punti | |
| PCMark 8 Creative Score Accelerated v2 | 3219 punti | |
| PCMark 8 Work Score Accelerated v2 | 3518 punti | |
| PCMark 10 Score | 2235 punti | |
Aiuto | ||
| HP Pavilion 17z 1EX13AV WDC Scorpio Blue WD10JPVX-60JC3T1 | HP Pavilion 17-x110ng SanDisk Z400s SD8SNAT-256G | Lenovo Ideapad 110-17IKB 80VK0001GE WDC Scorpio Blue WD10JPCX-24UE4T0 | Asus F756UX-T7013T HGST Travelstar 5K1000 HTS541010A9E680 | Dell Inspiron 17 5759-5118 Seagate Momentus SpinPoint M8 ST1000LM024 HN-M101MBB | |
|---|---|---|---|---|---|
| CrystalDiskMark 3.0 | 8313% | 45% | 22% | -9% | |
| Read Seq (MB/s) | 90 | 500 456% | 110.3 23% | 105.8 18% | 91.8 2% |
| Write Seq (MB/s) | 90.3 | 325.1 260% | 109 21% | 105 16% | 84.7 -6% |
| Read 512 (MB/s) | 28.47 | 290.2 919% | 39.19 38% | 33.33 17% | 26.59 -7% |
| Write 512 (MB/s) | 47.07 | 300.3 538% | 52.9 12% | 39.12 -17% | 32.7 -31% |
| Read 4k (MB/s) | 0.31 | 11.24 3526% | 0.45 45% | 0.413 33% | 0.288 -7% |
| Write 4k (MB/s) | 0.3997 | 86 21416% | 1.201 200% | 0.947 137% | 0.638 60% |
| Read 4k QD32 (MB/s) | 1.021 | 145.4 14141% | 1.079 6% | 0.812 -20% | 0.59 -42% |
| Write 4k QD32 (MB/s) | 1.076 | 272.7 25244% | 1.234 15% | 0.968 -10% | 0.642 -40% |

| 3DMark 11 | |
| 1280x720 Performance GPU | |
| Acer Aspire E5-575G-549D | |
| HP Pavilion 17z 1EX13AV | |
| Intel Skull Canyon NUC6i7KYK | |
| Apple MacBook Pro 13 2017 Touchbar i5 | |
| Lenovo Flex 2 Pro-15 | |
| Samsung Notebook 9 NP900X5N-X01US | |
| HP EliteBook 755 G4 | |
| Lenovo IdeaPad 305-15IBD | |
| Lenovo ThinkPad L570 20J80020PB | |
| Acer TravelMate P249-M-5452 | |
| HP 15-bw077ax | |
| Lenovo Ideapad 110-15ACL 80TJ00H0GE | |
| Toshiba Portege Z20t-B-10C | |
| 1280x720 Performance Combined | |
| Acer Aspire E5-575G-549D | |
| Intel Skull Canyon NUC6i7KYK | |
| Apple MacBook Pro 13 2017 Touchbar i5 | |
| Samsung Notebook 9 NP900X5N-X01US | |
| Lenovo Flex 2 Pro-15 | |
| Lenovo ThinkPad L570 20J80020PB | |
| Acer TravelMate P249-M-5452 | |
| Lenovo IdeaPad 305-15IBD | |
| HP Pavilion 17z 1EX13AV | |
| HP EliteBook 755 G4 | |
| Lenovo Ideapad 110-15ACL 80TJ00H0GE | |
| HP 15-bw077ax | |
| Toshiba Portege Z20t-B-10C | |
| 3DMark | |
| 1280x720 Cloud Gate Standard Graphics | |
| Acer Aspire E5-575G-549D | |
| Intel Skull Canyon NUC6i7KYK | |
| Apple MacBook Pro 13 2017 Touchbar i5 | |
| HP Pavilion 17z 1EX13AV | |
| Lenovo ThinkPad L570 20J80020PB | |
| Lenovo Flex 2 Pro-15 | |
| Samsung Notebook 9 NP900X5N-X01US | |
| Acer TravelMate P249-M-5452 | |
| HP EliteBook 755 G4 | |
| Lenovo IdeaPad 305-15IBD | |
| Toshiba Portege Z20t-B-10C | |
| HP 15-bw077ax | |
| 1920x1080 Fire Strike Graphics | |
| Acer Aspire E5-575G-549D | |
| HP Pavilion 17z 1EX13AV | |
| Intel Skull Canyon NUC6i7KYK | |
| Apple MacBook Pro 13 2017 Touchbar i5 | |
| Samsung Notebook 9 NP900X5N-X01US | |
| Lenovo Flex 2 Pro-15 | |
| Lenovo ThinkPad L570 20J80020PB | |
| HP EliteBook 755 G4 | |
| Lenovo IdeaPad 305-15IBD | |
| Acer TravelMate P249-M-5452 | |
| HP 15-bw077ax | |
| Toshiba Portege Z20t-B-10C | |
| 3DMark 11 Performance | 2961 punti | |
| 3DMark Ice Storm Standard Score | 41857 punti | |
| 3DMark Cloud Gate Standard Score | 5704 punti | |
| 3DMark Fire Strike Score | 1407 punti | |
Aiuto | ||
| Rise of the Tomb Raider - 1024x768 Lowest Preset | |
| Acer Aspire E5-575G-549D | |
| Samsung Notebook 9 NP900X5N-X01US | |
| HP Pavilion 17z 1EX13AV | |
| Microsoft Surface Pro (2017) i7 | |
| Asus X302UV-FN016T | |
| Dell Latitude 5280 | |
| basso | medio | alto | ultra | |
|---|---|---|---|---|
| StarCraft II: Heart of the Swarm (2013) | 61 | 35.5 | 21.5 | |
| BioShock Infinite (2013) | 74.5 | 43.5 | 34.1 | 11.8 |
| Metro: Last Light (2013) | 32.6 | 26 | 18.9 | |
| Thief (2014) | 20.3 | |||
| The Witcher 3 (2015) | 19 | |||
| Batman: Arkham Knight (2015) | 19 | |||
| Metal Gear Solid V (2015) | 57 | 40 | 14 | |
| Dota 2 Reborn (2015) | 46 | 38 | 21 | 18 |
| Fallout 4 (2015) | 25.6 | |||
| Rise of the Tomb Raider (2016) | 28.2 | 15 | ||
| Doom (2016) | 20.2 | |||
| Overwatch (2016) | 54.8 | 44.9 | ||
| Prey (2017) | 38.4 | 14.7 |
Rumorosità
| Idle |
| 30.4 / 30.5 / 30.5 dB(A) |
| Sotto carico |
| 41.5 / 48.2 dB(A) |
 | ||
30 dB silenzioso 40 dB(A) udibile 50 dB(A) rumoroso |
||
min: | ||
| HP Pavilion 17z 1EX13AV Radeon R7 M340, A12-9720P, WDC Scorpio Blue WD10JPVX-60JC3T1 | HP Pavilion 17-x110ng Radeon R7 M440, i5-7200U, SanDisk Z400s SD8SNAT-256G | Lenovo Ideapad 110-17IKB 80VK0001GE Radeon R5 M430, i5-7200U, WDC Scorpio Blue WD10JPCX-24UE4T0 | Asus F756UX-T7013T GeForce GTX 950M, 6200U, HGST Travelstar 5K1000 HTS541010A9E680 | Dell Inspiron 17 5759-5118 Radeon R5 M335, 6200U, Seagate Momentus SpinPoint M8 ST1000LM024 HN-M101MBB | MSI GL72 7RDX-602 GeForce GTX 1050 Mobile, i7-7700HQ, HGST Travelstar 7K1000 HTS721010A9E630 | |
|---|---|---|---|---|---|---|
| Noise | 3% | 1% | -5% | -6% | -3% | |
| off /ambiente * (dB) | 28 | 29 -4% | 30.5 -9% | 31.2 -11% | 30.8 -10% | |
| Idle Minimum * (dB) | 30.4 | 31 -2% | 32.5 -7% | 32.4 -7% | 33.9 -12% | 32.4 -7% |
| Idle Average * (dB) | 30.5 | 31 -2% | 32.5 -7% | 32.6 -7% | 33.9 -11% | 32.4 -6% |
| Idle Maximum * (dB) | 30.5 | 31 -2% | 32.5 -7% | 32.6 -7% | 33.9 -11% | 32.8 -8% |
| Load Average * (dB) | 41.5 | 33.8 19% | 34.6 17% | 42 -1% | 43.8 -6% | 40.9 1% |
| Witcher 3 ultra * (dB) | 41.8 | |||||
| Load Maximum * (dB) | 48.2 | 44.8 7% | 38.3 21% | 45.2 6% | 44.2 8% | 43.6 10% |
* ... Meglio usare valori piccoli
(±) La temperatura massima sul lato superiore è di 40.8 °C / 105 F, rispetto alla media di 36.8 °C / 98 F, che varia da 21 a 71 °C per questa classe Multimedia.
(±) Il lato inferiore si riscalda fino ad un massimo di 41.6 °C / 107 F, rispetto alla media di 39.1 °C / 102 F
(+) In idle, la temperatura media del lato superiore è di 23.3 °C / 74 F, rispetto alla media deld ispositivo di 31.3 °C / 88 F.
(±) Riproducendo The Witcher 3, la temperatura media per il lato superiore e' di 33.2 °C / 92 F, rispetto alla media del dispositivo di 31.3 °C / 88 F.
(+) I poggiapolsi e il touchpad raggiungono la temperatura massima della pelle (32.8 °C / 91 F) e quindi non sono caldi.
(-) La temperatura media della zona del palmo della mano di dispositivi simili e'stata di 28.7 °C / 83.7 F (-4.1 °C / -7.3 F).
HP Pavilion 17z 1EX13AV analisi audio
(-) | altoparlanti non molto potenti (64.1 dB)
Bassi 100 - 315 Hz
(±) | bassi ridotti - in media 13.7% inferiori alla media
(-) | bassi non lineari (16.5% delta rispetto alla precedente frequenza)
Medi 400 - 2000 Hz
(+) | medi bilanciati - solo only 3.5% rispetto alla media
(-) | medi non in linea (17.3% delta rispetto alla precedente frequenza)
Alti 2 - 16 kHz
(+) | Alti bilanciati - appena 4.6% dalla media
(-) | alti non lineari (18.5% delta rispetto alla precedente frequenza)
Nel complesso 100 - 16.000 Hz
(±) | la linearità complessiva del suono è media (27.5% di differenza rispetto alla media
Rispetto alla stessa classe
» 93% di tutti i dispositivi testati in questa classe è stato migliore, 2% simile, 5% peggiore
» Il migliore ha avuto un delta di 5%, medio di 17%, peggiore di 45%
Rispetto a tutti i dispositivi testati
» 84% di tutti i dispositivi testati in questa classe è stato migliore, 3% similare, 13% peggiore
» Il migliore ha avuto un delta di 4%, medio di 23%, peggiore di 134%
Apple MacBook 12 (Early 2016) 1.1 GHz analisi audio
(+) | gli altoparlanti sono relativamente potenti (83.6 dB)
Bassi 100 - 315 Hz
(±) | bassi ridotti - in media 11.3% inferiori alla media
(±) | la linearità dei bassi è media (14.2% delta rispetto alla precedente frequenza)
Medi 400 - 2000 Hz
(+) | medi bilanciati - solo only 2.4% rispetto alla media
(+) | medi lineari (5.5% delta rispetto alla precedente frequenza)
Alti 2 - 16 kHz
(+) | Alti bilanciati - appena 2% dalla media
(+) | alti lineari (4.5% delta rispetto alla precedente frequenza)
Nel complesso 100 - 16.000 Hz
(+) | suono nel complesso lineare (10.2% differenza dalla media)
Rispetto alla stessa classe
» 7% di tutti i dispositivi testati in questa classe è stato migliore, 2% simile, 90% peggiore
» Il migliore ha avuto un delta di 5%, medio di 18%, peggiore di 53%
Rispetto a tutti i dispositivi testati
» 5% di tutti i dispositivi testati in questa classe è stato migliore, 1% similare, 94% peggiore
» Il migliore ha avuto un delta di 4%, medio di 23%, peggiore di 134%
| Off / Standby | |
| Idle | |
| Sotto carico |
|
Leggenda:
min: | |
| HP Pavilion 17z 1EX13AV A12-9720P, Radeon R7 M340, WDC Scorpio Blue WD10JPVX-60JC3T1, IPS, 1920x1080, 17.3" | HP Pavilion 17-x110ng i5-7200U, Radeon R7 M440, SanDisk Z400s SD8SNAT-256G, IPS, WLED, 1920x1080, 17.3" | Lenovo Ideapad 110-17IKB 80VK0001GE i5-7200U, Radeon R5 M430, WDC Scorpio Blue WD10JPCX-24UE4T0, TN LED, 1600x900, 17.3" | Asus F756UX-T7013T 6200U, GeForce GTX 950M, HGST Travelstar 5K1000 HTS541010A9E680, TN LED, 1920x1080, 17.3" | Dell Inspiron 17 5759-5118 6200U, Radeon R5 M335, Seagate Momentus SpinPoint M8 ST1000LM024 HN-M101MBB, TN LED, 1920x1080, 17.3" | MSI GL72 7RDX-602 i7-7700HQ, GeForce GTX 1050 Mobile, HGST Travelstar 7K1000 HTS721010A9E630, TN LED, 1920x1080, 17.3" | |
|---|---|---|---|---|---|---|
| Power Consumption | 8% | 26% | 5% | 19% | -49% | |
| Idle Minimum * (Watt) | 7.8 | 7.7 1% | 6.9 12% | 5.8 26% | 6.2 21% | 9.6 -23% |
| Idle Average * (Watt) | 11.7 | 14 -20% | 9.6 18% | 11.2 4% | 11.6 1% | 15 -28% |
| Idle Maximum * (Watt) | 15.7 | 15.1 4% | 11.7 25% | 11.9 24% | 12.3 22% | 16.5 -5% |
| Load Average * (Watt) | 57.4 | 33 43% | 29 49% | 54 6% | 36 37% | 104 -81% |
| Witcher 3 ultra * (Watt) | 53.3 | |||||
| Load Maximum * (Watt) | 62.3 | 54.6 12% | 45.4 27% | 84 -35% | 55 12% | 129 -107% |
* ... Meglio usare valori piccoli
| HP Pavilion 17z 1EX13AV A12-9720P, Radeon R7 M340, 41.6 Wh | HP Pavilion 17-x110ng i5-7200U, Radeon R7 M440, 41 Wh | Lenovo Ideapad 110-17IKB 80VK0001GE i5-7200U, Radeon R5 M430, 32 Wh | Asus F756UX-T7013T 6200U, GeForce GTX 950M, 38 Wh | Dell Inspiron 17 5759-5118 6200U, Radeon R5 M335, 40 Wh | MSI GL72 7RDX-602 i7-7700HQ, GeForce GTX 1050 Mobile, 43.2 Wh | |
|---|---|---|---|---|---|---|
| Autonomia della batteria | 34% | 5% | 7% | 23% | -25% | |
| Reader / Idle (h) | 6.8 | 8.8 29% | 8.2 21% | 9.6 41% | 5.5 -19% | |
| WiFi v1.3 (h) | 3.9 | 5.8 49% | 4.1 5% | 3.6 -8% | 5 28% | 3.4 -13% |
| Load (h) | 1.2 | 1.5 25% | 1.3 8% | 1.2 0% | 0.7 -42% |
Pro
Contro

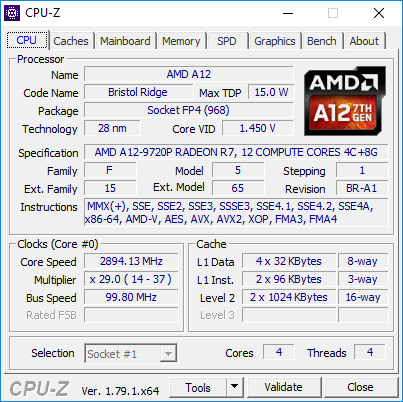
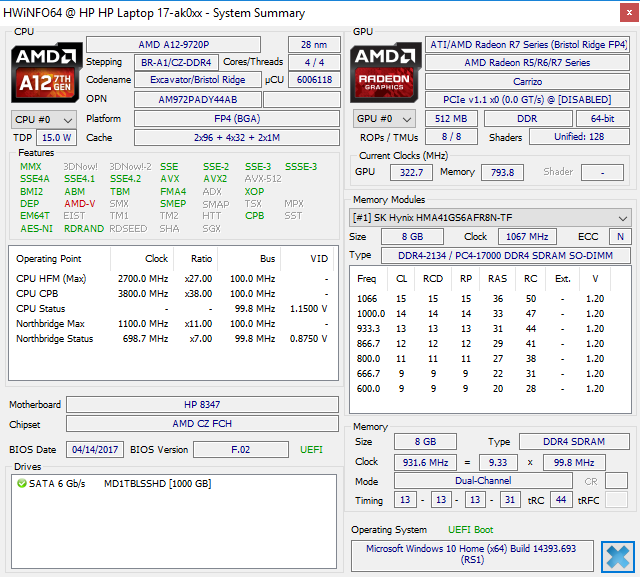
L'APU A12-9720P è un chiaro esempio di quanto AMD è dietro nella gara delle CPU prima dell'avvento dell'architettura Ryzen e Zen. Normalmente quando un processore gira in modo più forte e rumoroso rispetto alla concorrenza, ti aspetti prestazioni superiori. Questo nonv ale per l'A12-9720P che si scalda, fa rumore rispetto alle due vecchie generazioni Core i3-5010U. I programmi sono lenti nell'avvio ed installazione anche per un sistema HDD-based.
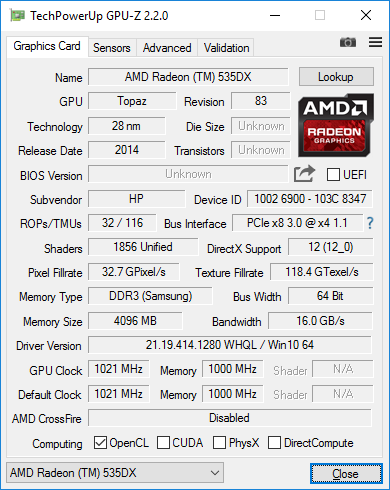
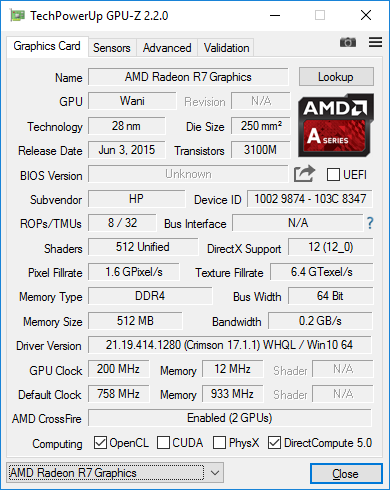
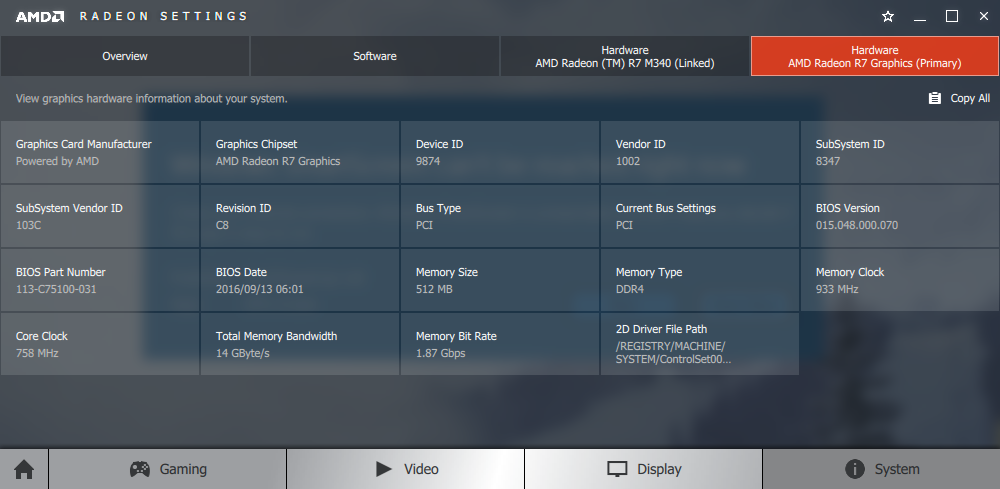
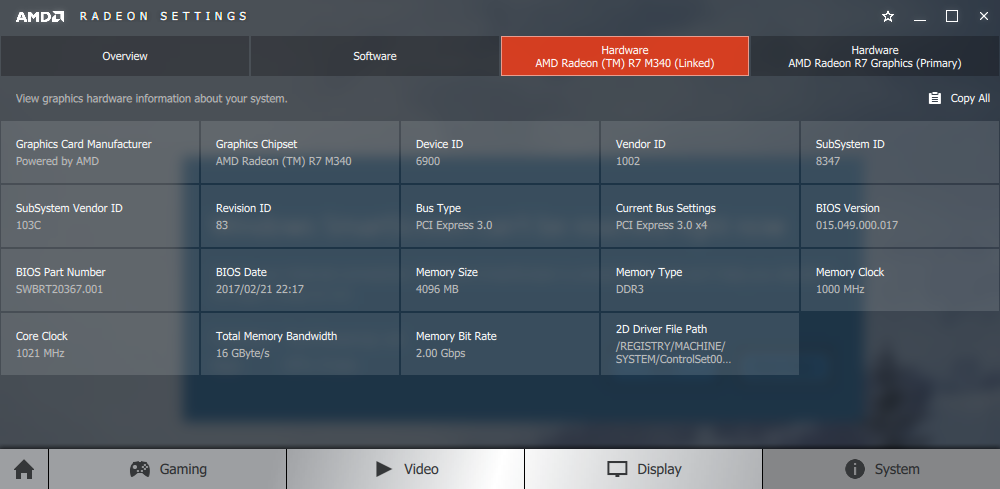
Per la GPU, la Radeon R7 M340 non è male in quanto compete con la GTX 950M. Il principale problema è legato alla CPU molto lenta quindi le prestazioni gaming sono nettamente inferiori rispetto ad un portatile con GTX 950M. Questo collo di bottiglia impedisce al Pavilion 17z di essere un portatile mainstream gaming economico e mette in discussione l'utilizzo della R7 M340. La GPU assorbe solo più energia e si scalda, riducendo l'autonomia senza alcun vantaggio.
Oltre alle critiche ad AMD, l'hardware del Pavilion 17z e decente, ma non spettacolare, considerando il prezzo contenuto. Colori e contrasto sono molto buoni per un portatile economico, ma per il resto il pannello è granuloso e le superfici in plastica lasciano a desiderare.
Avrete ciò che pagate. L'AMD-powered Pavilion 17z è sicuramente meno costoso di un pari Intel, ma performance ed autonomia sono troppo scarse.
Nota: si tratta di una recensione breve, con alcune sezioni non tradotte, per la versione integrale in inglese guardate qui.
HP Pavilion 17z 1EX13AV
- 07/14/2017 v6 (old)
Allen Ngo
Price comparison
