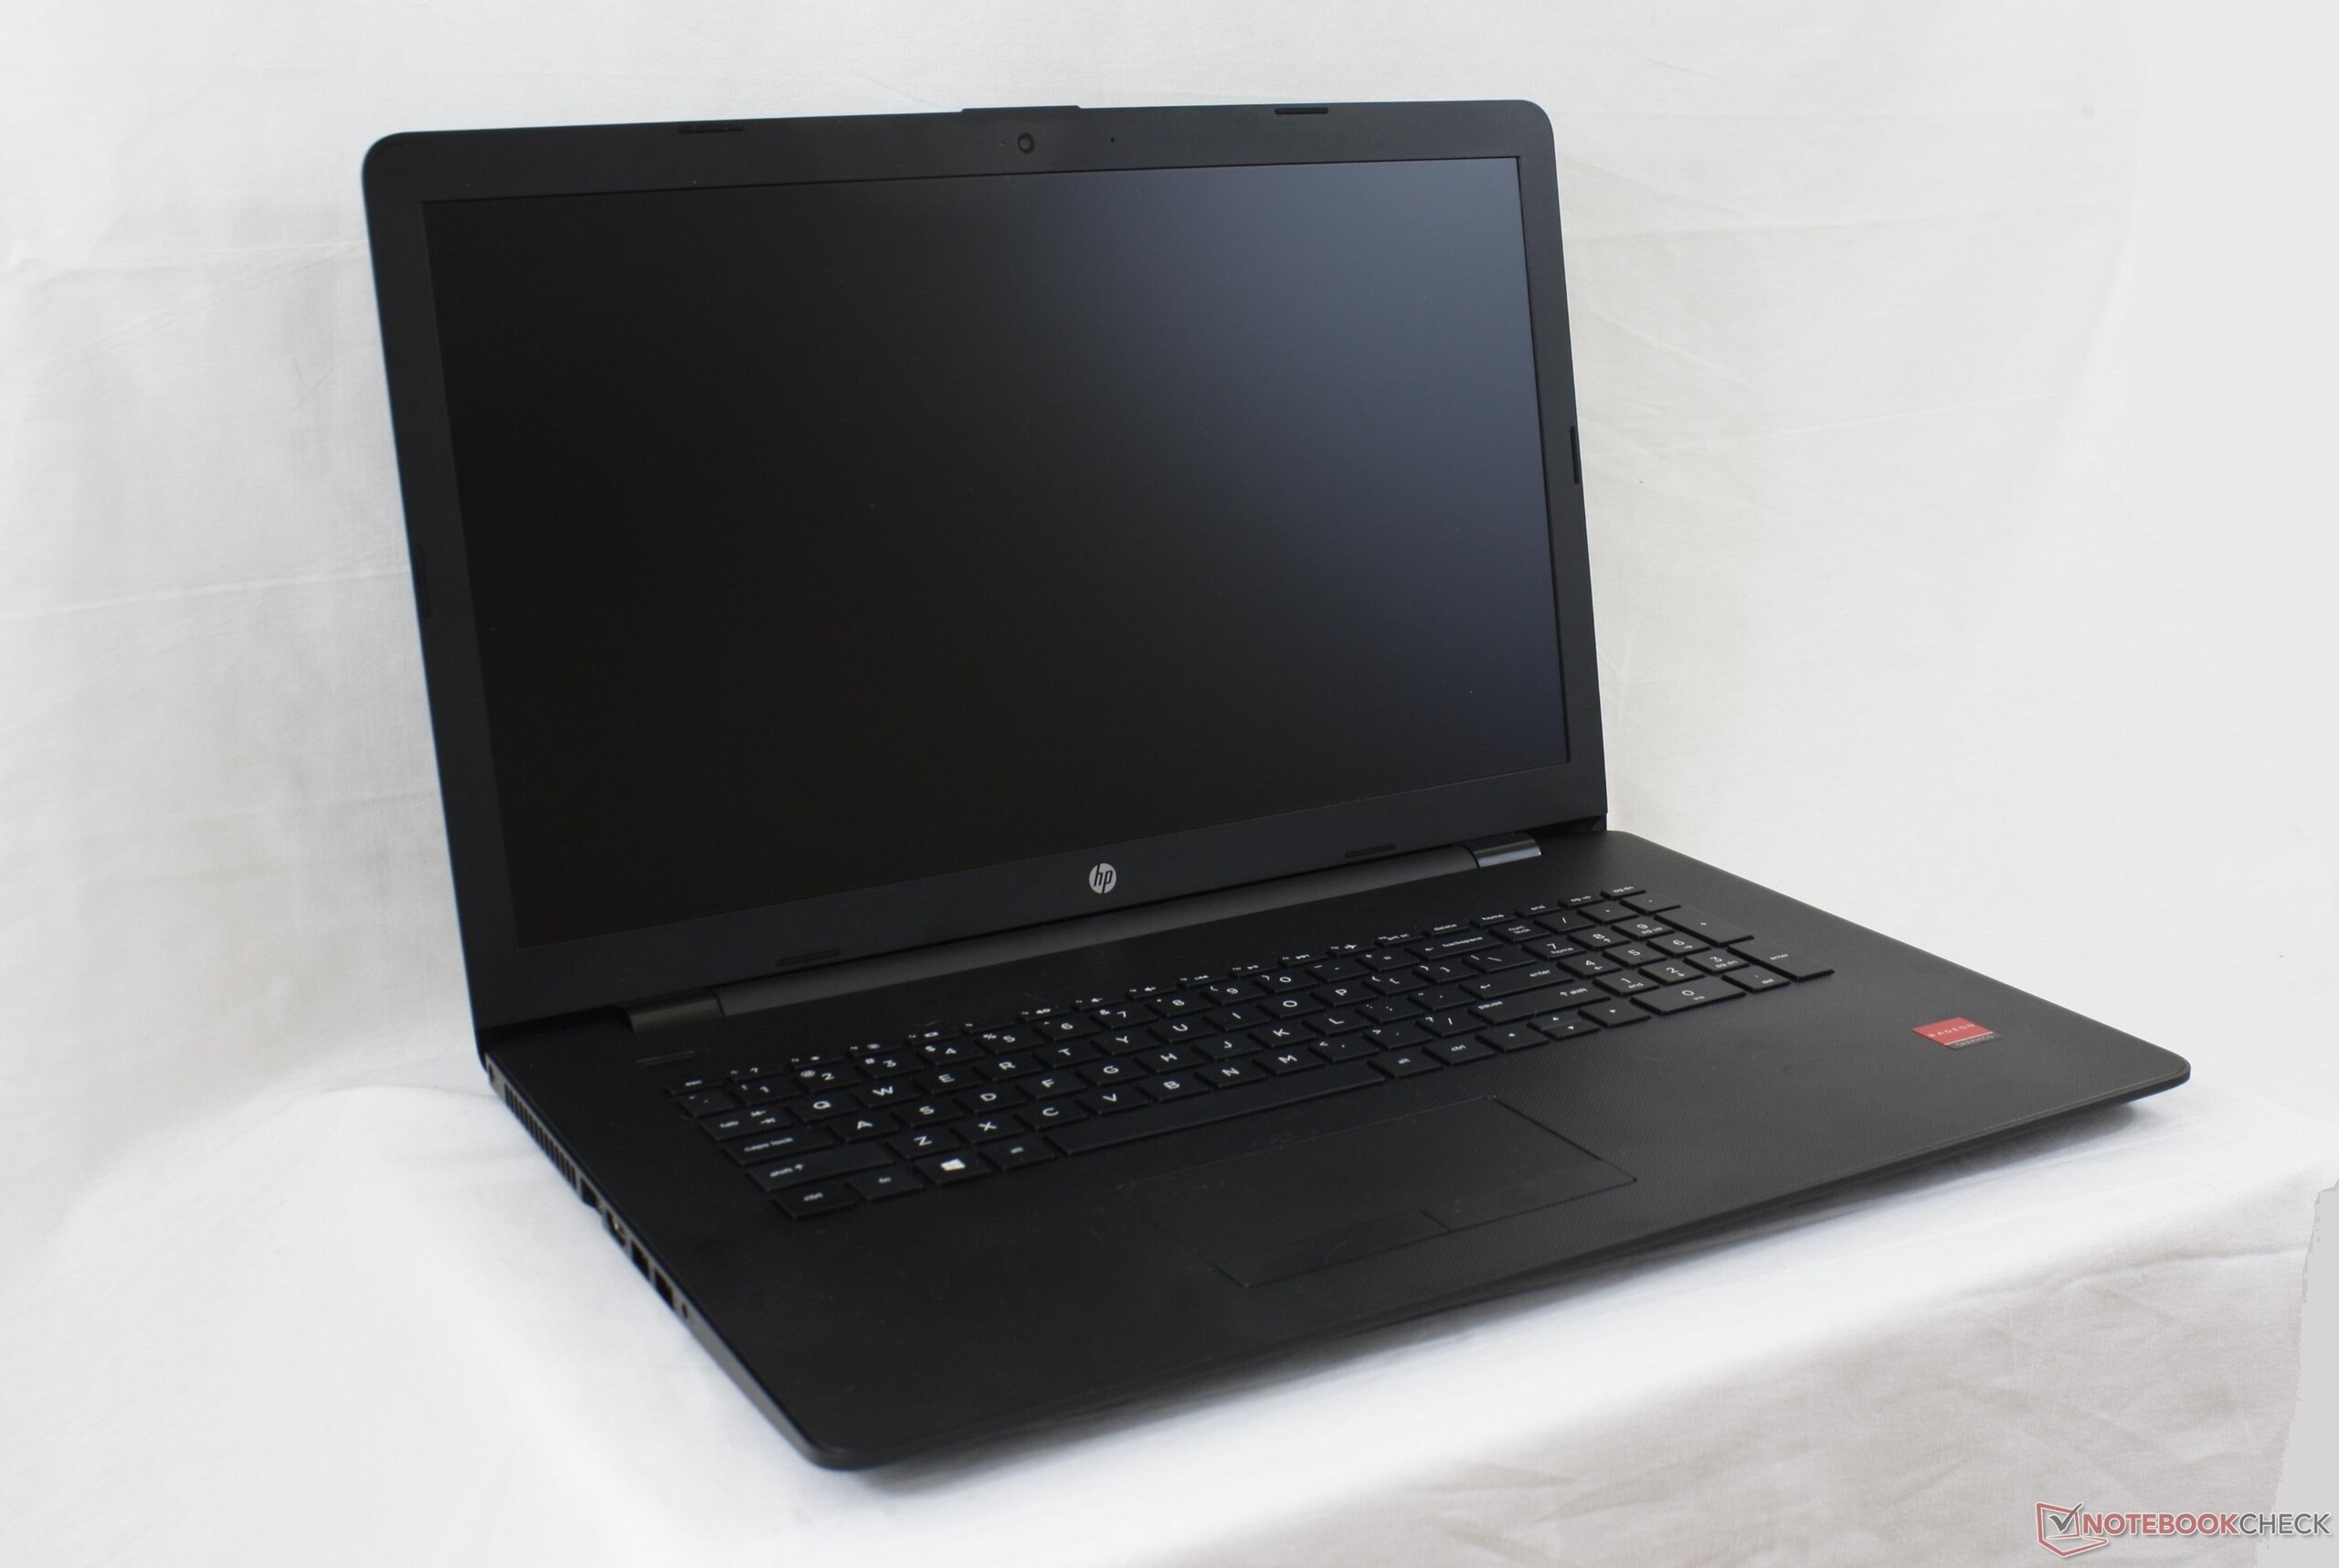
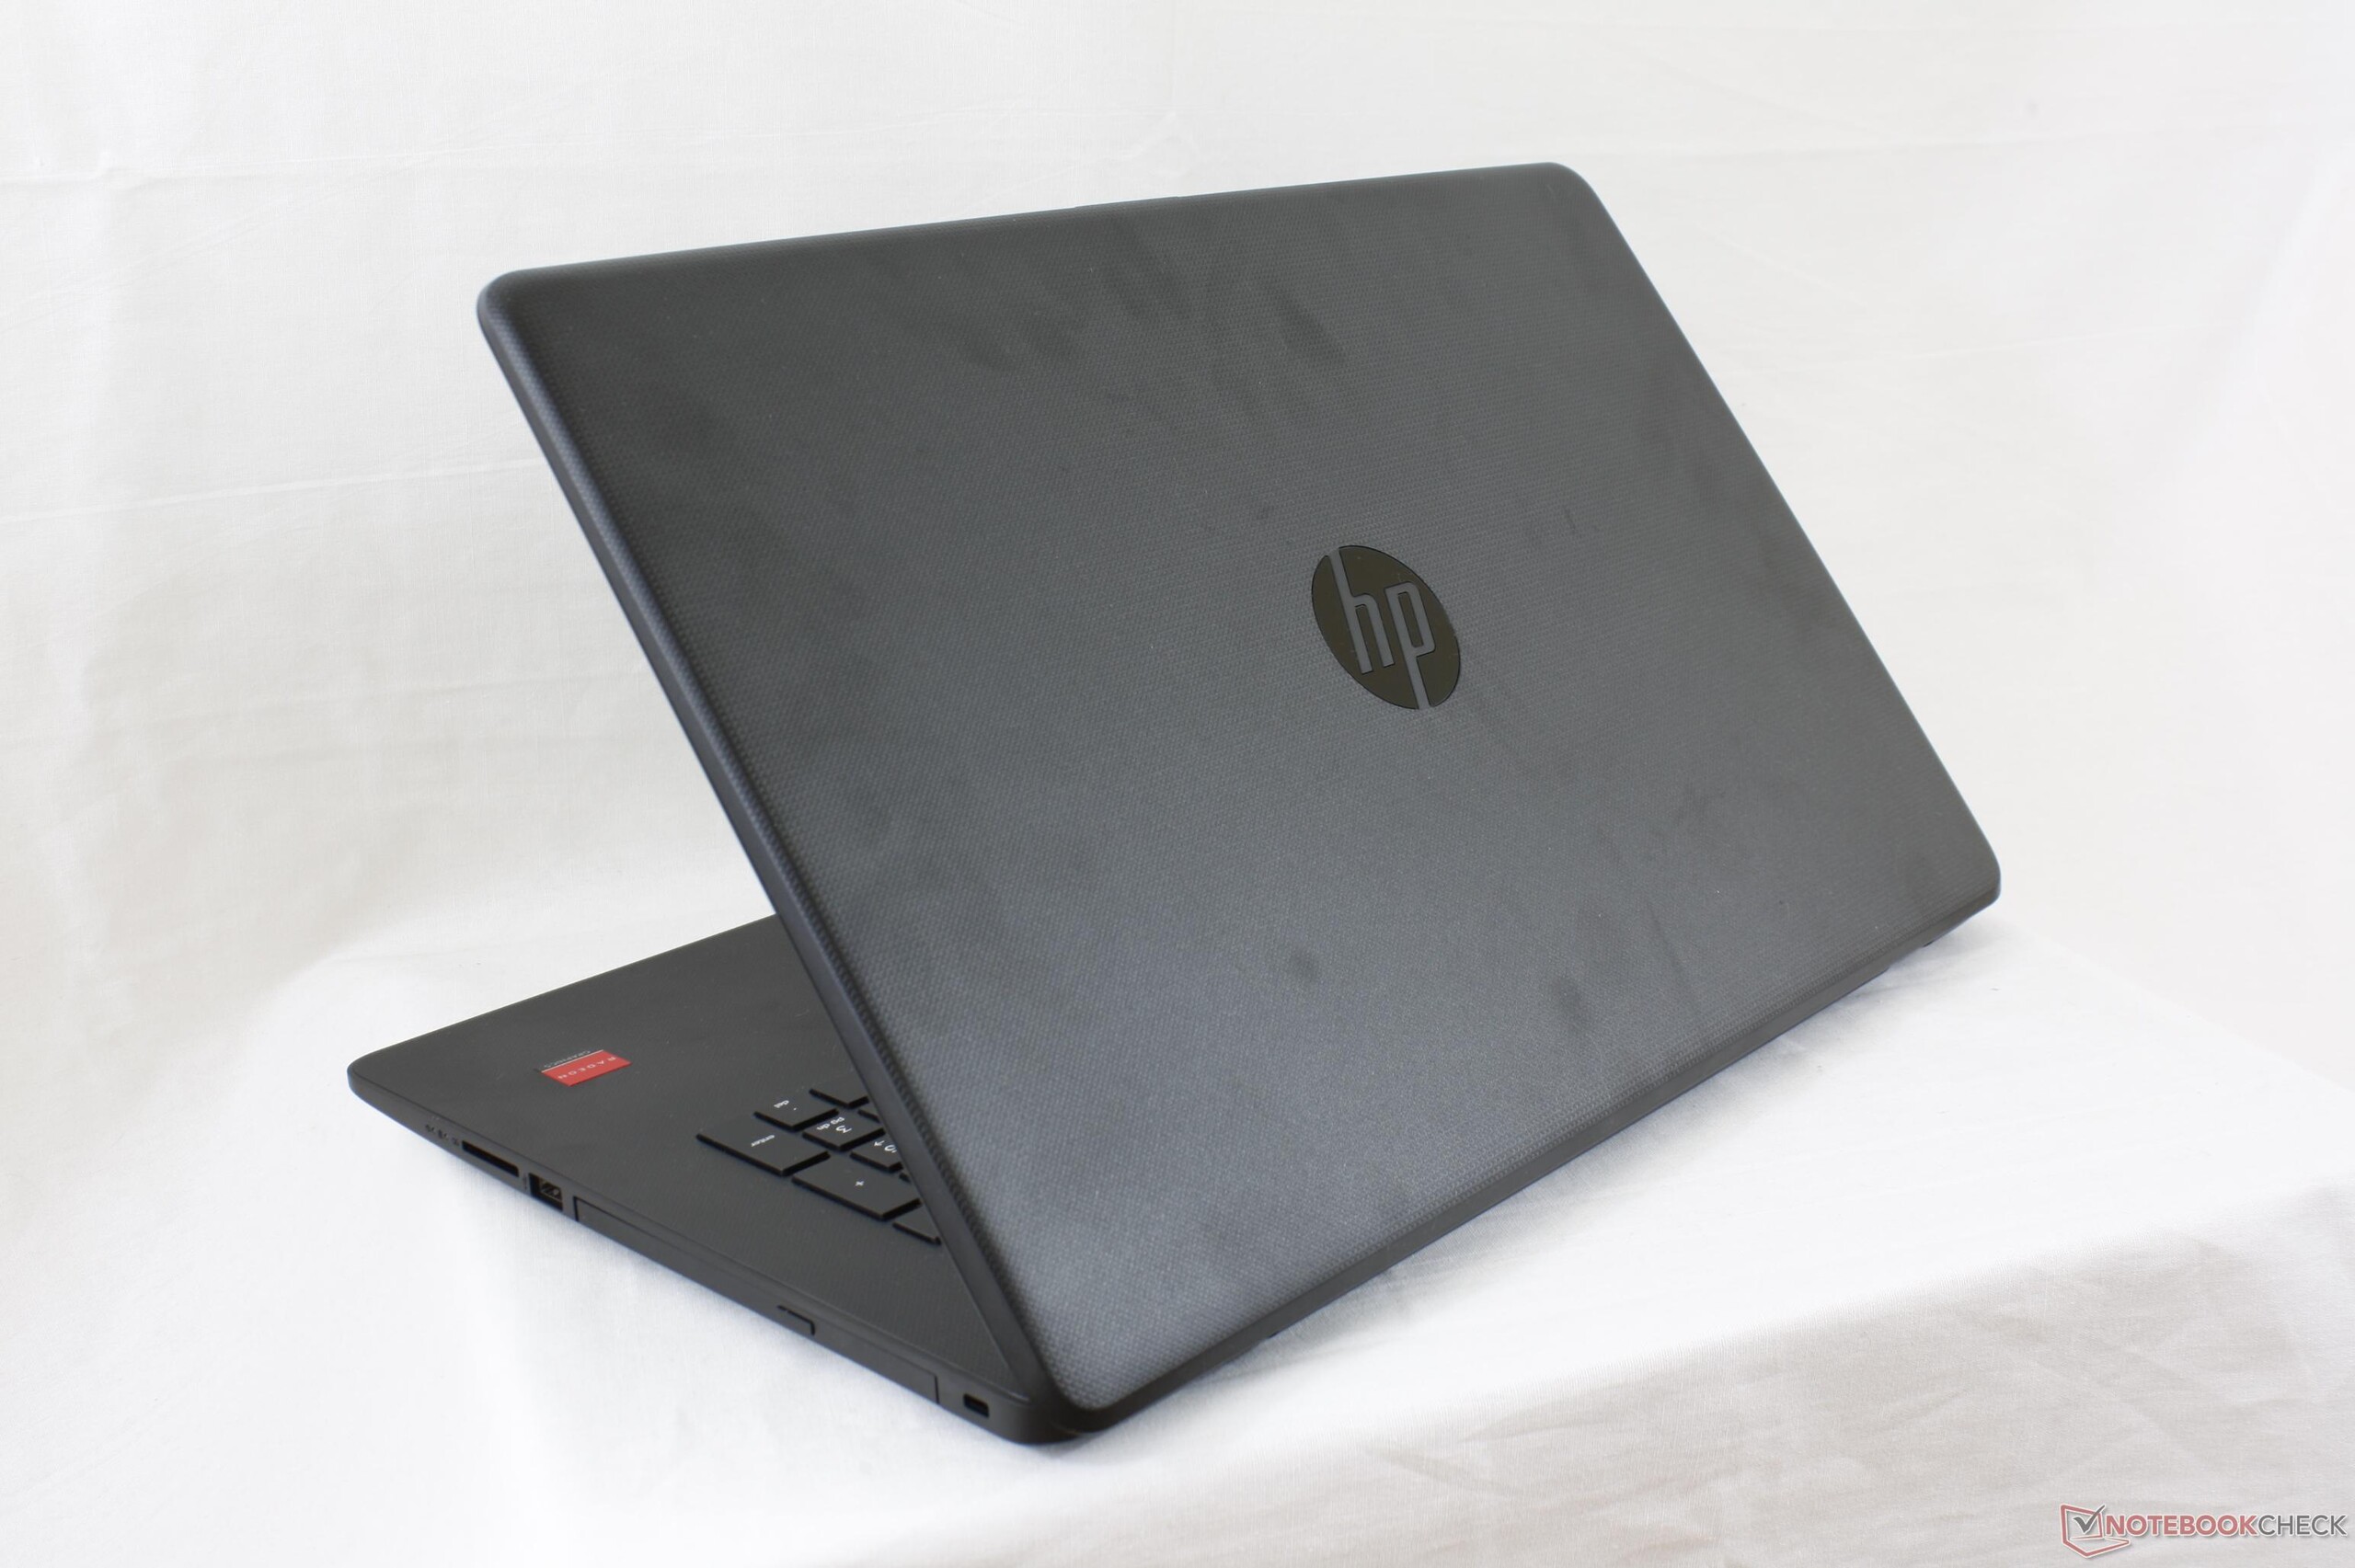
Recensione breve del Portatile HP Pavilion 17z-ak000 (A9-9420, Radeon 530)
| SD Card Reader | |
| average JPG Copy Test (av. of 3 runs) | |
| HP Pavilion Power 15t-cb2000 | |
| HP Pavilion 17z 1EX13AV | |
| Lenovo Thinkpad 13-20J1001BUS | |
| maximum AS SSD Seq Read Test (1GB) | |
| HP Pavilion Power 15t-cb2000 | |
| HP Pavilion 17z 1EX13AV | |
| Lenovo Thinkpad 13-20J1001BUS | |
| Networking | |
| iperf3 transmit AX12 | |
| Lenovo Thinkpad 13-20J1001BUS | |
| HP Pavilion Power 15t-cb2000 | |
| HP Pavilion 17z 1EX13AV | |
| iperf3 receive AX12 | |
| Lenovo Thinkpad 13-20J1001BUS | |
| HP Pavilion Power 15t-cb2000 | |
| HP Pavilion 17z 1EX13AV | |
| |||||||||||||||||||||||||
Distribuzione della luminosità: 90 %
Al centro con la batteria: 363.6 cd/m²
Contrasto: 983:1 (Nero: 0.37 cd/m²)
ΔE ColorChecker Calman: 5.8 | ∀{0.5-29.43 Ø4.73}
ΔE Greyscale Calman: 8.8 | ∀{0.09-98 Ø4.97}
87.3% sRGB (Argyll 1.6.3 3D)
57.2% AdobeRGB 1998 (Argyll 1.6.3 3D)
64% AdobeRGB 1998 (Argyll 3D)
87.5% sRGB (Argyll 3D)
64.8% Display P3 (Argyll 3D)
Gamma: 2.16
CCT: 5900 K
| HP Pavilion 17z 1EX13AV ID: AUO109D, Name: AU Optronics B173HW01 V0, IPS, 17.3", 1920x1080 | HP Pavilion 17z 1EX13AV ID: AUO109D, Name: AU Optronics B173HW01 V0, IPS, 17.3", 1920x1080 | HP Pavilion Power 15t-cb2000 AUO41ED , IPS, 15.6", 1920x1080 | Lenovo V510-15IKB 80WQ0002GE LG Philips LP156WF6-SPK3, IPS, 15.6", 1920x1080 | Asus X555DA-BB11 TN LED, 15.6", 1920x1080 | |
|---|---|---|---|---|---|
| Display | 0% | -36% | -37% | -43% | |
| Display P3 Coverage (%) | 64.8 | 64.3 -1% | 39.28 -39% | 38.8 -40% | 35.12 -46% |
| sRGB Coverage (%) | 87.5 | 88.5 1% | 58.9 -33% | 58.1 -34% | 52.7 -40% |
| AdobeRGB 1998 Coverage (%) | 64 | 64.6 1% | 40.59 -37% | 40.12 -37% | 36.29 -43% |
| Response Times | -9% | -30% | -13% | -3% | |
| Response Time Grey 50% / Grey 80% * (ms) | 34 ? | 40.8 ? -20% | 51.6 ? -52% | 39 ? -15% | 42 ? -24% |
| Response Time Black / White * (ms) | 27.2 ? | 26.4 ? 3% | 29.2 ? -7% | 30 ? -10% | 22.4 ? 18% |
| PWM Frequency (Hz) | 20000 ? | ||||
| Screen | 12% | -9% | -7% | -26% | |
| Brightness middle (cd/m²) | 363.6 | 333.5 -8% | 256 -30% | 256 -30% | 242.7 -33% |
| Brightness (cd/m²) | 349 | 323 -7% | 241 -31% | 252 -28% | 232 -34% |
| Brightness Distribution (%) | 90 | 91 1% | 88 -2% | 87 -3% | 88 -2% |
| Black Level * (cd/m²) | 0.37 | 0.32 14% | 0.21 43% | 0.3 19% | 0.52 -41% |
| Contrast (:1) | 983 | 1042 6% | 1219 24% | 853 -13% | 467 -52% |
| Colorchecker dE 2000 * | 5.8 | 4 31% | 5.2 10% | 5.4 7% | 4.9 16% |
| Colorchecker dE 2000 max. * | 10 | 6.9 31% | 19.3 -93% | 9.36 6% | 20.3 -103% |
| Greyscale dE 2000 * | 8.8 | 4.5 49% | 3.5 60% | 5.37 39% | 2.7 69% |
| Gamma | 2.16 102% | 2.19 100% | 2.35 94% | 2.58 85% | 2.34 94% |
| CCT | 5900 110% | 6386 102% | 6576 99% | 6795 96% | 6876 95% |
| Color Space (Percent of AdobeRGB 1998) (%) | 57.2 | 57.5 1% | 37 -35% | 37 -35% | 33.5 -41% |
| Color Space (Percent of sRGB) (%) | 87.3 | 88.1 1% | 59 -32% | 58 -34% | 52.5 -40% |
| Media totale (Programma / Settaggio) | 1% /
7% | -25% /
-17% | -19% /
-14% | -24% /
-26% |
* ... Meglio usare valori piccoli
Tempi di risposta del Display
| ↔ Tempi di risposta dal Nero al Bianco | ||
|---|---|---|
| 27.2 ms ... aumenta ↗ e diminuisce ↘ combinato | ↗ 16.4 ms Incremento | 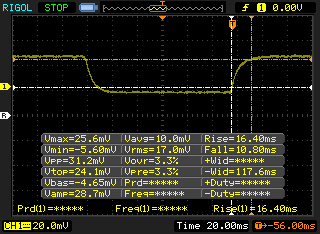 |
| ↘ 10.8 ms Calo | ||
| Lo schermo mostra tempi di risposta relativamente lenti nei nostri tests e potrebbe essere troppo lento per i gamers. In confronto, tutti i dispositivi di test variano da 0.1 (minimo) a 240 (massimo) ms. » 69 % di tutti i dispositivi è migliore. Questo significa che i tempi di risposta rilevati sono peggiori rispetto alla media di tutti i dispositivi testati (19.9 ms). | ||
| ↔ Tempo di risposta dal 50% Grigio all'80% Grigio | ||
| 34 ms ... aumenta ↗ e diminuisce ↘ combinato | ↗ 15.6 ms Incremento | 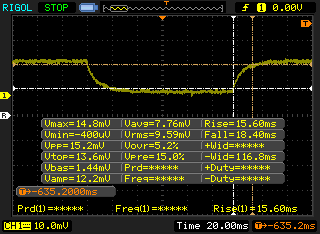 |
| ↘ 18.4 ms Calo | ||
| Lo schermo mostra tempi di risposta lenti nei nostri tests e sarà insoddisfacente per i gamers. In confronto, tutti i dispositivi di test variano da 0.165 (minimo) a 636 (massimo) ms. » 47 % di tutti i dispositivi è migliore. Questo significa che i tempi di risposta rilevati sono simili alla media di tutti i dispositivi testati (31.1 ms). | ||
Sfarfallio dello schermo / PWM (Pulse-Width Modulation)
| flickering dello schermo / PWM non rilevato | 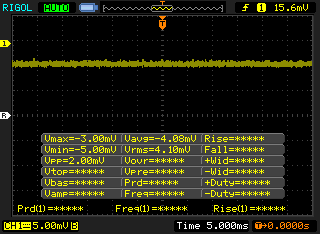 | ||
In confronto: 52 % di tutti i dispositivi testati non utilizza PWM per ridurre la luminosita' del display. Se è rilevato PWM, una media di 7794 (minimo: 5 - massimo: 343500) Hz è stata rilevata. | |||
| wPrime 2.10 - 1024m | |
| HP 15-bw077ax | |
| HP Pavilion 14t-ab000 K9E07AV | |
| HP Pavilion 17z 1EX13AV | |
| Lenovo Thinkpad 13-20J1001BUS | |
| HP EliteBook 725 G4 | |
| HP Pavilion 15z-bw000 | |
| HP Pavilion 17z 1EX13AV | |
* ... Meglio usare valori piccoli
| PCMark 8 | |
| Home Score Accelerated v2 | |
| HP Pavilion Power 15t-cb2000 | |
| Toshiba Satellite Pro R50-C-16V | |
| HP Pavilion 17z 1EX13AV | |
| Asus X555DA-BB11 | |
| Work Score Accelerated v2 | |
| HP Pavilion Power 15t-cb2000 | |
| HP Pavilion 17z 1EX13AV | |
| Toshiba Satellite Pro R50-C-16V | |
| Asus X555DA-BB11 | |
| Creative Score Accelerated v2 | |
| HP Pavilion Power 15t-cb2000 | |
| Toshiba Satellite Pro R50-C-16V | |
| HP Pavilion 17z 1EX13AV | |
| Asus X555DA-BB11 | |
| PCMark 8 Home Score Accelerated v2 | 2897 punti | |
| PCMark 8 Creative Score Accelerated v2 | 3174 punti | |
| PCMark 8 Work Score Accelerated v2 | 3976 punti | |
| PCMark 10 Score | 2046 punti | |
Aiuto | ||
| HP Pavilion 17z 1EX13AV Avolusion MD1TBLSSHD | Asus X555DA-BB11 Seagate Momentus SpinPoint M8 ST1000LM024 HN-M101MBB | Toshiba Satellite Pro R50-C-16V TOSHIBA MQ01ABD075 | Lenovo V510-15IKB 80WQ0002GE Samsung CM871a MZNTY256HDHP | HP Pavilion 17z 1EX13AV WDC Scorpio Blue WD10JPVX-60JC3T1 | |
|---|---|---|---|---|---|
| CrystalDiskMark 3.0 | -2% | -15% | 13527% | 2% | |
| Read Seq (MB/s) | 90 | 106.9 19% | 96.5 7% | 532 491% | 90 0% |
| Write Seq (MB/s) | 93.4 | 97.5 4% | 77.9 -17% | 511 447% | 90.3 -3% |
| Read 512 (MB/s) | 28.71 | 32.28 12% | 20.82 -27% | 414.8 1345% | 28.47 -1% |
| Write 512 (MB/s) | 44.35 | 35.39 -20% | 19.83 -55% | 307.7 594% | 47.07 6% |
| Read 4k (MB/s) | 0.316 | 0.373 18% | 0.342 8% | 39.51 12403% | 0.31 -2% |
| Write 4k (MB/s) | 0.813 | 0.636 -22% | 0.836 3% | 108.1 13196% | 0.3997 -51% |
| Read 4k QD32 (MB/s) | 0.711 | 0.694 -2% | 0.595 -16% | 361.6 50758% | 1.021 44% |
| Write 4k QD32 (MB/s) | 0.87 | 0.682 -22% | 0.706 -19% | 253 28980% | 1.076 24% |

| 3DMark 11 Performance | 2121 punti | |
| 3DMark Ice Storm Standard Score | 40215 punti | |
| 3DMark Cloud Gate Standard Score | 3749 punti | |
| 3DMark Fire Strike Score | 1062 punti | |
Aiuto | ||
| Doom - 1280x720 Low Preset | |
| Apple MacBook Pro 13 2016 | |
| HP Pavilion 17z 1EX13AV | |
| HP Pavilion 17z 1EX13AV | |
| Overwatch - 1280x720 Low (Render Scale 100 %) AA:FX AF:1x | |
| Acer Aspire E5-575G-549D | |
| Apple MacBook Pro 13 2016 | |
| Samsung Notebook 9 NP900X5N-X01US | |
| Microsoft Surface Pro (2017) i7 | |
| HP Pavilion 17z 1EX13AV | |
| HP Pavilion 17z 1EX13AV | |
| basso | medio | alto | ultra | |
|---|---|---|---|---|
| StarCraft II: Heart of the Swarm (2013) | 71.5 | 43.4 | 35.2 | 21.9 |
| BioShock Infinite (2013) | 61.7 | 41.7 | 33.8 | 11.9 |
| The Witcher 3 (2015) | 24 | |||
| Batman: Arkham Knight (2015) | 13 | |||
| Rise of the Tomb Raider (2016) | 26.1 | 14.7 | ||
| Doom (2016) | 16.8 | |||
| Overwatch (2016) | 35.8 | 30.4 |
Rumorosità
| Idle |
| 30.5 / 30.6 / 30.6 dB(A) |
| Sotto carico |
| 41.6 / 48 dB(A) |
 | ||
30 dB silenzioso 40 dB(A) udibile 50 dB(A) rumoroso |
||
min: | ||
| HP Pavilion 17z 1EX13AV Radeon 530, A9-9420, Avolusion MD1TBLSSHD | HP Pavilion 17z 1EX13AV Radeon R7 M340, A12-9720P, WDC Scorpio Blue WD10JPVX-60JC3T1 | Asus X555DA-BB11 Radeon R6 (Carrizo), A10-8700P, Seagate Momentus SpinPoint M8 ST1000LM024 HN-M101MBB | Toshiba Satellite Pro R50-C-16V HD Graphics 520, 6006U, TOSHIBA MQ01ABD075 | Lenovo V510-15IKB 80WQ0002GE HD Graphics 620, i5-7200U, Samsung CM871a MZNTY256HDHP | Acer Aspire E5-574-53YZ Iris Graphics 550, 6267U, Toshiba MQ02ABD100H | |
|---|---|---|---|---|---|---|
| Noise | 2% | 5% | 6% | 6% | 2% | |
| off /ambiente * (dB) | 28 | 28 -0% | 28.9 -3% | 30.4 -9% | 30.2 -8% | 28.8 -3% |
| Idle Minimum * (dB) | 30.5 | 30.4 -0% | 31.6 -4% | 31.8 -4% | 30.2 1% | 31 -2% |
| Idle Average * (dB) | 30.6 | 30.5 -0% | 32 -5% | 31.8 -4% | 30.2 1% | 31 -1% |
| Idle Maximum * (dB) | 30.6 | 30.5 -0% | 32.4 -6% | 31.8 -4% | 32 -5% | 31 -1% |
| Load Average * (dB) | 41.6 | 41.5 -0% | 33.3 20% | 31.9 23% | 34.7 17% | 39.1 6% |
| Witcher 3 ultra * (dB) | 48 | 41.8 13% | ||||
| Load Maximum * (dB) | 48 | 48.2 -0% | 35.5 26% | 31.8 34% | 33.9 29% | 41 15% |
* ... Meglio usare valori piccoli
(±) La temperatura massima sul lato superiore è di 40.4 °C / 105 F, rispetto alla media di 36.8 °C / 98 F, che varia da 21 a 71 °C per questa classe Multimedia.
(±) Il lato inferiore si riscalda fino ad un massimo di 45 °C / 113 F, rispetto alla media di 39.1 °C / 102 F
(+) In idle, la temperatura media del lato superiore è di 25.3 °C / 78 F, rispetto alla media deld ispositivo di 31.3 °C / 88 F.
(+) I poggiapolsi e il touchpad sono piu' freddi della temperatura della pelle con un massimo di 30.8 °C / 87.4 F e sono quindi freddi al tatto.
(-) La temperatura media della zona del palmo della mano di dispositivi simili e'stata di 28.7 °C / 83.7 F (-2.1 °C / -3.7 F).
HP Pavilion 17z 1EX13AV analisi audio
(-) | altoparlanti non molto potenti (61.5 dB)
Bassi 100 - 315 Hz
(±) | bassi ridotti - in media 14.7% inferiori alla media
(-) | bassi non lineari (15.8% delta rispetto alla precedente frequenza)
Medi 400 - 2000 Hz
(+) | medi bilanciati - solo only 2.5% rispetto alla media
(±) | linearità dei medi adeguata (10.6% delta rispetto alla precedente frequenza)
Alti 2 - 16 kHz
(+) | Alti bilanciati - appena 4.5% dalla media
(-) | alti non lineari (15.2% delta rispetto alla precedente frequenza)
Nel complesso 100 - 16.000 Hz
(±) | la linearità complessiva del suono è media (24.7% di differenza rispetto alla media
Rispetto alla stessa classe
» 87% di tutti i dispositivi testati in questa classe è stato migliore, 5% simile, 8% peggiore
» Il migliore ha avuto un delta di 5%, medio di 17%, peggiore di 45%
Rispetto a tutti i dispositivi testati
» 75% di tutti i dispositivi testati in questa classe è stato migliore, 5% similare, 20% peggiore
» Il migliore ha avuto un delta di 4%, medio di 24%, peggiore di 134%
Apple MacBook 12 (Early 2016) 1.1 GHz analisi audio
(+) | gli altoparlanti sono relativamente potenti (83.6 dB)
Bassi 100 - 315 Hz
(±) | bassi ridotti - in media 11.3% inferiori alla media
(±) | la linearità dei bassi è media (14.2% delta rispetto alla precedente frequenza)
Medi 400 - 2000 Hz
(+) | medi bilanciati - solo only 2.4% rispetto alla media
(+) | medi lineari (5.5% delta rispetto alla precedente frequenza)
Alti 2 - 16 kHz
(+) | Alti bilanciati - appena 2% dalla media
(+) | alti lineari (4.5% delta rispetto alla precedente frequenza)
Nel complesso 100 - 16.000 Hz
(+) | suono nel complesso lineare (10.2% differenza dalla media)
Rispetto alla stessa classe
» 7% di tutti i dispositivi testati in questa classe è stato migliore, 2% simile, 91% peggiore
» Il migliore ha avuto un delta di 5%, medio di 18%, peggiore di 53%
Rispetto a tutti i dispositivi testati
» 5% di tutti i dispositivi testati in questa classe è stato migliore, 1% similare, 94% peggiore
» Il migliore ha avuto un delta di 4%, medio di 24%, peggiore di 134%
| Off / Standby | |
| Idle | |
| Sotto carico |
|
Leggenda:
min: | |
| HP Pavilion 17z 1EX13AV A9-9420, Radeon 530, Avolusion MD1TBLSSHD, IPS, 1920x1080, 17.3" | HP 17-x066ng 6006U, HD Graphics 520, WDC WD10JPVX-08JC3T5, IPS, 1920x1080, 17.3" | Asus X555DA-BB11 A10-8700P, Radeon R6 (Carrizo), Seagate Momentus SpinPoint M8 ST1000LM024 HN-M101MBB, TN LED, 1920x1080, 15.6" | Lenovo V510-15IKB 80WQ0002GE i5-7200U, HD Graphics 620, Samsung CM871a MZNTY256HDHP, IPS, 1920x1080, 15.6" | Acer Aspire F5-771G-50RD i5-7200U, GeForce GTX 950M, Toshiba MQ01ABD100, TN, 1920x1080, 17.3" | |
|---|---|---|---|---|---|
| Power Consumption | 39% | 28% | 43% | 14% | |
| Idle Minimum * (Watt) | 8.4 | 5.5 35% | 8.3 1% | 4 52% | 6.9 18% |
| Idle Average * (Watt) | 11.7 | 9.9 15% | 8.6 26% | 9.6 18% | 13.6 -16% |
| Idle Maximum * (Watt) | 24.1 | 14.6 39% | 13.1 46% | 9.7 60% | 14.8 39% |
| Load Average * (Watt) | 50.4 | 28 44% | 31.2 38% | 27.7 45% | 41 19% |
| Witcher 3 ultra * (Watt) | 58 | 33 43% | |||
| Load Maximum * (Watt) | 62.8 | 24.6 61% | 43.9 30% | 38.4 39% | 75 -19% |
* ... Meglio usare valori piccoli
| HP Pavilion 17z 1EX13AV A9-9420, Radeon 530, 41.6 Wh | HP Pavilion Power 15t-cb2000 i7-7700HQ, Radeon RX 550 (Laptop), 70 Wh | Asus X555DA-BB11 A10-8700P, Radeon R6 (Carrizo), 37 Wh | Toshiba Satellite Pro R50-C-16V 6006U, HD Graphics 520, 44 Wh | Lenovo V510-15IKB 80WQ0002GE i5-7200U, HD Graphics 620, 32 Wh | HP Omen 15-ax213ng i7-7700HQ, GeForce GTX 1050 Ti Mobile, 63.3 Wh | |
|---|---|---|---|---|---|---|
| Autonomia della batteria | 29% | -21% | 28% | -17% | 42% | |
| Reader / Idle (h) | 7.8 | 10.5 35% | 7.3 -6% | 12.8 64% | ||
| WiFi v1.3 (h) | 4.6 | 5.7 24% | 2.9 -37% | 5.9 28% | 3.8 -17% | 7.1 54% |
| Load (h) | 1.5 | 1.9 27% | 1.2 -20% | 1.6 7% |
Pro
Contro

I portatili Pavilion AMD-powered sono sempre stati un test di pazienza. Non solo le prestazioni basse, ma i tempi lunghi per le applicazioni ogni volta. Nessuno vuole aspettare più di 6 secondi per lanciare un documento word o 6 secondi per aprire un file Explorer e ancora di più per Microsoft Edge ed iTunes. Basta questo aspetto per non raccomandare alcun Pavilion AMD con HDDs standard indipendentemente dalla qualità dello chassis e dalle caratteristiche del display.
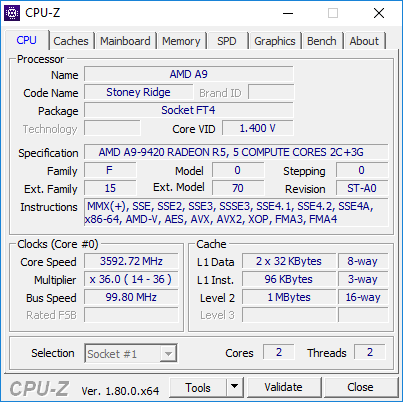
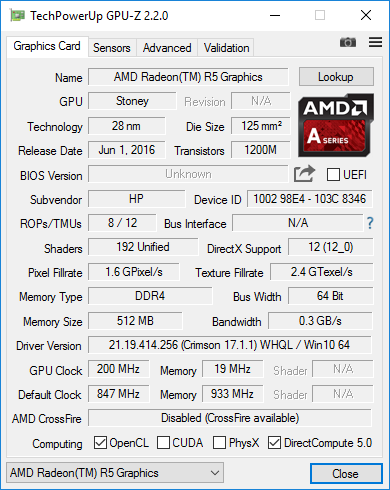
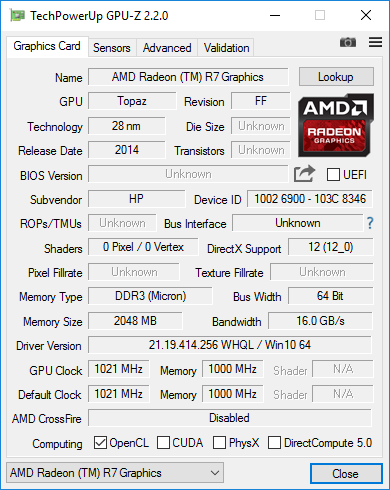
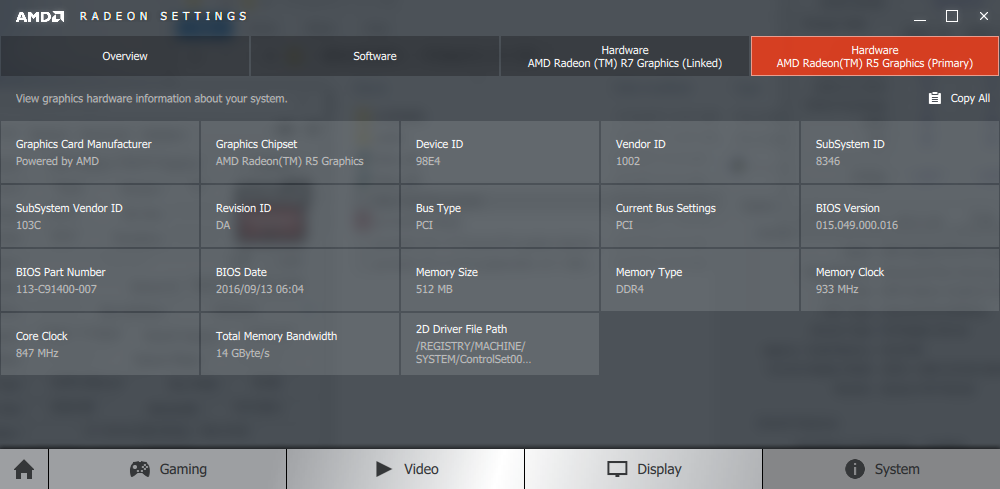
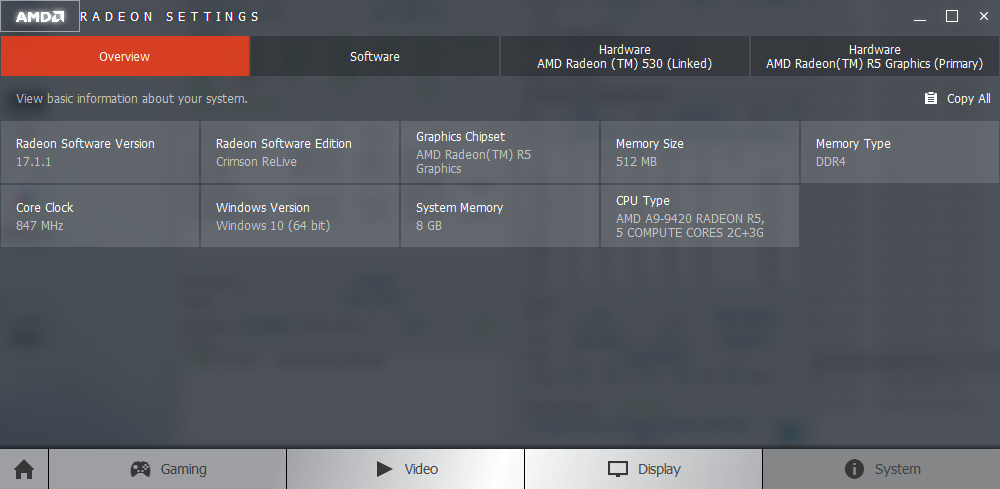
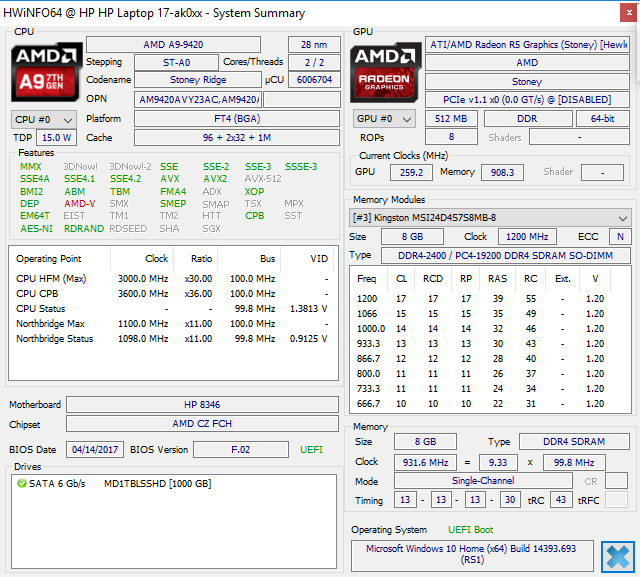
L'APU Stoney Ridge A9 e la GPU Radeon 530 sono sbilanciate tra loro. Come nella precedente SKU A12-9720P Pavilion 17z, le capacità grafiche della nostra configurazione A9 sono limitate dalla lentezza del SoC. I frame rates possono variare tra l'80% della HD Graphics 620 o scendere al 20% in base al gioco ed ai consumi energetici, riducendo l'autonomia e facendo diventare rumorosa la ventola. Una GPU che consuma come la GeForce GTX 950M ma con prestazioni della vecchia Intel Iris o HD Graphics series fa innervosire.
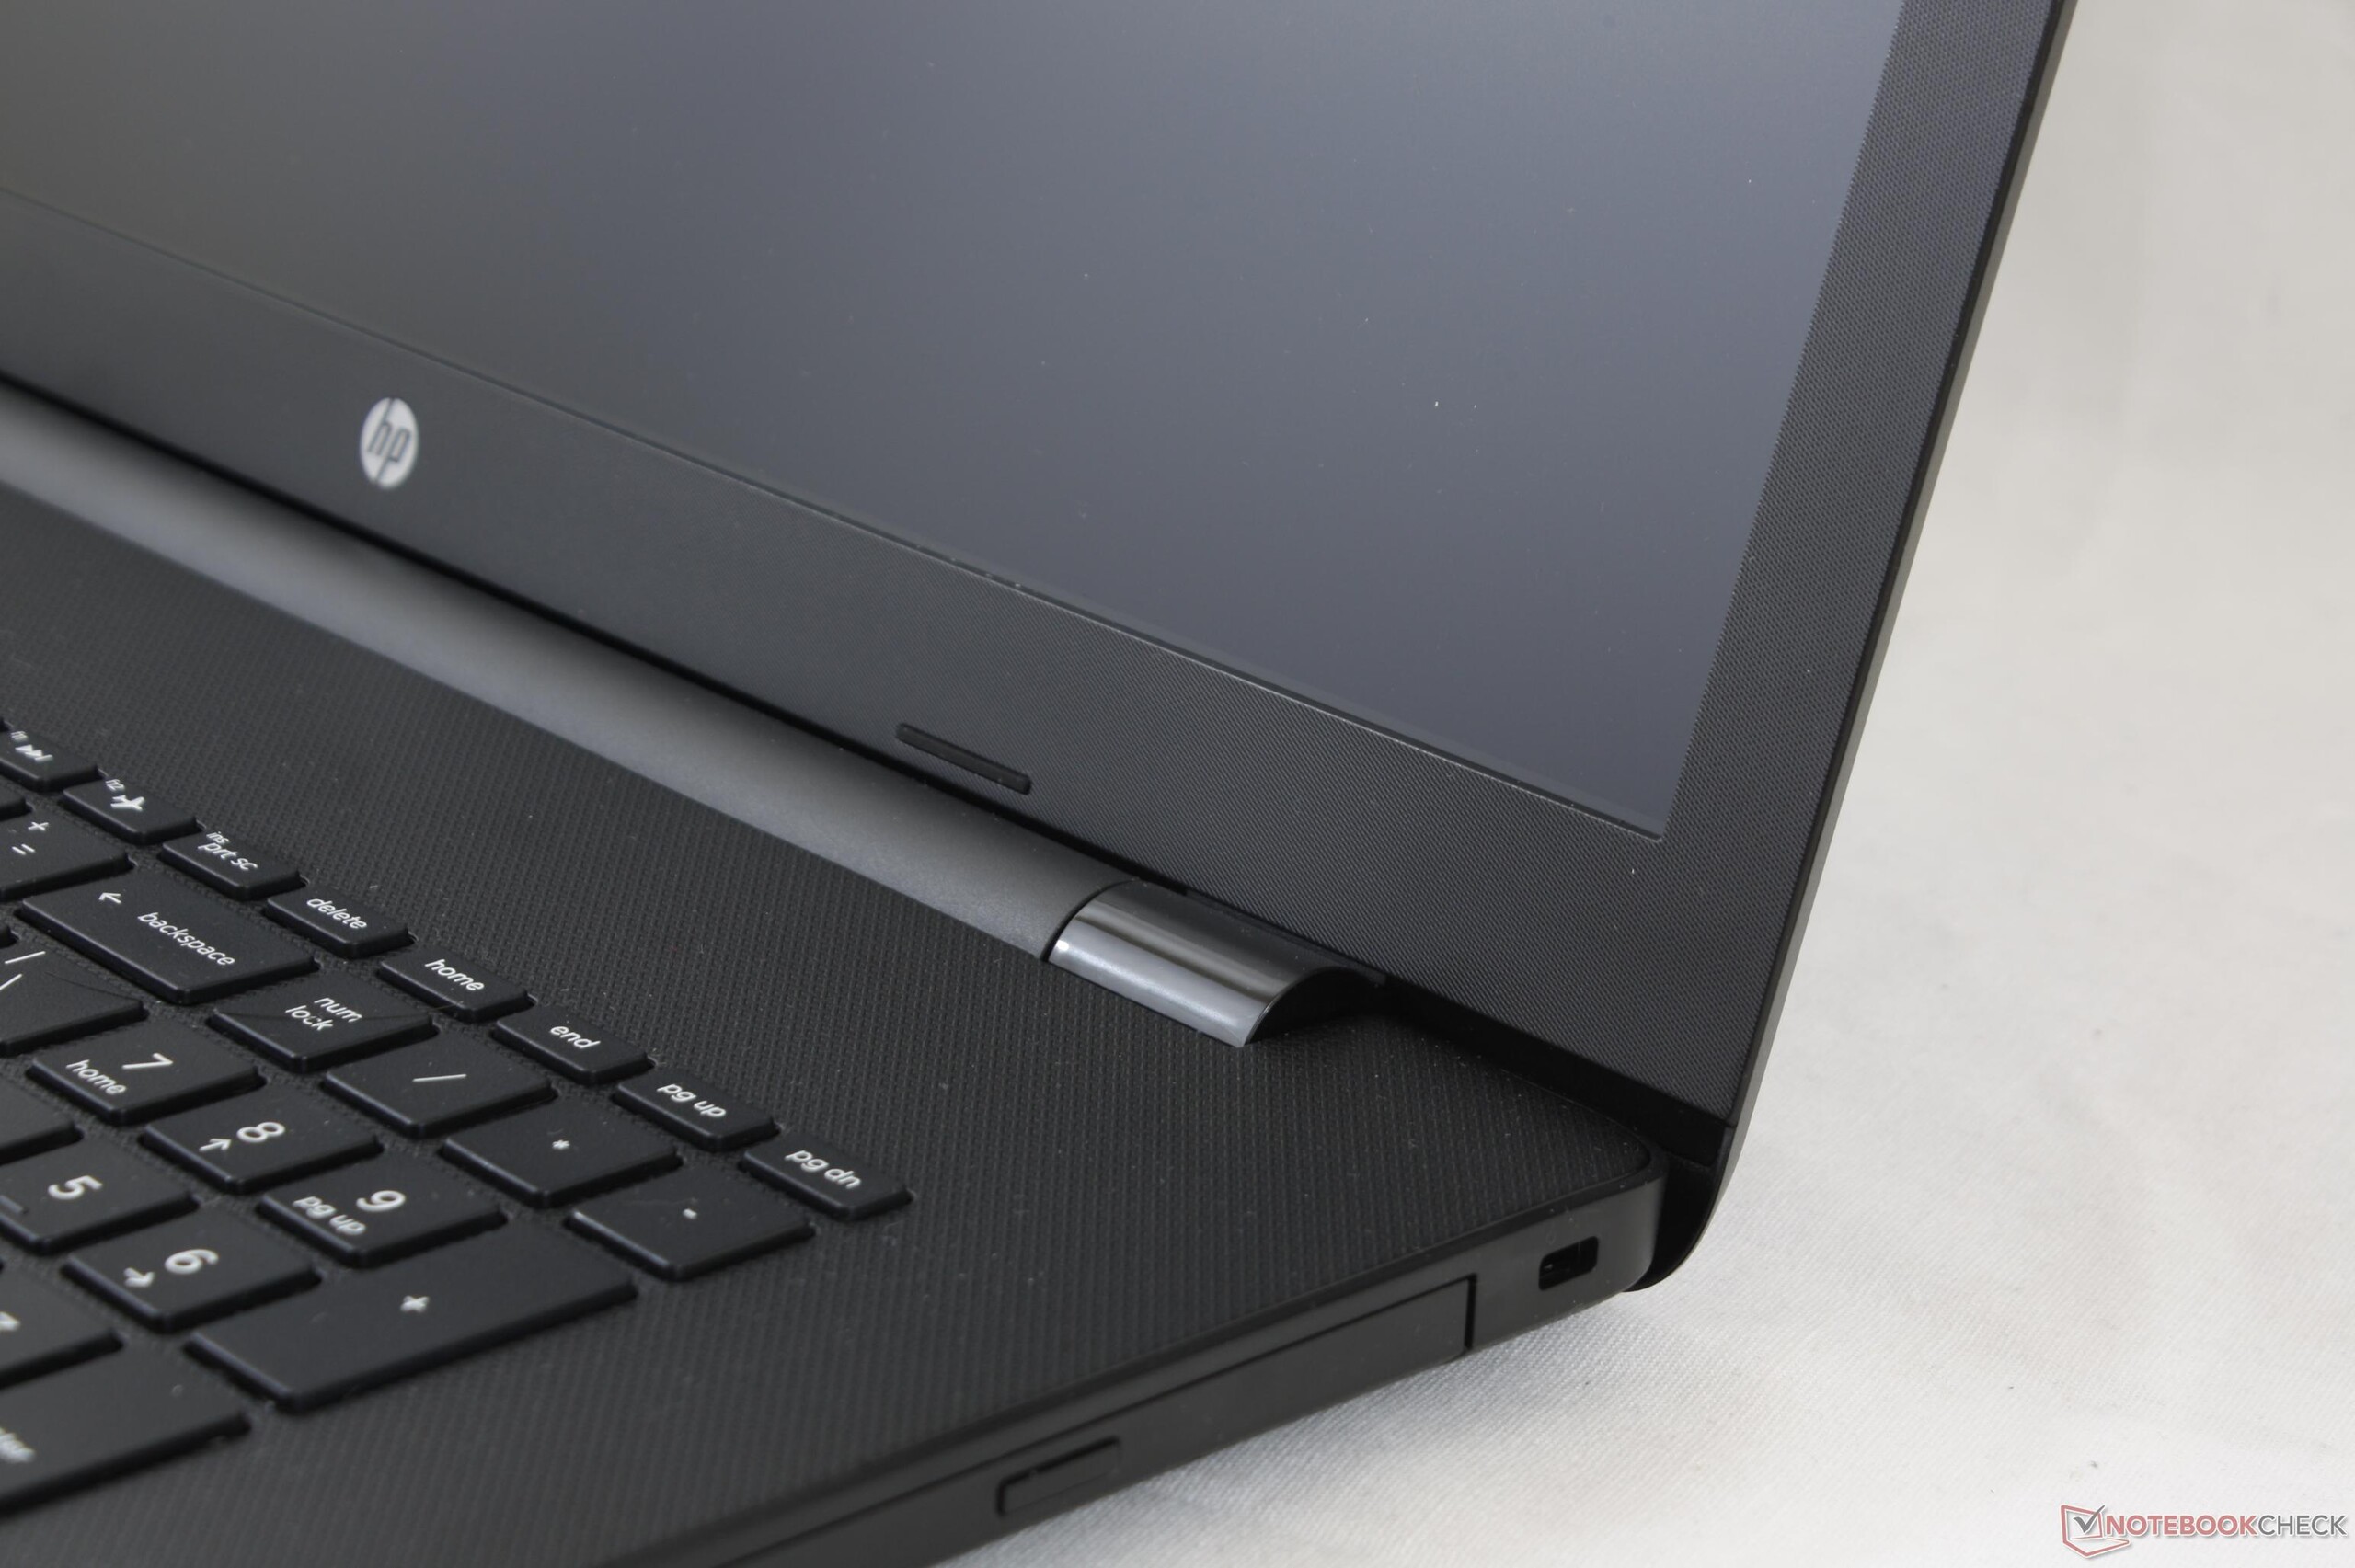
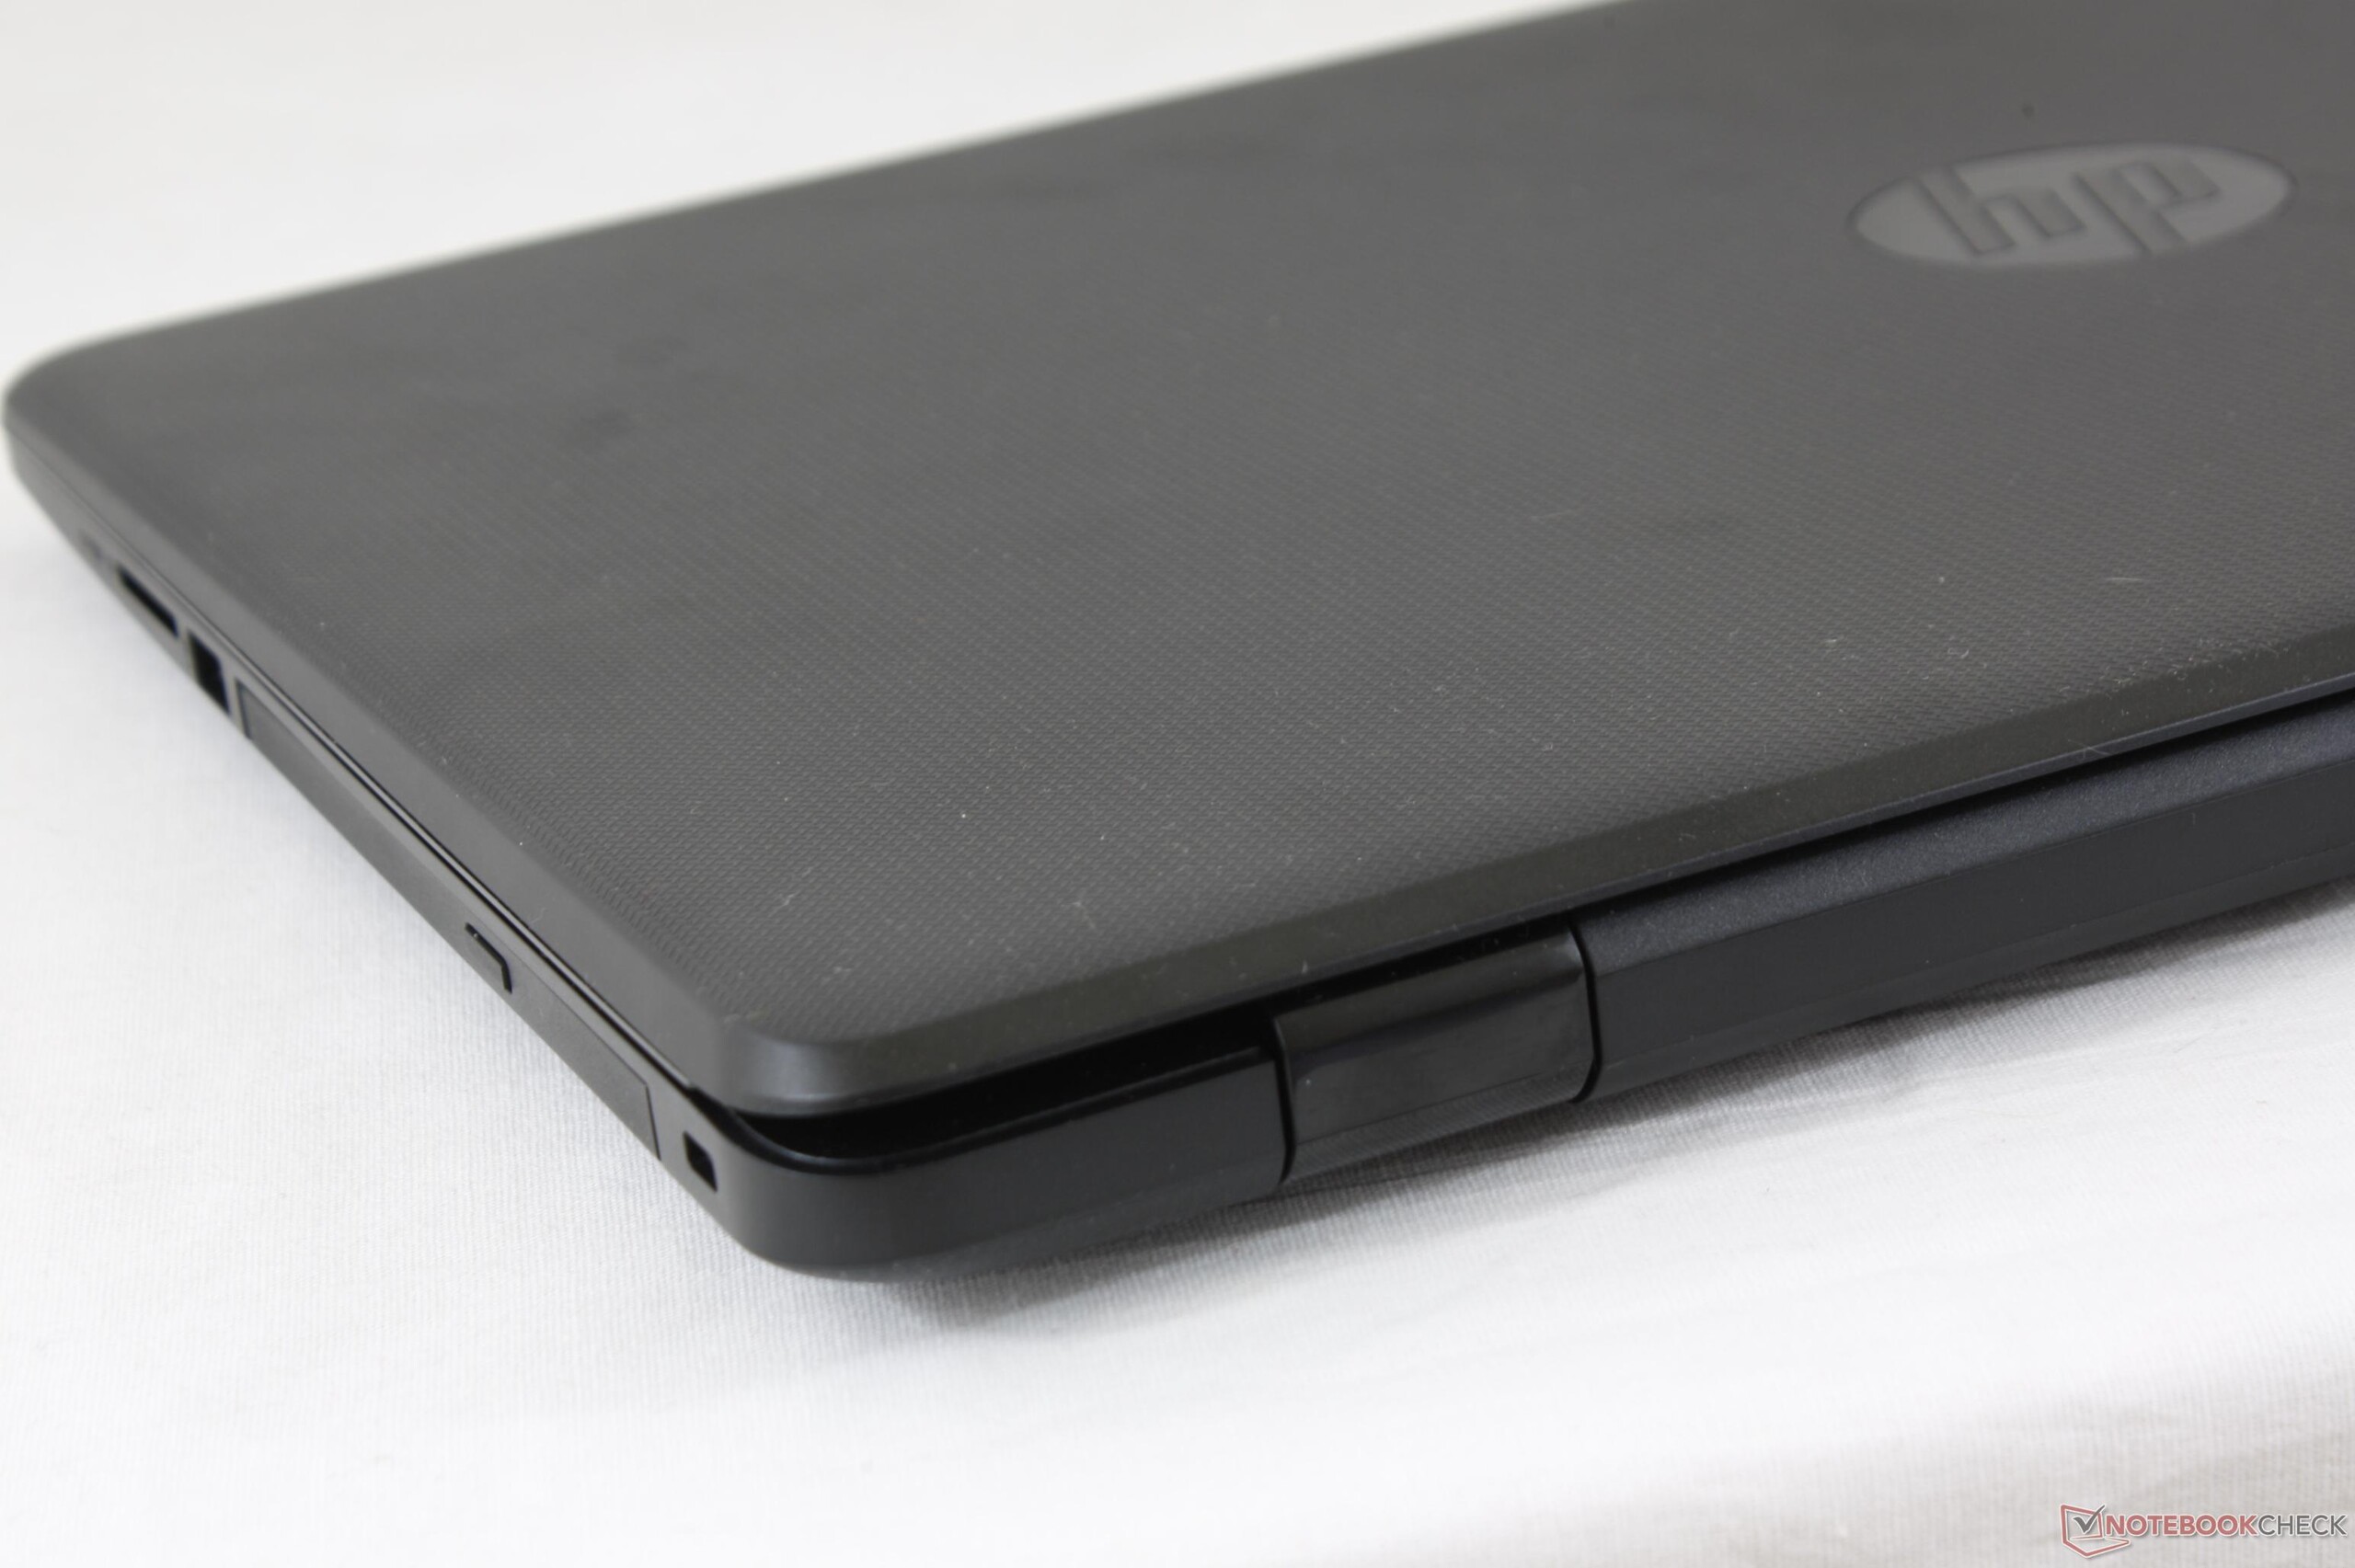
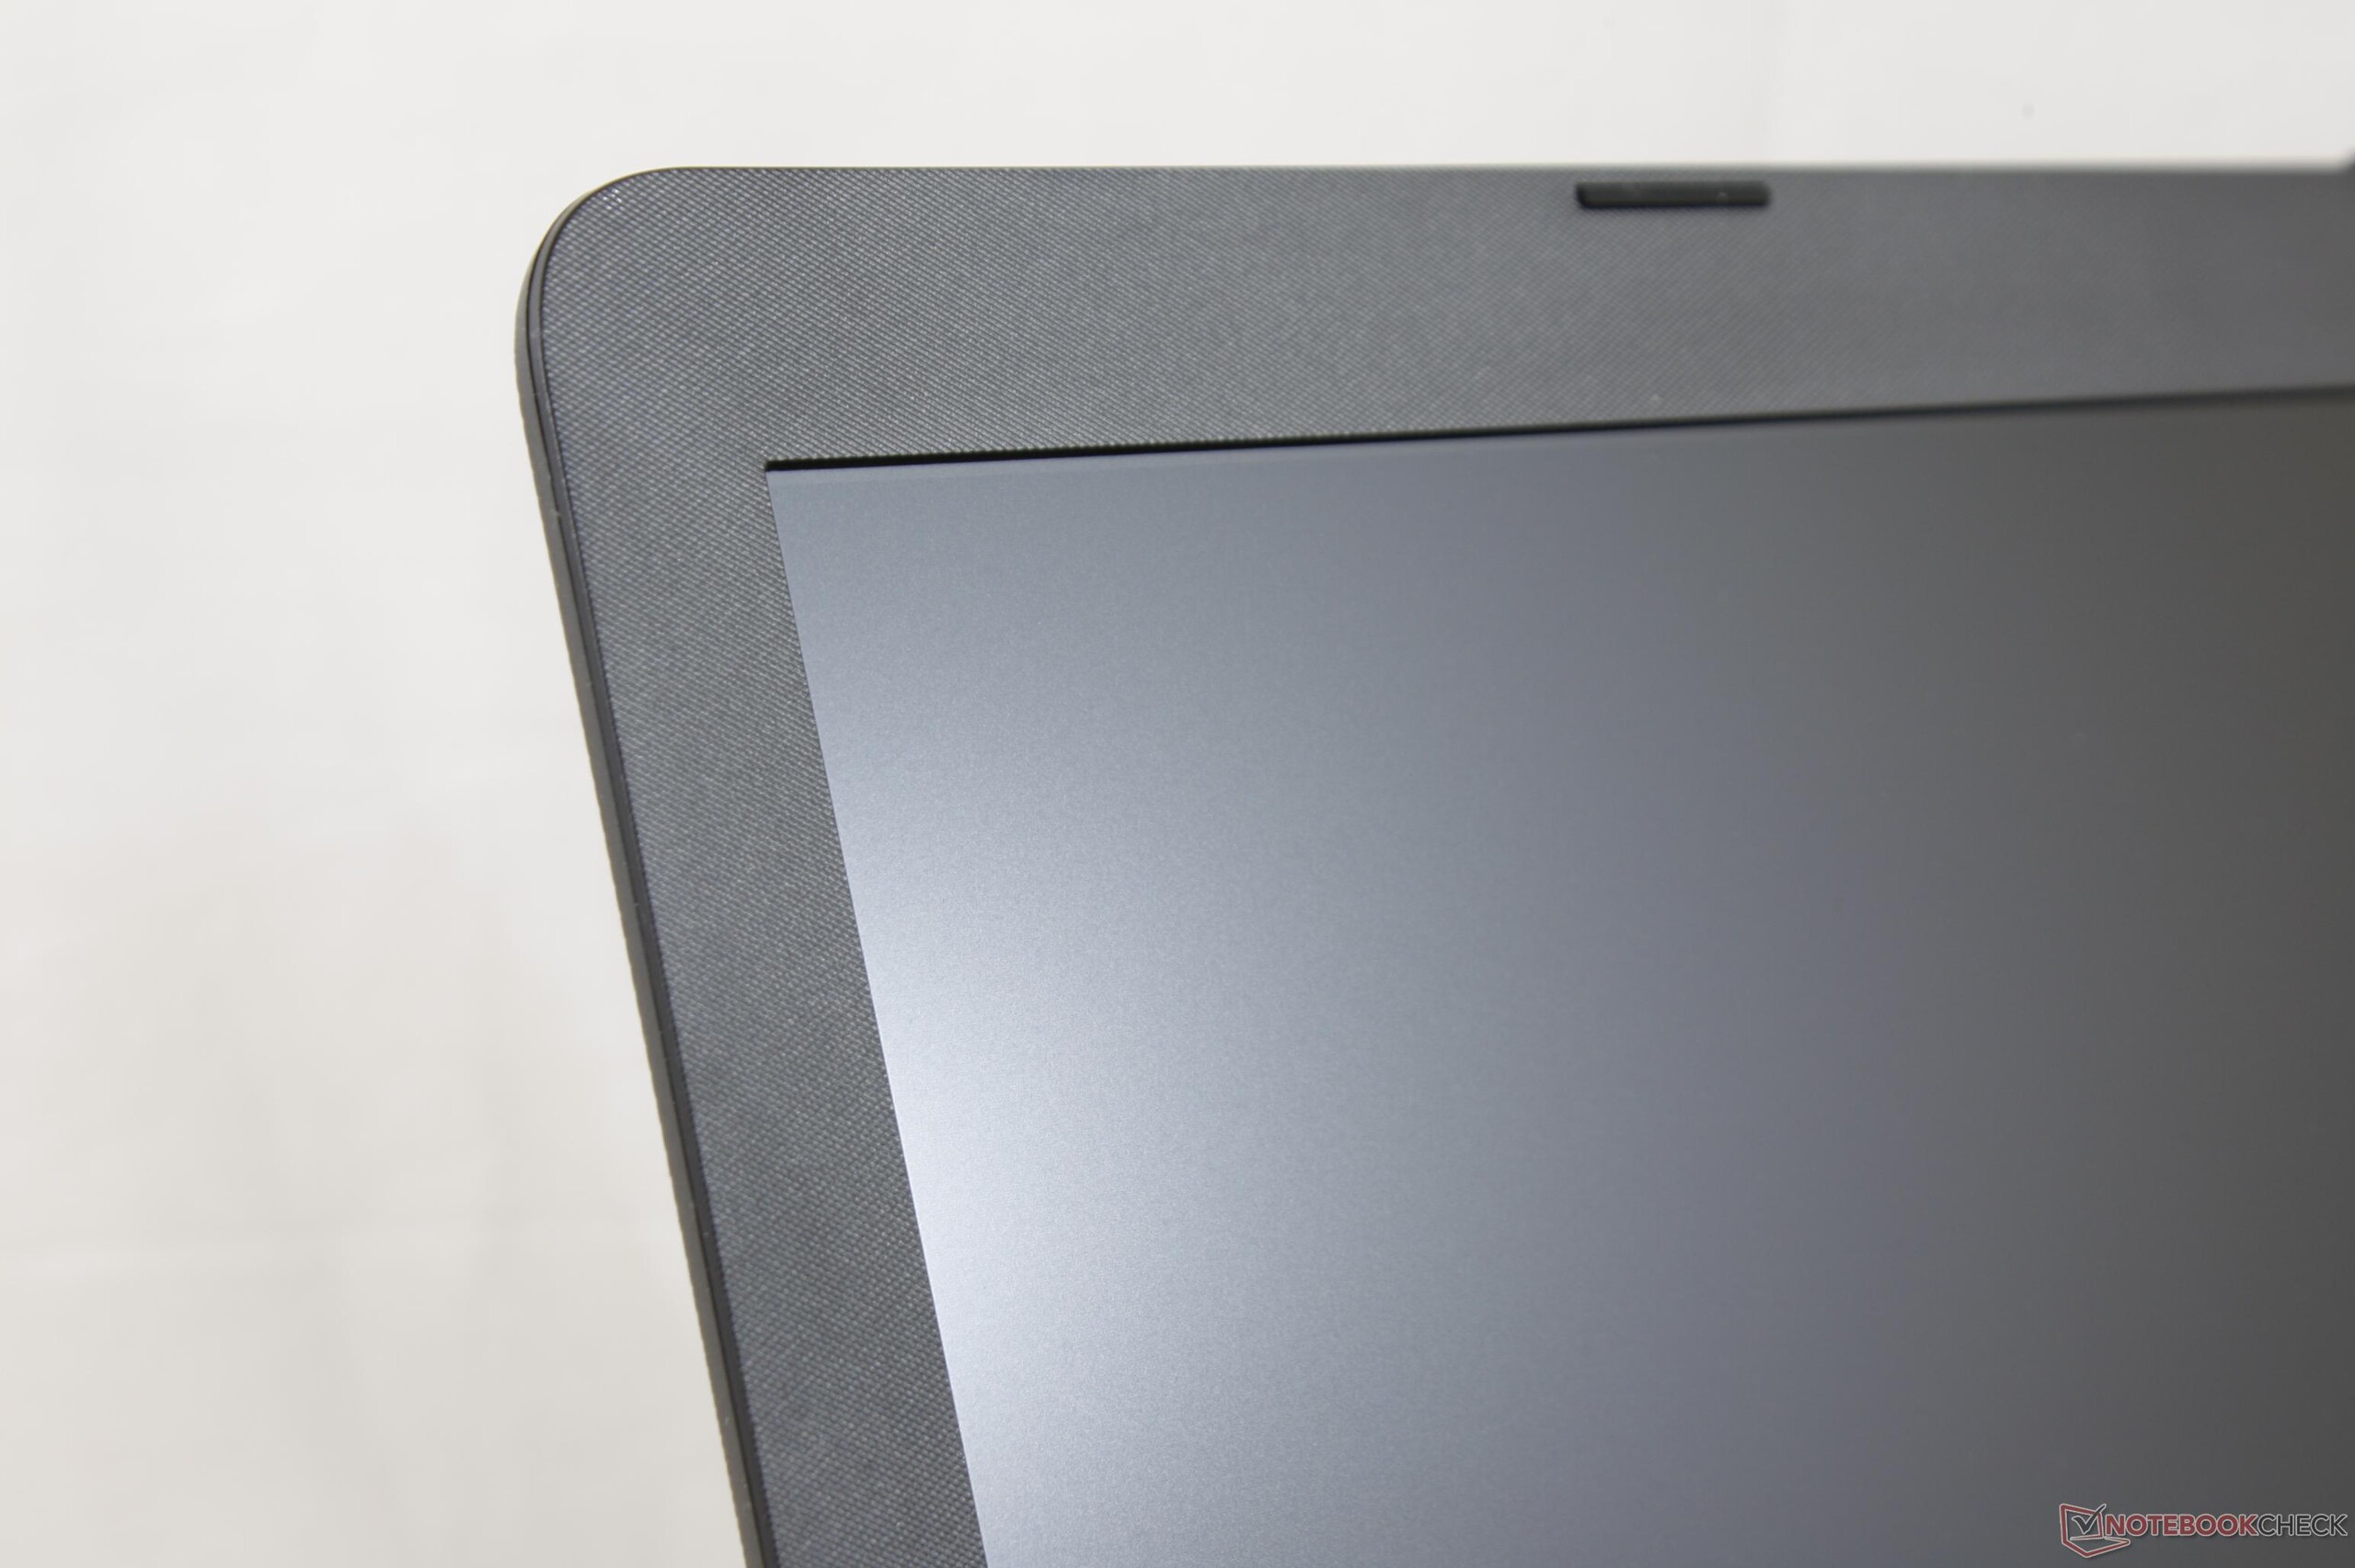
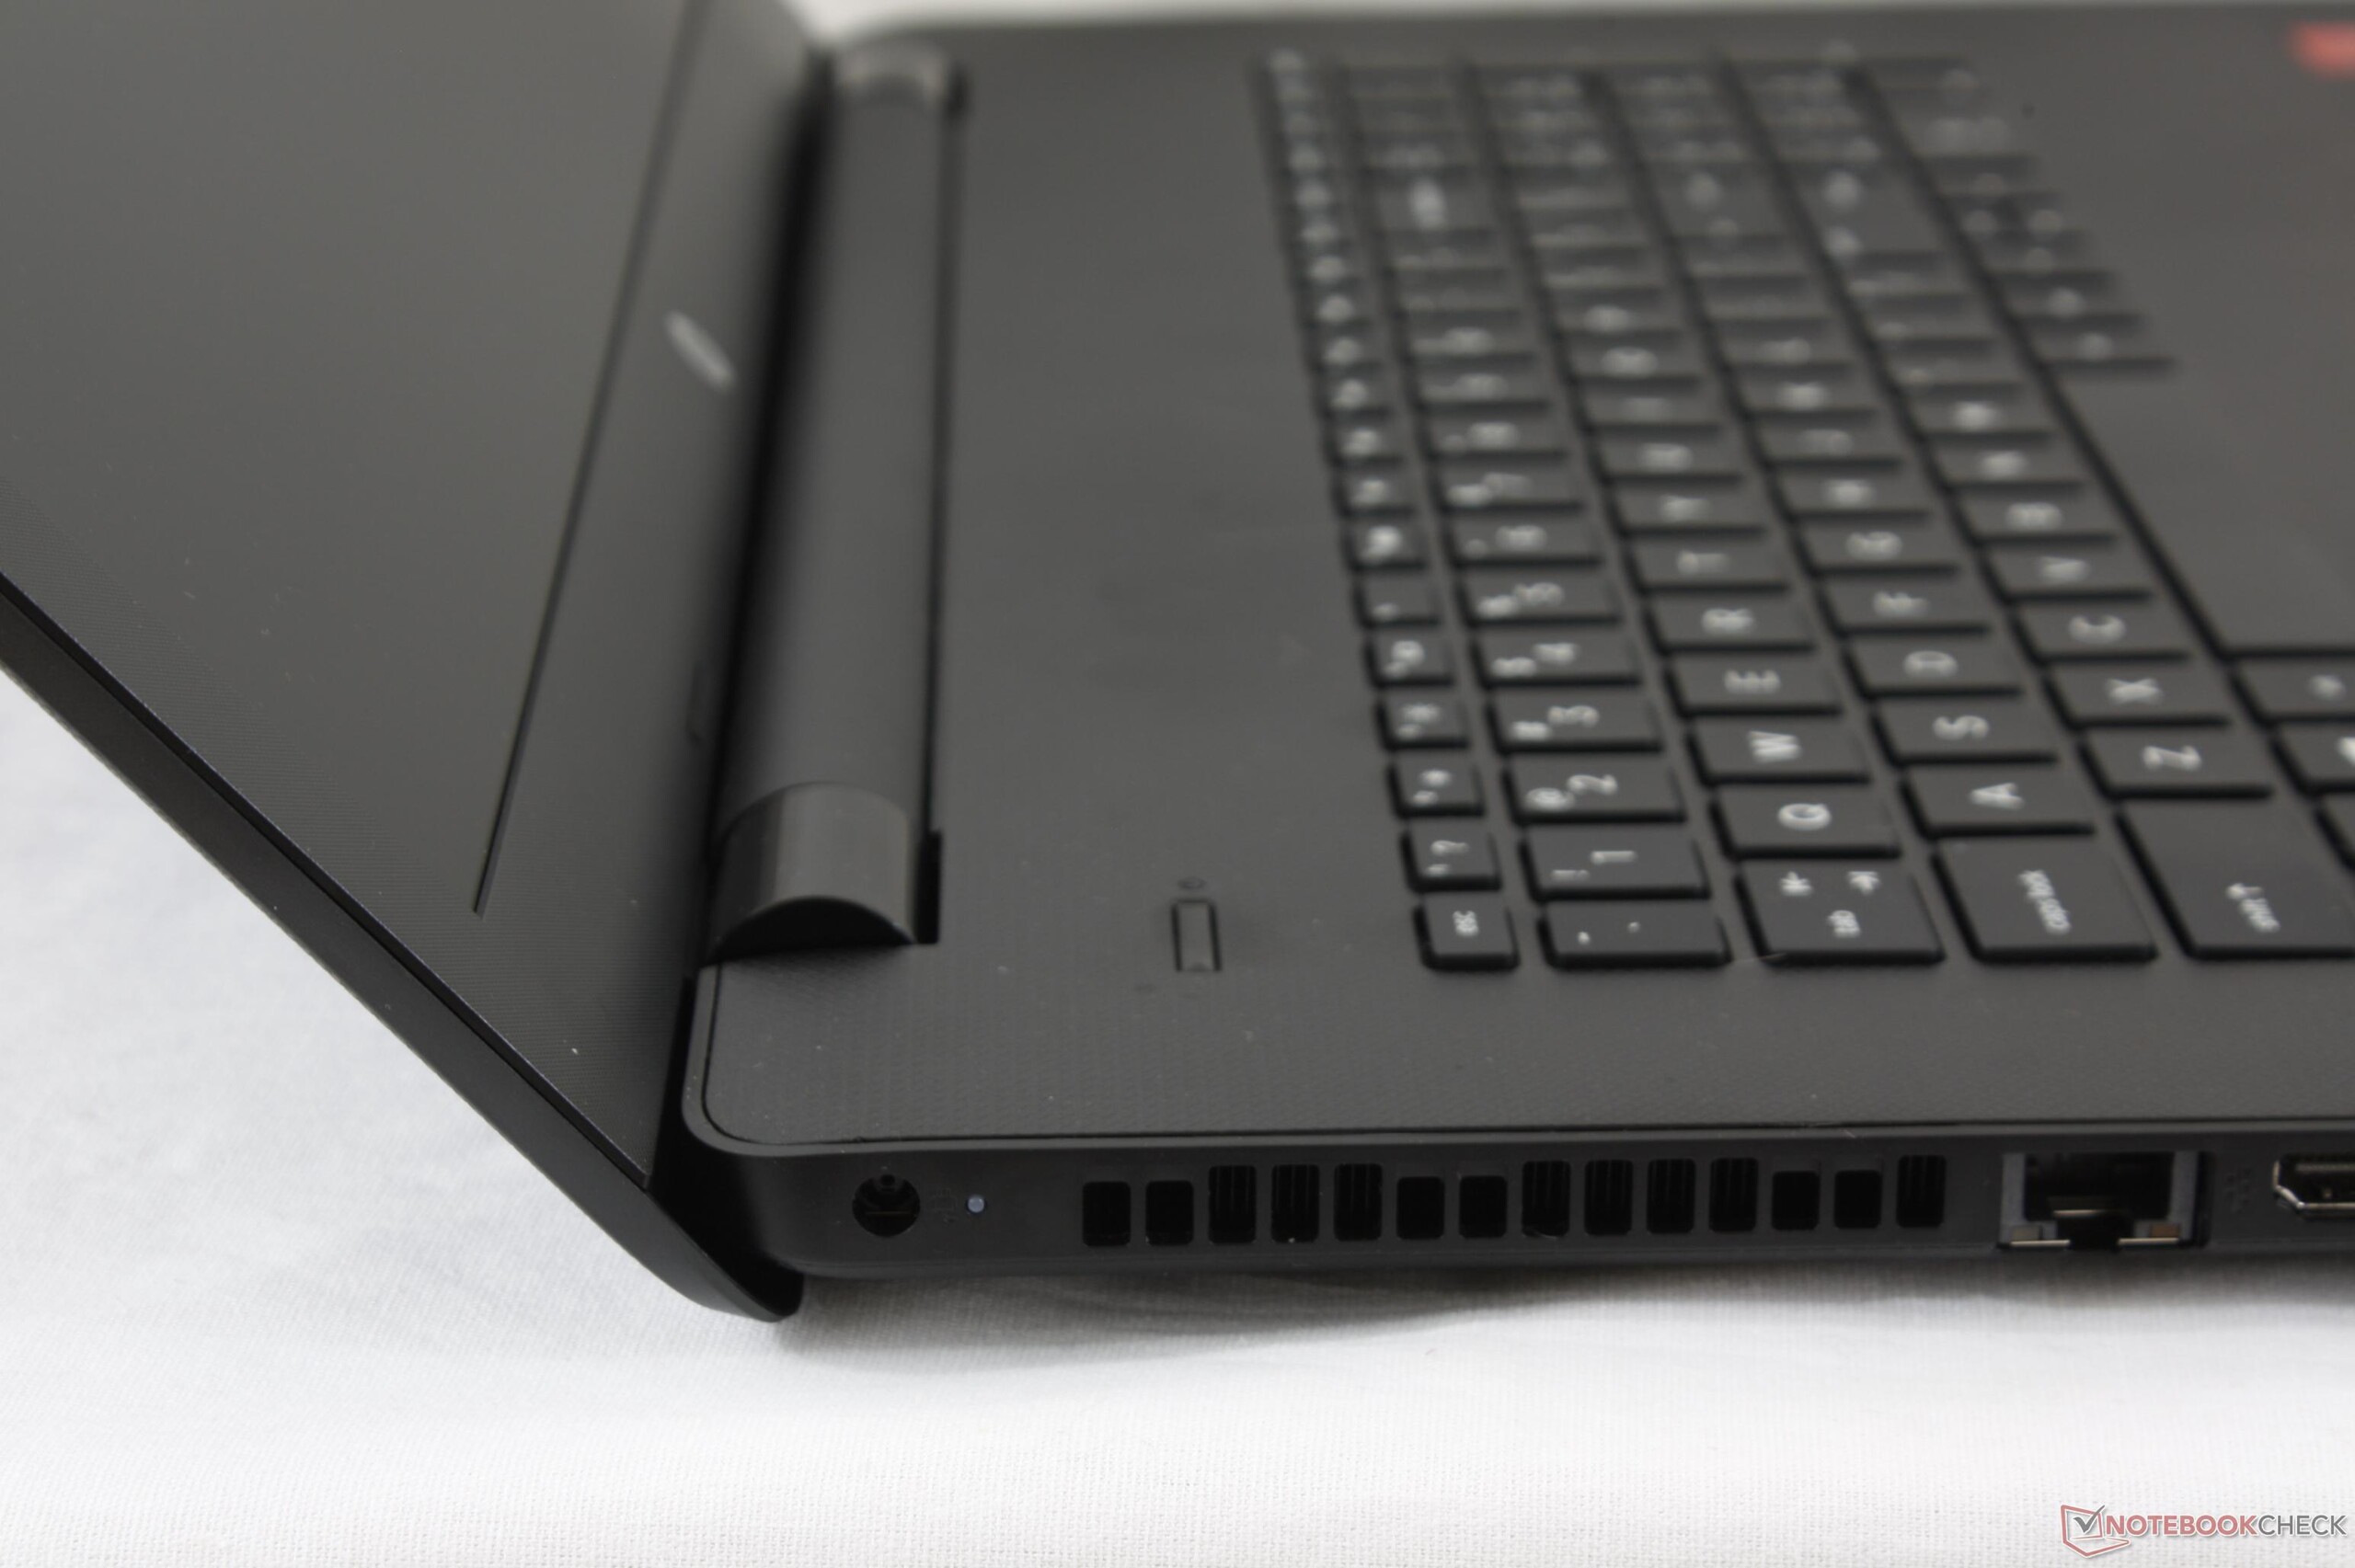
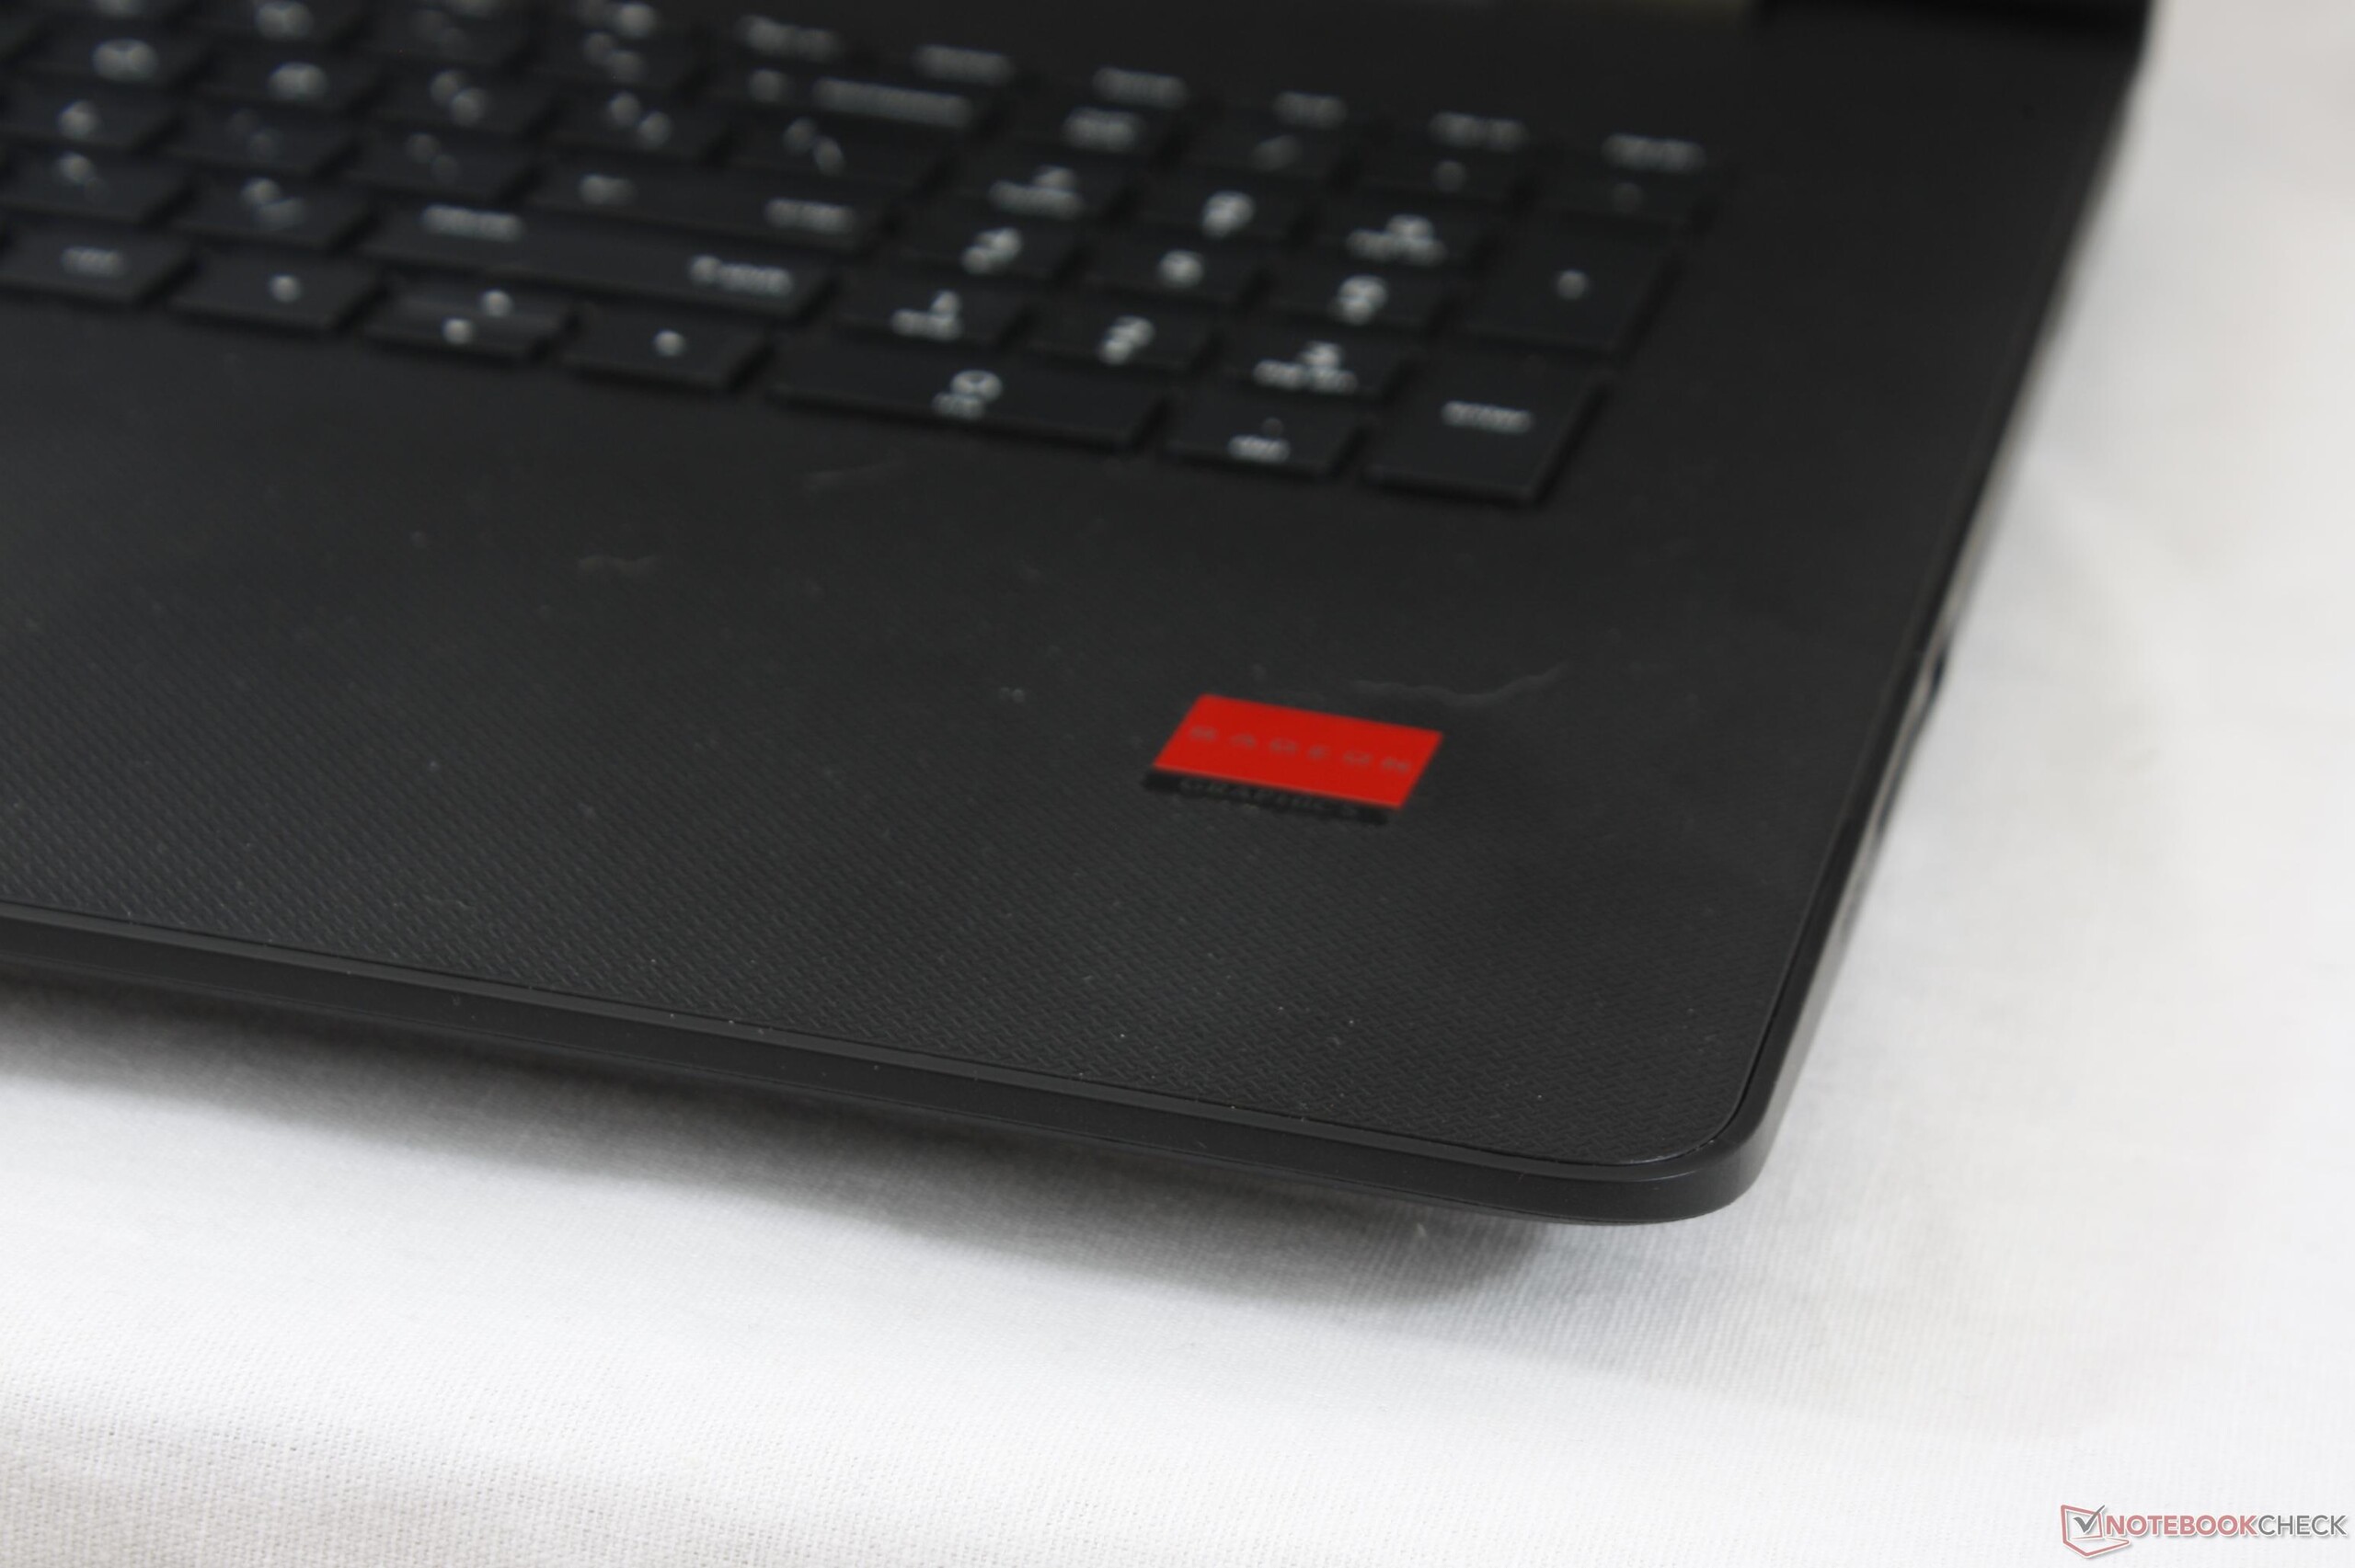
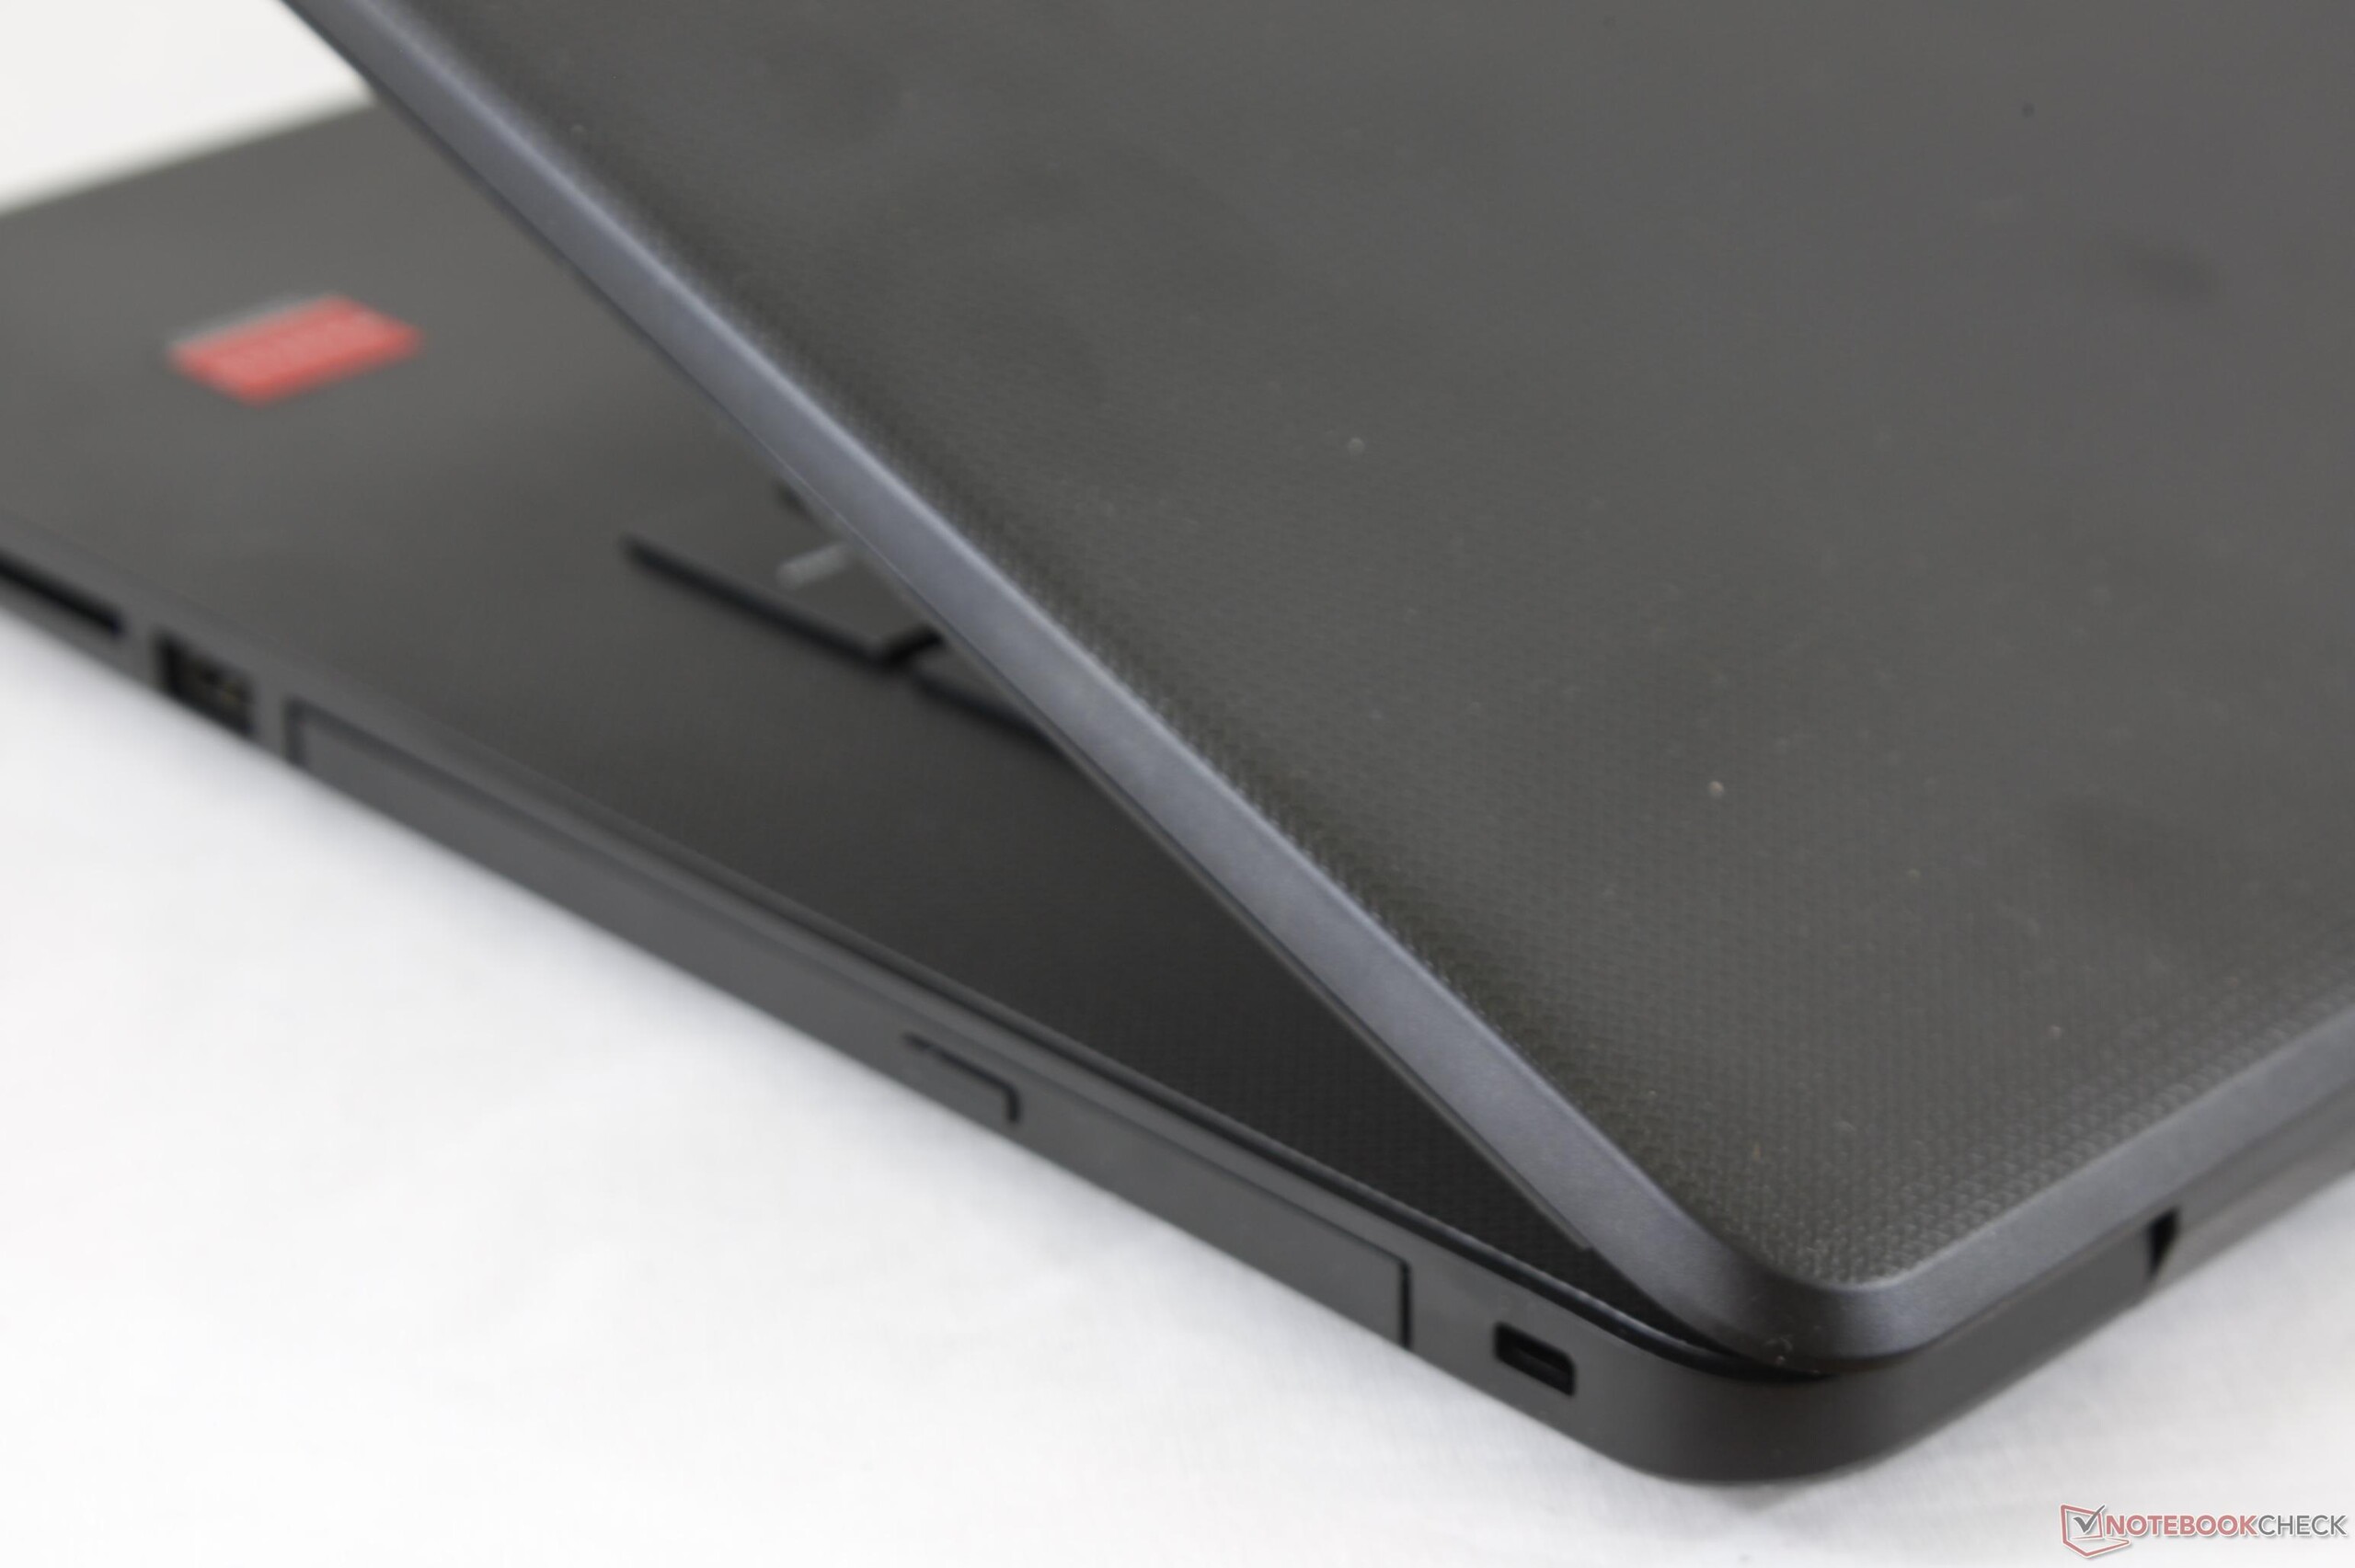
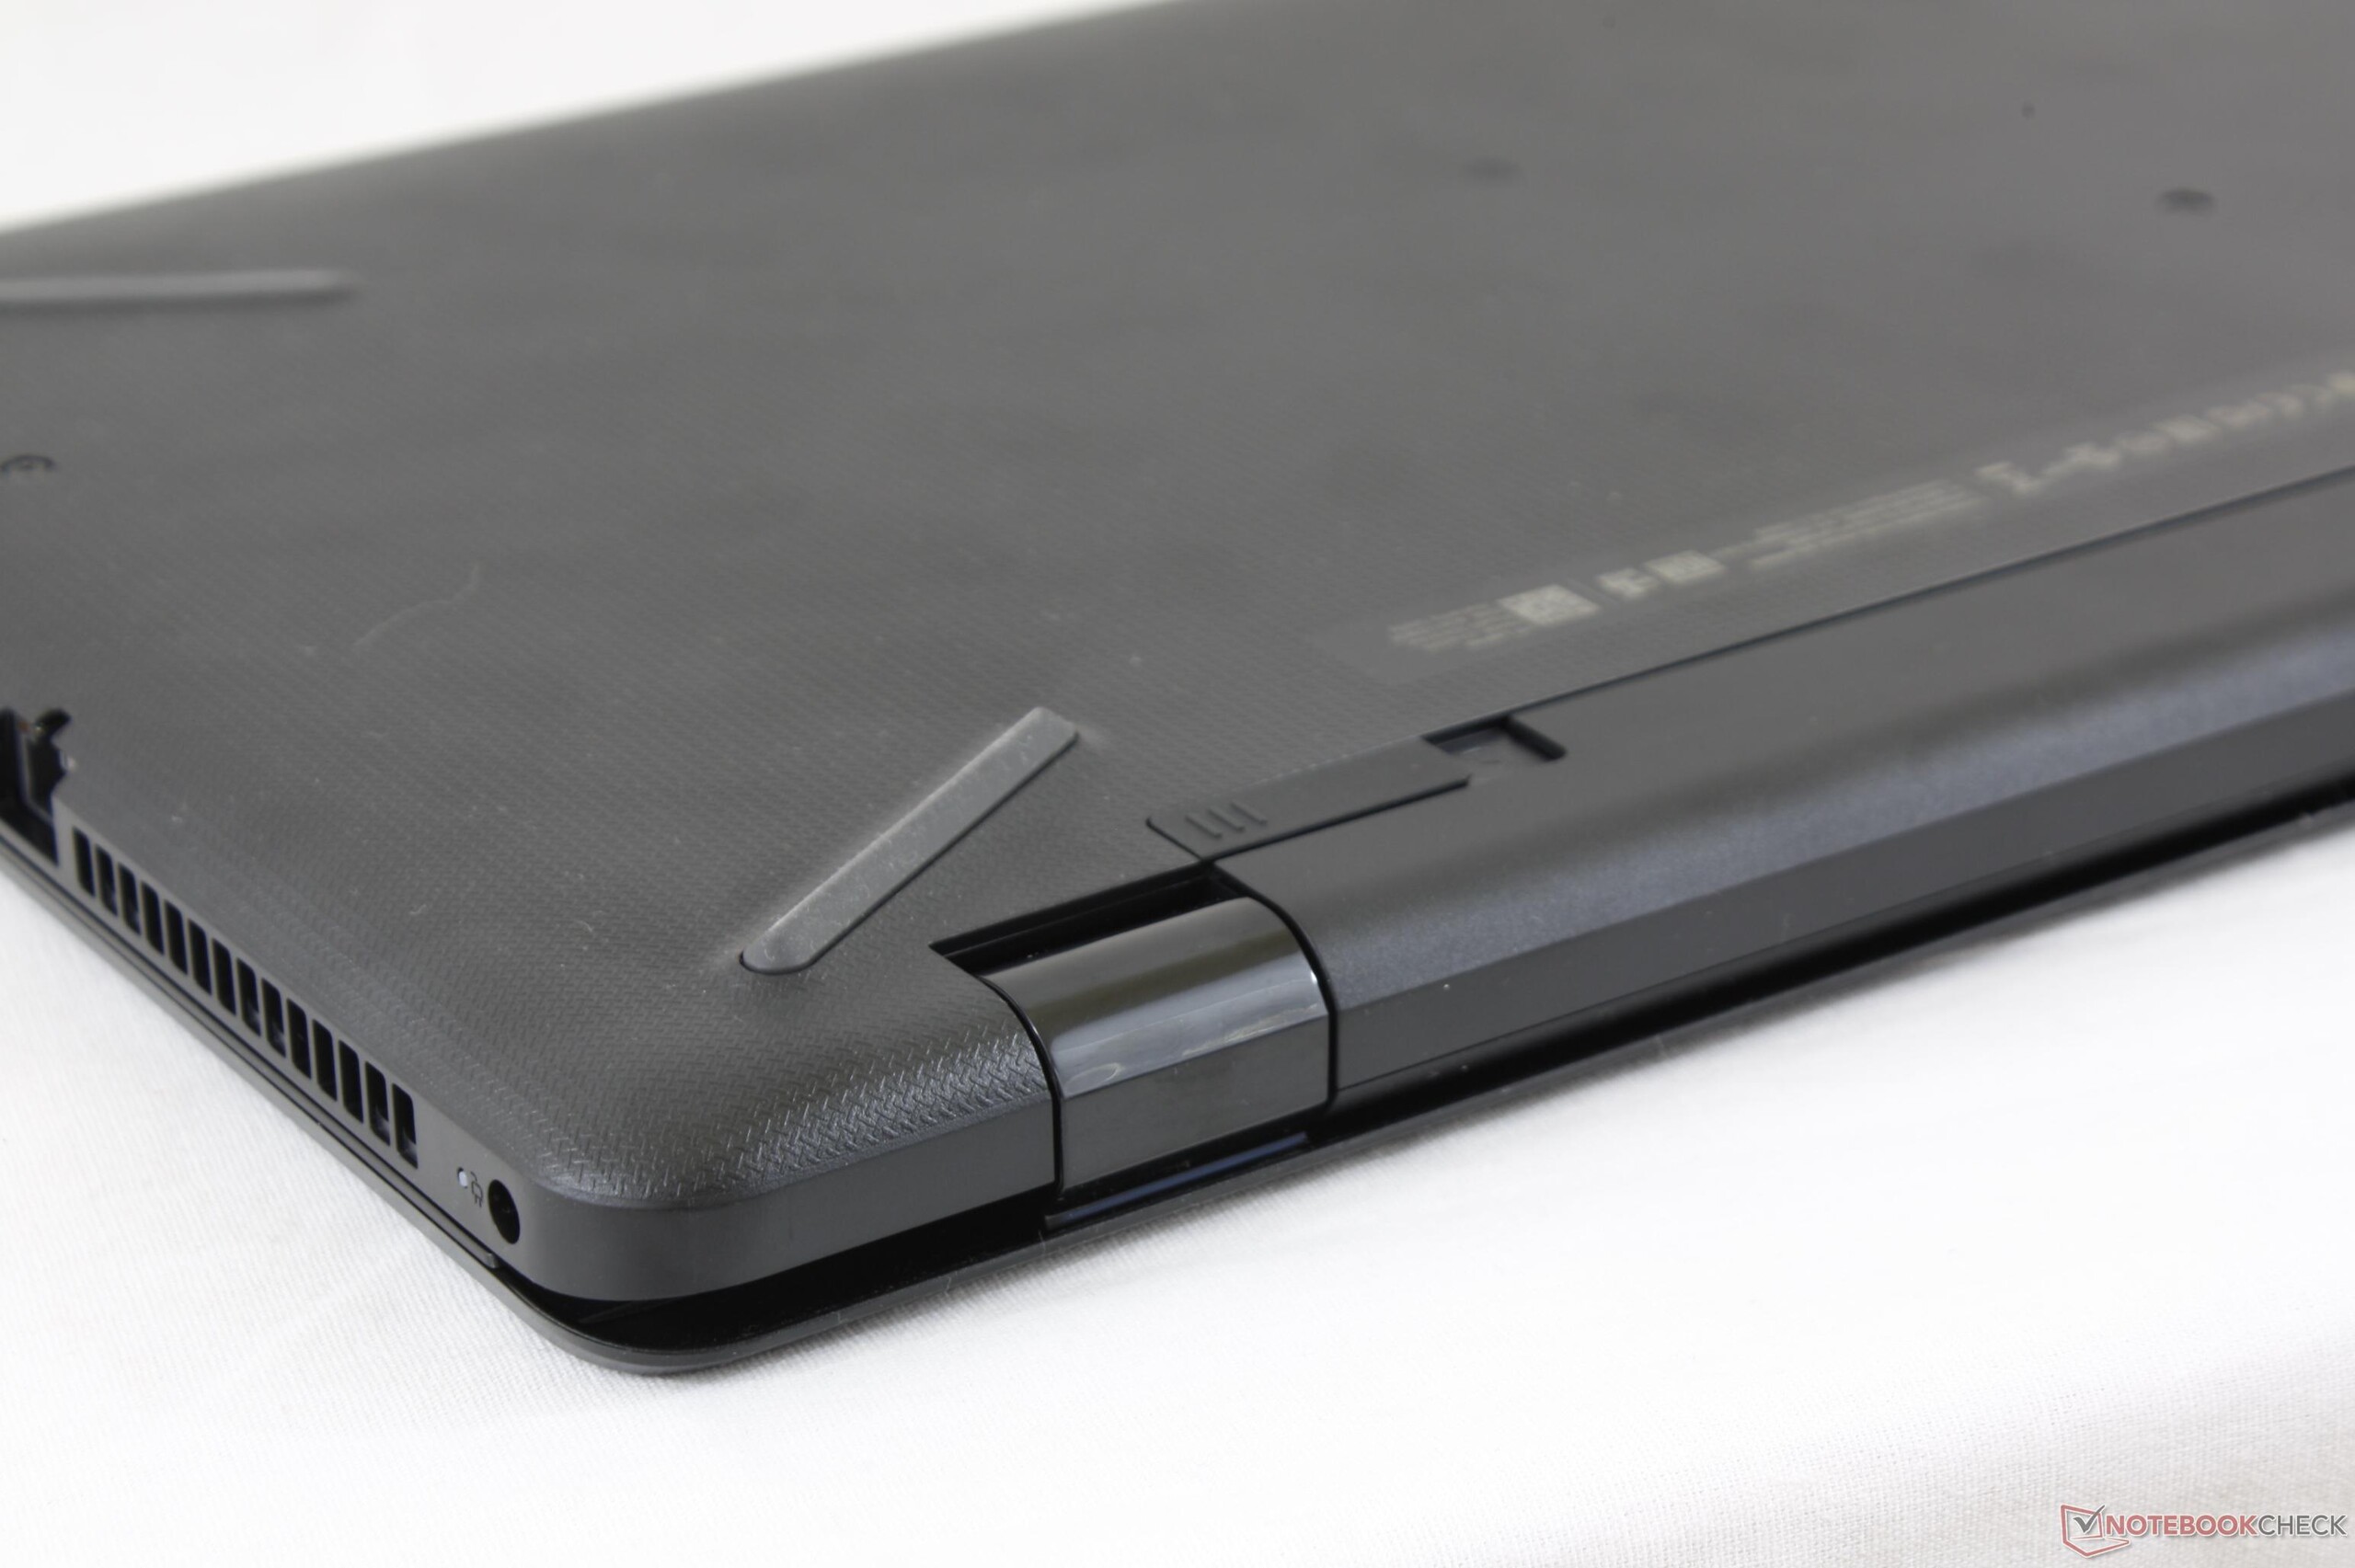
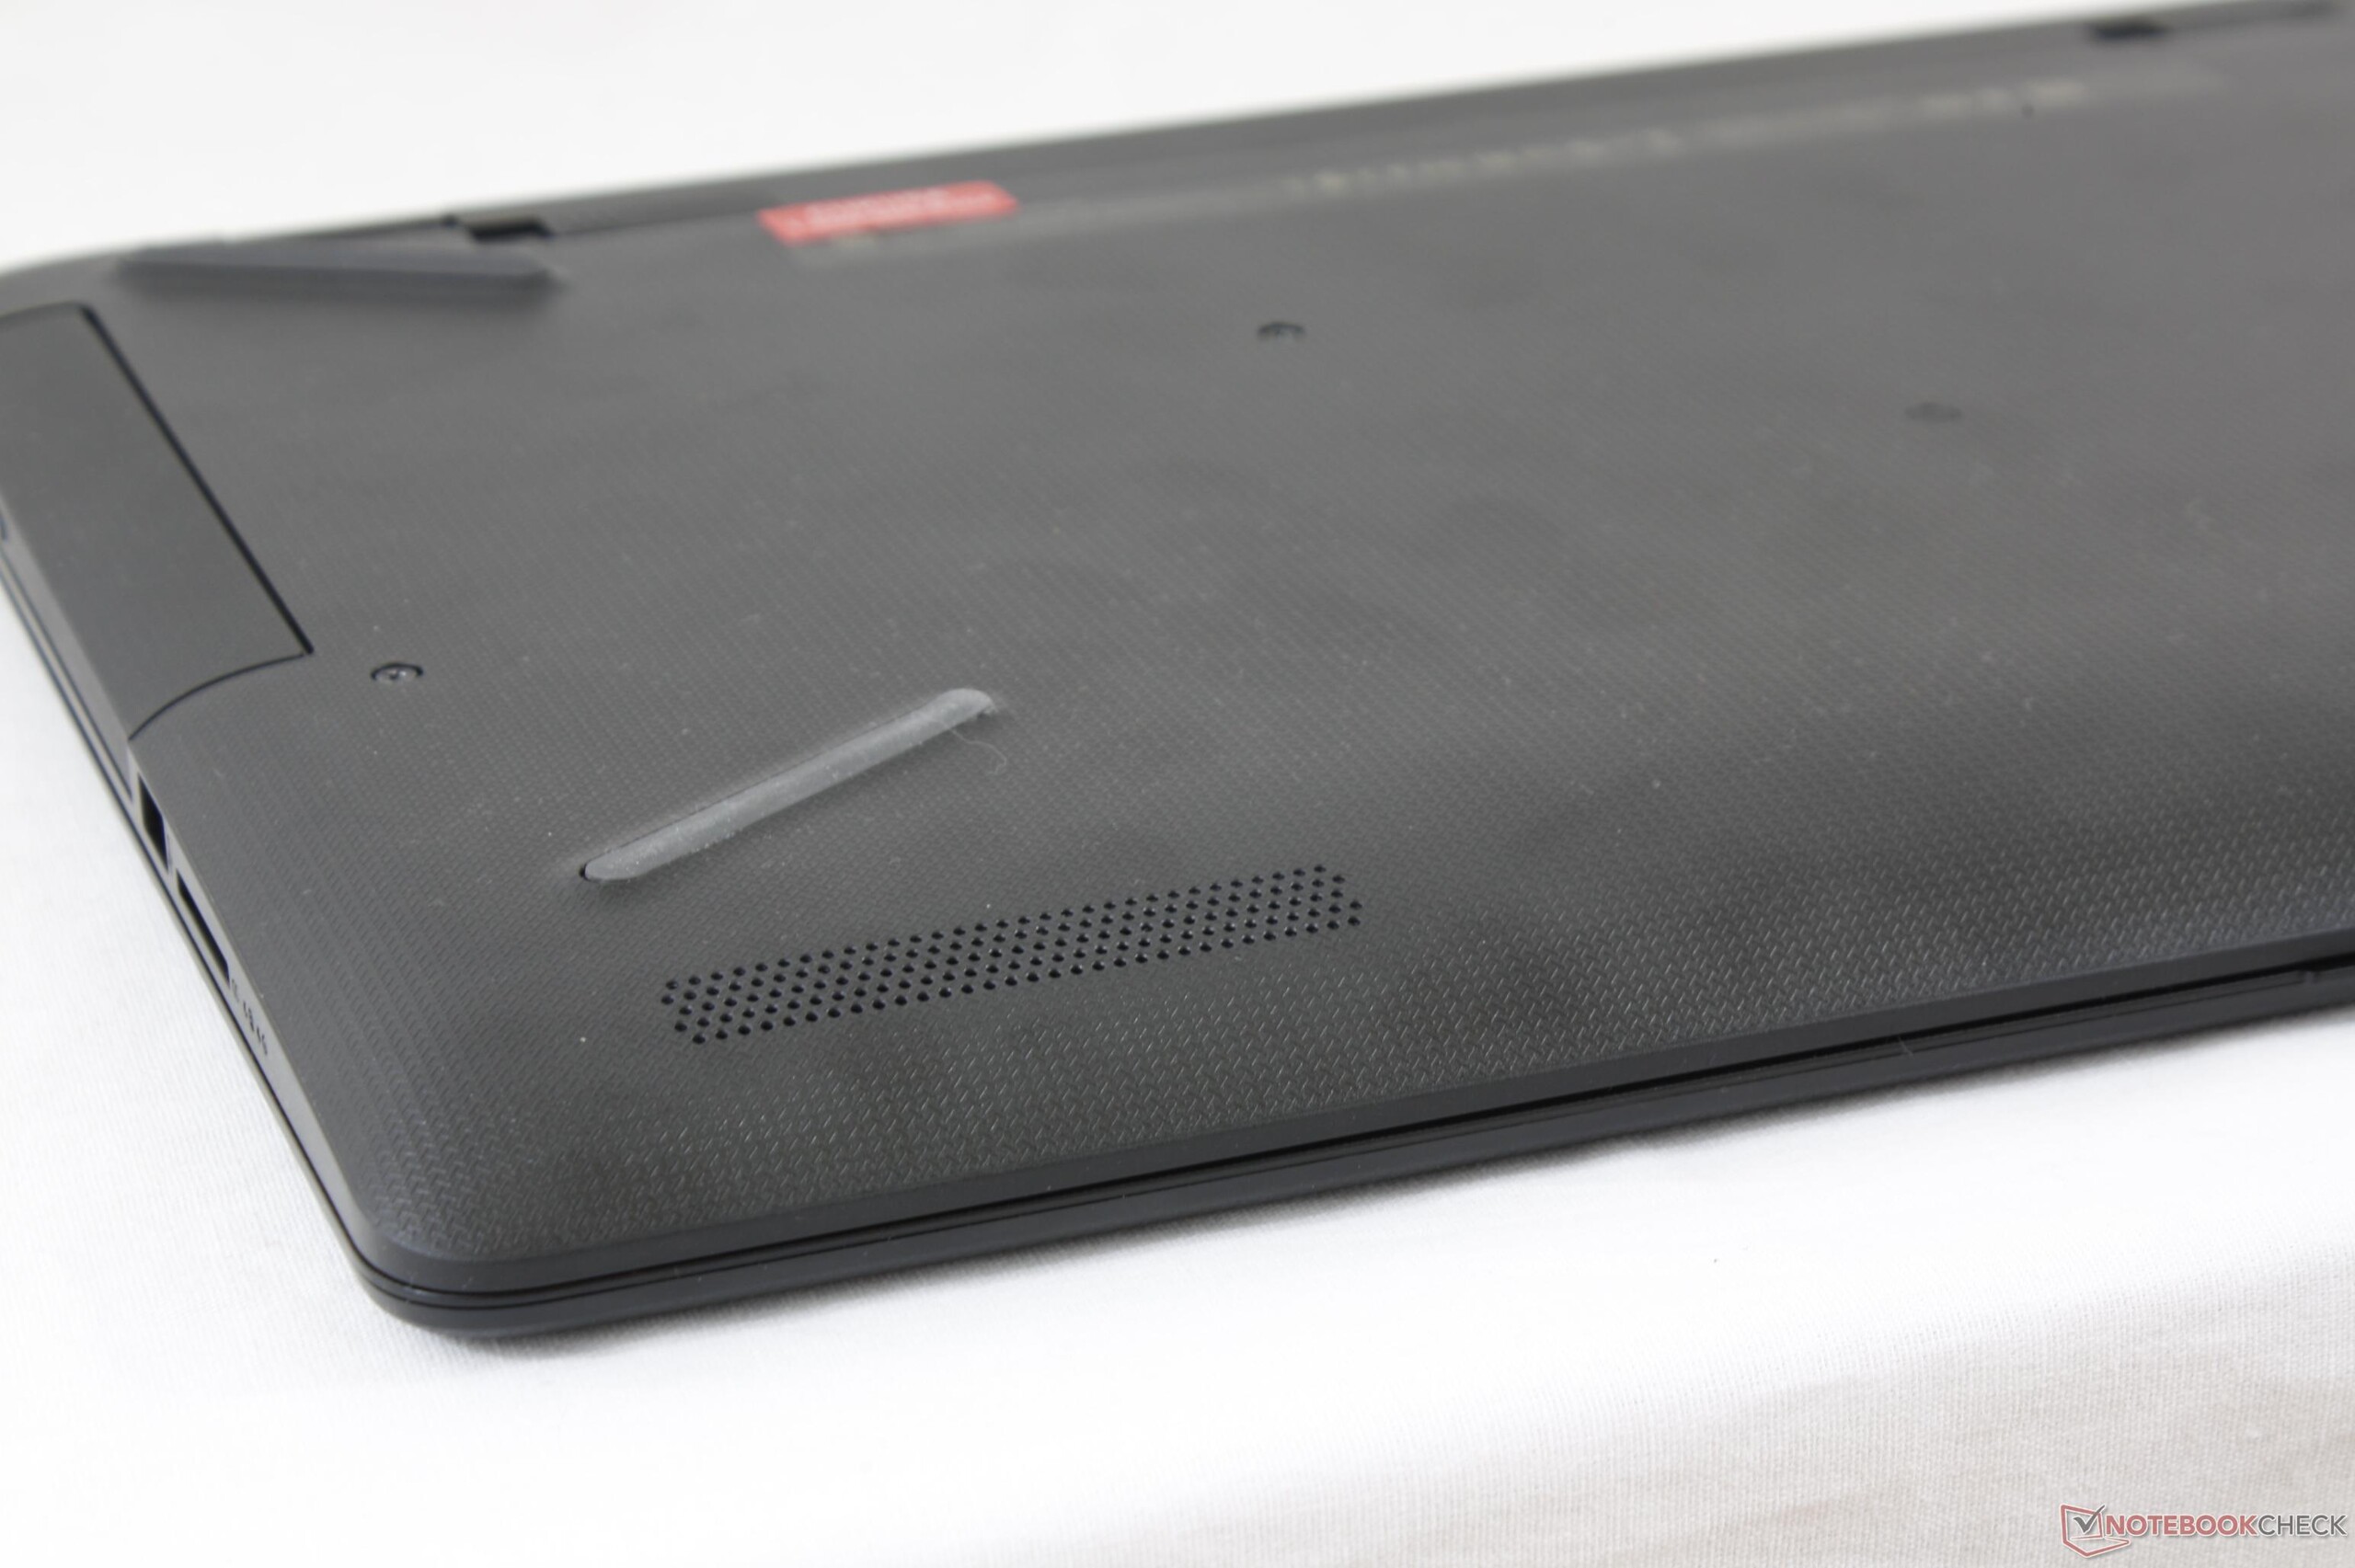
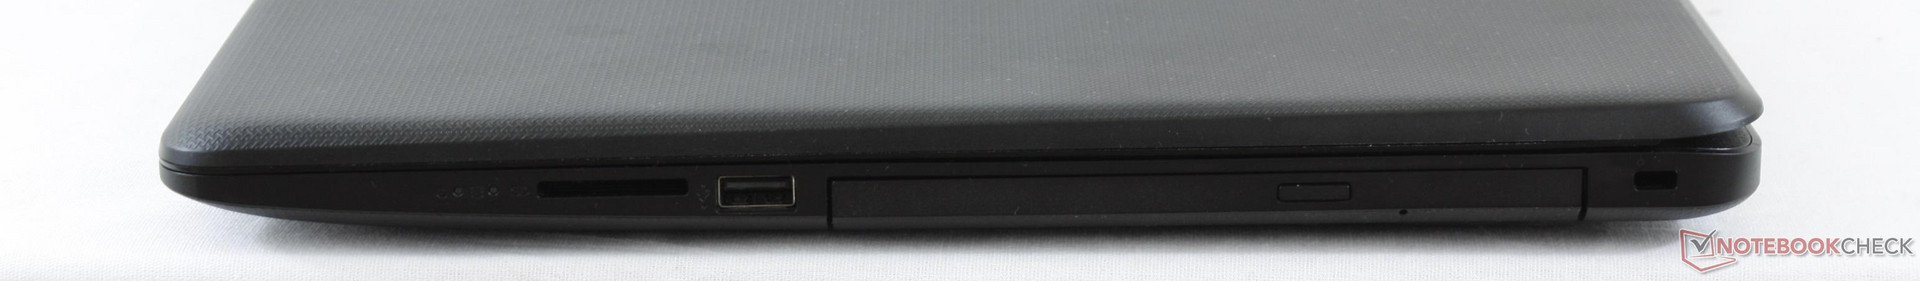
Lo chassis del Pavilion 17z è nello standard con un paio di sorprese. Le casse sono decenti e la retroilluminazione del display è potente per la sua classe con una copertura del colore abbastanza ampia. Oltre a questo, speriamo in future revisioni dell'hardware che riducano i disturbi del panello ed eliminino l'effetto bleeding, oltre a migliorare le possibilità di manutenzione per coloro che vogliono montare da soli un SSD.
Il Pavilion AMD-powered non sembra decidersi se essere un portatile economico gaming low-end o un economico dispositivo da ufficio. In entrambi i casi sembra fallire.
Nota: si tratta di una recensione breve, con alcune sezioni non tradotte, per la versione integrale in inglese guardate qui.
HP Pavilion 17z 1EX13AV
- 07/18/2017 v6 (old)
Allen Ngo
Price comparison
