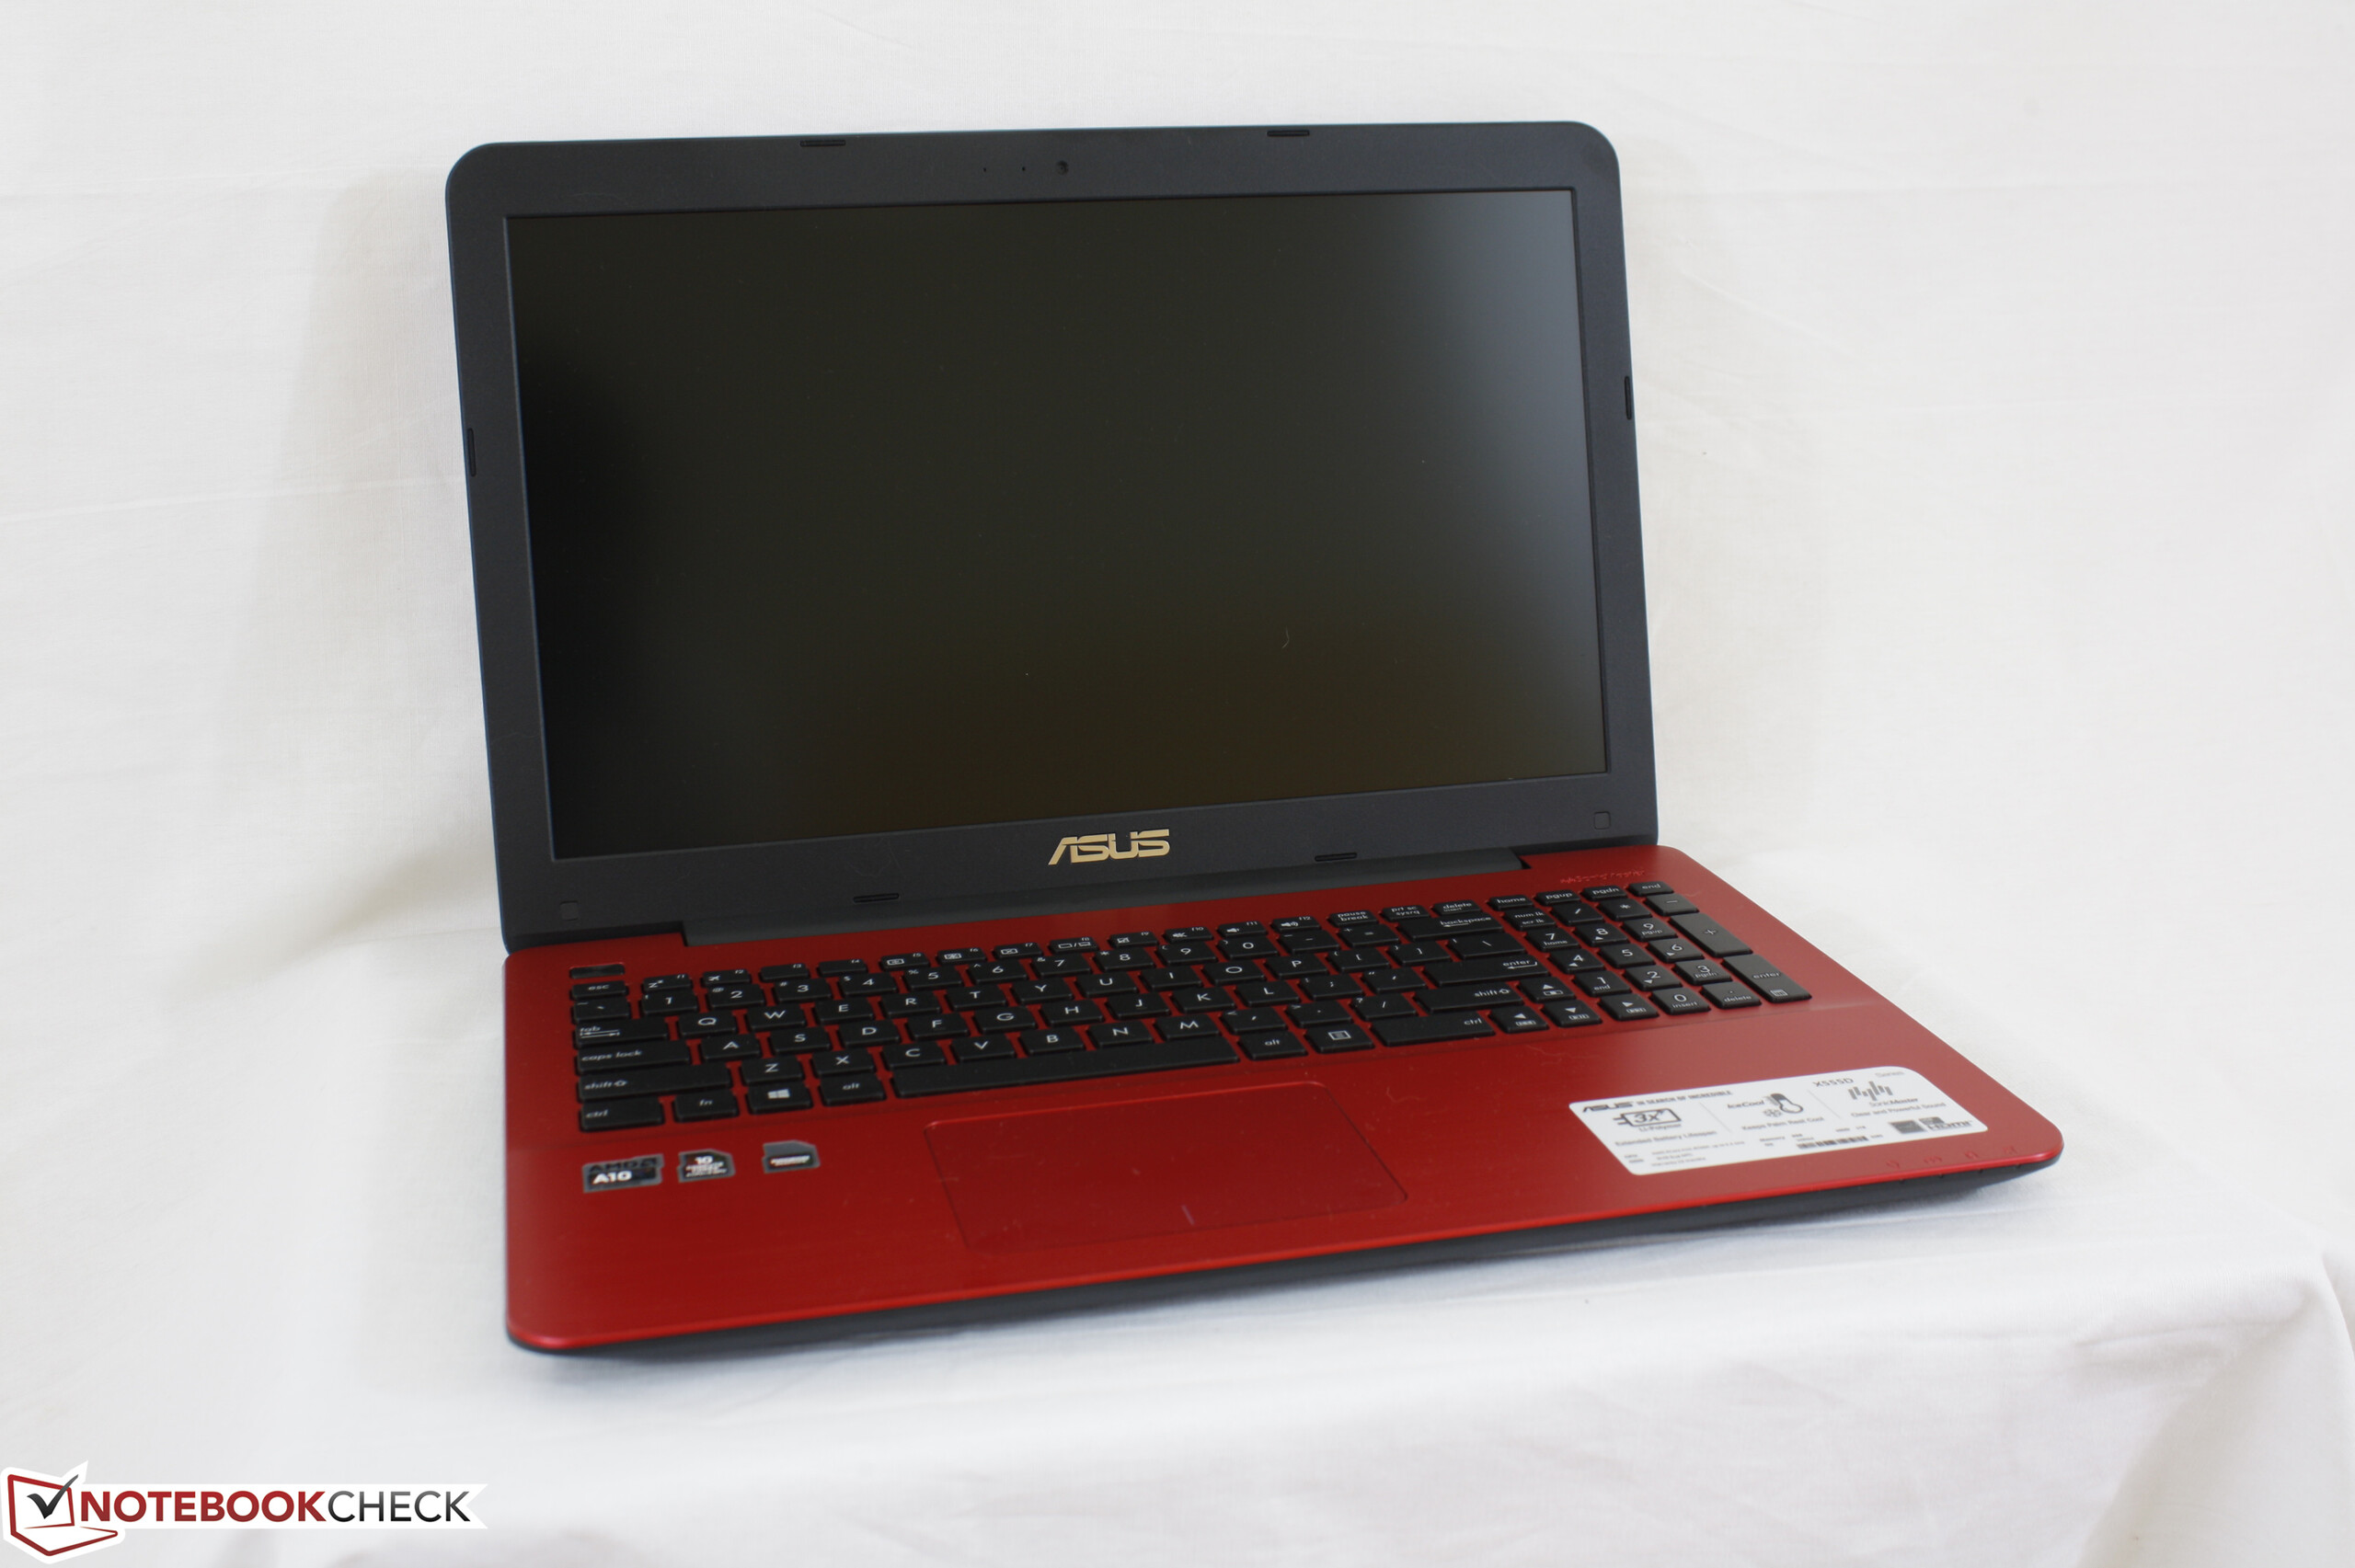
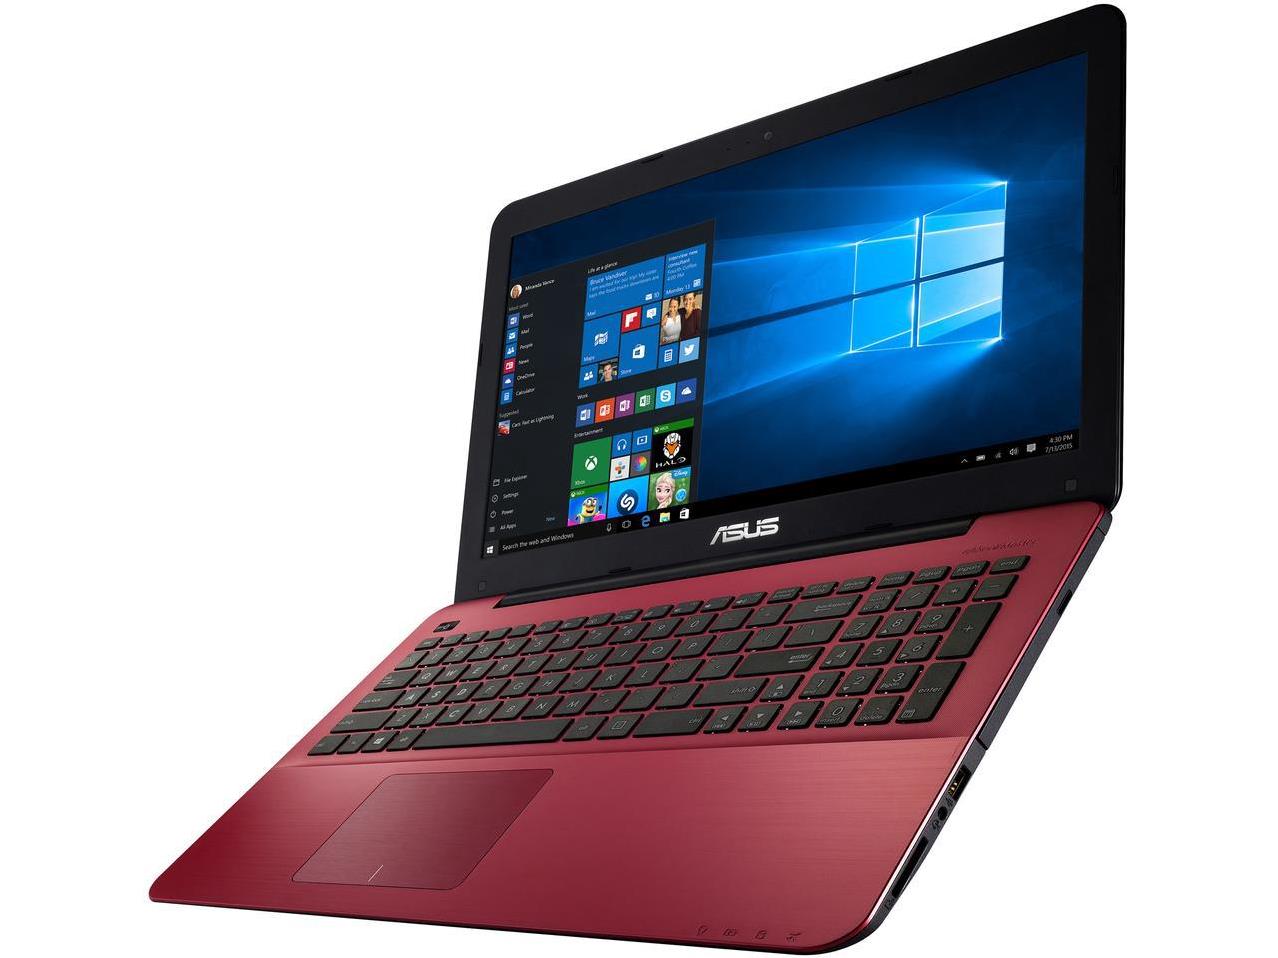
Recensione breve del Portatile Asus X555DA (A10-8700P, FHD)
| SD Card Reader | |
| average JPG Copy Test (av. of 3 runs) | |
| HP Pavilion 15t-X7P42AV | |
| Asus X555DA-BB11 | |
| Toshiba Satellite Pro R50-C-16V | |
| maximum AS SSD Seq Read Test (1GB) | |
| HP Pavilion 15t-X7P42AV | |
| Asus X555DA-BB11 | |
| Toshiba Satellite Pro R50-C-16V | |
| Networking | |
| iperf3 transmit AX12 | |
| HP Pavilion 15t-X7P42AV | |
| Toshiba Satellite Pro R50-C-16V | |
| Asus X555DA-BB11 | |
| iperf3 receive AX12 | |
| HP Pavilion 15t-X7P42AV | |
| Asus X555DA-BB11 | |
| Toshiba Satellite Pro R50-C-16V | |
| |||||||||||||||||||||||||
Distribuzione della luminosità: 88 %
Al centro con la batteria: 242.7 cd/m²
Contrasto: 467:1 (Nero: 0.52 cd/m²)
ΔE ColorChecker Calman: 4.9 | ∀{0.5-29.43 Ø4.71}
ΔE Greyscale Calman: 2.7 | ∀{0.09-98 Ø4.96}
52.5% sRGB (Argyll 1.6.3 3D)
33.5% AdobeRGB 1998 (Argyll 1.6.3 3D)
36.29% AdobeRGB 1998 (Argyll 3D)
52.7% sRGB (Argyll 3D)
35.12% Display P3 (Argyll 3D)
Gamma: 2.34
CCT: 6876 K
| Asus X555DA-BB11 TN LED, 15.6", 1920x1080 | Toshiba Satellite Pro R50-C-16V Toshiba, TN LED, 15.6", 1366x768 | Lenovo Ideapad 110-15ACL 80TJ00H0GE BOE NT156WHM-N32, TN LED, 15.6", 1366x768 | HP Pavilion 15t-X7P42AV AU Optronics AUO41ED, IPS, 15.6", 1920x1080 | Asus X555LN-XO112H AU Optronics B156XW04 V6, TN LED, 15.6", 1366x768 | |
|---|---|---|---|---|---|
| Display | 16% | 6% | 8% | 41% | |
| Display P3 Coverage (%) | 35.12 | 40.6 16% | 37.39 6% | 38.03 8% | 49.95 42% |
| sRGB Coverage (%) | 52.7 | 61.2 16% | 56.2 7% | 56.5 7% | 73.9 40% |
| AdobeRGB 1998 Coverage (%) | 36.29 | 41.95 16% | 38.63 6% | 39.29 8% | 51.7 42% |
| Response Times | -39% | -21% | -14% | ||
| Response Time Grey 50% / Grey 80% * (ms) | 42 ? | 68 ? -62% | 58 -38% | 44.4 ? -6% | |
| Response Time Black / White * (ms) | 22.4 ? | 26 ? -16% | 23 -3% | 27.2 ? -21% | |
| PWM Frequency (Hz) | 217 ? | 200 ? | |||
| Screen | -40% | -32% | -7% | -86% | |
| Brightness middle (cd/m²) | 242.7 | 226 -7% | 253 4% | 209.7 -14% | 189 -22% |
| Brightness (cd/m²) | 232 | 217 -6% | 246 6% | 193 -17% | 184 -21% |
| Brightness Distribution (%) | 88 | 91 3% | 86 -2% | 75 -15% | 92 5% |
| Black Level * (cd/m²) | 0.52 | 0.58 -12% | 0.44 15% | 0.19 63% | 2.2 -323% |
| Contrast (:1) | 467 | 390 -16% | 575 23% | 1104 136% | 86 -82% |
| Colorchecker dE 2000 * | 4.9 | 9.84 -101% | 9.2 -88% | 7.8 -59% | 7.77 -59% |
| Colorchecker dE 2000 max. * | 20.3 | 16.77 17% | 17.68 13% | 24.1 -19% | |
| Greyscale dE 2000 * | 2.7 | 11.1 -311% | 11.05 -309% | 7.3 -170% | 8.82 -227% |
| Gamma | 2.34 94% | 2.35 94% | 2.55 86% | 2.39 92% | 2.43 91% |
| CCT | 6876 95% | 11979 54% | 11451 57% | 5771 113% | 9275 70% |
| Color Space (Percent of AdobeRGB 1998) (%) | 33.5 | 39 16% | 36 7% | 39.3 17% | 48 43% |
| Color Space (Percent of sRGB) (%) | 52.5 | 61 16% | 56 7% | 56.5 8% | |
| Media totale (Programma / Settaggio) | -21% /
-29% | -16% /
-23% | -4% /
-5% | -23% /
-51% |
* ... Meglio usare valori piccoli
Tempi di risposta del Display
| ↔ Tempi di risposta dal Nero al Bianco | ||
|---|---|---|
| 22.4 ms ... aumenta ↗ e diminuisce ↘ combinato | ↗ 14.4 ms Incremento | 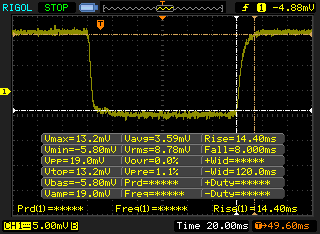 |
| ↘ 8 ms Calo | ||
| Lo schermo mostra buoni tempi di risposta durante i nostri tests, ma potrebbe essere troppo lento per i gamers competitivi. In confronto, tutti i dispositivi di test variano da 0.1 (minimo) a 240 (massimo) ms. » 51 % di tutti i dispositivi è migliore. Questo significa che i tempi di risposta rilevati sono peggiori rispetto alla media di tutti i dispositivi testati (19.8 ms). | ||
| ↔ Tempo di risposta dal 50% Grigio all'80% Grigio | ||
| 42 ms ... aumenta ↗ e diminuisce ↘ combinato | ↗ 23.6 ms Incremento | 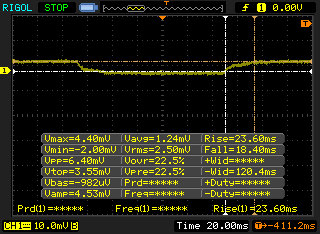 |
| ↘ 18.4 ms Calo | ||
| Lo schermo mostra tempi di risposta lenti nei nostri tests e sarà insoddisfacente per i gamers. In confronto, tutti i dispositivi di test variano da 0.165 (minimo) a 636 (massimo) ms. » 67 % di tutti i dispositivi è migliore. Questo significa che i tempi di risposta rilevati sono peggiori rispetto alla media di tutti i dispositivi testati (31 ms). | ||
Sfarfallio dello schermo / PWM (Pulse-Width Modulation)
| flickering dello schermo / PWM non rilevato | 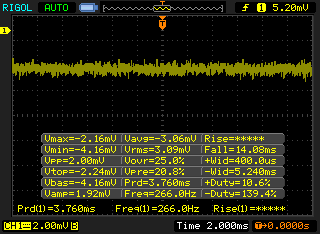 | ||
In confronto: 52 % di tutti i dispositivi testati non utilizza PWM per ridurre la luminosita' del display. Se è rilevato PWM, una media di 7757 (minimo: 5 - massimo: 343500) Hz è stata rilevata. | |||
| Cinebench R15 | |
| CPU Single 64Bit | |
| Lenovo ThinkPad X1 Tablet | |
| HP ProBook 640 G2-T9X60ET | |
| HP 250 G4 T6P08ES | |
| Lenovo IdeaPad Z40-59422614 | |
| Microsoft Surface Pro 4, Core m3 | |
| Asus X555DA-BB11 | |
| Dell Venue 10 Pro 5056 | |
| Toshiba Satellite Click 10 LX0W-C-104 | |
| CPU Multi 64Bit | |
| HP ProBook 640 G2-T9X60ET | |
| HP 250 G4 T6P08ES | |
| Lenovo ThinkPad X1 Tablet | |
| Lenovo IdeaPad Z40-59422614 | |
| Microsoft Surface Pro 4, Core m3 | |
| Asus X555DA-BB11 | |
| Dell Venue 10 Pro 5056 | |
| Toshiba Satellite Click 10 LX0W-C-104 | |
| Cinebench R11.5 | |
| CPU Single 64Bit | |
| HP ProBook 640 G2-T9X60ET | |
| HP 250 G4 T6P08ES | |
| Lenovo IdeaPad Z40-59422614 | |
| Lenovo ThinkPad X1 Tablet | |
| Microsoft Surface Pro 4, Core m3 | |
| Asus X555DA-BB11 | |
| Dell Venue 10 Pro 5056 | |
| Toshiba Satellite Click 10 LX0W-C-104 | |
| CPU Multi 64Bit | |
| HP ProBook 640 G2-T9X60ET | |
| HP 250 G4 T6P08ES | |
| Lenovo ThinkPad X1 Tablet | |
| Lenovo IdeaPad Z40-59422614 | |
| Asus X555DA-BB11 | |
| Microsoft Surface Pro 4, Core m3 | |
| Dell Venue 10 Pro 5056 | |
| Toshiba Satellite Click 10 LX0W-C-104 | |
| Cinebench R10 | |
| Rendering Multiple CPUs 32Bit | |
| HP ProBook 640 G2-T9X60ET | |
| HP 250 G4 T6P08ES | |
| Lenovo IdeaPad Z40-59422614 | |
| Microsoft Surface Pro 4, Core m3 | |
| Asus X555DA-BB11 | |
| Dell Venue 10 Pro 5056 | |
| Toshiba Satellite Click 10 LX0W-C-104 | |
| Rendering Single 32Bit | |
| HP ProBook 640 G2-T9X60ET | |
| HP 250 G4 T6P08ES | |
| Lenovo IdeaPad Z40-59422614 | |
| Microsoft Surface Pro 4, Core m3 | |
| Asus X555DA-BB11 | |
| Dell Venue 10 Pro 5056 | |
| Toshiba Satellite Click 10 LX0W-C-104 | |
| wPrime 2.10 - 1024m | |
| Lenovo IdeaPad Z40-59422614 | |
| Microsoft Surface Pro 4, Core m3 | |
| Lenovo ThinkPad X1 Tablet | |
| Asus X555DA-BB11 | |
* ... Meglio usare valori piccoli
| PCMark 8 | |
| Home Score Accelerated v2 | |
| HP Pavilion 15t-X7P42AV | |
| Asus Vivobook F556UQ-XO626D | |
| Toshiba Satellite Pro R50-C-16V | |
| Asus X555DA-BB11 | |
| Lenovo Ideapad 110-15ACL 80TJ00H0GE | |
| Work Score Accelerated v2 | |
| Asus Vivobook F556UQ-XO626D | |
| Toshiba Satellite Pro R50-C-16V | |
| Asus X555DA-BB11 | |
| HP Pavilion 15t-X7P42AV | |
| Creative Score Accelerated v2 | |
| HP Pavilion 15t-X7P42AV | |
| Asus Vivobook F556UQ-XO626D | |
| Toshiba Satellite Pro R50-C-16V | |
| Asus X555DA-BB11 | |
| PCMark 8 Home Score Accelerated v2 | 2335 punti | |
| PCMark 8 Creative Score Accelerated v2 | 2856 punti | |
| PCMark 8 Work Score Accelerated v2 | 3246 punti | |
Aiuto | ||
| Asus X555DA-BB11 Seagate Momentus SpinPoint M8 ST1000LM024 HN-M101MBB | Toshiba Satellite Pro R50-C-16V TOSHIBA MQ01ABD075 | Lenovo Ideapad 110-15ACL 80TJ00H0GE Seagate Mobile HDD 1TB ST1000LM035 | HP Pavilion 15t-X7P42AV Samsung CM871a MZNTY128HDHP | Asus X555LN-XO112H Toshiba MQ01ABF050 | |
|---|---|---|---|---|---|
| CrystalDiskMark 3.0 | -12% | -13% | 12908% | 28% | |
| Read Seq (MB/s) | 106.9 | 96.5 -10% | 92.1 -14% | 522 388% | 105.8 -1% |
| Write Seq (MB/s) | 97.5 | 77.9 -20% | 88.5 -9% | 476.6 389% | 104 7% |
| Read 512 (MB/s) | 32.28 | 20.82 -36% | 32.94 2% | 399.7 1138% | 35.72 11% |
| Write 512 (MB/s) | 35.39 | 19.83 -44% | 26.71 -25% | 185.4 424% | 44.85 27% |
| Read 4k (MB/s) | 0.373 | 0.342 -8% | 0.372 0% | 33.12 8779% | 0.47 26% |
| Write 4k (MB/s) | 0.636 | 0.836 31% | 0.283 -56% | 89.8 14019% | 1.044 64% |
| Read 4k QD32 (MB/s) | 0.694 | 0.595 -14% | 0.921 33% | 400.9 57667% | 0.894 29% |
| Write 4k QD32 (MB/s) | 0.682 | 0.706 4% | 0.473 -31% | 140.2 20457% | 1.099 61% |

| 3DMark | |
| 1280x720 Cloud Gate Standard Graphics | |
| HP Pavilion 15t-X7P42AV | |
| Asus X555LN-XO112H | |
| Microsoft Surface Pro 4, Core m3 | |
| HP ProBook 640 G2-T9X60ET | |
| Lenovo IdeaPad Z40-59422614 | |
| Lenovo ThinkPad X1 Tablet | |
| HP 250 G4 T6P08ES | |
| Asus X555DA-BB11 | |
| Dell Venue 10 Pro 5056 | |
| Toshiba Satellite Click 10 LX0W-C-104 | |
| 1920x1080 Fire Strike Graphics | |
| HP Pavilion 15t-X7P42AV | |
| Asus X555LN-XO112H | |
| HP 250 G4 T6P08ES | |
| Lenovo IdeaPad Z40-59422614 | |
| Microsoft Surface Pro 4, Core m3 | |
| HP ProBook 640 G2-T9X60ET | |
| Asus X555DA-BB11 | |
| Lenovo ThinkPad X1 Tablet | |
| Dell Venue 10 Pro 5056 | |
| Toshiba Satellite Click 10 LX0W-C-104 | |
| 1280x720 Ice Storm Standard Graphics | |
| HP Pavilion 15t-X7P42AV | |
| Asus X555LN-XO112H | |
| Lenovo IdeaPad Z40-59422614 | |
| HP 250 G4 T6P08ES | |
| Lenovo ThinkPad X1 Tablet | |
| Microsoft Surface Pro 4, Core m3 | |
| HP ProBook 640 G2-T9X60ET | |
| Asus X555DA-BB11 | |
| Dell Venue 10 Pro 5056 | |
| Toshiba Satellite Click 10 LX0W-C-104 | |
| 3DMark 11 Performance | 1297 punti | |
| 3DMark Ice Storm Standard Score | 31586 punti | |
| 3DMark Cloud Gate Standard Score | 3248 punti | |
| 3DMark Fire Strike Score | 666 punti | |
| 3DMark Fire Strike Extreme Score | 337 punti | |
Aiuto | ||
| basso | medio | alto | ultra | |
|---|---|---|---|---|
| BioShock Infinite (2013) | 36.3 | |||
| Dota 2 Reborn (2015) | 28.2 | |||
| Rise of the Tomb Raider (2016) | 17 |
Rumorosità
| Idle |
| 31.6 / 32 / 32.4 dB(A) |
| Sotto carico |
| 33.3 / 35.5 dB(A) |
 | ||
30 dB silenzioso 40 dB(A) udibile 50 dB(A) rumoroso |
||
min: | ||
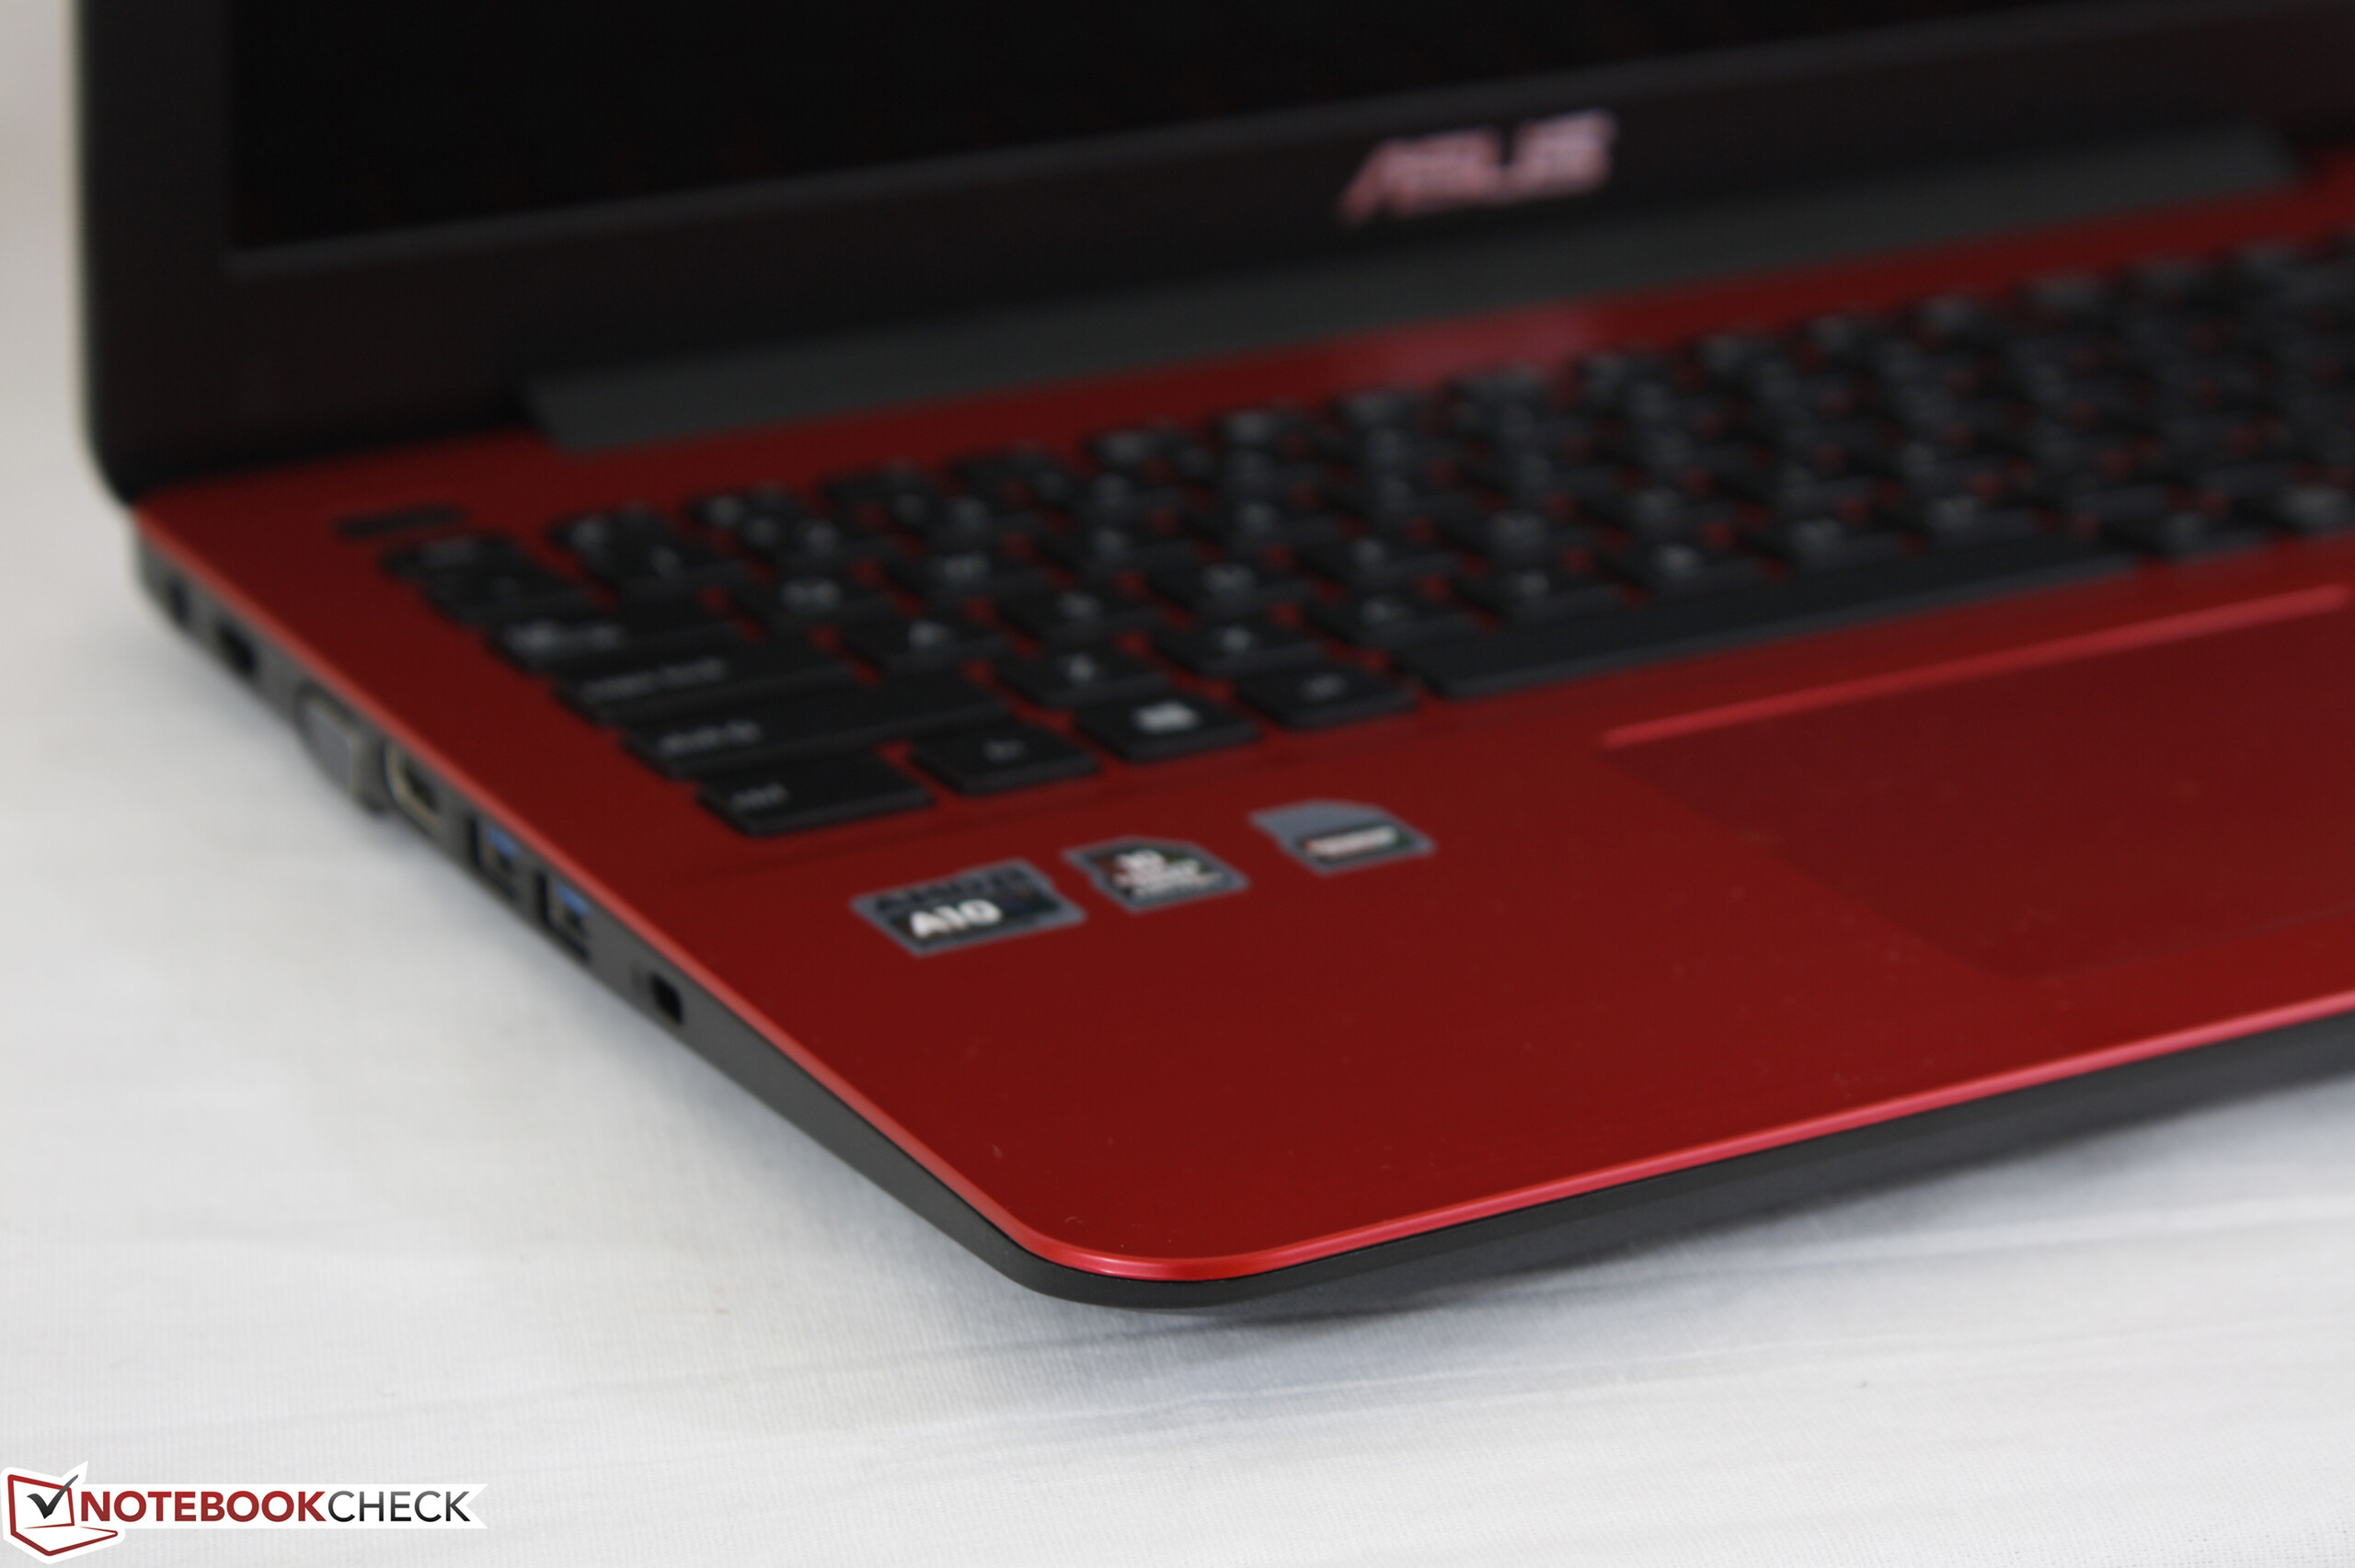
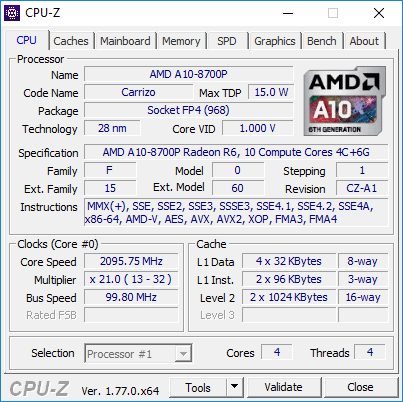
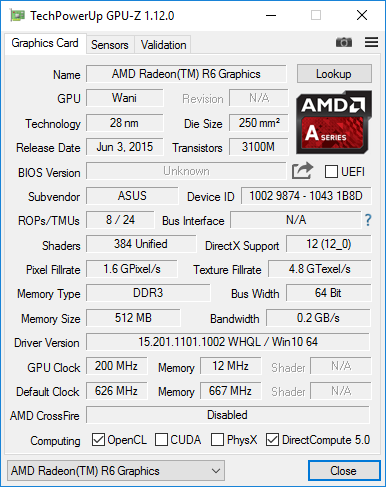
| Asus X555DA-BB11 Radeon R6 (Carrizo), A10-8700P, Seagate Momentus SpinPoint M8 ST1000LM024 HN-M101MBB | Toshiba Satellite Pro R50-C-16V HD Graphics 520, 6006U, TOSHIBA MQ01ABD075 | Lenovo Ideapad 110-15ACL 80TJ00H0GE Radeon R5 (Beema/Carrizo-L), A8-7410, Seagate Mobile HDD 1TB ST1000LM035 | HP Pavilion 15t-X7P42AV GeForce GTX 1050 Mobile, i7-7700HQ, Samsung CM871a MZNTY128HDHP | Asus X555LN-XO112H GeForce 840M, 4210U, Toshiba MQ01ABF050 | Asus Vivobook F556UQ-XO626D GeForce 940MX, 6198DU, Toshiba MQ01ABF050 | |
|---|---|---|---|---|---|---|
| Noise | 2% | 3% | -13% | -8% | -6% | |
| off /ambiente * (dB) | 28.9 | 30.4 -5% | 30.4 -5% | 29.3 -1% | 30.7 -6% | |
| Idle Minimum * (dB) | 31.6 | 31.8 -1% | 30.9 2% | 32.3 -2% | 31.7 -0% | 32 -1% |
| Idle Average * (dB) | 32 | 31.8 1% | 30.9 3% | 32.3 -1% | 31.7 1% | 32 -0% |
| Idle Maximum * (dB) | 32.4 | 31.8 2% | 31 4% | 32.4 -0% | 31.8 2% | 32.2 1% |
| Load Average * (dB) | 33.3 | 31.9 4% | 31.8 5% | 44.4 -33% | 40.8 -23% | 37.3 -12% |
| Load Maximum * (dB) | 35.5 | 31.8 10% | 31.9 10% | 49.2 -39% | 43.2 -22% | 42.6 -20% |
* ... Meglio usare valori piccoli
(+) La temperatura massima sul lato superiore è di 36.8 °C / 98 F, rispetto alla media di 36.8 °C / 98 F, che varia da 21 a 71 °C per questa classe Multimedia.
(±) Il lato inferiore si riscalda fino ad un massimo di 45 °C / 113 F, rispetto alla media di 39.1 °C / 102 F
(+) In idle, la temperatura media del lato superiore è di 27 °C / 81 F, rispetto alla media deld ispositivo di 31.3 °C / 88 F.
(+) I poggiapolsi e il touchpad sono piu' freddi della temperatura della pelle con un massimo di 30 °C / 86 F e sono quindi freddi al tatto.
(±) La temperatura media della zona del palmo della mano di dispositivi simili e'stata di 28.7 °C / 83.7 F (-1.3 °C / -2.3 F).
Asus X555DA-BB11 analisi audio
(±) | potenza degli altiparlanti media ma buona (76.4 dB)
Bassi 100 - 315 Hz
(-) | quasi nessun basso - in media 21.4% inferiori alla media
(±) | la linearità dei bassi è media (13.5% delta rispetto alla precedente frequenza)
Medi 400 - 2000 Hz
(±) | medi ridotti - circa 5.1% inferiori alla media
(±) | linearità dei medi adeguata (14.6% delta rispetto alla precedente frequenza)
Alti 2 - 16 kHz
(±) | alti elevati - circa 7.2% superiori alla media
(±) | la linearità degli alti è media (14.6% delta rispetto alla precedente frequenza)
Nel complesso 100 - 16.000 Hz
(±) | la linearità complessiva del suono è media (29% di differenza rispetto alla media
Rispetto alla stessa classe
» 95% di tutti i dispositivi testati in questa classe è stato migliore, 1% simile, 4% peggiore
» Il migliore ha avuto un delta di 5%, medio di 17%, peggiore di 45%
Rispetto a tutti i dispositivi testati
» 87% di tutti i dispositivi testati in questa classe è stato migliore, 2% similare, 11% peggiore
» Il migliore ha avuto un delta di 4%, medio di 23%, peggiore di 134%
Apple MacBook 12 (Early 2016) 1.1 GHz analisi audio
(+) | gli altoparlanti sono relativamente potenti (83.6 dB)
Bassi 100 - 315 Hz
(±) | bassi ridotti - in media 11.3% inferiori alla media
(±) | la linearità dei bassi è media (14.2% delta rispetto alla precedente frequenza)
Medi 400 - 2000 Hz
(+) | medi bilanciati - solo only 2.4% rispetto alla media
(+) | medi lineari (5.5% delta rispetto alla precedente frequenza)
Alti 2 - 16 kHz
(+) | Alti bilanciati - appena 2% dalla media
(+) | alti lineari (4.5% delta rispetto alla precedente frequenza)
Nel complesso 100 - 16.000 Hz
(+) | suono nel complesso lineare (10.2% differenza dalla media)
Rispetto alla stessa classe
» 7% di tutti i dispositivi testati in questa classe è stato migliore, 2% simile, 90% peggiore
» Il migliore ha avuto un delta di 5%, medio di 18%, peggiore di 53%
Rispetto a tutti i dispositivi testati
» 5% di tutti i dispositivi testati in questa classe è stato migliore, 1% similare, 94% peggiore
» Il migliore ha avuto un delta di 4%, medio di 23%, peggiore di 134%
| Off / Standby | |
| Idle | |
| Sotto carico |
|
Leggenda:
min: | |
| Asus X555DA-BB11 A10-8700P, Radeon R6 (Carrizo), Seagate Momentus SpinPoint M8 ST1000LM024 HN-M101MBB, TN LED, 1920x1080, 15.6" | Toshiba Satellite Pro R50-C-16V 6006U, HD Graphics 520, TOSHIBA MQ01ABD075, TN LED, 1366x768, 15.6" | Lenovo Ideapad 110-15ACL 80TJ00H0GE A8-7410, Radeon R5 (Beema/Carrizo-L), Seagate Mobile HDD 1TB ST1000LM035, TN LED, 1366x768, 15.6" | HP Pavilion 15t-X7P42AV i7-7700HQ, GeForce GTX 1050 Mobile, Samsung CM871a MZNTY128HDHP, IPS, 1920x1080, 15.6" | Asus X555LN-XO112H 4210U, GeForce 840M, Toshiba MQ01ABF050, TN LED, 1366x768, 15.6" | |
|---|---|---|---|---|---|
| Power Consumption | 29% | 35% | -68% | 19% | |
| Idle Minimum * (Watt) | 8.3 | 6 28% | 5.4 35% | 8.29 -0% | 4.2 49% |
| Idle Average * (Watt) | 8.6 | 8.7 -1% | 6.8 21% | 8.9 -3% | 6.3 27% |
| Idle Maximum * (Watt) | 13.1 | 9.2 30% | 7.3 44% | 10.2 22% | 7.1 46% |
| Load Average * (Watt) | 31.2 | 18.6 40% | 21.1 32% | 77.1 -147% | 35.2 -13% |
| Load Maximum * (Watt) | 43.9 | 23.8 46% | 25.5 42% | 136.6 -211% | 49.2 -12% |
* ... Meglio usare valori piccoli
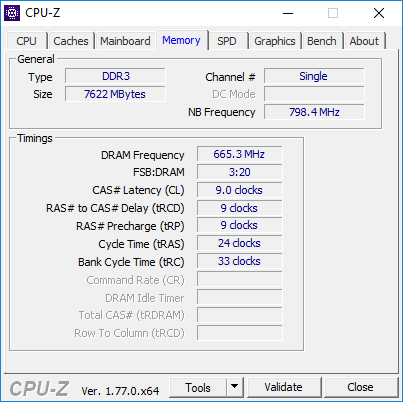
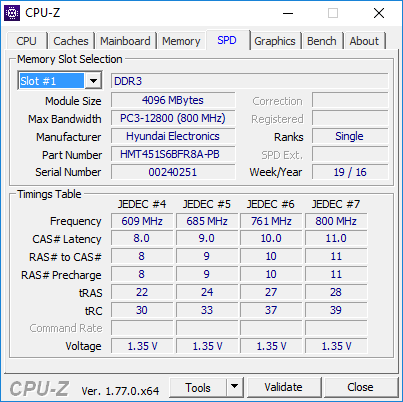
| Asus X555DA-BB11 A10-8700P, Radeon R6 (Carrizo), 37 Wh | Toshiba Satellite Pro R50-C-16V 6006U, HD Graphics 520, 44 Wh | Lenovo Ideapad 110-15ACL 80TJ00H0GE A8-7410, Radeon R5 (Beema/Carrizo-L), 24 Wh | HP Pavilion 15t-X7P42AV i7-7700HQ, GeForce GTX 1050 Mobile, 63.3 Wh | Asus X555LN-XO112H 4210U, GeForce 840M, 37 Wh | |
|---|---|---|---|---|---|
| Autonomia della batteria | 103% | 17% | 100% | ||
| Reader / Idle (h) | 7.3 | 16 119% | |||
| WiFi v1.3 (h) | 2.9 | 5.9 103% | 3.4 17% | 6.5 124% | |
| Load (h) | 1.2 | 1.9 58% | |||
| WiFi (h) | 4.3 |
Pro
Contro
L'X555DA è difficilmente raccomandabile, soprattutto quando le vecchie Intel X555LN o X555LD SKU possono superare e durare più al lungo del nostro equivalente AMD. Normalmente, quando l'hardware è più lento e più economico, gli utenti sono più propensi ad aspettarsi maggiore durata della batteria e temperature più basse di base. L'X555DA è il peggiore dei due mondi sia le perfomance che durata della batteria sono sotto la media.
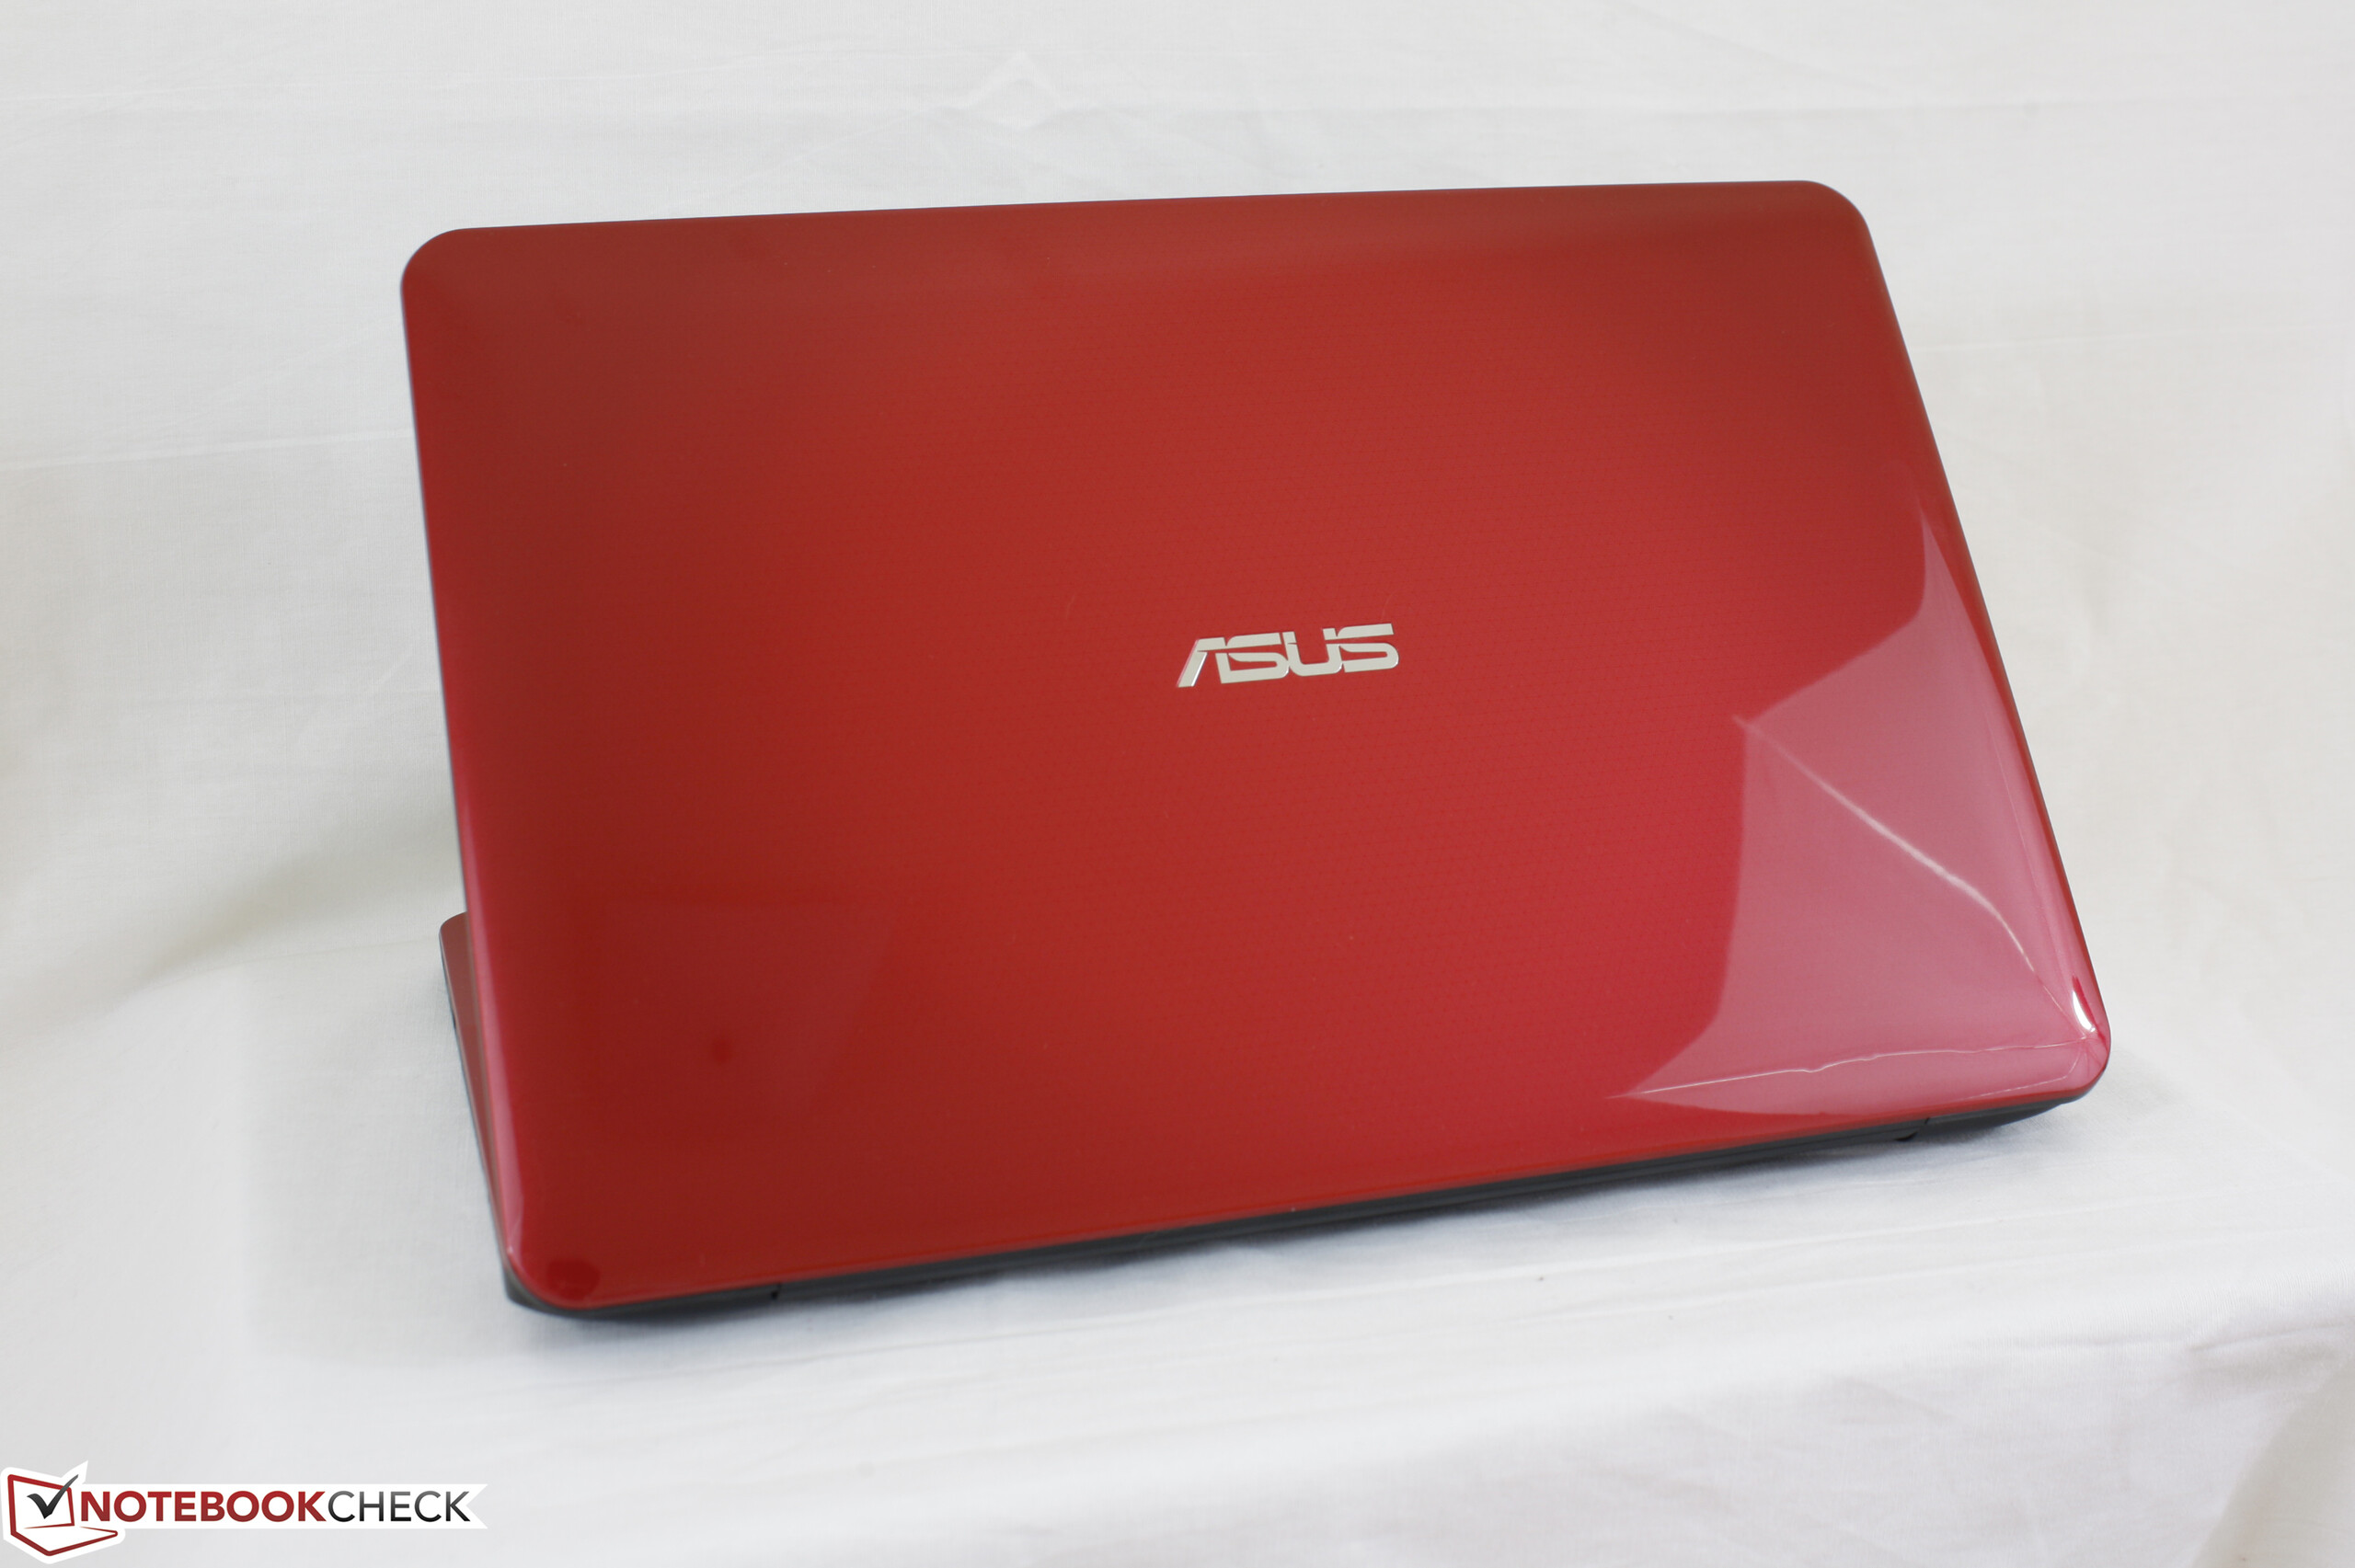
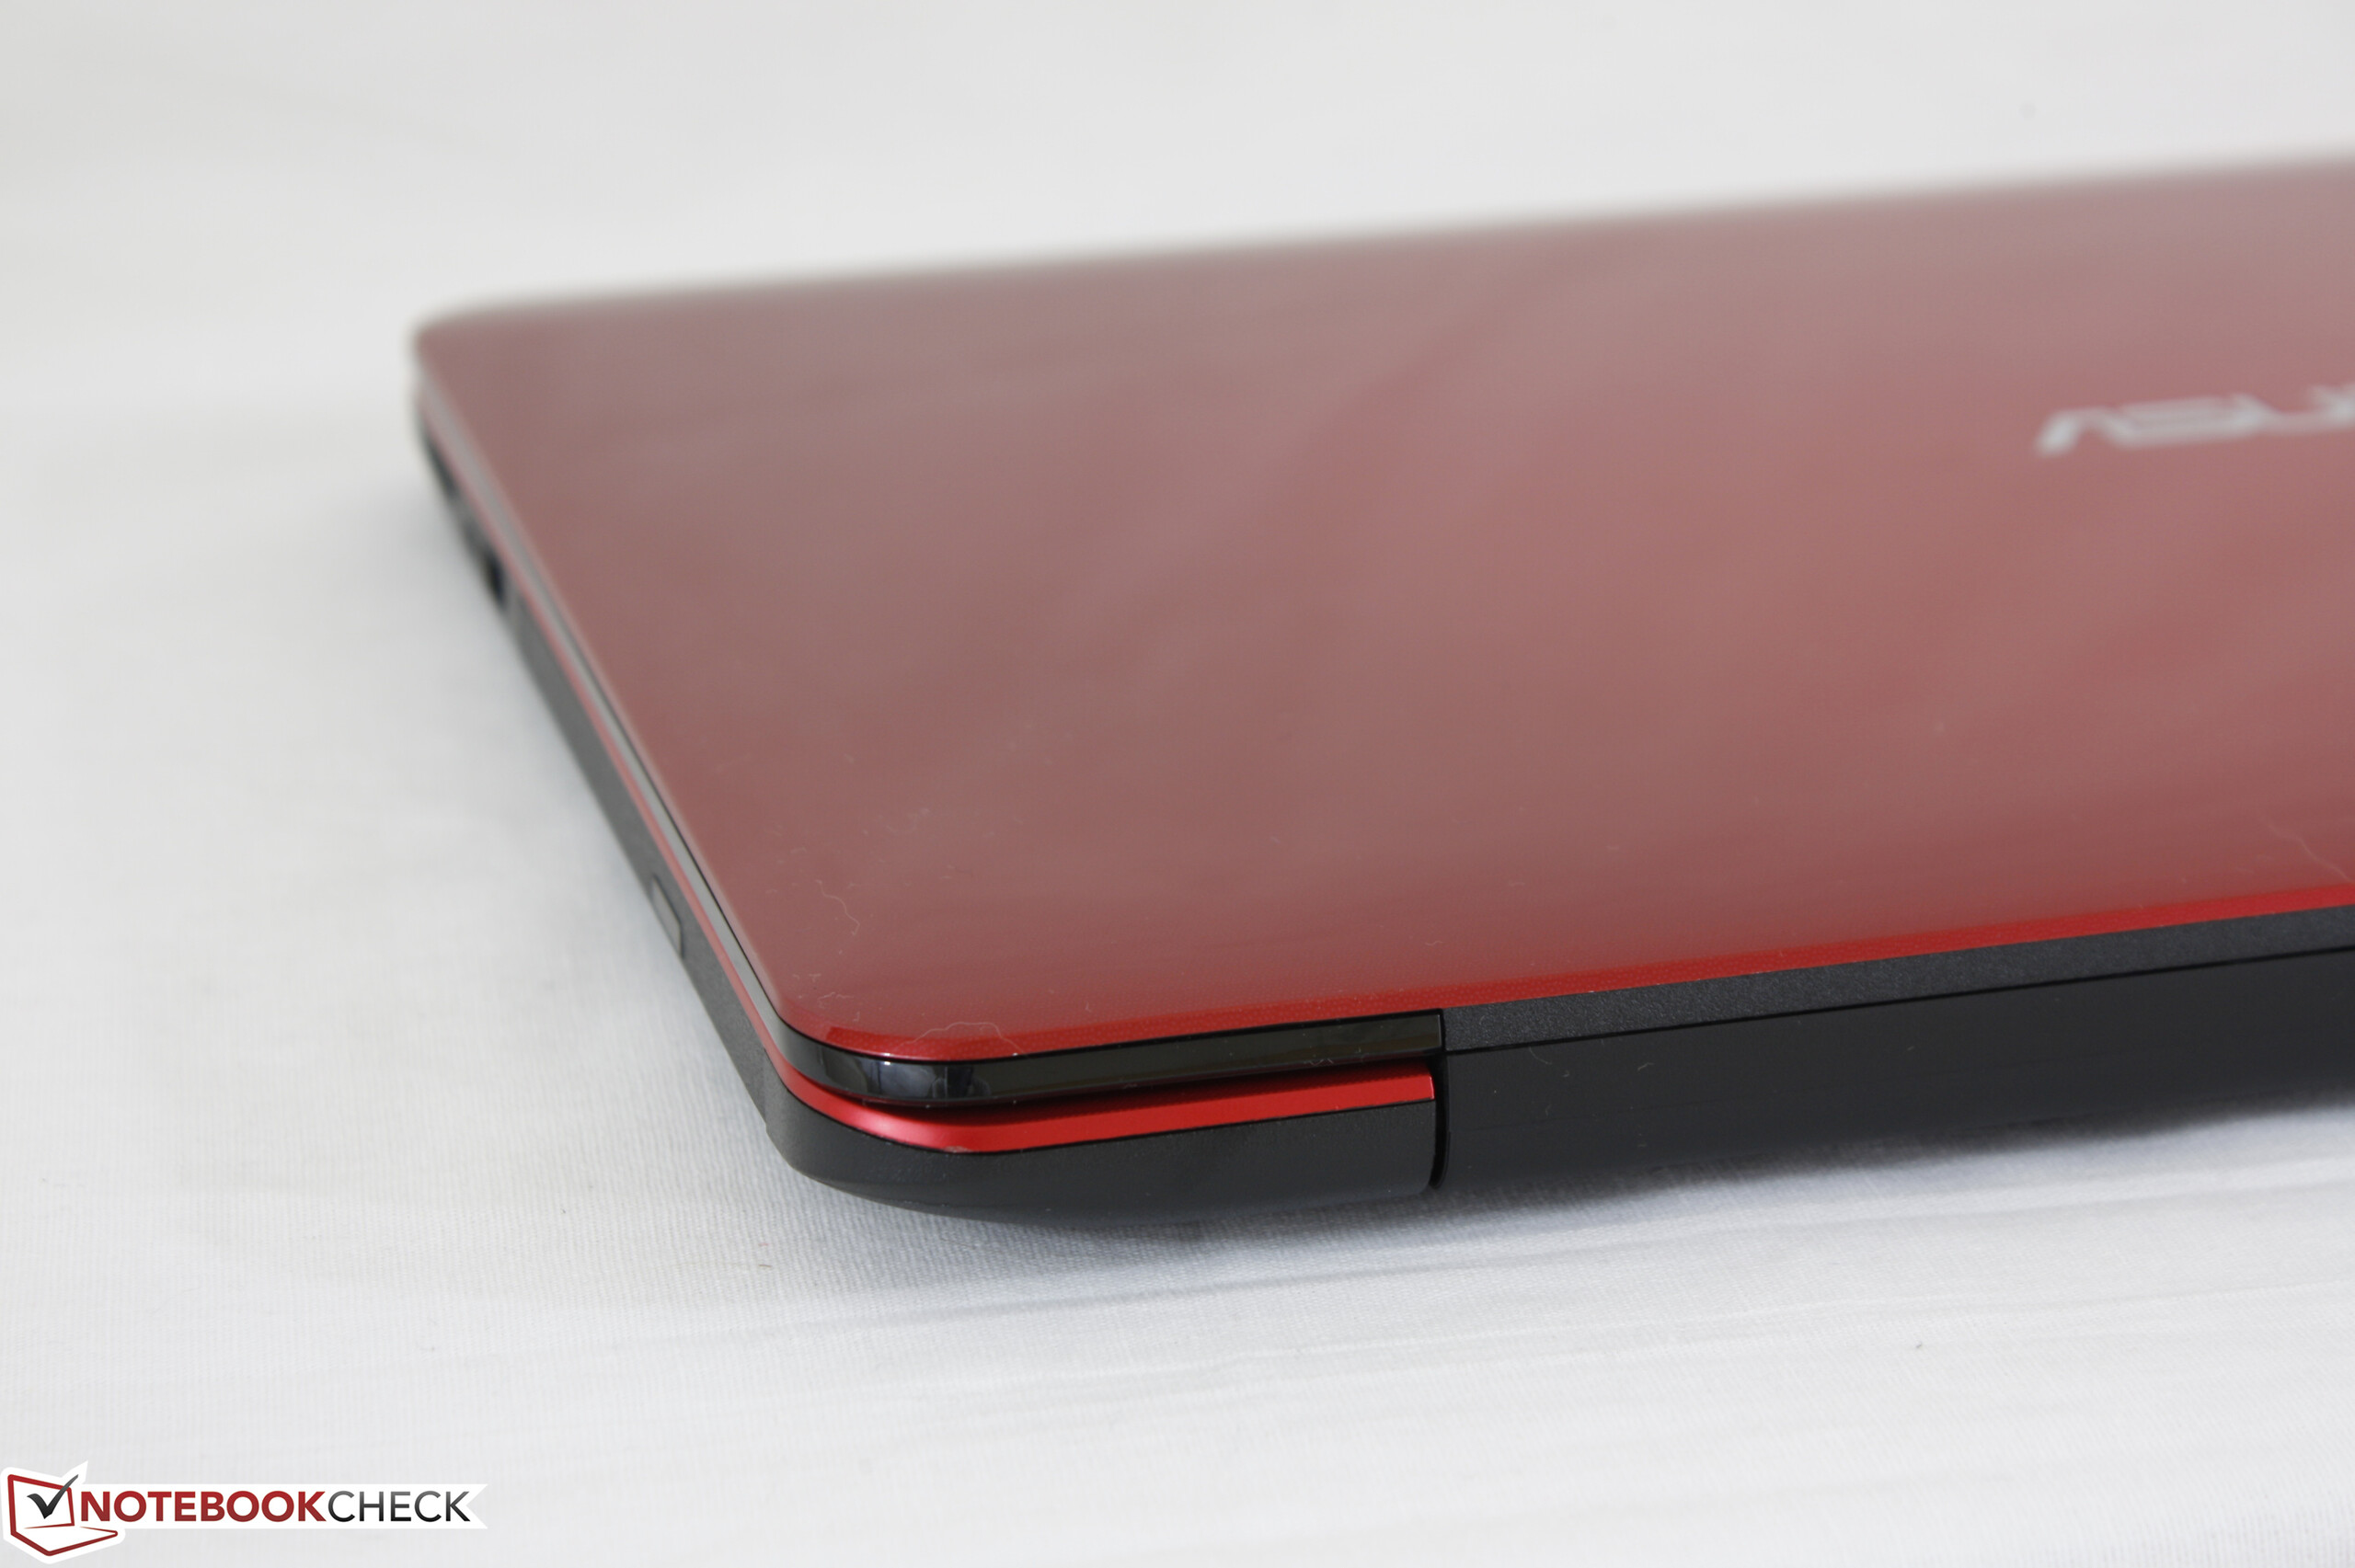
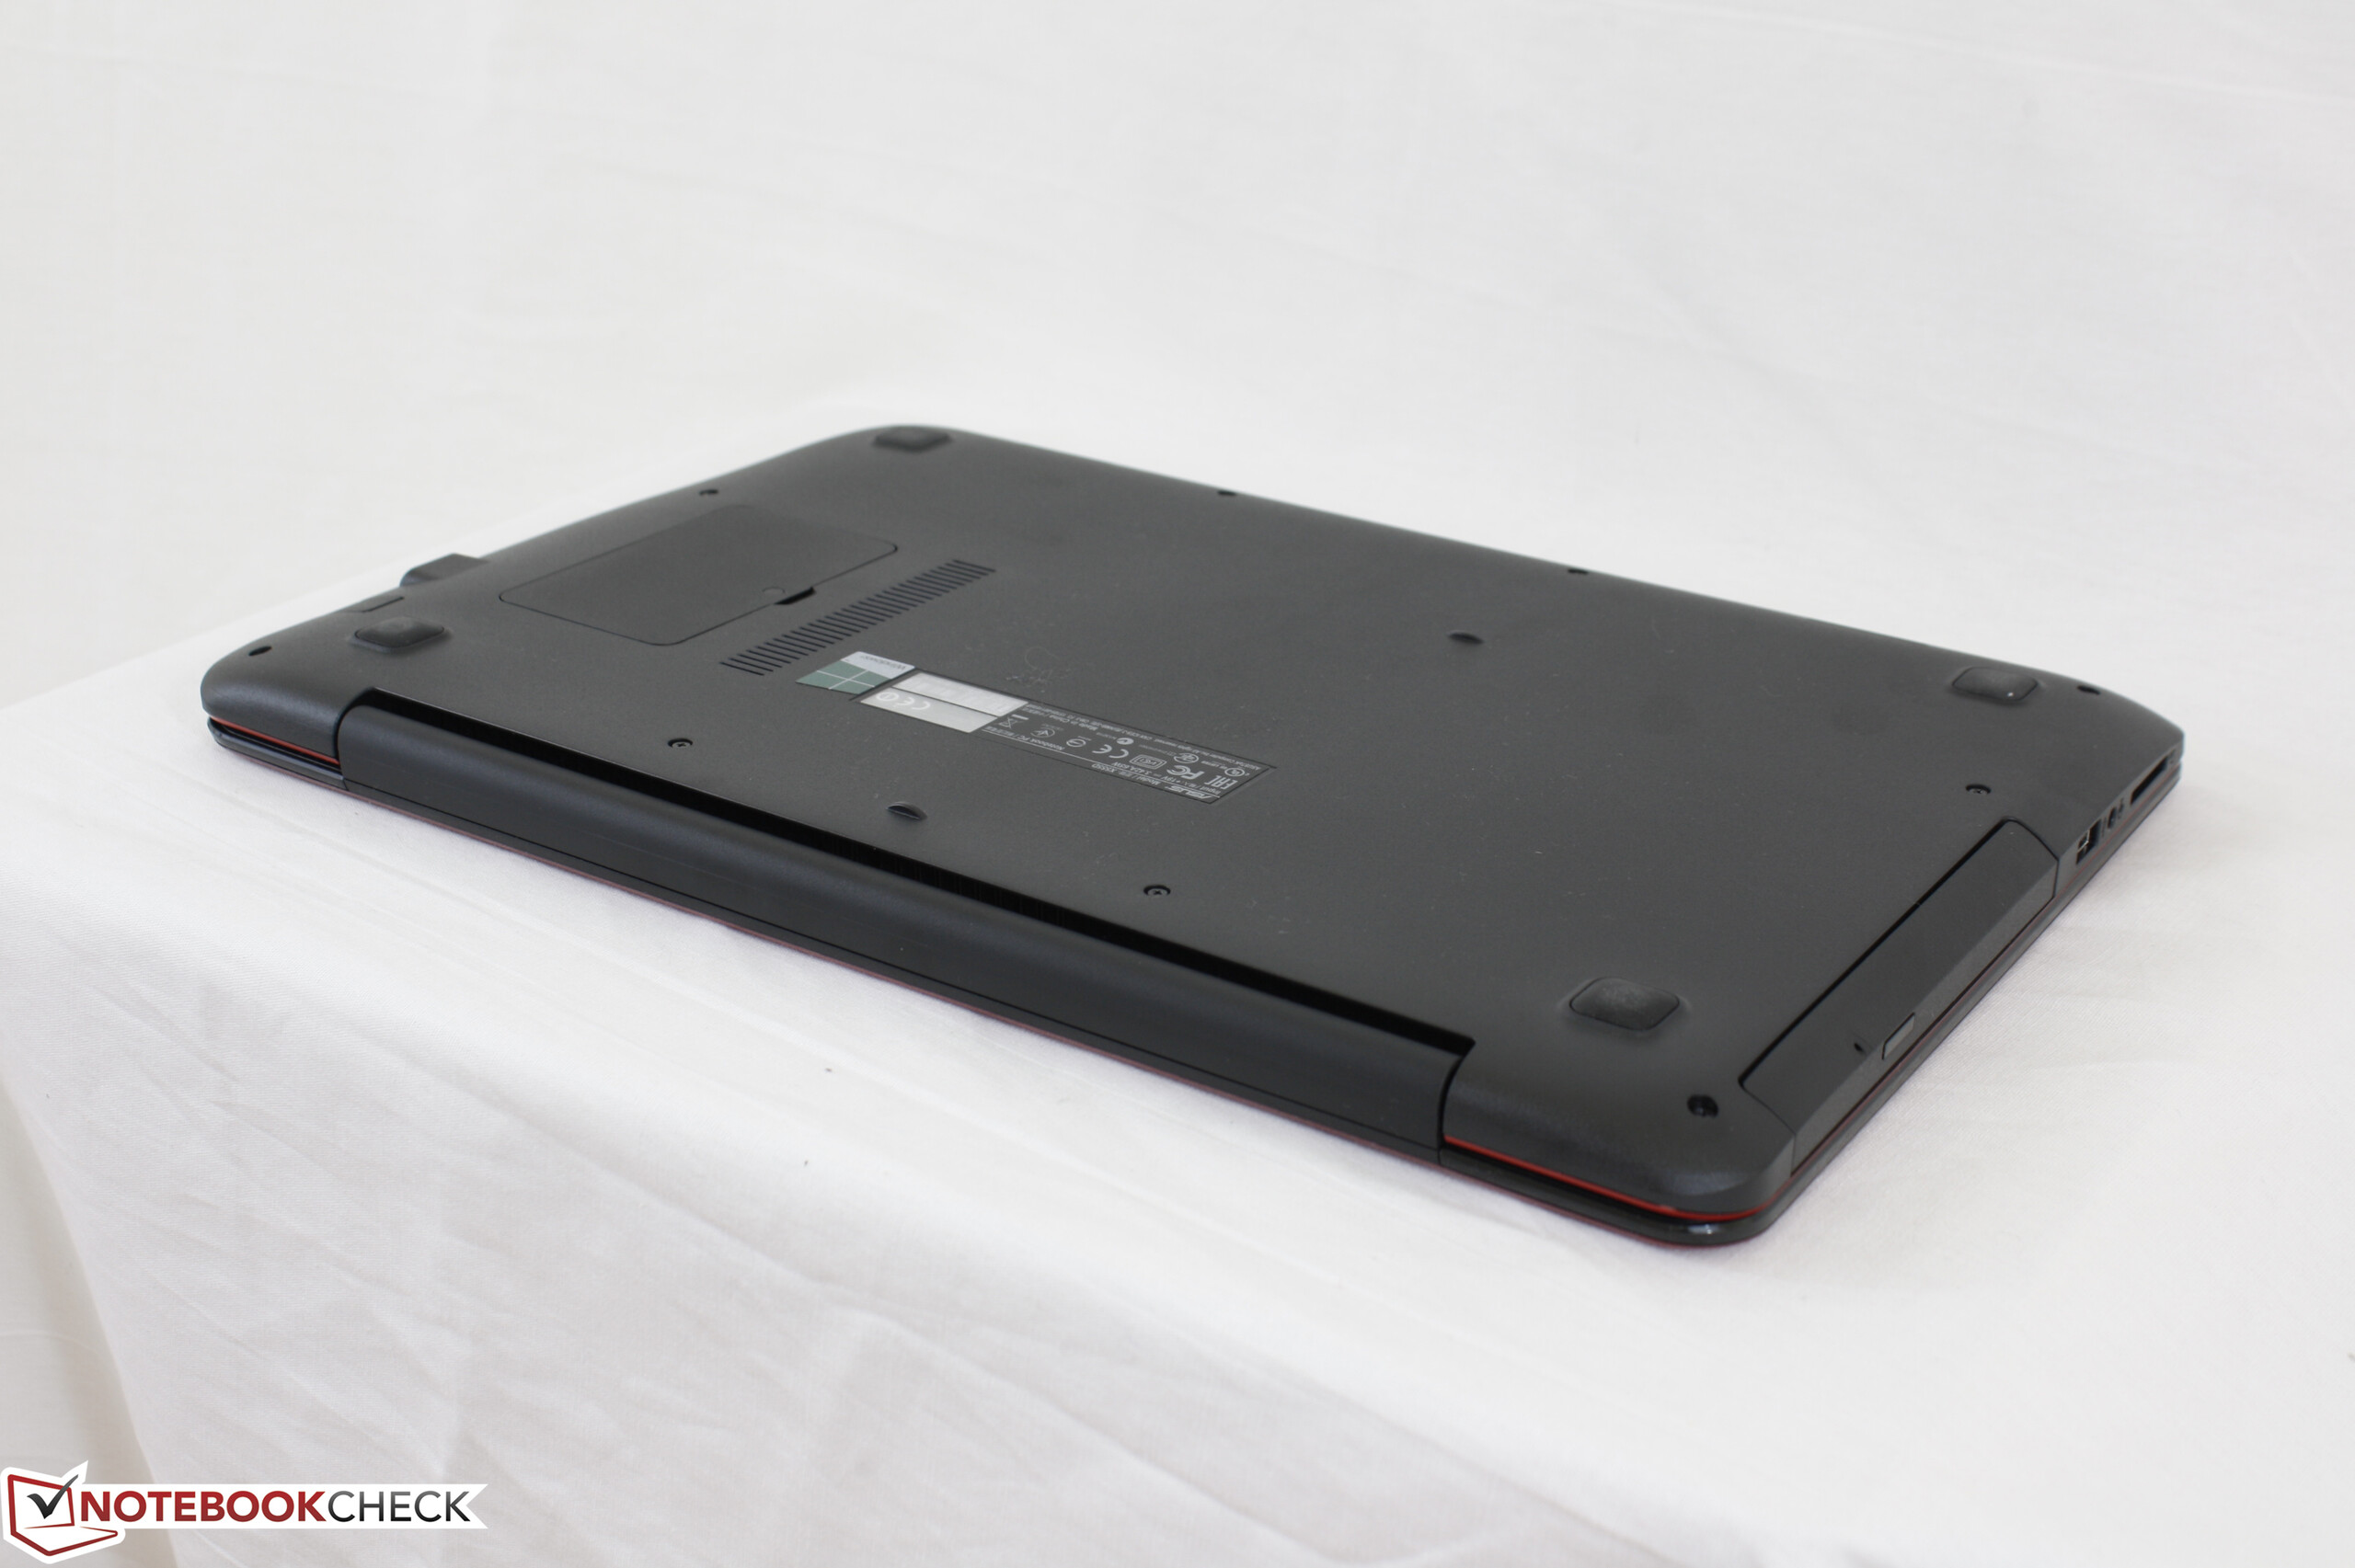
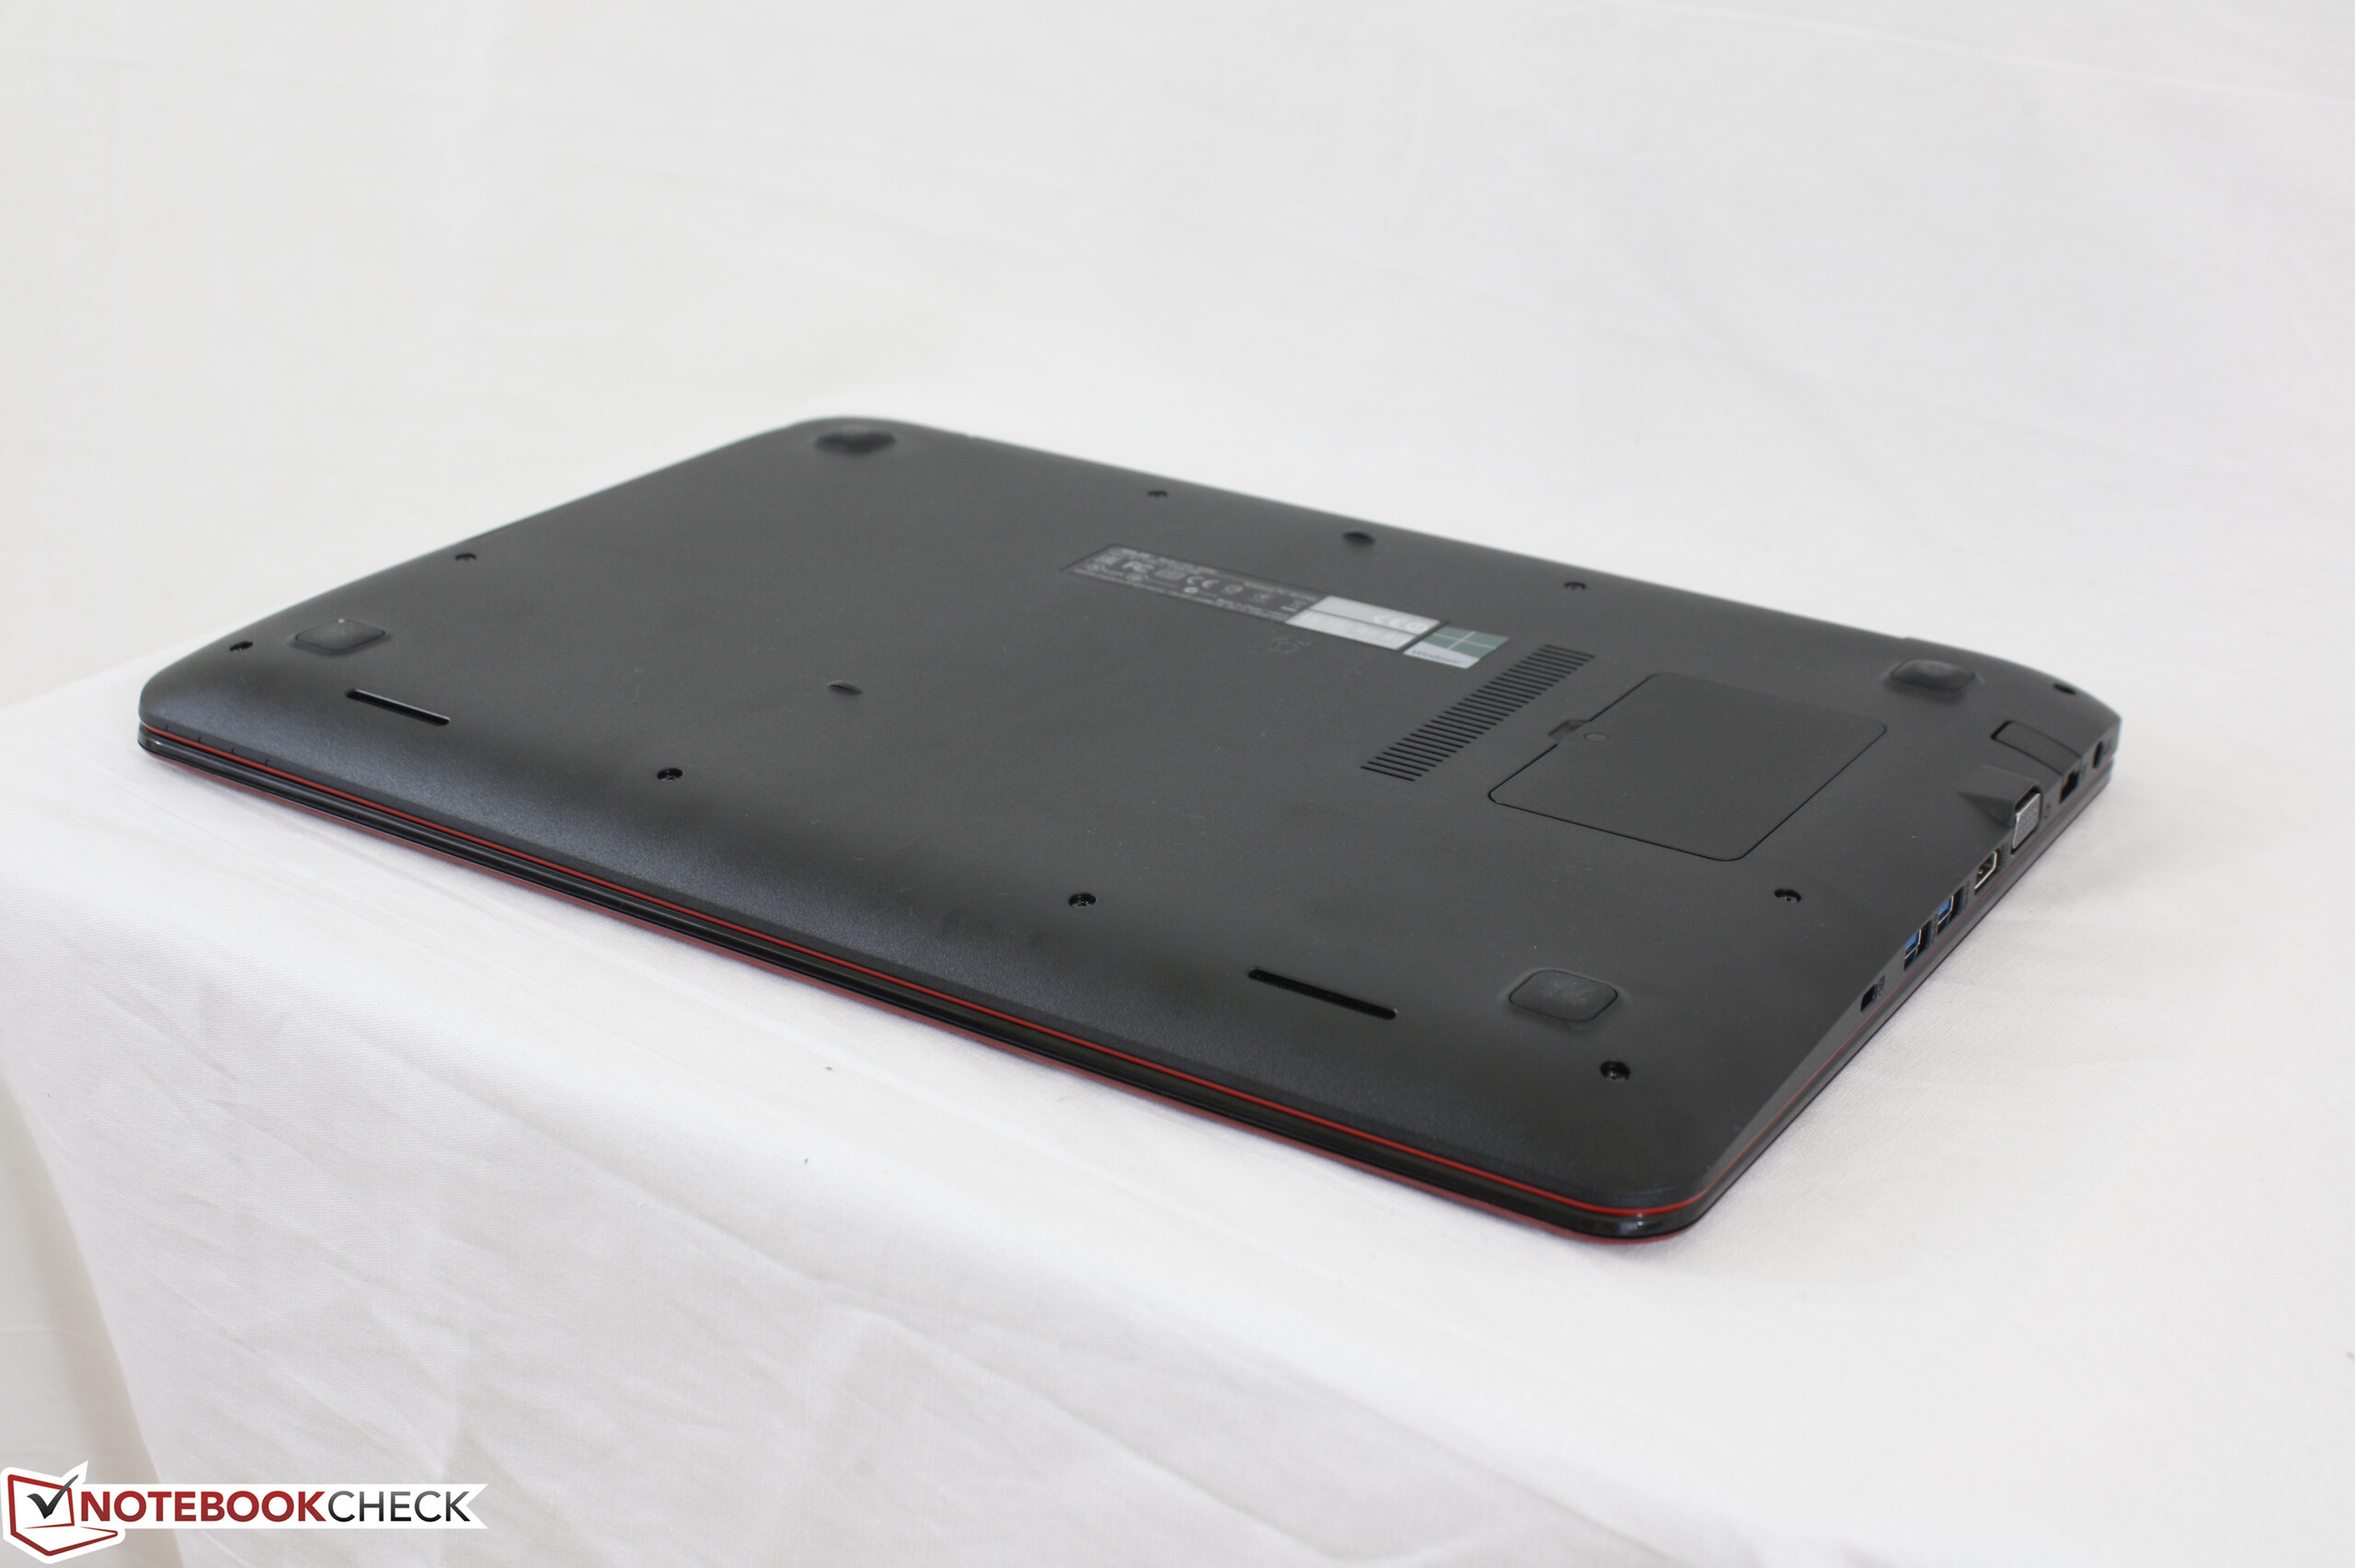
Al di fuori della lenta APU AMD, l'hardware Asus soffre di una serie di problemi. Il coperchio e la tastiera si flettono troppo facilmente per i nostri gusti e il display 1080p TN ha una riproduzione dei colori molto povera. Gli utenti interessati potranno avere meglio dai precedenti notebook ULV Broadwell o anche Haswell rispetto a quello che Asus ha da offrire in questo SKU AMD.
Questo notebook fallisce come PC economico a causa della sua breve durata della batteria, il display povero, e perfomance limitate. Alternative Intel che risalgono a tre o quattro anni fa sono ancora più vantaggiose sotto ogni aspetto..
Nota: si tratta di una recensione breve, con alcune sezioni non tradotte, per la versione integrale in inglese guardate qui.
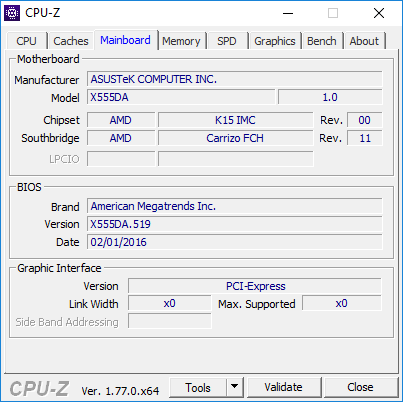
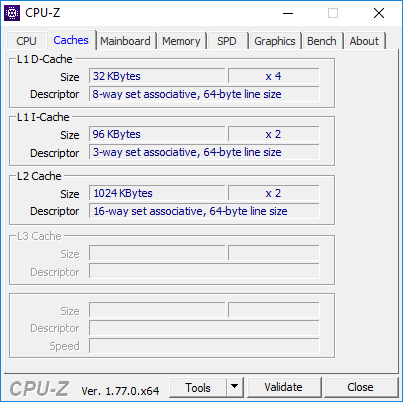
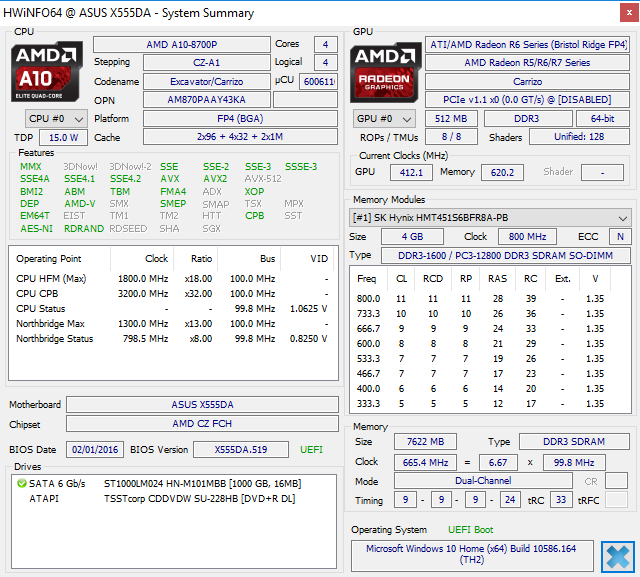
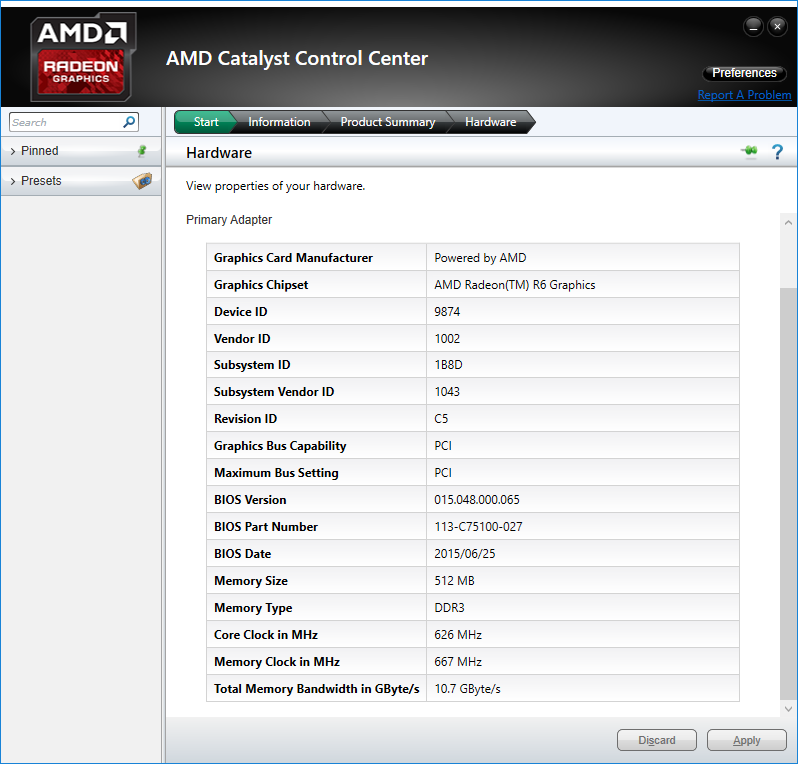
Asus X555DA-BB11
- 04/13/2017 v6 (old)
Allen Ngo
Price comparison
