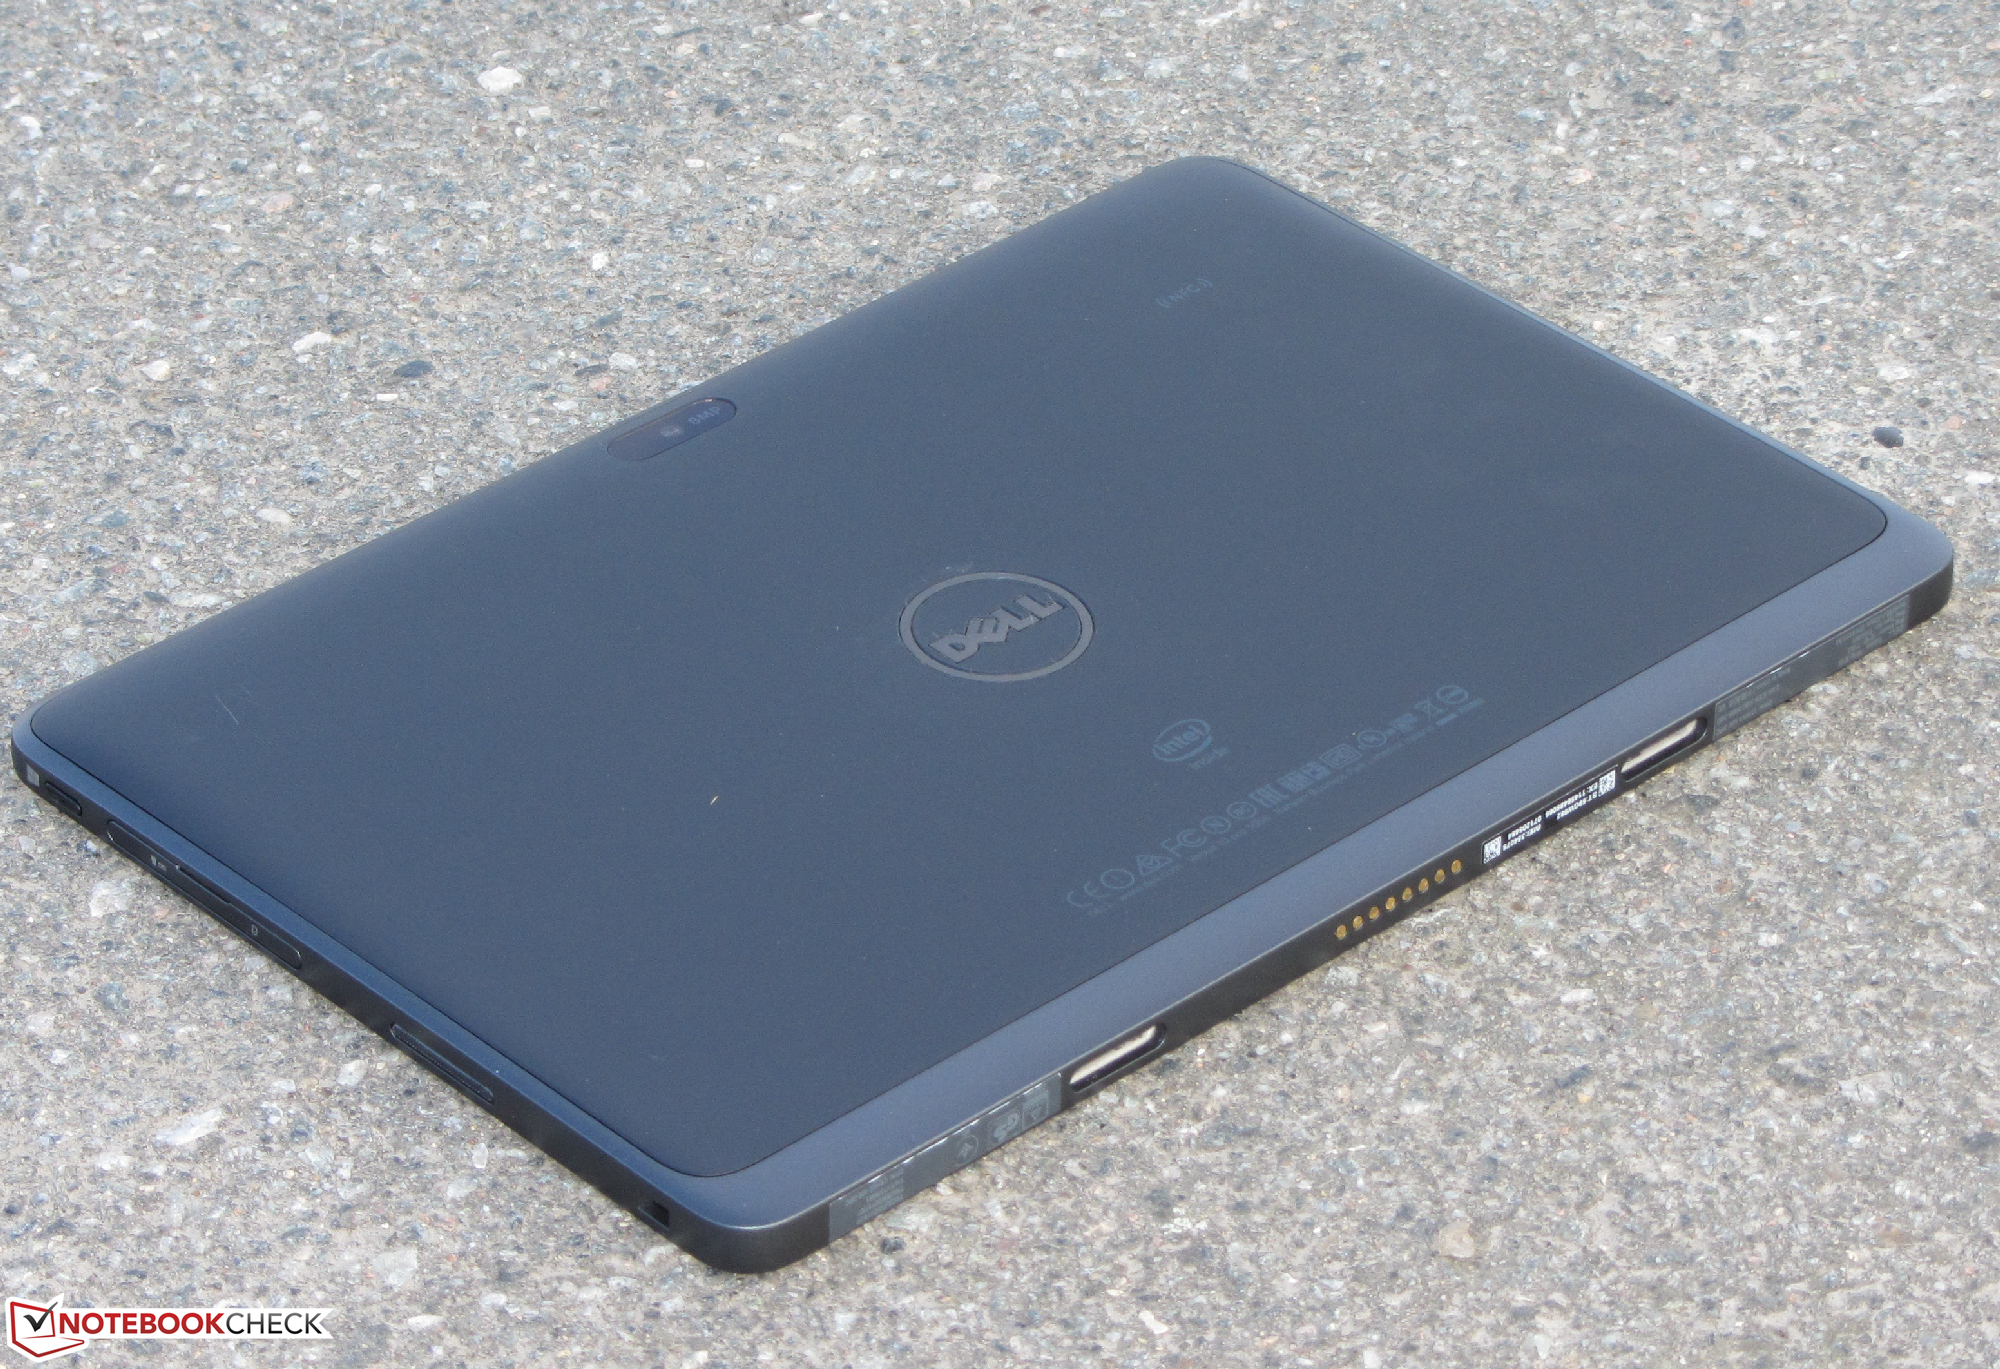
Recensione breve del Tablet Dell Venue 10 Pro (5056)

Confronto immagini
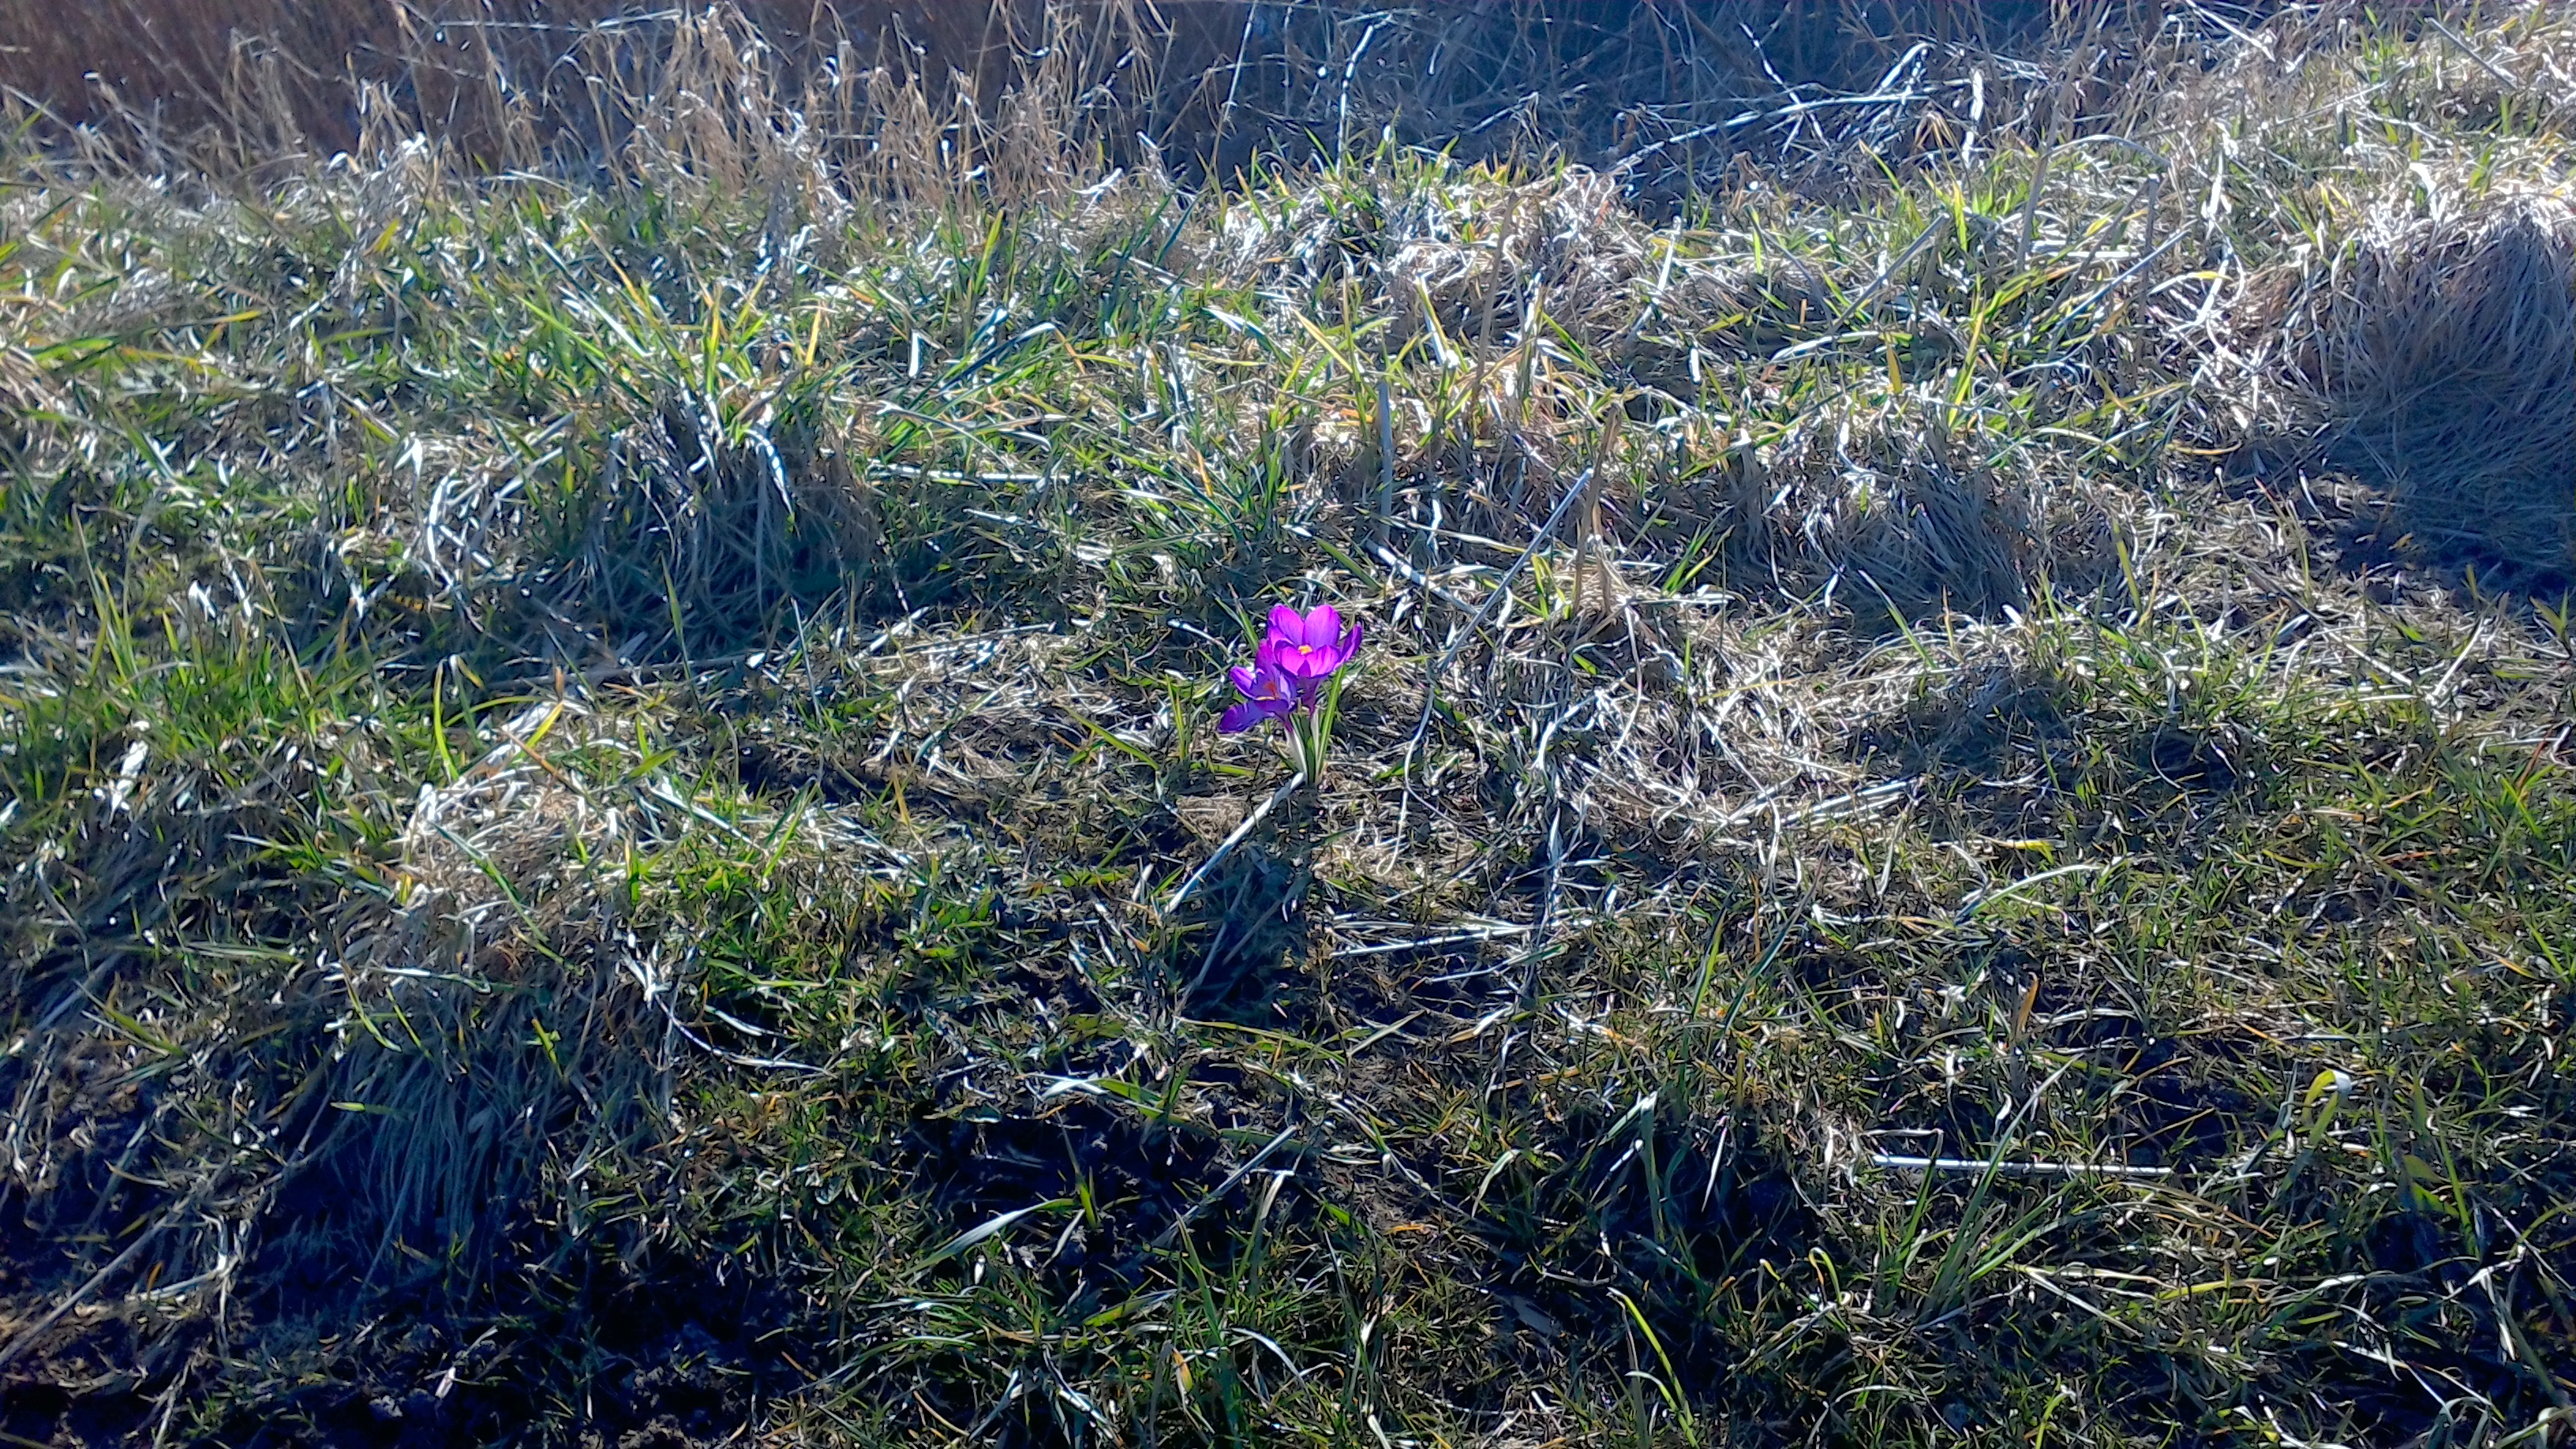
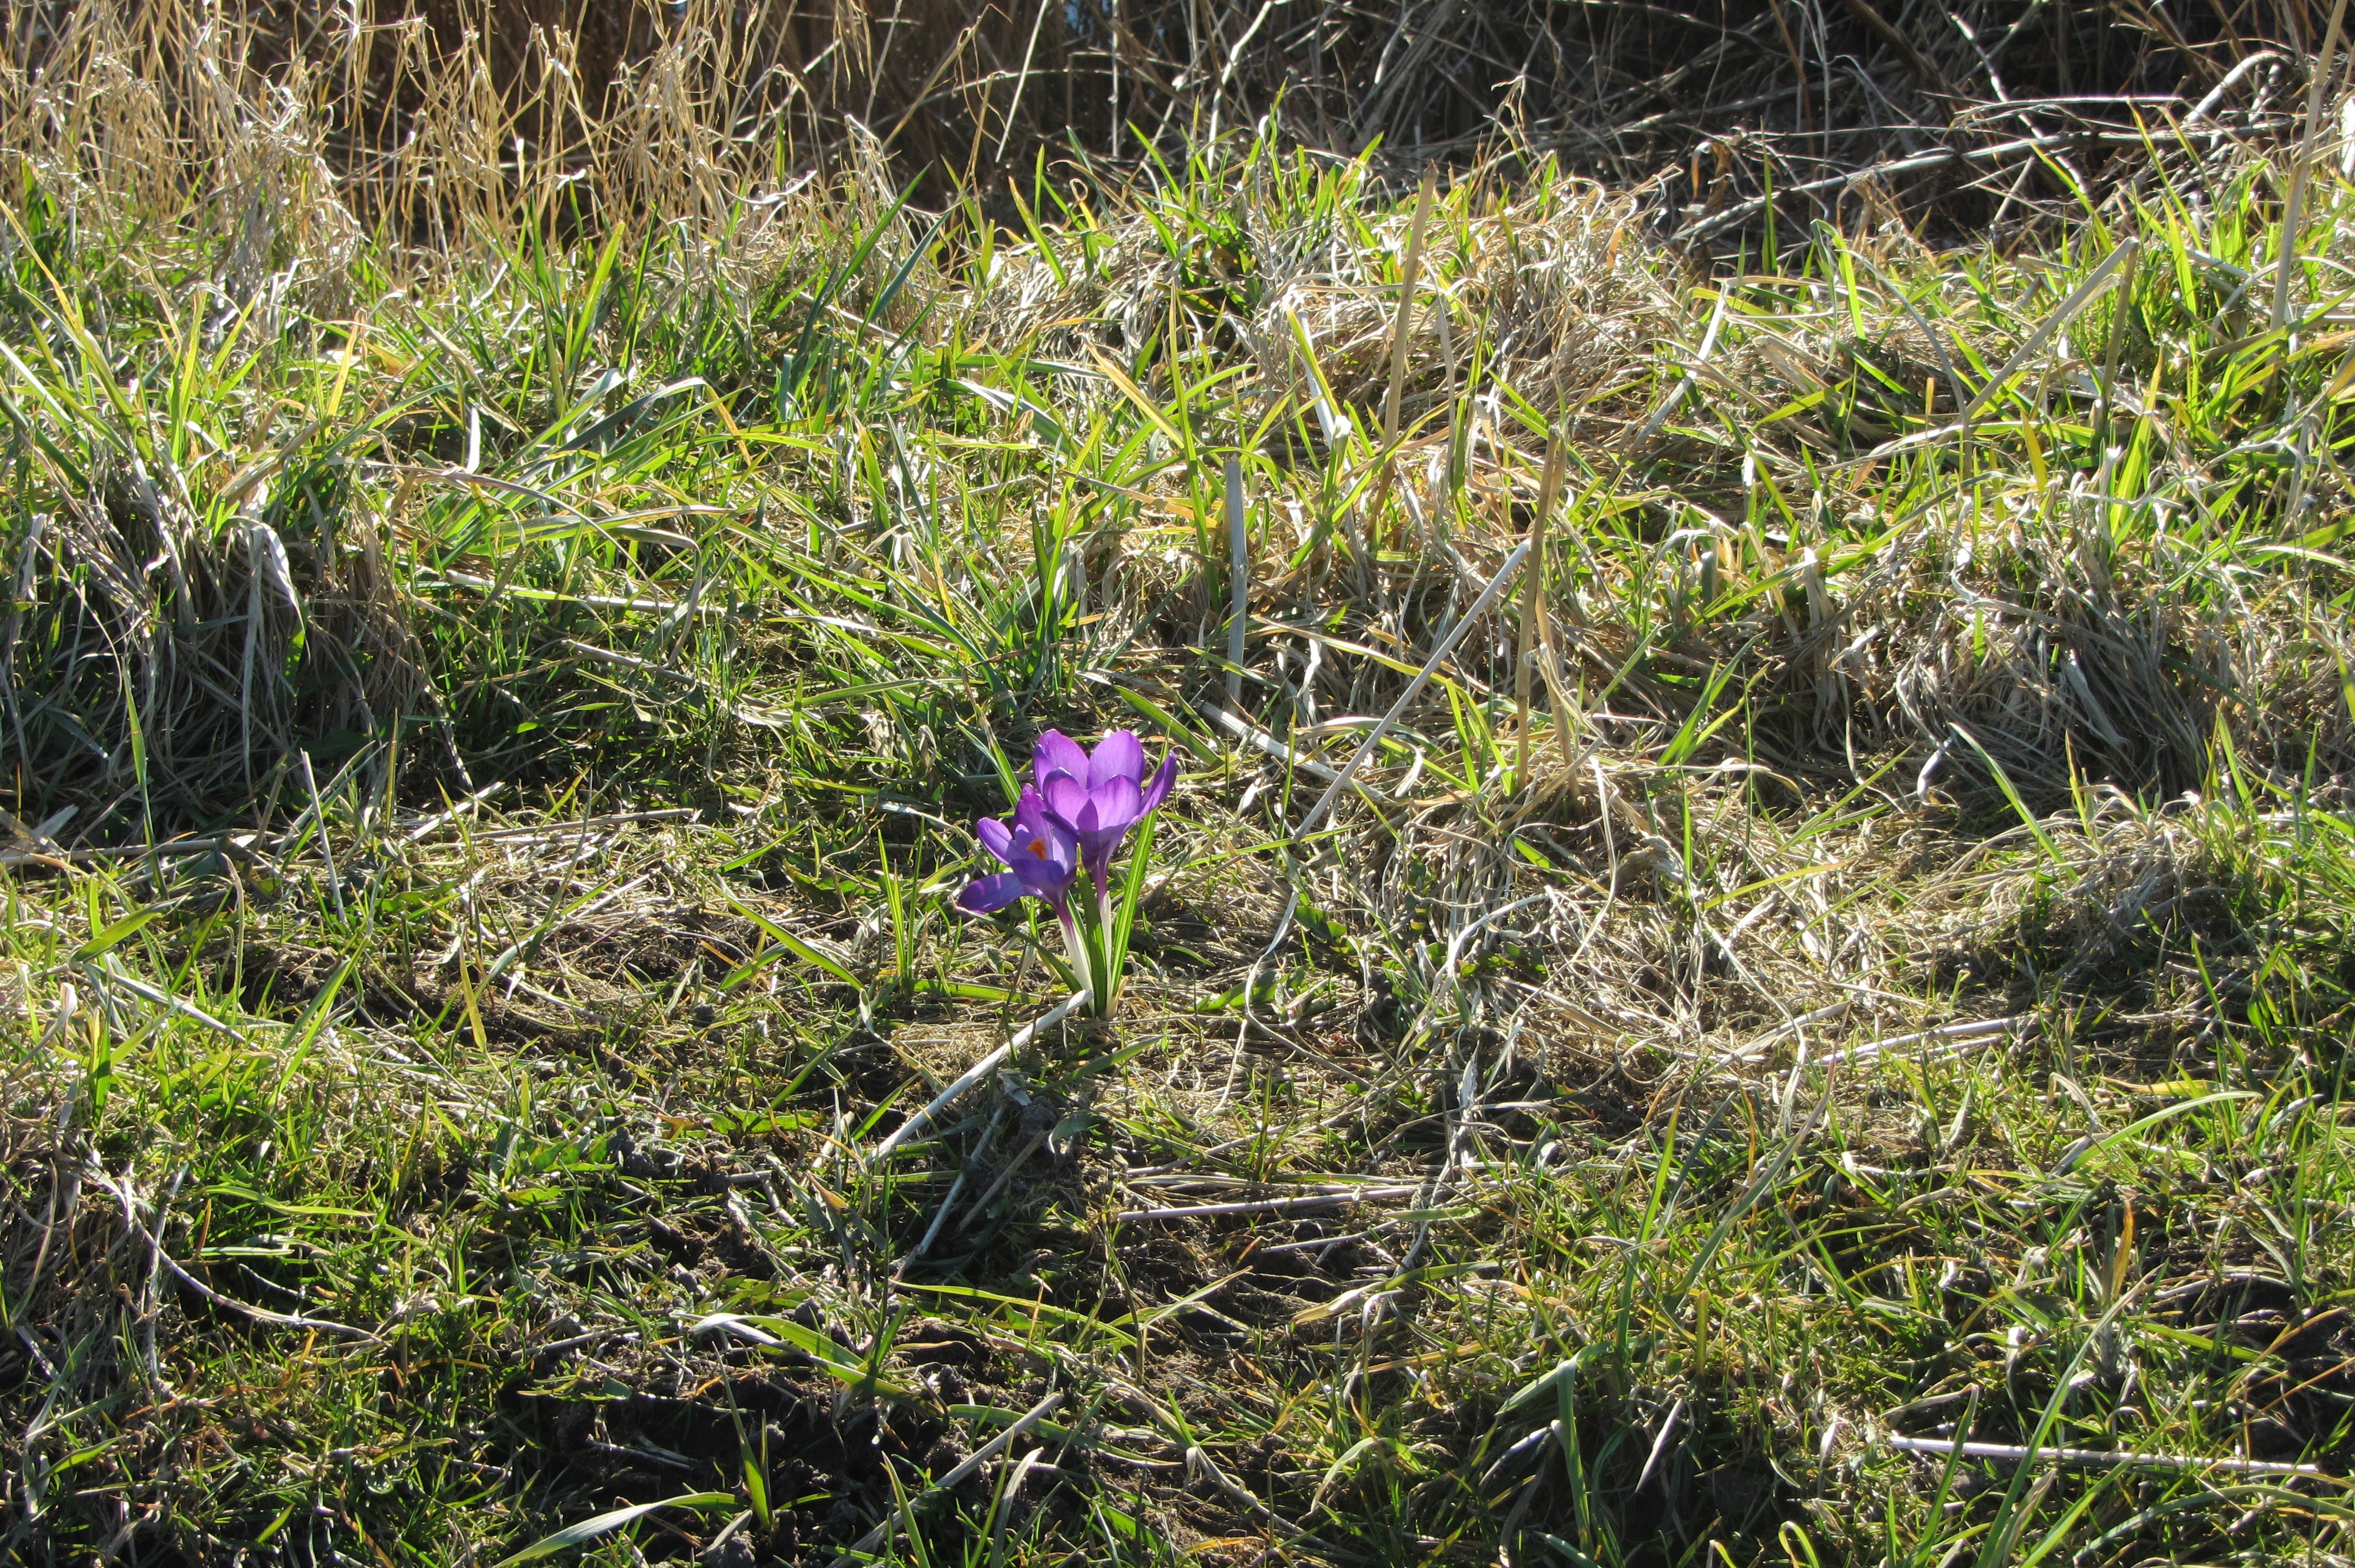
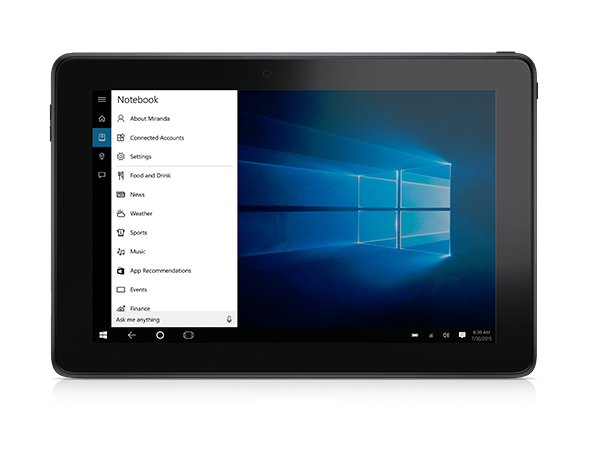
Scegliete una scena e navigate nella prima immagine. Un click cambia lo zoom. Un click sulla immagine zoommata apre quella originale in una nuova finestra. La prima immagine mostra la fotografia ridimensionata del dispositivo di test.


| |||||||||||||||||||||||||
Distribuzione della luminosità: 91 %
Al centro con la batteria: 365 cd/m²
Contrasto: 1521:1 (Nero: 0.24 cd/m²)
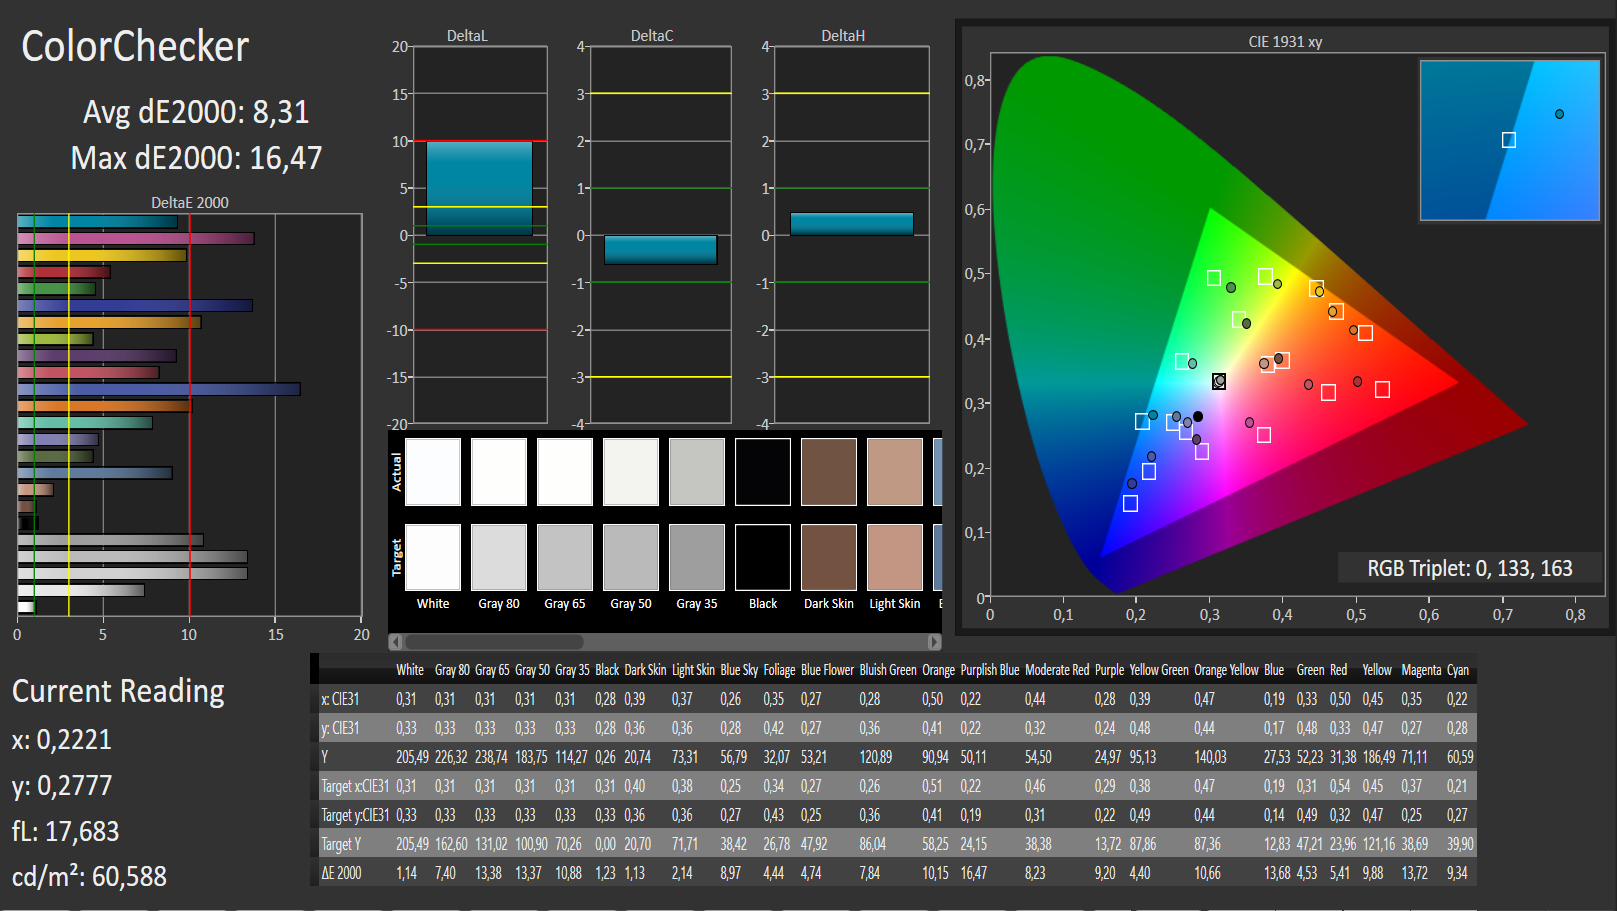
ΔE ColorChecker Calman: 8.31 | ∀{0.5-29.43 Ø4.72}
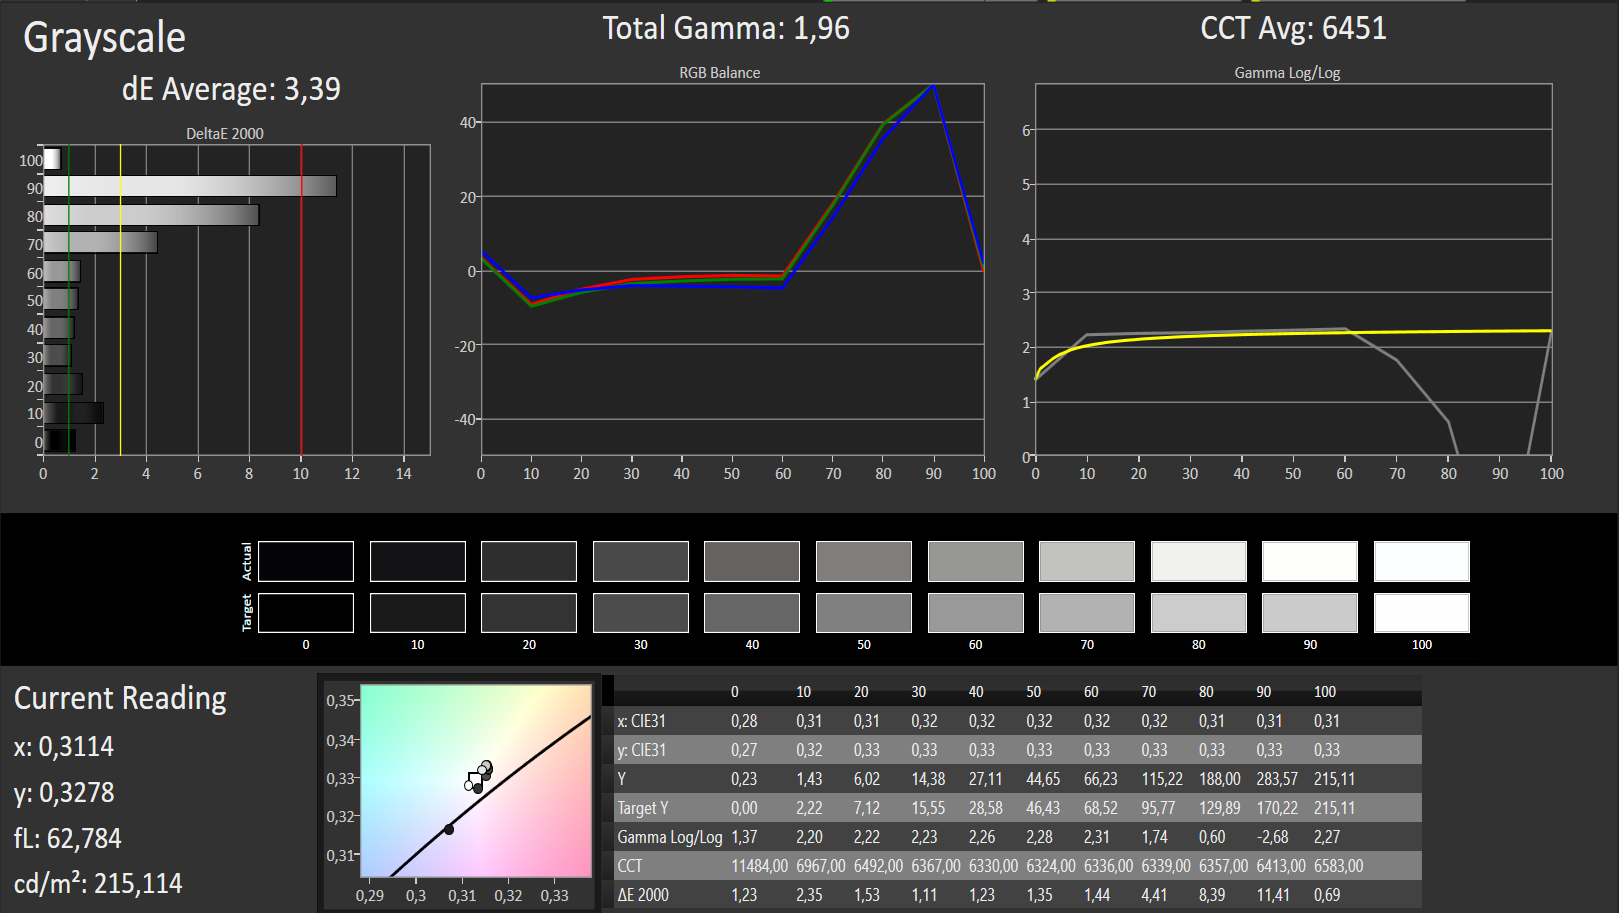
ΔE Greyscale Calman: 3.39 | ∀{0.09-98 Ø4.97}
60% sRGB (Argyll 1.6.3 3D)
38% AdobeRGB 1998 (Argyll 1.6.3 3D)
41.72% AdobeRGB 1998 (Argyll 3D)
60.7% sRGB (Argyll 3D)
40.38% Display P3 (Argyll 3D)
Gamma: 1.96
CCT: 6451 K
Sfarfallio dello schermo / PWM (Pulse-Width Modulation)
| flickering dello schermo / PWM non rilevato | 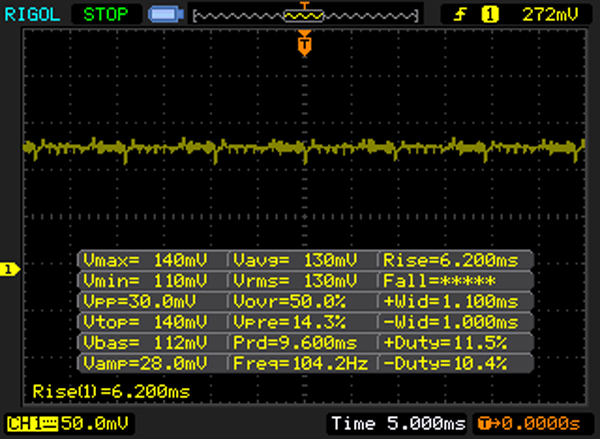 | ||
In confronto: 52 % di tutti i dispositivi testati non utilizza PWM per ridurre la luminosita' del display. Se è rilevato PWM, una media di 7784 (minimo: 5 - massimo: 343500) Hz è stata rilevata. | |||
Tempi di risposta del Display
| ↔ Tempi di risposta dal Nero al Bianco | ||
|---|---|---|
| 26 ms ... aumenta ↗ e diminuisce ↘ combinato | ↗ 7 ms Incremento | 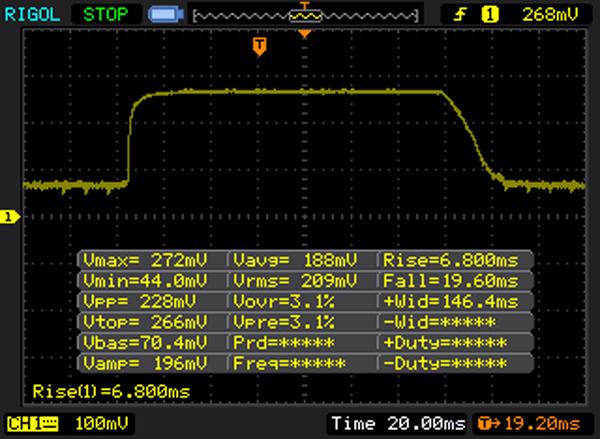 |
| ↘ 19 ms Calo | ||
| Lo schermo mostra tempi di risposta relativamente lenti nei nostri tests e potrebbe essere troppo lento per i gamers. In confronto, tutti i dispositivi di test variano da 0.1 (minimo) a 240 (massimo) ms. » 62 % di tutti i dispositivi è migliore. Questo significa che i tempi di risposta rilevati sono peggiori rispetto alla media di tutti i dispositivi testati (19.9 ms). | ||
| ↔ Tempo di risposta dal 50% Grigio all'80% Grigio | ||
| 30 ms ... aumenta ↗ e diminuisce ↘ combinato | ↗ 14 ms Incremento | 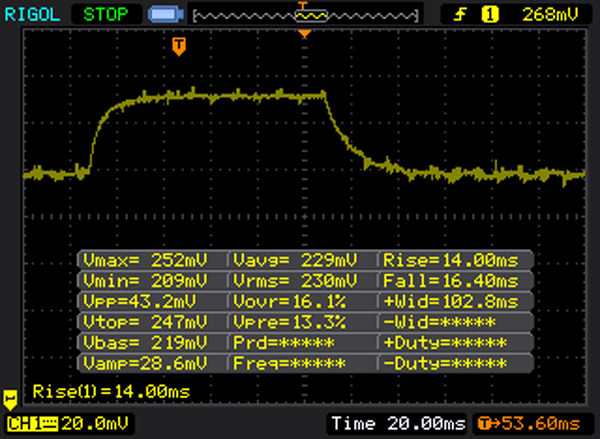 |
| ↘ 16 ms Calo | ||
| Lo schermo mostra tempi di risposta lenti nei nostri tests e sarà insoddisfacente per i gamers. In confronto, tutti i dispositivi di test variano da 0.165 (minimo) a 636 (massimo) ms. » 40 % di tutti i dispositivi è migliore. Questo significa che i tempi di risposta rilevati sono simili alla media di tutti i dispositivi testati (31.1 ms). | ||
| Dell Venue 10 Pro 5056 IPS, 1920x1200 | Dell Venue 10 Pro 5055 IPS, 1920x1200 | Apple iPad Air 2 2014 IPS, 2048x1536 | Google Pixel C LTPS, 2560x1800 | Lenovo Thinkpad Tablet 10 2nd Gen IPS, 1920x1200 | Amazon Fire HD 10 inch 2015 IPS, 1280x800 | Asus Transformer Book T100HA-C4-GR IPS, 1280x800 | Samsung Galaxy Tab S2 9.7 LTE Super AMOLED, 2048x1536 | Samsung Galaxy Tab A 9.7 SM-T555 TFT, 1024x768 | |
|---|---|---|---|---|---|---|---|---|---|
| Display | 18% | 26% | |||||||
| Display P3 Coverage (%) | 40.38 | 48.01 19% | 52.8 31% | ||||||
| sRGB Coverage (%) | 60.7 | 70.6 16% | 73 20% | ||||||
| AdobeRGB 1998 Coverage (%) | 41.72 | 49.79 19% | 53.3 28% | ||||||
| Response Times | -39% | ||||||||
| Response Time Grey 50% / Grey 80% * (ms) | 30 ? | 42 ? -40% | |||||||
| Response Time Black / White * (ms) | 26 ? | 36 ? -38% | |||||||
| PWM Frequency (Hz) | |||||||||
| Screen | -22% | 8% | -14% | -15% | -7% | 18% | 27% | -17% | |
| Brightness middle (cd/m²) | 365 | 436 19% | 423 16% | 487 33% | 345 -5% | 458 25% | 480.2 32% | 358 -2% | 394 8% |
| Brightness (cd/m²) | 348 | 418 20% | 427 23% | 510 47% | 337 -3% | 434 25% | 455 31% | 357 3% | 392 13% |
| Brightness Distribution (%) | 91 | 92 1% | 92 1% | 91 0% | 94 3% | 86 -5% | 85 -7% | 86 -5% | 80 -12% |
| Black Level * (cd/m²) | 0.24 | 0.58 -142% | 0.61 -154% | 0.39 -63% | 0.43 -79% | 0.43 -79% | 0.324 -35% | 0.51 -113% | |
| Contrast (:1) | 1521 | 752 -51% | 693 -54% | 1249 -18% | 802 -47% | 1065 -30% | 1482 -3% | 773 -49% | |
| Colorchecker dE 2000 * | 8.31 | 5.17 38% | 2.86 66% | 5.24 37% | 5.86 29% | 4.18 50% | 3.45 58% | 1.78 79% | 3.59 57% |
| Colorchecker dE 2000 max. * | 16.47 | ||||||||
| Greyscale dE 2000 * | 3.39 | 4.68 -38% | 2.37 30% | 7.95 -135% | 5.63 -66% | 4.54 -34% | 2.67 21% | 1.38 59% | 4.25 -25% |
| Gamma | 1.96 112% | 2.31 95% | 2.43 91% | 2.16 102% | 2.33 94% | 2.15 102% | 2.34 94% | 2.24 98% | 2.56 86% |
| CCT | 6451 101% | 6652 98% | 6941 94% | 6565 99% | 6533 99% | 7083 92% | 6164 105% | 6366 102% | 7148 91% |
| Color Space (Percent of AdobeRGB 1998) (%) | 38 | 88 132% | 45.7 20% | 47.28 24% | |||||
| Color Space (Percent of sRGB) (%) | 60 | 70.1 17% | 84.38 41% | ||||||
| Media totale (Programma / Settaggio) | -22% /
-22% | 8% /
8% | -27% /
-20% | 2% /
-6% | -7% /
-7% | 22% /
20% | 27% /
27% | -17% /
-17% |
* ... Meglio usare valori piccoli
| JetStream 1.1 - 1.1 Total (ordina per valore) | |
| Dell Venue 10 Pro 5056 | |
| HP Pro Tablet 10 EE G1 | |
| Google Pixel C | |
| Lenovo Yoga Tab 3 Pro 10 YT3-X90L | |
| Samsung Galaxy Tab S2 9.7 LTE | |
| Peacekeeper - --- (ordina per valore) | |
| Dell Venue 10 Pro 5056 | |
| Dell Venue 10 Pro 5055 | |
| HP Pro Tablet 10 EE G1 | |
| Apple iPad Air 2 2014 | |
| Browsermark - 2.1 (ordina per valore) | |
| Dell Venue 10 Pro 5056 | |
| Apple iPad Air 2 2014 | |
| Google Pixel C | |
* ... Meglio usare valori piccoli
| 3DMark 11 - 1280x720 Performance (ordina per valore) | |
| Dell Venue 10 Pro 5056 | |
| Dell Venue 10 Pro 5055 | |
| HP Pro Tablet 10 EE G1 | |
| Lenovo Thinkpad Tablet 10 2nd Gen | |
| Asus Transformer Book T100HA-C4-GR | |
| 3DMark - 1280x720 Ice Storm Standard Score (ordina per valore) | |
| Dell Venue 10 Pro 5056 | |
| HP Pro Tablet 10 EE G1 | |
| Google Pixel C | |
| Lenovo Thinkpad Tablet 10 2nd Gen | |
| Asus Transformer Book T100HA-C4-GR | |
| 3DMark 06 - 1280x1024 Standard Score AA:0x AF:0x (ordina per valore) | |
| Dell Venue 10 Pro 5056 | |
| Asus Transformer Book T100HA-C4-GR | |
| GFXBench | |
| on screen Car Chase Onscreen (ordina per valore) | |
| Dell Venue 10 Pro 5056 | |
| Google Pixel C | |
| Lenovo Yoga Tab 3 Pro 10 YT3-X90L | |
| 1920x1080 Car Chase Offscreen (ordina per valore) | |
| Dell Venue 10 Pro 5056 | |
| Google Pixel C | |
| Lenovo Yoga Tab 3 Pro 10 YT3-X90L | |
| GFXBench 3.1 | |
| on screen Manhattan ES 3.1 Onscreen (ordina per valore) | |
| Dell Venue 10 Pro 5056 | |
| Apple iPad Air 2 2014 | |
| Google Pixel C | |
| Amazon Fire HD 10 inch 2015 | |
| Lenovo Yoga Tab 3 Pro 10 YT3-X90L | |
| 1920x1080 Manhattan ES 3.1 Offscreen (ordina per valore) | |
| Dell Venue 10 Pro 5056 | |
| Apple iPad Air 2 2014 | |
| Google Pixel C | |
| Amazon Fire HD 10 inch 2015 | |
| Lenovo Yoga Tab 3 Pro 10 YT3-X90L | |
| GFXBench 3.0 | |
| on screen Manhattan Onscreen OGL (ordina per valore) | |
| Dell Venue 10 Pro 5056 | |
| Apple iPad Air 2 2014 | |
| Google Pixel C | |
| LG G Pad II 10.1 | |
| Amazon Fire HD 10 inch 2015 | |
| Lenovo Yoga Tab 3 Pro 10 YT3-X90L | |
| 1920x1080 1080p Manhattan Offscreen (ordina per valore) | |
| Dell Venue 10 Pro 5056 | |
| Apple iPad Air 2 2014 | |
| Google Pixel C | |
| LG G Pad II 10.1 | |
| Amazon Fire HD 10 inch 2015 | |
| Lenovo Yoga Tab 3 Pro 10 YT3-X90L | |
| basso | medio | alto | ultra | |
|---|---|---|---|---|
| Trackmania Nations Forever (2008) | 128 | 29.2 | 16.8 | |
| Tomb Raider (2013) | 25.7 | 12 | 8.3 | 3.7 |
| BioShock Infinite (2013) | 20.1 | 9.3 | 7.6 | 2.4 |
| Dragon Age: Inquisition (2014) | 9.5 | 5.7 | ||
| Dirt Rally (2015) | 20.1 | 12.5 | ||
| Metal Gear Solid V (2015) | 15.1 | 9.8 | ||
| Anno 2205 (2015) | 8.1 | 3.9 | ||
| Star Wars Battlefront (2015) | 8.8 | 4.8 | ||
| Rainbow Six Siege (2015) | 11.5 | 7 |
(±) La temperatura massima sul lato superiore è di 42.2 °C / 108 F, rispetto alla media di 33.6 °C / 92 F, che varia da 20.7 a 53.2 °C per questa classe Tablet.
(-) Il lato inferiore si riscalda fino ad un massimo di 50.2 °C / 122 F, rispetto alla media di 33.2 °C / 92 F
(+) In idle, la temperatura media del lato superiore è di 28.6 °C / 83 F, rispetto alla media deld ispositivo di 30 °C / 86 F.
| Dell Venue 10 Pro 5056 Z8500, HD Graphics (Cherry Trail) | Dell Venue 10 Pro 5055 Z3735F, HD Graphics (Bay Trail) | HP Pro Tablet 10 EE G1 Z3735F, HD Graphics (Bay Trail) | Apple iPad Air 2 2014 A8X, PowerVR GXA6850 | Google Pixel C X1, Tegra X1 Maxwell GPU | Lenovo Thinkpad Tablet 10 2nd Gen Z8700, HD Graphics (Cherry Trail) | Amazon Fire HD 10 inch 2015 MT8135, PowerVR G6200 | Asus Transformer Book T100HA-C4-GR Z8500, HD Graphics (Cherry Trail) | Samsung Galaxy Tab S2 9.7 LTE Exynos 5433, Mali-T760 MP6 | Samsung Galaxy Tab A 9.7 SM-T555 410 APQ8016, Adreno 306 | |
|---|---|---|---|---|---|---|---|---|---|---|
| Heat | -8% | 6% | 9% | 11% | -1% | 23% | 22% | 12% | 11% | |
| Maximum Upper Side * (°C) | 42.2 | 43.6 -3% | 39 8% | 36.2 14% | 42.3 -0% | 51 -21% | 30.4 28% | 35.2 17% | 40.8 3% | 37 12% |
| Maximum Bottom * (°C) | 50.2 | 47.6 5% | 44.9 11% | 42.8 15% | 36 28% | 55 -10% | 30.2 40% | 33.4 33% | 35.7 29% | 36.9 26% |
| Idle Upper Side * (°C) | 34.1 | 38 -11% | 31.1 9% | 31 9% | 31.8 7% | 27.1 21% | 29.8 13% | 27.6 19% | 31.2 9% | 33.7 1% |
| Idle Bottom * (°C) | 31.2 | 37.8 -21% | 33 -6% | 32 -3% | 28 10% | 29 7% | 28 10% | 25.8 17% | 29.1 7% | 29.8 4% |
* ... Meglio usare valori piccoli
| Off / Standby | |
| Idle | |
| Sotto carico |
|
Leggenda:
min: | |
| Dell Venue 10 Pro 5056 Z8500, HD Graphics (Cherry Trail) | Dell Venue 10 Pro 5055 Z3735F, HD Graphics (Bay Trail) | HP Pro Tablet 10 EE G1 Z3735F, HD Graphics (Bay Trail) | Apple iPad Air 2 2014 A8X, PowerVR GXA6850 | Google Pixel C X1, Tegra X1 Maxwell GPU | Lenovo Thinkpad Tablet 10 2nd Gen Z8700, HD Graphics (Cherry Trail) | Amazon Fire HD 10 inch 2015 MT8135, PowerVR G6200 | Samsung Galaxy Tab S2 9.7 LTE Exynos 5433, Mali-T760 MP6 | Samsung Galaxy Tab A 9.7 SM-T555 410 APQ8016, Adreno 306 | |
|---|---|---|---|---|---|---|---|---|---|
| Power Consumption | 12% | 5% | 28% | 22% | 11% | 48% | 23% | 44% | |
| Idle Minimum * (Watt) | 3.2 | 2.8 13% | 3.5 -9% | 1.2 63% | 1.82 43% | 2.4 25% | 1.24 61% | 2.3 28% | 1.1 66% |
| Idle Average * (Watt) | 6 | 5.4 10% | 5.5 8% | 5.1 15% | 4.26 29% | 5.1 15% | 3.81 36% | 4.5 25% | 3.6 40% |
| Idle Maximum * (Watt) | 6.2 | 5.5 11% | 5.7 8% | 5.4 13% | 4.33 30% | 6 3% | 3.92 37% | 5 19% | 3.9 37% |
| Load Average * (Watt) | 14.5 | 10.9 25% | 10.7 26% | 7.9 46% | 9.82 32% | 14.7 -1% | 5.94 59% | 9.4 35% | 6.8 53% |
| Load Maximum * (Watt) | 11.2 | 11.1 1% | 12.2 -9% | 11.1 1% | 13.99 -25% | 5.94 47% | 10.4 7% | 8.4 25% |
* ... Meglio usare valori piccoli
| Dell Venue 10 Pro 5056 32 Wh | Dell Venue 10 Pro 5055 32 Wh | Apple iPad Air 2 2014 28 Wh | Google Pixel C 34 Wh | Lenovo Thinkpad Tablet 10 2nd Gen 32 Wh | Amazon Fire HD 10 inch 2015 Wh | Lenovo Yoga Tab 3 Pro 10 YT3-X90L 23 Wh | Asus Transformer Book T100HA-C4-GR 30 Wh | Samsung Galaxy Tab S2 9.7 LTE 22 Wh | Samsung Galaxy Tab A 9.7 SM-T555 Wh | |
|---|---|---|---|---|---|---|---|---|---|---|
| Autonomia della batteria | -24% | 29% | 73% | 17% | 16% | 43% | 36% | 21% | 126% | |
| Reader / Idle (h) | 14.5 | 11.3 -22% | 22.7 57% | 34.8 140% | 14.4 -1% | 19 31% | 21 45% | 24.3 68% | 15.3 6% | 49.2 239% |
| H.264 (h) | 7.4 | 9.4 27% | 12.3 66% | 9.1 23% | 10.4 41% | 10.7 45% | 10.9 47% | |||
| WiFi v1.3 (h) | 7.5 | 10.6 41% | 7.5 0% | 7.5 0% | 9.3 24% | 9 20% | 6.6 -12% | 14.4 92% | ||
| Load (h) | 3.4 | 2.5 -26% | 3.5 3% | 4.9 44% | 5 47% | 3.1 -9% | 5.4 59% | 4.1 21% | 4.9 44% | 5 47% |
| WiFi (h) | 4.2 | 10.5 |
Pro
Contro
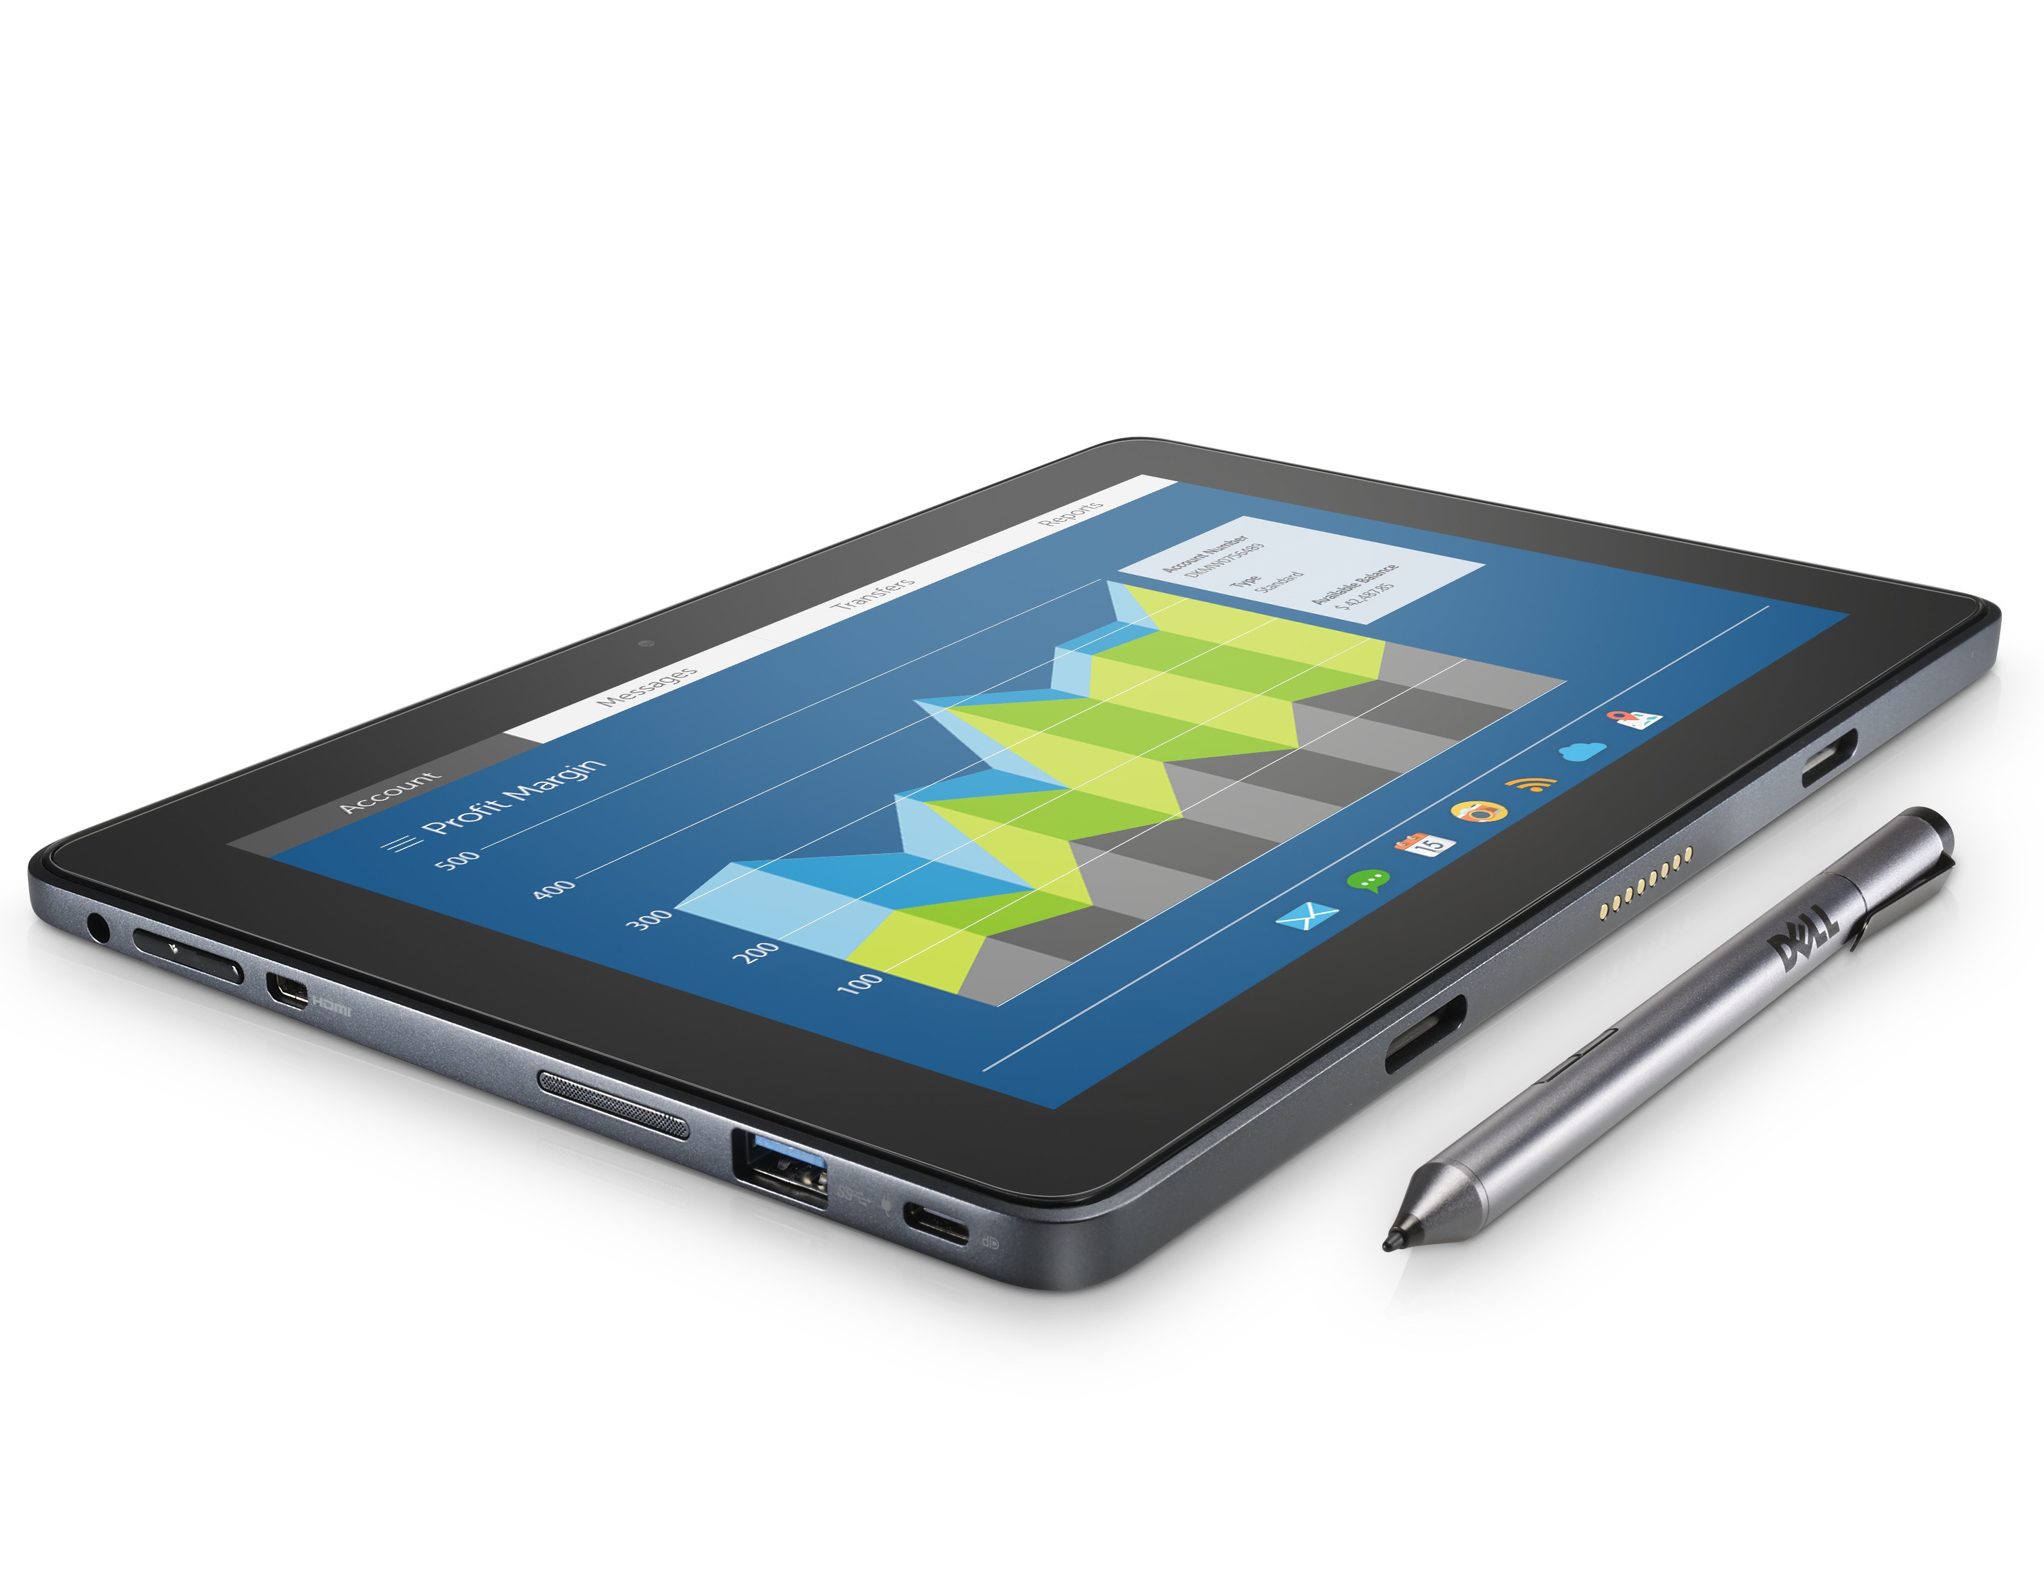
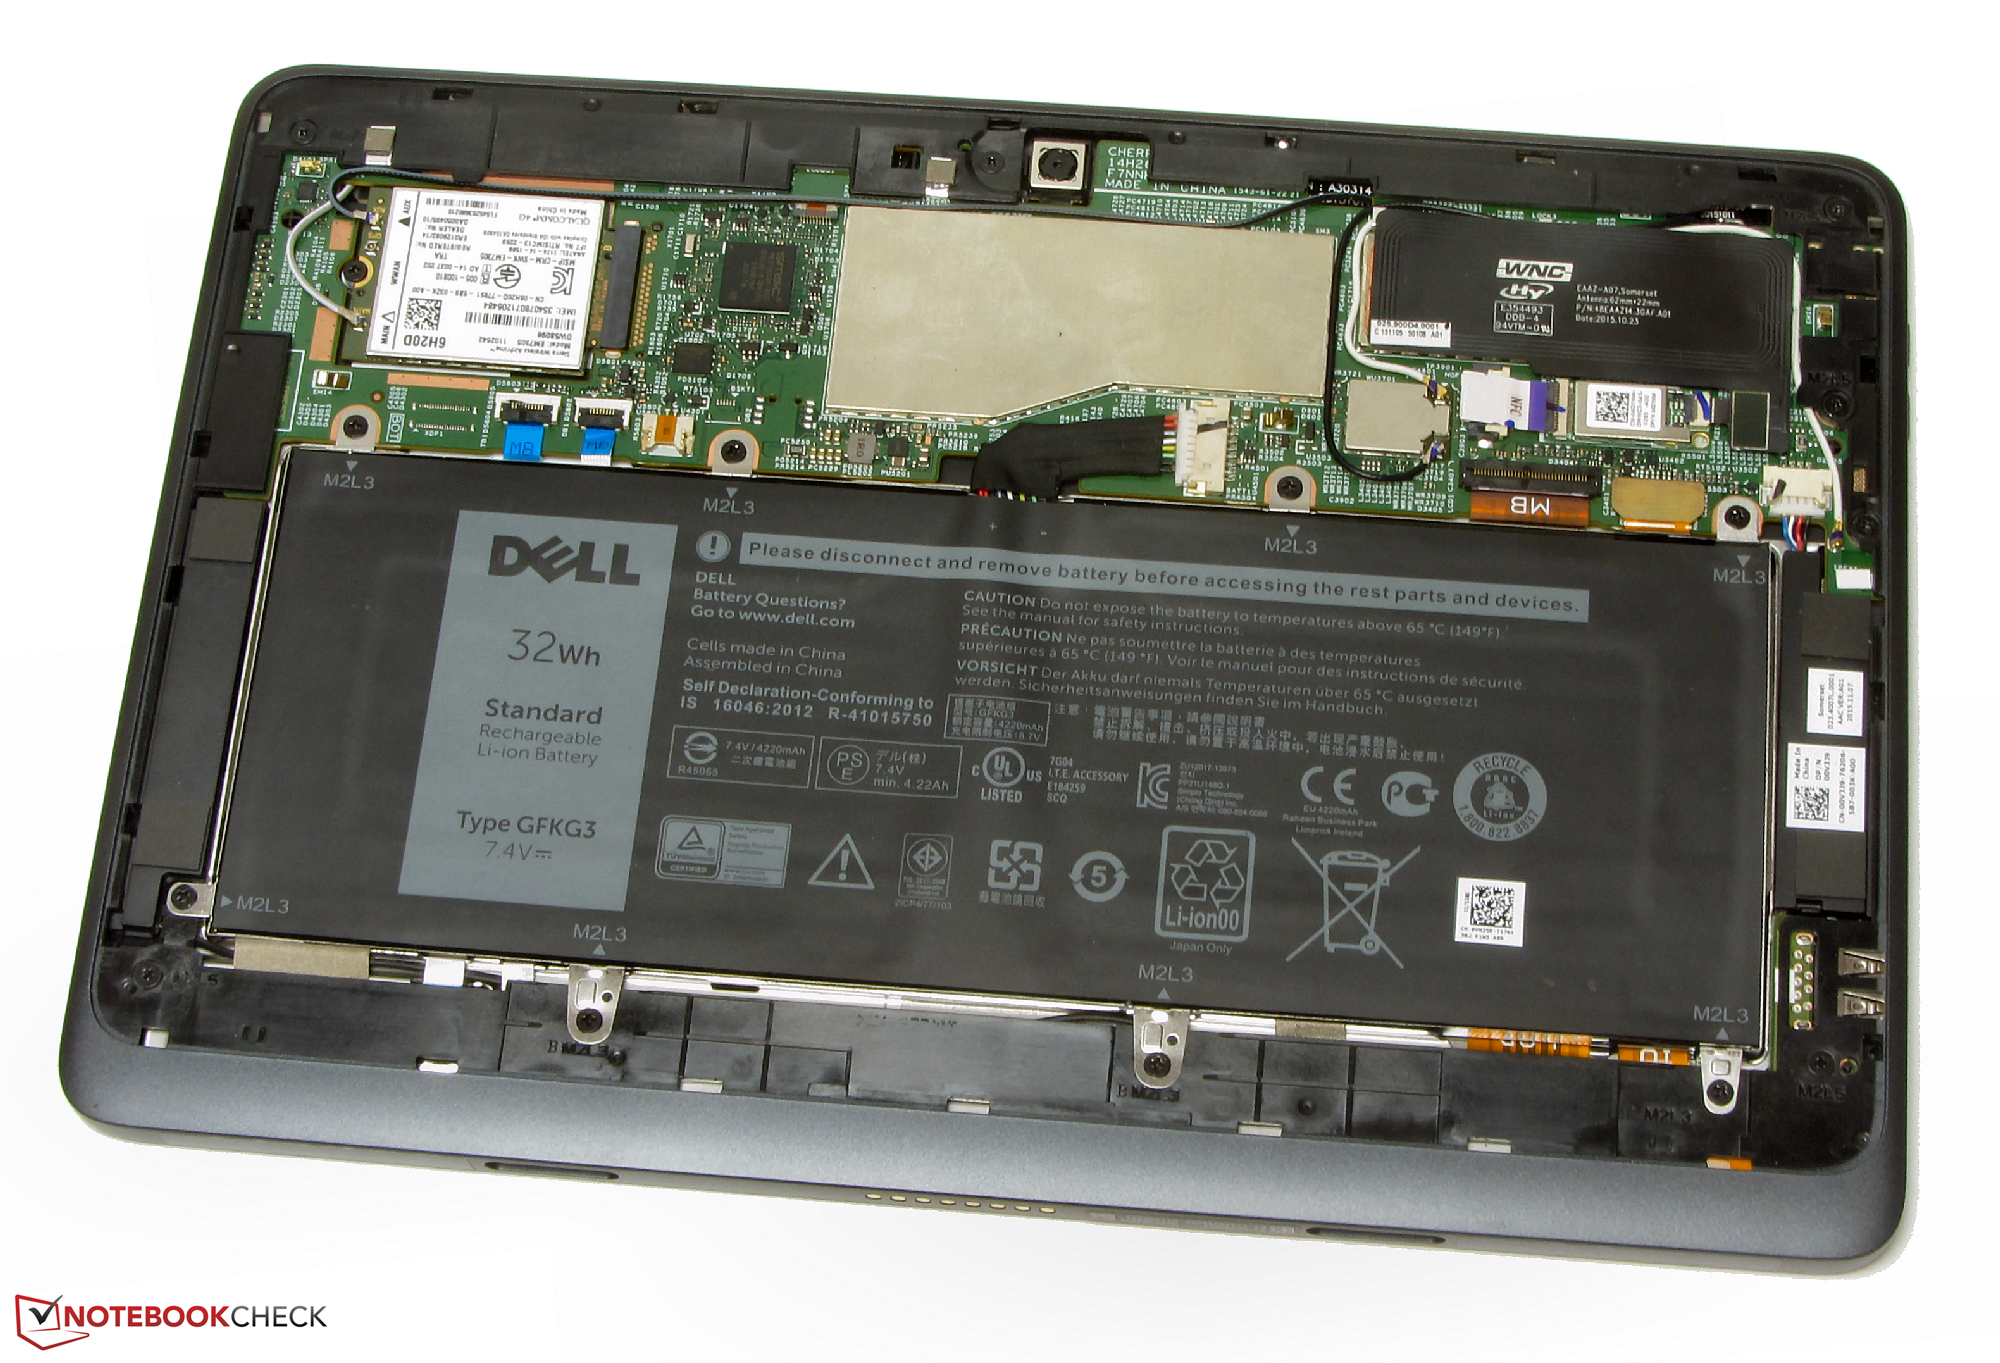
Il Dell Venue 10 Pro è un solido tablet da 10.1" Windows. Come tutti i tablets Windows, il Venue consente all'utente di installare ed usare normali applicazioni desktop. La CPU può gestire solo applicazioni semplici come processing e web browsing. I 128 GB eMMC di flash drive offrono molto spazio. Abbiamo apprezzato anche il luminoso display IPS con elevato contrasto - sebbene il display del Venue 10 Pro 5055 era leggermente più luminoso. L'autonomia della batteria è molto buona.
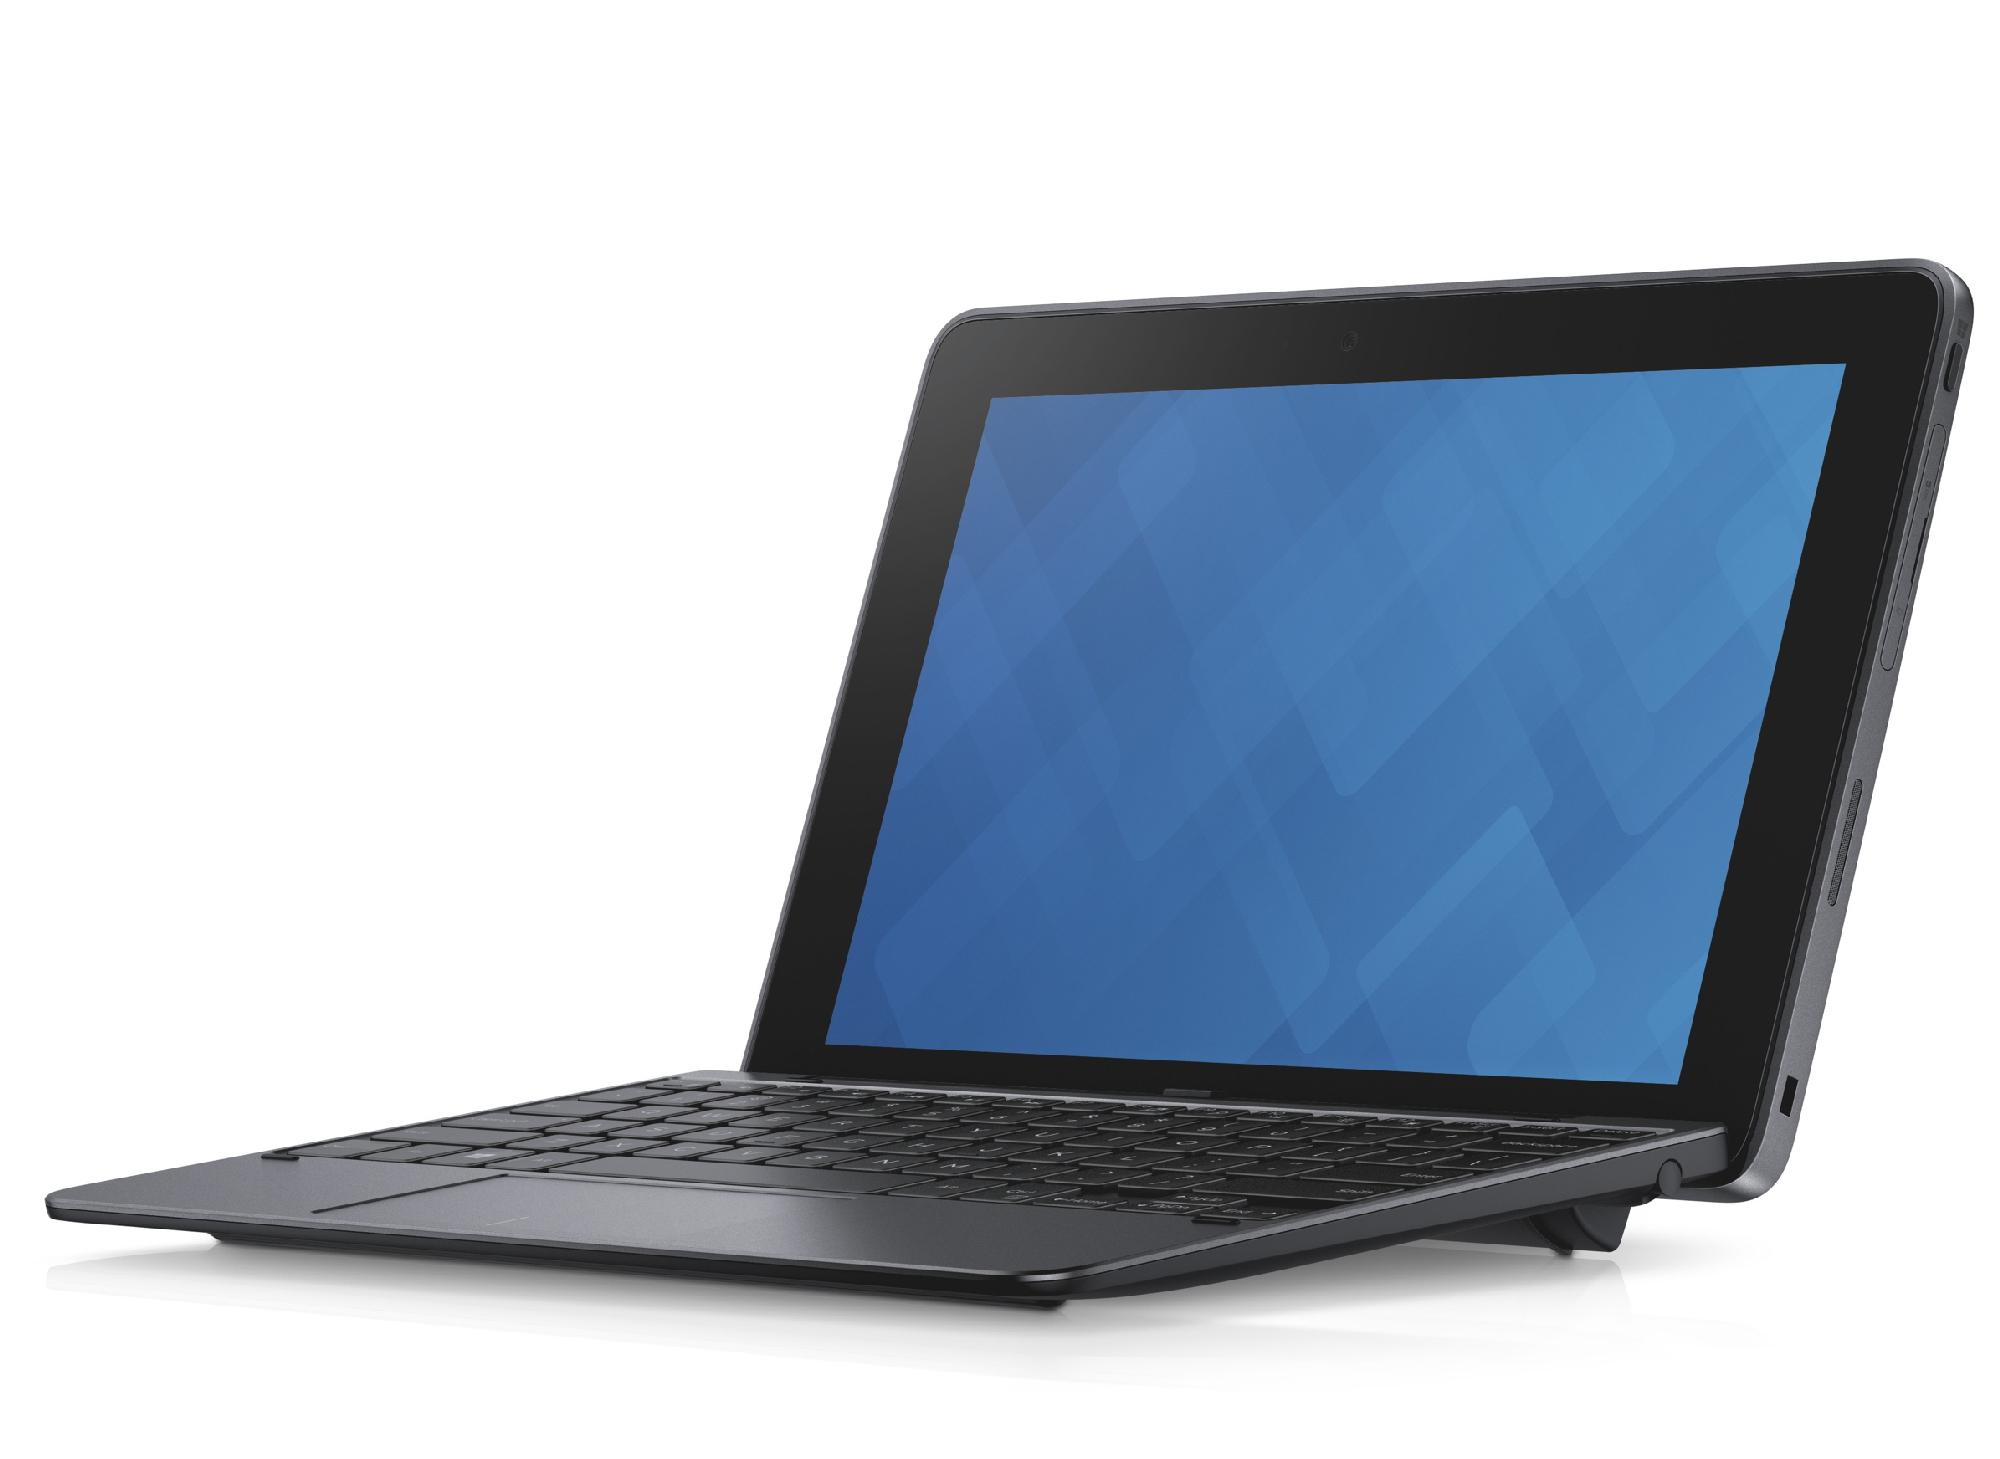
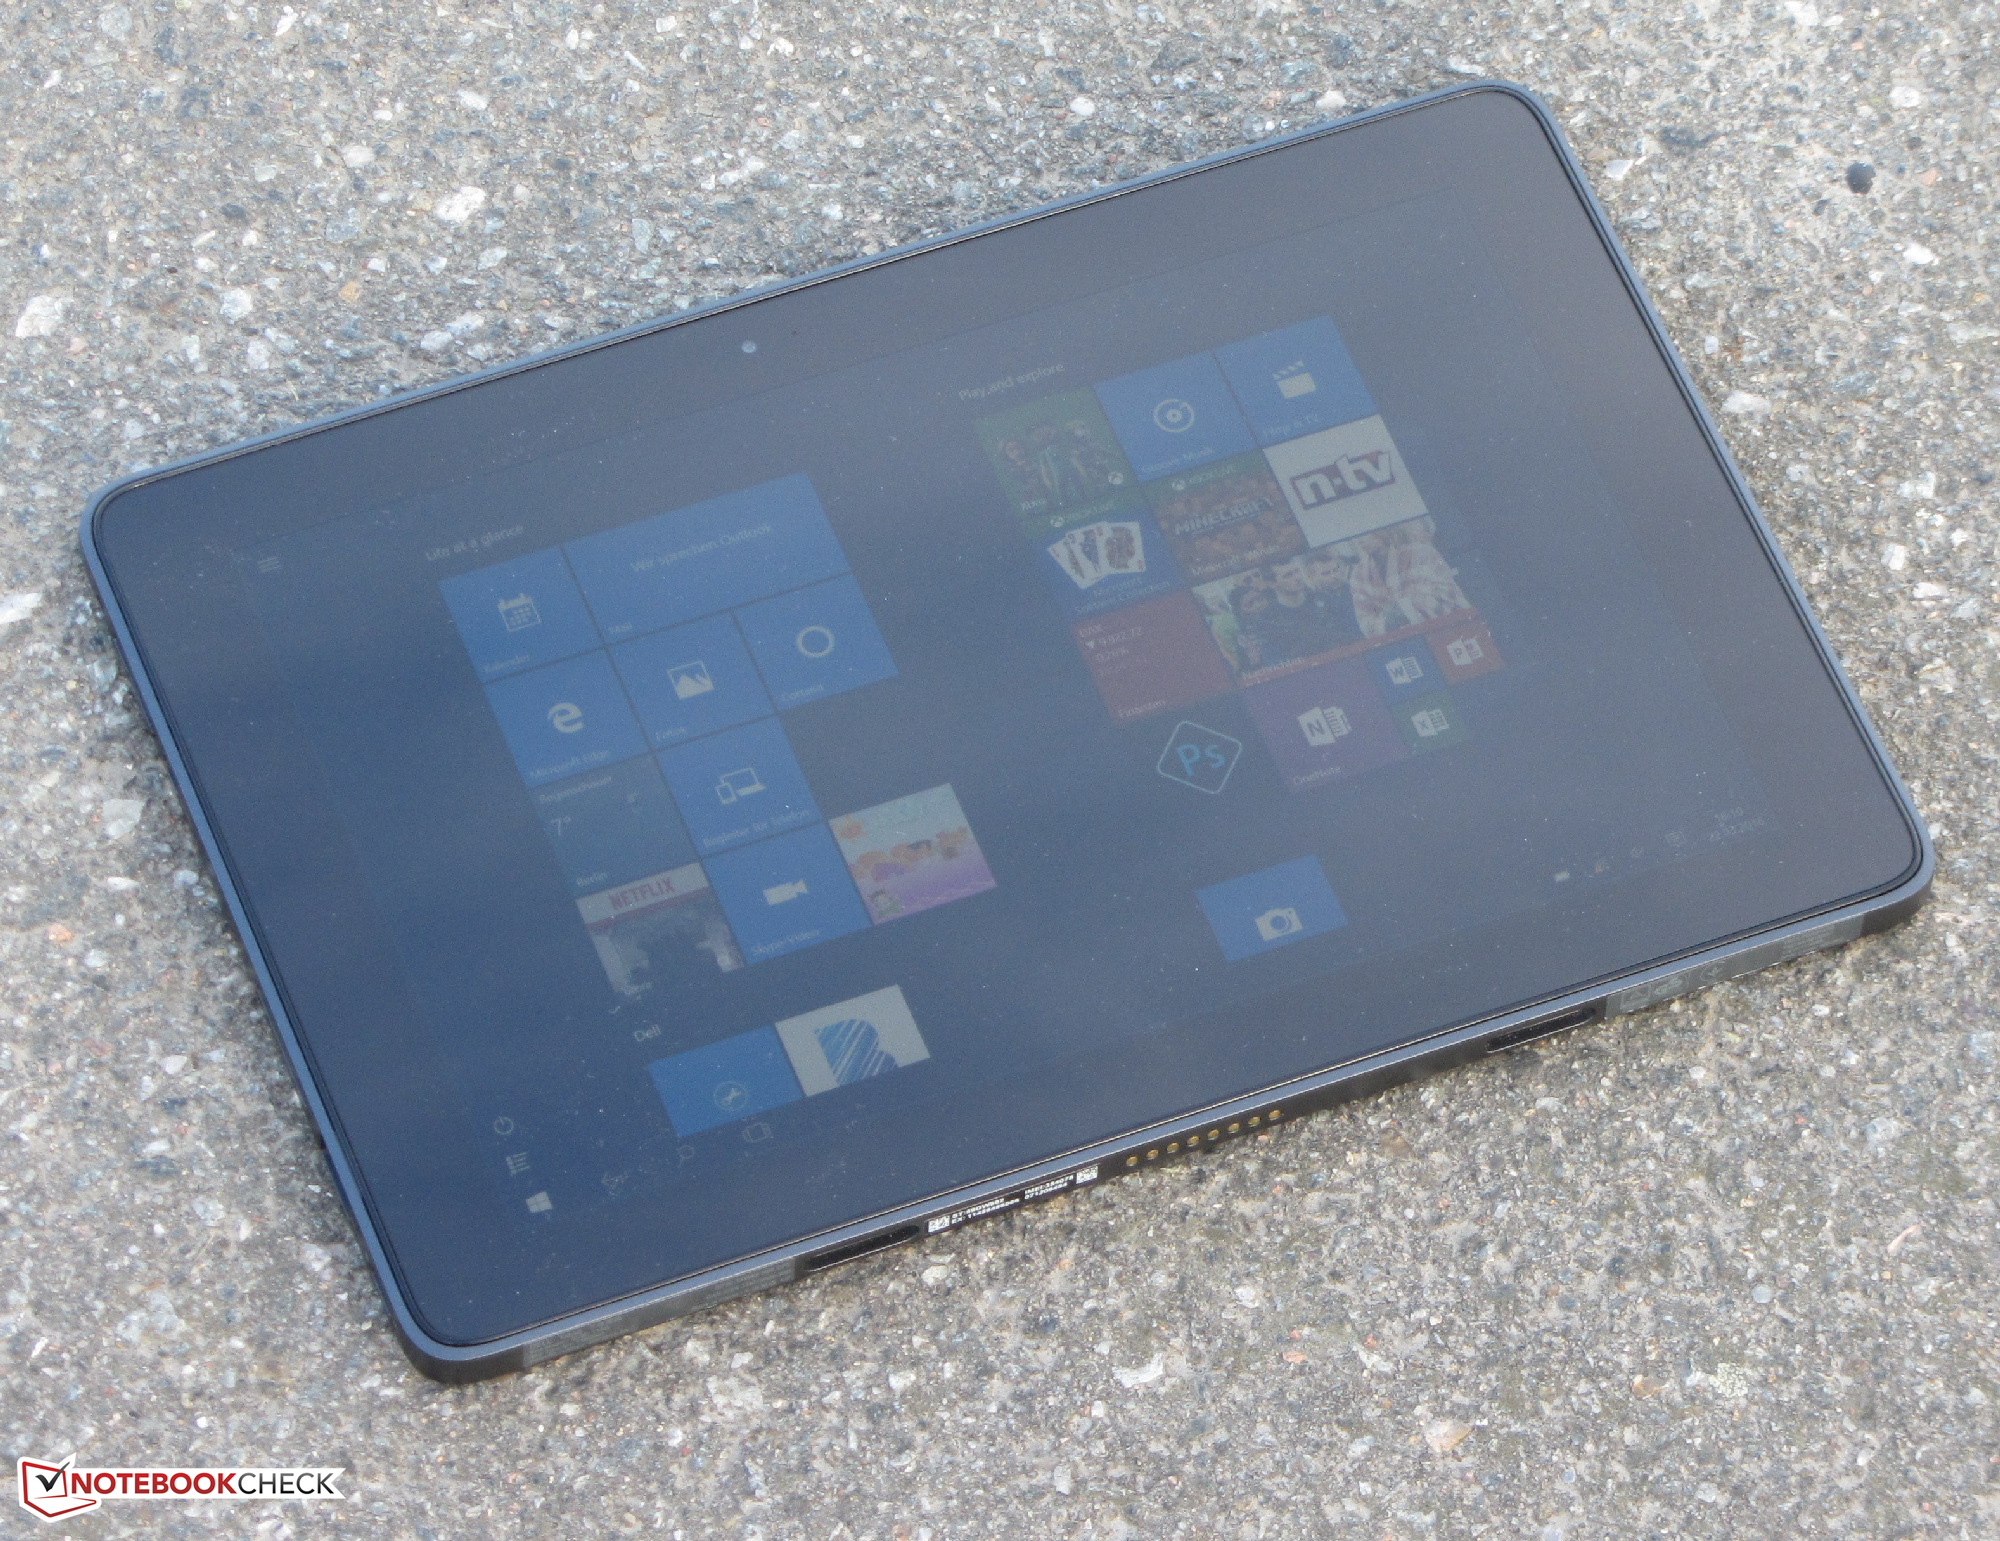
L'aspetto non lascia dubbi sul fatto che si tratta di un dispositivo per il business. Il peso di 662 g è relativamente elevato. Con la dock per la tastiera opzionale, il Venue sale a circa 1300 g - quanto netbooks e subnotebooks paragonabili.
Con un prezzo di 800 Euro, il Venue 10 Pro non è esattamente un affare.
Per l'utente domestico medio, il Venue non è una scelta molto interessante. Questo vale anche per la versione entry-level che costa 530 Euro (~$600). I netbooks o i tablets consumer sono alternative più economiche.
Si tratta di una recensione breve, con alcune sezioni non tradotte, per la versione integrale in inglese guardate qui.
Dell Venue 10 Pro 5056
- 04/18/2016 v5.1 (old)
Sascha Mölck
Price comparison
