Recensione breve del Portatile HP Pavilion Power 15t-cb2000 (i7-7700HQ, Radeon RX 550)


| SD Card Reader | |
| average JPG Copy Test (av. of 3 runs) | |
| HP Pavilion 15 Power 1GK62AV | |
| HP Omen 17-w206ng | |
| HP Omen 15-ax213ng | |
| Samsung Notebook 9 NP900X5N-X01US | |
| HP Pavilion Power 15t-cb2000 | |
| maximum AS SSD Seq Read Test (1GB) | |
| HP Pavilion Power 15t-cb2000 | |
| HP Omen 15-ax213ng | |
| HP Omen 17-w206ng | |
| Samsung Notebook 9 NP900X5N-X01US | |
| HP Pavilion 15 Power 1GK62AV | |
| |||||||||||||||||||||||||
Distribuzione della luminosità: 88 %
Al centro con la batteria: 256 cd/m²
Contrasto: 1219:1 (Nero: 0.21 cd/m²)
ΔE ColorChecker Calman: 5.2 | ∀{0.5-29.43 Ø4.71}
ΔE Greyscale Calman: 3.5 | ∀{0.09-98 Ø4.96}
59% sRGB (Argyll 1.6.3 3D)
37% AdobeRGB 1998 (Argyll 1.6.3 3D)
40.59% AdobeRGB 1998 (Argyll 3D)
58.9% sRGB (Argyll 3D)
39.28% Display P3 (Argyll 3D)
Gamma: 2.35
CCT: 6576 K
| HP Pavilion Power 15t-cb2000 AUO41ED , IPS, 15.6", 1920x1080 | HP Pavilion 15 Power 1GK62AV ID: AU Optronics AUO41ED, IPS, 15.6", 1920x1080 | HP Omen 15-ax213ng AU Optronics AUO41ED, IPS, 15.6", 1920x1080 | HP Omen 17-w206ng Chi Mei CMN1738, IPS, 17.3", 1920x1080 | Samsung Notebook 9 NP900X5N-X01US ID: BOE06E8, Name: BOE HF NV150FHB-N31, IPS, 15", 1920x1080 | |
|---|---|---|---|---|---|
| Display | -1% | -2% | 65% | 66% | |
| Display P3 Coverage (%) | 39.28 | 38.81 -1% | 38.59 -2% | 67.2 71% | 65.2 66% |
| sRGB Coverage (%) | 58.9 | 57.9 -2% | 58 -2% | 93.1 58% | 97.7 66% |
| AdobeRGB 1998 Coverage (%) | 40.59 | 40.03 -1% | 39.87 -2% | 67.4 66% | 67.2 66% |
| Response Times | 15% | 12% | 19% | 5% | |
| Response Time Grey 50% / Grey 80% * (ms) | 51.6 ? | 38.8 ? 25% | 42 ? 19% | 38 ? 26% | 40.8 ? 21% |
| Response Time Black / White * (ms) | 29.2 ? | 28 ? 4% | 28 ? 4% | 26 ? 11% | 32.4 ? -11% |
| PWM Frequency (Hz) | 200 ? | 208.3 ? | |||
| Screen | 3% | 7% | 17% | 40% | |
| Brightness middle (cd/m²) | 256 | 256.6 0% | 230 -10% | 318 24% | 565.6 121% |
| Brightness (cd/m²) | 241 | 243 1% | 228 -5% | 295 22% | 524 117% |
| Brightness Distribution (%) | 88 | 81 -8% | 88 0% | 79 -10% | 88 0% |
| Black Level * (cd/m²) | 0.21 | 0.19 10% | 0.21 -0% | 0.25 -19% | 0.49 -133% |
| Contrast (:1) | 1219 | 1351 11% | 1095 -10% | 1272 4% | 1154 -5% |
| Colorchecker dE 2000 * | 5.2 | 5 4% | 4.01 23% | 4.7 10% | 2 62% |
| Colorchecker dE 2000 max. * | 19.3 | 20.1 -4% | 7.26 62% | 8.8 54% | 5 74% |
| Greyscale dE 2000 * | 3.5 | 2.7 23% | 3.18 9% | 5 -43% | 2.5 29% |
| Gamma | 2.35 94% | 2.32 95% | 2.52 87% | 2.28 96% | 2.21 100% |
| CCT | 6576 99% | 6599 98% | 6814 95% | 7374 88% | 6896 94% |
| Color Space (Percent of AdobeRGB 1998) (%) | 37 | 36.7 -1% | 37 0% | 61 65% | 61.2 65% |
| Color Space (Percent of sRGB) (%) | 59 | 57.7 -2% | 58 -2% | 93 58% | 97.5 65% |
| Media totale (Programma / Settaggio) | 6% /
4% | 6% /
6% | 34% /
26% | 37% /
40% |
* ... Meglio usare valori piccoli
Tempi di risposta del Display
| ↔ Tempi di risposta dal Nero al Bianco | ||
|---|---|---|
| 29.2 ms ... aumenta ↗ e diminuisce ↘ combinato | ↗ 16.8 ms Incremento | 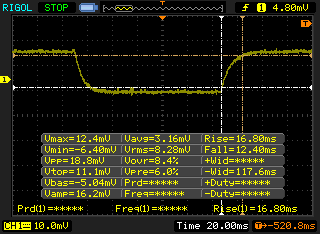 |
| ↘ 12.4 ms Calo | ||
| Lo schermo mostra tempi di risposta relativamente lenti nei nostri tests e potrebbe essere troppo lento per i gamers. In confronto, tutti i dispositivi di test variano da 0.1 (minimo) a 240 (massimo) ms. » 78 % di tutti i dispositivi è migliore. Questo significa che i tempi di risposta rilevati sono peggiori rispetto alla media di tutti i dispositivi testati (19.8 ms). | ||
| ↔ Tempo di risposta dal 50% Grigio all'80% Grigio | ||
| 51.6 ms ... aumenta ↗ e diminuisce ↘ combinato | ↗ 26.4 ms Incremento |  |
| ↘ 25.2 ms Calo | ||
| Lo schermo mostra tempi di risposta lenti nei nostri tests e sarà insoddisfacente per i gamers. In confronto, tutti i dispositivi di test variano da 0.165 (minimo) a 636 (massimo) ms. » 88 % di tutti i dispositivi è migliore. Questo significa che i tempi di risposta rilevati sono peggiori rispetto alla media di tutti i dispositivi testati (31 ms). | ||
Sfarfallio dello schermo / PWM (Pulse-Width Modulation)
| flickering dello schermo / PWM non rilevato |  | ||
In confronto: 52 % di tutti i dispositivi testati non utilizza PWM per ridurre la luminosita' del display. Se è rilevato PWM, una media di 7754 (minimo: 5 - massimo: 343500) Hz è stata rilevata. | |||
| wPrime 2.10 - 1024m | |
| Samsung Notebook 9 NP900X5N-X01US | |
| HP Pavilion Power 15t-cb2000 | |
| HP Pavilion 15 Power 1GK62AV | |
* ... Meglio usare valori piccoli
| PCMark 8 | |
| Home Score Accelerated v2 | |
| HP Pavilion Power 15t-cb2000 | |
| HP Omen 17-w206ng | |
| HP Omen 15-ax213ng | |
| HP Pavilion 15 Power 1GK62AV | |
| Samsung Notebook 9 NP900X5N-X01US | |
| Work Score Accelerated v2 | |
| HP Pavilion 15 Power 1GK62AV | |
| Samsung Notebook 9 NP900X5N-X01US | |
| HP Pavilion Power 15t-cb2000 | |
| HP Omen 15-ax213ng | |
| Creative Score Accelerated v2 | |
| HP Omen 15-ax213ng | |
| HP Pavilion 15 Power 1GK62AV | |
| HP Pavilion Power 15t-cb2000 | |
| Samsung Notebook 9 NP900X5N-X01US | |
| PCMark 8 Home Score Accelerated v2 | 4499 punti | |
| PCMark 8 Creative Score Accelerated v2 | 5151 punti | |
| PCMark 8 Work Score Accelerated v2 | 4627 punti | |
| PCMark 10 Score | 3802 punti | |
Aiuto | ||
| HP Pavilion Power 15t-cb2000 HGST Travelstar 7K1000 HTS721010A9E630 | HP Pavilion 15 Power 1GK62AV SK Hynix HFS256G39TND-N210A | HP Omen 15-ax213ng Samsung PM961 MZVLW256HEHP | HP Omen 17-w206ng Samsung PM961 MZVLW256HEHP | Samsung Notebook 9 NP900X5N-X01US Samsung PM961 MZVLW256HEHP | |
|---|---|---|---|---|---|
| CrystalDiskMark 3.0 | 8924% | 24609% | 22337% | 19660% | |
| Read Seq (MB/s) | 105.9 | 491.6 364% | 1657 1465% | 1606 1417% | 1447 1266% |
| Write Seq (MB/s) | 104.7 | 141.7 35% | 1208 1054% | 1176 1023% | 1281 1123% |
| Read 512 (MB/s) | 36.71 | 345.6 841% | 806 2096% | 846 2205% | 651 1673% |
| Write 512 (MB/s) | 49.86 | 142.6 186% | 807 1519% | 805 1515% | 765 1434% |
| Read 4k (MB/s) | 0.473 | 18.83 3881% | 62.6 13135% | 59.9 12564% | 58.3 12226% |
| Write 4k (MB/s) | 0.547 | 76.3 13849% | 176.9 32240% | 155.6 28346% | 131.9 24013% |
| Read 4k QD32 (MB/s) | 0.903 | 348.5 38494% | 650 71882% | 588 65016% | 545 60254% |
| Write 4k QD32 (MB/s) | 0.757 | 104.8 13744% | 557 73480% | 505 66611% | 419.3 55290% |

| 3DMark 06 Standard Score | 23308 punti | |
| 3DMark 11 Performance | 5704 punti | |
| 3DMark Ice Storm Standard Score | 92226 punti | |
| 3DMark Cloud Gate Standard Score | 15004 punti | |
| 3DMark Fire Strike Score | 3738 punti | |
| 3DMark Fire Strike Extreme Score | 1775 punti | |
| 3DMark Time Spy Score | 1302 punti | |
Aiuto | ||
| Metro: Last Light | |
| 1920x1080 Very High (DX11) AF:16x (ordina per valore) | |
| HP Pavilion Power 15t-cb2000 | |
| HP Pavilion 15 Power 1GK62AV | |
| 1366x768 High (DX11) AF:16x (ordina per valore) | |
| HP Pavilion Power 15t-cb2000 | |
| HP Pavilion 15 Power 1GK62AV | |
| HP 15-bw077ax | |
| 1366x768 Medium (DX10) AF:4x (ordina per valore) | |
| HP Pavilion Power 15t-cb2000 | |
| HP 15-bw077ax | |
| 1024x768 Low (DX10) AF:4x (ordina per valore) | |
| HP Pavilion Power 15t-cb2000 | |
| HP 15-bw077ax | |
| Thief | |
| 1920x1080 Very High Preset AA:FXAA & High SS AF:8x (ordina per valore) | |
| HP Pavilion Power 15t-cb2000 | |
| HP Pavilion 15 Power 1GK62AV | |
| 1366x768 High Preset AA:FXAA & Low SS AF:4x (ordina per valore) | |
| HP Pavilion Power 15t-cb2000 | |
| HP Pavilion 15 Power 1GK62AV | |
| 1366x768 Normal Preset AA:FX (ordina per valore) | |
| HP Pavilion Power 15t-cb2000 | |
| 1024x768 Very Low Preset (ordina per valore) | |
| HP Pavilion Power 15t-cb2000 | |
| The Witcher 3 | |
| 1920x1080 Ultra Graphics & Postprocessing (HBAO+) (ordina per valore) | |
| HP Pavilion Power 15t-cb2000 | |
| HP Pavilion 15 Power 1GK62AV | |
| HP Omen 15-ax213ng | |
| HP Omen 17-w206ng | |
| 1920x1080 High Graphics & Postprocessing (Nvidia HairWorks Off) (ordina per valore) | |
| HP Pavilion 15 Power 1GK62AV | |
| HP Omen 15-ax213ng | |
| HP Omen 17-w206ng | |
| 1366x768 Medium Graphics & Postprocessing (ordina per valore) | |
| HP Pavilion 15 Power 1GK62AV | |
| HP Omen 15-ax213ng | |
| HP Omen 17-w206ng | |
| 1024x768 Low Graphics & Postprocessing (ordina per valore) | |
| HP Omen 15-ax213ng | |
| HP Omen 17-w206ng | |
| Samsung Notebook 9 NP900X5N-X01US | |
| HP 15-bw077ax | |
| HP Pavilion 17z 1EX13AV | |
| Rise of the Tomb Raider | |
| 1920x1080 Very High Preset AA:FX AF:16x (ordina per valore) | |
| HP Pavilion Power 15t-cb2000 | |
| HP Pavilion 15 Power 1GK62AV | |
| HP Omen 15-ax213ng | |
| 1920x1080 High Preset AA:FX AF:4x (ordina per valore) | |
| HP Pavilion Power 15t-cb2000 | |
| HP Pavilion 15 Power 1GK62AV | |
| HP Omen 15-ax213ng | |
| Samsung Notebook 9 NP900X5N-X01US | |
| 1366x768 Medium Preset AF:2x (ordina per valore) | |
| HP Pavilion Power 15t-cb2000 | |
| HP Omen 15-ax213ng | |
| Samsung Notebook 9 NP900X5N-X01US | |
| HP 15-bw077ax | |
| HP Pavilion 17z 1EX13AV | |
| 1024x768 Lowest Preset (ordina per valore) | |
| HP Pavilion Power 15t-cb2000 | |
| HP Omen 15-ax213ng | |
| Samsung Notebook 9 NP900X5N-X01US | |
| HP 15-bw077ax | |
| HP Pavilion 17z 1EX13AV | |
| Asus X555DA-BB11 | |
| Batman: Arkham Knight | |
| 1920x1080 High / On AA:SM AF:16x (ordina per valore) | |
| HP Pavilion Power 15t-cb2000 | |
| HP Pavilion 15 Power 1GK62AV | |
| 1920x1080 High / On (Interactive Smoke & Paper Debris Off) AA:SM AF:8x (ordina per valore) | |
| HP Pavilion Power 15t-cb2000 | |
| 1366x768 Normal / Off AF:4x (ordina per valore) | |
| HP Pavilion Power 15t-cb2000 | |
| HP Pavilion 15 Power 1GK62AV | |
| HP 15-bw077ax | |
| 1280x720 Low / Off AF:Trilinear (ordina per valore) | |
| HP Pavilion Power 15t-cb2000 | |
| HP Pavilion 15 Power 1GK62AV | |
| HP 15-bw077ax | |
| HP Pavilion 17z 1EX13AV | |
| Ashes of the Singularity | |
| 1280x768 low (ordina per valore) | |
| HP Pavilion Power 15t-cb2000 | |
| HP Pavilion 15 Power 1GK62AV | |
| HP 15-bw077ax | |
| 1920x1080 Standard (ordina per valore) | |
| HP Pavilion Power 15t-cb2000 | |
| HP Pavilion 15 Power 1GK62AV | |
| 1920x1080 high (ordina per valore) | |
| HP Pavilion Power 15t-cb2000 | |
| HP Pavilion 15 Power 1GK62AV | |
| Doom | |
| 1920x1080 Ultra Preset AA:SM (ordina per valore) | |
| HP Pavilion Power 15t-cb2000 | |
| HP Pavilion 15 Power 1GK62AV | |
| 1920x1080 High Preset AA:FX (ordina per valore) | |
| HP Pavilion Power 15t-cb2000 | |
| HP Pavilion 15 Power 1GK62AV | |
| 1366x768 Medium Preset (ordina per valore) | |
| HP Pavilion Power 15t-cb2000 | |
| HP Pavilion 15 Power 1GK62AV | |
| 1280x720 Low Preset (ordina per valore) | |
| HP Pavilion Power 15t-cb2000 | |
| HP Pavilion 15 Power 1GK62AV | |
| HP Pavilion 17z 1EX13AV | |
| basso | medio | alto | ultra | |
|---|---|---|---|---|
| Tomb Raider (2013) | 289.8 | 149.5 | 114.9 | 51.2 |
| BioShock Infinite (2013) | 183 | 133 | 117 | 67 |
| Metro: Last Light (2013) | 90 | 85.4 | 59.5 | 28.4 |
| Thief (2014) | 65.2 | 58.3 | 55.1 | 29 |
| The Witcher 3 (2015) | 24 | |||
| Batman: Arkham Knight (2015) | 82 | 71 | 39 | 27 |
| Rise of the Tomb Raider (2016) | 91 | 54 | 27 | 21 |
| Ashes of the Singularity (2016) | 41.9 | 25.4 | 22 | |
| Doom (2016) | 56 | 37 | 22 | 21 |
Rumorosità
| Idle |
| 30.8 / 30.9 / 31.1 dB(A) |
| Sotto carico |
| 50.2 / 50.2 dB(A) |
 | ||
30 dB silenzioso 40 dB(A) udibile 50 dB(A) rumoroso |
||
min: | ||
| HP Pavilion Power 15t-cb2000 Radeon RX 550 (Laptop), i7-7700HQ, HGST Travelstar 7K1000 HTS721010A9E630 | HP Pavilion 15 Power 1GK62AV GeForce GTX 1050 Mobile, i7-7700HQ, SK Hynix HFS256G39TND-N210A | HP Omen 15-ax213ng GeForce GTX 1050 Ti Mobile, i7-7700HQ, Samsung PM961 MZVLW256HEHP | HP Omen 17-w206ng GeForce GTX 1050 Ti Mobile, i7-7700HQ, Samsung PM961 MZVLW256HEHP | Samsung Notebook 9 NP900X5N-X01US GeForce 940MX, i7-7500U, Samsung PM961 MZVLW256HEHP | |
|---|---|---|---|---|---|
| Noise | 2% | -5% | -6% | 12% | |
| off /ambiente * (dB) | 28.4 | 27.8 2% | 30 -6% | 30 -6% | 28.3 -0% |
| Idle Minimum * (dB) | 30.8 | 32.1 -4% | 32 -4% | 34 -10% | 28.3 8% |
| Idle Average * (dB) | 30.9 | 32.2 -4% | 34 -10% | 35 -13% | 28.3 8% |
| Idle Maximum * (dB) | 31.1 | 32.2 -4% | 36 -16% | 36 -16% | 28.3 9% |
| Load Average * (dB) | 50.2 | 43.3 14% | 48 4% | 47 6% | 38.3 24% |
| Witcher 3 ultra * (dB) | 50.2 | 45 10% | 49 2% | 48 4% | |
| Load Maximum * (dB) | 50.2 | 49.6 1% | 51 -2% | 52 -4% | 38.3 24% |
* ... Meglio usare valori piccoli
(±) La temperatura massima sul lato superiore è di 43.4 °C / 110 F, rispetto alla media di 36.8 °C / 98 F, che varia da 21 a 71 °C per questa classe Multimedia.
(-) Il lato inferiore si riscalda fino ad un massimo di 54 °C / 129 F, rispetto alla media di 39.1 °C / 102 F
(+) In idle, la temperatura media del lato superiore è di 31.5 °C / 89 F, rispetto alla media deld ispositivo di 31.3 °C / 88 F.
(±) Riproducendo The Witcher 3, la temperatura media per il lato superiore e' di 32.2 °C / 90 F, rispetto alla media del dispositivo di 31.3 °C / 88 F.
(±) I poggiapolsi e il touchpad possono diventare molto caldi al tatto con un massimo di 37.8 °C / 100 F.
(-) La temperatura media della zona del palmo della mano di dispositivi simili e'stata di 28.7 °C / 83.7 F (-9.1 °C / -16.3 F).
HP Pavilion Power 15t-cb2000 analisi audio
(±) | potenza degli altiparlanti media ma buona (74.6 dB)
Bassi 100 - 315 Hz
(-) | quasi nessun basso - in media 16.2% inferiori alla media
(±) | la linearità dei bassi è media (13.8% delta rispetto alla precedente frequenza)
Medi 400 - 2000 Hz
(+) | medi bilanciati - solo only 4.3% rispetto alla media
(+) | medi lineari (6.8% delta rispetto alla precedente frequenza)
Alti 2 - 16 kHz
(+) | Alti bilanciati - appena 3.1% dalla media
(±) | la linearità degli alti è media (8.3% delta rispetto alla precedente frequenza)
Nel complesso 100 - 16.000 Hz
(±) | la linearità complessiva del suono è media (25.4% di differenza rispetto alla media
Rispetto alla stessa classe
» 90% di tutti i dispositivi testati in questa classe è stato migliore, 2% simile, 8% peggiore
» Il migliore ha avuto un delta di 5%, medio di 17%, peggiore di 45%
Rispetto a tutti i dispositivi testati
» 78% di tutti i dispositivi testati in questa classe è stato migliore, 5% similare, 17% peggiore
» Il migliore ha avuto un delta di 4%, medio di 23%, peggiore di 134%
Apple MacBook 12 (Early 2016) 1.1 GHz analisi audio
(+) | gli altoparlanti sono relativamente potenti (83.6 dB)
Bassi 100 - 315 Hz
(±) | bassi ridotti - in media 11.3% inferiori alla media
(±) | la linearità dei bassi è media (14.2% delta rispetto alla precedente frequenza)
Medi 400 - 2000 Hz
(+) | medi bilanciati - solo only 2.4% rispetto alla media
(+) | medi lineari (5.5% delta rispetto alla precedente frequenza)
Alti 2 - 16 kHz
(+) | Alti bilanciati - appena 2% dalla media
(+) | alti lineari (4.5% delta rispetto alla precedente frequenza)
Nel complesso 100 - 16.000 Hz
(+) | suono nel complesso lineare (10.2% differenza dalla media)
Rispetto alla stessa classe
» 7% di tutti i dispositivi testati in questa classe è stato migliore, 2% simile, 90% peggiore
» Il migliore ha avuto un delta di 5%, medio di 18%, peggiore di 53%
Rispetto a tutti i dispositivi testati
» 5% di tutti i dispositivi testati in questa classe è stato migliore, 1% similare, 94% peggiore
» Il migliore ha avuto un delta di 4%, medio di 23%, peggiore di 134%
| Off / Standby | |
| Idle | |
| Sotto carico |
|
Leggenda:
min: | |
| HP Pavilion Power 15t-cb2000 i7-7700HQ, Radeon RX 550 (Laptop), HGST Travelstar 7K1000 HTS721010A9E630, IPS, 1920x1080, 15.6" | HP Pavilion 15 Power 1GK62AV i7-7700HQ, GeForce GTX 1050 Mobile, SK Hynix HFS256G39TND-N210A, IPS, 1920x1080, 15.6" | HP Omen 15-ax213ng i7-7700HQ, GeForce GTX 1050 Ti Mobile, Samsung PM961 MZVLW256HEHP, IPS, 1920x1080, 15.6" | HP Omen 17-w206ng i7-7700HQ, GeForce GTX 1050 Ti Mobile, Samsung PM961 MZVLW256HEHP, IPS, 1920x1080, 17.3" | Samsung Notebook 9 NP900X5N-X01US i7-7500U, GeForce 940MX, Samsung PM961 MZVLW256HEHP, IPS, 1920x1080, 15" | |
|---|---|---|---|---|---|
| Power Consumption | 10% | 0% | -18% | 41% | |
| Idle Minimum * (Watt) | 18.7 | 9.4 50% | 6 68% | 11 41% | 5 73% |
| Idle Average * (Watt) | 19.6 | 9.7 51% | 11 44% | 18 8% | 11.6 41% |
| Idle Maximum * (Watt) | 21.7 | 16.8 23% | 18 17% | 24 -11% | 12.2 44% |
| Load Average * (Watt) | 60.1 | 76.5 -27% | 81 -35% | 84 -40% | 47.8 20% |
| Witcher 3 ultra * (Watt) | 80.5 | 86.5 -7% | 90 -12% | 101 -25% | 51.9 36% |
| Load Maximum * (Watt) | 80.6 | 105.6 -31% | 146 -81% | 146 -81% | 55.7 31% |
* ... Meglio usare valori piccoli
| HP Pavilion Power 15t-cb2000 i7-7700HQ, Radeon RX 550 (Laptop), 70 Wh | HP Pavilion 15 Power 1GK62AV i7-7700HQ, GeForce GTX 1050 Mobile, 70 Wh | HP Omen 15-ax213ng i7-7700HQ, GeForce GTX 1050 Ti Mobile, 63.3 Wh | HP Omen 17-w206ng i7-7700HQ, GeForce GTX 1050 Ti Mobile, 62 Wh | Samsung Notebook 9 NP900X5N-X01US i7-7500U, GeForce 940MX, 66 Wh | |
|---|---|---|---|---|---|
| Autonomia della batteria | 30% | 10% | 7% | 79% | |
| Reader / Idle (h) | 10.5 | 16.2 54% | 12.8 22% | 13.3 27% | 27.4 161% |
| WiFi v1.3 (h) | 5.7 | 8 40% | 7.1 25% | 6.3 11% | 10.1 77% |
| Load (h) | 1.9 | 1.8 -5% | 1.6 -16% | 1.6 -16% | 1.9 0% |
Pro
Contro


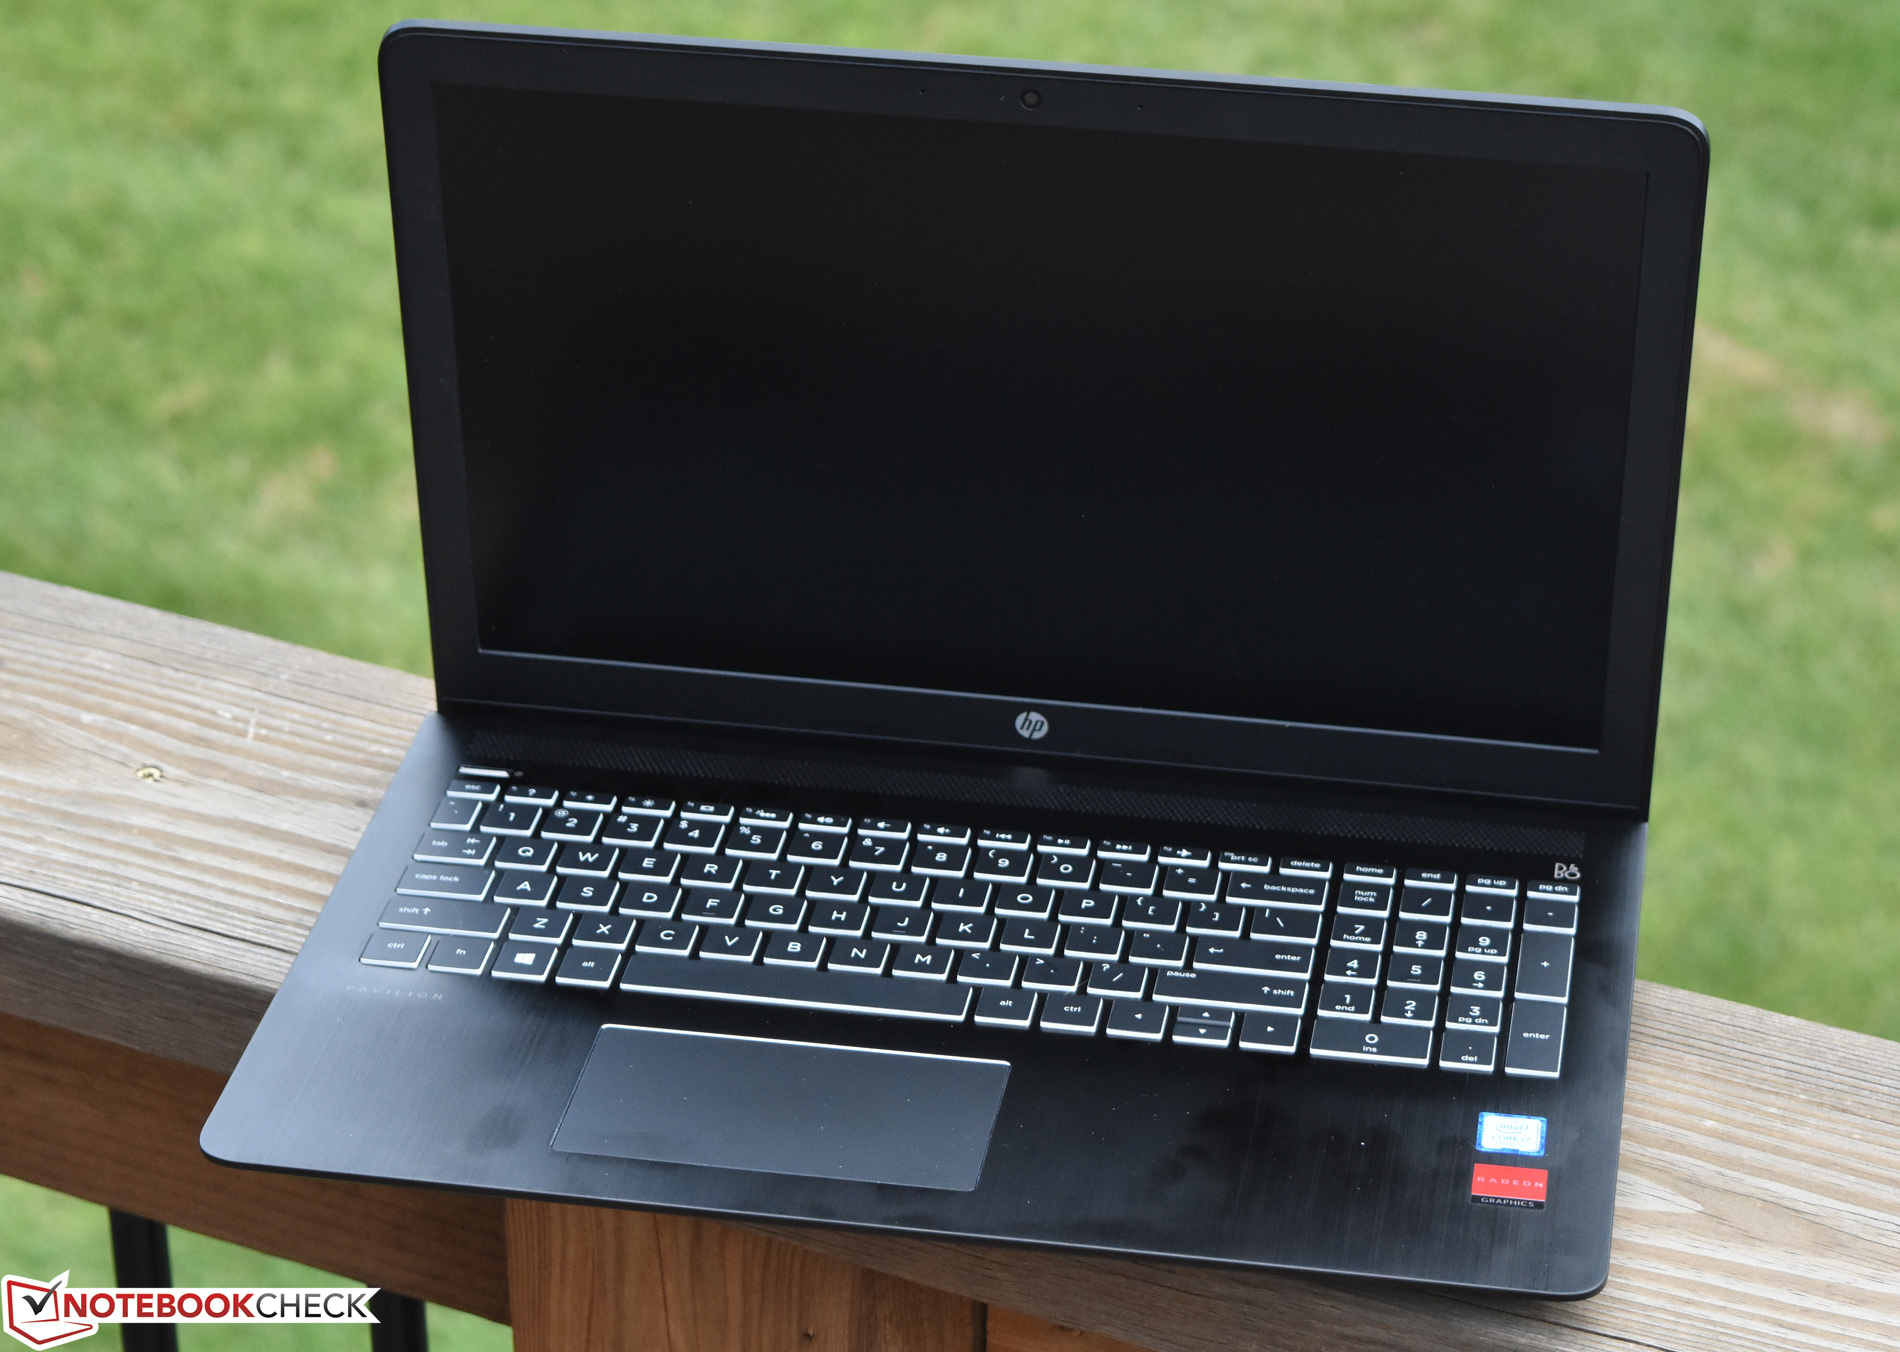
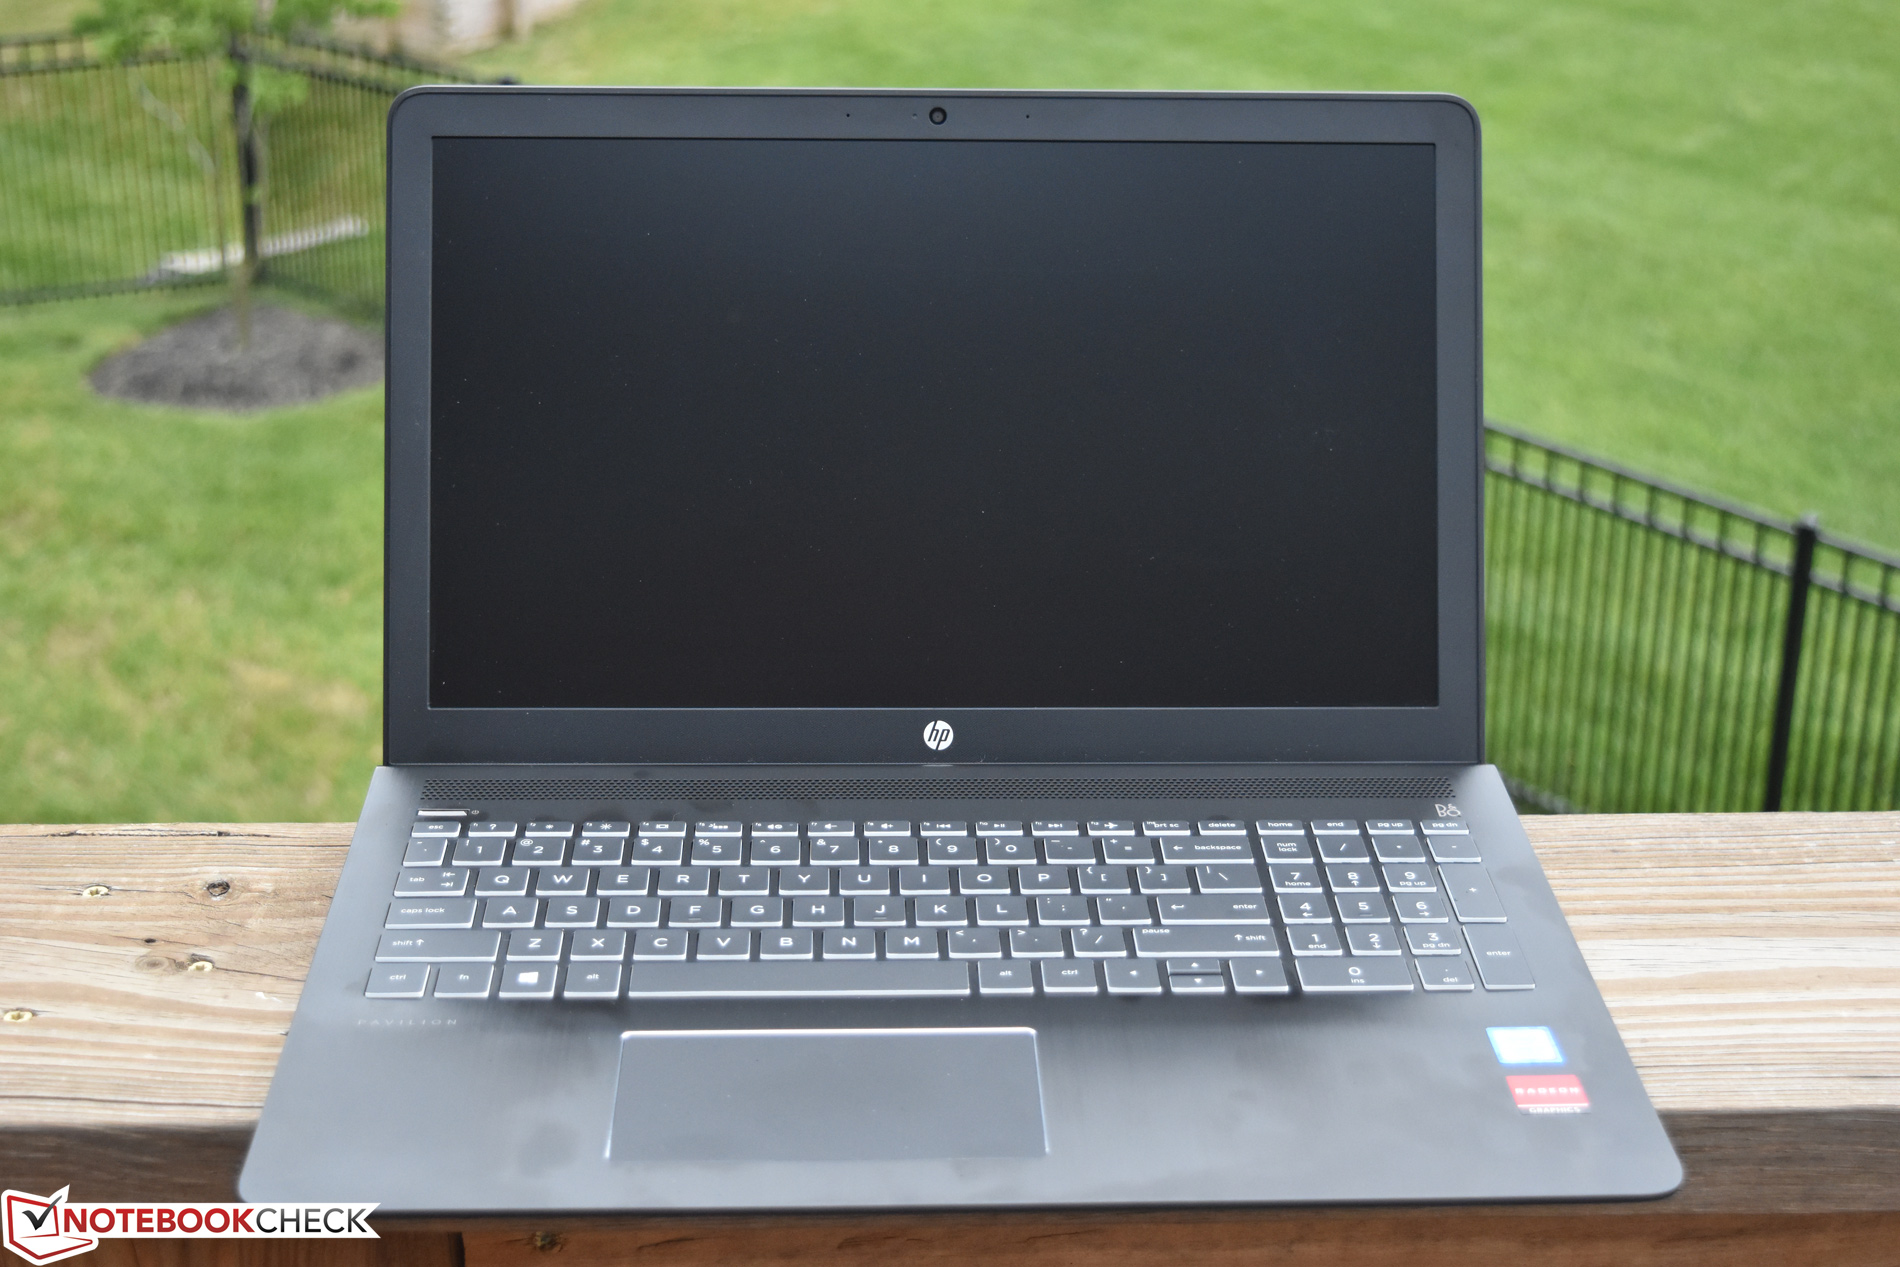
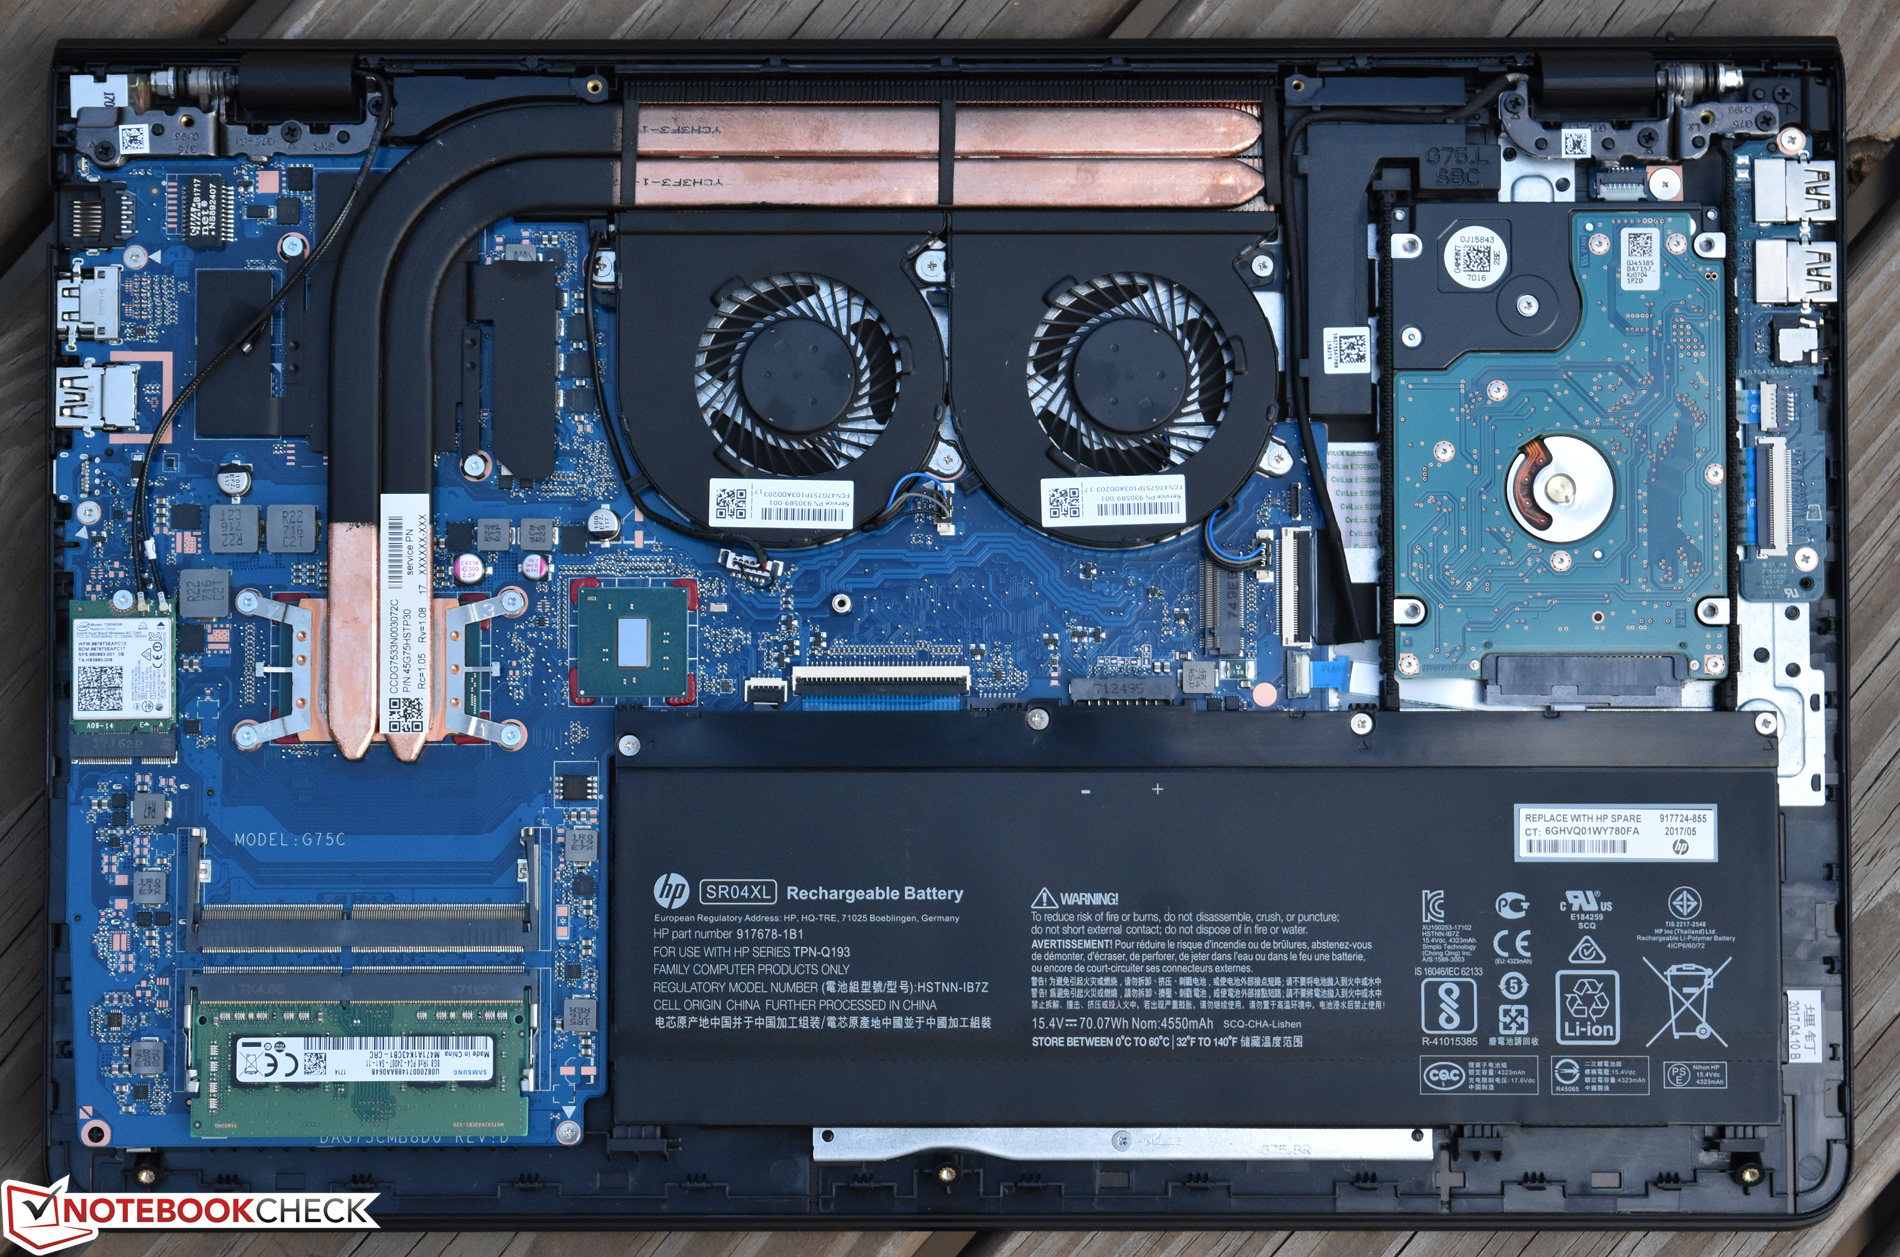
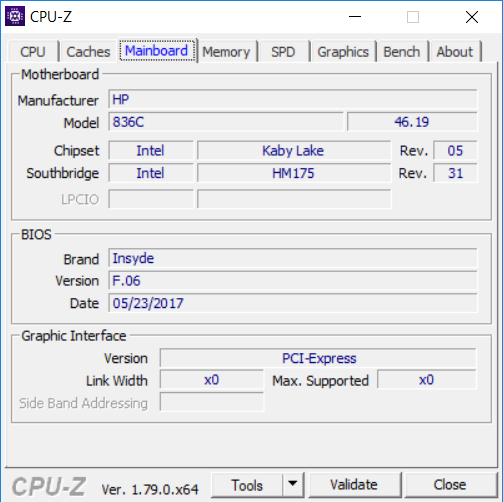
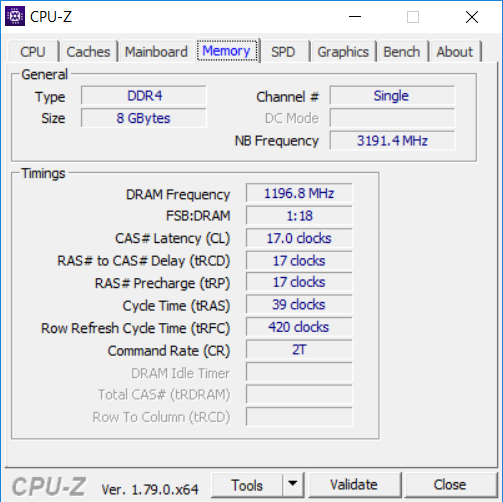
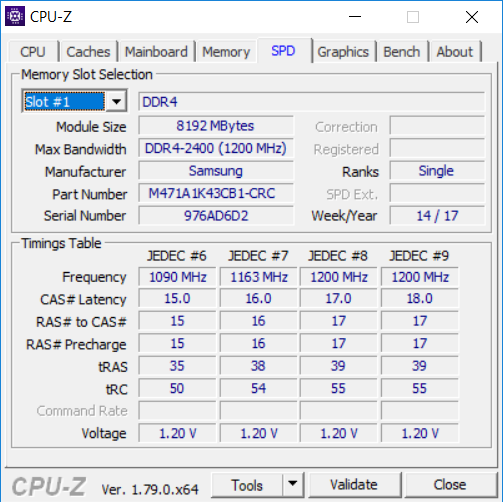
Per $880, il Pavilion Power 15 è un midrange in ogni senso. A parte il popolare Core i7-7700HQ, ci sono 8 GB di RAM ed una scheda grafica, oltre ad un decente display FHD antiriflesso. Ha anche una costruzione solida e una buona selezione di porte (ma manca la Thunderbolt 3). Funziona abbastanza bene come entry-level gaming sebbene non predisposto al futuro.
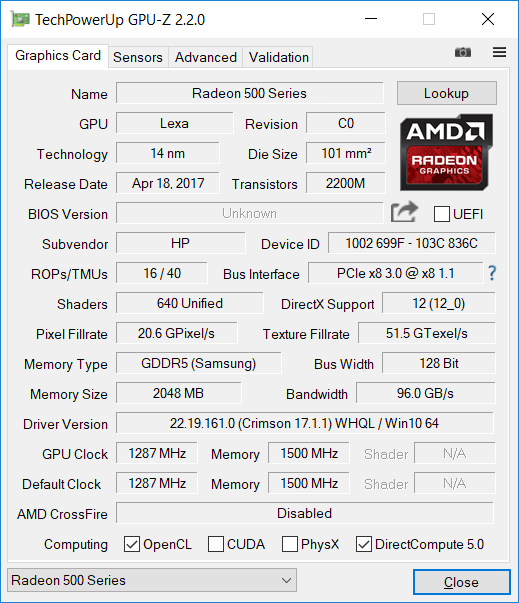
Il Pavilion Power 15t con scheda grafica AMD RX 550 funziona come entry-level gaming machine, ma è difficile raccomandarlo rispetto ad un setup NVIDIA GTX 1050 (completo con un solid-state) abbiamo recensito un paio di settimane fa—un'opzione che costa appena $120 in più.
Sebbene c'è la possibilità di upgrade il drive da 1 TB 7200 RPM è un collo di bottiglia, e la RX 550 non compete (almeno in termini di performance ed efficienza energetica) con le GPUs NVIDIA Pascal come la GTX 1050. Il peggio che possiamo dire è che il dispositivo non è giudicabile a causa di strani problemi apparsi al sistema di raffreddamento. Le prestazioni CPU del nostro dispositivo erano affette da problemi termici, con temperature fino a 90° C durante lo stress test e i valori benchmark inferiori tra il 5% e il 57%.
Considerando sia un problema isolato, tuttavia, la configurazione RX 550 è difficile da raccomandare rispetto ad un setup NVIDIA GTX 1050 (con solid-state) abbiamo recensito un paio di settimane fa—un'opzione che costa appena $120 in più. Chiederemo al distributore un aggiornamento se avremo modo di rivedere questa configurazione.
Nota: si tratta di una recensione breve, con alcune sezioni non tradotte, per la versione integrale in inglese guardate qui.
HP Pavilion Power 15t-cb2000
- 07/14/2017 v6 (old)
Steve Schardein
Price comparison
