Recensione breve del Portatile HP Omen 15t 2017 (7700HQ, GTX 1050 Ti, Full HD)

| SD Card Reader | |
| average JPG Copy Test (av. of 3 runs) | |
| Asus FX502VM-AS73 | |
| HP Omen 15-ax007ng | |
| HP Omen 15-ax213ng | |
| Lenovo Legion Y520-15IKBN-80WK001KUS | |
| Acer Aspire VX5-591G-75C4 VX15 | |
| Dell Inspiron 15 7000 7567 | |
| maximum AS SSD Seq Read Test (1GB) | |
| Lenovo Legion Y520-15IKBN-80WK001KUS | |
| HP Omen 15-ax213ng | |
| Asus FX502VM-AS73 | |
| HP Omen 15-ax007ng | |
| Acer Aspire VX5-591G-75C4 VX15 | |
| Dell Inspiron 15 7000 7567 | |
| Networking | |
| iperf3 transmit AX12 | |
| Acer Aspire VX5-591G-75C4 VX15 | |
| HP Omen 15-ax213ng | |
| Asus FX502VM-AS73 | |
| Dell Inspiron 15 7000 7567 (jseb) | |
| Lenovo Legion Y520-15IKBN-80WK001KUS | |
| iperf3 receive AX12 | |
| HP Omen 15-ax213ng | |
| Asus FX502VM-AS73 | |
| Acer Aspire VX5-591G-75C4 VX15 | |
| Lenovo Legion Y520-15IKBN-80WK001KUS | |
| Dell Inspiron 15 7000 7567 (jseb) | |
| |||||||||||||||||||||||||
Distribuzione della luminosità: 88 %
Al centro con la batteria: 230 cd/m²
Contrasto: 1095:1 (Nero: 0.21 cd/m²)
ΔE ColorChecker Calman: 4.01 | ∀{0.5-29.43 Ø4.71}
ΔE Greyscale Calman: 3.18 | ∀{0.09-98 Ø4.96}
58% sRGB (Argyll 1.6.3 3D)
37% AdobeRGB 1998 (Argyll 1.6.3 3D)
39.87% AdobeRGB 1998 (Argyll 3D)
58% sRGB (Argyll 3D)
38.59% Display P3 (Argyll 3D)
Gamma: 2.52
CCT: 6814 K
| HP Omen 15-ax213ng AU Optronics AUO41ED, 1920x1080, 15.6" | HP Omen 15-ax007ng LGD0519, 1920x1080, 15.6" | Acer Aspire VX5-591G-75C4 VX15 LG Philips LGD0550 / LP156WF6-SPK4, 1920x1080, 15.6" | Dell Inspiron 15 7000 7567 AU Optronics AUO38ED B156HTN 28H80, 1920x1080, 15.6" | Lenovo Legion Y520-15IKBN-80WK001KUS LP156WF6-SPK3, 1920x1080, 15.6" | Asus FX502VM-AS73 1920x1080, 15.6" | |
|---|---|---|---|---|---|---|
| Display | 29% | 1% | -6% | -1% | ||
| Display P3 Coverage (%) | 38.59 | 59.9 55% 40.34 5% | 38.88 1% | 36.42 -6% | 38.28 -1% | |
| sRGB Coverage (%) | 58 | 85.9 48% 60.3 4% | 58.2 0% | 54.9 -5% | 56.9 -2% | |
| AdobeRGB 1998 Coverage (%) | 39.87 | 61.6 55% 41.73 5% | 40.2 1% | 37.62 -6% | 39.47 -1% | |
| Response Times | -21% | 33% | -8% | -35% | 26% | |
| Response Time Grey 50% / Grey 80% * (ms) | 42 ? | 55 ? -31% | 22 ? 48% | 36 ? 14% | 58.8 ? -40% | 28.4 ? 32% |
| Response Time Black / White * (ms) | 28 ? | 31 ? -11% | 23 ? 18% | 36 ? -29% | 36 ? -29% | 22.4 ? 20% |
| PWM Frequency (Hz) | 21550 ? | |||||
| Screen | -29% | -14% | -84% | -48% | -46% | |
| Brightness middle (cd/m²) | 230 | 214 -7% | 281 22% | 246 7% | 239 4% | 209.5 -9% |
| Brightness (cd/m²) | 228 | 203 -11% | 257 13% | 235 3% | 244 7% | 205 -10% |
| Brightness Distribution (%) | 88 | 79 -10% | 85 -3% | 75 -15% | 88 0% | 92 5% |
| Black Level * (cd/m²) | 0.21 | 0.28 -33% | 0.32 -52% | 0.55 -162% | 0.35 -67% | 0.69 -229% |
| Contrast (:1) | 1095 | 764 -30% | 878 -20% | 447 -59% | 683 -38% | 304 -72% |
| Colorchecker dE 2000 * | 4.01 | 6.04 -51% | 5.16 -29% | 10.97 -174% | 7.3 -82% | 4.7 -17% |
| Colorchecker dE 2000 max. * | 7.26 | 12 -65% | 9.09 -25% | 24.7 -240% | 19.7 -171% | |
| Greyscale dE 2000 * | 3.18 | 5.91 -86% | 4.57 -44% | 14.25 -348% | 4.9 -54% | 1.8 43% |
| Gamma | 2.52 87% | 2.44 90% | 2.59 85% | 1.83 120% | 2.19 100% | 2.23 99% |
| CCT | 6814 95% | 7362 88% | 6931 94% | 11200 58% | 7332 89% | 6975 93% |
| Color Space (Percent of AdobeRGB 1998) (%) | 37 | 38 3% | 37 0% | 35 -5% | 35 -5% | 36.2 -2% |
| Color Space (Percent of sRGB) (%) | 58 | 60 3% | 58 0% | 55 -5% | 55 -5% | 56.6 -2% |
| Media totale (Programma / Settaggio) | -7% /
-9% | 7% /
-5% | -33% /
-56% | -42% /
-46% | -7% /
-28% |
* ... Meglio usare valori piccoli
Tempi di risposta del Display
| ↔ Tempi di risposta dal Nero al Bianco | ||
|---|---|---|
| 28 ms ... aumenta ↗ e diminuisce ↘ combinato | ↗ 16.4 ms Incremento | 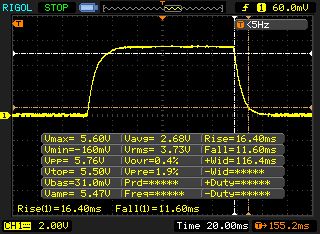 |
| ↘ 11.6 ms Calo | ||
| Lo schermo mostra tempi di risposta relativamente lenti nei nostri tests e potrebbe essere troppo lento per i gamers. In confronto, tutti i dispositivi di test variano da 0.1 (minimo) a 240 (massimo) ms. » 71 % di tutti i dispositivi è migliore. Questo significa che i tempi di risposta rilevati sono peggiori rispetto alla media di tutti i dispositivi testati (19.8 ms). | ||
| ↔ Tempo di risposta dal 50% Grigio all'80% Grigio | ||
| 42 ms ... aumenta ↗ e diminuisce ↘ combinato | ↗ 20.4 ms Incremento | 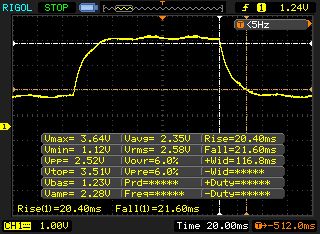 |
| ↘ 21.6 ms Calo | ||
| Lo schermo mostra tempi di risposta lenti nei nostri tests e sarà insoddisfacente per i gamers. In confronto, tutti i dispositivi di test variano da 0.165 (minimo) a 636 (massimo) ms. » 67 % di tutti i dispositivi è migliore. Questo significa che i tempi di risposta rilevati sono peggiori rispetto alla media di tutti i dispositivi testati (31 ms). | ||
Sfarfallio dello schermo / PWM (Pulse-Width Modulation)
| flickering dello schermo / PWM non rilevato | 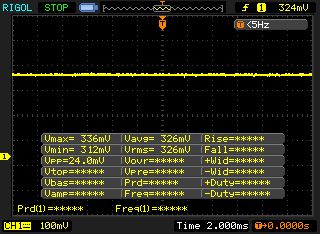 | ||
In confronto: 52 % di tutti i dispositivi testati non utilizza PWM per ridurre la luminosita' del display. Se è rilevato PWM, una media di 7757 (minimo: 5 - massimo: 343500) Hz è stata rilevata. | |||
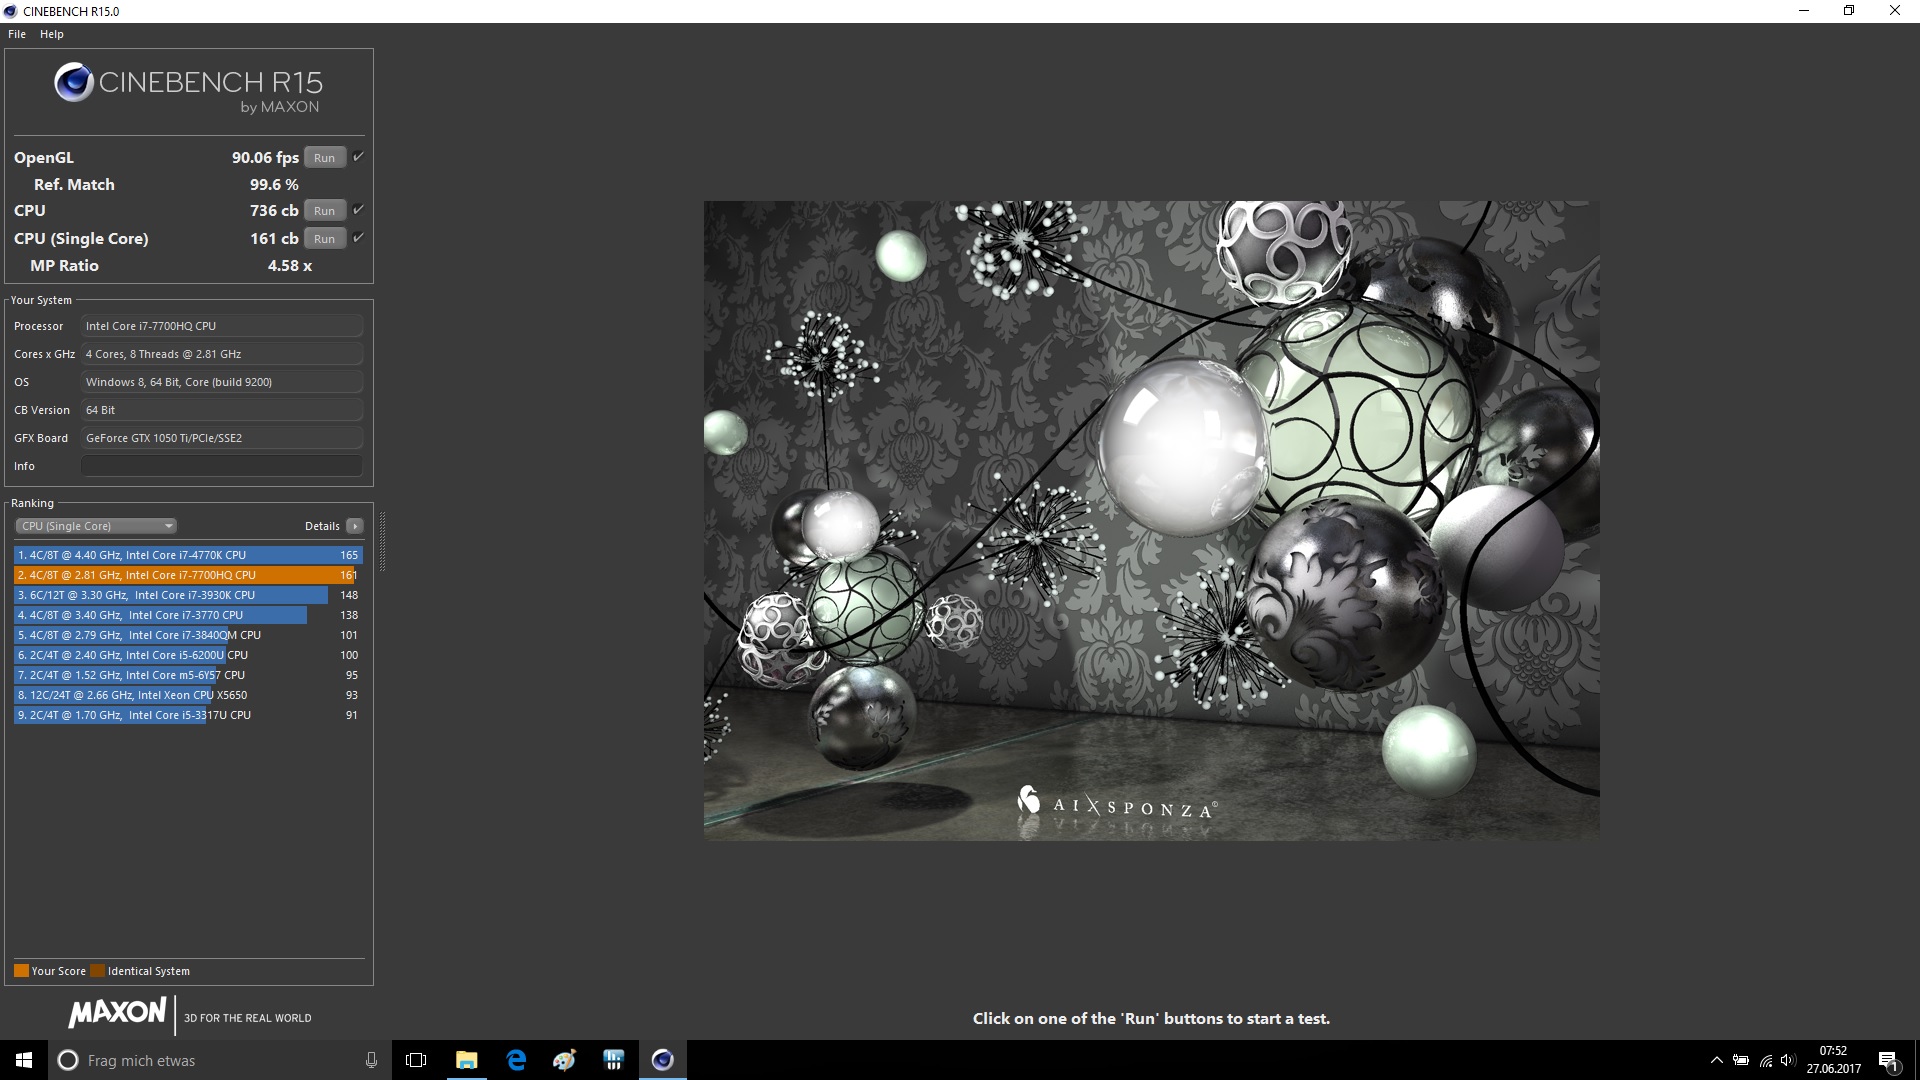
| Cinebench R15 | |
| CPU Single 64Bit | |
| MSI GS63VR 7RF-228US | |
| HP Omen 15-ax213ng | |
| Dell Inspiron 15 7000 7567 | |
| Lenovo Legion Y520-15IKBN-80WK001KUS | |
| Acer Aspire VX5-591G-75C4 VX15 | |
| HP Omen 15-ax007ng | |
| Asus FX502VM-AS73 | |
| CPU Multi 64Bit | |
| MSI GS63VR 7RF-228US | |
| HP Omen 15-ax213ng | |
| Asus FX502VM-AS73 | |
| Dell Inspiron 15 7000 7567 | |
| Acer Aspire VX5-591G-75C4 VX15 | |
| HP Omen 15-ax007ng | |
| Lenovo Legion Y520-15IKBN-80WK001KUS | |
| Cinebench R11.5 | |
| CPU Single 64Bit | |
| HP Omen 15-ax213ng | |
| MSI GS63VR 7RF-228US | |
| Lenovo Legion Y520-15IKBN-80WK001KUS | |
| HP Omen 15-ax007ng | |
| Asus FX502VM-AS73 | |
| CPU Multi 64Bit | |
| MSI GS63VR 7RF-228US | |
| HP Omen 15-ax213ng | |
| Asus FX502VM-AS73 | |
| HP Omen 15-ax007ng | |
| Lenovo Legion Y520-15IKBN-80WK001KUS | |
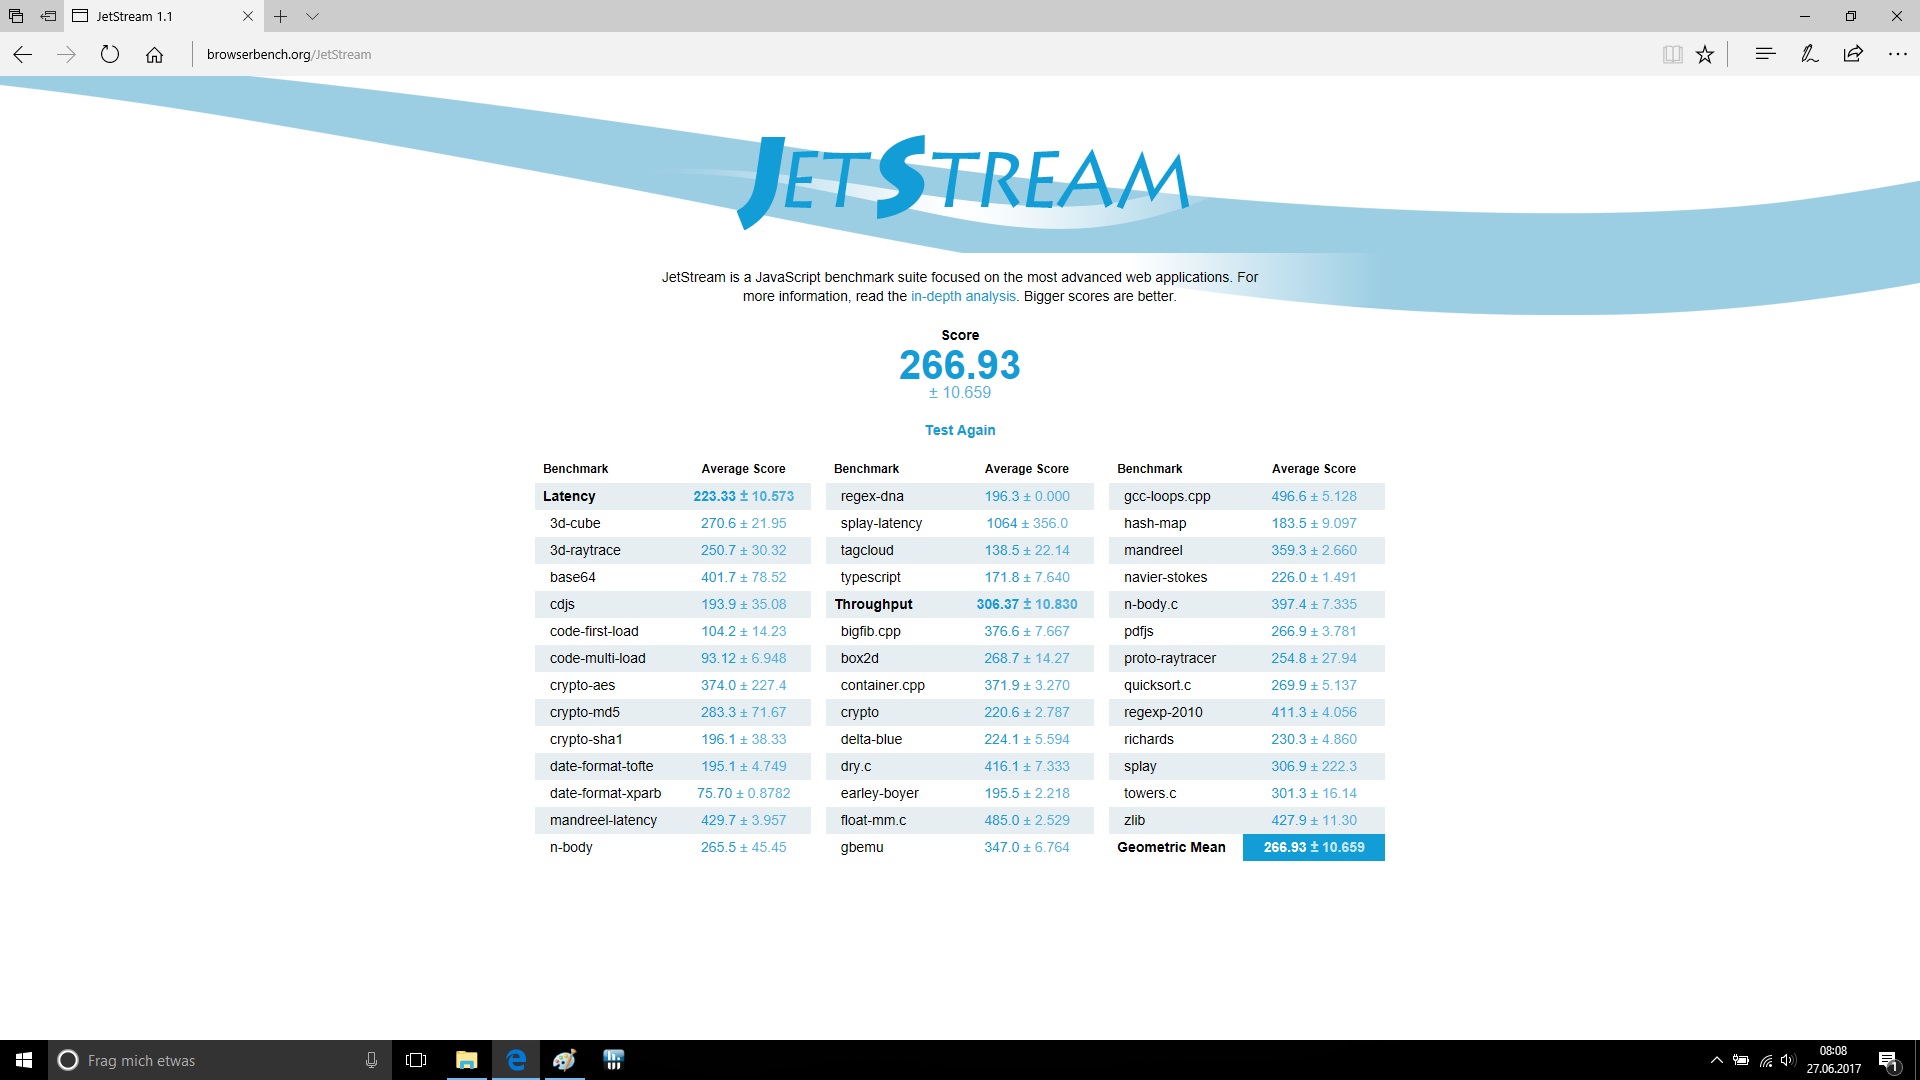
| JetStream 1.1 - 1.1 Total | |
| HP Omen 15-ax213ng | |
| Lenovo Legion Y520-15IKBN-80WK001KUS | |
| Dell Inspiron 15 7000 7567 | |
| MSI GS63VR 7RF-228US | |
| Asus FX502VM-AS73 | |
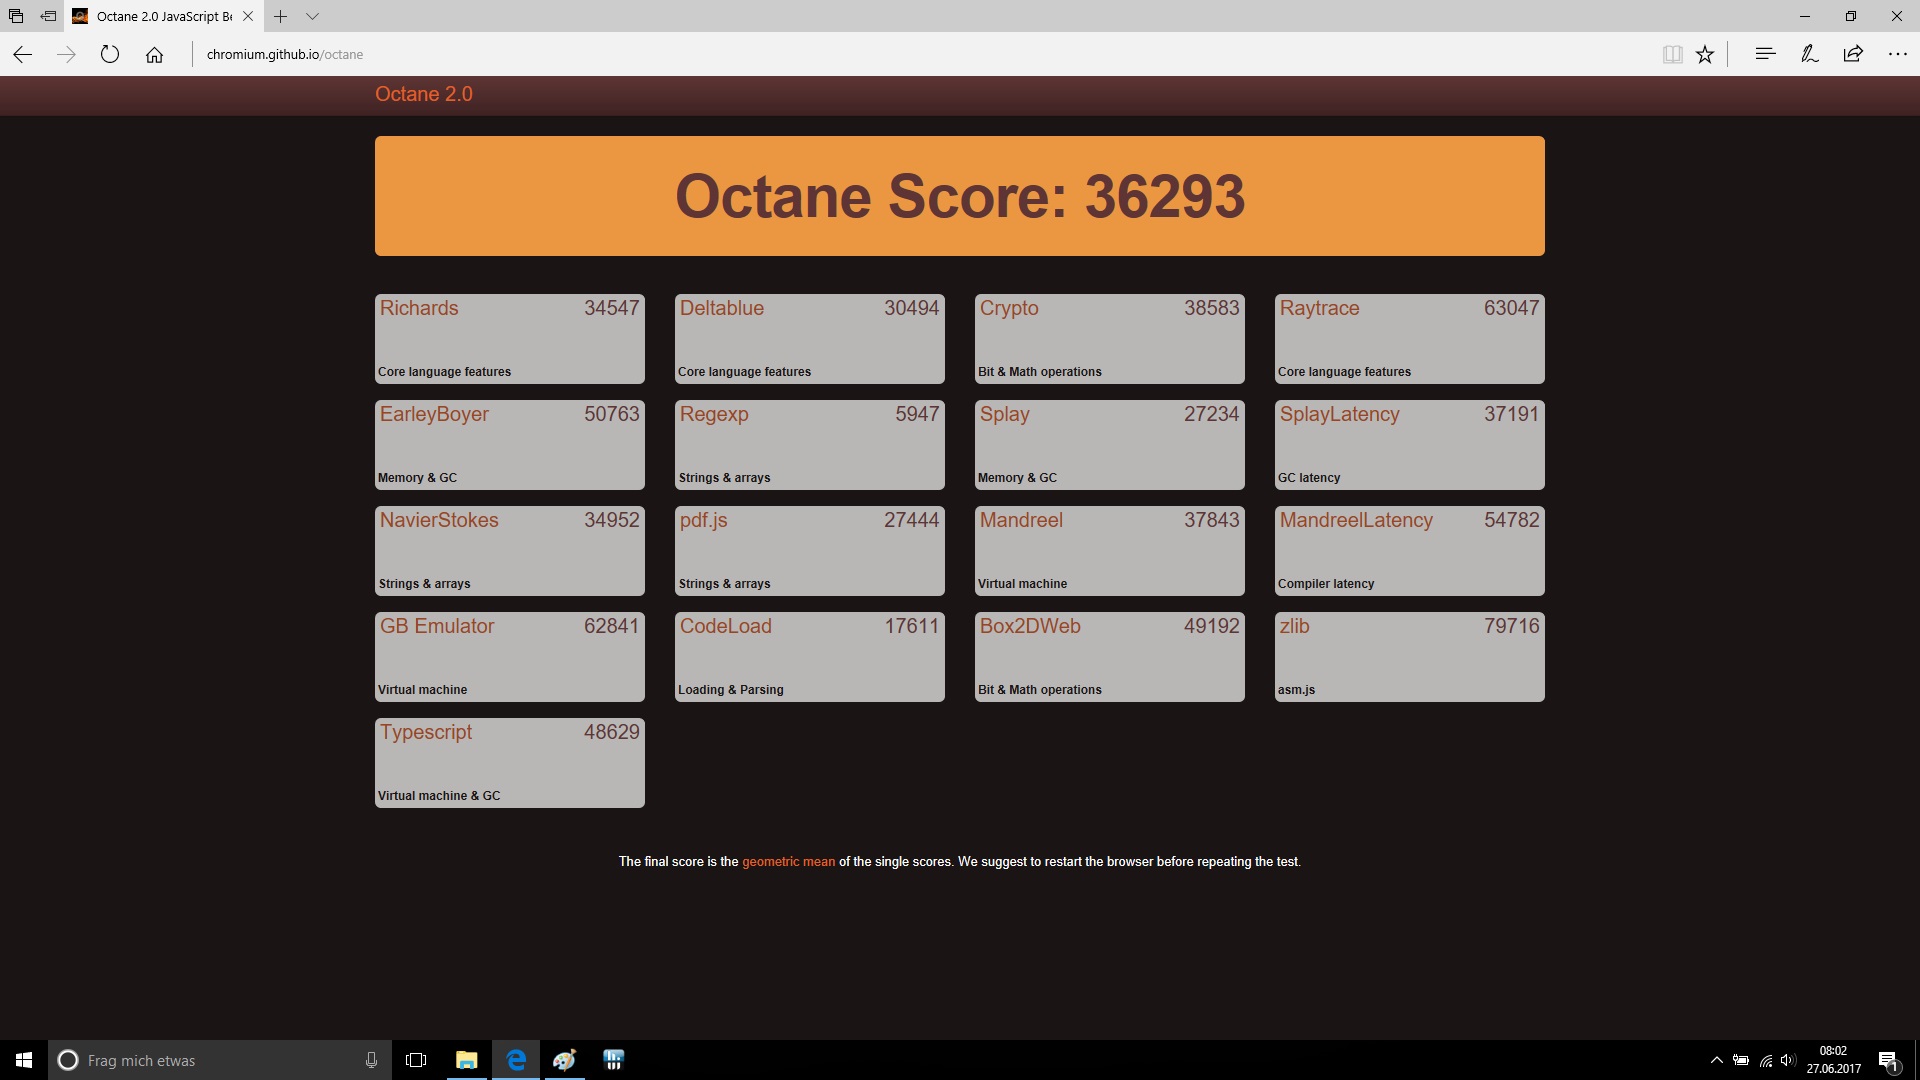
| Octane V2 - Total Score | |
| Dell Inspiron 15 7000 7567 | |
| Asus FX502VM-AS73 | |
| HP Omen 15-ax213ng | |
| Lenovo Legion Y520-15IKBN-80WK001KUS | |
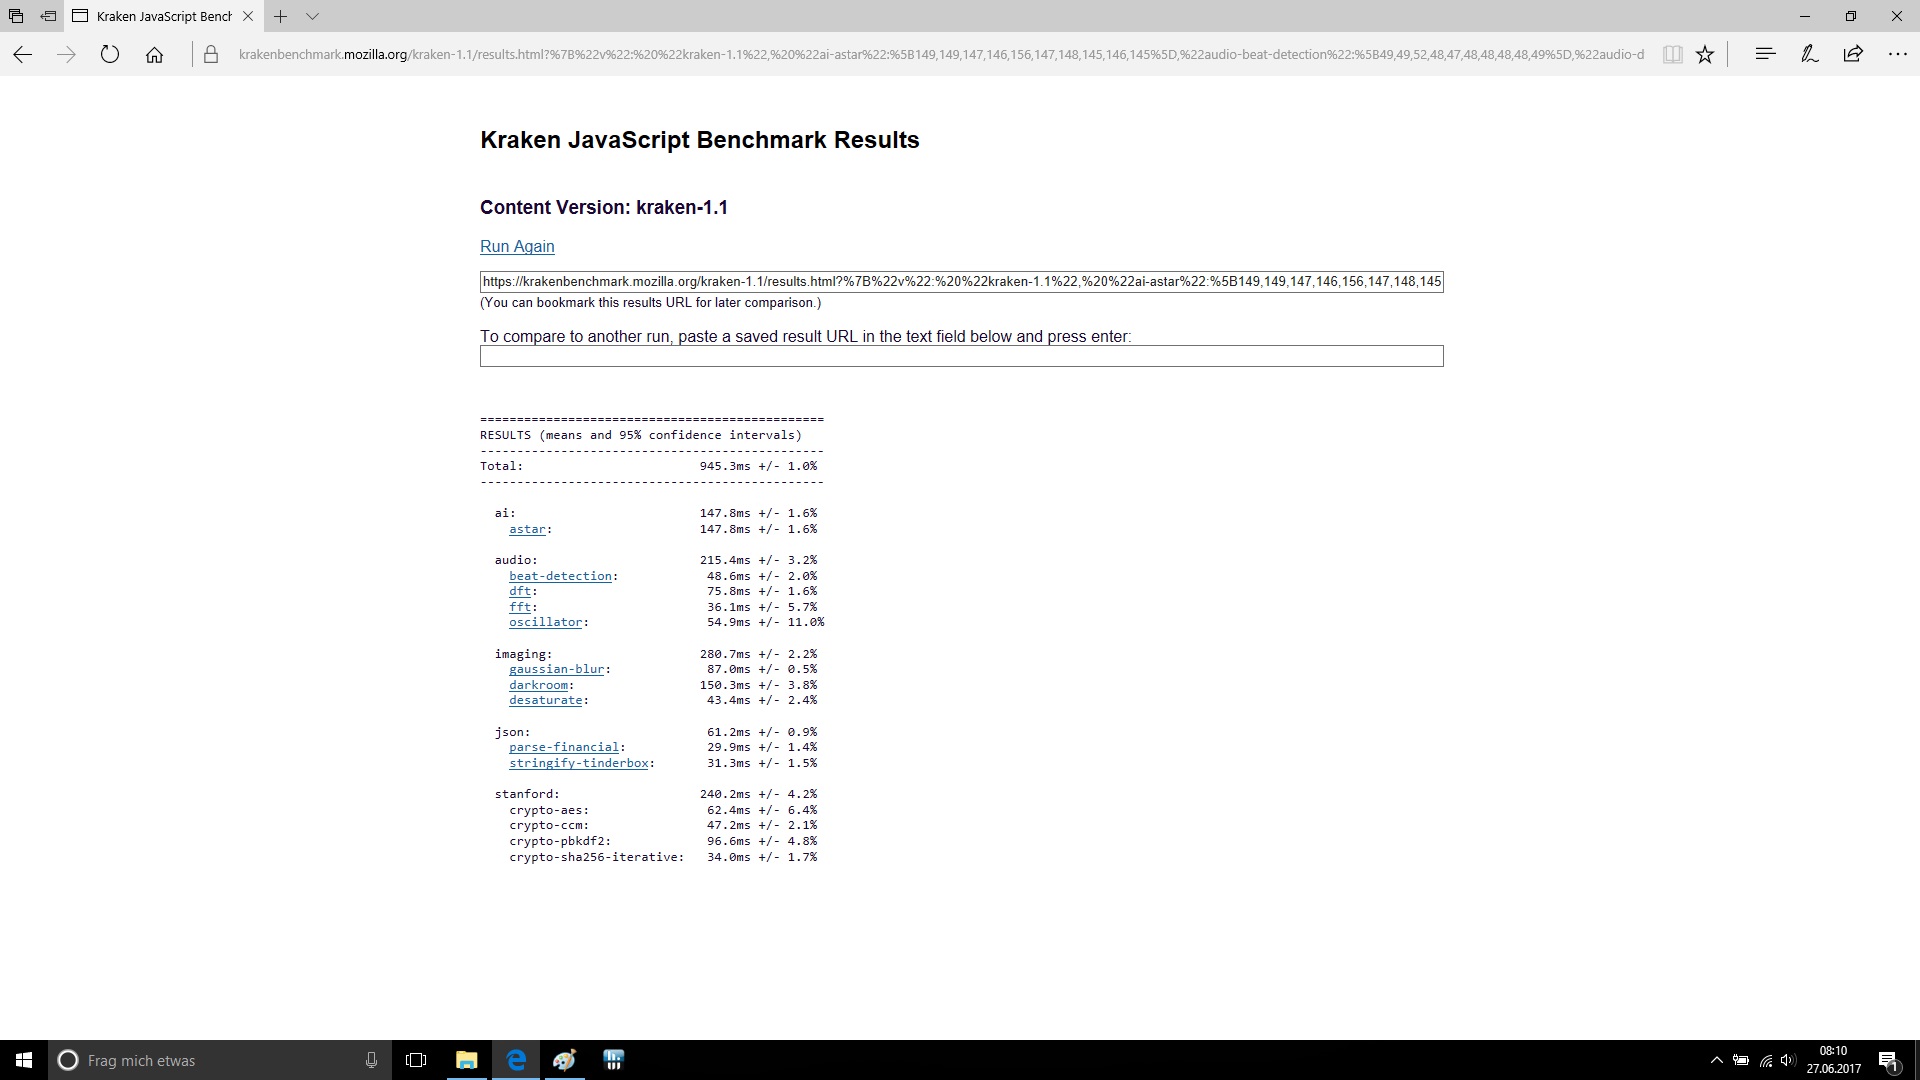
| Mozilla Kraken 1.1 - Total | |
| Acer Aspire VX5-591G-75C4 VX15 | |
| MSI GS63VR 7RF-228US | |
| Dell Inspiron 15 7000 7567 | |
| Lenovo Legion Y520-15IKBN-80WK001KUS | |
| HP Omen 15-ax213ng | |
* ... Meglio usare valori piccoli
| PCMark 8 | |
| Home Score Accelerated v2 | |
| Asus FX502VM-AS73 | |
| HP Omen 15-ax213ng | |
| MSI GS63VR 7RF-228US | |
| HP Omen 15-ax007ng | |
| Dell Inspiron 15 7000 7567 | |
| Acer Aspire VX5-591G-75C4 VX15 | |
| Work Score Accelerated v2 | |
| MSI GS63VR 7RF-228US | |
| Dell Inspiron 15 7000 7567 | |
| HP Omen 15-ax007ng | |
| Acer Aspire VX5-591G-75C4 VX15 | |
| HP Omen 15-ax213ng | |
| Asus FX502VM-AS73 | |
| Creative Score Accelerated v2 | |
| Asus FX502VM-AS73 | |
| HP Omen 15-ax213ng | |
| MSI GS63VR 7RF-228US | |
| HP Omen 15-ax007ng | |
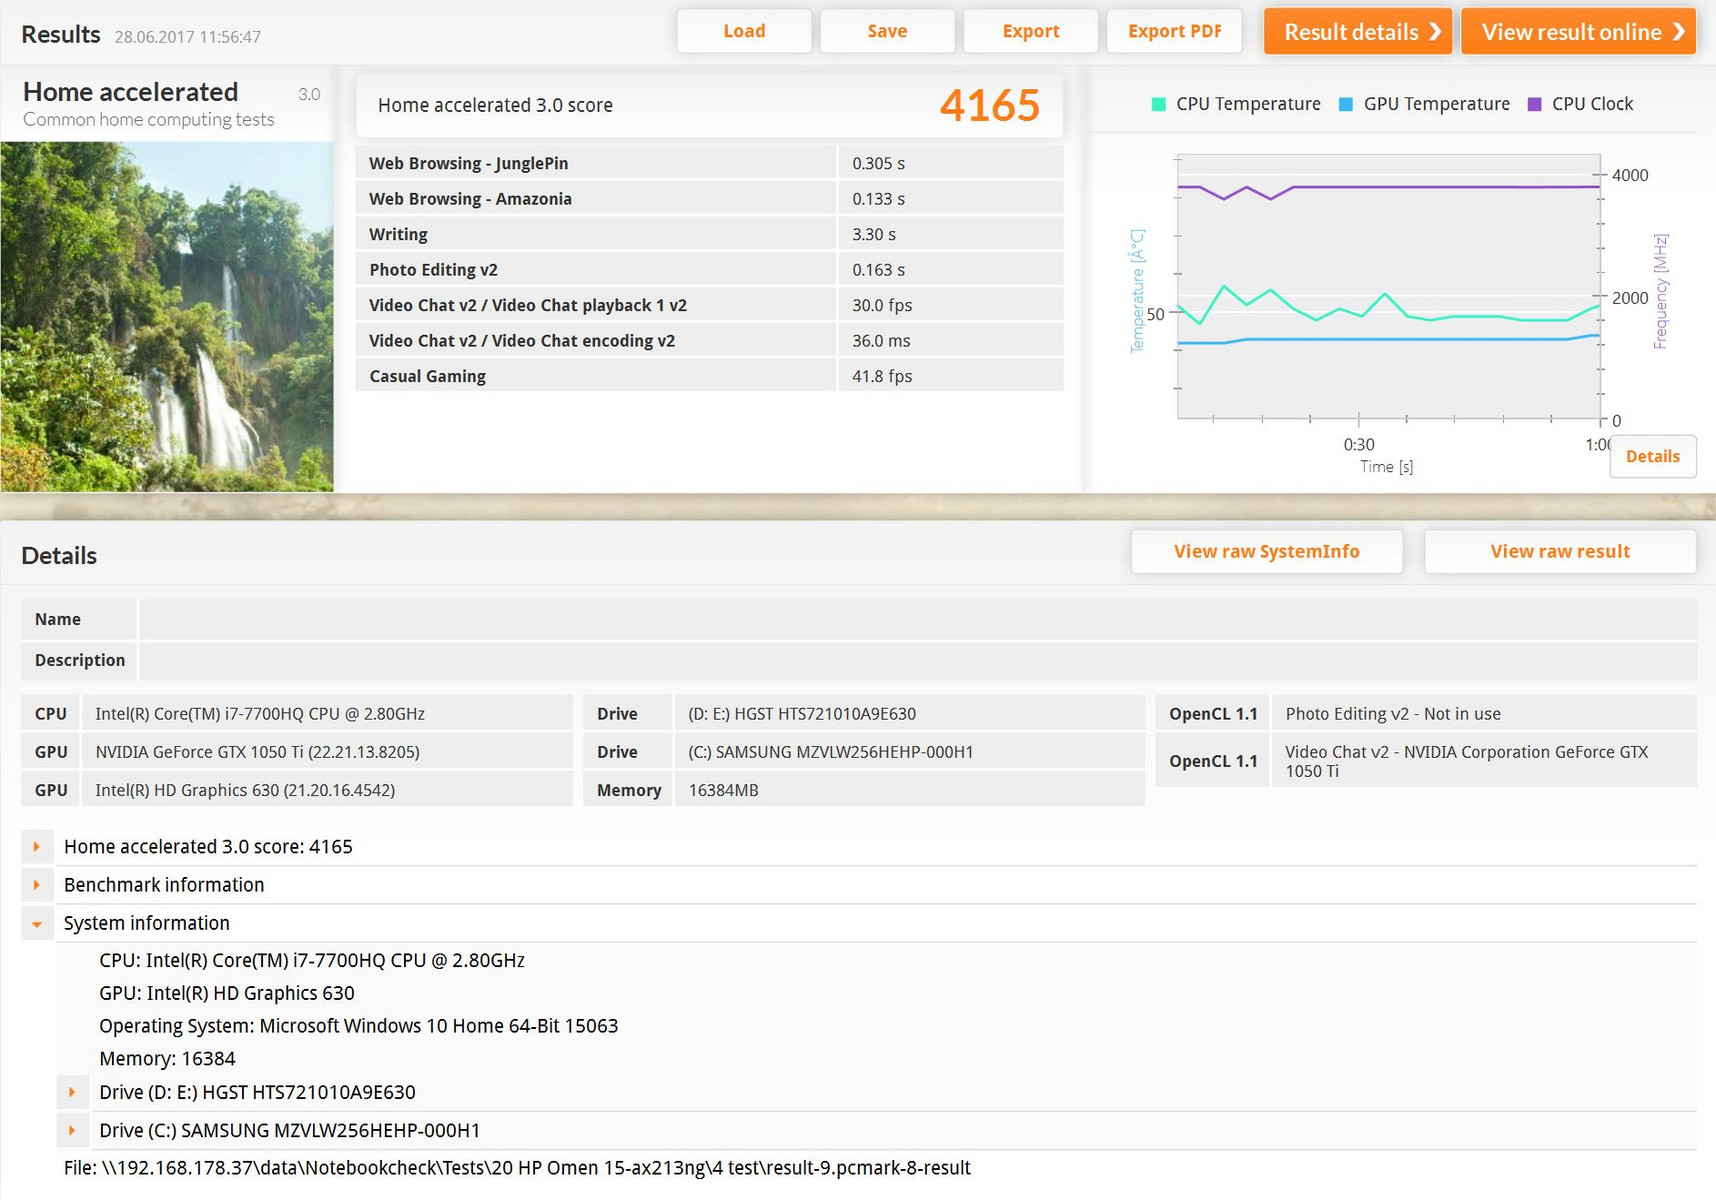
| PCMark 8 Home Score Accelerated v2 | 4165 punti | |
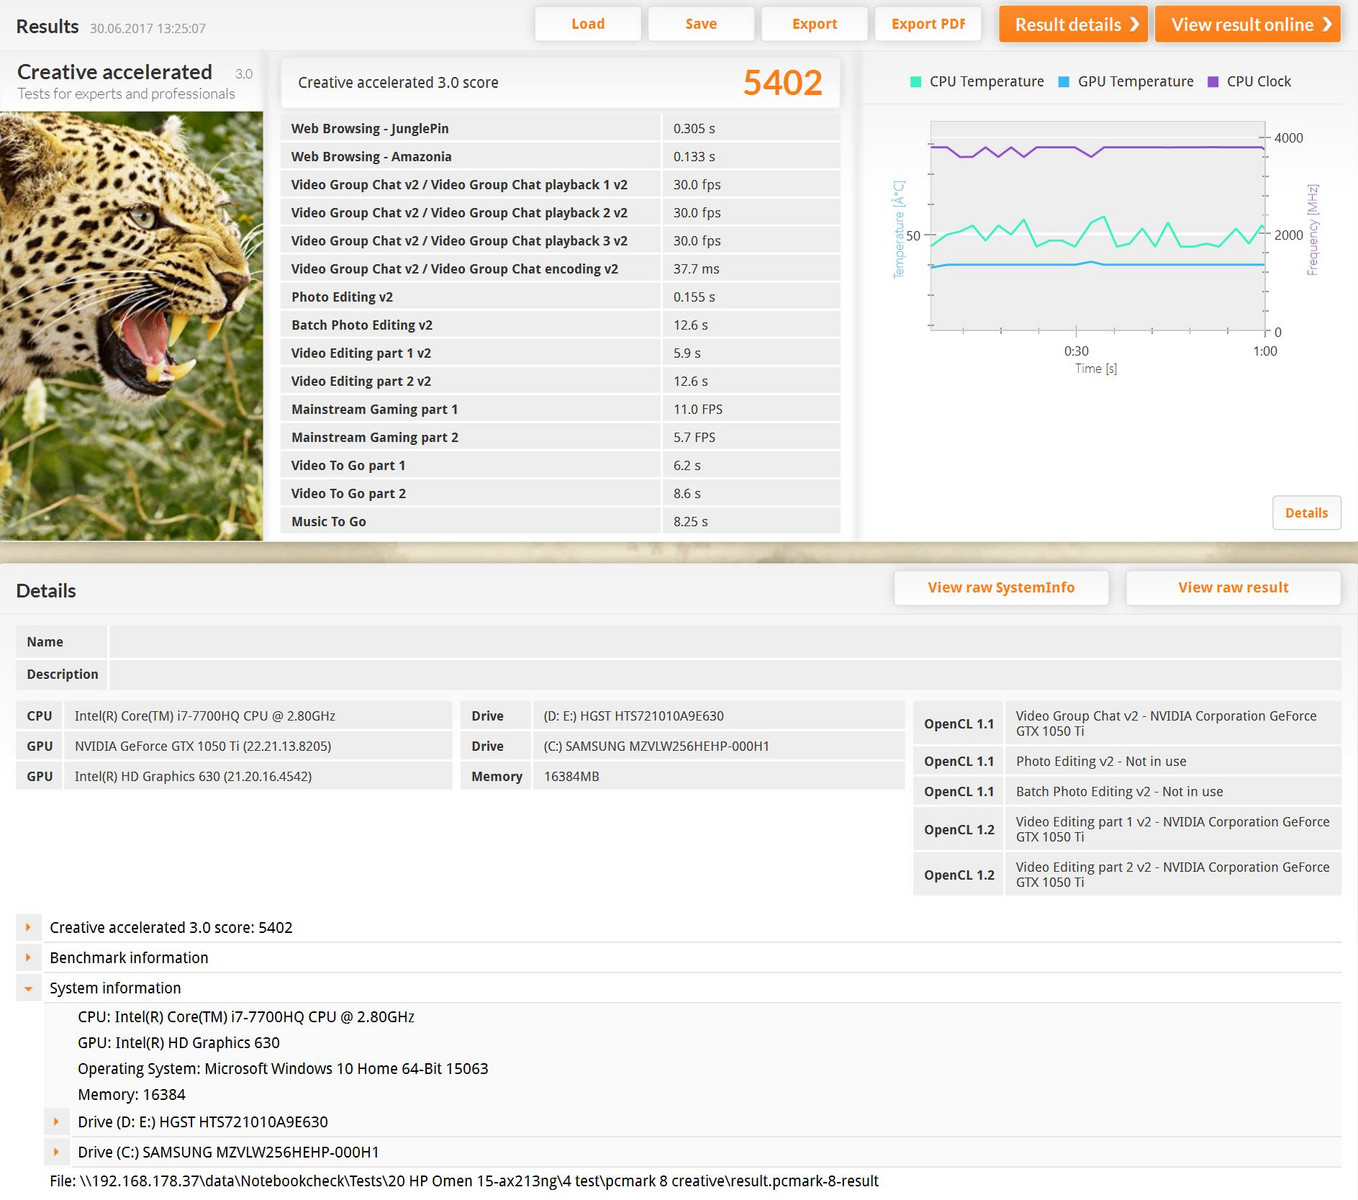
| PCMark 8 Creative Score Accelerated v2 | 5402 punti | |
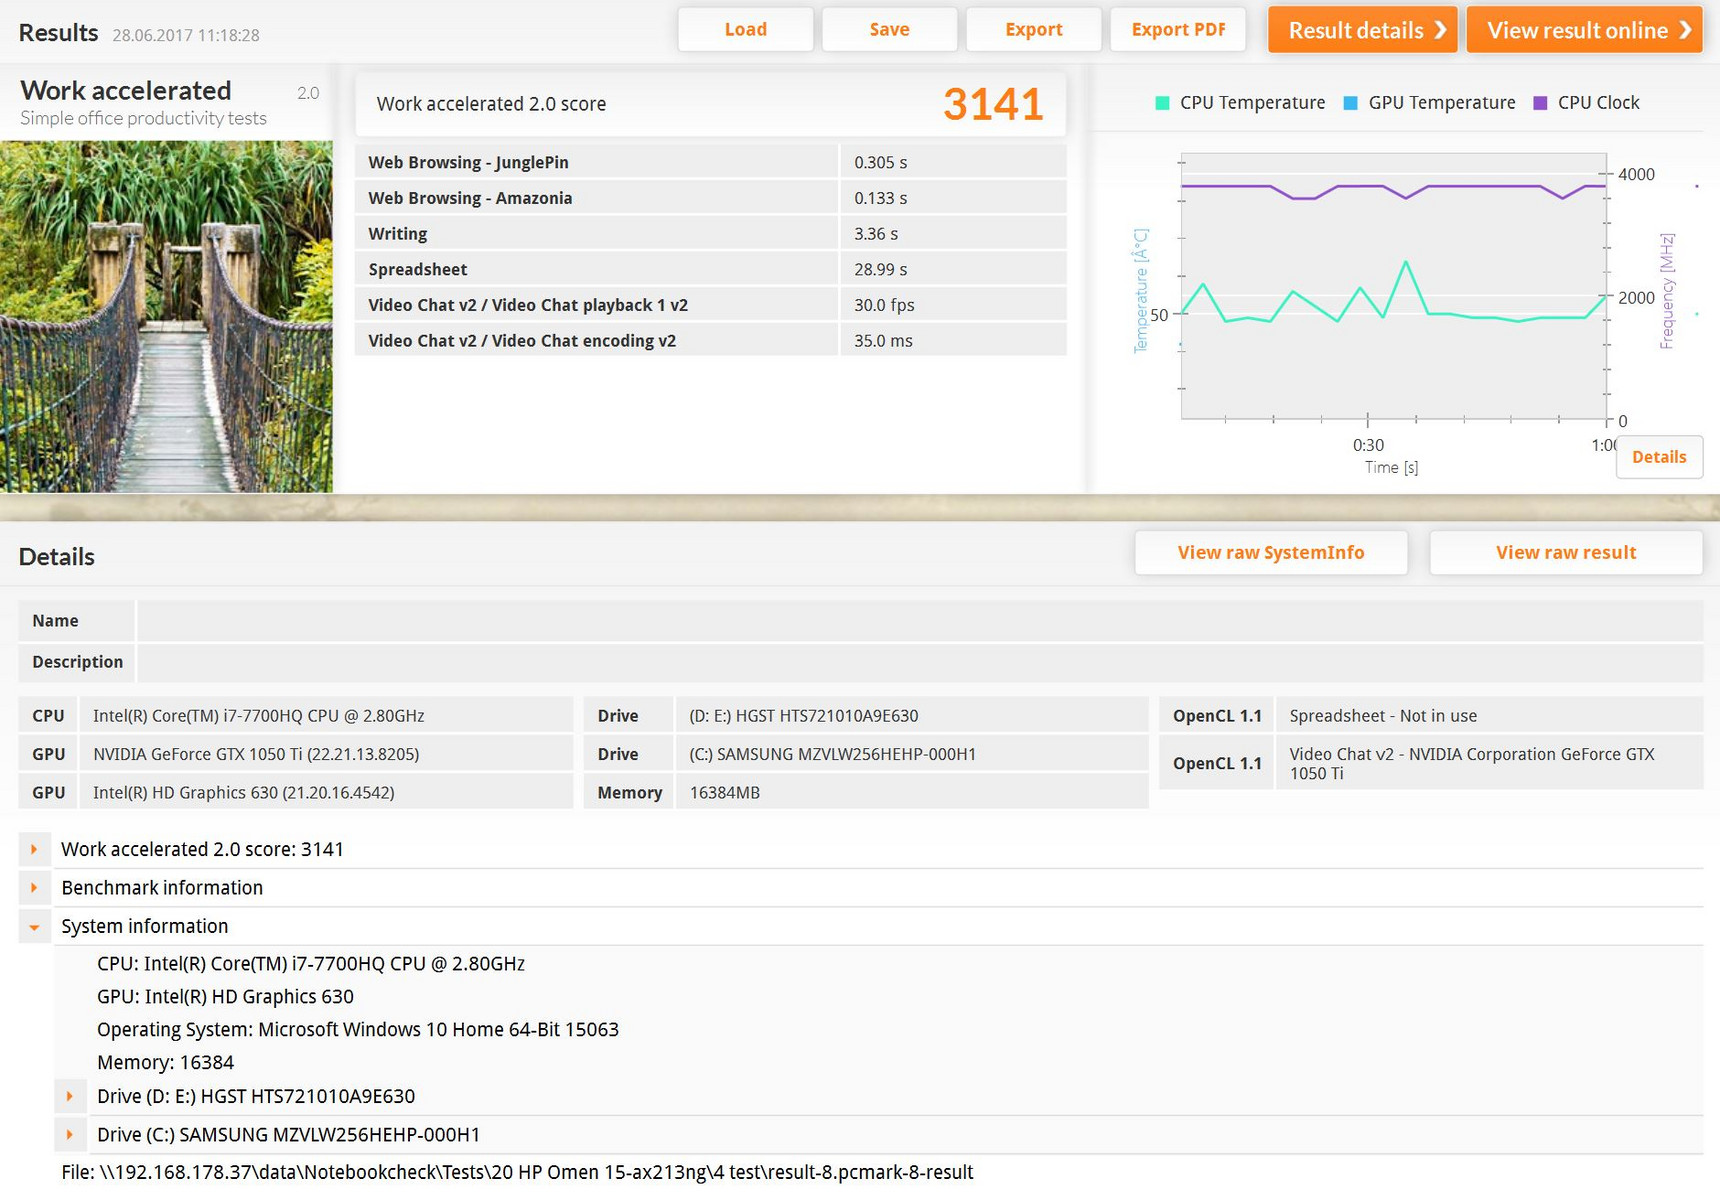
| PCMark 8 Work Score Accelerated v2 | 3141 punti | |
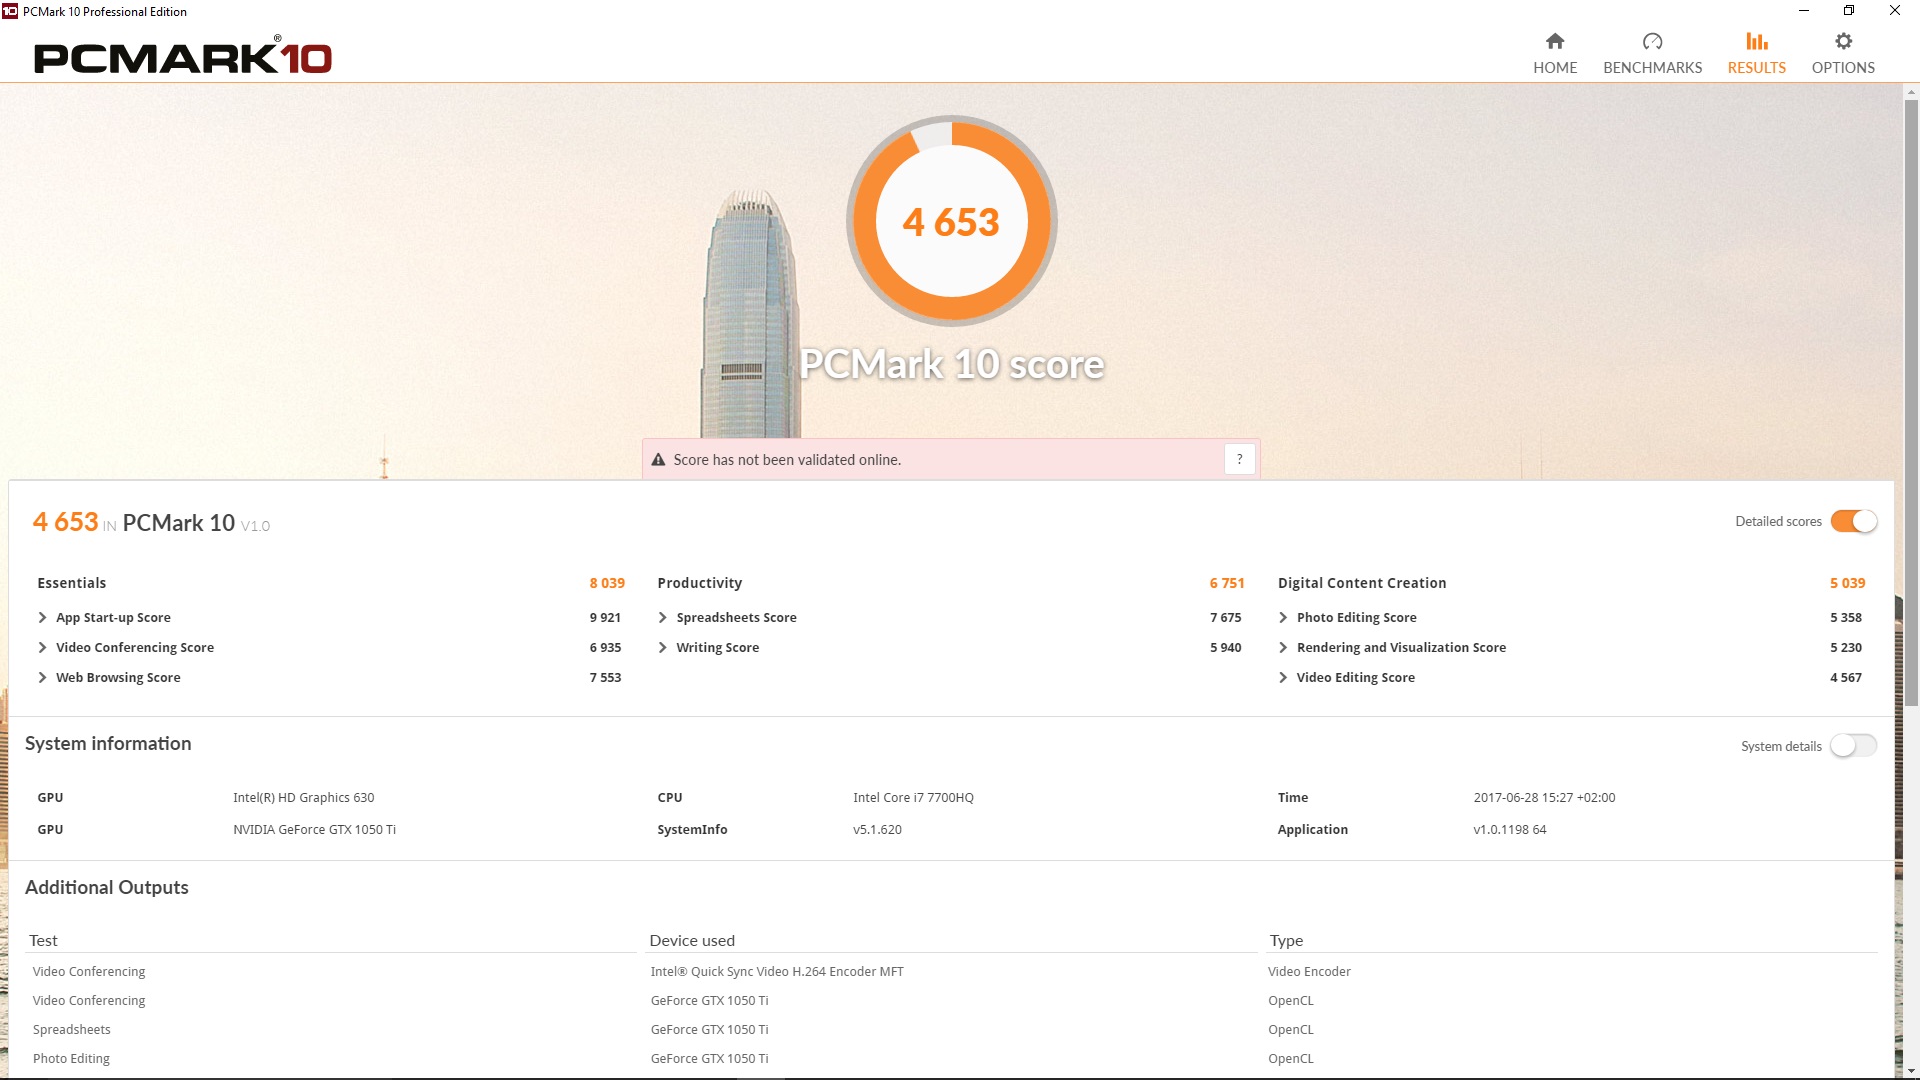
| PCMark 10 Score | 4653 punti | |
Aiuto | ||
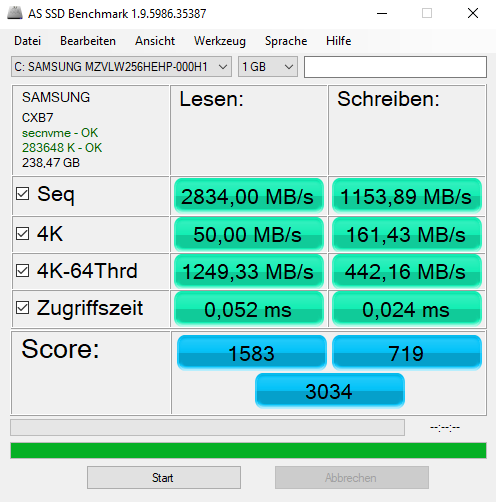
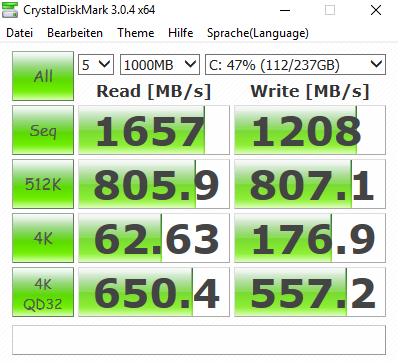
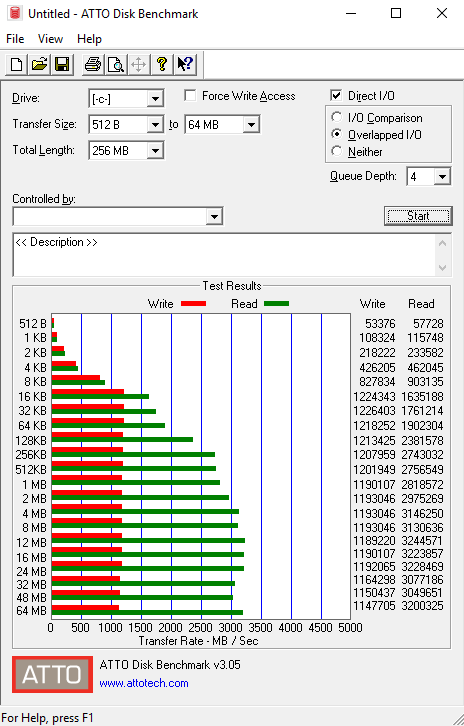
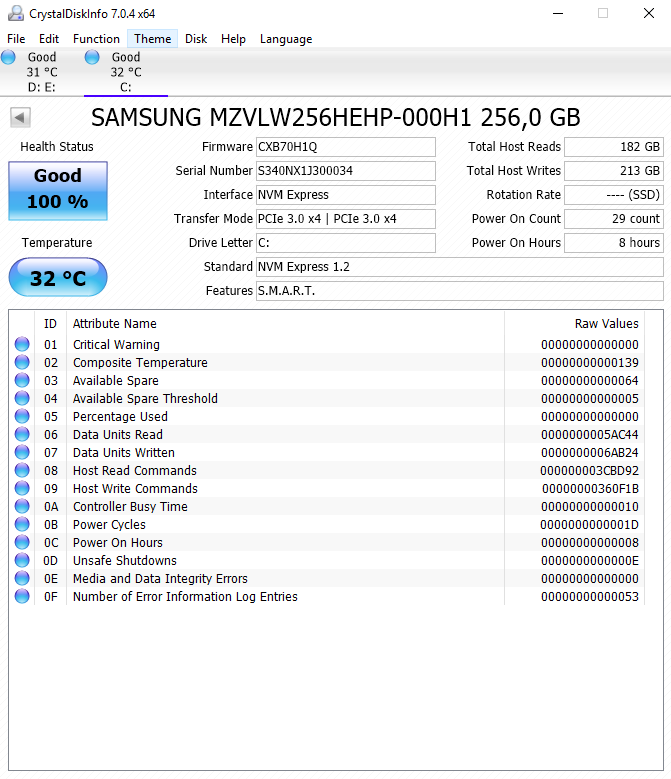
| HP Omen 15-ax213ng Samsung PM961 MZVLW256HEHP | HP Omen 15-ax007ng Adata IM2S3138E-128GM-B | Acer Aspire VX5-591G-75C4 VX15 Toshiba MQ01ABD100 | Dell Inspiron 15 7000 7567 Intel SSDSCKKF256H6 | Lenovo Legion Y520-15IKBN-80WK001KUS Samsung PM961 MZVLW256HEHP | Asus FX502VM-AS73 SK Hynix HFS256G39TND-N210A | MSI GS63VR 7RF-228US Samsung SM961 MZVKW512HMJP m.2 PCI-e | |
|---|---|---|---|---|---|---|---|
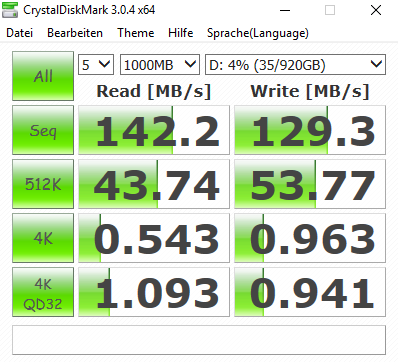
| CrystalDiskMark 3.0 | -65% | -97% | -60% | -6% | -67% | 10% | |
| Read Seq (MB/s) | 1657 | 475.7 -71% | 101.5 -94% | 485.8 -71% | 2170 31% | 503 -70% | 2141 29% |
| Write Seq (MB/s) | 1208 | 169.2 -86% | 100.6 -92% | 422.8 -65% | 1202 0% | 138.2 -89% | 1621 34% |
| Read 512 (MB/s) | 806 | 327.6 -59% | 28.33 -96% | 338.9 -58% | 786 -2% | 343.5 -57% | 499.7 -38% |
| Write 512 (MB/s) | 807 | 169.6 -79% | 28.31 -96% | 304 -62% | 822 2% | 137.8 -83% | 1531 90% |
| Read 4k (MB/s) | 62.6 | 33.14 -47% | 0.327 -99% | 27.11 -57% | 58.9 -6% | 29.36 -53% | 54.2 -13% |
| Write 4k (MB/s) | 176.9 | 81.4 -54% | 0.846 -100% | 85.4 -52% | 146.4 -17% | 70.9 -60% | 158.2 -11% |
| Read 4k QD32 (MB/s) | 650 | 276.8 -57% | 0.718 -100% | 279.6 -57% | 457.7 -30% | 369.9 -43% | 632 -3% |
| Write 4k QD32 (MB/s) | 557 | 168 -70% | 0.893 -100% | 255.1 -54% | 392.9 -29% | 99.7 -82% | 527 -5% |

| 3DMark | |
| 1280x720 Cloud Gate Standard Graphics | |
| Asus FX502VM-AS73 | |
| Lenovo Legion Y520-15IKBN-80WK001KUS | |
| Dell Inspiron 15 7000 7567 | |
| HP Omen 15-ax213ng | |
| Acer Aspire VX5-591G-75C4 VX15 | |
| HP Omen 15-ax007ng | |
| 1920x1080 Fire Strike Graphics | |
| Asus FX502VM-AS73 | |
| HP Omen 15-ax213ng | |
| Acer Aspire VX5-591G-75C4 VX15 | |
| Lenovo Legion Y520-15IKBN-80WK001KUS | |
| Dell Inspiron 15 7000 7567 | |
| HP Omen 15-ax007ng | |
| 3DMark 11 - 1280x720 Performance GPU | |
| Asus FX502VM-AS73 | |
| HP Omen 15-ax213ng | |
| Acer Aspire VX5-591G-75C4 VX15 | |
| Dell Inspiron 15 7000 7567 | |
| HP Omen 15-ax007ng | |
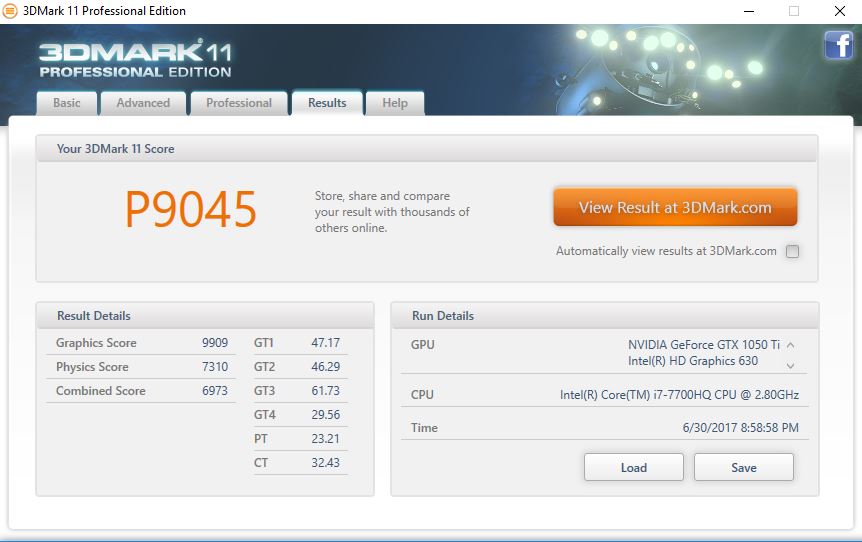
| 3DMark 11 Performance | 9045 punti | |
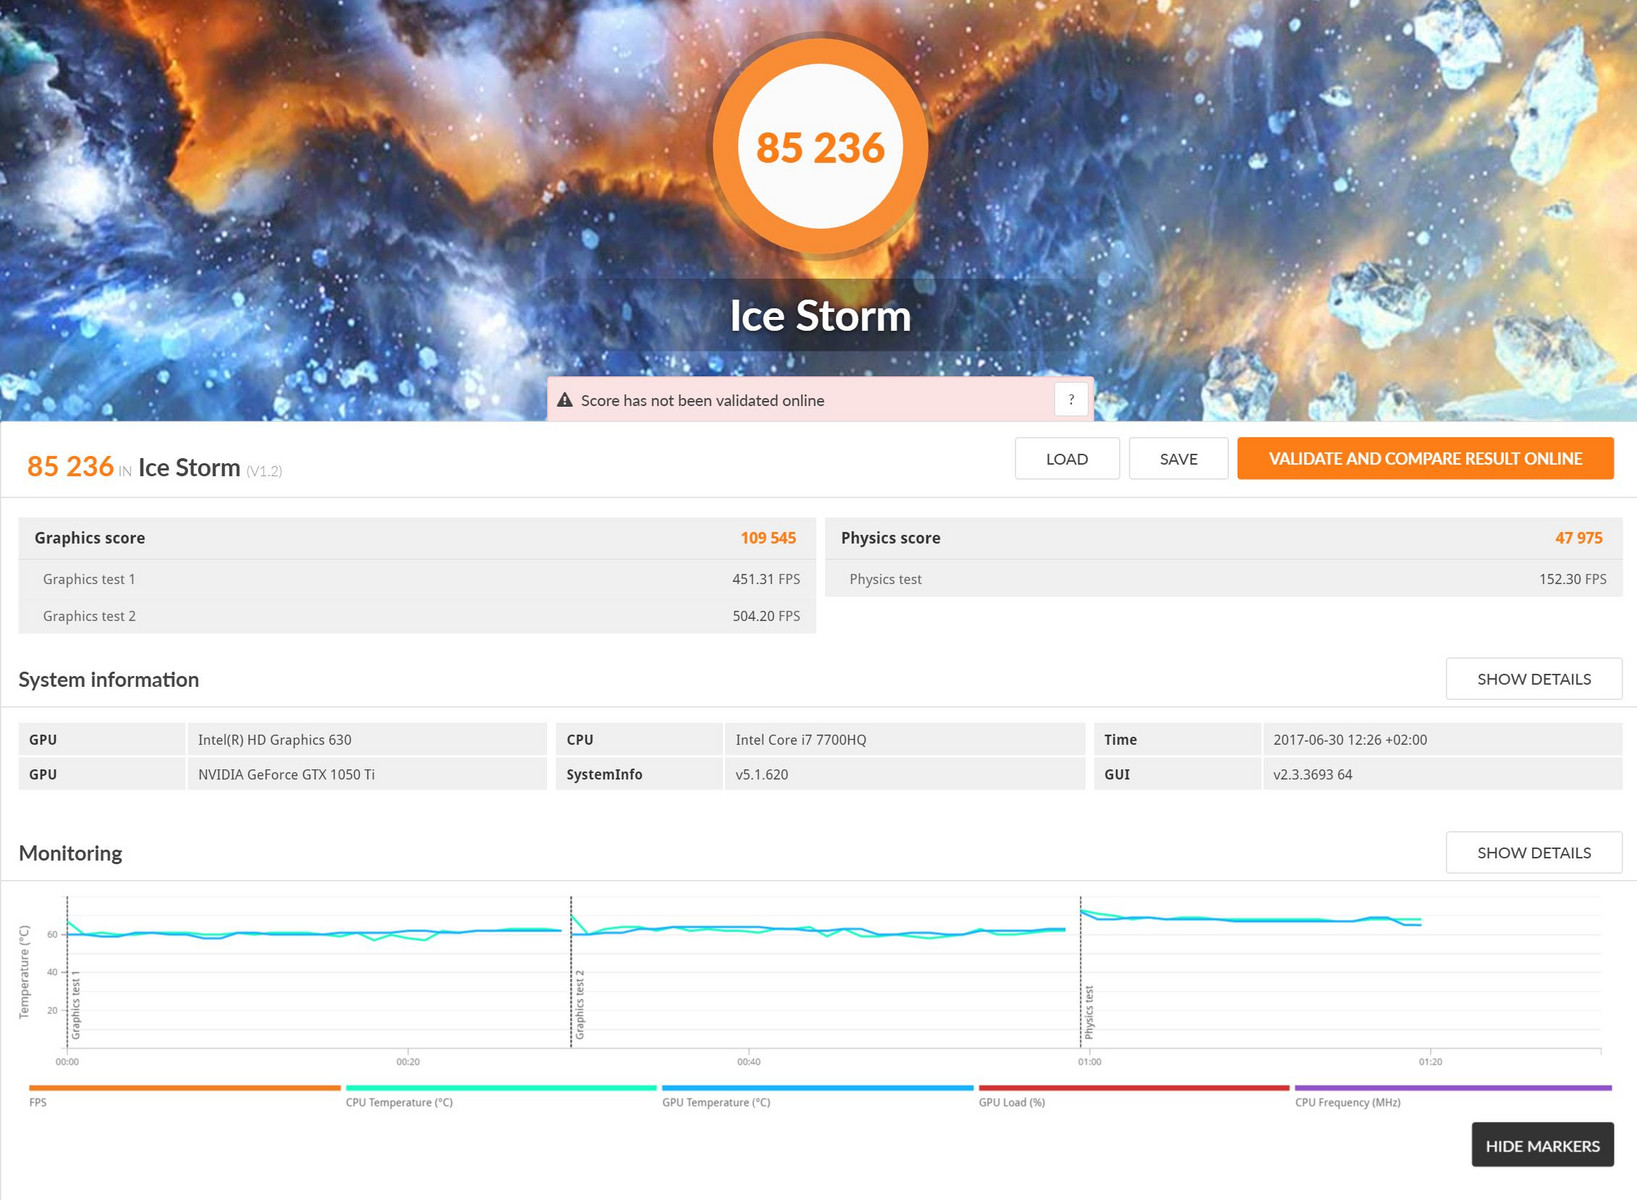
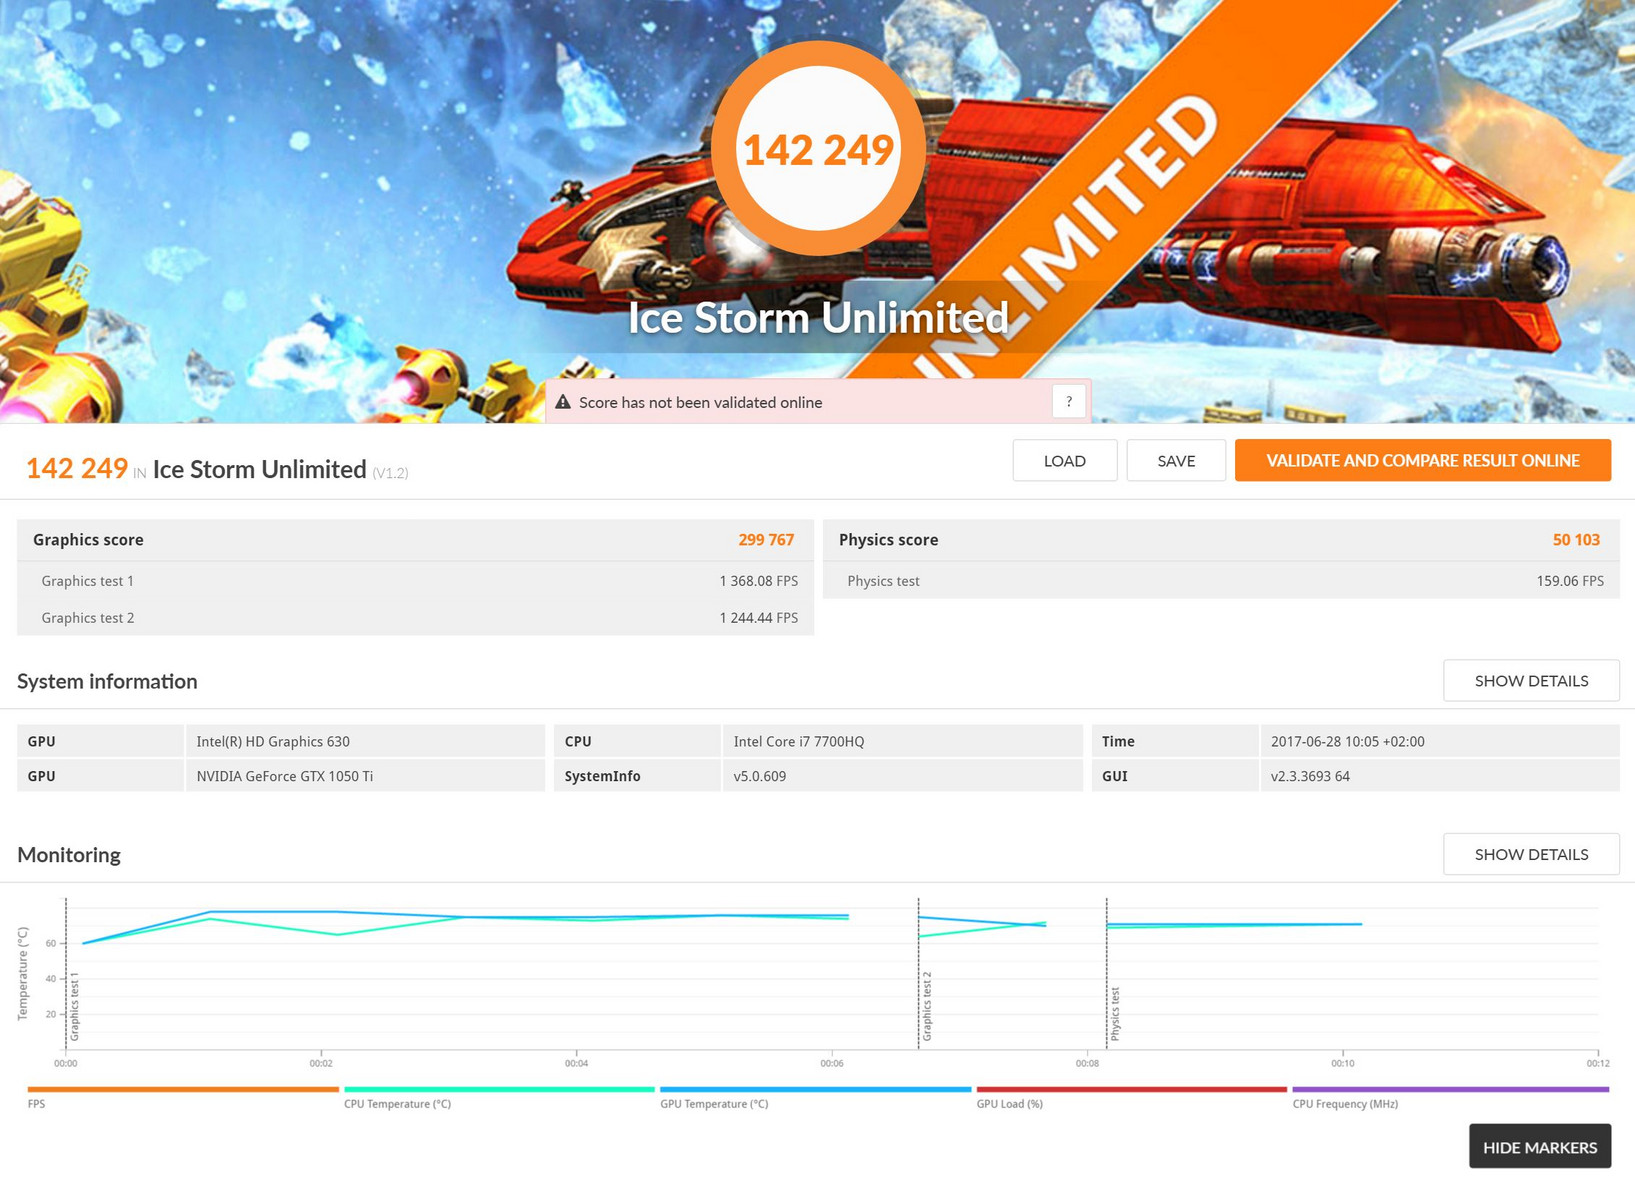
| 3DMark Ice Storm Standard Score | 85236 punti | |
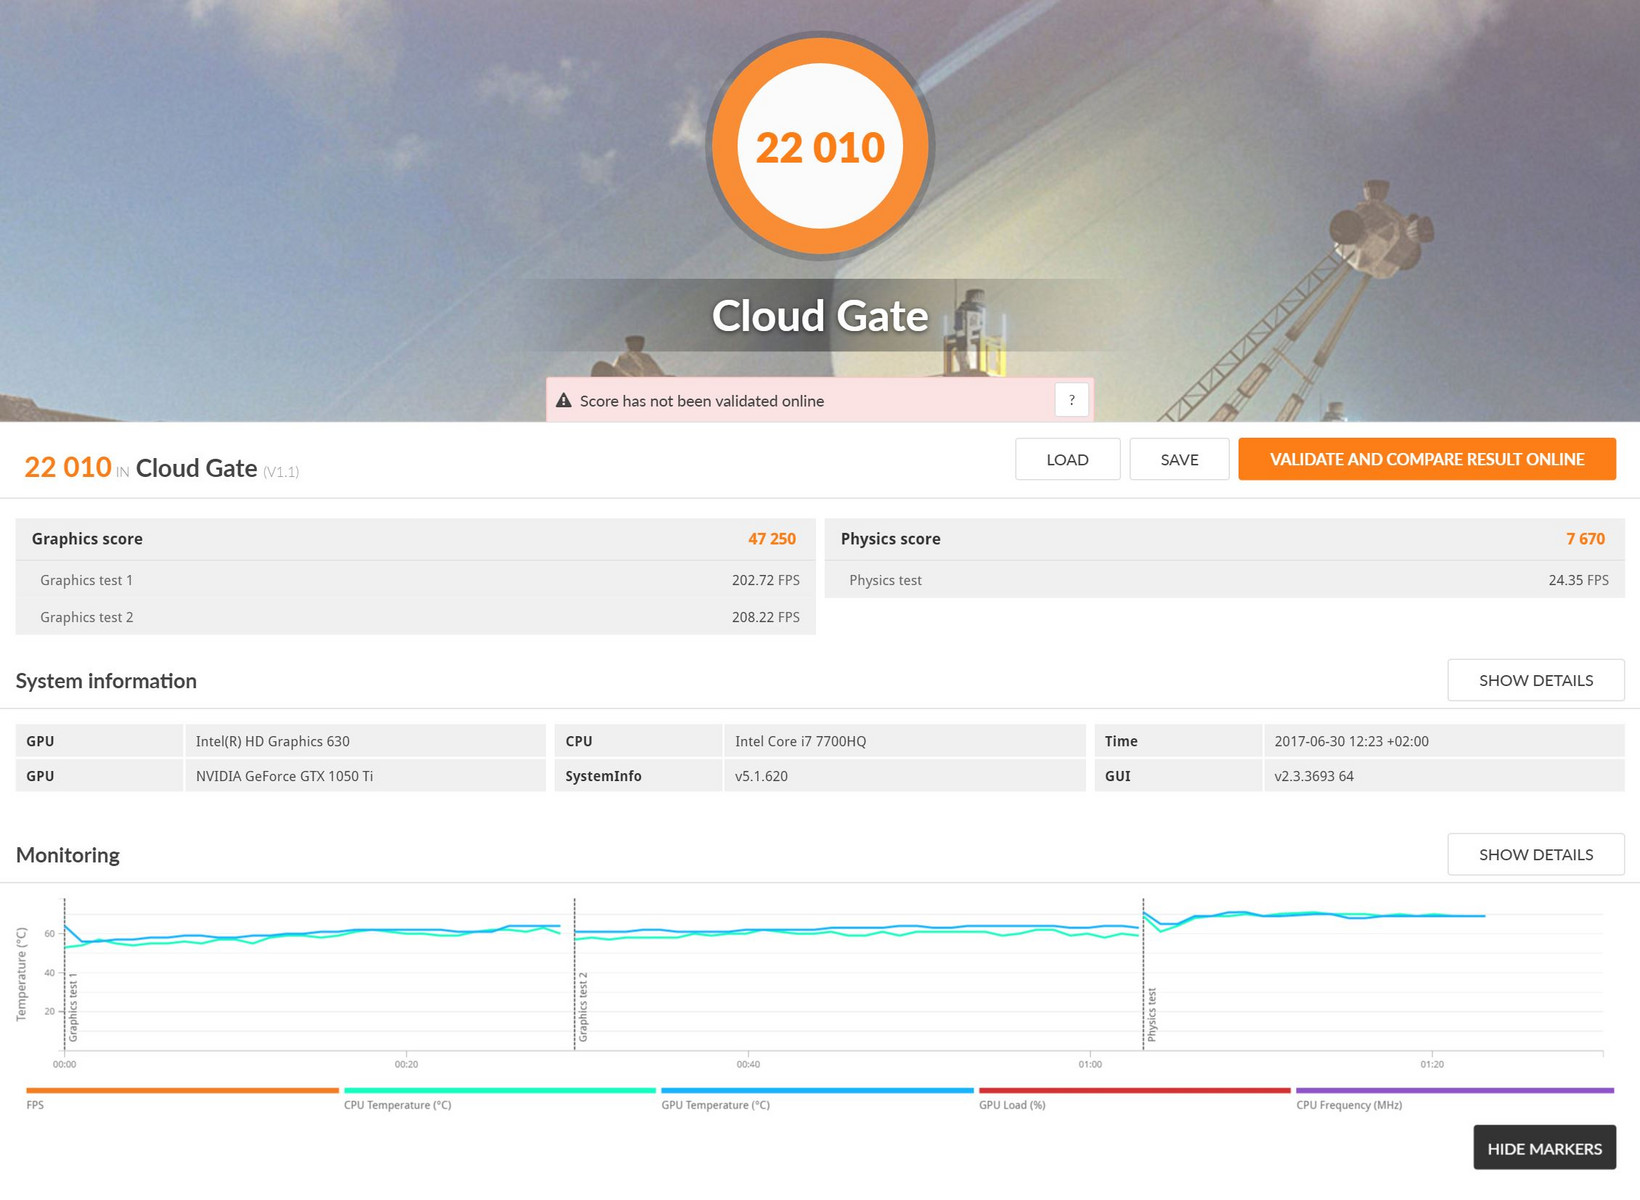
| 3DMark Cloud Gate Standard Score | 22010 punti | |
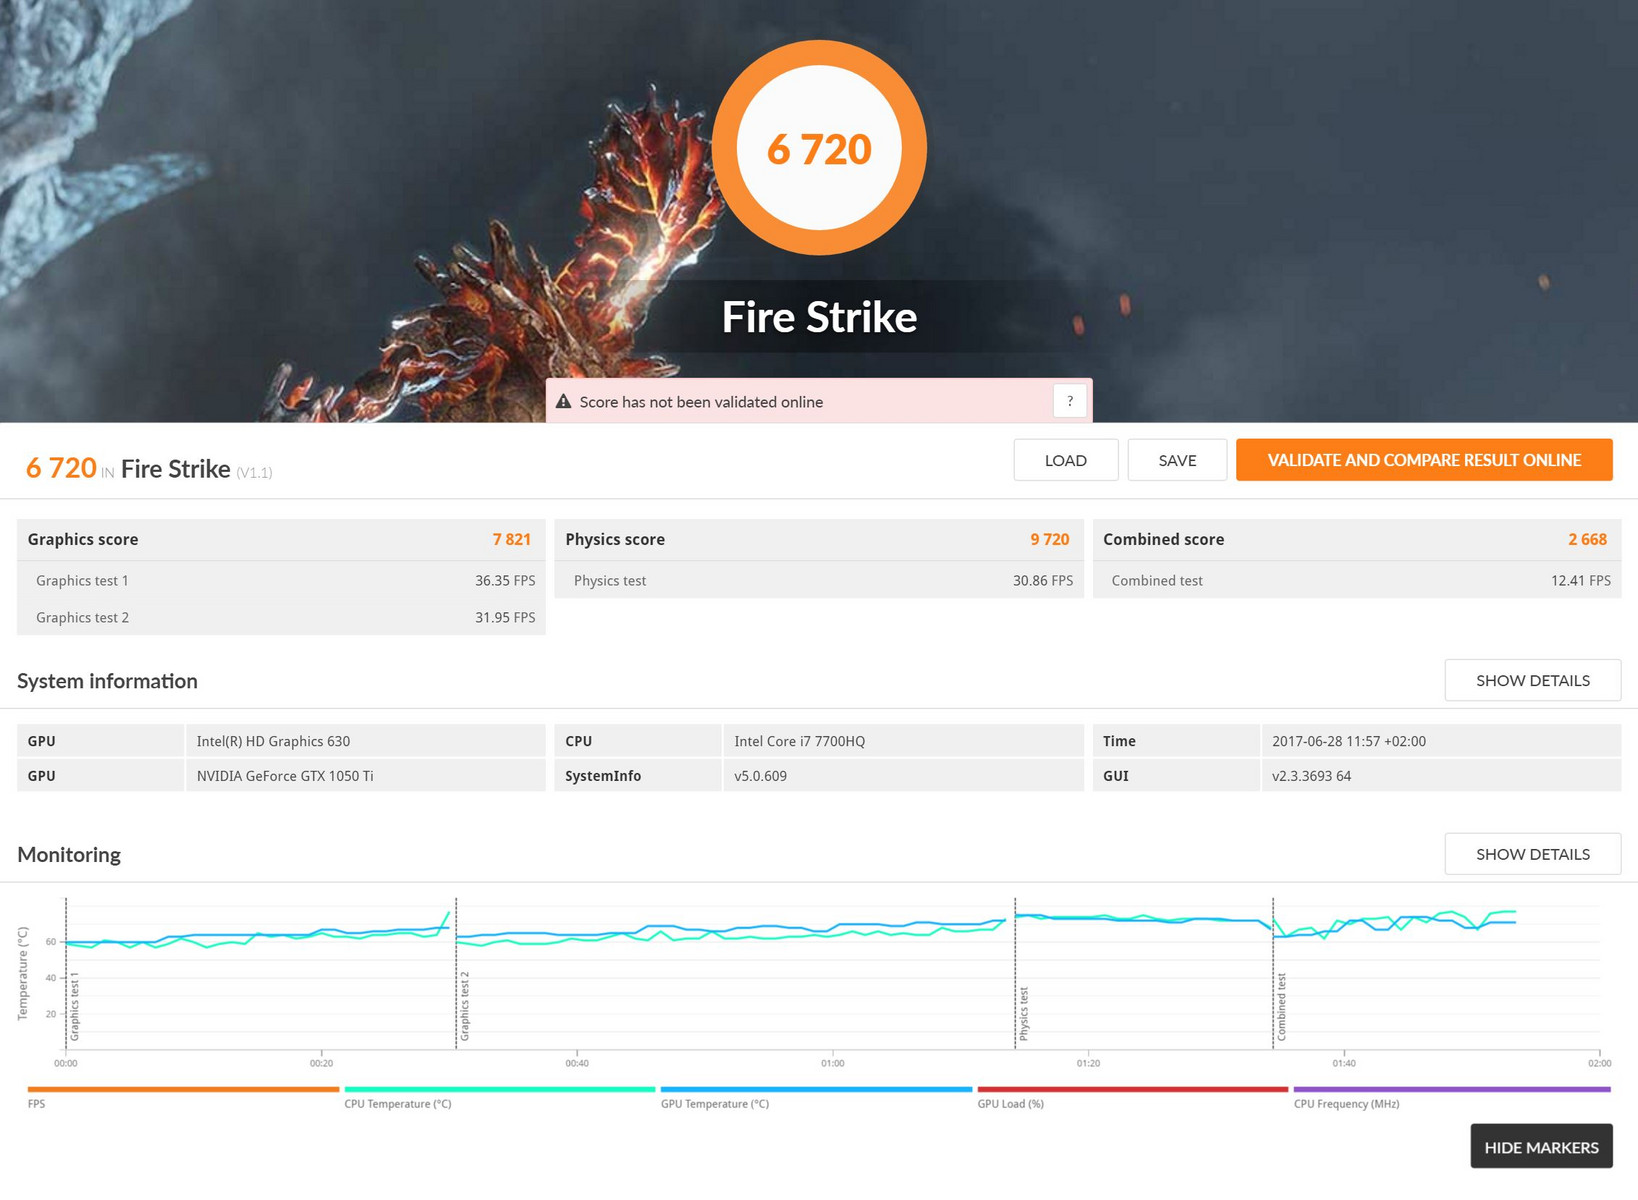
| 3DMark Fire Strike Score | 6720 punti | |
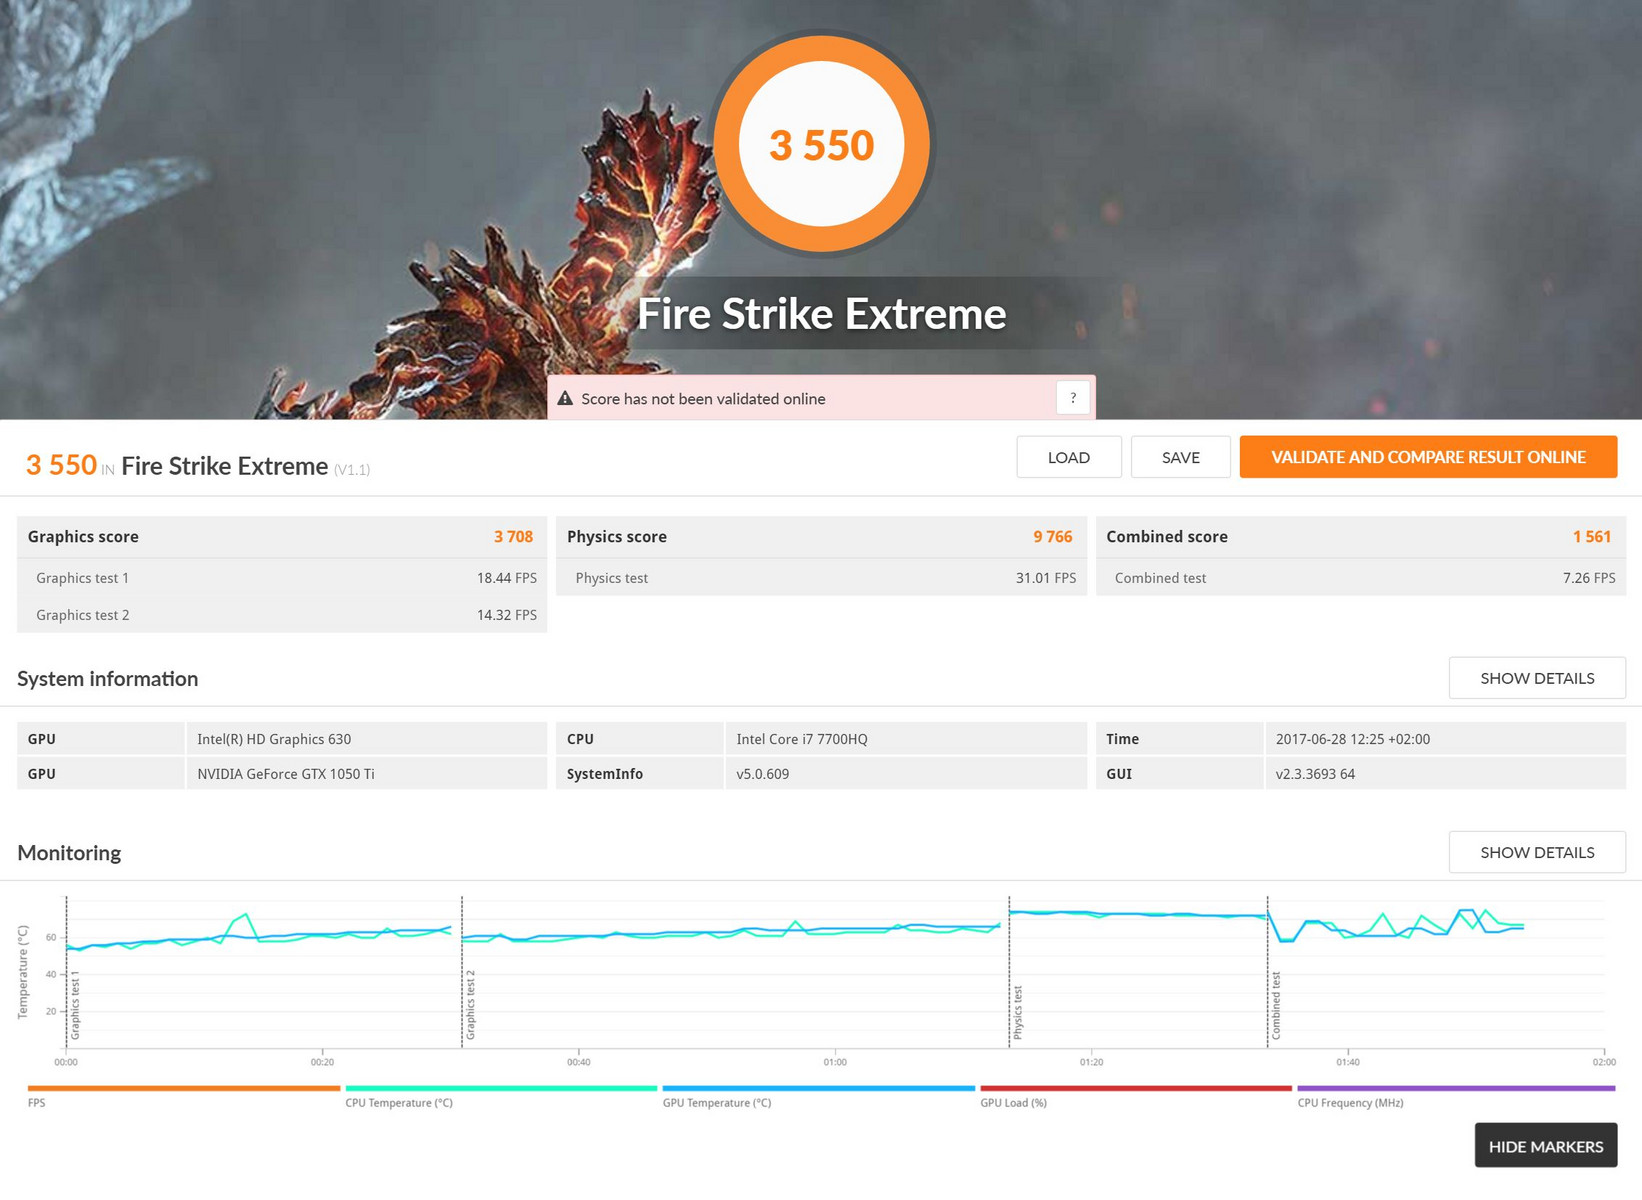
| 3DMark Fire Strike Extreme Score | 3550 punti | |
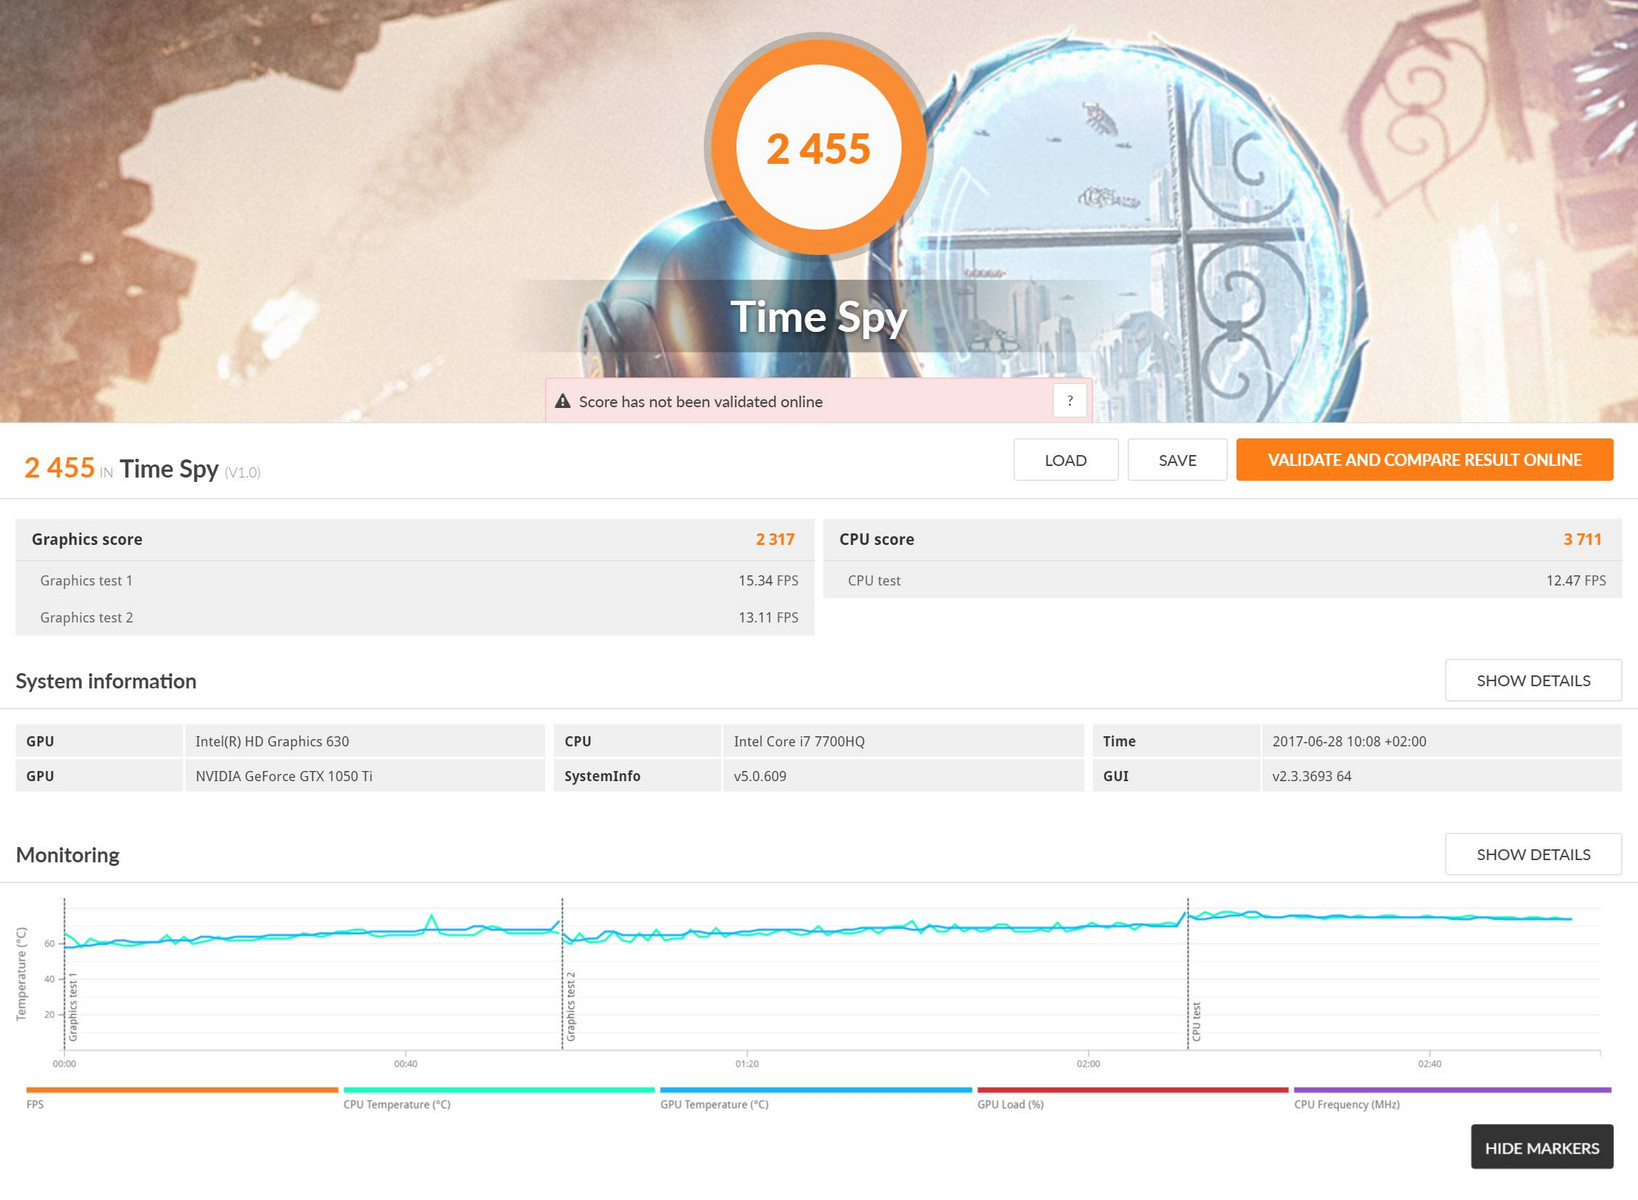
| 3DMark Time Spy Score | 2455 punti | |
Aiuto | ||
| basso | medio | alto | ultra | |
|---|---|---|---|---|
| BioShock Infinite (2013) | 216 | 176.8 | 163.4 | 70.7 |
| Battlefield 4 (2013) | 180.2 | 176.4 | 146 | 71.3 |
| The Witcher 3 (2015) | 128.1 | 86.2 | 48.3 | 26.6 |
| Rise of the Tomb Raider (2016) | 115.4 | 68.2 | 38.9 | 32.5 |
Rumorosità
| Idle |
| 32 / 34 / 36 dB(A) |
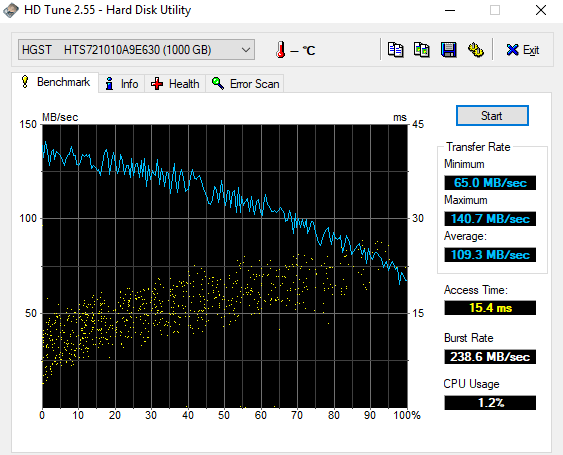
| HDD |
| 34 dB(A) |
| Sotto carico |
| 48 / 51 dB(A) |
 | ||
30 dB silenzioso 40 dB(A) udibile 50 dB(A) rumoroso |
||
min: | ||
| HP Omen 15-ax213ng GeForce GTX 1050 Ti Mobile, i7-7700HQ | HP Omen 15-ax007ng GeForce GTX 965M, 6700HQ | Acer Aspire VX5-591G-75C4 VX15 GeForce GTX 1050 Ti Mobile, i7-7700HQ | Dell Inspiron 15 7000 7567 GeForce GTX 1050 Ti Mobile, i7-7700HQ | Lenovo Legion Y520-15IKBN-80WK001KUS GeForce GTX 1050 Ti Mobile, i7-7700HQ | Asus FX502VM-AS73 GeForce GTX 1060 Mobile, i7-7700HQ | MSI GS63VR 7RF-228US GeForce GTX 1060 Mobile, i7-7700HQ | |
|---|---|---|---|---|---|---|---|
| Noise | 3% | 11% | 6% | 13% | 6% | 7% | |
| off /ambiente * (dB) | 30 | 30 -0% | 30.4 -1% | 30.3 -1% | 27.7 8% | 28.7 4% | 28.8 4% |
| Idle Minimum * (dB) | 32 | 32 -0% | 31.4 2% | 30.9 3% | 30.5 5% | 30.6 4% | 33.1 -3% |
| Idle Average * (dB) | 34 | 33 3% | 31.4 8% | 30.9 9% | 30.5 10% | 30.6 10% | 33.1 3% |
| Idle Maximum * (dB) | 36 | 36 -0% | 31.4 13% | 31 14% | 30.6 15% | 31 14% | 34 6% |
| Load Average * (dB) | 48 | 43 10% | 36.8 23% | 46.5 3% | 40 17% | 46.2 4% | 37.2 22% |
| Witcher 3 ultra * (dB) | 49 | 40 18% | 46.1 6% | ||||
| Load Maximum * (dB) | 51 | 49 4% | 41.3 19% | 46.8 8% | 42.6 16% | 52.3 -3% | 47.1 8% |
* ... Meglio usare valori piccoli
| HP Omen 15-ax213ng GeForce GTX 1050 Ti Mobile, i7-7700HQ | HP Omen 15-ax007ng GeForce GTX 965M, 6700HQ | Acer Aspire VX5-591G-75C4 VX15 GeForce GTX 1050 Ti Mobile, i7-7700HQ | Dell Inspiron 15 7000 7567 GeForce GTX 1050 Ti Mobile, i7-7700HQ | Lenovo Legion Y520-15IKBN-80WK001KUS GeForce GTX 1050 Ti Mobile, i7-7700HQ | Asus FX502VM-AS73 GeForce GTX 1060 Mobile, i7-7700HQ | MSI GS63VR 7RF-228US GeForce GTX 1060 Mobile, i7-7700HQ | |
|---|---|---|---|---|---|---|---|
| Heat | 3% | 9% | 21% | 4% | -3% | 1% | |
| Maximum Upper Side * (°C) | 52.4 | 48.5 7% | 47 10% | 43.4 17% | 46.8 11% | 53.2 -2% | |
| Maximum Bottom * (°C) | 54.2 | 59 -9% | 47 13% | 37.7 30% | 55.8 -3% | 56.8 -5% | |
| Idle Upper Side * (°C) | 30.5 | 28.7 6% | 28.4 7% | 24.3 20% | 27.6 10% | 28.8 6% | 28.4 7% |
| Idle Bottom * (°C) | 28.2 | 25.7 9% | 27.1 4% | 23.6 16% | 28.4 -1% | 31.4 -11% | 29.6 -5% |
* ... Meglio usare valori piccoli
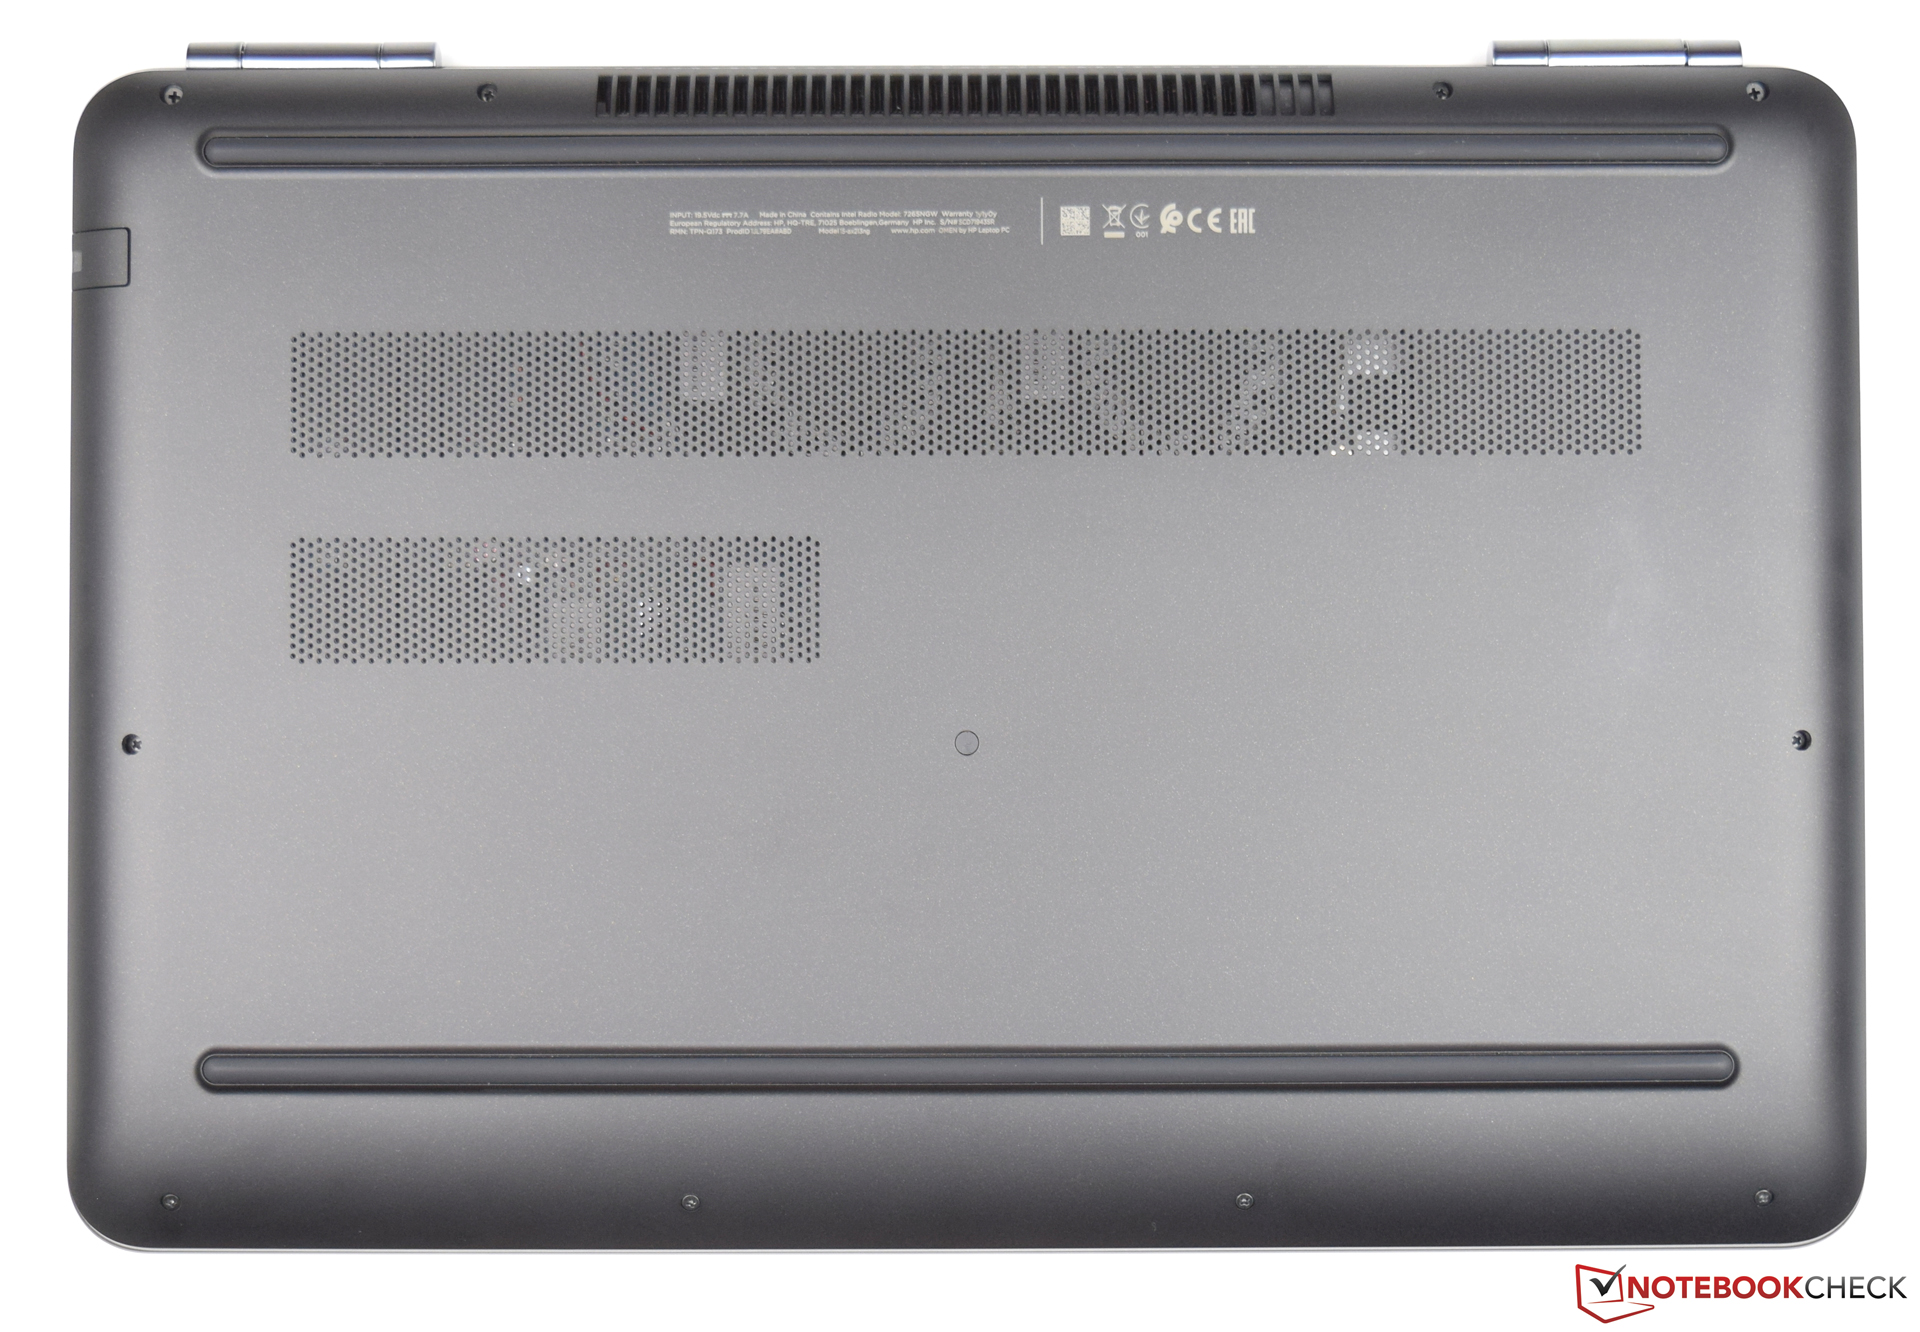
(-) La temperatura massima sul lato superiore è di 52.4 °C / 126 F, rispetto alla media di 36.8 °C / 98 F, che varia da 21 a 71 °C per questa classe Multimedia.
(-) Il lato inferiore si riscalda fino ad un massimo di 54.2 °C / 130 F, rispetto alla media di 39.1 °C / 102 F
(+) In idle, la temperatura media del lato superiore è di 28.5 °C / 83 F, rispetto alla media deld ispositivo di 31.3 °C / 88 F.
(-) Riproducendo The Witcher 3, la temperatura media per il lato superiore e' di 38.9 °C / 102 F, rispetto alla media del dispositivo di 31.3 °C / 88 F.
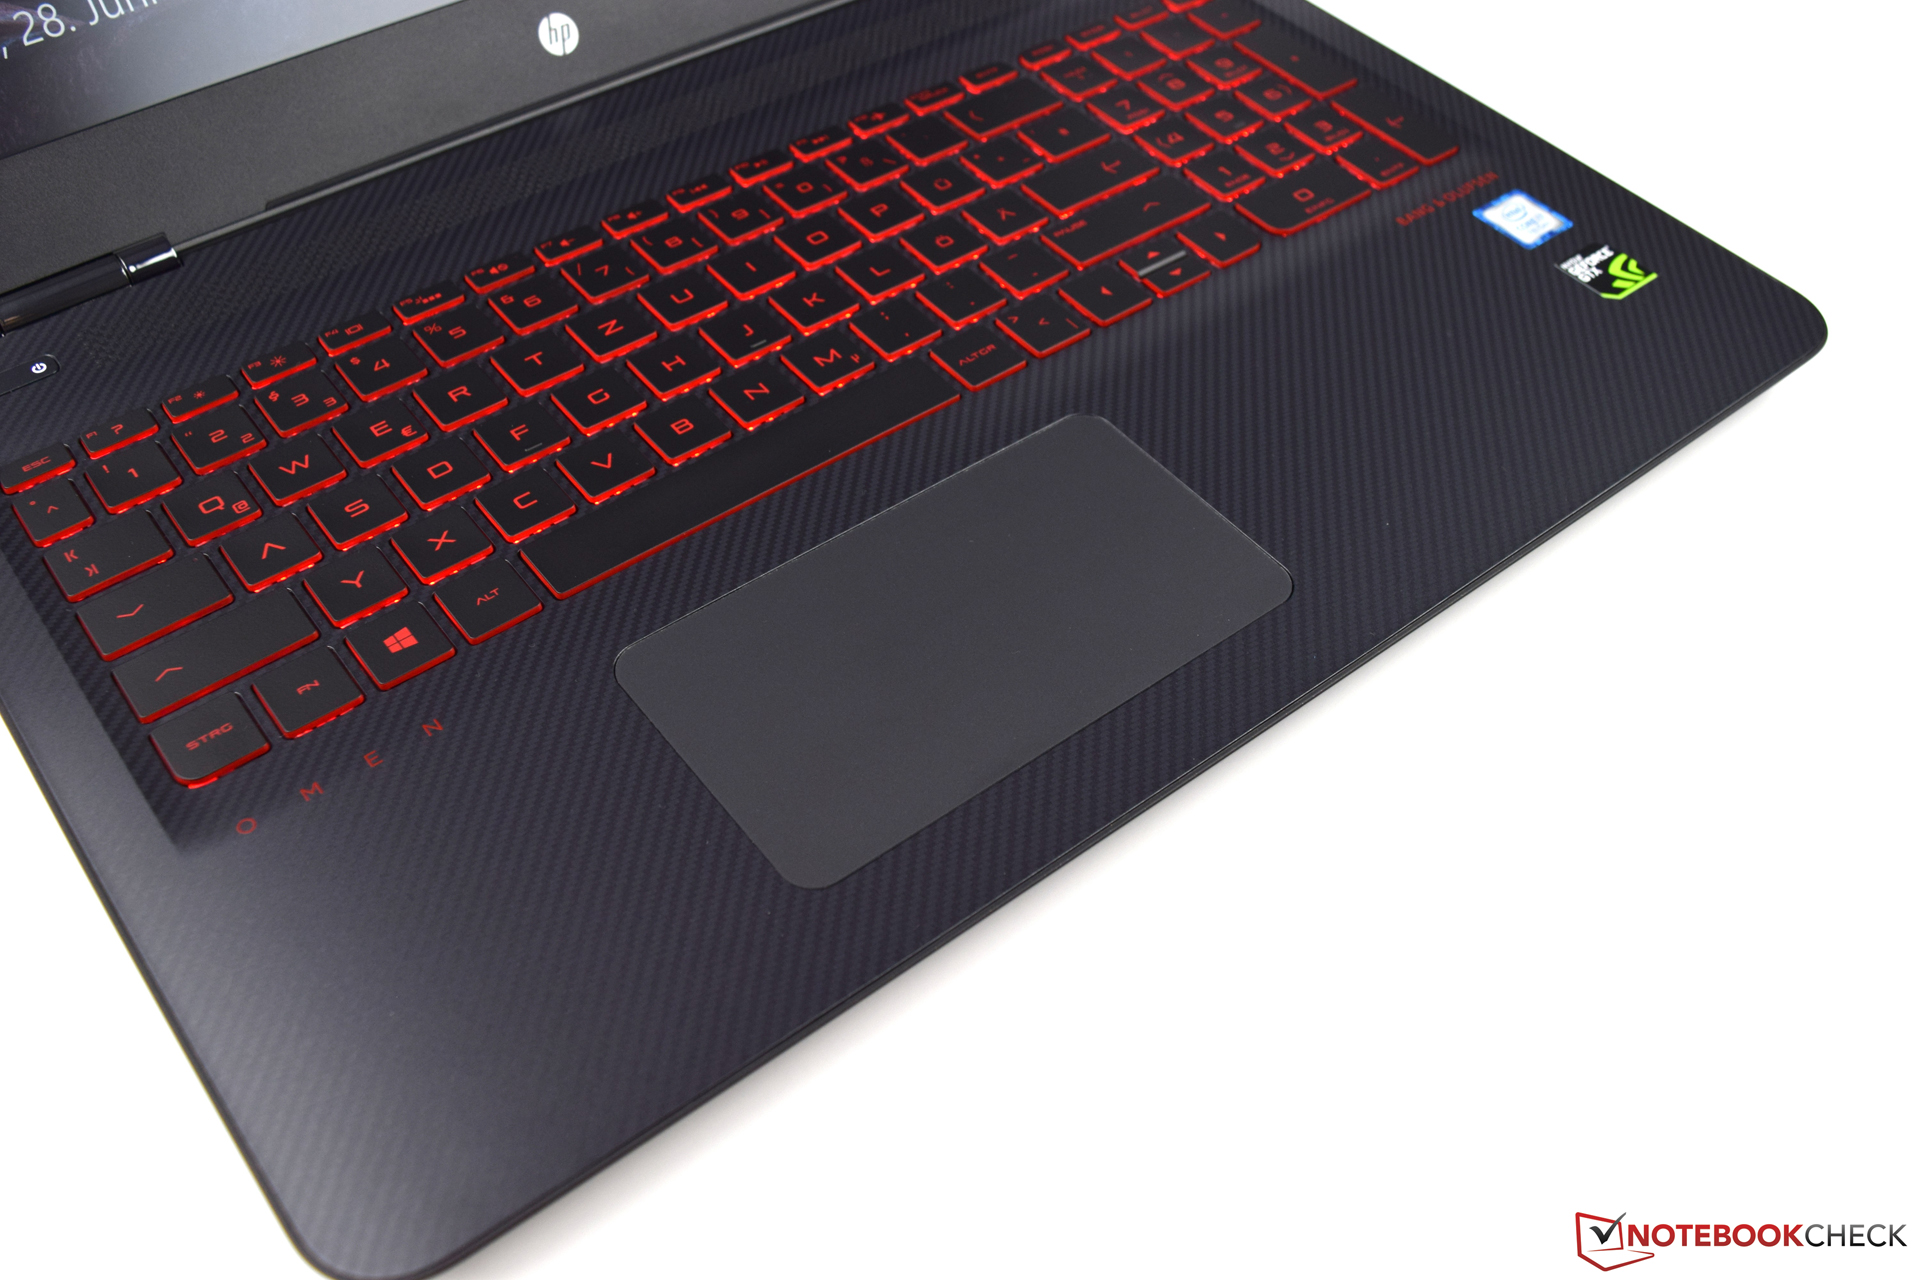
(-) I poggiapolsi e il touchpad possono diventare molto caldi al tatto con un massimo di 45.4 °C / 113.7 F.
(-) La temperatura media della zona del palmo della mano di dispositivi simili e'stata di 28.7 °C / 83.7 F (-16.7 °C / -30 F).
HP Omen 15-ax213ng analisi audio
(±) | potenza degli altiparlanti media ma buona (80 dB)
Bassi 100 - 315 Hz
(-) | quasi nessun basso - in media 18.2% inferiori alla media
(±) | la linearità dei bassi è media (11.8% delta rispetto alla precedente frequenza)
Medi 400 - 2000 Hz
(+) | medi bilanciati - solo only 4.3% rispetto alla media
(+) | medi lineari (4.2% delta rispetto alla precedente frequenza)
Alti 2 - 16 kHz
(+) | Alti bilanciati - appena 4.2% dalla media
(+) | alti lineari (5.8% delta rispetto alla precedente frequenza)
Nel complesso 100 - 16.000 Hz
(±) | la linearità complessiva del suono è media (20.6% di differenza rispetto alla media
Rispetto alla stessa classe
» 70% di tutti i dispositivi testati in questa classe è stato migliore, 8% simile, 22% peggiore
» Il migliore ha avuto un delta di 5%, medio di 17%, peggiore di 45%
Rispetto a tutti i dispositivi testati
» 55% di tutti i dispositivi testati in questa classe è stato migliore, 8% similare, 37% peggiore
» Il migliore ha avuto un delta di 4%, medio di 23%, peggiore di 134%
MSI GS63VR 7RF-228US analisi audio
(±) | potenza degli altiparlanti media ma buona (75 dB)
Bassi 100 - 315 Hz
(-) | quasi nessun basso - in media 25.3% inferiori alla media
(±) | la linearità dei bassi è media (12.4% delta rispetto alla precedente frequenza)
Medi 400 - 2000 Hz
(+) | medi bilanciati - solo only 3.3% rispetto alla media
(±) | linearità dei medi adeguata (7% delta rispetto alla precedente frequenza)
Alti 2 - 16 kHz
(±) | alti elevati - circa 8.1% superiori alla media
(±) | la linearità degli alti è media (8.6% delta rispetto alla precedente frequenza)
Nel complesso 100 - 16.000 Hz
(±) | la linearità complessiva del suono è media (28.4% di differenza rispetto alla media
Rispetto alla stessa classe
» 94% di tutti i dispositivi testati in questa classe è stato migliore, 1% simile, 4% peggiore
» Il migliore ha avuto un delta di 6%, medio di 18%, peggiore di 132%
Rispetto a tutti i dispositivi testati
» 86% di tutti i dispositivi testati in questa classe è stato migliore, 3% similare, 12% peggiore
» Il migliore ha avuto un delta di 4%, medio di 23%, peggiore di 134%
| Off / Standby | |
| Idle | |
| Sotto carico |
|
Leggenda:
min: | |
| HP Omen 15-ax213ng GeForce GTX 1050 Ti Mobile, i7-7700HQ | HP Omen 15-ax007ng GeForce GTX 965M, 6700HQ | Acer Aspire VX5-591G-75C4 VX15 GeForce GTX 1050 Ti Mobile, i7-7700HQ | Dell Inspiron 15 7000 7567 GeForce GTX 1050 Ti Mobile, i7-7700HQ | Lenovo Legion Y520-15IKBN-80WK001KUS GeForce GTX 1050 Ti Mobile, i7-7700HQ | Asus FX502VM-AS73 GeForce GTX 1060 Mobile, i7-7700HQ | MSI GS63VR 7RF-228US GeForce GTX 1060 Mobile, i7-7700HQ | |
|---|---|---|---|---|---|---|---|
| Power Consumption | -1% | 6% | 26% | 5% | -40% | -51% | |
| Idle Minimum * (Watt) | 6 | 7 -17% | 7 -17% | 4.4 27% | 8.5 -42% | 14.9 -148% | 14.5 -142% |
| Idle Average * (Watt) | 11 | 11 -0% | 10.2 7% | 6.8 38% | 9.1 17% | 15.1 -37% | 17.3 -57% |
| Idle Maximum * (Watt) | 18 | 19 -6% | 14 22% | 8.3 54% | 9.7 46% | 15.2 16% | 17.4 3% |
| Load Average * (Watt) | 81 | 79 2% | 78 4% | 81 -0% | 79.9 1% | 105.8 -31% | 93 -15% |
| Witcher 3 ultra * (Watt) | 90 | 97.7 -9% | 128.8 -43% | ||||
| Load Maximum * (Watt) | 146 | 119 18% | 127 13% | 127 13% | 121.5 17% | 148.8 -2% |
* ... Meglio usare valori piccoli
| HP Omen 15-ax213ng i7-7700HQ, GeForce GTX 1050 Ti Mobile, 63.3 Wh | HP Omen 15-ax007ng 6700HQ, GeForce GTX 965M, 61.5 Wh | Acer Aspire VX5-591G-75C4 VX15 i7-7700HQ, GeForce GTX 1050 Ti Mobile, 52.5 Wh | Dell Inspiron 15 7000 7567 i7-7700HQ, GeForce GTX 1050 Ti Mobile, 74 Wh | Lenovo Legion Y520-15IKBN-80WK001KUS i7-7700HQ, GeForce GTX 1050 Ti Mobile, 45 Wh | Asus FX502VM-AS73 i7-7700HQ, GeForce GTX 1060 Mobile, 64 Wh | MSI GS63VR 7RF-228US i7-7700HQ, GeForce GTX 1060 Mobile, 65 Wh | |
|---|---|---|---|---|---|---|---|
| Autonomia della batteria | -13% | -34% | 54% | -43% | -39% | -38% | |
| Reader / Idle (h) | 12.8 | 7.8 -39% | 5.4 -58% | 19.6 53% | 8.5 -34% | 6.1 -52% | 6.4 -50% |
| H.264 (h) | 3.3 | 4.1 24% | 7.6 130% | ||||
| WiFi v1.3 (h) | 7.1 | 4.5 -37% | 5 -30% | 10.4 46% | 4 -44% | 4.6 -35% | 3.9 -45% |
| Load (h) | 1.6 | 1.6 0% | 1.4 -13% | 1.4 -13% | 0.8 -50% | 1.1 -31% | 1.3 -19% |
Pro
Contro
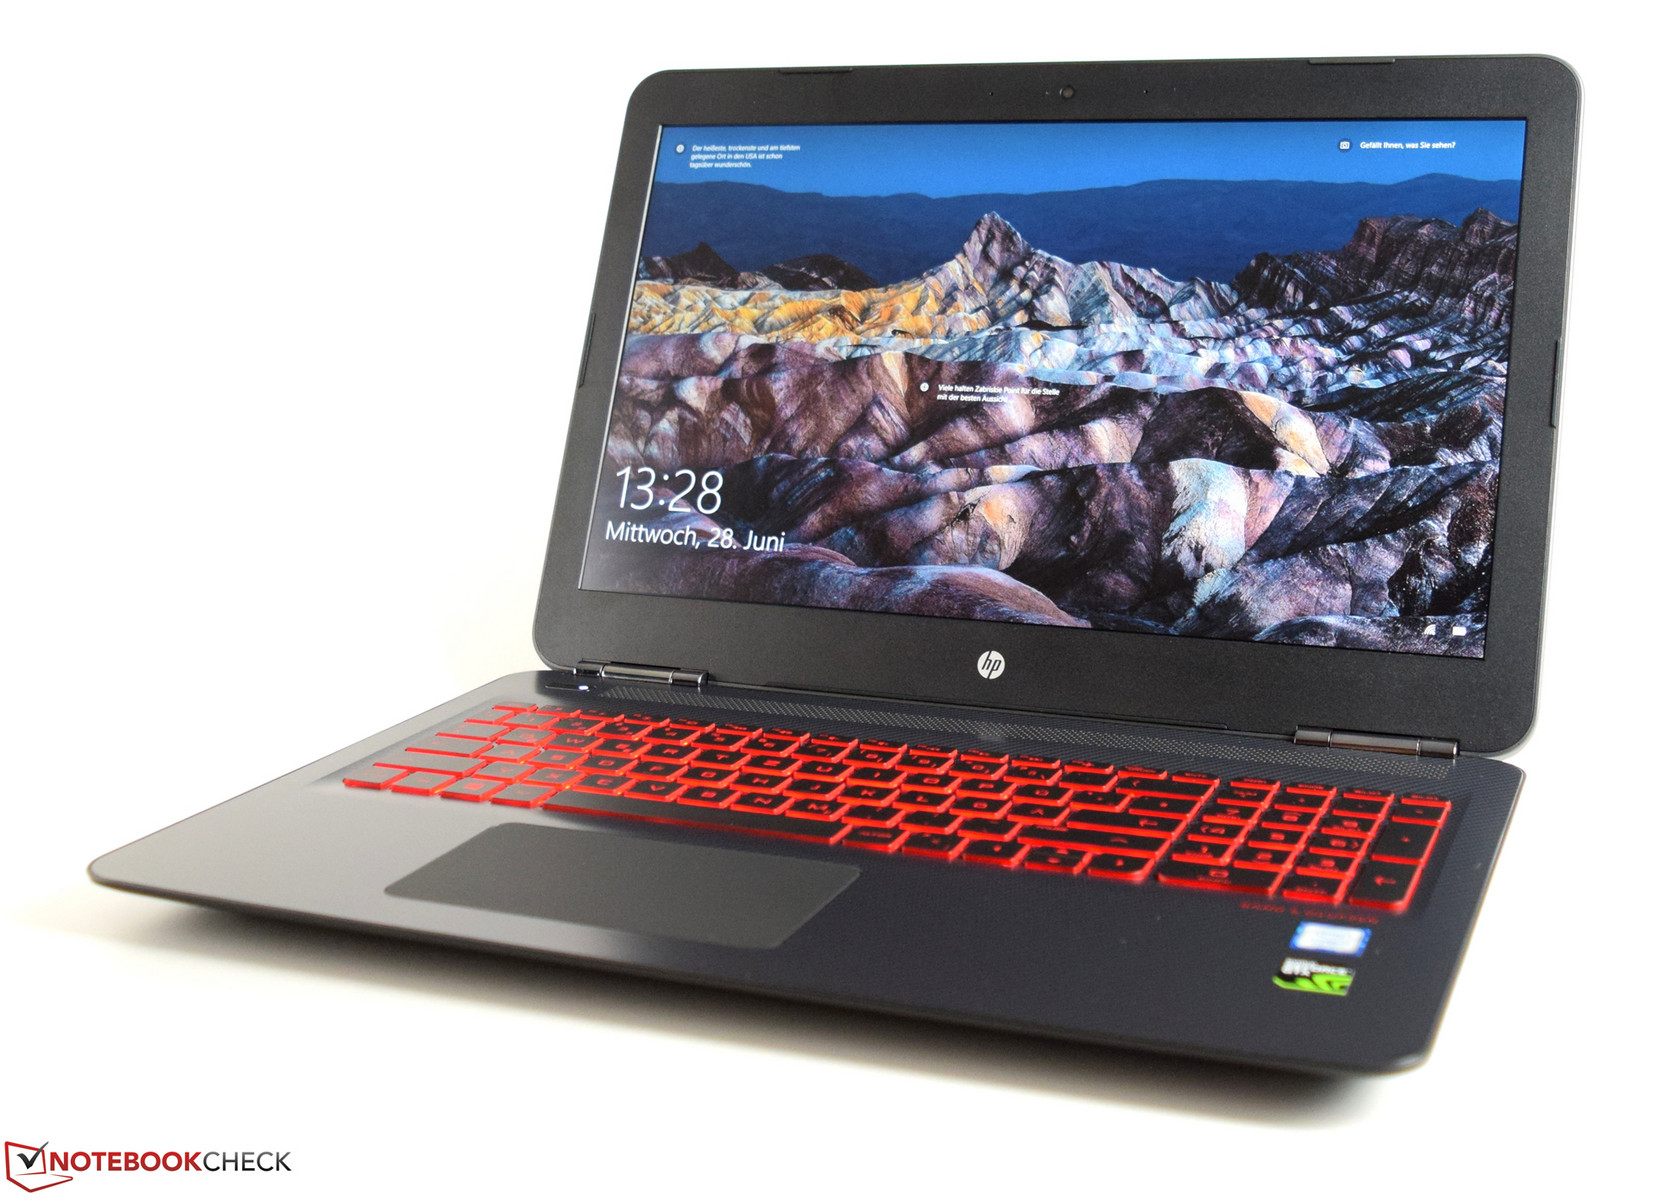
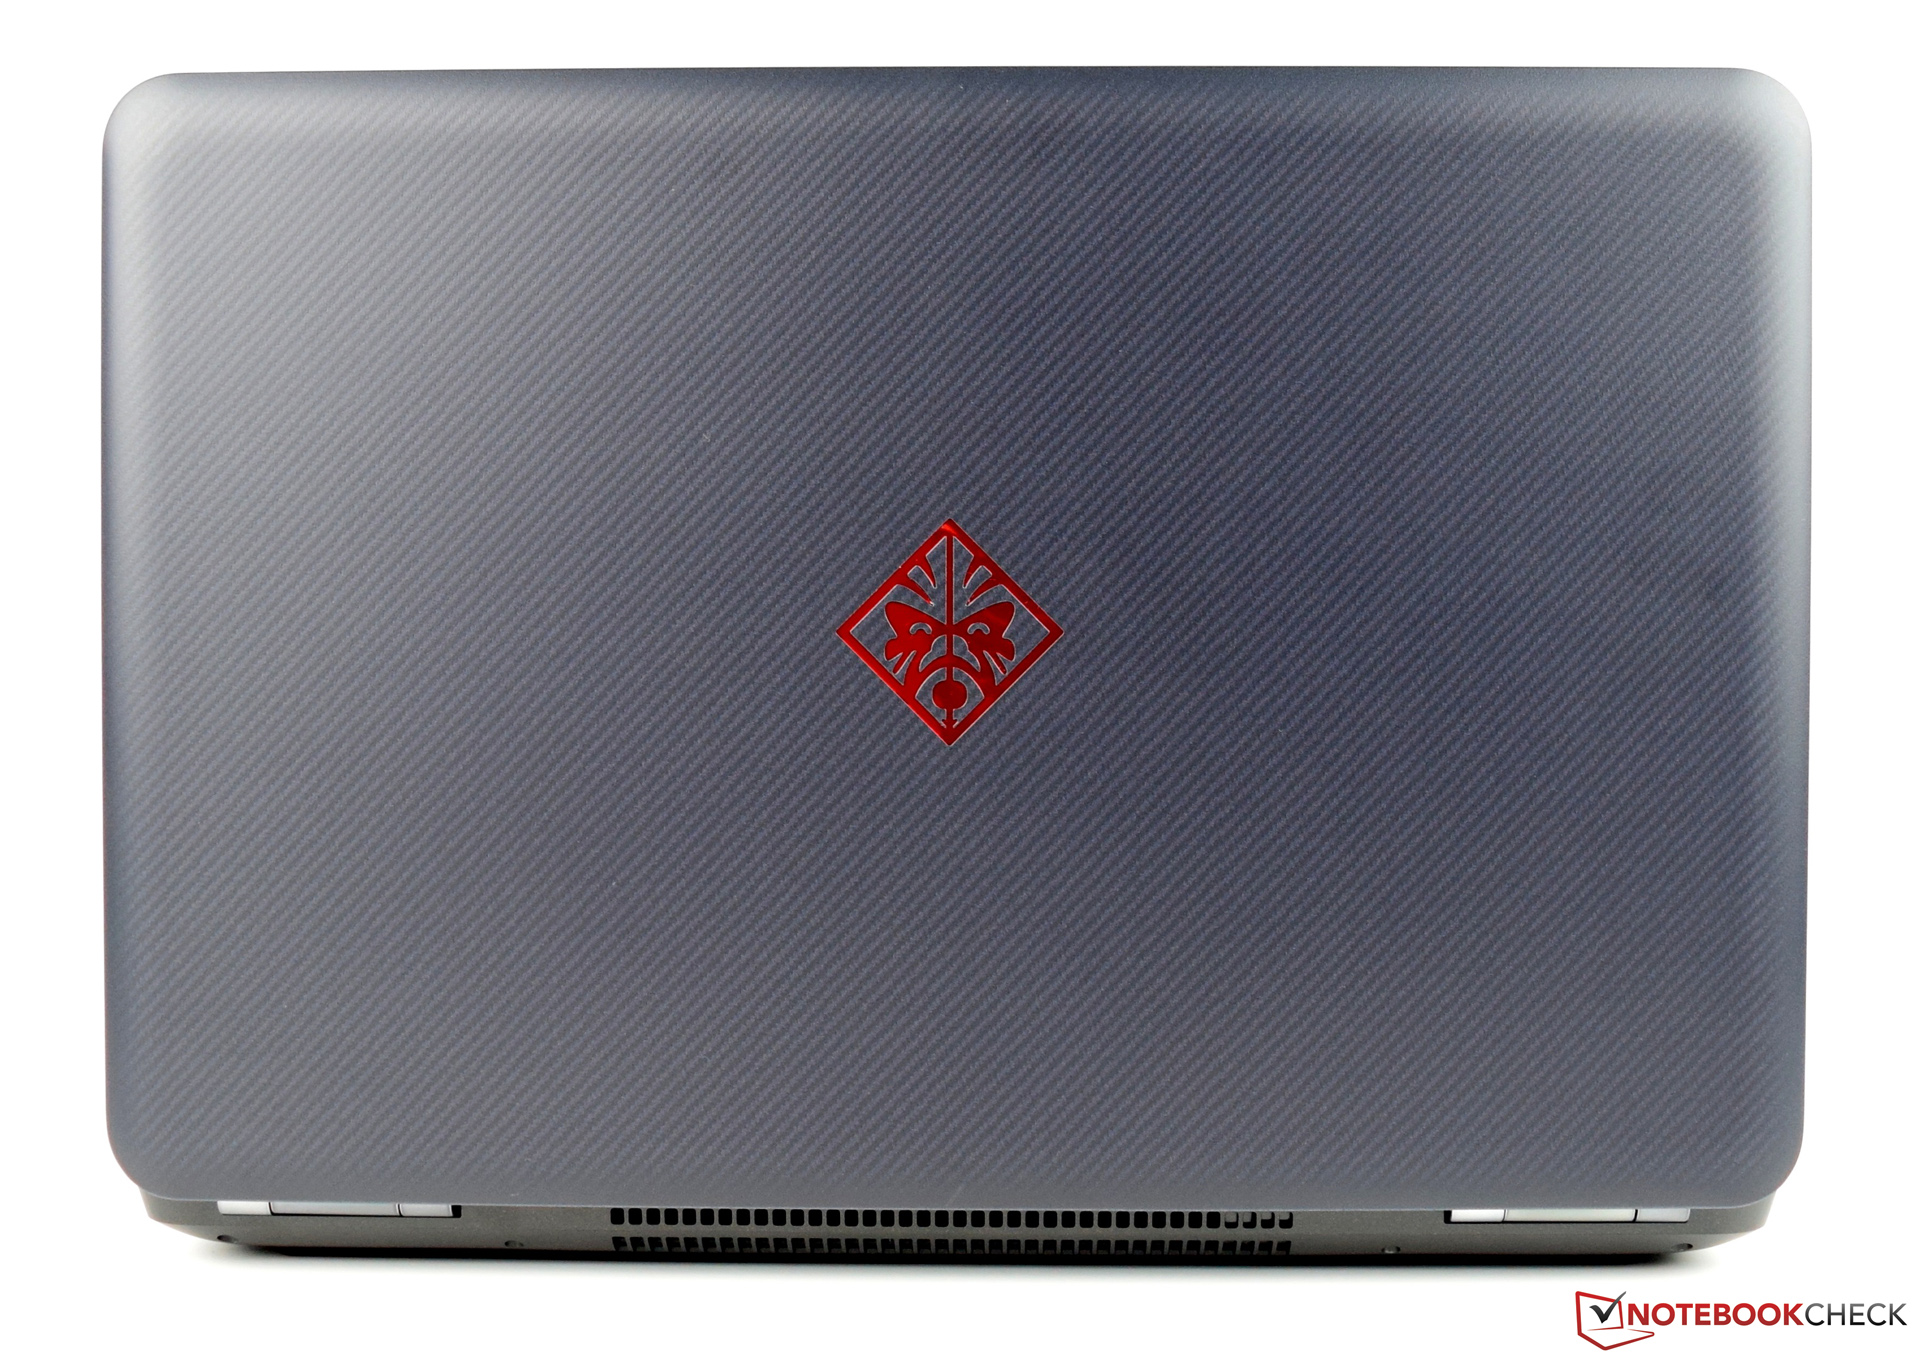
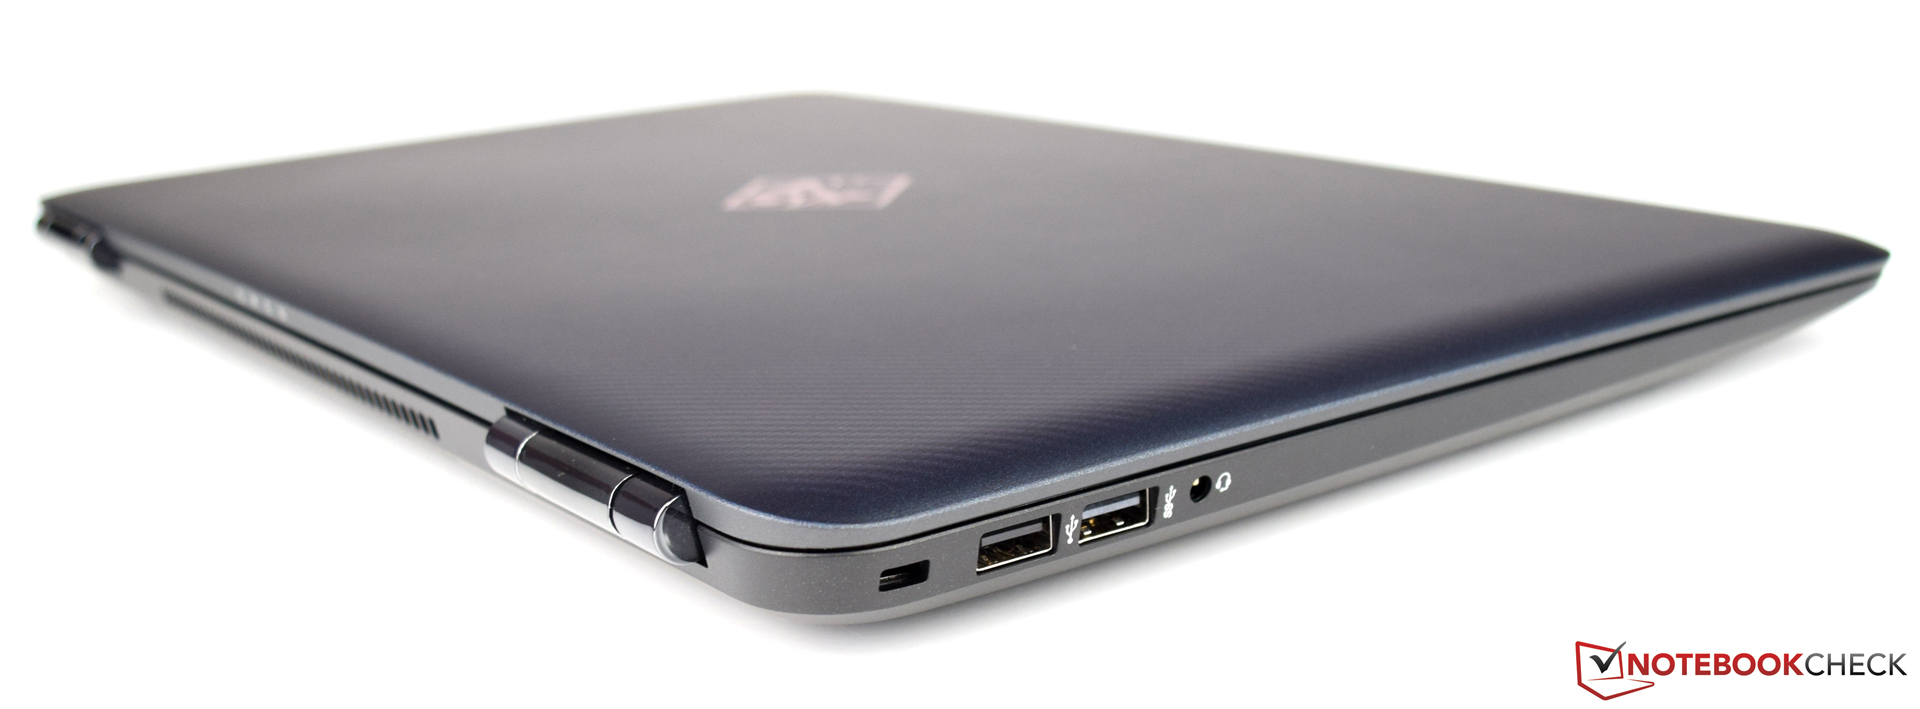
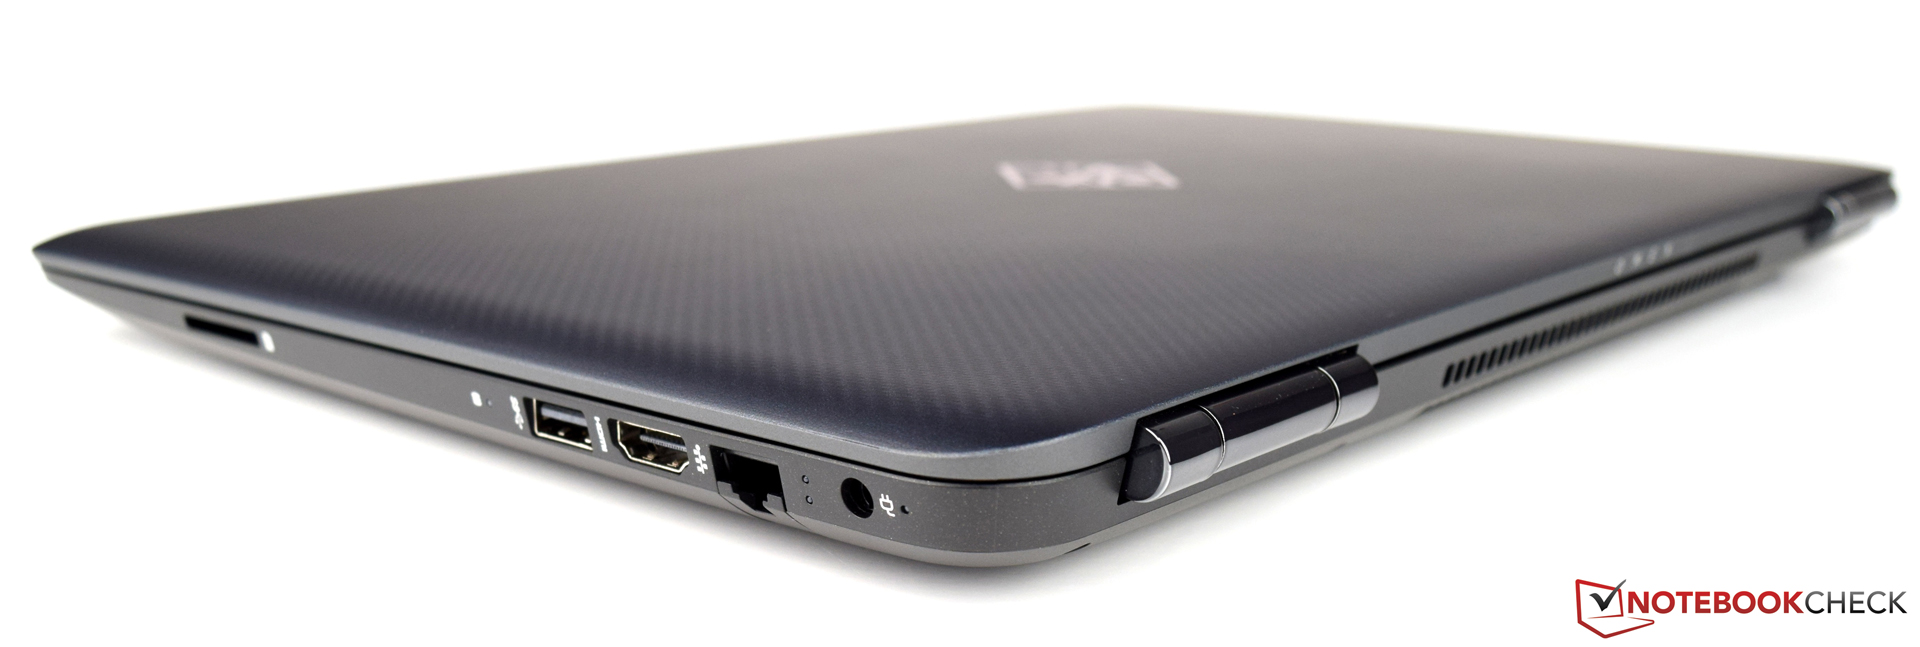
L'HP Omen 15t (2017) non avrà vita facile, specialmente in quanto la concorrenza offre vari dispositivi con la nuova architettura Pascal già da tempo. Questo dispositivo da 15" ha un design carino, sebbene la costruzione potrebbe essere migliore considerando il prezzo di $1500. Non capiamo come mai manchino porte moderne come DisplayPort o USB 3.1 Gen2. La connettività non è predisposta per il futuro.
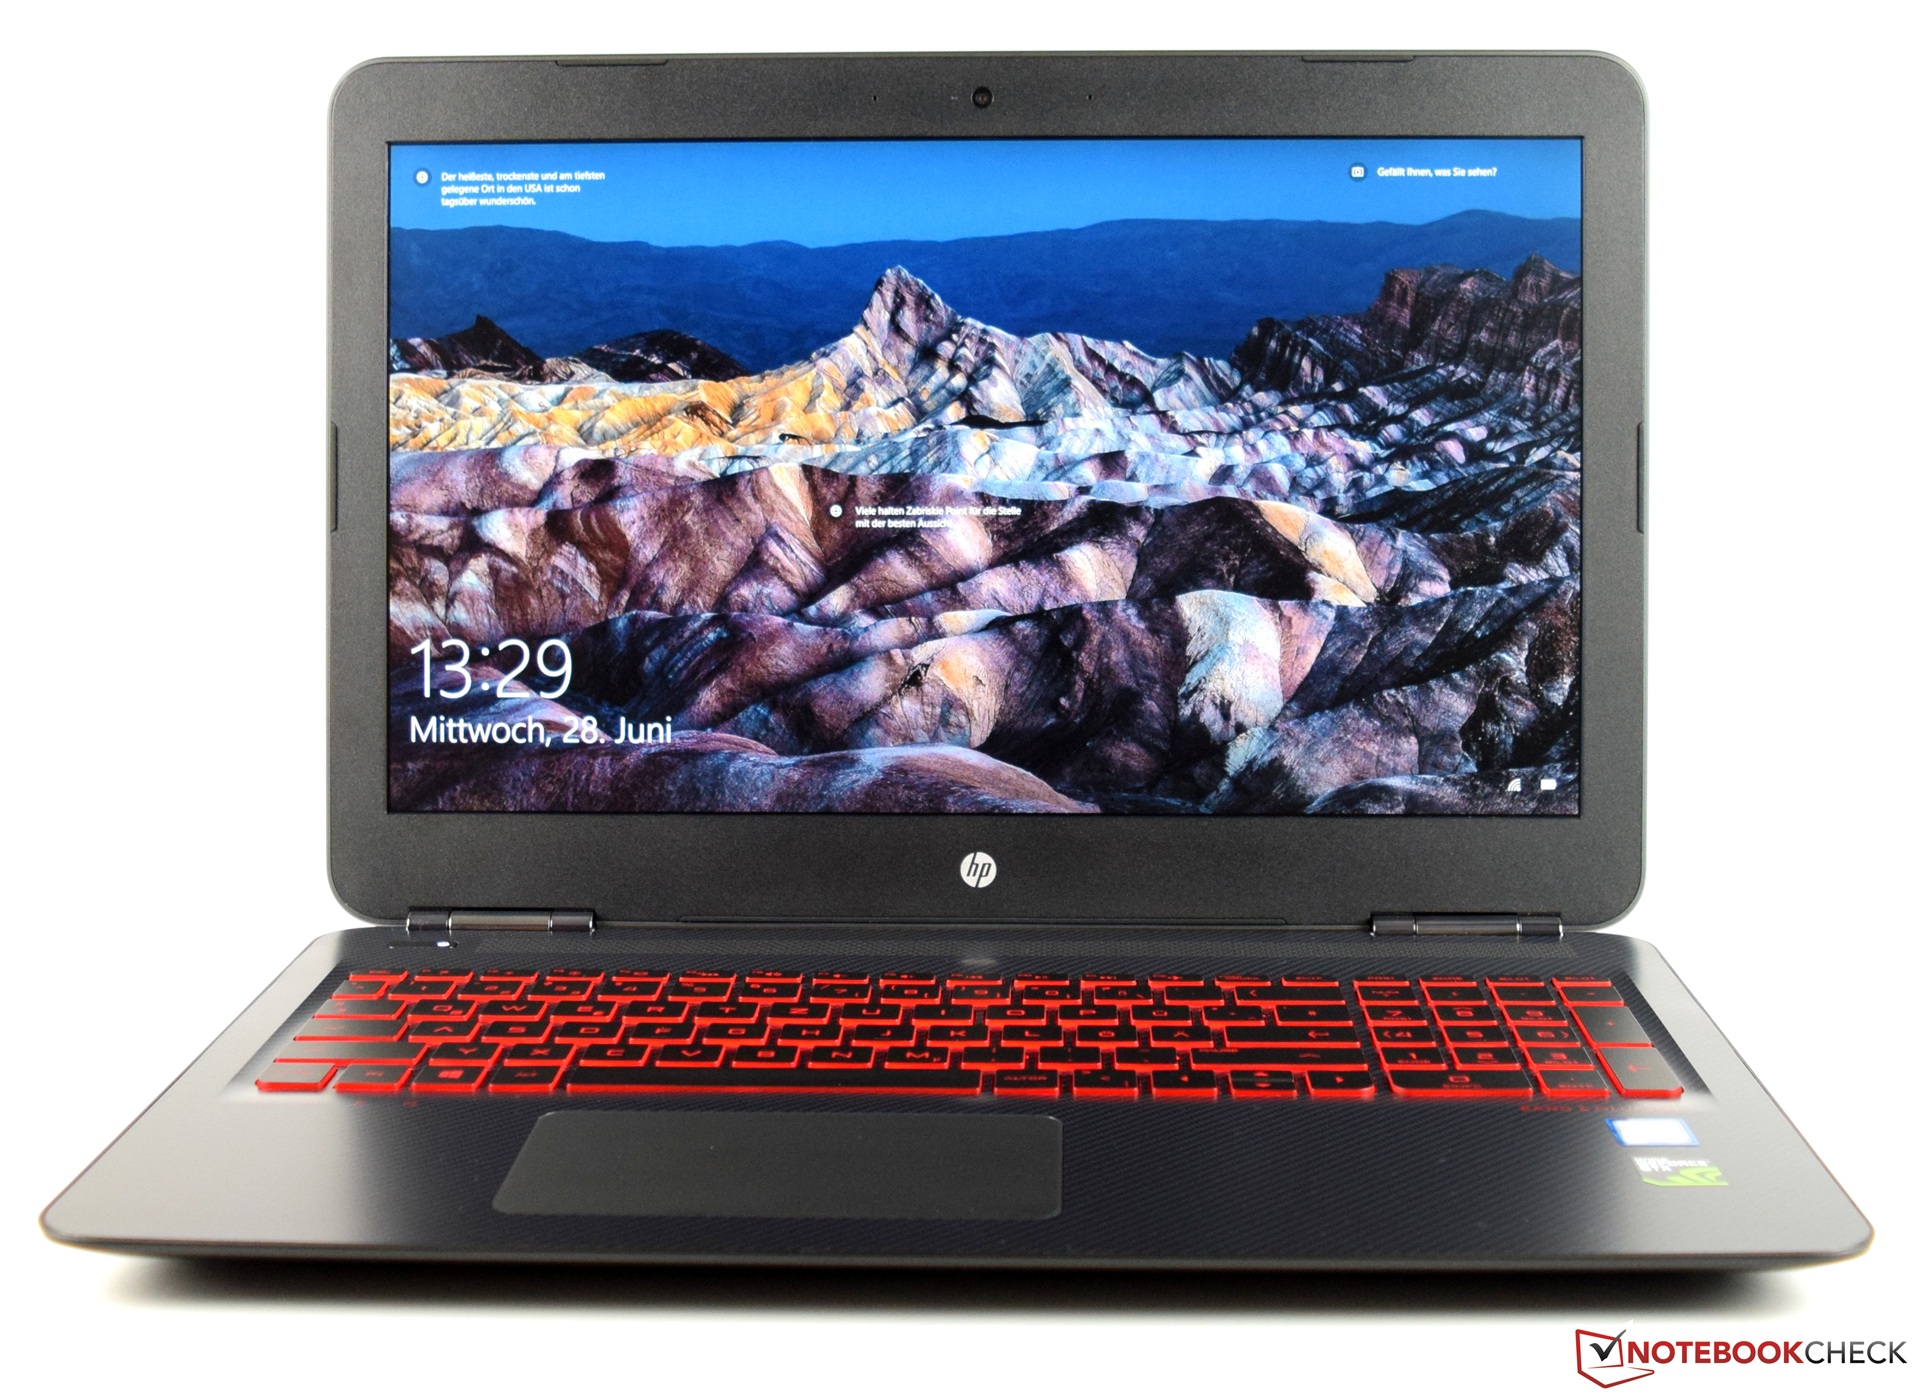
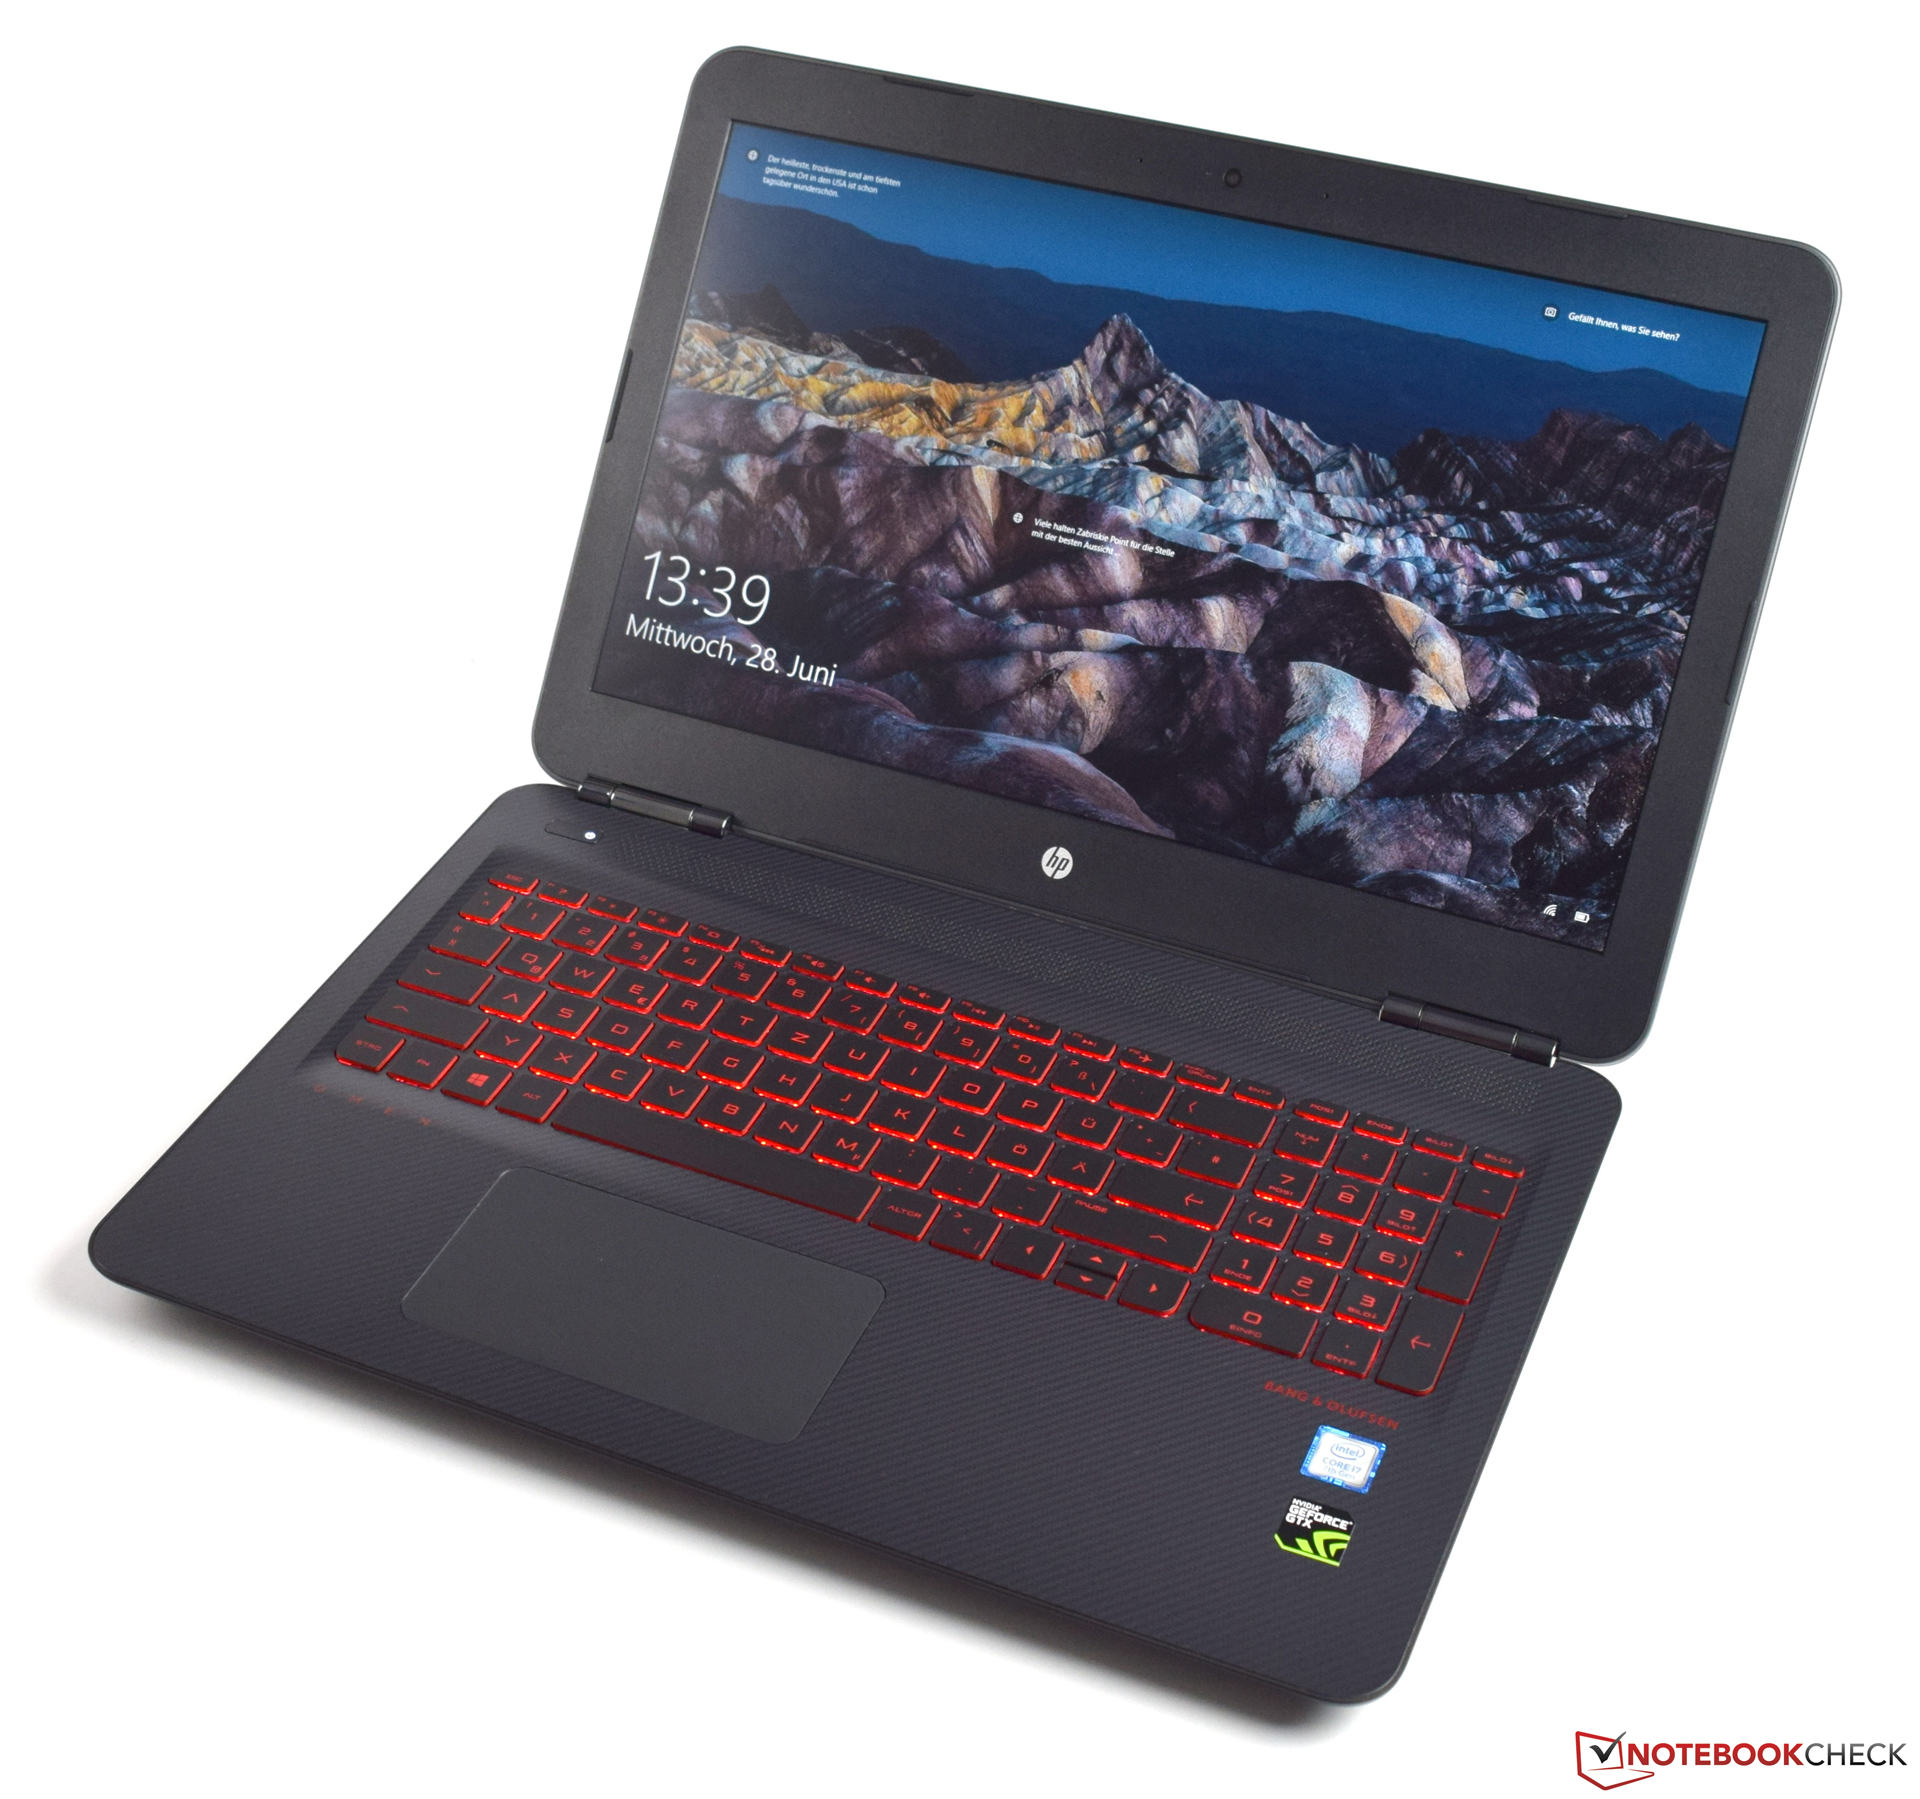
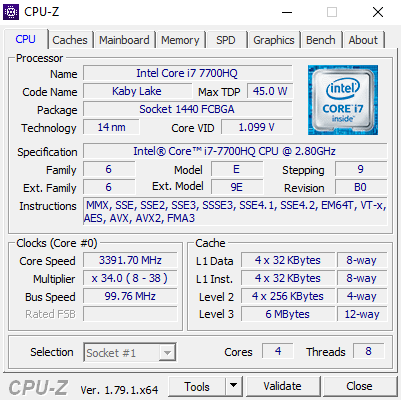
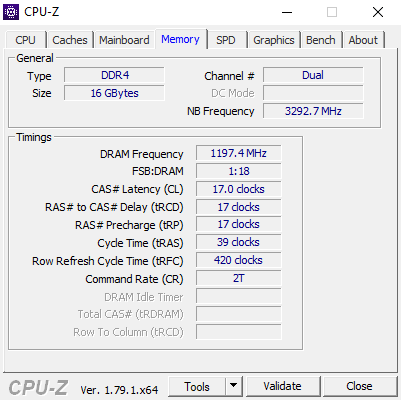
L'HP Omen 15t (2017) ha mostrato prestazioni solide, che hanno un ruolo importante nel nostro punteggio. Il dispositivo monta una Nvidia GeForce GTX 1050 Ti ed un potente Intel Core i7-7700HQ. Questa combinazione, supportata da 16 GB di RAM, vi consente di usare in modo fluido i giochi attuali con dettagli elevati.
Se aspettavate l'HP Omen 15t (2017), sarete ripagati da buone prestazioni gaming. Tuttavia, il produttore ha deciso di non aggiornare le porte.
HP perde punti anche per colpa del display, che non è abbastanza luminoso. La gamma di colore è deludente. Tuttavia, abbiamo apprezzato le prestazioni di sistema dell'HP Omen 15, che sono sostenute dal suo SSD NVMe.
Nota: si tratta di una recensione breve, con alcune sezioni non tradotte, per la versione integrale in inglese guardate qui.
HP Omen 15-ax213ng
- 07/03/2017 v6 (old)
Sebastian Bade