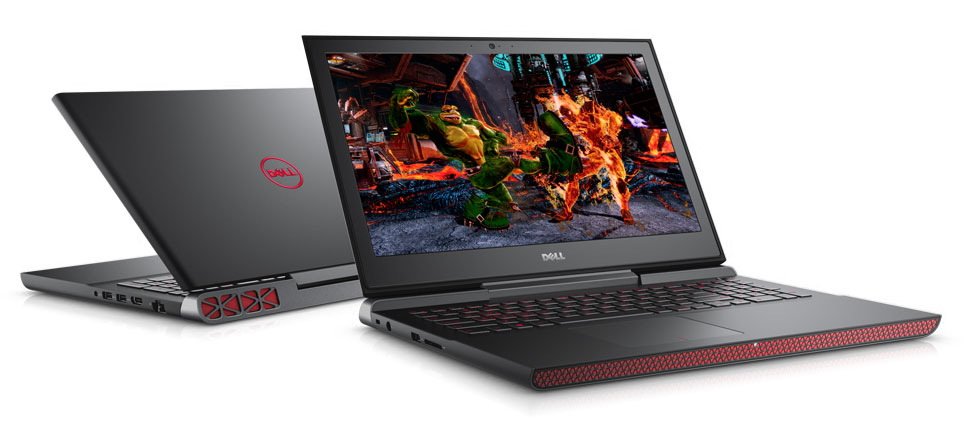
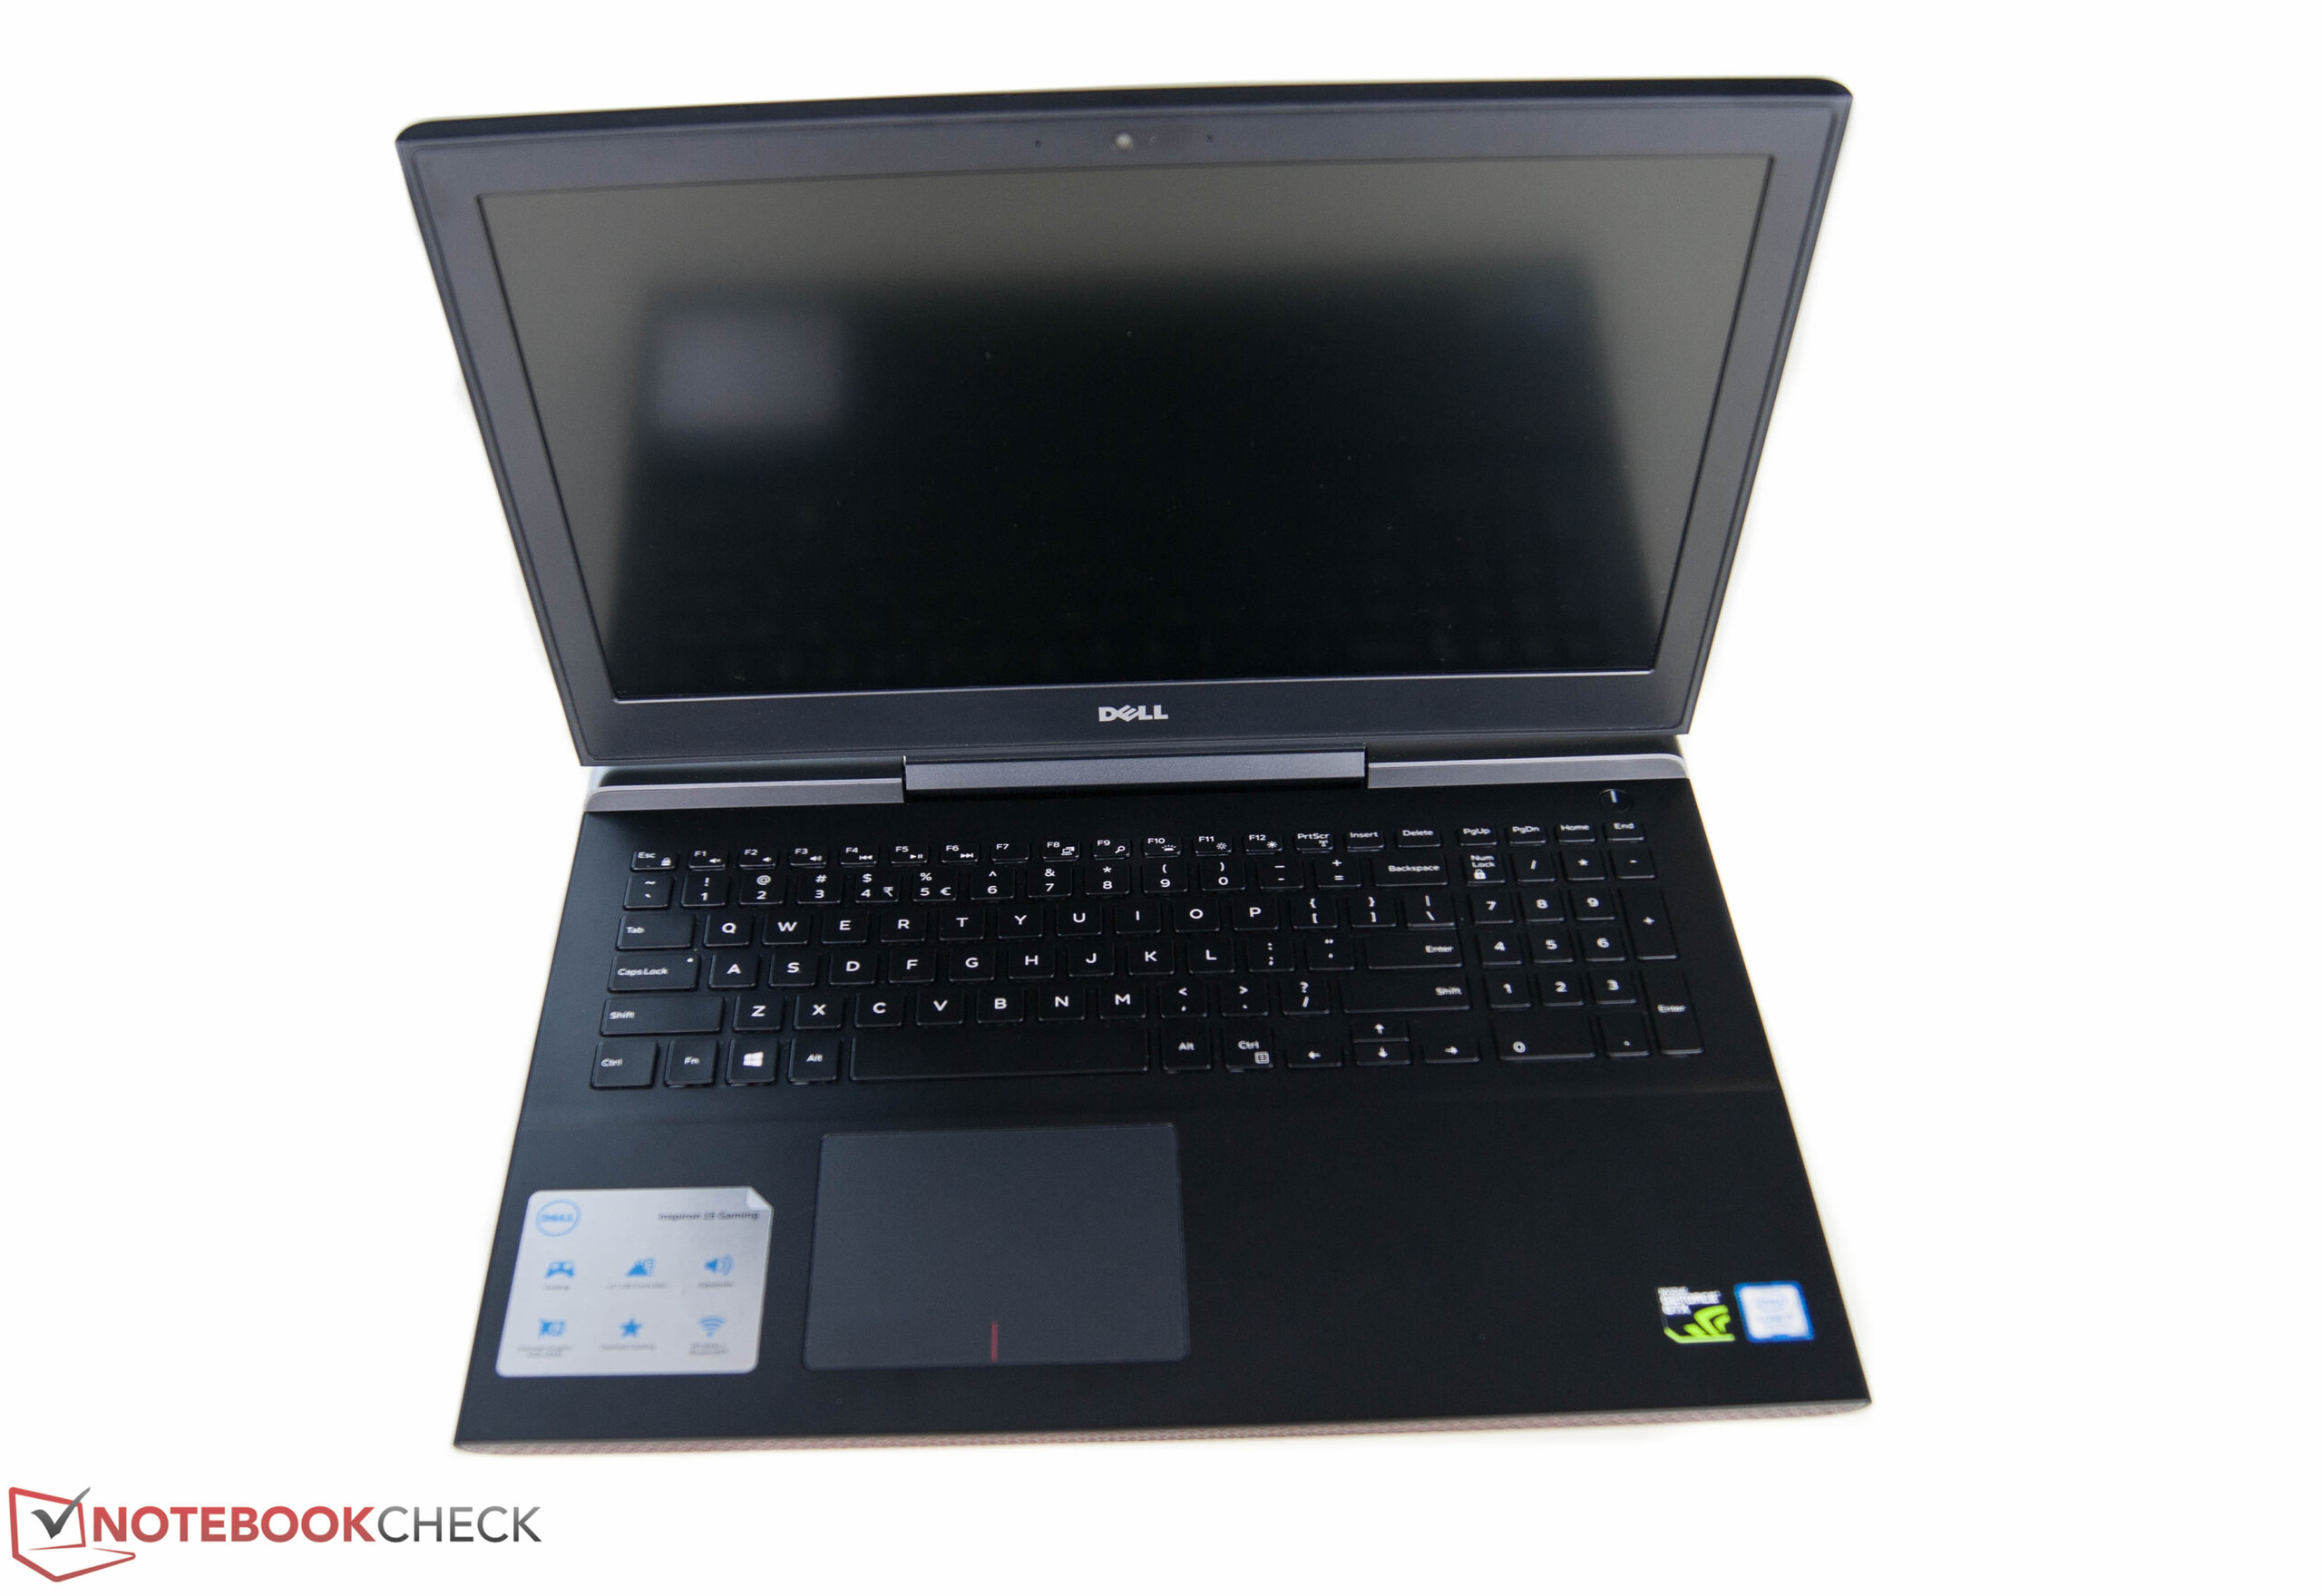
Recensione breve del Portatile Gaming Dell Inspiron 15 7000 7567


| SD Card Reader | |
| average JPG Copy Test (av. of 3 runs) | |
| Asus Strix GL502VM-DS74 | |
| Dell Inspiron 15 7559 | |
| MSI GE72 7RE-046 | |
| Acer Aspire VX5-591G-D0DD | |
| Dell Inspiron 15 7000 7567 | |
| maximum AS SSD Seq Read Test (1GB) | |
| Asus Strix GL502VM-DS74 | |
| Dell Inspiron 15 7559 | |
| Acer Aspire VX5-591G-D0DD | |
| MSI GE72 7RE-046 | |
| Dell Inspiron 15 7000 7567 | |
| Networking | |
| iperf3 transmit AX12 | |
| Acer Aspire VX5-591G-D0DD | |
| Asus Strix GL502VM-DS74 | |
| Dell Inspiron 15 7000 7567 (jseb) | |
| MSI GE72 7RE-046 | |
| iperf3 receive AX12 | |
| Acer Aspire VX5-591G-D0DD | |
| MSI GE72 7RE-046 | |
| Asus Strix GL502VM-DS74 | |
| Dell Inspiron 15 7000 7567 (jseb) | |
| |||||||||||||||||||||||||
Distribuzione della luminosità: 75 %
Al centro con la batteria: 286 cd/m²
Contrasto: 447:1 (Nero: 0.55 cd/m²)
ΔE ColorChecker Calman: 10.97 | ∀{0.5-29.43 Ø4.72}
ΔE Greyscale Calman: 14.25 | ∀{0.09-98 Ø4.97}
55% sRGB (Argyll 1.6.3 3D)
35% AdobeRGB 1998 (Argyll 1.6.3 3D)
37.62% AdobeRGB 1998 (Argyll 3D)
54.9% sRGB (Argyll 3D)
36.42% Display P3 (Argyll 3D)
Gamma: 1.83
CCT: 11200 K
| Dell Inspiron 15 7000 7567 AU Optronics AUO38ED B156HTN 28H80, , 1920x1080, 15.6" | MSI GE72 7RE-046 N173HHE-G32 (CMN1747), , 1920x1080, 17.3" | Dell Inspiron 15 7559 LG Philips LGD04D9 / 156UD2 / Dell P/N: 53FC4, , 3840x2160, 15.6" | Asus Strix GL502VM-DS74 1920x1080, 15.6" | |
|---|---|---|---|---|
| Display | 119% | 70% | 66% | |
| Display P3 Coverage (%) | 36.42 | 90.7 149% | 63.4 74% | 64.8 78% |
| sRGB Coverage (%) | 54.9 | 99.9 82% | 90 64% | 84.9 55% |
| AdobeRGB 1998 Coverage (%) | 37.62 | 85.2 126% | 64.6 72% | 62 65% |
| Response Times | 50% | 20% | -4% | |
| Response Time Grey 50% / Grey 80% * (ms) | 36 ? | 27 ? 25% | 32 ? 11% | 42 ? -17% |
| Response Time Black / White * (ms) | 36 ? | 9 ? 75% | 26 ? 28% | 32.8 ? 9% |
| PWM Frequency (Hz) | ||||
| Screen | 57% | 26% | 52% | |
| Brightness middle (cd/m²) | 246 | 253 3% | 276 12% | 307.8 25% |
| Brightness (cd/m²) | 235 | 230 -2% | 273 16% | 301 28% |
| Brightness Distribution (%) | 75 | 86 15% | 85 13% | 88 17% |
| Black Level * (cd/m²) | 0.55 | 0.24 56% | 0.78 -42% | 0.33 40% |
| Contrast (:1) | 447 | 1054 136% | 354 -21% | 933 109% |
| Colorchecker dE 2000 * | 10.97 | 5.01 54% | 4.05 63% | 4.5 59% |
| Greyscale dE 2000 * | 14.25 | 7.26 49% | 4.68 67% | 2.9 80% |
| Gamma | 1.83 120% | 2.09 105% | 2.55 86% | 2.22 99% |
| CCT | 11200 58% | 6329 103% | 6871 95% | 1136 572% |
| Color Space (Percent of AdobeRGB 1998) (%) | 35 | 76 117% | 58 66% | 55.4 58% |
| Color Space (Percent of sRGB) (%) | 55 | 100 82% | 90 64% | 84.8 54% |
| Colorchecker dE 2000 max. * | 10.4 | 10 | ||
| Media totale (Programma / Settaggio) | 75% /
69% | 39% /
35% | 38% /
47% |
* ... Meglio usare valori piccoli
Tempi di risposta del Display
| ↔ Tempi di risposta dal Nero al Bianco | ||
|---|---|---|
| 36 ms ... aumenta ↗ e diminuisce ↘ combinato | ↗ 19 ms Incremento | 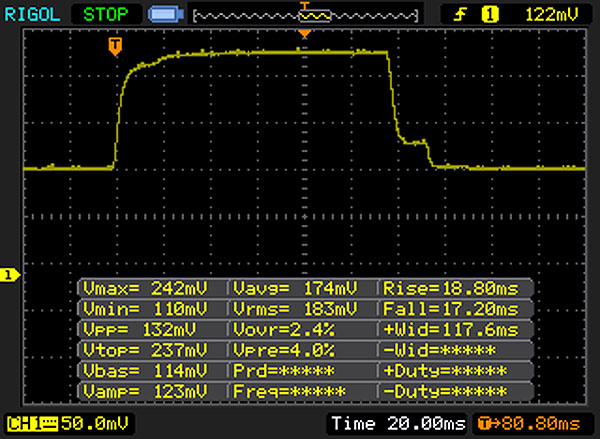 |
| ↘ 17 ms Calo | ||
| Lo schermo mostra tempi di risposta lenti nei nostri tests e sarà insoddisfacente per i gamers. In confronto, tutti i dispositivi di test variano da 0.1 (minimo) a 240 (massimo) ms. » 94 % di tutti i dispositivi è migliore. Questo significa che i tempi di risposta rilevati sono peggiori rispetto alla media di tutti i dispositivi testati (19.8 ms). | ||
| ↔ Tempo di risposta dal 50% Grigio all'80% Grigio | ||
| 36 ms ... aumenta ↗ e diminuisce ↘ combinato | ↗ 17 ms Incremento | 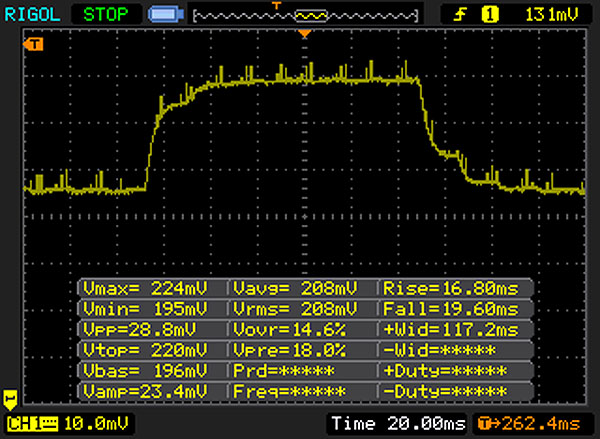 |
| ↘ 19 ms Calo | ||
| Lo schermo mostra tempi di risposta lenti nei nostri tests e sarà insoddisfacente per i gamers. In confronto, tutti i dispositivi di test variano da 0.165 (minimo) a 636 (massimo) ms. » 50 % di tutti i dispositivi è migliore. Questo significa che i tempi di risposta rilevati sono peggiori rispetto alla media di tutti i dispositivi testati (31 ms). | ||
Sfarfallio dello schermo / PWM (Pulse-Width Modulation)
| flickering dello schermo / PWM non rilevato | ||
In confronto: 52 % di tutti i dispositivi testati non utilizza PWM per ridurre la luminosita' del display. Se è rilevato PWM, una media di 7778 (minimo: 5 - massimo: 343500) Hz è stata rilevata. | ||
| PCMark 8 Home Score Accelerated v2 | 3850 punti | |
| PCMark 8 Work Score Accelerated v2 | 5068 punti | |
Aiuto | ||
| Dell Inspiron 15 7000 7567 Intel SSDSCKKF256H6 | MSI GE72 7RE-046 Toshiba HG6 THNSNJ256G8NY | Dell Inspiron 15 7559 SK hynix SC300 M.2 | Asus Strix GL502VM-DS74 Samsung SSD 960 Evo 250GB m.2 NVMe | Acer Aspire VX5-591G-D0DD SK Hynix Canvas SC300 512GB M.2 (HFS512G39MND) | |
|---|---|---|---|---|---|
| CrystalDiskMark 3.0 | 19% | -11% | 171% | 3% | |
| Read Seq (MB/s) | 485.8 | 540 11% | 489.9 1% | 1747 260% | 494.2 2% |
| Write Seq (MB/s) | 422.8 | 495.7 17% | 205.1 -51% | 1477 249% | 449.6 6% |
| Read 512 (MB/s) | 338.9 | 455.1 34% | 354.3 5% | 863 155% | 348.1 3% |
| Write 512 (MB/s) | 304 | 481.4 58% | 211.5 -30% | 1115 267% | 418.2 38% |
| Read 4k (MB/s) | 27.11 | 22.7 -16% | 27.84 3% | 56.8 110% | 16.97 -37% |
| Write 4k (MB/s) | 85.4 | 112.9 32% | 68 -20% | 152.4 78% | 38.36 -55% |
| Read 4k QD32 (MB/s) | 279.6 | 372.5 33% | 348.2 25% | 652 133% | 394.9 41% |
| Write 4k QD32 (MB/s) | 255.1 | 212.9 -17% | 198.4 -22% | 542 112% | 317.4 24% |

| 3DMark 11 Performance | 8992 punti | |
| 3DMark Cloud Gate Standard Score | 21998 punti | |
| 3DMark Fire Strike Score | 6709 punti | |
Aiuto | ||
| Rise of the Tomb Raider | |
| 1920x1080 High Preset AA:FX AF:4x | |
| Asus Strix GL502VT-DS74 | |
| MSI GE72 7RE-046 | |
| Acer Aspire VX5-591G-D0DD | |
| Dell Inspiron 15 7000 7567 | |
| MSI GL62M 7RD-077 | |
| Asus Strix GL753VD-GC045T | |
| 1920x1080 Very High Preset AA:FX AF:16x | |
| Asus Strix GL502VM-DS74 | |
| Asus Strix GL502VT-DS74 | |
| MSI GE72 7RE-046 | |
| Acer Aspire VX5-591G-D0DD | |
| Dell Inspiron 15 7000 7567 | |
| MSI GL62M 7RD-077 | |
| Asus Strix GL753VD-GC045T | |
| BioShock Infinite | |
| 1366x768 High Preset | |
| MSI GL62M 7RD-077 | |
| Dell Inspiron 15 7000 7567 | |
| Asus Strix GL502VT-DS74 | |
| Dell Inspiron 15 7559 | |
| Lenovo IdeaPad Z50-75 | |
| 1920x1080 Ultra Preset, DX11 (DDOF) | |
| Asus Strix GL502VM-DS74 | |
| Dell Inspiron 15 7000 7567 | |
| Asus Strix GL502VT-DS74 | |
| MSI GL62M 7RD-077 | |
| Dell Inspiron 15 7559 | |
| Lenovo IdeaPad Z50-75 | |
| Titanfall 2 | |
| 1920x1080 High / Enabled AA:TS AF:8x | |
| Dell Inspiron 15 7000 7567 | |
| Acer Aspire VX5-591G-D0DD | |
| MSI GE72 7RE-046 | |
| Asus Strix GL753VD-GC045T | |
| MSI GL62M 7RD-077 | |
| Dell XPS 15 2017 9560 (7300HQ, Full-HD) | |
| 1920x1080 Very High (Insane Texture Quality) / Enabled AA:TS AF:16x | |
| Dell Inspiron 15 7000 7567 | |
| Acer Aspire VX5-591G-D0DD | |
| Asus Strix GL753VD-GC045T | |
| MSI GE72 7RE-046 | |
| Dell XPS 15 2017 9560 (7300HQ, Full-HD) | |
| MSI GL62M 7RD-077 | |
| basso | medio | alto | ultra | |
|---|---|---|---|---|
| BioShock Infinite (2013) | 182.1 | 154.1 | 147 | 72.8 |
| GTA V (2015) | 135 | 118.8 | 60.3 | 36.1 |
| Metal Gear Solid V (2015) | 60 | 60 | 60 | 60 |
| Rise of the Tomb Raider (2016) | 117.5 | 86.6 | 46.6 | 38.3 |
| Doom (2016) | 117 | 105.3 | 69.1 | 67.5 |
| Mafia 3 (2016) | 61.3 | 44.3 | 28.6 | |
| Battlefield 1 (2016) | 114.7 | 99.7 | 56.9 | 51.2 |
| Farming Simulator 17 (2016) | 169.8 | 148.5 | 124.6 | 116 |
| Titanfall 2 (2016) | 143.4 | 131.9 | 75.8 | 66.7 |
| Call of Duty Infinite Warfare (2016) | 113.8 | 102 | 67.8 | 59 |
| Dishonored 2 (2016) | 87.9 | 72.2 | 46.3 | 39.9 |
| Watch Dogs 2 (2016) | 82.5 | 74.3 | 44.5 | 31.4 |
| Resident Evil 7 (2017) | 245.5 | 126.8 | 68.5 | 25.6 |
Rumorosità
| Idle |
| 30.9 / 30.9 / 31 dB(A) |
| HDD |
| 31.2 dB(A) |
| Sotto carico |
| 46.5 / 46.8 dB(A) |
 | ||
30 dB silenzioso 40 dB(A) udibile 50 dB(A) rumoroso |
||
min: | ||
(±) La temperatura massima sul lato superiore è di 43.4 °C / 110 F, rispetto alla media di 40.4 °C / 105 F, che varia da 21.2 a 68.8 °C per questa classe Gaming.
(+) Il lato inferiore si riscalda fino ad un massimo di 37.7 °C / 100 F, rispetto alla media di 43.2 °C / 110 F
(+) In idle, la temperatura media del lato superiore è di 23.1 °C / 74 F, rispetto alla media deld ispositivo di 33.9 °C / 93 F.
(+) I poggiapolsi e il touchpad sono piu' freddi della temperatura della pelle con un massimo di 26.6 °C / 79.9 F e sono quindi freddi al tatto.
(+) La temperatura media della zona del palmo della mano di dispositivi simili e'stata di 28.8 °C / 83.8 F (+2.2 °C / 3.9 F).
Dell Inspiron 15 7000 7567 analisi audio
(±) | potenza degli altiparlanti media ma buona (74 dB)
Bassi 100 - 315 Hz
(±) | bassi ridotti - in media 12.6% inferiori alla media
(±) | la linearità dei bassi è media (13.2% delta rispetto alla precedente frequenza)
Medi 400 - 2000 Hz
(+) | medi bilanciati - solo only 1.8% rispetto alla media
(+) | medi lineari (4.3% delta rispetto alla precedente frequenza)
Alti 2 - 16 kHz
(+) | Alti bilanciati - appena 4% dalla media
(+) | alti lineari (3.9% delta rispetto alla precedente frequenza)
Nel complesso 100 - 16.000 Hz
(+) | suono nel complesso lineare (12% differenza dalla media)
Rispetto alla stessa classe
» 12% di tutti i dispositivi testati in questa classe è stato migliore, 4% simile, 84% peggiore
» Il migliore ha avuto un delta di 6%, medio di 18%, peggiore di 132%
Rispetto a tutti i dispositivi testati
» 9% di tutti i dispositivi testati in questa classe è stato migliore, 2% similare, 88% peggiore
» Il migliore ha avuto un delta di 4%, medio di 24%, peggiore di 134%
Apple MacBook 12 (Early 2016) 1.1 GHz analisi audio
(+) | gli altoparlanti sono relativamente potenti (83.6 dB)
Bassi 100 - 315 Hz
(±) | bassi ridotti - in media 11.3% inferiori alla media
(±) | la linearità dei bassi è media (14.2% delta rispetto alla precedente frequenza)
Medi 400 - 2000 Hz
(+) | medi bilanciati - solo only 2.4% rispetto alla media
(+) | medi lineari (5.5% delta rispetto alla precedente frequenza)
Alti 2 - 16 kHz
(+) | Alti bilanciati - appena 2% dalla media
(+) | alti lineari (4.5% delta rispetto alla precedente frequenza)
Nel complesso 100 - 16.000 Hz
(+) | suono nel complesso lineare (10.2% differenza dalla media)
Rispetto alla stessa classe
» 7% di tutti i dispositivi testati in questa classe è stato migliore, 2% simile, 91% peggiore
» Il migliore ha avuto un delta di 5%, medio di 18%, peggiore di 53%
Rispetto a tutti i dispositivi testati
» 5% di tutti i dispositivi testati in questa classe è stato migliore, 1% similare, 94% peggiore
» Il migliore ha avuto un delta di 4%, medio di 24%, peggiore di 134%
| Off / Standby | |
| Idle | |
| Sotto carico |
|
Leggenda:
min: | |
| Dell Inspiron 15 7000 7567 i7-7700HQ, GeForce GTX 1050 Ti Mobile, Intel SSDSCKKF256H6, TN, 1920x1080, 15.6" | MSI GE72 7RE-046 i7-7700HQ, GeForce GTX 1050 Ti Mobile, Toshiba HG6 THNSNJ256G8NY, TN LED, 1920x1080, 17.3" | Dell Inspiron 15 7559 6700HQ, GeForce GTX 960M, SK hynix SC300 M.2, IPS, 3840x2160, 15.6" | Asus Strix GL502VM-DS74 i7-7700HQ, GeForce GTX 1060 Mobile, Samsung SSD 960 Evo 250GB m.2 NVMe, IPS, 1920x1080, 15.6" | |
|---|---|---|---|---|
| Power Consumption | -124% | -65% | -347% | |
| Idle Minimum * (Watt) | 4.4 | 14 -218% | 9.4 -114% | 38.3 -770% |
| Idle Average * (Watt) | 6.8 | 20 -194% | 14.4 -112% | 40.5 -496% |
| Idle Maximum * (Watt) | 8.3 | 25 -201% | 15 -81% | 42.2 -408% |
| Load Average * (Watt) | 81 | 82 -1% | 102 -26% | 110.4 -36% |
| Load Maximum * (Watt) | 127 | 135 -6% | 120 6% | 155.7 -23% |
* ... Meglio usare valori piccoli
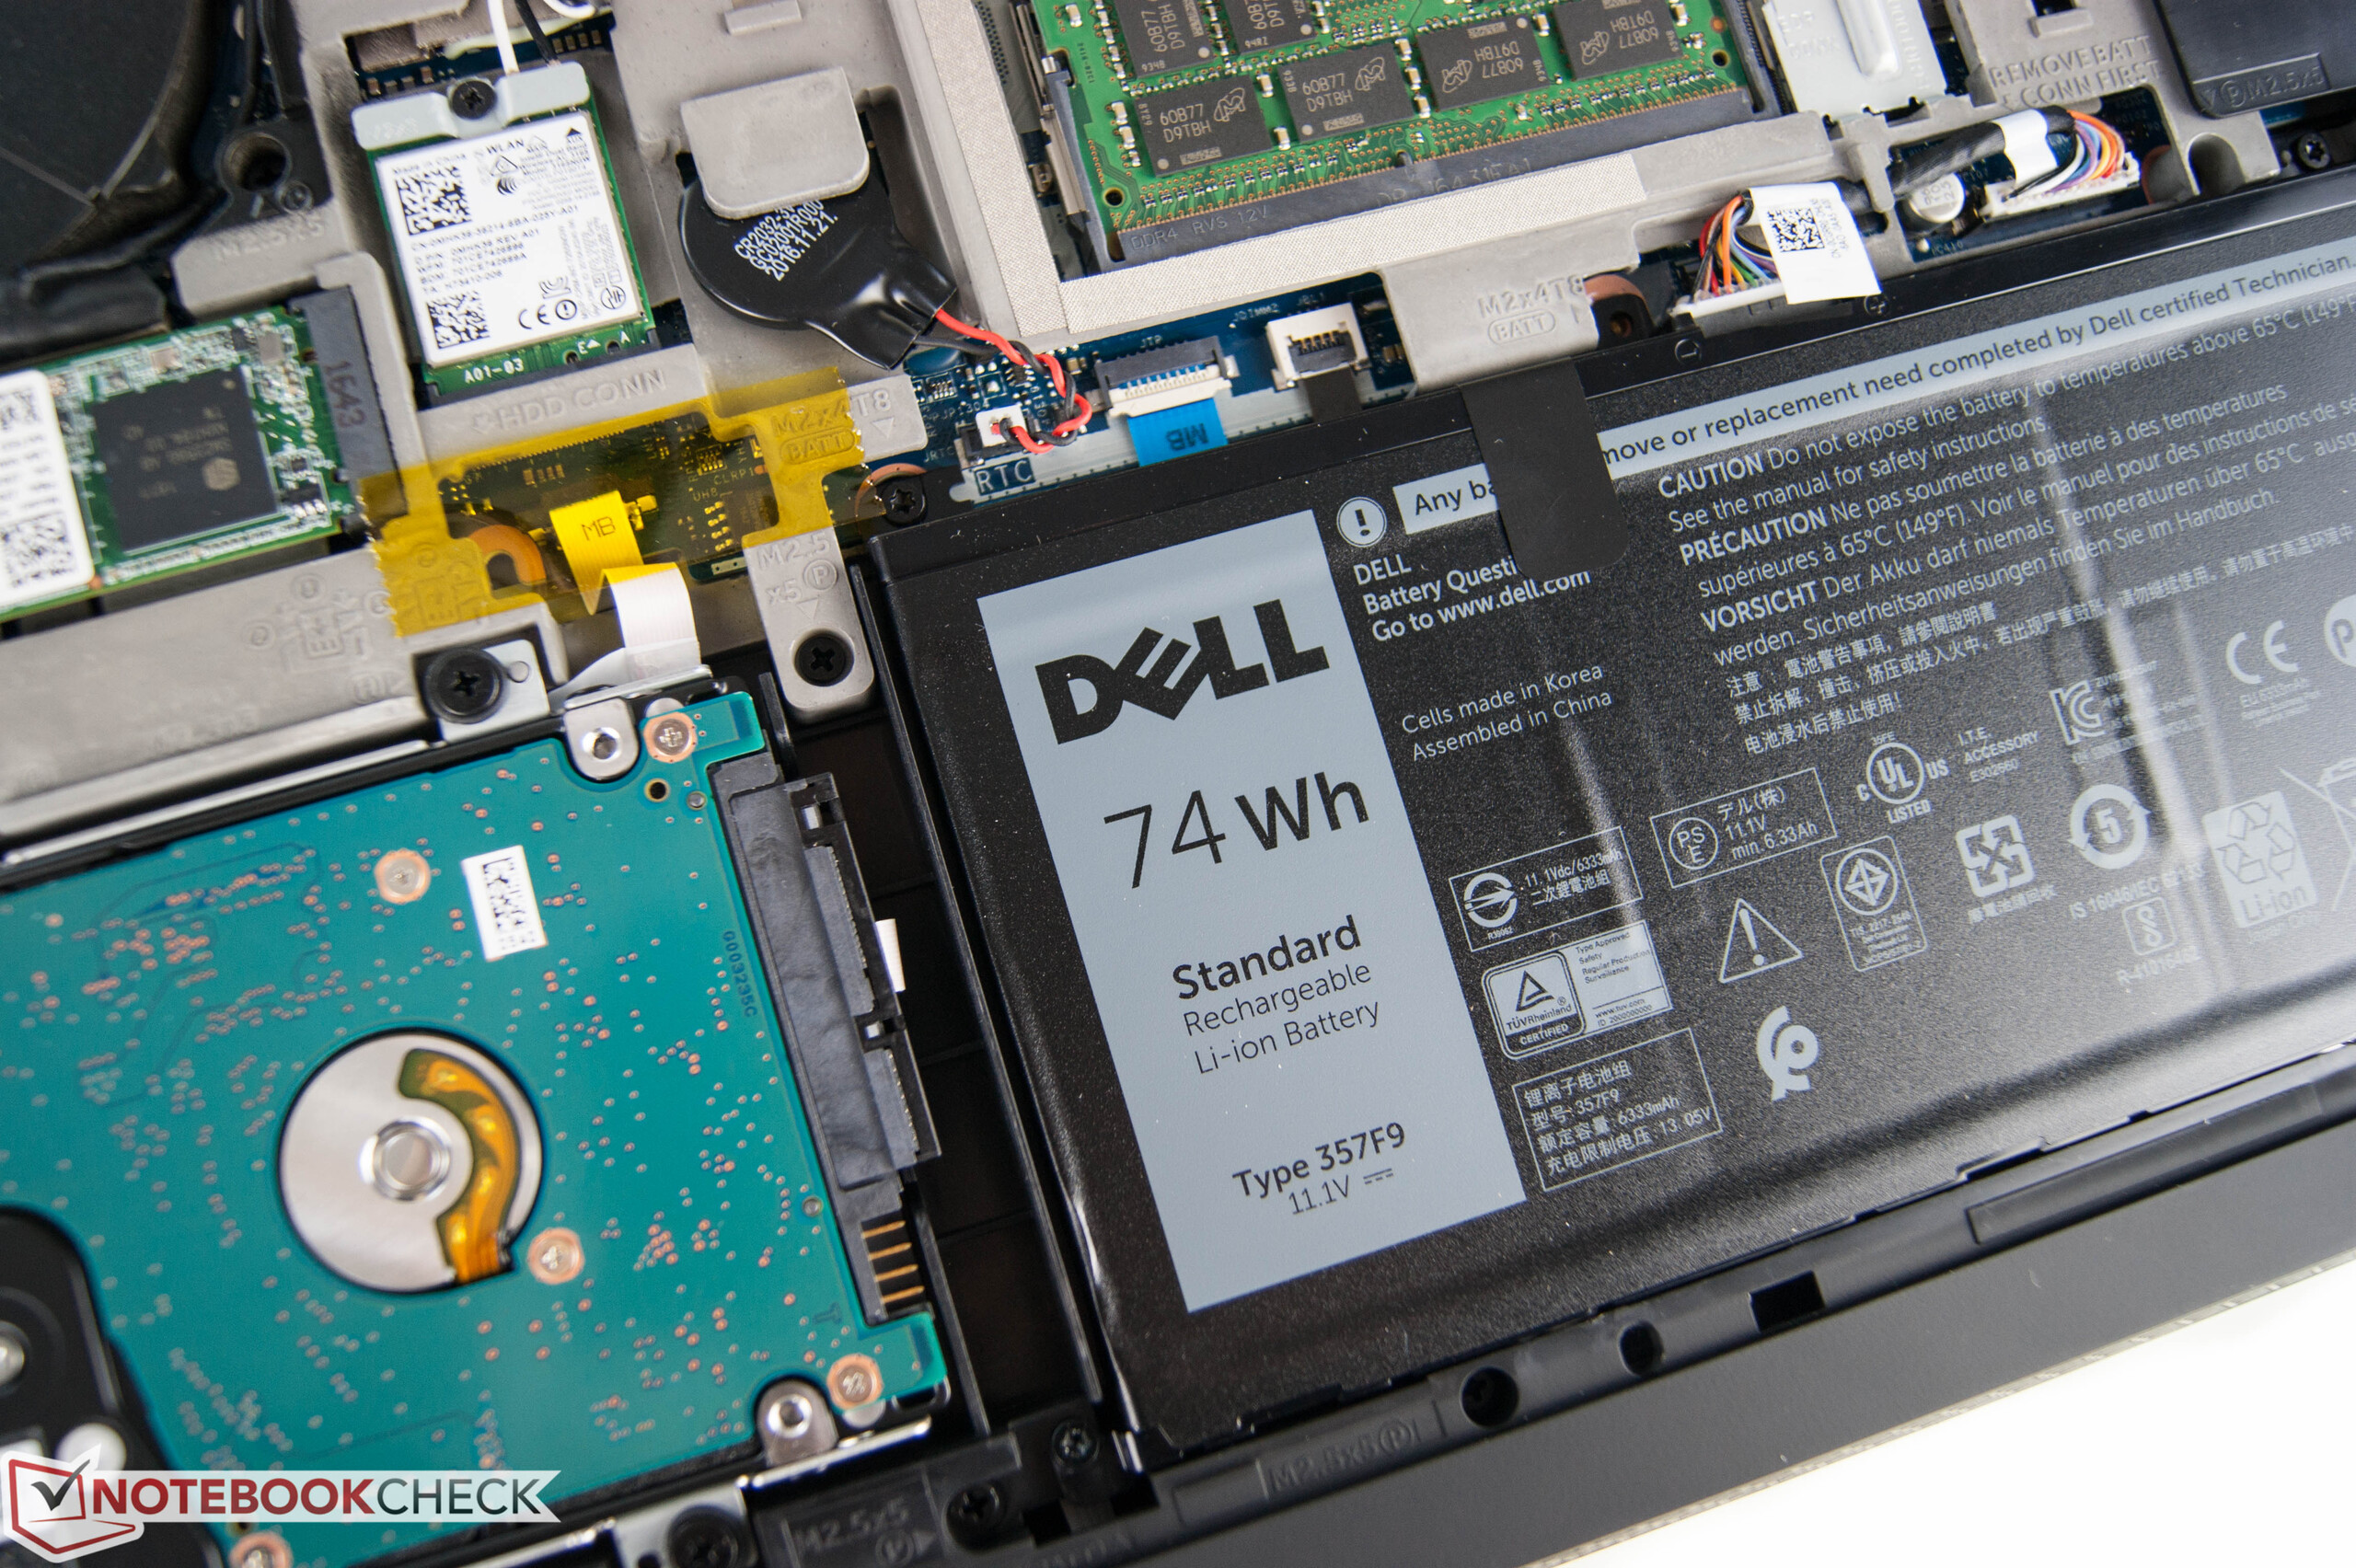
| Dell Inspiron 15 7000 7567 i7-7700HQ, GeForce GTX 1050 Ti Mobile, 74 Wh | MSI GE72 7RE-046 i7-7700HQ, GeForce GTX 1050 Ti Mobile, 51.4 Wh | Dell Inspiron 15 7559 6700HQ, GeForce GTX 960M, 74 Wh | Asus Strix GL502VM-DS74 i7-7700HQ, GeForce GTX 1060 Mobile, 64 Wh | Acer Aspire VX5-591G-D0DD i7-7700HQ, GeForce GTX 1050 Ti Mobile, 52 Wh | |
|---|---|---|---|---|---|
| Autonomia della batteria | -64% | -36% | -69% | -41% | |
| Reader / Idle (h) | 19.6 | 11.8 -40% | 1.7 -91% | ||
| H.264 (h) | 7.6 | 3.3 -57% | |||
| WiFi v1.3 (h) | 10.4 | 3.1 -70% | 3.9 -62% | 1.5 -86% | 6.1 -41% |
| Load (h) | 1.4 | 1.3 -7% | 1 -29% |
Pro
Contro
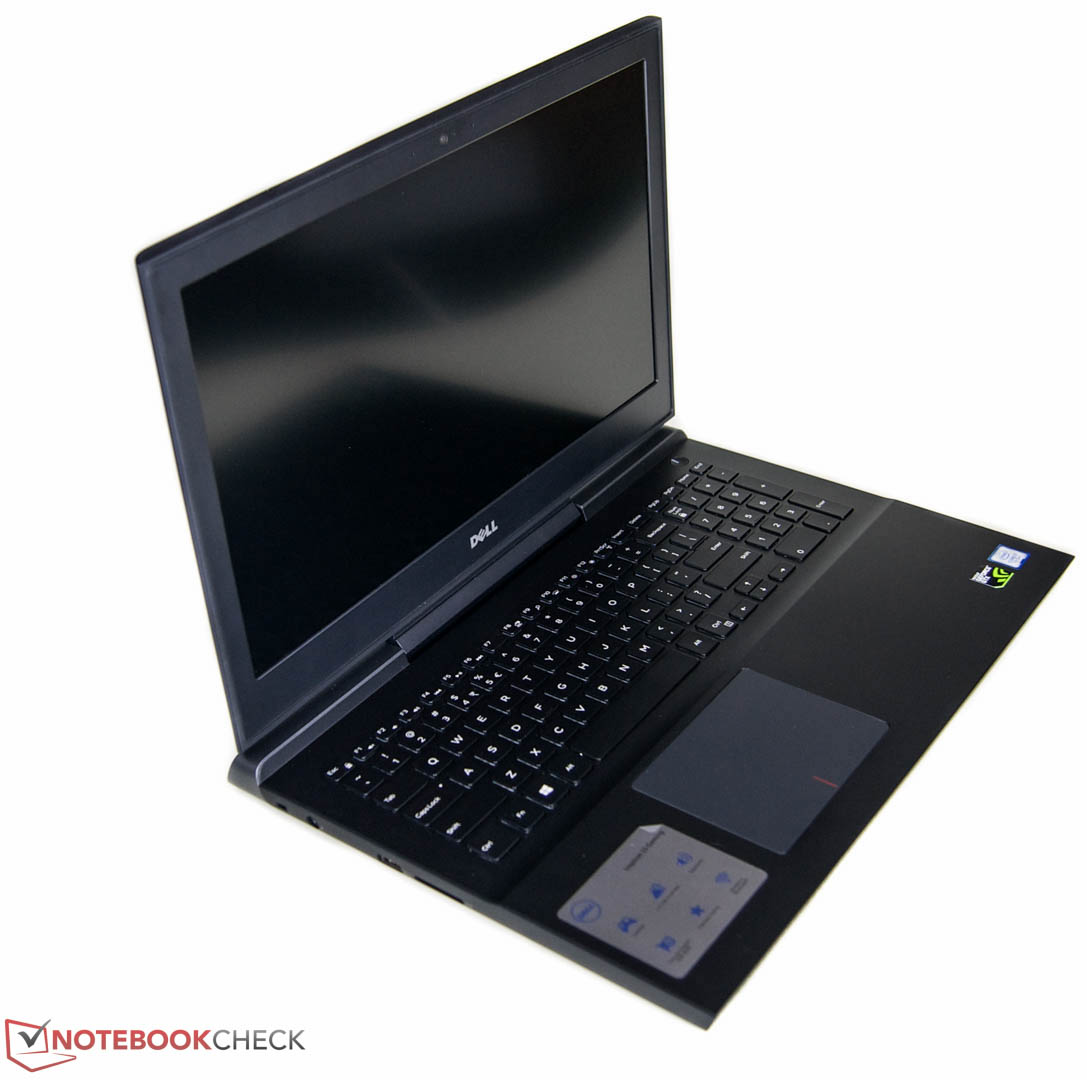
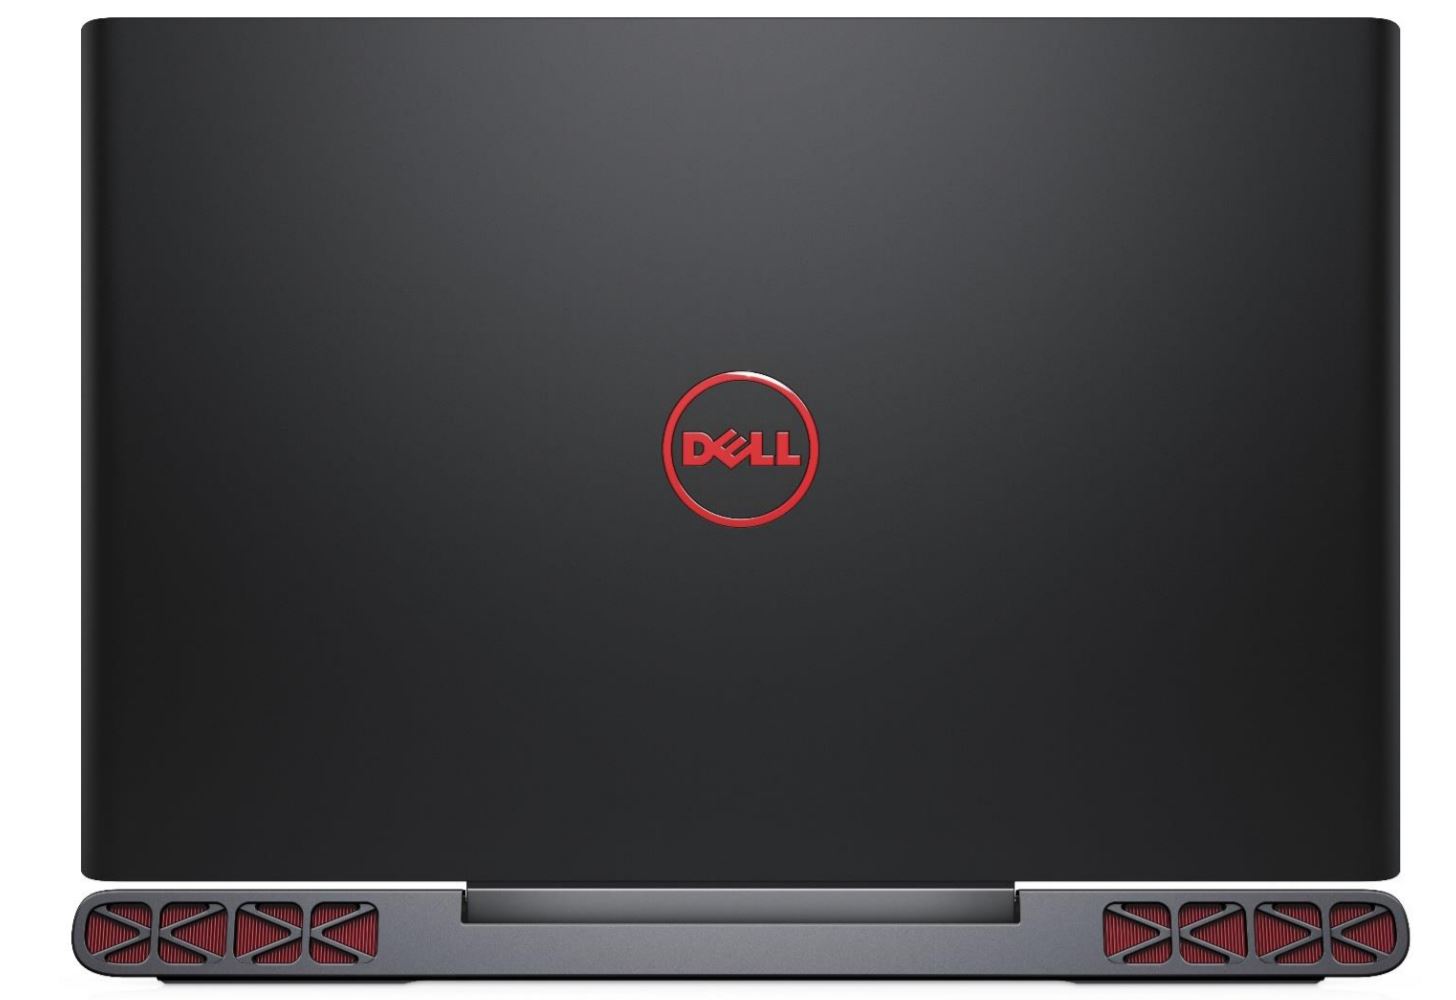
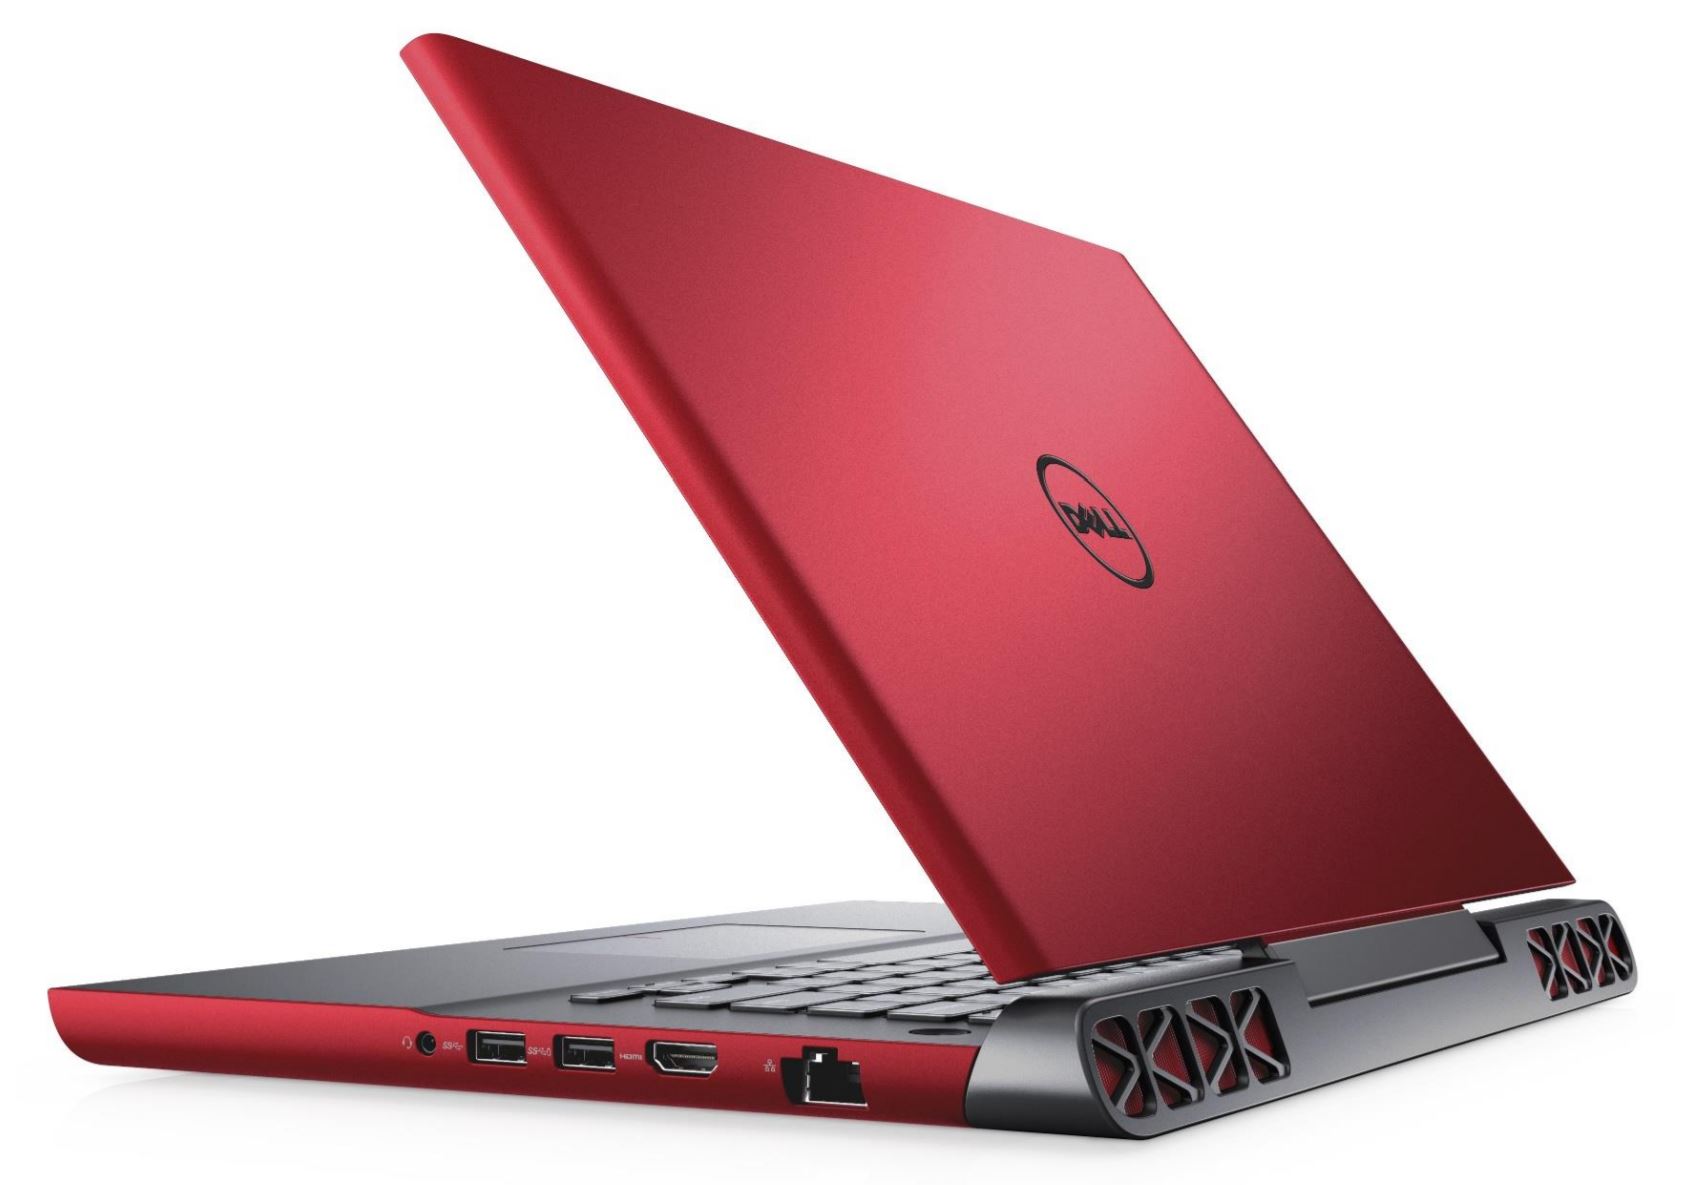
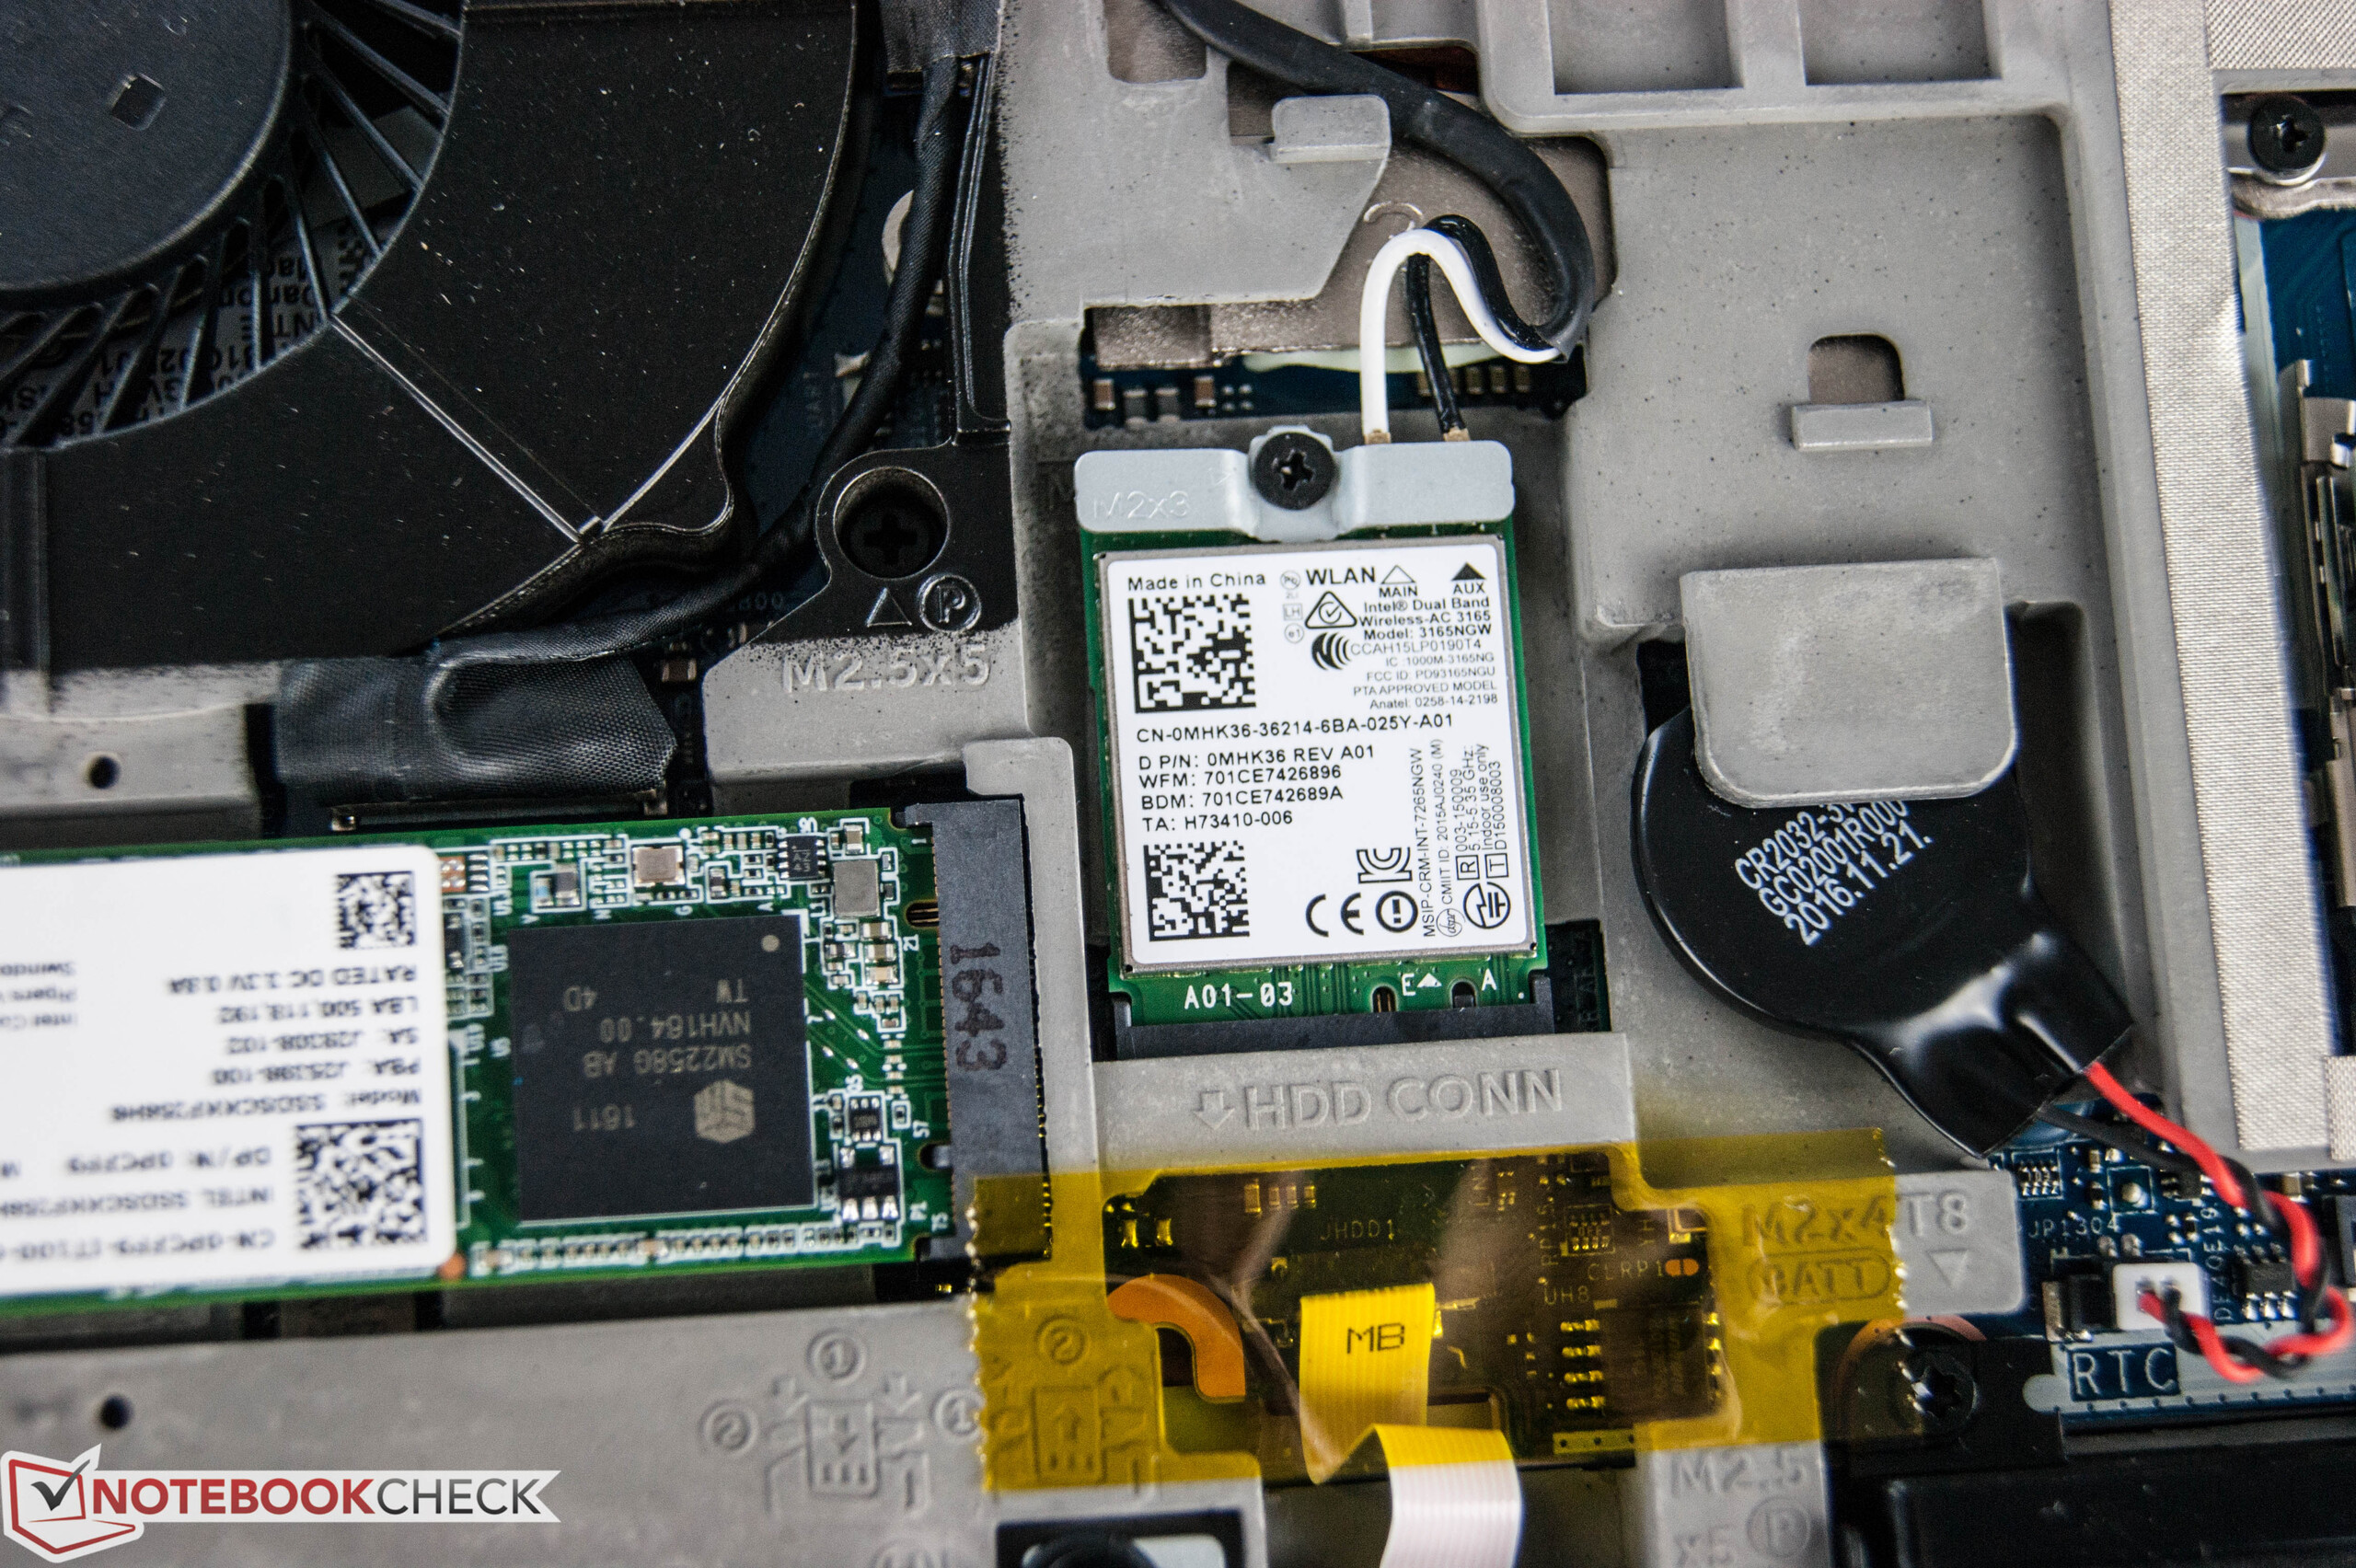
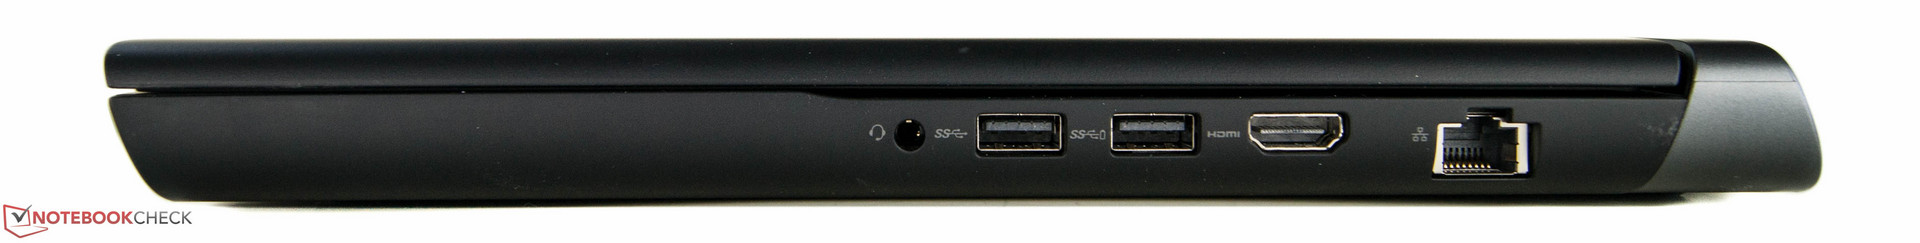
Un portatile gaming per ogni giorno. Il nuovo Dell Inspiron 15 della serie 7000 ha mostrato di avere diritto ad essere nel mondo dei portatili gaming. Prima di tutto, ha un case ben costruito, che consente all'utente la manutenzione. Tuttavia, ci sono poche interfacce per un portatile da 15". In aggiunta, le prestazioni del lettore SD-card sono scarse. In cambio, il produttore ha utilizzato accettabili dispositivi di input. La tastiera ha anche la retroilluminazione e un tastierino numerico resistenti all'acqua. Tuttavia, non abbiamo apprezzato i piccoli tasti direzionali, che sono scomodi soprattutto con i giochi di auto. L'unica vera delusione dell'Inspiron 15 è il pannello TN Full HD, che non solo ha angoli di visuale molto limitati ma anche una evidente tendenza al blu. Dell dovrebbe almeno offrire ai clienti una opzione di display IPS.
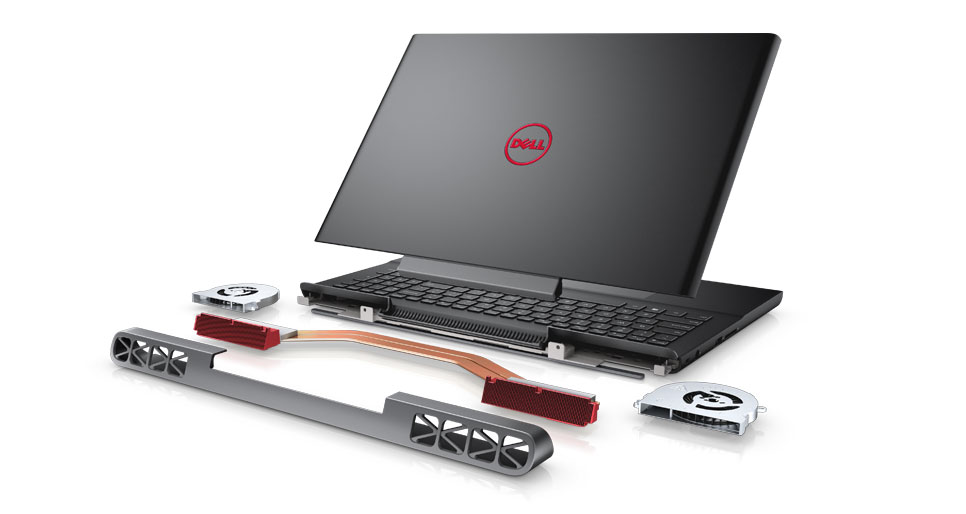
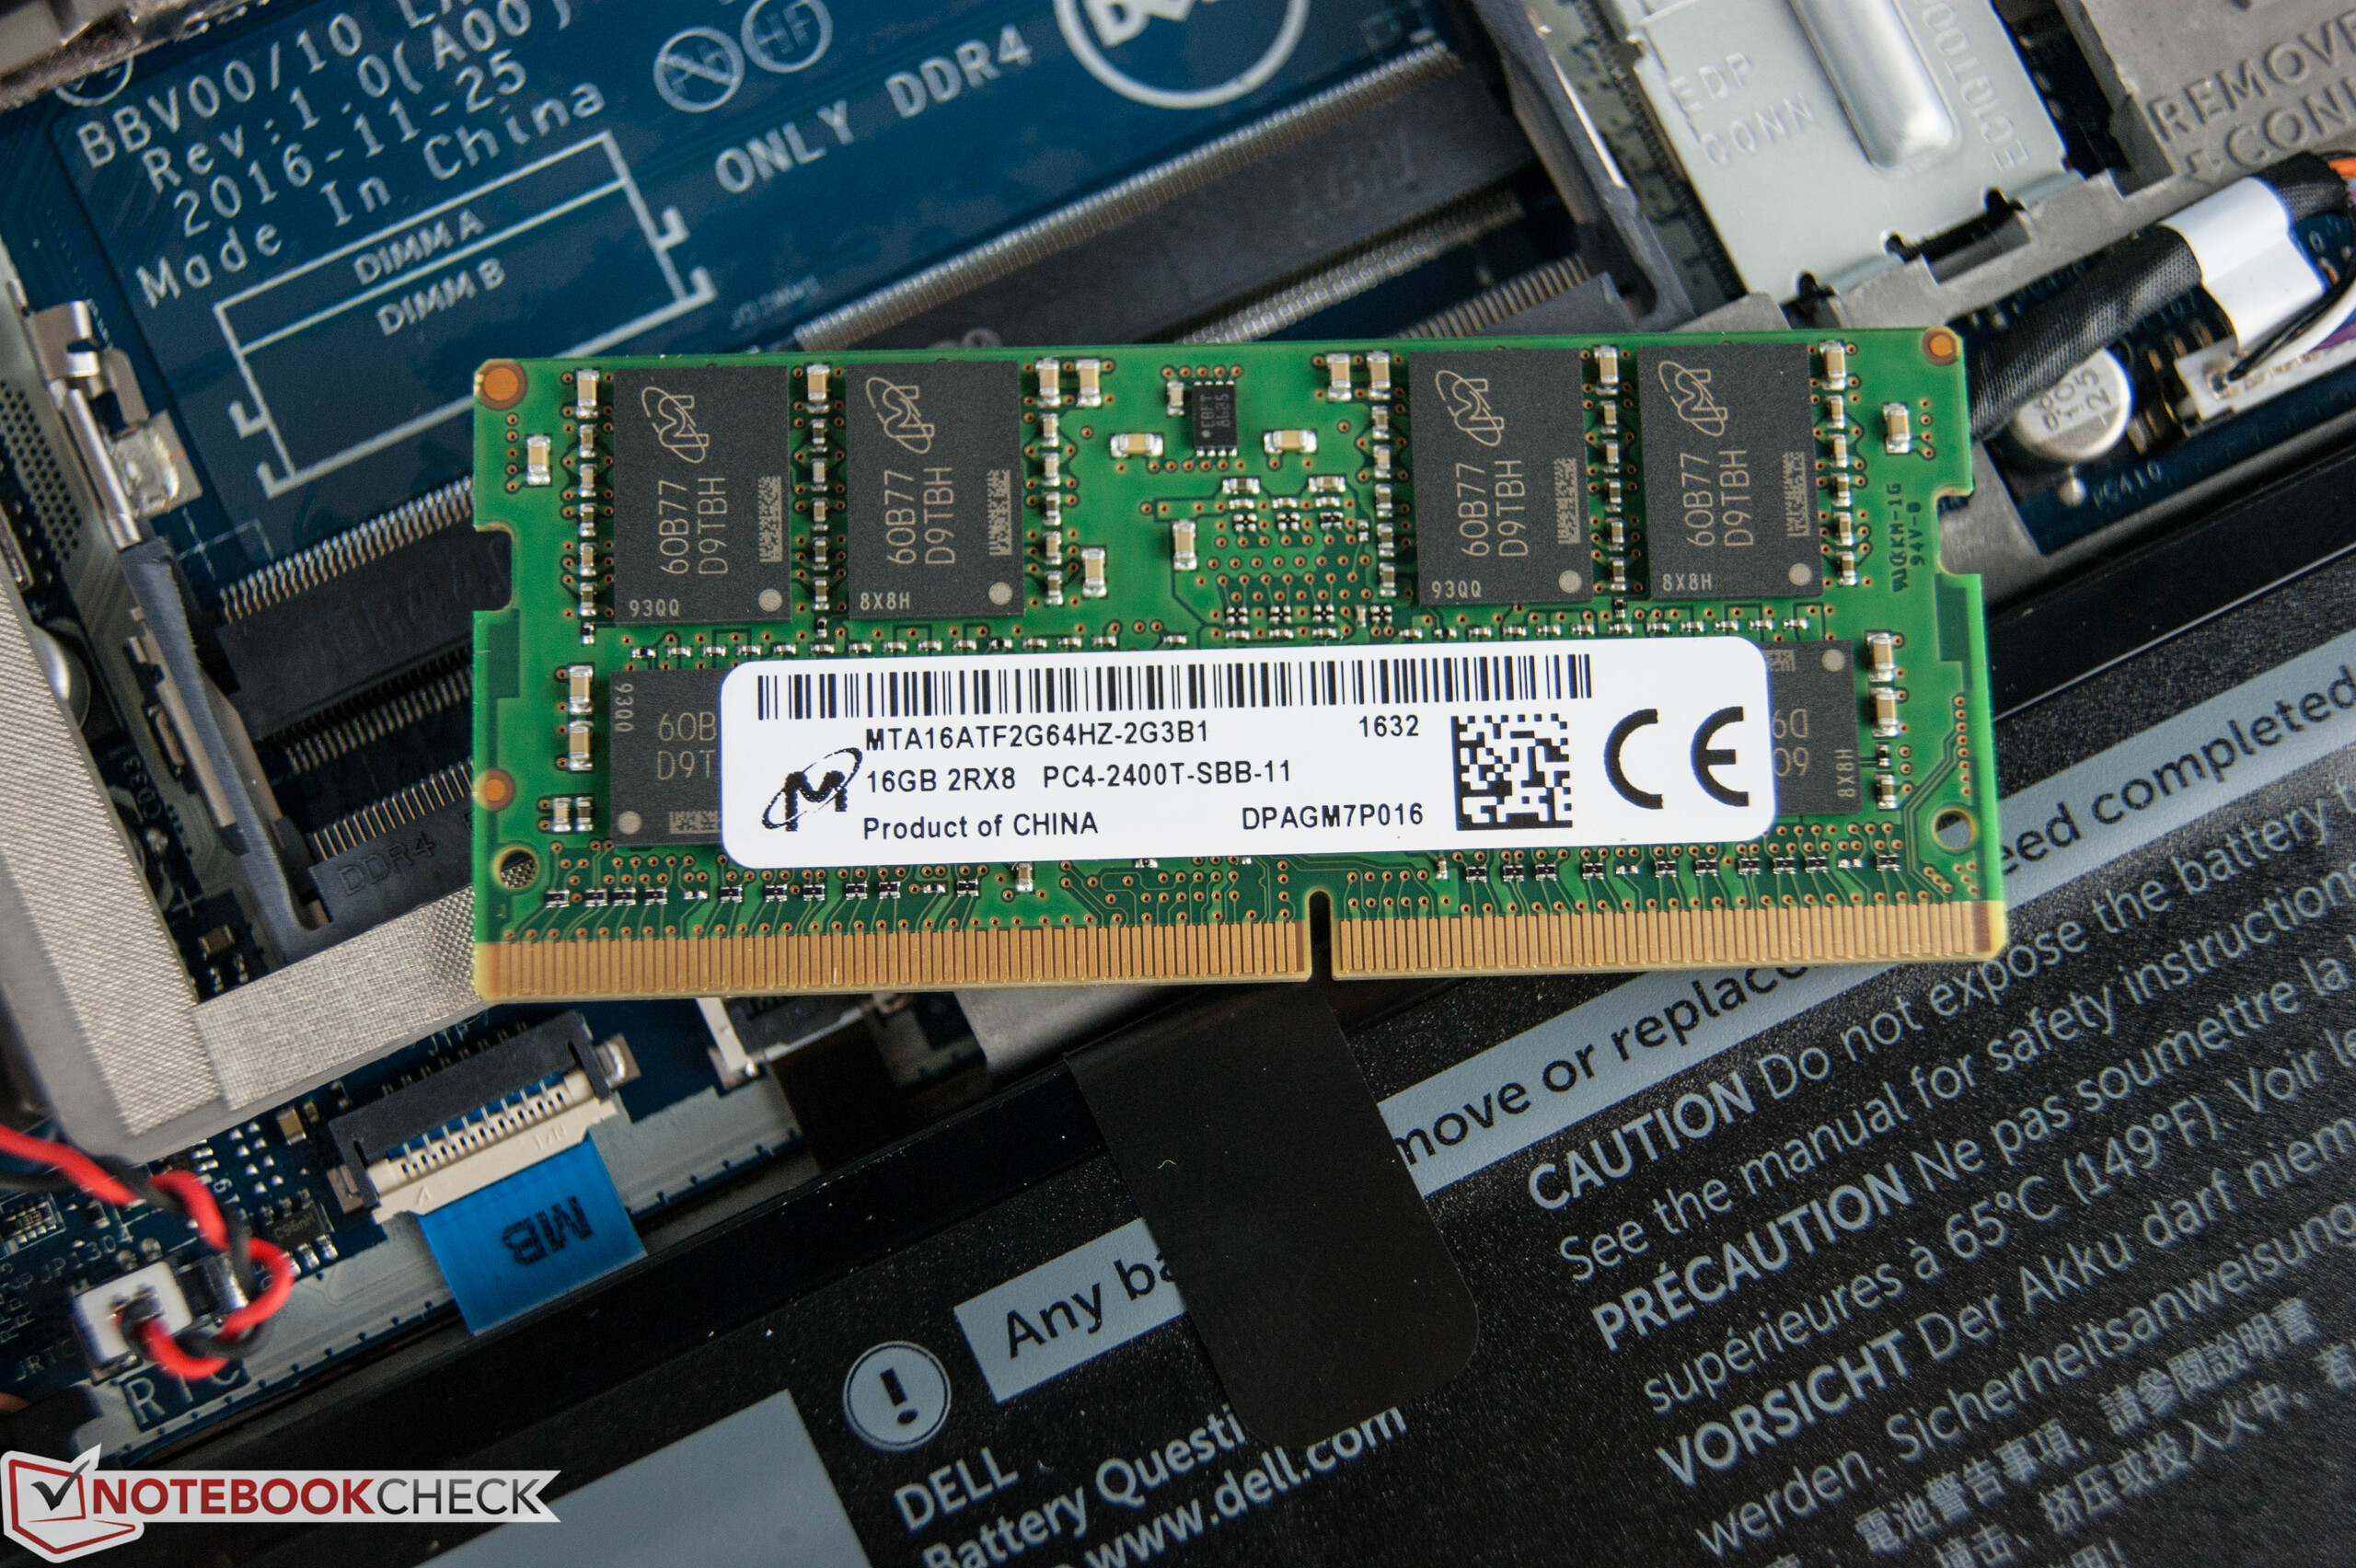
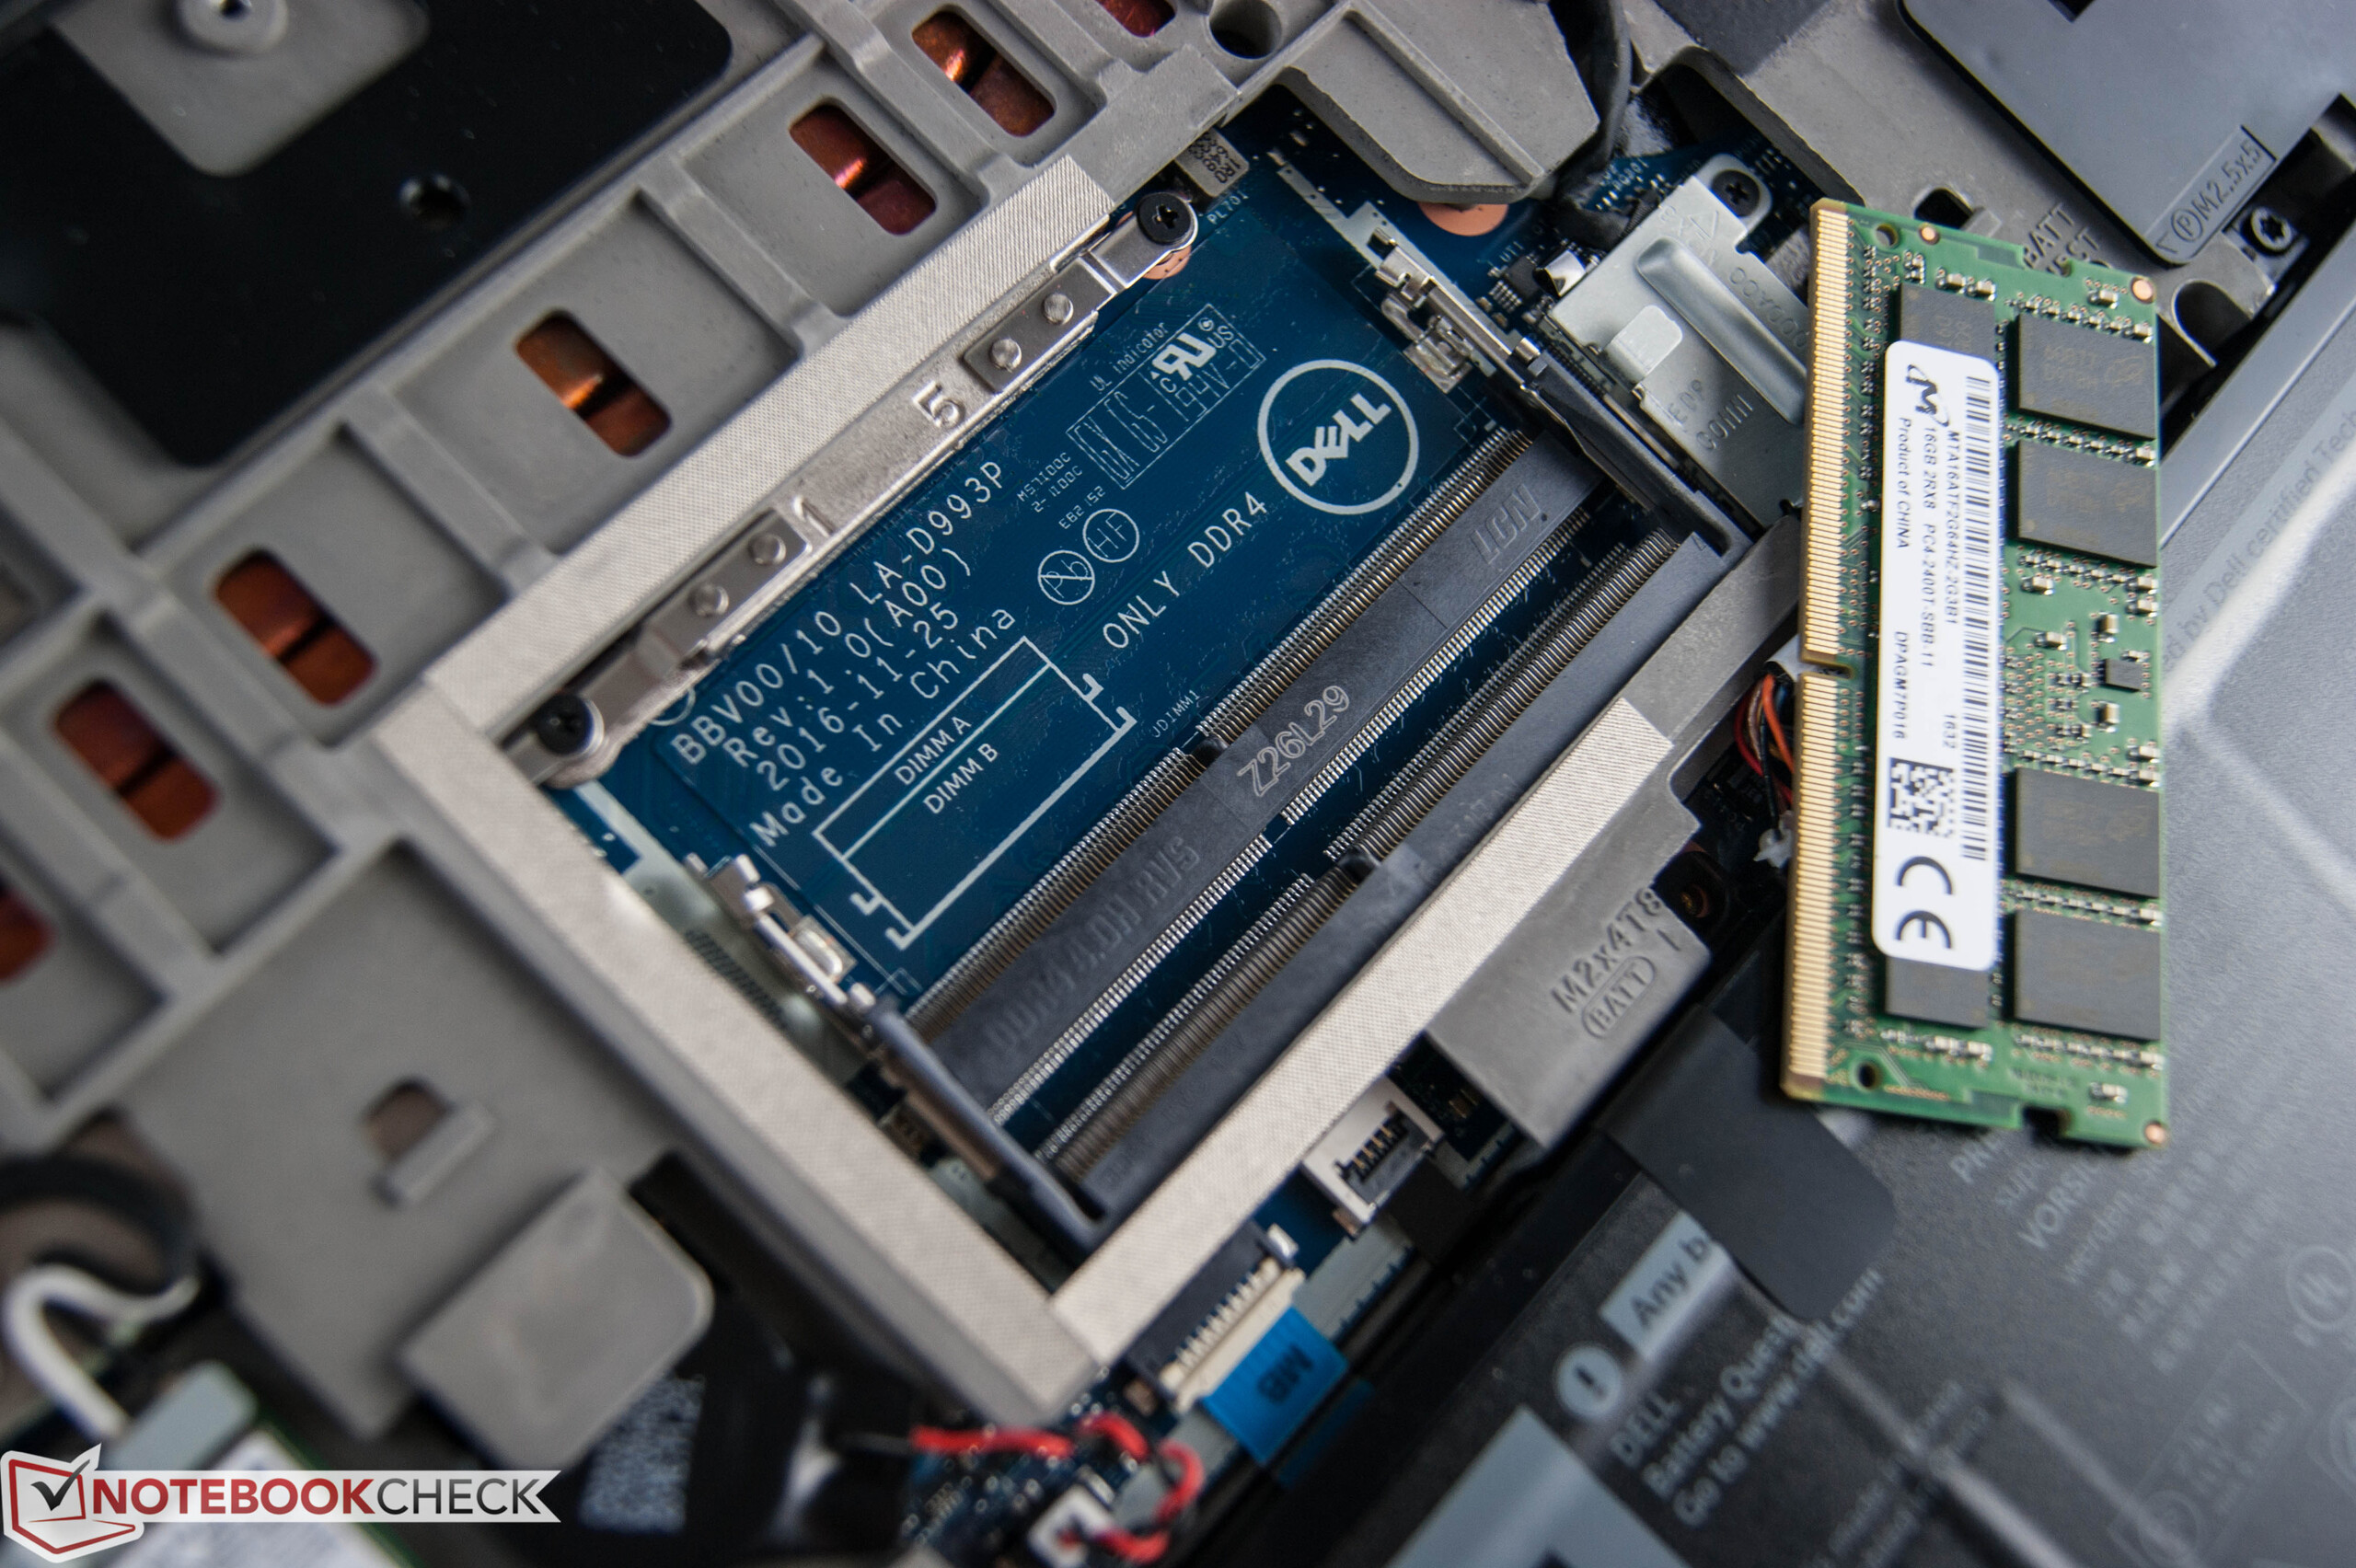
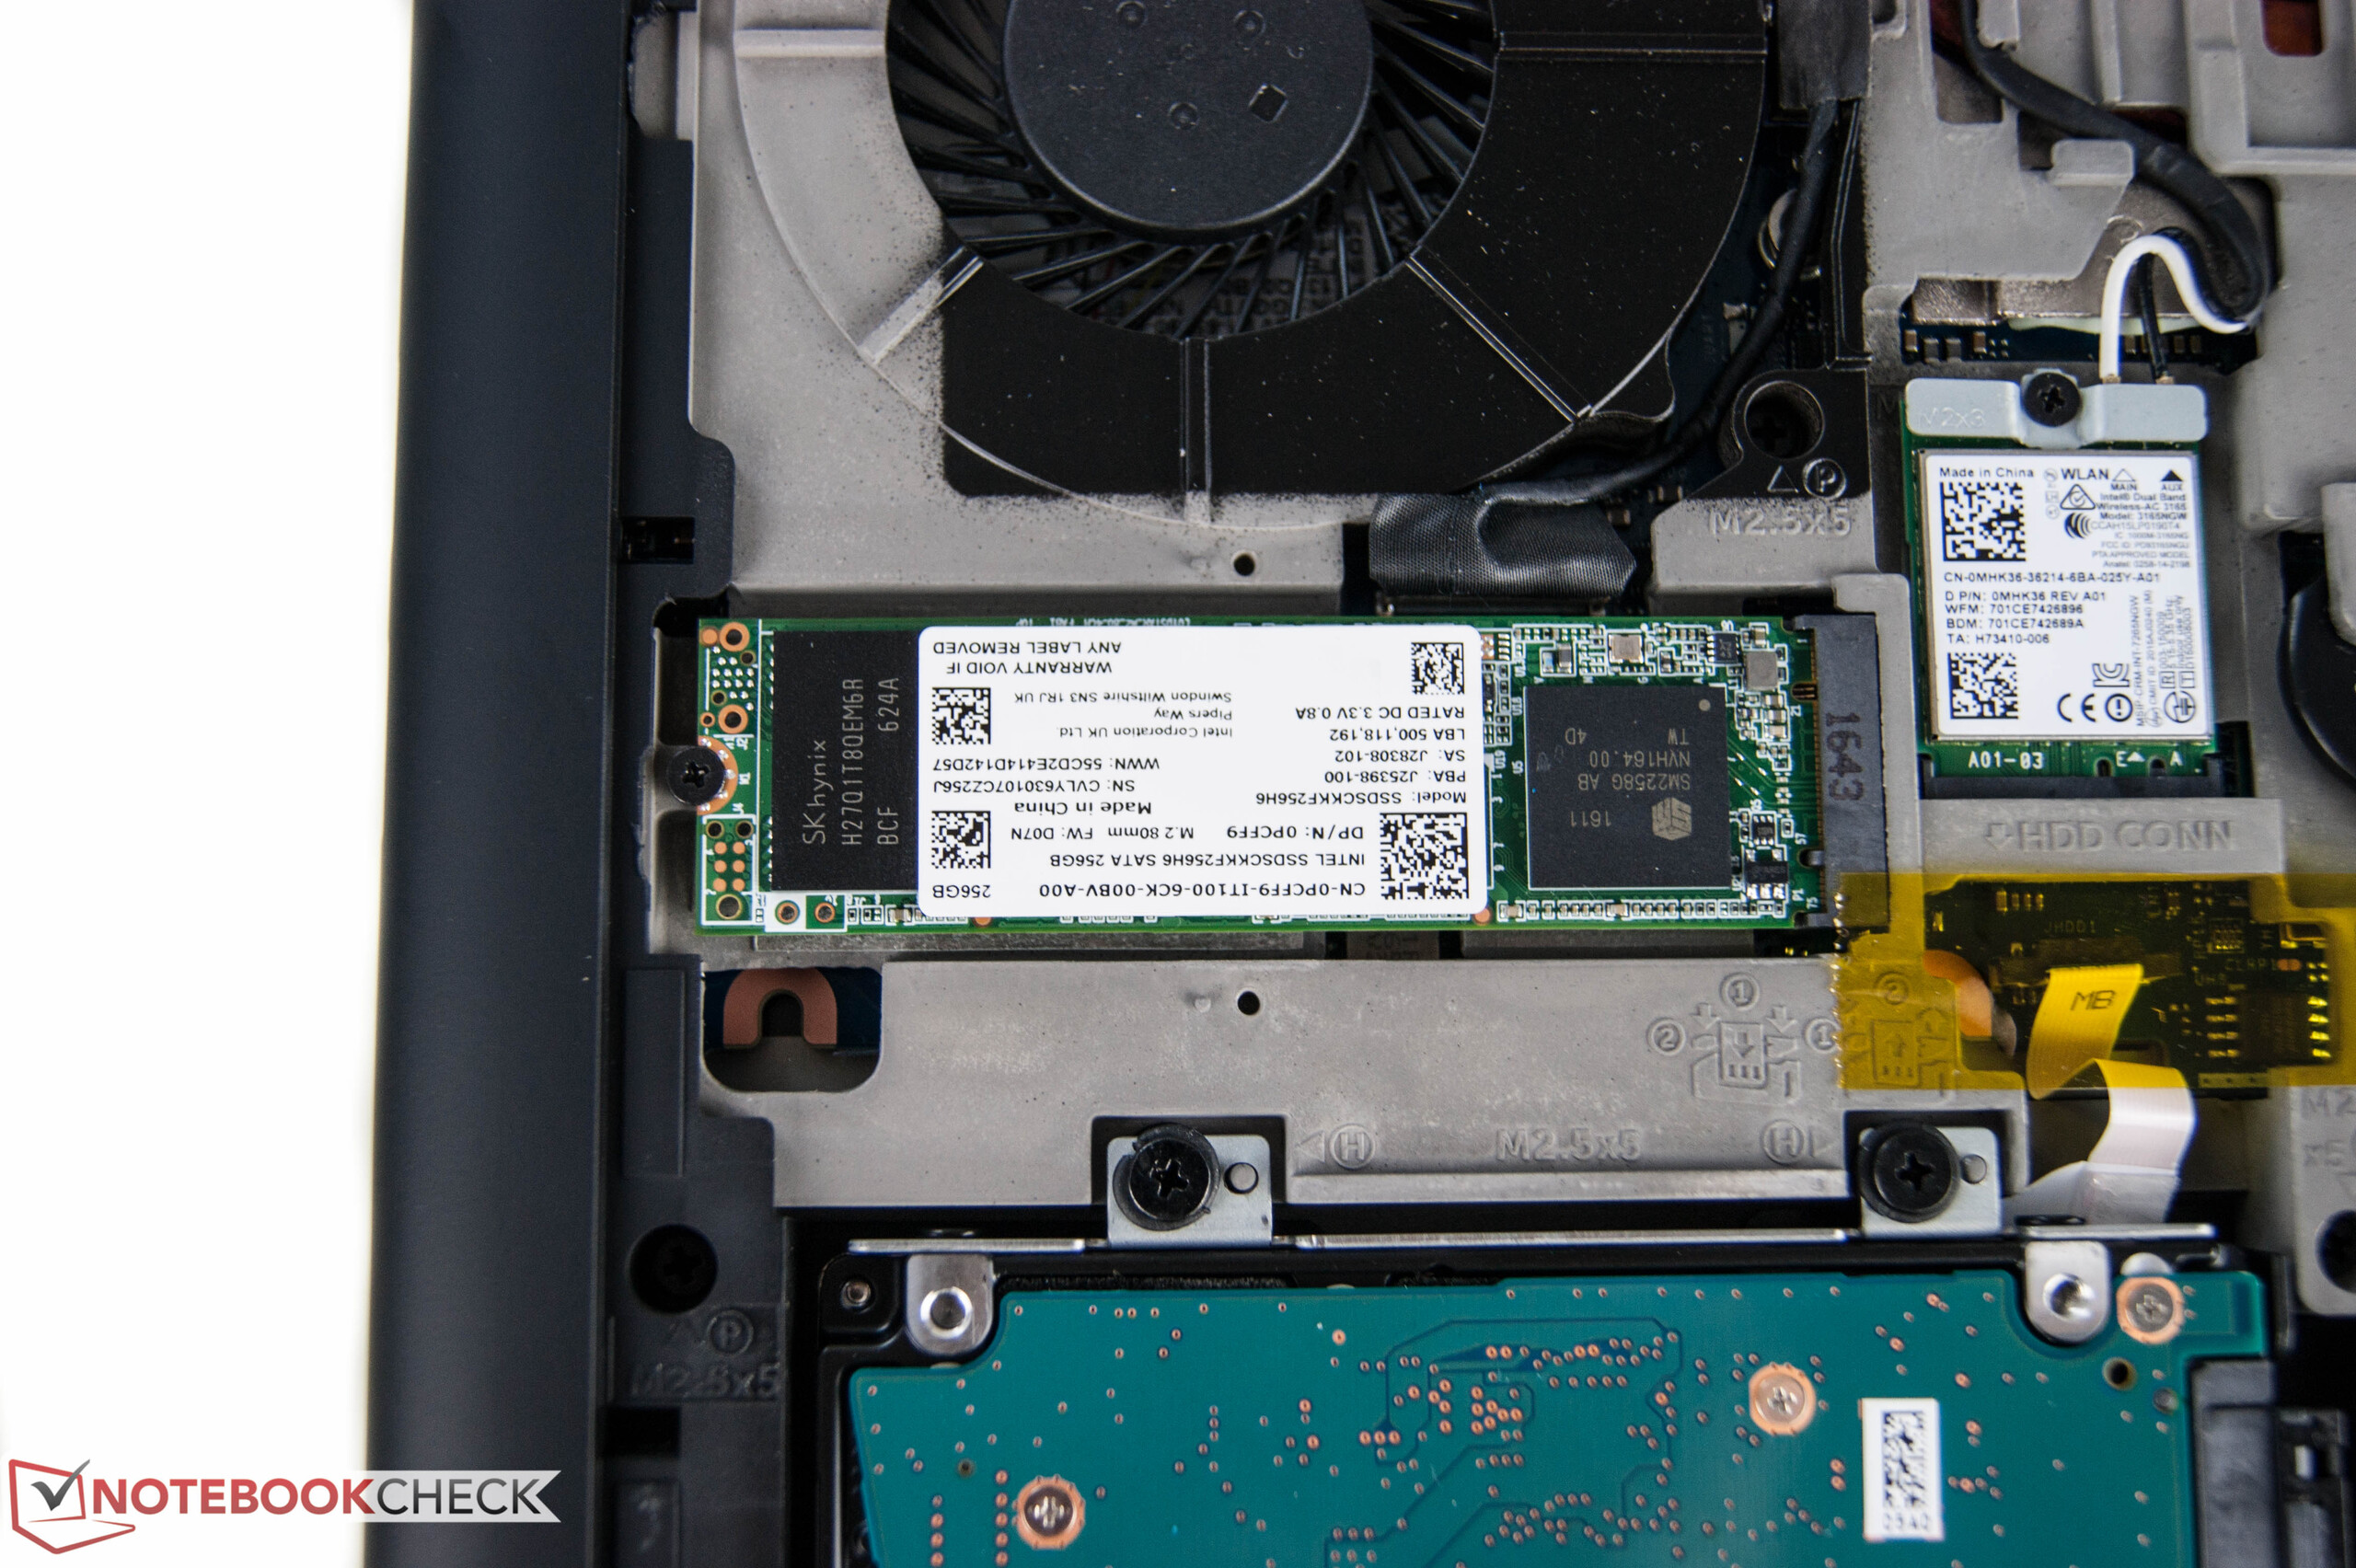
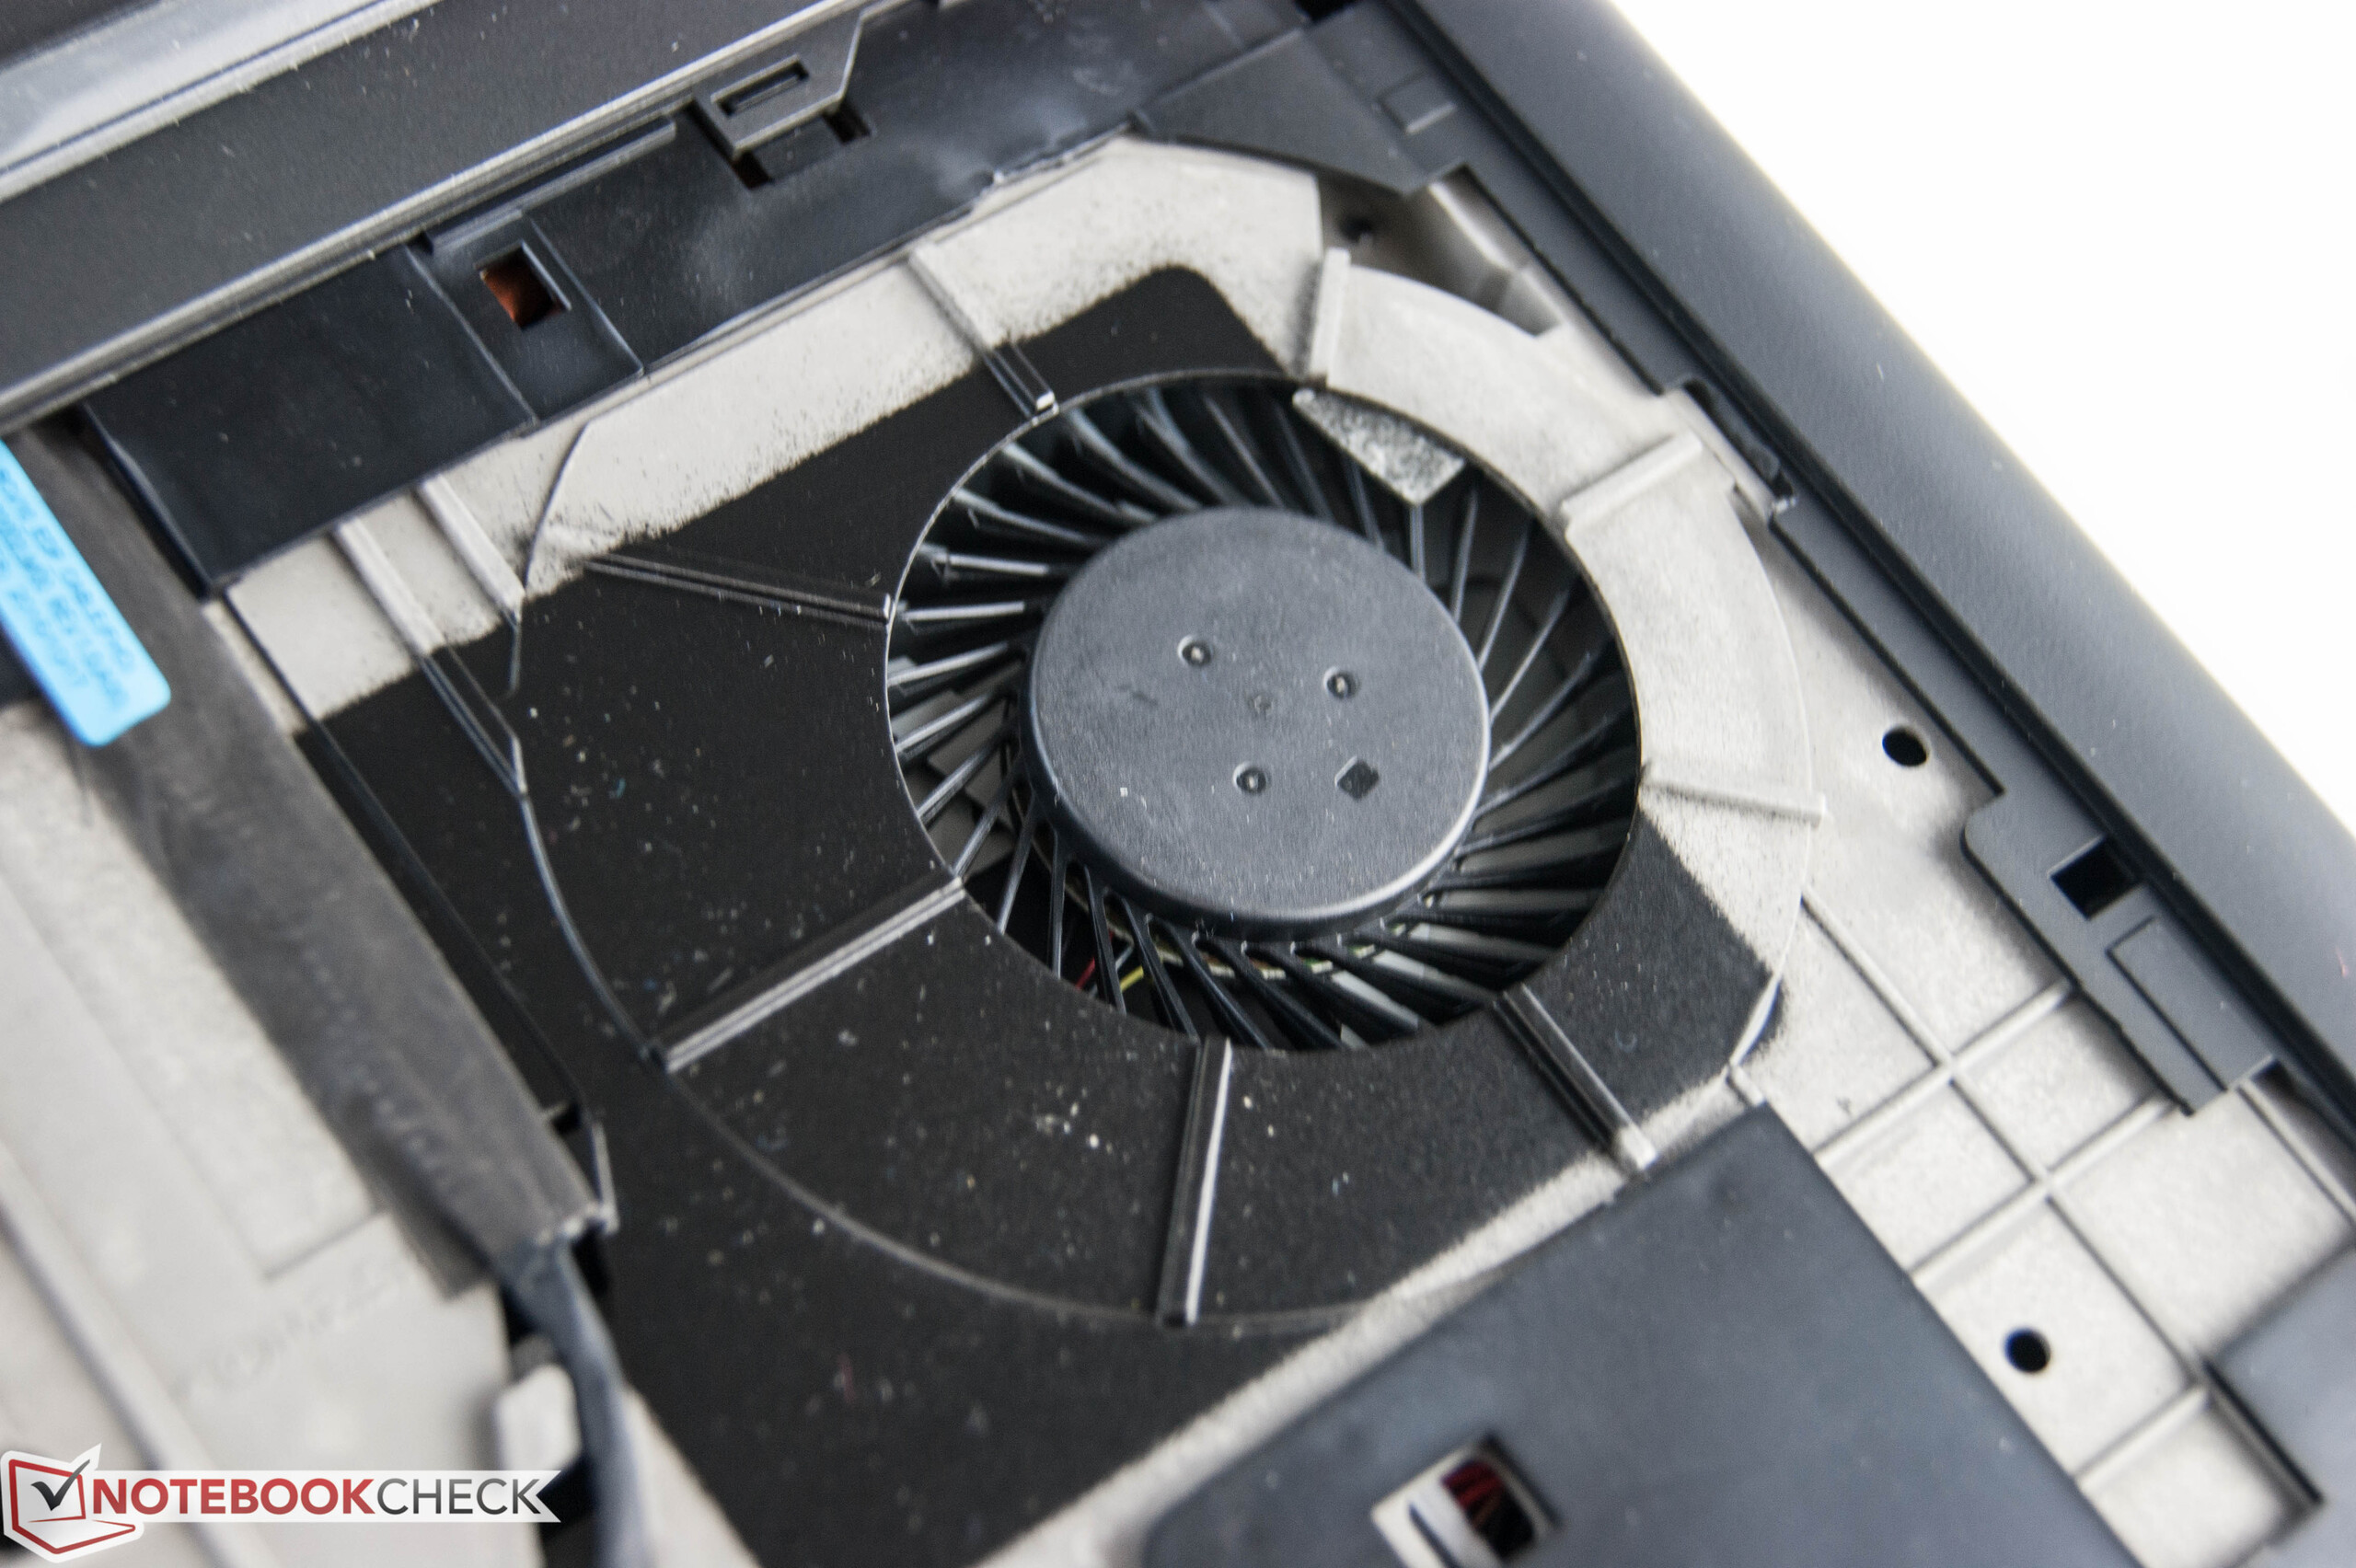
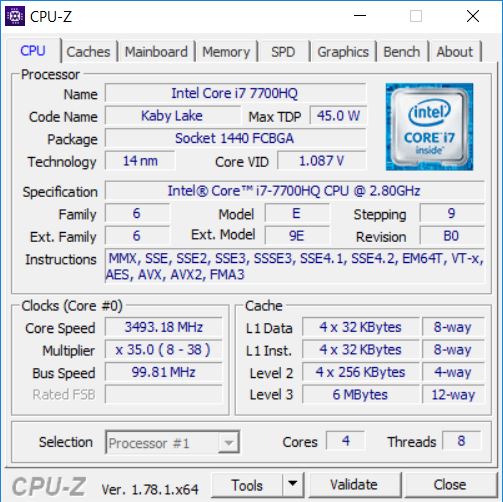
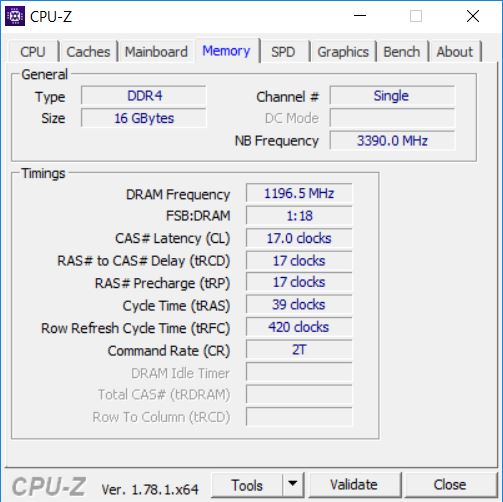
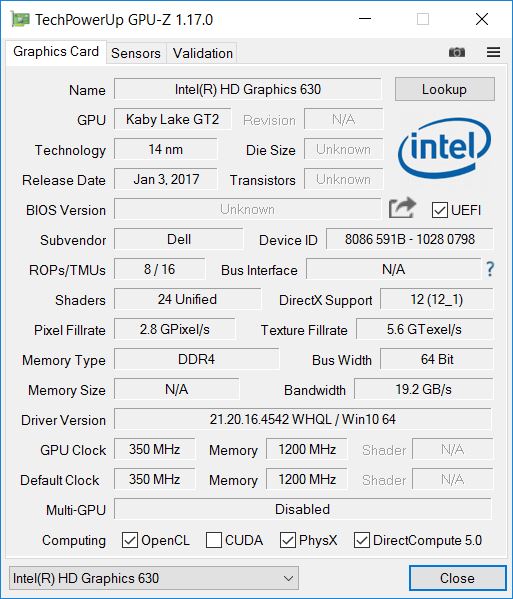
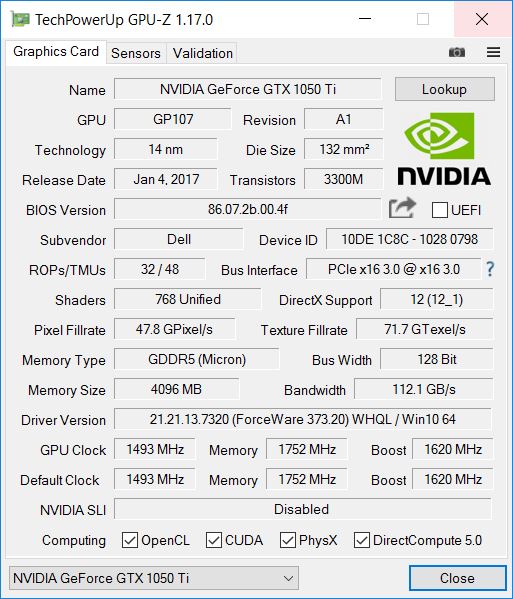
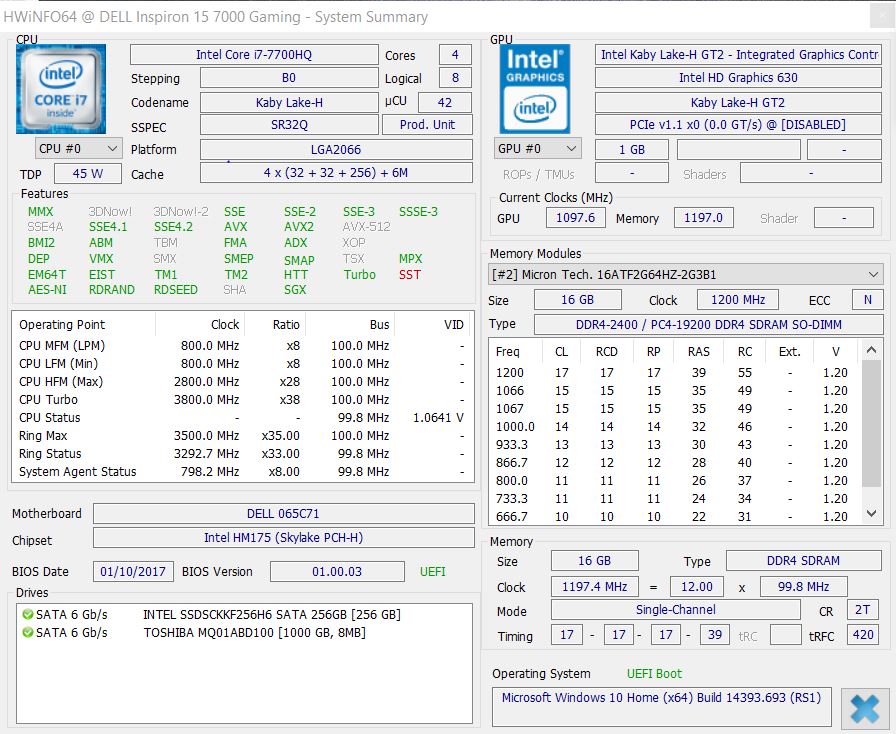
Nel corso del test, il nuovo portatile gaming Dell mostra la sua potenza: il processore Intel Core i7 e la Nvidia GeForce GTX 1050 Ti si uniscono ad un veloce SSD e ai 16 GB di RAM DDR4. Ne consegue che le prestazioni di sistema e le prestazioni gaming sono eccellenti. Tuttavia, l'Inspiron 15 si comporta bene anche in altri settori di applicazione oltre al gaming. Durante l'utilizzo normale, la ventola difficilmente si sente e le temperature restano in valori accettabili in ogni scenario. Sebbene, questo portatile gaming possa essere usato poco anche come compagno mobile a causa di dimensioni e peso, l'autonomia lo rende adatto a portarlo in giro. Il nostro modello di test, mostra la sua forza superiore rispetto molti subnotebooks.
Dell offre un portatile gaming superiore per un prezzo da 1000 Euro (~$1062), e che non teme la concorrenza dei dispositivi più costosi.
Coloro che sono interessati al display dovrebbero considerare il più costoso UHD.
Nota: si tratta di una recensione breve, con alcune sezioni non tradotte, per la versione integrale in inglese guardate qui.
Dell Inspiron 15 7000 7567
- 02/07/2017 v6 (old)
Nino Ricchizzi