Recensione breve del Portatile Dell Inspiron 15 7000 7577 (i7-7700HQ, GTX 1060 Max-Q, 4K UHD)
| SD Card Reader | |
| average JPG Copy Test (av. of 3 runs) | |
| Media della classe Gaming (20.9 - 210, n=54, ultimi 2 anni) | |
| Asus Zenbook Pro UX550VE-DB71T (Toshiba Exceria Pro SDXC 64 GB UHS-II) | |
| Dell Inspiron 15 7000 7577 4K (Toshiba Exceria Pro SDXC 64 GB UHS-II) | |
| MSI GF62VR 7RF-877 (Toshiba Exceria Pro SDXC 64 GB UHS-II) | |
| maximum AS SSD Seq Read Test (1GB) | |
| Media della classe Gaming (25.5 - 261, n=51, ultimi 2 anni) | |
| Asus Zenbook Pro UX550VE-DB71T (Toshiba Exceria Pro SDXC 64 GB UHS-II) | |
| Dell Inspiron 15 7000 7577 4K (Toshiba Exceria Pro SDXC 64 GB UHS-II) | |
| MSI GF62VR 7RF-877 (Toshiba Exceria Pro SDXC 64 GB UHS-II) | |
| Networking | |
| iperf3 transmit AX12 | |
| MSI GF62VR 7RF-877 | |
| Dell Inspiron 15 7000 7577 4K | |
| Asus Zenbook Pro UX550VE-DB71T | |
| iperf3 receive AX12 | |
| MSI GF62VR 7RF-877 | |
| Dell Inspiron 15 7000 7577 4K | |
| Asus Zenbook Pro UX550VE-DB71T | |
| |||||||||||||||||||||||||
Distribuzione della luminosità: 90 %
Al centro con la batteria: 322.9 cd/m²
Contrasto: 897:1 (Nero: 0.36 cd/m²)
ΔE ColorChecker Calman: 3.99 | ∀{0.5-29.43 Ø4.73}
ΔE Greyscale Calman: 5.3 | ∀{0.09-98 Ø4.97}
96.8% sRGB (Argyll 1.6.3 3D)
62.9% AdobeRGB 1998 (Argyll 1.6.3 3D)
69.6% AdobeRGB 1998 (Argyll 3D)
97.1% sRGB (Argyll 3D)
68.4% Display P3 (Argyll 3D)
Gamma: 2.041
CCT: 6941 K
| Dell Inspiron 15 7000 7577 4K Name: AU Optronics B156ZAN, IPS, 15.6", 3840x2160 | Asus Zenbook Pro UX550VE-DB71T N156HCE-EN1 (CMN15E8), IPS, 15.6", 1920x1080 | MSI GF62VR 7RF-877 Chi Mei N156HGA-EAL, TN LED, 15.6", 1920x1080 | Asus GL503VD-DB74 LG Philips LP156WF6, IPS, 15.6", 1920x1080 | Apple MacBook Pro 15 2017 (2.8 GHz, 555) APPA031, IPS, 15.4", 2880x1800 | Dell Inspiron 15 7000 7577 ID: LG Philips LGD053F, Name: 156WF6, Dell P/N: 4XK13, IPS, 15.6", 1920x1080 | |
|---|---|---|---|---|---|---|
| Display | -6% | 16% | -10% | 23% | -40% | |
| Display P3 Coverage (%) | 68.4 | 64.3 -6% | 85.6 25% | 64.3 -6% | 97.9 43% | 40.4 -41% |
| sRGB Coverage (%) | 97.1 | 90.4 -7% | 99.9 3% | 84.4 -13% | 99.9 3% | 60.5 -38% |
| AdobeRGB 1998 Coverage (%) | 69.6 | 65.3 -6% | 83.9 21% | 61.7 -11% | 85.9 23% | 41.77 -40% |
| Response Times | -19% | -14% | 3% | -28% | -8% | |
| Response Time Grey 50% / Grey 80% * (ms) | 35.2 ? | 43.2 ? -23% | 49.6 ? -41% | 36.4 ? -3% | 48 ? -36% | 41 ? -16% |
| Response Time Black / White * (ms) | 28.4 ? | 32.8 ? -15% | 24.4 ? 14% | 26.2 ? 8% | 33.8 ? -19% | 28 ? 1% |
| PWM Frequency (Hz) | 25510 ? | 25510 ? | 21010 ? | 119000 ? | ||
| Screen | -15% | -56% | -4% | 42% | -5% | |
| Brightness middle (cd/m²) | 322.9 | 288.2 -11% | 223.9 -31% | 315.9 -2% | 545 69% | 257 -20% |
| Brightness (cd/m²) | 309 | 266 -14% | 208 -33% | 304 -2% | 523 69% | 229 -26% |
| Brightness Distribution (%) | 90 | 75 -17% | 88 -2% | 88 -2% | 86 -4% | 84 -7% |
| Black Level * (cd/m²) | 0.36 | 0.3 17% | 0.56 -56% | 0.37 -3% | 0.44 -22% | 0.17 53% |
| Contrast (:1) | 897 | 961 7% | 400 -55% | 854 -5% | 1239 38% | 1512 69% |
| Colorchecker dE 2000 * | 3.99 | 5.5 -38% | 9.7 -143% | 4.9 -23% | 1.6 60% | 5.34 -34% |
| Colorchecker dE 2000 max. * | 8.97 | 11.3 -26% | 19.7 -120% | 9.7 -8% | 3.8 58% | 9.99 -11% |
| Greyscale dE 2000 * | 5.3 | 7.9 -49% | 12.9 -143% | 3.8 28% | 1.9 64% | 4.82 9% |
| Gamma | 2.041 108% | 2.09 105% | 2.18 101% | 2.24 98% | 2.26 97% | 2.46 89% |
| CCT | 6941 94% | 6559 99% | 15225 43% | 6847 95% | 6834 95% | 6587 99% |
| Color Space (Percent of AdobeRGB 1998) (%) | 62.9 | 58.5 -7% | 75 19% | 55 -13% | 38 -40% | |
| Color Space (Percent of sRGB) (%) | 96.8 | 90 -7% | 100 3% | 84 -13% | 60 -38% | |
| Media totale (Programma / Settaggio) | -13% /
-13% | -18% /
-36% | -4% /
-5% | 12% /
27% | -18% /
-12% |
* ... Meglio usare valori piccoli
Tempi di risposta del Display
| ↔ Tempi di risposta dal Nero al Bianco | ||
|---|---|---|
| 28.4 ms ... aumenta ↗ e diminuisce ↘ combinato | ↗ 16 ms Incremento | 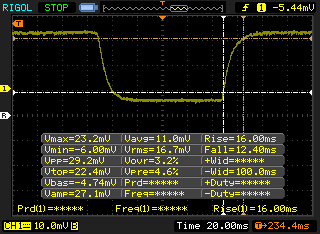 |
| ↘ 12.4 ms Calo | ||
| Lo schermo mostra tempi di risposta relativamente lenti nei nostri tests e potrebbe essere troppo lento per i gamers. In confronto, tutti i dispositivi di test variano da 0.1 (minimo) a 240 (massimo) ms. » 75 % di tutti i dispositivi è migliore. Questo significa che i tempi di risposta rilevati sono peggiori rispetto alla media di tutti i dispositivi testati (19.9 ms). | ||
| ↔ Tempo di risposta dal 50% Grigio all'80% Grigio | ||
| 35.2 ms ... aumenta ↗ e diminuisce ↘ combinato | ↗ 17.2 ms Incremento | 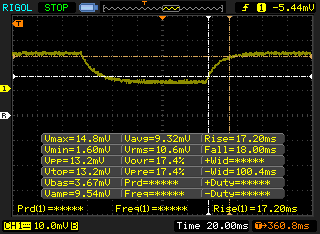 |
| ↘ 18 ms Calo | ||
| Lo schermo mostra tempi di risposta lenti nei nostri tests e sarà insoddisfacente per i gamers. In confronto, tutti i dispositivi di test variano da 0.165 (minimo) a 636 (massimo) ms. » 49 % di tutti i dispositivi è migliore. Questo significa che i tempi di risposta rilevati sono peggiori rispetto alla media di tutti i dispositivi testati (31.1 ms). | ||
Sfarfallio dello schermo / PWM (Pulse-Width Modulation)
| flickering dello schermo / PWM non rilevato | 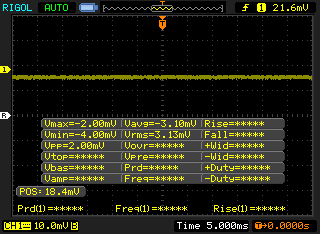 | ||
In confronto: 52 % di tutti i dispositivi testati non utilizza PWM per ridurre la luminosita' del display. Se è rilevato PWM, una media di 7798 (minimo: 5 - massimo: 343500) Hz è stata rilevata. | |||
* ... Meglio usare valori piccoli
| PCMark 8 Home Score Accelerated v2 | 3385 punti | |
| PCMark 8 Creative Score Accelerated v2 | 4806 punti | |
| PCMark 8 Work Score Accelerated v2 | 4102 punti | |
| PCMark 10 Score | 4306 punti | |
Aiuto | ||
| Dell Inspiron 15 7000 7577 4K SK hynix SC311 M.2 | Asus Zenbook Pro UX550VE-DB71T Samsung PM961 NVMe MZVLW512HMJP | MSI GF62VR 7RF-877 Intel SSD 600p SSDPEKKW256G7 | Dell Inspiron 15 7000 7577 Samsung PM961 MZVLW256HEHP | Media SK hynix SC311 M.2 | |
|---|---|---|---|---|---|
| AS SSD | 337% | 114% | 207% | 1% | |
| Copy Game MB/s (MB/s) | 185.4 | 477.1 157% | 471.7 154% | 382.5 106% | 164.3 ? -11% |
| Copy Program MB/s (MB/s) | 142.2 | 294.6 107% | 286.5 101% | 274.8 93% | 138.6 ? -3% |
| Copy ISO MB/s (MB/s) | 363.6 | 1269 249% | 1069 194% | 814 124% | 246 ? -32% |
| Score Total (Points) | 578 | 3721 544% | 1324 129% | 2405 316% | 639 ? 11% |
| Score Write (Points) | 227 | 1421 526% | 693 205% | 594 162% | 228 ? 0% |
| Score Read (Points) | 234 | 1541 559% | 448 91% | 1241 430% | 273 ? 17% |
| Access Time Write * (ms) | 0.058 | 0.034 41% | 0.03 48% | 0.037 36% | 0.058 ? -0% |
| Access Time Read * (ms) | 0.126 | 0.054 57% | 0.09 29% | 0.058 54% | 0.1233 ? 2% |
| 4K-64 Write (MB/s) | 127.2 | 1160 812% | 551 333% | 375.8 195% | 131.4 ? 3% |
| 4K-64 Read (MB/s) | 156.6 | 1269 710% | 280.1 79% | 929 493% | 196.5 ? 25% |
| 4K Write (MB/s) | 74 | 112.8 52% | 118.3 60% | 100.2 35% | 69.6 ? -6% |
| 4K Read (MB/s) | 26.24 | 51 94% | 31.27 19% | 46.95 79% | 26.3 ? 0% |
| Seq Write (MB/s) | 259.9 | 1475 468% | 234.9 -10% | 1181 354% | 270 ? 4% |
| Seq Read (MB/s) | 508 | 2208 335% | 1371 170% | 2652 422% | 504 ? -1% |
* ... Meglio usare valori piccoli

| 3DMark 11 Performance | 11855 punti | |
| 3DMark Ice Storm Standard Score | 84441 punti | |
| 3DMark Cloud Gate Standard Score | 24667 punti | |
| 3DMark Fire Strike Score | 8861 punti | |
| 3DMark Fire Strike Extreme Score | 4610 punti | |
Aiuto | ||
| Rise of the Tomb Raider | |
| 1920x1080 Very High Preset AA:FX AF:16x | |
| MSI Gaming Z GeForce GTX 1070 OC Bios Desktop PC | |
| Nvidia GeForce GTX 1060 Founders Edition 6 GB | |
| Nvidia GeForce GTX 1060 Founders Edition 6 GB | |
| DogHouse Systems Mobius SS | |
| Dell Inspiron 15 7000 7577 4K | |
| MSI GeForce GTX 1050 Ti | |
| Zotac GeForce GTX 1050 2GB | |
| 3840x2160 High Preset AA:FX AF:4x | |
| MSI Gaming Z GeForce GTX 1070 OC Bios Desktop PC | |
| Nvidia GeForce GTX 1060 Founders Edition 6 GB | |
| Nvidia GeForce GTX 1060 Founders Edition 6 GB | |
| Dell Inspiron 15 7000 7577 4K | |
| Zotac GeForce GTX 1050 2GB | |
| basso | medio | alto | ultra | 4K | |
|---|---|---|---|---|---|
| BioShock Infinite (2013) | 100.4 | ||||
| Metro: Last Light (2013) | 74 | ||||
| Thief (2014) | 70.4 | ||||
| The Witcher 3 (2015) | 70.1 | 36.8 | 24.4 | ||
| Batman: Arkham Knight (2015) | 129 | 81 | 53 | 26 | |
| Metal Gear Solid V (2015) | 60 | 60 | 42 | ||
| Fallout 4 (2015) | 78.4 | 64.6 | 25.8 | ||
| Rise of the Tomb Raider (2016) | 45.3 | 22.8 | |||
| Ashes of the Singularity (2016) | 59.8 | 52.9 | 21 | ||
| Overwatch (2016) | 165.8 | 102 | 50.3 | ||
| Prey (2017) | 120 | 101 | 34.6 | ||
| Dirt 4 (2017) | 119.5 | 84.9 | 48.3 | 28.8 | |
| F1 2017 (2017) | 98 | 60 | 26 | ||
| Middle-earth: Shadow of War (2017) | 82 | 60 | 46 | 17 | |
| Destiny 2 (2017) | 94.7 | 85.4 | 71.4 | 17.6 | |
| Final Fantasy XV Benchmark (2018) | 73 | 47.2 | 33.9 | 14.6 |
Rumorosità
| Idle |
| 28.8 / 29.2 / 29.2 dB(A) |
| Sotto carico |
| 34.6 / 49.3 dB(A) |
 | ||
30 dB silenzioso 40 dB(A) udibile 50 dB(A) rumoroso |
||
min: | ||
| Dell Inspiron 15 7000 7577 4K GeForce GTX 1060 Max-Q, i7-7700HQ, SK hynix SC311 M.2 | Asus Zenbook Pro UX550VE-DB71T GeForce GTX 1050 Ti Mobile, i7-7700HQ, Samsung PM961 NVMe MZVLW512HMJP | Acer Swift 3 SF315-41-R4W1 Vega 8, R5 2500U, Intel SSD 600p SSDPEKKW256G7 | Dell Inspiron 15 7000 7577 GeForce GTX 1050 Mobile, i5-7300HQ, Seagate Mobile HDD 1TB ST1000LX015-1U7172 | Asus Zephyrus GX501 GeForce GTX 1080 Max-Q, i7-7700HQ, Samsung SSD SM961 1TB M.2 MZVKW1T0HMLH | MSI GE63VR 7RF Raider GeForce GTX 1070 Mobile, i7-7700HQ, Toshiba HG6 THNSNJ256G8NY | |
|---|---|---|---|---|---|---|
| Noise | -6% | -1% | -5% | -7% | -20% | |
| off /ambiente * (dB) | 28.5 | 28.3 1% | 31.8 -12% | 31 -9% | 31 -9% | 30 -5% |
| Idle Minimum * (dB) | 28.8 | 30.4 -6% | 31.8 -10% | 32.7 -14% | 32 -11% | 33 -15% |
| Idle Average * (dB) | 29.2 | 31 -6% | 32.1 -10% | 32.7 -12% | 33 -13% | 35 -20% |
| Idle Maximum * (dB) | 29.2 | 31.2 -7% | 32.1 -10% | 32.7 -12% | 34 -16% | 40 -37% |
| Load Average * (dB) | 34.6 | 43.3 -25% | 33 5% | 38.7 -12% | 39 -13% | 48 -39% |
| Witcher 3 ultra * (dB) | 44.1 | 46.2 -5% | 39 12% | 42 5% | 50 -13% | |
| Load Maximum * (dB) | 49.3 | 46.2 6% | 34.8 29% | 44.6 10% | 46 7% | 55 -12% |
* ... Meglio usare valori piccoli
(±) La temperatura massima sul lato superiore è di 42.6 °C / 109 F, rispetto alla media di 40.4 °C / 105 F, che varia da 21.2 a 68.8 °C per questa classe Gaming.
(-) Il lato inferiore si riscalda fino ad un massimo di 46.2 °C / 115 F, rispetto alla media di 43.2 °C / 110 F
(+) In idle, la temperatura media del lato superiore è di 27.1 °C / 81 F, rispetto alla media deld ispositivo di 33.9 °C / 93 F.
(+) Riproducendo The Witcher 3, la temperatura media per il lato superiore e' di 28.9 °C / 84 F, rispetto alla media del dispositivo di 33.9 °C / 93 F.
(+) I poggiapolsi e il touchpad sono piu' freddi della temperatura della pelle con un massimo di 27.2 °C / 81 F e sono quindi freddi al tatto.
(±) La temperatura media della zona del palmo della mano di dispositivi simili e'stata di 28.8 °C / 83.8 F (+1.6 °C / 2.8 F).
| Off / Standby | |
| Idle | |
| Sotto carico |
|
Leggenda:
min: | |
| Dell Inspiron 15 7000 7577 4K i7-7700HQ, GeForce GTX 1060 Max-Q, SK hynix SC311 M.2, IPS, 3840x2160, 15.6" | Asus Zenbook Pro UX550VE-DB71T i7-7700HQ, GeForce GTX 1050 Ti Mobile, Samsung PM961 NVMe MZVLW512HMJP, IPS, 1920x1080, 15.6" | Acer Swift 3 SF315-41-R4W1 R5 2500U, Vega 8, Intel SSD 600p SSDPEKKW256G7, IPS, 1920x1080, 15.6" | MSI GF62VR 7RF-877 i7-7700HQ, GeForce GTX 1060 Mobile, Intel SSD 600p SSDPEKKW256G7, TN LED, 1920x1080, 15.6" | Dell Inspiron 15 7000 7577 i5-7300HQ, GeForce GTX 1050 Mobile, Seagate Mobile HDD 1TB ST1000LX015-1U7172, IPS, 1920x1080, 15.6" | Asus Zephyrus GX501 i7-7700HQ, GeForce GTX 1080 Max-Q, Samsung SSD SM961 1TB M.2 MZVKW1T0HMLH, IPS, 1920x1080, 15.6" | |
|---|---|---|---|---|---|---|
| Power Consumption | 7% | 14% | -68% | 3% | -107% | |
| Idle Minimum * (Watt) | 5.5 | 6.3 -15% | 7.3 -33% | 16.2 -195% | 5.3 4% | 18 -227% |
| Idle Average * (Watt) | 10.5 | 7.9 25% | 9.7 8% | 18.2 -73% | 8.8 16% | 23 -119% |
| Idle Maximum * (Watt) | 10.9 | 8.1 26% | 13 -19% | 18.9 -73% | 9.7 11% | 31 -184% |
| Load Average * (Watt) | 72 | 84.9 -18% | 40.4 44% | 82.7 -15% | 100 -39% | 79 -10% |
| Witcher 3 ultra * (Watt) | 97.4 | 96.3 1% | 125.7 -29% | 87 11% | 148 -52% | |
| Load Maximum * (Watt) | 130.4 | 102.4 21% | 42.2 68% | 162.3 -24% | 109 16% | 196 -50% |
* ... Meglio usare valori piccoli
| Dell Inspiron 15 7000 7577 4K i7-7700HQ, GeForce GTX 1060 Max-Q, 56 Wh | Asus Zenbook Pro UX550VE-DB71T i7-7700HQ, GeForce GTX 1050 Ti Mobile, 73 Wh | Acer Swift 3 SF315-41-R4W1 R5 2500U, Vega 8, 48 Wh | MSI GF62VR 7RF-877 i7-7700HQ, GeForce GTX 1060 Mobile, 41 Wh | Asus GL503VD-DB74 i7-7700HQ, GeForce GTX 1050 Mobile, 64 Wh | Dell Inspiron 15 7000 7577 i5-7300HQ, GeForce GTX 1050 Mobile, 56 Wh | |
|---|---|---|---|---|---|---|
| Autonomia della batteria | 39% | 4% | -63% | -2% | 19% | |
| Reader / Idle (h) | 10 | 17.1 71% | 12.2 22% | 2.8 -72% | 10.8 8% | 11.1 11% |
| WiFi v1.3 (h) | 5.4 | 8.9 65% | 5.2 -4% | 1.9 -65% | 5.8 7% | 6.8 26% |
| Load (h) | 1.5 | 1.2 -20% | 1.4 -7% | 0.7 -53% | 1.2 -20% | 1.8 20% |
Pro
Contro
Per finalità gaming, un pannello 4K UHD nativo non è la soluzione perfetta per sistemi che montano una GPU GTX 1060 Max-Q. A meno che il portatile non sarà usato solo per fogli di calcolo o giochi non pesanti come Rocket League, LoL, Overwatch, o DOTA 2, oltre questo limite diventa difficile giustificare il prezzo premium del pannello 4K UHD rispetto ad un modello standard FHD. Gli utenti avranno bisogno di una GPU più potente per sfruttare meglio le potenzialità del 4K UHD.
Se quanto appena detto non è importante per voi, allora sarete lieti di sapere che il pannello 4K UHD è più luminoso rispetto al modello FHD e con colori più precisi. Gli stessi vantaggi e svantaggi dell'Inspiron 15 7577 valgono ancora.
La versione 4K UHD dell'Inspiron 15 7577 è superiore alle SKUs FHD sulla carta, ma i giocatori dovranno limitarsi al massimo ai titoli 1080p per i quali la GTX 1060 Max-Q è stata progettata.
Nota: si tratta di una recensione breve, con alcune sezioni non tradotte, per la versione integrale in inglese guardate qui.
Dell Inspiron 15 7000 7577 4K
- 02/19/2018 v6 (old)
Allen Ngo
Price comparison
