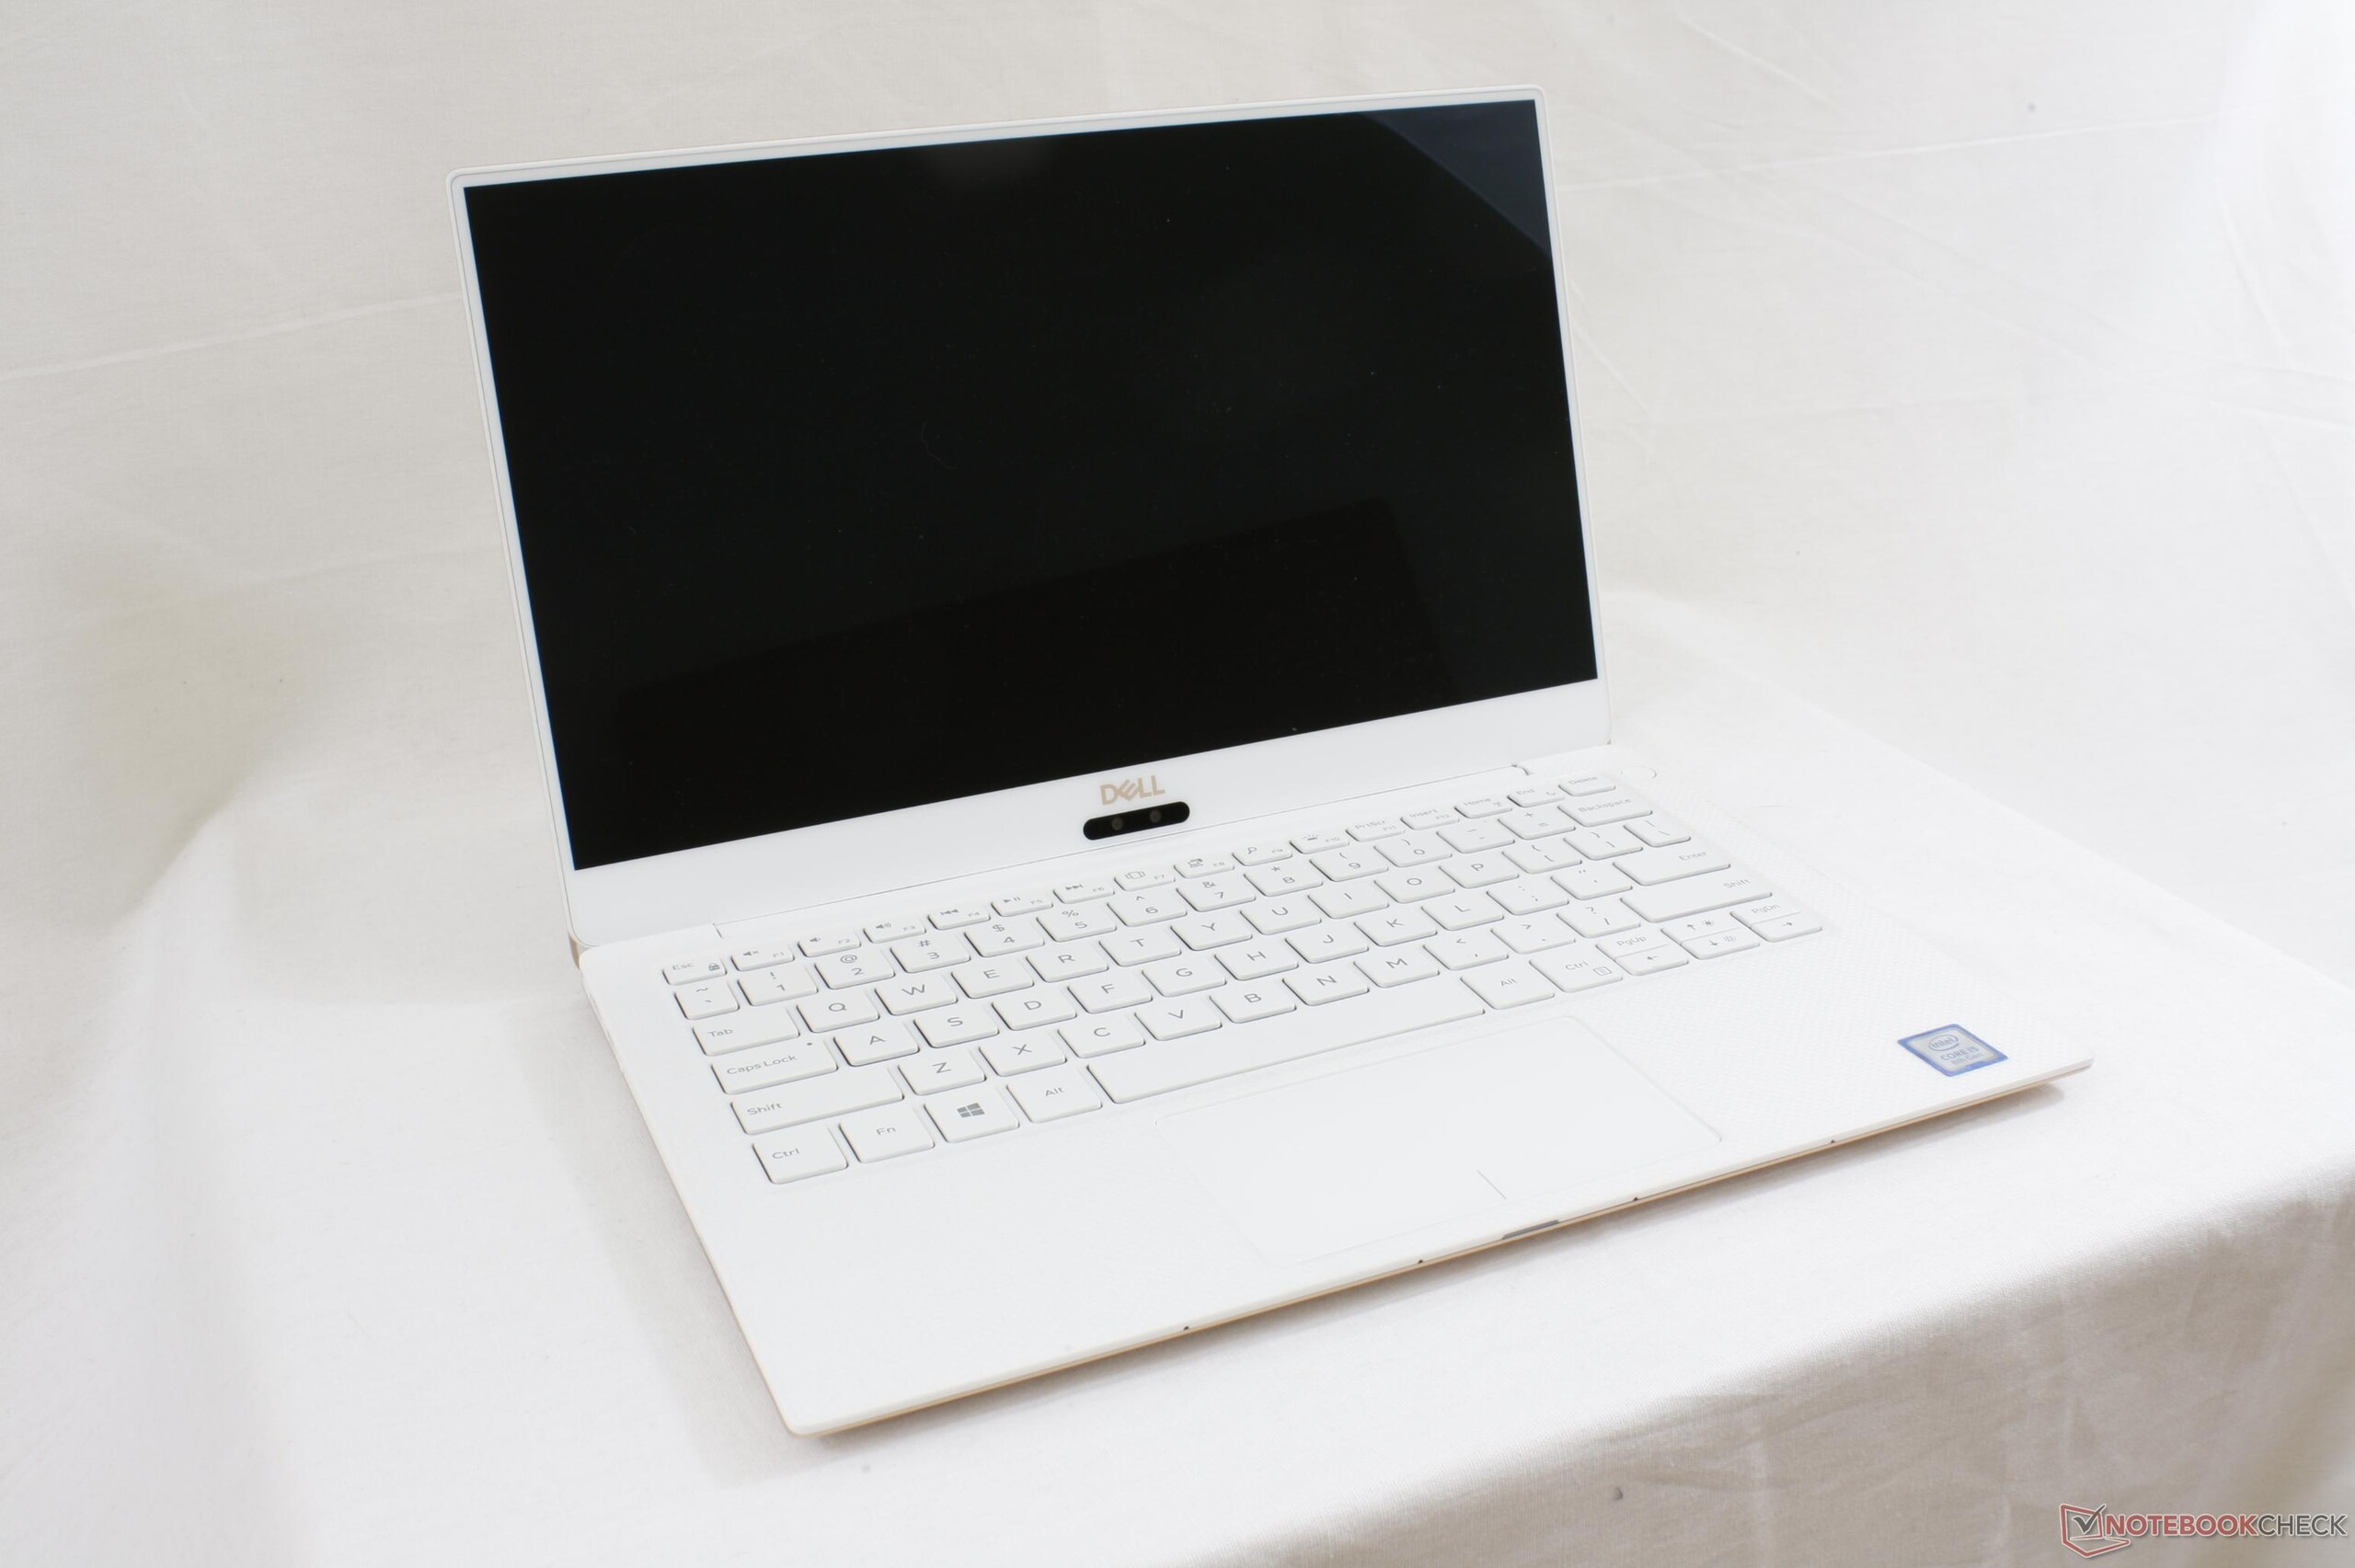
Recensione breve del Portatile Dell XPS 13 9370 (i5-8250U, 4K UHD)

| SD Card Reader | |
| average JPG Copy Test (av. of 3 runs) | |
| Dell XPS 13 9370 i5 UHD | |
| Dell XPS 13 i7-8550U | |
| Dell XPS 15-9550 i7 | |
| maximum AS SSD Seq Read Test (1GB) | |
| Dell XPS 15-9550 i7 | |
| Dell XPS 13 9370 i5 UHD | |
| Dell XPS 13 i7-8550U | |
| Networking | |
| iperf3 transmit AX12 | |
| Dell XPS 13 9360 FHD i7 Iris | |
| Samsung Notebook 9 NP900X3N-K01US | |
| Dell XPS 13 9370 i5 UHD | |
| iperf3 receive AX12 | |
| Samsung Notebook 9 NP900X3N-K01US | |
| Dell XPS 13 9370 i5 UHD | |
| Dell XPS 13 9360 FHD i7 Iris | |
| |||||||||||||||||||||||||
Distribuzione della luminosità: 84 %
Al centro con la batteria: 496.4 cd/m²
Contrasto: 993:1 (Nero: 0.5 cd/m²)
ΔE ColorChecker Calman: 2.9 | ∀{0.5-29.43 Ø4.73}
ΔE Greyscale Calman: 3.9 | ∀{0.09-98 Ø4.97}
98.2% sRGB (Argyll 1.6.3 3D)
63.9% AdobeRGB 1998 (Argyll 1.6.3 3D)
69.5% AdobeRGB 1998 (Argyll 3D)
98.4% sRGB (Argyll 3D)
68.9% Display P3 (Argyll 3D)
Gamma: 2.066
CCT: 7169 K
| Dell XPS 13 9370 i5 UHD ID: Sharp SHP148B, Name: LQ133D1, Dell P/N: 8XDHY, IPS, 13.3", 3840x2160 | Dell XPS 13 9370 FHD i5 SHP1484, IPS, 13.3", 1920x1080 | Dell XPS 13 9360 QHD+ i7 Sharp SHP144A, IPS, 13.3", 3200x1800 | Samsung Notebook 9 NP900X3N-K01US ID: BOE06E1, Name: NV133FHB-N31, IPS, 13.3", 1920x1080 | Asus ZenBook 13 UX331UN B133HAN04.9, IPS LED, 13.3", 1920x1080 | Apple MacBook Pro 13 2017 APPA033, IPS, 13.3", 2560x1600 | Acer Swift 7 SF713-51 Chimei Innolux, N133HCE-GP1, IPS, WLED, 13.3", 1920x1080 | |
|---|---|---|---|---|---|---|---|
| Display | -1% | -8% | -9% | -5% | 24% | -7% | |
| Display P3 Coverage (%) | 68.9 | 68.9 0% | 62.8 -9% | 63.4 -8% | 65.4 -5% | 99.2 44% | 64.6 -6% |
| sRGB Coverage (%) | 98.4 | 96.6 -2% | 89.4 -9% | 88.6 -10% | 93.1 -5% | 99.9 2% | 89.1 -9% |
| AdobeRGB 1998 Coverage (%) | 69.5 | 69.6 0% | 64.6 -7% | 64 -8% | 66.4 -4% | 87.1 25% | 64.8 -7% |
| Response Times | -2% | 33% | 28% | 46% | 34% | 45% | |
| Response Time Grey 50% / Grey 80% * (ms) | 67.2 ? | 62.4 ? 7% | 43.6 ? 35% | 41.6 ? 38% | 22.4 ? 67% | 42.8 ? 36% | 31 ? 54% |
| Response Time Black / White * (ms) | 41.6 ? | 45.6 ? -10% | 29.2 ? 30% | 34 ? 18% | 31.2 ? 25% | 28.8 ? 31% | 27 ? 35% |
| PWM Frequency (Hz) | 2500 ? | 1008 ? | 210.1 ? | ||||
| Screen | 1% | -5% | -5% | -11% | 24% | -14% | |
| Brightness middle (cd/m²) | 496.4 | 428 -14% | 396.2 -20% | 510.7 3% | 338 -32% | 588 18% | 359 -28% |
| Brightness (cd/m²) | 469 | 405 -14% | 357 -24% | 481 3% | 321 -32% | 561 20% | 344 -27% |
| Brightness Distribution (%) | 84 | 87 4% | 84 0% | 90 7% | 90 7% | 92 10% | 92 10% |
| Black Level * (cd/m²) | 0.5 | 0.26 48% | 0.266 47% | 0.66 -32% | 0.35 30% | 0.45 10% | 0.25 50% |
| Contrast (:1) | 993 | 1646 66% | 1489 50% | 774 -22% | 966 -3% | 1307 32% | 1436 45% |
| Colorchecker dE 2000 * | 2.9 | 3.8 -31% | 3.9 -34% | 2.4 17% | 4.2 -45% | 1.7 41% | 4.57 -58% |
| Colorchecker dE 2000 max. * | 5.26 | 7.2 -37% | 7.58 -44% | 7.3 -39% | 6.5 -24% | 3.5 33% | 9.25 -76% |
| Greyscale dE 2000 * | 3.9 | 4.4 -13% | 4.16 -7% | 2.4 38% | 3.9 -0% | 1.9 51% | 5.2 -33% |
| Gamma | 2.066 106% | 2.21 100% | 2.31 95% | 2.23 99% | 2.43 91% | 2.33 94% | 2.47 89% |
| CCT | 7169 91% | 7067 92% | 6514 100% | 6747 96% | 7144 91% | 6738 96% | 6887 94% |
| Color Space (Percent of AdobeRGB 1998) (%) | 63.9 | 62.8 -2% | 57.5 -10% | 57 -11% | 60.4 -5% | 77.92 22% | 58 -9% |
| Color Space (Percent of sRGB) (%) | 98.2 | 96.4 -2% | 88.7 -10% | 88.1 -10% | 93.1 -5% | 99.94 2% | 89 -9% |
| Media totale (Programma / Settaggio) | -1% /
0% | 7% /
-1% | 5% /
-1% | 10% /
-2% | 27% /
25% | 8% /
-5% |
* ... Meglio usare valori piccoli
Tempi di risposta del Display
| ↔ Tempi di risposta dal Nero al Bianco | ||
|---|---|---|
| 41.6 ms ... aumenta ↗ e diminuisce ↘ combinato | ↗ 22.8 ms Incremento | 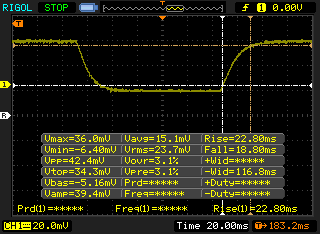 |
| ↘ 18.8 ms Calo | ||
| Lo schermo mostra tempi di risposta lenti nei nostri tests e sarà insoddisfacente per i gamers. In confronto, tutti i dispositivi di test variano da 0.1 (minimo) a 240 (massimo) ms. » 98 % di tutti i dispositivi è migliore. Questo significa che i tempi di risposta rilevati sono peggiori rispetto alla media di tutti i dispositivi testati (19.9 ms). | ||
| ↔ Tempo di risposta dal 50% Grigio all'80% Grigio | ||
| 67.2 ms ... aumenta ↗ e diminuisce ↘ combinato | ↗ 31.6 ms Incremento | 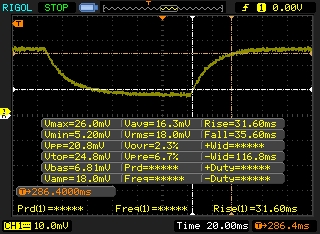 |
| ↘ 35.6 ms Calo | ||
| Lo schermo mostra tempi di risposta lenti nei nostri tests e sarà insoddisfacente per i gamers. In confronto, tutti i dispositivi di test variano da 0.165 (minimo) a 636 (massimo) ms. » 98 % di tutti i dispositivi è migliore. Questo significa che i tempi di risposta rilevati sono peggiori rispetto alla media di tutti i dispositivi testati (31.1 ms). | ||
Sfarfallio dello schermo / PWM (Pulse-Width Modulation)
| flickering dello schermo / PWM rilevato | 2500 Hz | ≤ 20 % settaggio luminosita' | 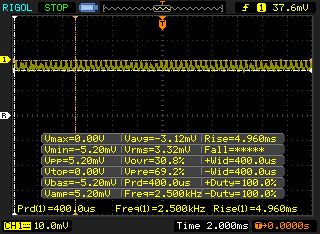 |
Il display sfarfalla a 2500 Hz (Probabilmente a causa dell'uso di PWM) Flickering rilevato ad una luminosita' di 20 % o inferiore. Non dovrebbe verificarsi flickering o PWM sopra questo valore di luminosita'. La frequenza di 2500 Hz è abbastanza alta, quindi la maggioranza degli utenti sensibili al PWM non dovrebbero notare alcun flickering. In confronto: 52 % di tutti i dispositivi testati non utilizza PWM per ridurre la luminosita' del display. Se è rilevato PWM, una media di 7798 (minimo: 5 - massimo: 343500) Hz è stata rilevata. | |||
XPS 13 9370 i5-8250U
XPS 13 9360 i5-8250U
| wPrime 2.10 - 1024m | |
| Lenovo IdeaPad Z40-59422614 | |
| Lenovo ThinkPad 25 | |
| Dell Inspiron 15 7000 7577 | |
| HP Envy x360 15m-bq121dx | |
| Dell XPS 13 9370 i5 UHD | |
* ... Meglio usare valori piccoli
| PCMark 8 Home Score Accelerated v2 | 3471 punti | |
| PCMark 8 Creative Score Accelerated v2 | 4933 punti | |
| PCMark 8 Work Score Accelerated v2 | 4140 punti | |
| PCMark 10 Score | 3678 punti | |
Aiuto | ||
| Dell XPS 13 9370 i5 UHD Toshiba XG5 KXG50ZNV256G | Dell XPS 13 9360 QHD+ i7 Toshiba NVMe THNSN5256GPUK | Samsung Notebook 9 NP900X3N-K01US Samsung CM871a MZNTY256HDHP | HP Spectre x360 13-ac033dx Samsung PM961 NVMe MZVLW512HMJP | Asus ZenBook 13 UX331UN SanDisk SD8SN8U512G1002 | |
|---|---|---|---|---|---|
| AS SSD | -13% | -38% | 65% | -57% | |
| Copy Game MB/s (MB/s) | 291.4 | 534 83% | 186.8 -36% | 1123 285% | 324.3 11% |
| Copy Program MB/s (MB/s) | 207 | 251.4 21% | 213 3% | 466.7 125% | 168.5 -19% |
| Copy ISO MB/s (MB/s) | 357.4 | 285.1 -20% | 335.9 -6% | 1672 368% | 405 13% |
| Score Total (Points) | 2437 | 1570 -36% | 1057 -57% | 2219 -9% | 907 -63% |
| Score Write (Points) | 1135 | 360 -68% | 350 -69% | 832 -27% | 253 -78% |
| Score Read (Points) | 894 | 822 -8% | 463 -48% | 945 6% | 433 -52% |
| Access Time Write * (ms) | 0.038 | 0.033 13% | 0.053 -39% | 0.031 18% | 0.09 -137% |
| Access Time Read * (ms) | 0.063 | 0.065 -3% | 0.066 -5% | 0.036 43% | 0.143 -127% |
| 4K-64 Write (MB/s) | 937 | 205.6 -78% | 223.8 -76% | 566 -40% | 174.9 -81% |
| 4K-64 Read (MB/s) | 657 | 655 0% | 379.4 -42% | 641 -2% | 362.8 -45% |
| 4K Write (MB/s) | 107.2 | 95.6 -11% | 79.2 -26% | 118.5 11% | 49.58 -54% |
| 4K Read (MB/s) | 33.81 | 31.64 -6% | 31.24 -8% | 48.18 43% | 25.47 -25% |
| Seq Write (MB/s) | 907 | 586 -35% | 466 -49% | 1476 63% | 283.3 -69% |
| Seq Read (MB/s) | 2037 | 1346 -34% | 520 -74% | 2556 25% | 448.2 -78% |
* ... Meglio usare valori piccoli

| 3DMark 11 Performance | 2033 punti | |
| 3DMark Ice Storm Standard Score | 65803 punti | |
| 3DMark Cloud Gate Standard Score | 8789 punti | |
| 3DMark Fire Strike Score | 1108 punti | |
| 3DMark Fire Strike Extreme Score | 520 punti | |
Aiuto | ||
| basso | medio | alto | ultra | |
|---|---|---|---|---|
| BioShock Infinite (2013) | 70.9 | 34.5 | 29.9 | 10.1 |
| Rise of the Tomb Raider (2016) | 24.6 | 13.8 |
Rumorosità
| Idle |
| 29 / 29 / 29 dB(A) |
| Sotto carico |
| 32 / 40.1 dB(A) |
 | ||
30 dB silenzioso 40 dB(A) udibile 50 dB(A) rumoroso |
||
min: | ||
| Dell XPS 13 9370 i5 UHD UHD Graphics 620, i5-8250U, Toshiba XG5 KXG50ZNV256G | Dell XPS 13 9360 QHD+ i7 HD Graphics 620, i7-7500U, Toshiba NVMe THNSN5256GPUK | Samsung Notebook 9 NP900X3N-K01US HD Graphics 620, i5-7200U, Samsung CM871a MZNTY256HDHP | Asus ZenBook 13 UX331UN GeForce MX150, i5-8550U, SanDisk SD8SN8U512G1002 | Razer Blade Stealth QHD i7-8550U UHD Graphics 620, i5-8550U, Samsung PM961 NVMe MZVLW512HMJP | Apple MacBook Pro 13 2017 Iris Plus Graphics 640, i5-7360U, Apple SSD AP0128 | |
|---|---|---|---|---|---|---|
| Noise | 0% | 3% | -8% | -4% | -3% | |
| off /ambiente * (dB) | 29 | 28.8 1% | 28.4 2% | 29.6 -2% | 30.5 -5% | 30.2 -4% |
| Idle Minimum * (dB) | 29 | 28.8 1% | 28.4 2% | 29.6 -2% | 30.7 -6% | 30.2 -4% |
| Idle Average * (dB) | 29 | 28.8 1% | 28.4 2% | 29.6 -2% | 30.7 -6% | 30.2 -4% |
| Idle Maximum * (dB) | 29 | 30.8 -6% | 28.4 2% | 29.6 -2% | 32.11 -11% | 30.2 -4% |
| Load Average * (dB) | 32 | 34.8 -9% | 33.2 -4% | 41.7 -30% | 32.9 -3% | 32.9 -3% |
| Load Maximum * (dB) | 40.1 | 34.8 13% | 35.2 12% | 43.5 -8% | 36.4 9% | 39.3 2% |
| Witcher 3 ultra * (dB) | 43.5 |
* ... Meglio usare valori piccoli
(±) La temperatura massima sul lato superiore è di 43.2 °C / 110 F, rispetto alla media di 35.9 °C / 97 F, che varia da 21.4 a 59 °C per questa classe Subnotebook.
(-) Il lato inferiore si riscalda fino ad un massimo di 46.2 °C / 115 F, rispetto alla media di 39.2 °C / 103 F
(+) In idle, la temperatura media del lato superiore è di 26.2 °C / 79 F, rispetto alla media deld ispositivo di 30.8 °C / 87 F.
(+) I poggiapolsi e il touchpad sono piu' freddi della temperatura della pelle con un massimo di 27.4 °C / 81.3 F e sono quindi freddi al tatto.
(±) La temperatura media della zona del palmo della mano di dispositivi simili e'stata di 28.2 °C / 82.8 F (+0.8 °C / 1.5 F).
Dell XPS 13 9370 i5 UHD analisi audio
(-) | altoparlanti non molto potenti (68.9 dB)
Bassi 100 - 315 Hz
(±) | bassi ridotti - in media 8.3% inferiori alla media
(+) | bassi in lineaa (5.6% delta rispetto alla precedente frequenza)
Medi 400 - 2000 Hz
(+) | medi bilanciati - solo only 3.8% rispetto alla media
(+) | medi lineari (5.6% delta rispetto alla precedente frequenza)
Alti 2 - 16 kHz
(+) | Alti bilanciati - appena 2.5% dalla media
(+) | alti lineari (6% delta rispetto alla precedente frequenza)
Nel complesso 100 - 16.000 Hz
(±) | la linearità complessiva del suono è media (15.7% di differenza rispetto alla media
Rispetto alla stessa classe
» 37% di tutti i dispositivi testati in questa classe è stato migliore, 5% simile, 58% peggiore
» Il migliore ha avuto un delta di 5%, medio di 18%, peggiore di 53%
Rispetto a tutti i dispositivi testati
» 24% di tutti i dispositivi testati in questa classe è stato migliore, 5% similare, 71% peggiore
» Il migliore ha avuto un delta di 4%, medio di 24%, peggiore di 134%
Apple MacBook 12 (Early 2016) 1.1 GHz analisi audio
(+) | gli altoparlanti sono relativamente potenti (83.6 dB)
Bassi 100 - 315 Hz
(±) | bassi ridotti - in media 11.3% inferiori alla media
(±) | la linearità dei bassi è media (14.2% delta rispetto alla precedente frequenza)
Medi 400 - 2000 Hz
(+) | medi bilanciati - solo only 2.4% rispetto alla media
(+) | medi lineari (5.5% delta rispetto alla precedente frequenza)
Alti 2 - 16 kHz
(+) | Alti bilanciati - appena 2% dalla media
(+) | alti lineari (4.5% delta rispetto alla precedente frequenza)
Nel complesso 100 - 16.000 Hz
(+) | suono nel complesso lineare (10.2% differenza dalla media)
Rispetto alla stessa classe
» 7% di tutti i dispositivi testati in questa classe è stato migliore, 2% simile, 91% peggiore
» Il migliore ha avuto un delta di 5%, medio di 18%, peggiore di 53%
Rispetto a tutti i dispositivi testati
» 5% di tutti i dispositivi testati in questa classe è stato migliore, 1% similare, 94% peggiore
» Il migliore ha avuto un delta di 4%, medio di 24%, peggiore di 134%
| Off / Standby | |
| Idle | |
| Sotto carico |
|
Leggenda:
min: | |
| Dell XPS 13 9370 i5 UHD i5-8250U, UHD Graphics 620, Toshiba XG5 KXG50ZNV256G, IPS, 3840x2160, 13.3" | Dell XPS 13 i5-8250U i5-8250U, UHD Graphics 620, Toshiba XG5 KXG50ZNV256G, IGZO IPS, 3200x1800, 13.3" | Dell XPS 13 9360 FHD i7 Iris i7-7560U, Iris Plus Graphics 640, Toshiba XG4 NVMe (THNSN5512GPUK), IPS, 1920x1080, 13.3" | Dell XPS 13 9360 FHD i5 i5-7200U, HD Graphics 620, Toshiba NVMe THNSN5256GPUK, IPS, 1920x1080, 13.3" | Dell XPS 13 9365-4537 2-in-1 i5-7Y54, HD Graphics 615, Toshiba NVMe THNSN5256GPUK, IPS, 3200x1800, 13.3" | Dell XPS 13 9350 WQXGA 6560U, Iris Graphics 540, Samsung PM951 NVMe 512 GB, IPS, 3200x1800, 13.3" | |
|---|---|---|---|---|---|---|
| Power Consumption | 7% | 24% | 37% | -16% | -11% | |
| Idle Minimum * (Watt) | 4.3 | 3.6 16% | 3.32 23% | 4.1 5% | 8.2 -91% | 7.2 -67% |
| Idle Average * (Watt) | 8 | 7.9 1% | 5.27 34% | 4.2 47% | 10.8 -35% | 9.3 -16% |
| Idle Maximum * (Watt) | 8.1 | 8.5 -5% | 6.32 22% | 5.1 37% | 12.7 -57% | 11.6 -43% |
| Load Average * (Watt) | 46.6 | 43 8% | 32 31% | 22.1 53% | 22.6 52% | 31.9 32% |
| Load Maximum * (Watt) | 49.8 | 43 14% | 45.9 8% | 29.4 41% | 24.6 51% | 29.9 40% |
* ... Meglio usare valori piccoli
| Dell XPS 13 9370 i5 UHD i5-8250U, UHD Graphics 620, 52 Wh | Samsung Notebook 9 NP900X3N-K01US i5-7200U, HD Graphics 620, 30 Wh | Asus ZenBook 13 UX331UN i5-8550U, GeForce MX150, 50 Wh | Razer Blade Stealth QHD i7-8550U i5-8550U, UHD Graphics 620, 53.6 Wh | Apple MacBook Pro 13 2017 i5-7360U, Iris Plus Graphics 640, 54.5 Wh | Dell XPS 13 9360 QHD+ i7 i7-7500U, HD Graphics 620, 60 Wh | |
|---|---|---|---|---|---|---|
| Autonomia della batteria | -32% | 29% | -12% | 20% | 23% | |
| Reader / Idle (h) | 14.5 | 11.6 -20% | 22 52% | 17.6 21% | ||
| WiFi v1.3 (h) | 6.8 | 4.7 -31% | 8.4 24% | 6 -12% | 11.4 68% | 8.6 26% |
| Load (h) | 1.8 | 1 -44% | 2 11% | 1.3 -28% | 2.2 22% | |
| Witcher 3 ultra (h) | 1.9 |
Pro
Contro
L'XPS 13 9370 è sicuramente migliore rispetto all'XPS 13 9360? Per molti aspetti è un passo avanti mentre in altri settori non è migliorato. L'autonomia, ad esempio, e uguale se non inferiore, così come i tasti della tastiera, i tempi di risposta del display, e la rigidità dello chassis. Se in precedenza nessuno di questi problemi era fondamentale, riteniamo che in questo modello più sottile lo spessore sia andato a discapito di altre qualità del portatile. I temi di risposta del display incredibilmente lunghi, in particolare, offendono gli utenti che sono abituati a monitors 5 ms/120 Hz.
Internamente, molte modifiche puntano a riduzione delle temperature e della rumorosità, che sono i principali problemi quando si riducono le dimensioni. Il sistema di raffreddamento più grande e l'introduzione di un GORE con isolamento termico consentono al sistema di funzionare con temperature più basse senza far aumentare molto la rotazione della ventola.
Infine la Dynamic Power Policy è da lodare per come gestisce al meglio le prestazioni del processore ULV. E' un'impresa notevole in quanto il processore i5-8250U si scalda di più sull'XPS 13 9370 rispetto all'XPS 13 9360 se teniamo sott'occhio temperature di superficie e rumorosità della ventola.
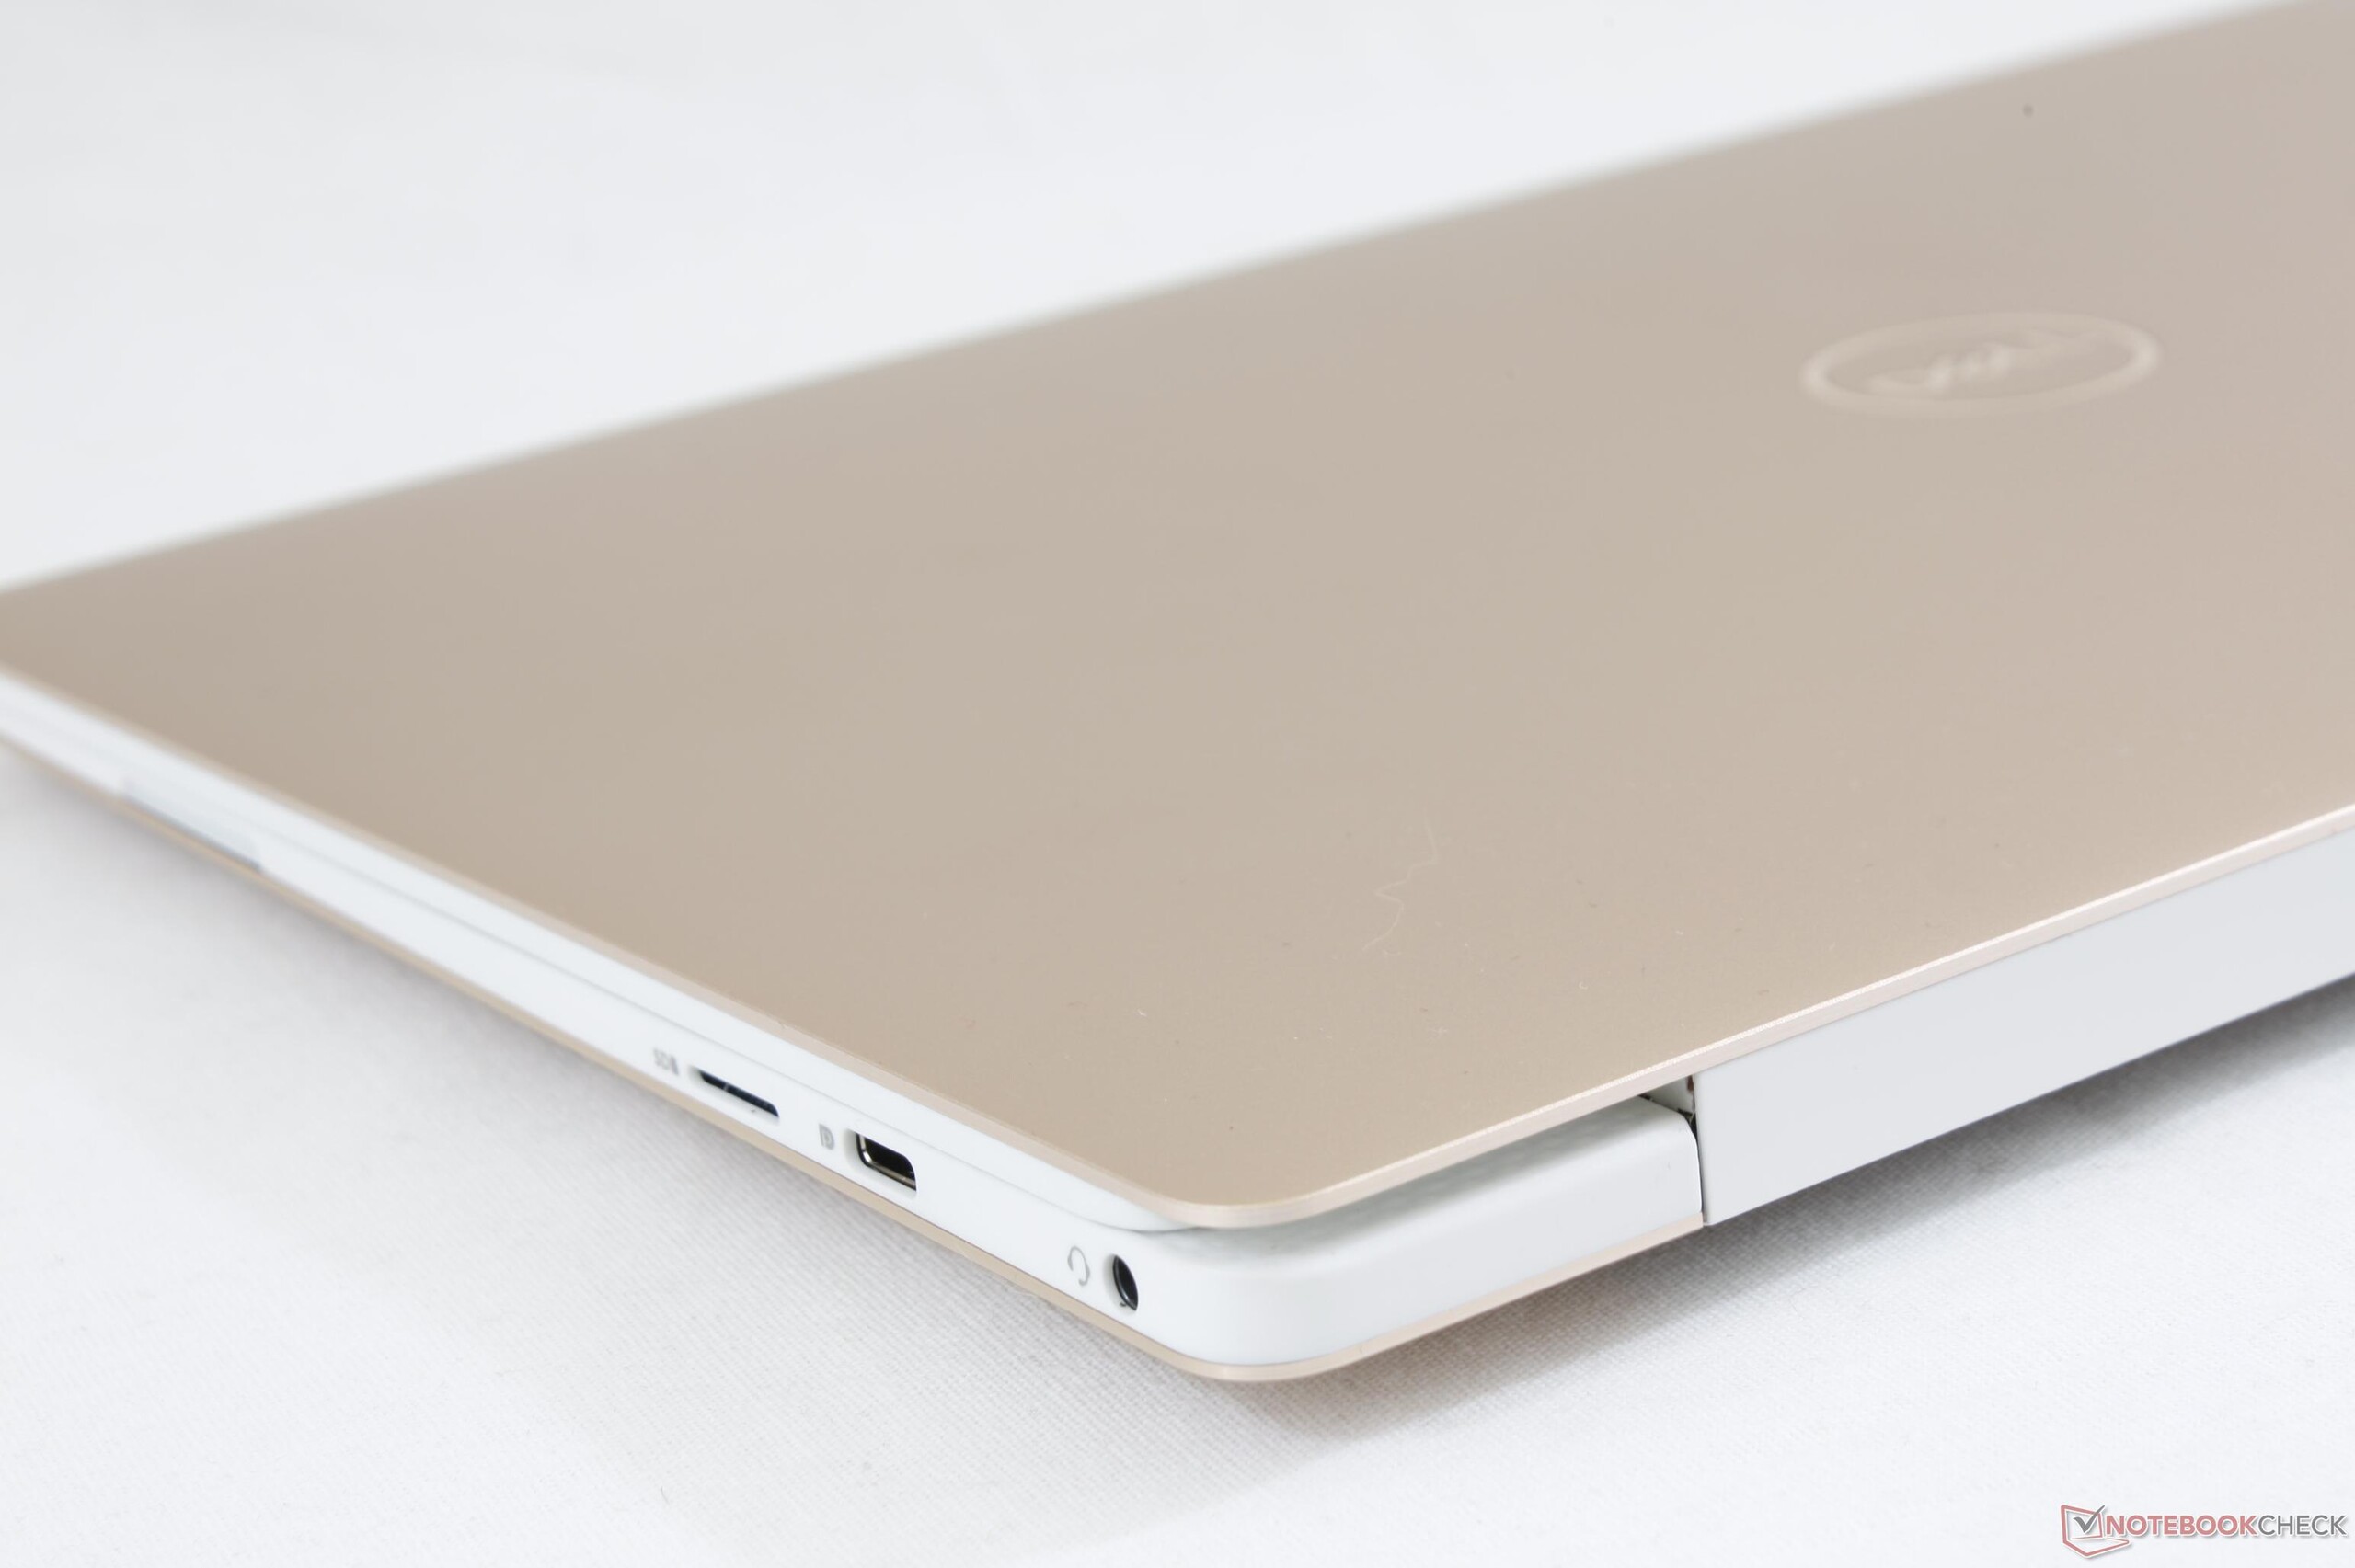
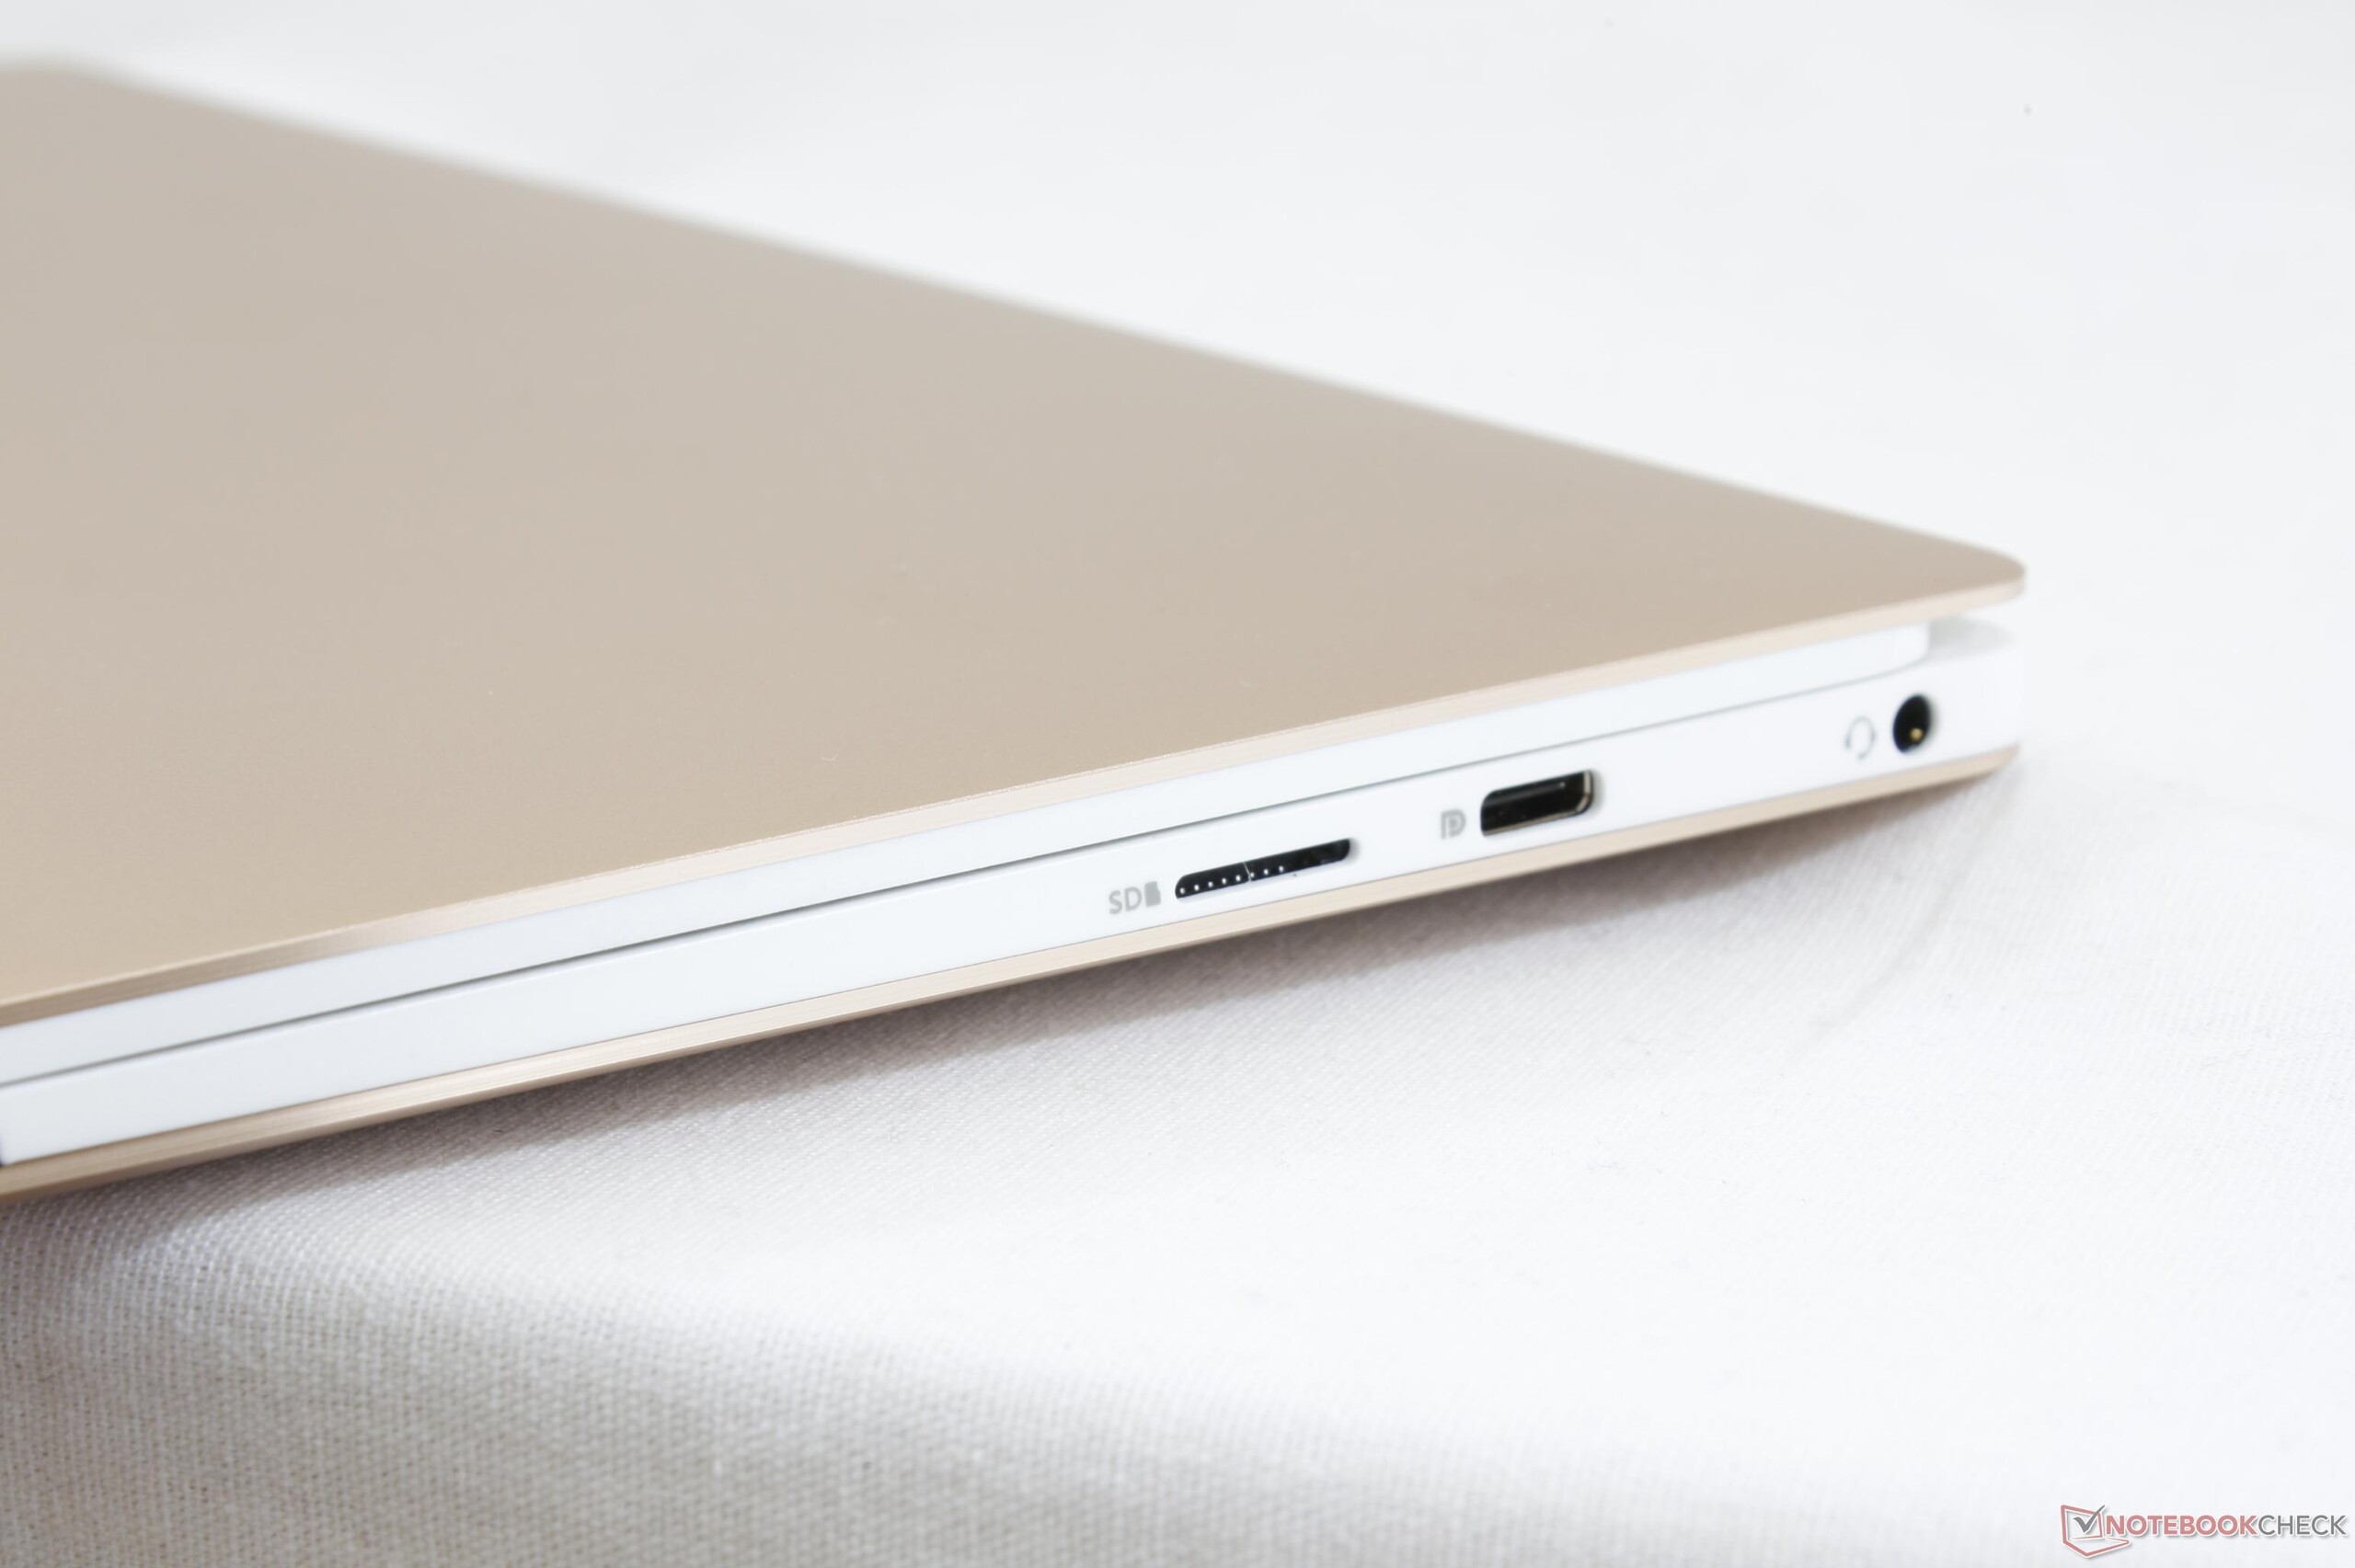
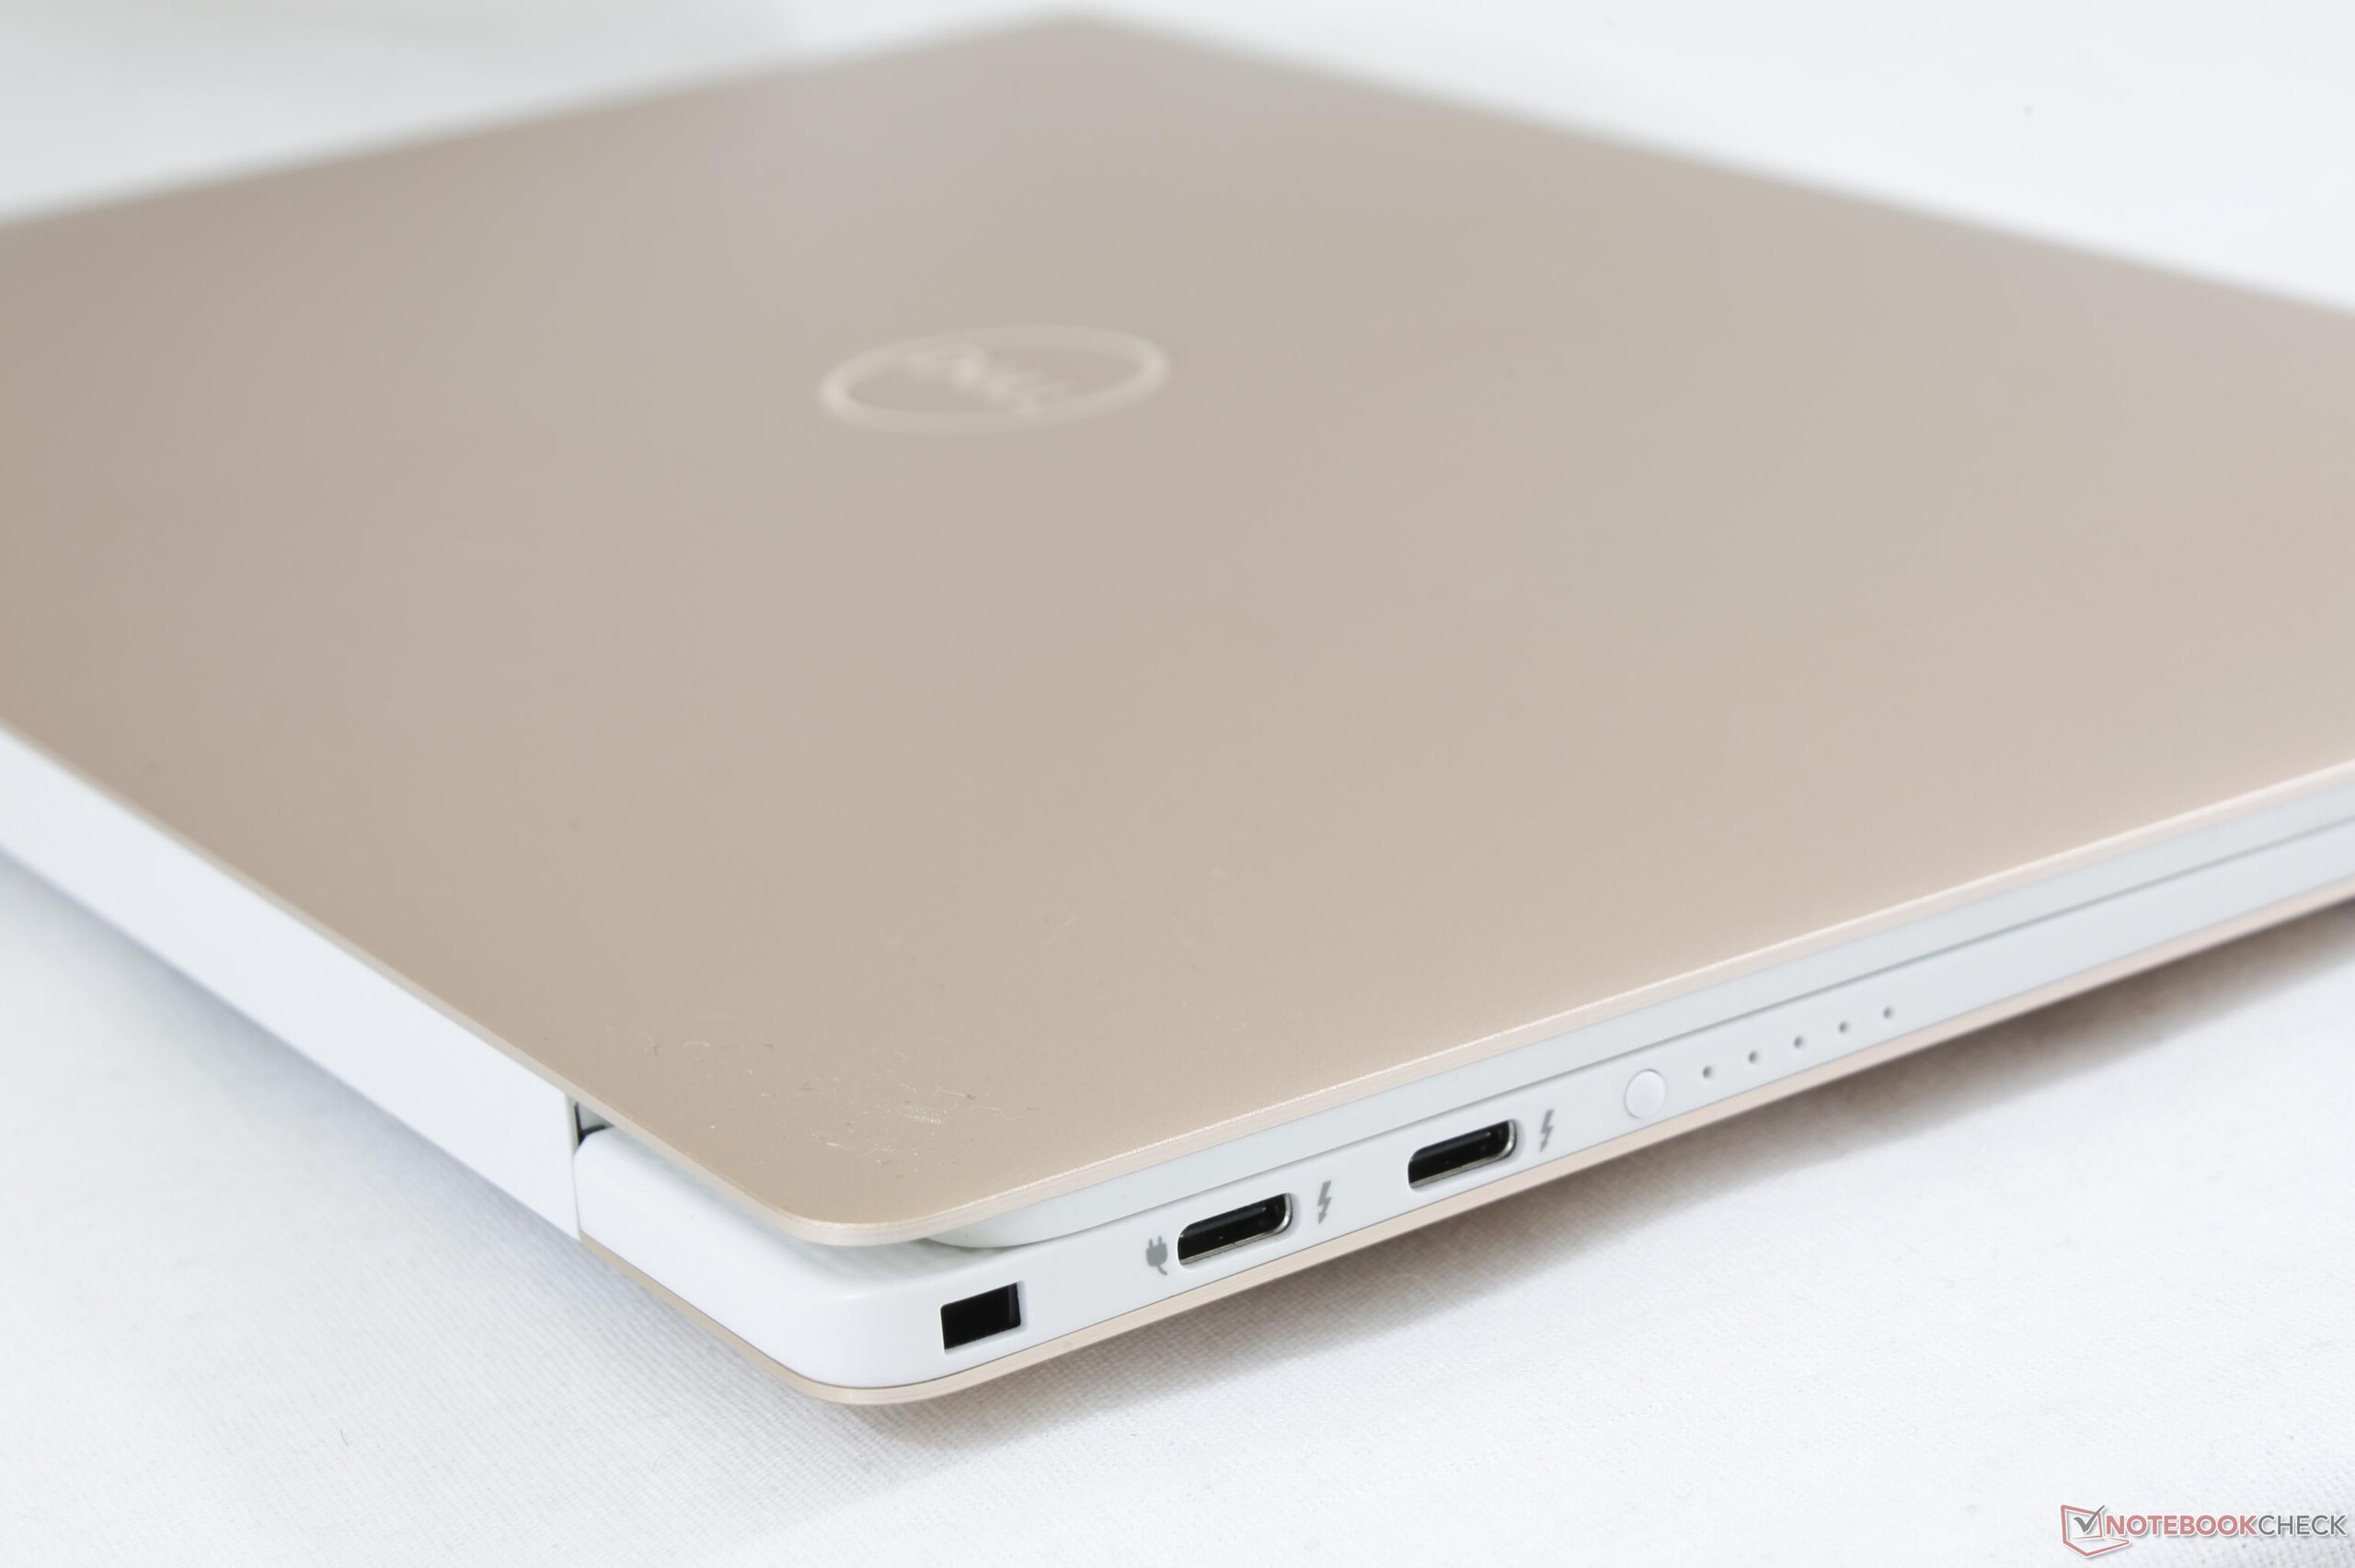
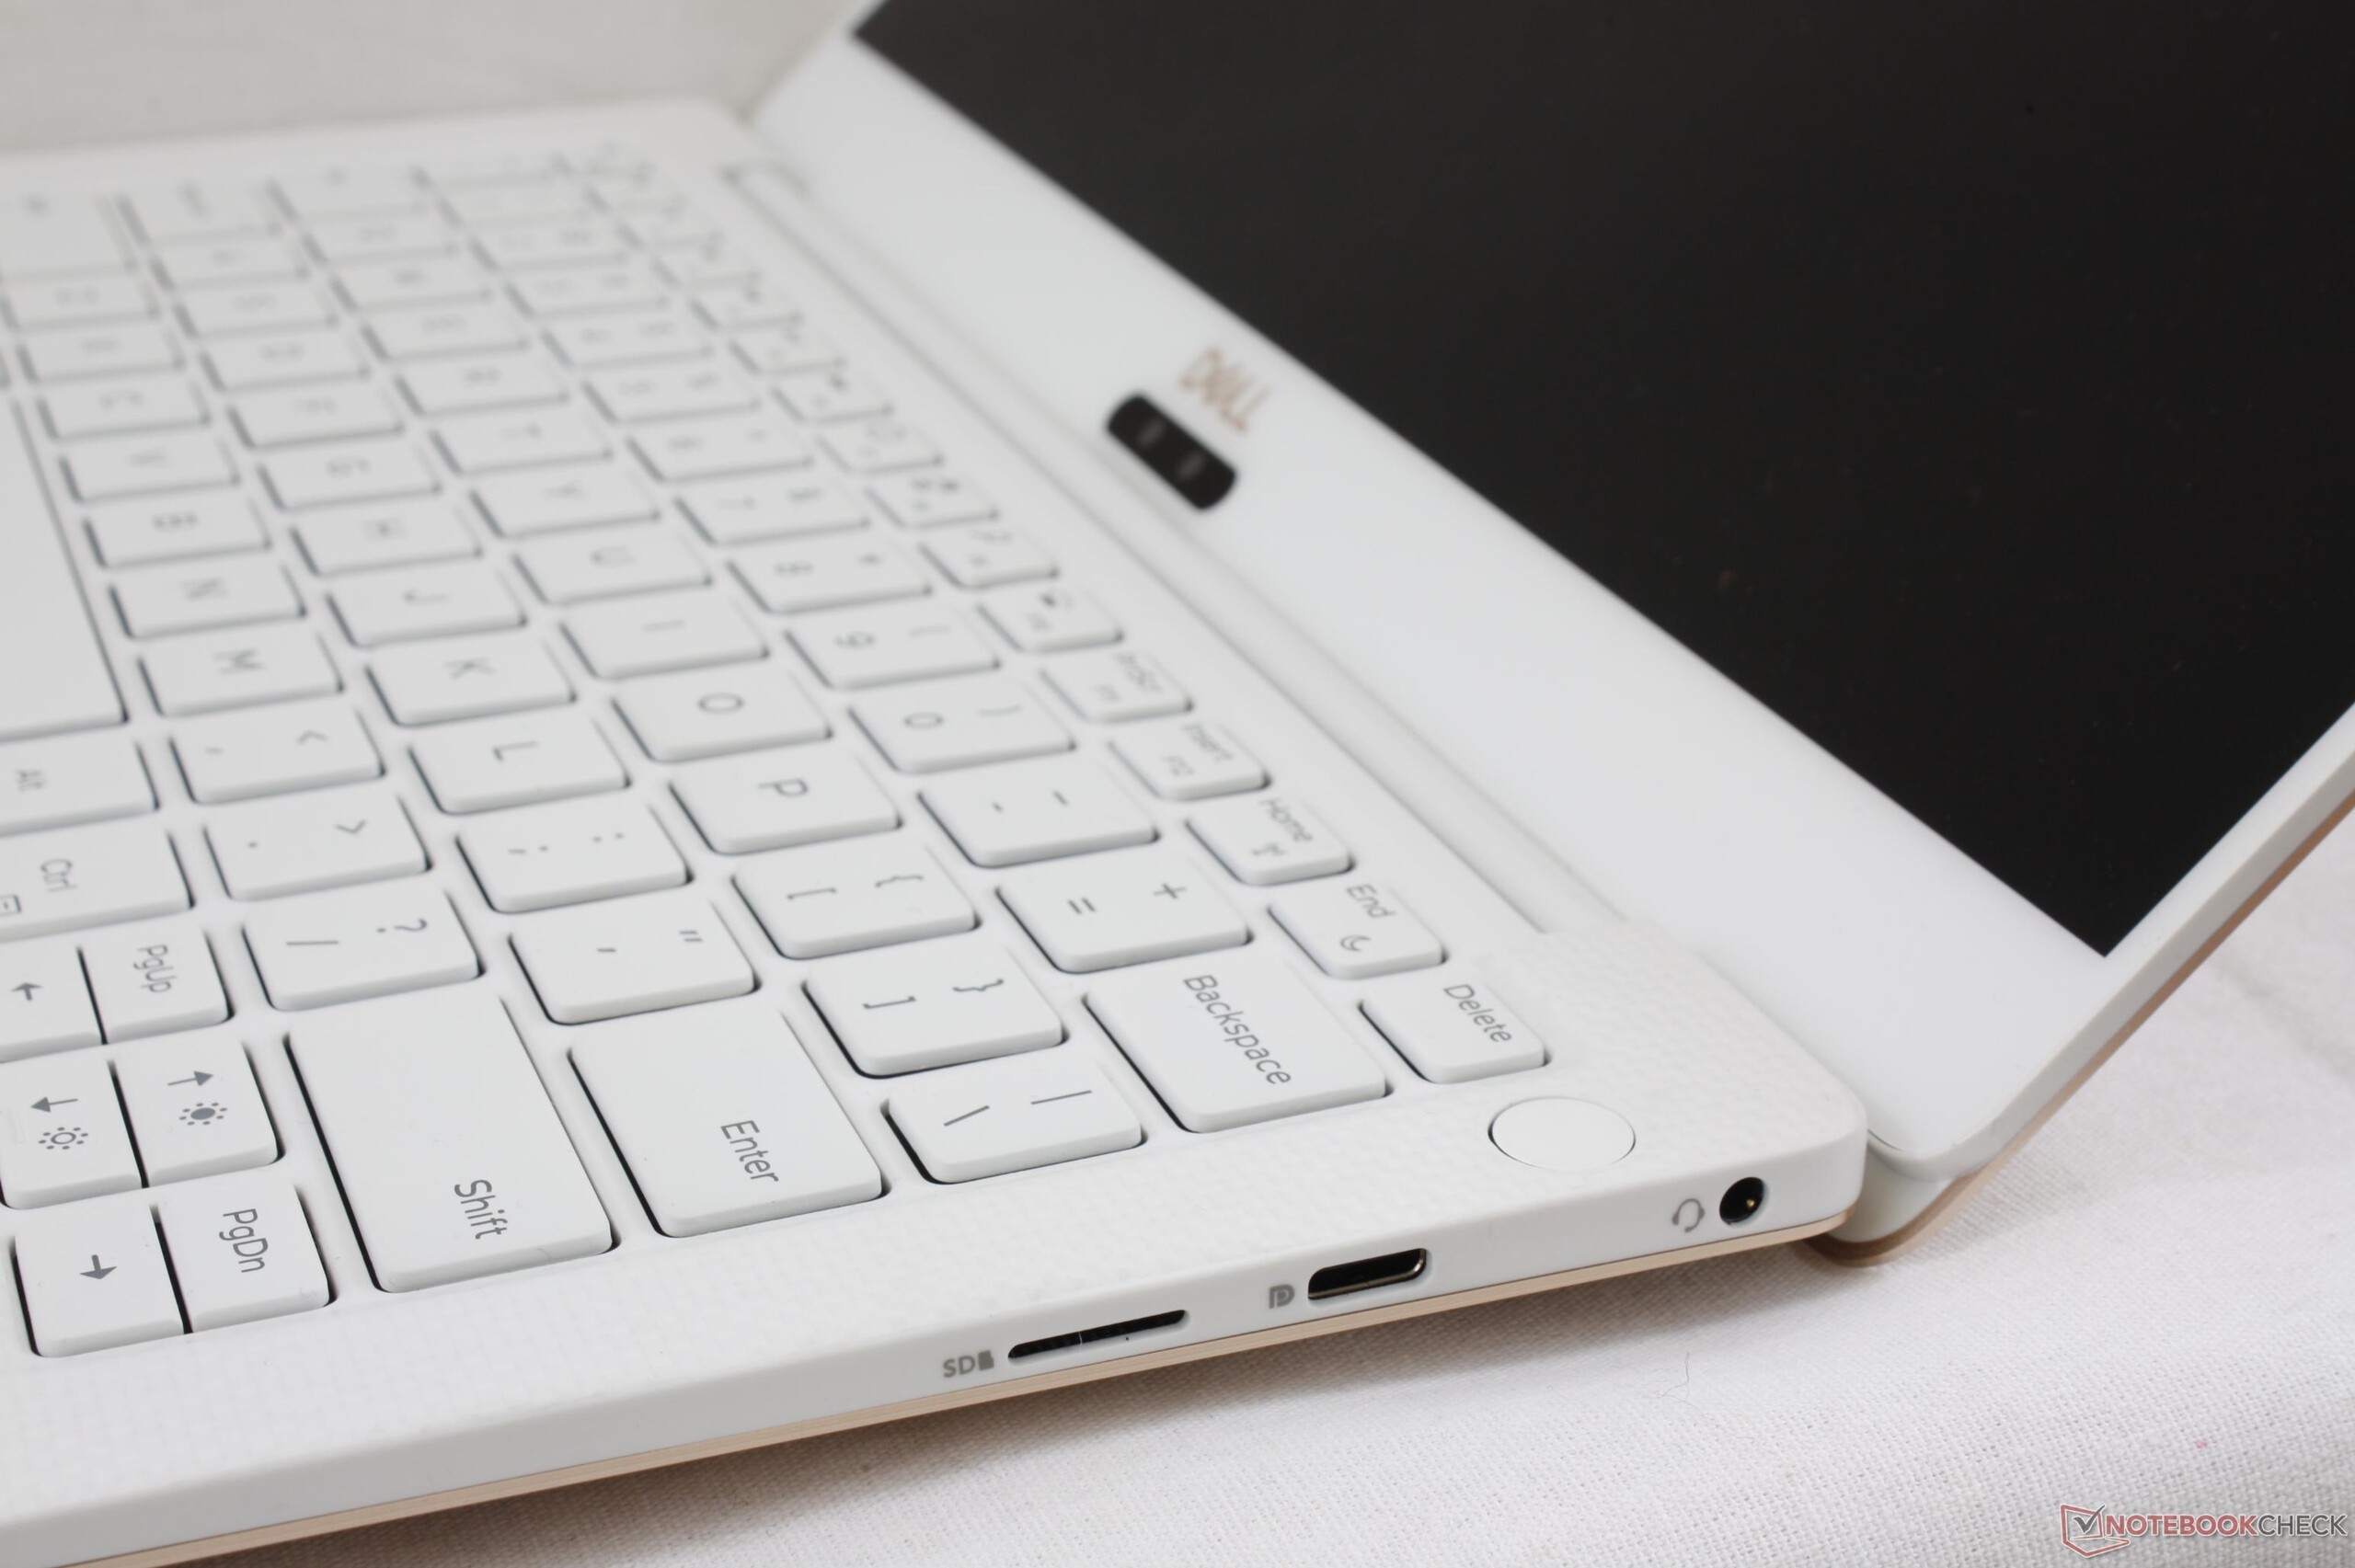
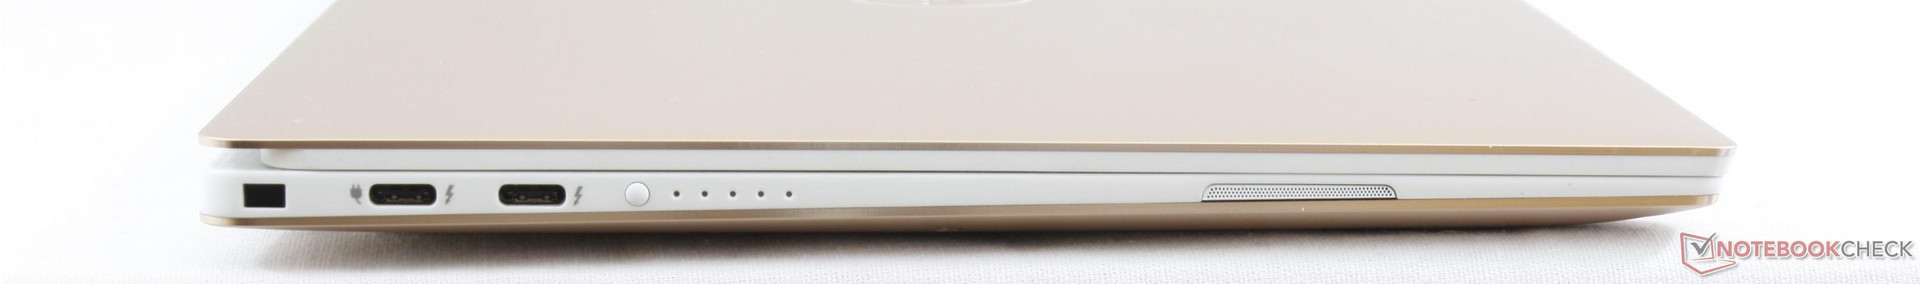
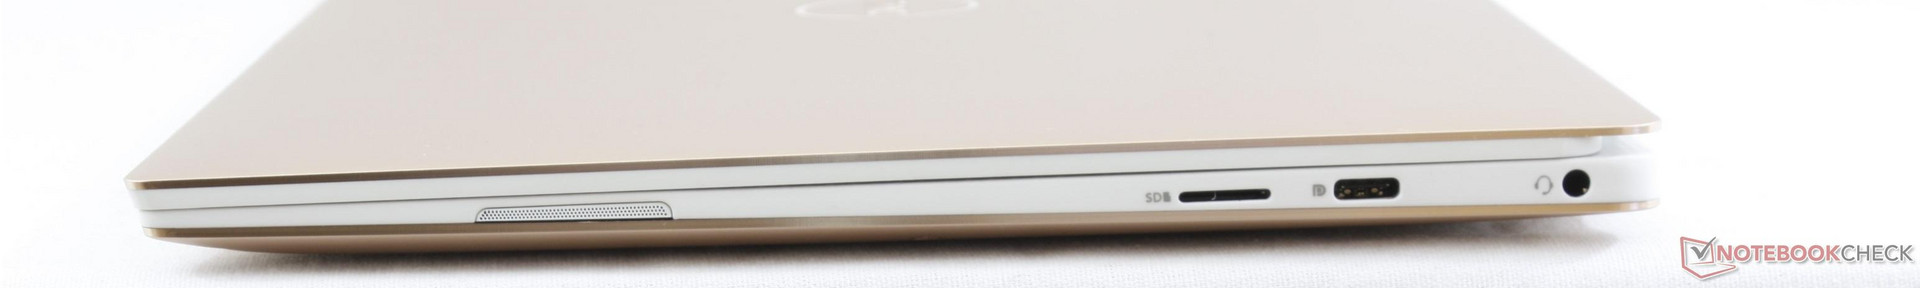
Detto questo, i possessori dell'XPS 13 9360 non si perdono molto con quest'ultima versione considerando che tastiera, peso, processore, casse, webcam, e chassis sono praticamente gli stessi. La differenza di prestazioni potrebbe fare comodo, ma si nota poco con carichi di lavoro medi o bassi come word processing, browsing, o riproduzione video. Pertanto, il principale incentivo per effettuare l'upgrade riguarda altri aspetti. Se non siete attratti da basi più strette, retroilluminazione più forte, e un profilo più sottile allora i motivi per fare l'upgrade sono pochi perché perderete le porte USB Type-A, un lettore SD full-size, uno chassis leggermente più robusto, e una batteria più grande.
Per i possessori di Ultrabooks concorrenti, l'XPS 13 9370 ha più di un motivo per effettuare lo switch. Ma anche il precedente XPS 13 9360 ha da dire la sua in quanto mantiene molti vantaggi rispetto all'XPS 9370 come detto. Gli utenti del MacBook Pro 13 non devono temere in quanto il sistema Apple resta più potente, luminoso, con una maggiore autonomia ed un trackpad facile da usare.
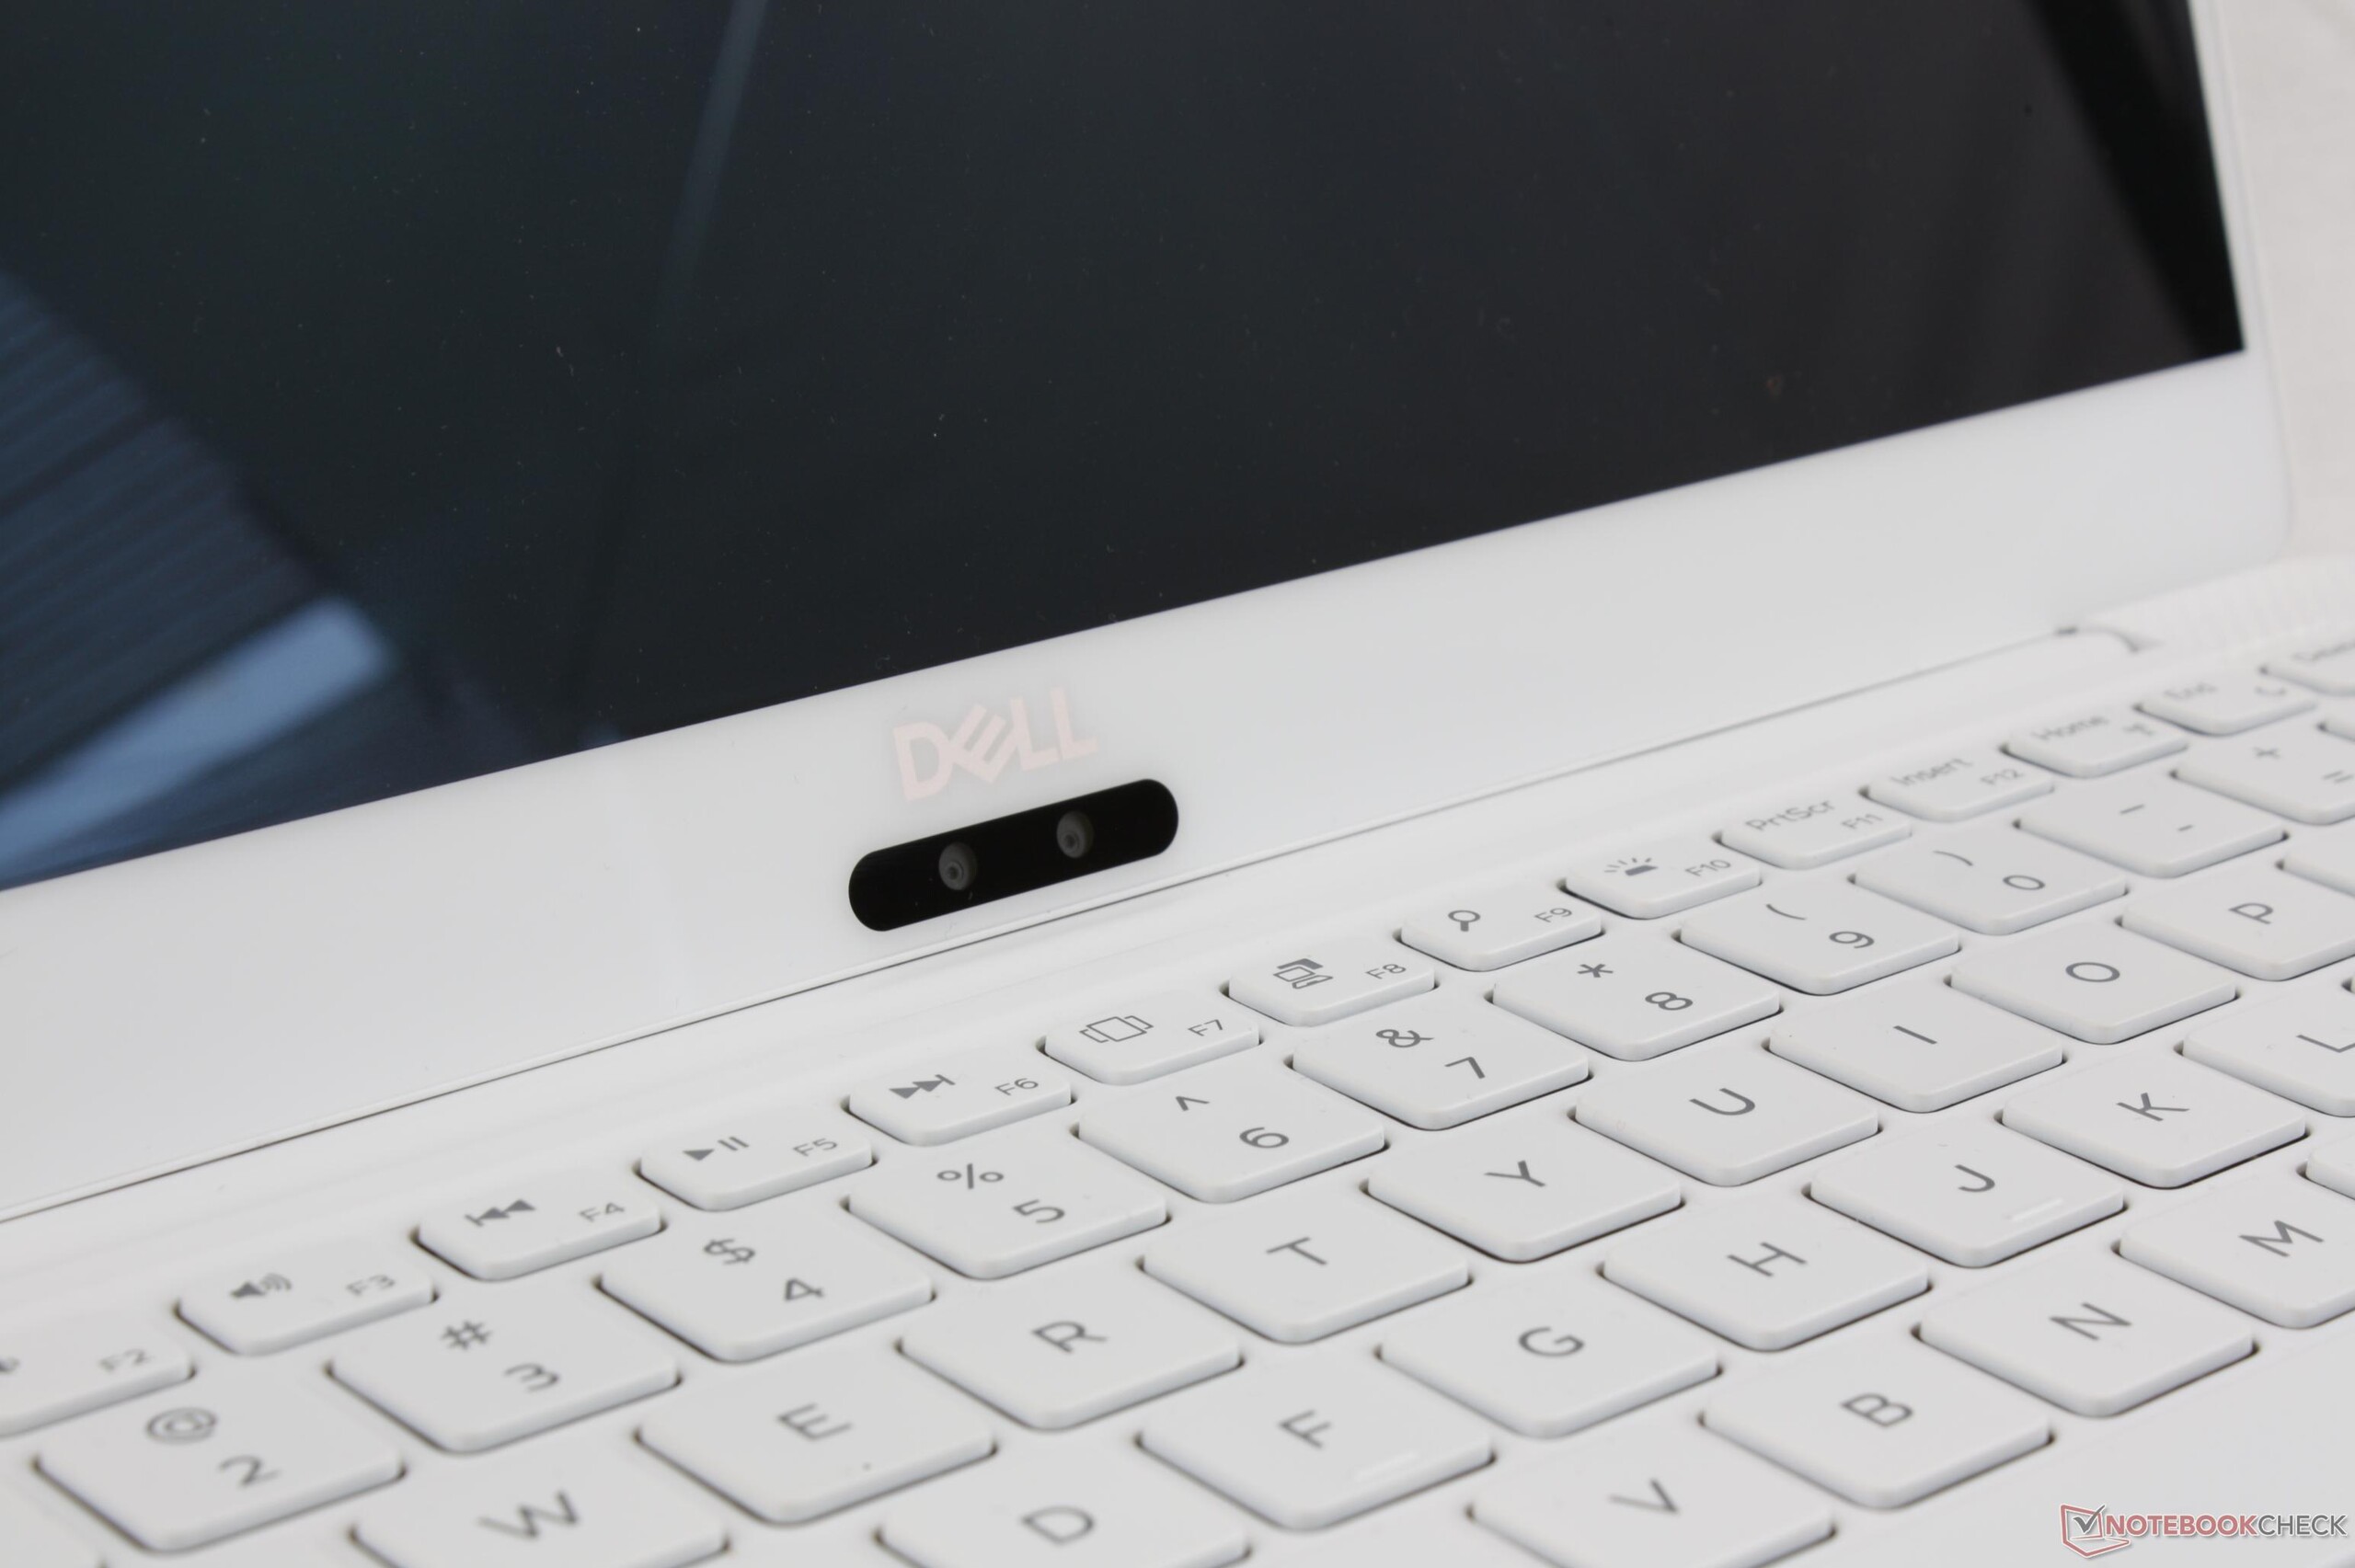
L'XPS 13 9370 è il classico esempio di come fare qualche passo avanti e qualche passo indietro. E' un miglioramento rispetto all'ultima generazione se aspetto, dimensione, risoluzione e luminosità sono importanti, ma gli altri aspetti chiave come autonomia, tempi di risposta, rigidità, posizione della webcam, e connettività sembrano aver fatto un passo indietro.
Nota: si tratta di una recensione breve, con alcune sezioni non tradotte, per la versione integrale in inglese guardate qui.
Dell XPS 13 9370 i5 UHD
- 02/01/2018 v6 (old)
Allen Ngo
Price comparison
