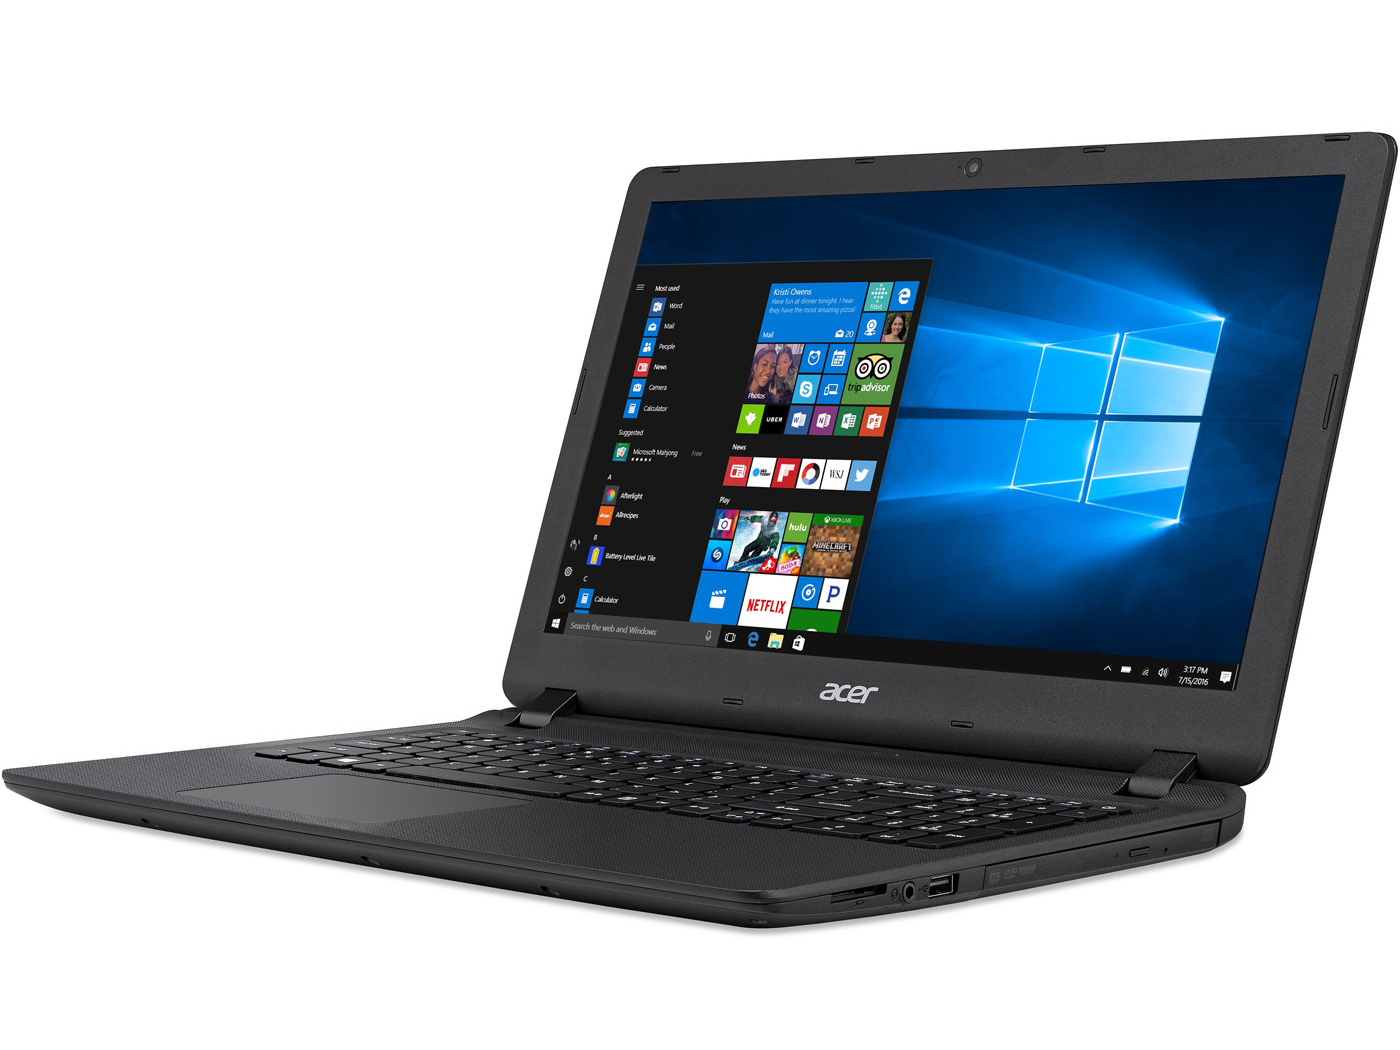
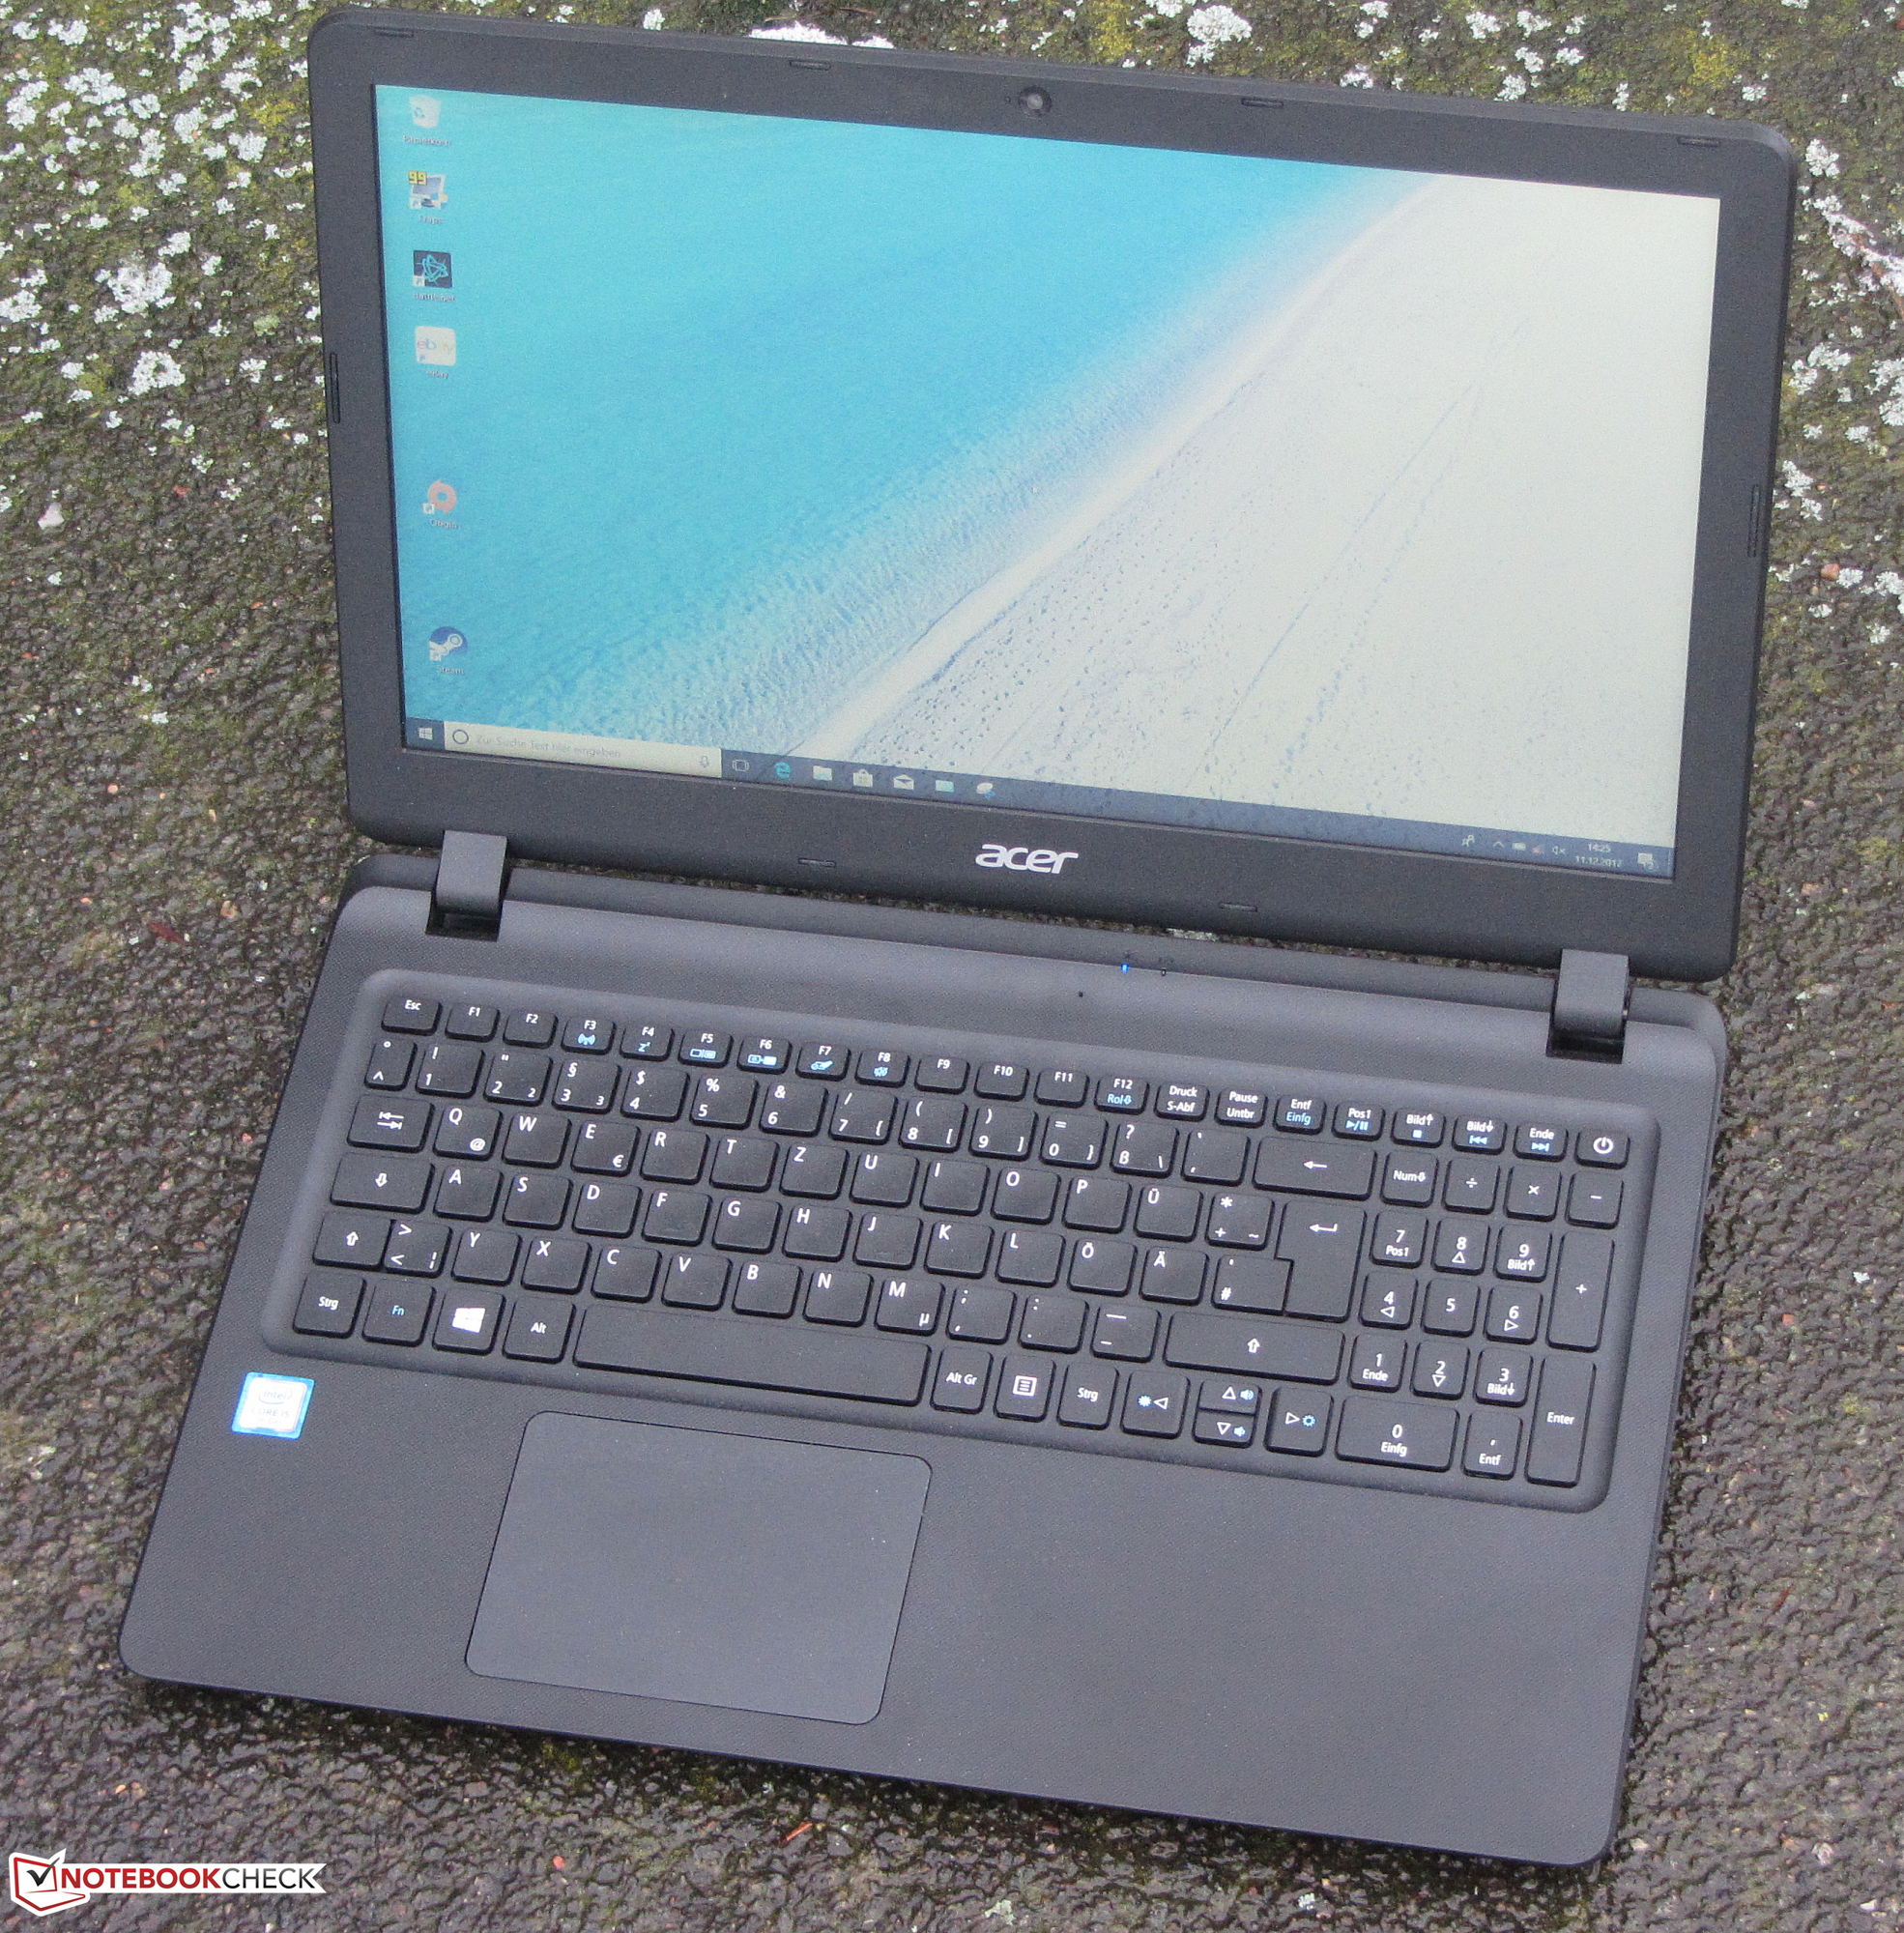
Recensione breve del Portatile Acer Extensa 2540 (i5-7200U, FHD)
| SD Card Reader | |
| average JPG Copy Test (av. of 3 runs) | |
| Asus ASUSPRO P541UA-GQ1532 (Toshiba Exceria Pro SDXC 64 GB UHS-II) | |
| Acer Aspire 3 A315-21-651Y (Toshiba Exceria Pro SDXC 64 GB UHS-II) | |
| Asus VivoBook S15 S510UA (Toshiba Exceria Pro SDXC 64 GB UHS-II) | |
| HP 15-ba077ng (Toshiba Exceria Pro SDXC 64 GB UHS-II) | |
| Lenovo Ideapad 110-15ACL 80TJ00H0GE (Toshiba Exceria Pro SDXC 64 GB UHS-II) | |
| Lenovo IdeaPad V110-15IKB 80TH001SGE (Toshiba Exceria Pro SDXC 64 GB UHS-II) | |
| Acer Extensa 2540-580K (Toshiba Exceria Pro SDXC 64 GB UHS-II) | |
| HP 15-ay116ng (Toshiba Exceria Pro SDXC 64 GB UHS-II) | |
| maximum AS SSD Seq Read Test (1GB) | |
| Acer Aspire 3 A315-21-651Y (Toshiba Exceria Pro SDXC 64 GB UHS-II) | |
| Lenovo Ideapad 110-15ACL 80TJ00H0GE (Toshiba Exceria Pro SDXC 64 GB UHS-II) | |
| HP 15-ba077ng (Toshiba Exceria Pro SDXC 64 GB UHS-II) | |
| Asus VivoBook S15 S510UA (Toshiba Exceria Pro SDXC 64 GB UHS-II) | |
| Lenovo IdeaPad V110-15IKB 80TH001SGE (Toshiba Exceria Pro SDXC 64 GB UHS-II) | |
| Acer Extensa 2540-580K (Toshiba Exceria Pro SDXC 64 GB UHS-II) | |
| HP 15-ay116ng (Toshiba Exceria Pro SDXC 64 GB UHS-II) | |
| |||||||||||||||||||||||||
Distribuzione della luminosità: 92 %
Al centro con la batteria: 215 cd/m²
Contrasto: 316:1 (Nero: 0.68 cd/m²)
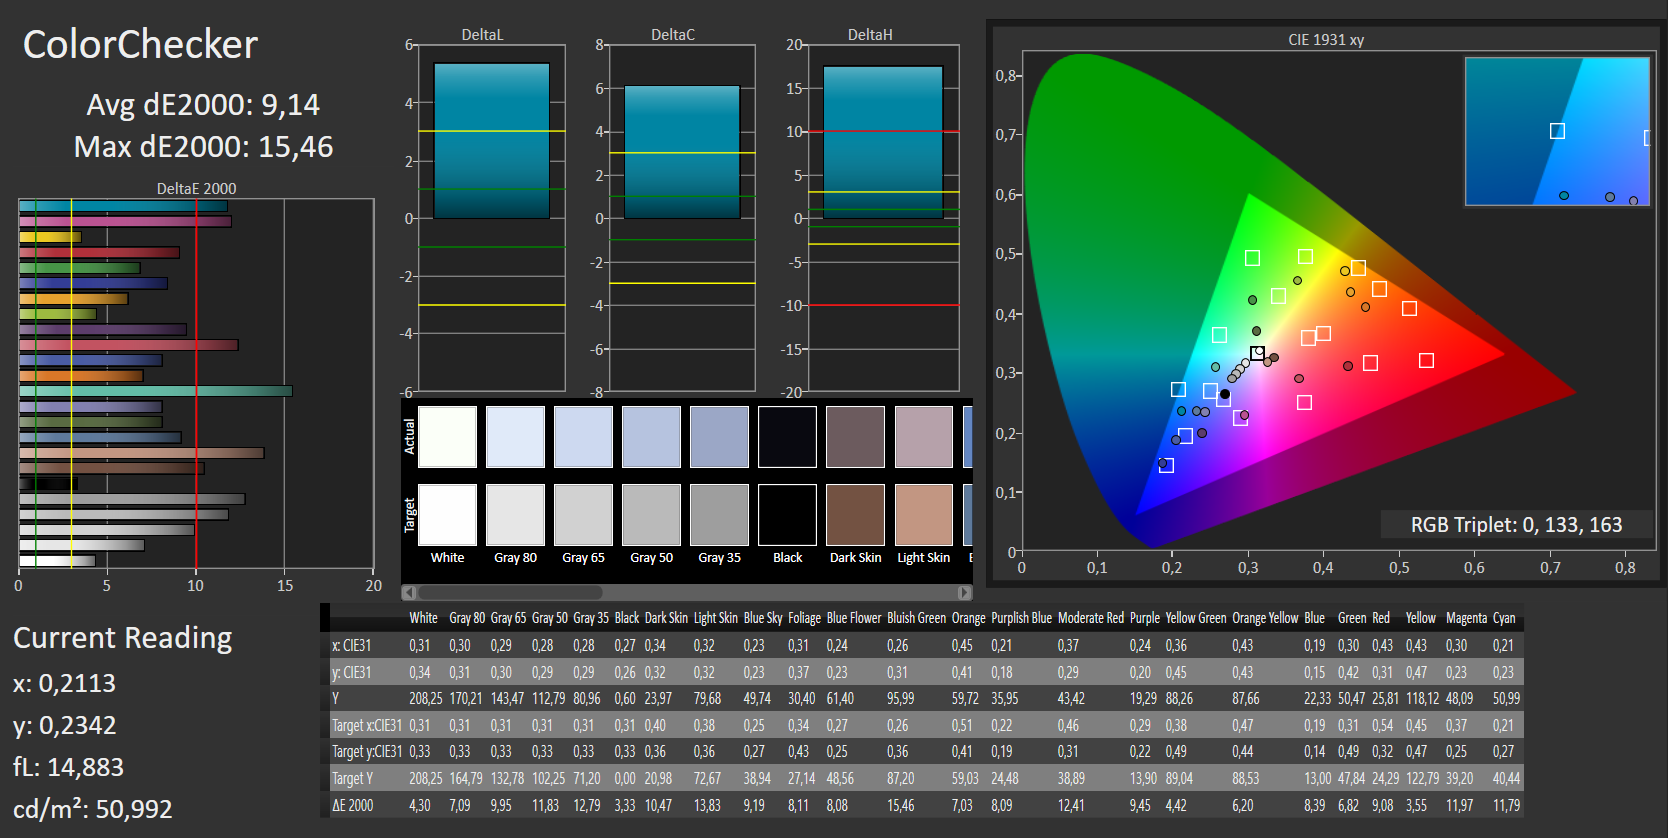
ΔE ColorChecker Calman: 9.14 | ∀{0.5-29.43 Ø4.72}
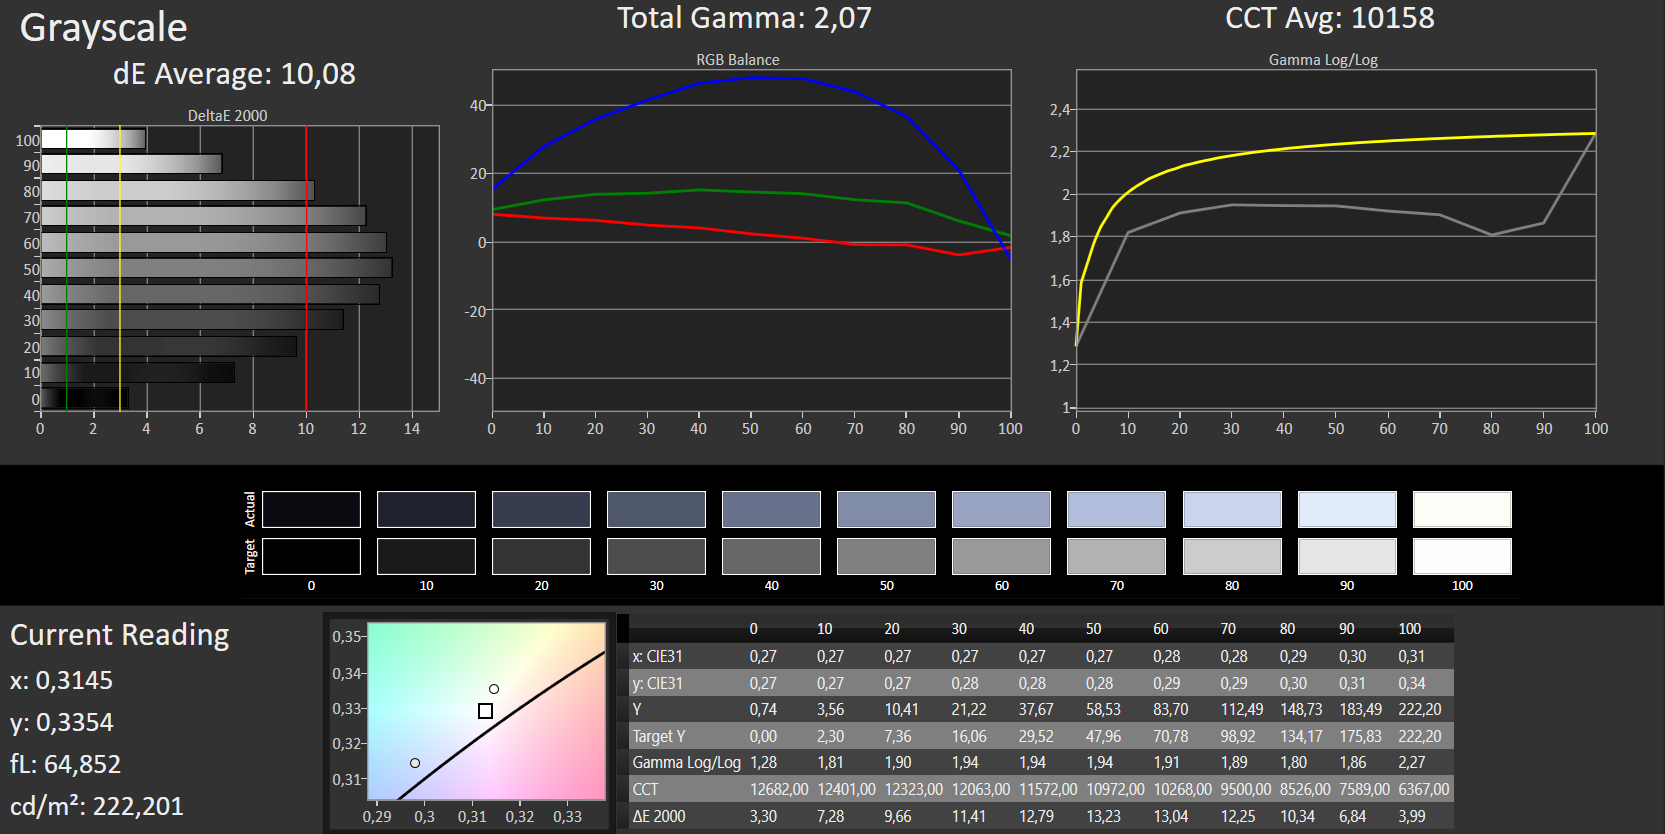
ΔE Greyscale Calman: 10.08 | ∀{0.09-98 Ø4.97}
56% sRGB (Argyll 1.6.3 3D)
36% AdobeRGB 1998 (Argyll 1.6.3 3D)
38.84% AdobeRGB 1998 (Argyll 3D)
56.5% sRGB (Argyll 3D)
37.59% Display P3 (Argyll 3D)
Gamma: 2.07
CCT: 10158 K
| Acer Extensa 2540-580K TN LED, 1920x1080, 15.6" | Lenovo IdeaPad V110-15IKB 80TH001SGE TN LED, 1366x768, 15.6" | HP 15-ba077ng TN LED, 1920x1080, 15.6" | HP 15-ay116ng TN LED, 1920x1080, 15.6" | Asus ASUSPRO P541UA-GQ1532 TN LED, 1366x768, 15.6" | Acer Aspire 3 A315-21-651Y TN LED, 1366x768, 15.6" | Lenovo Ideapad 110-15ACL 80TJ00H0GE TN LED, 1366x768, 15.6" | |
|---|---|---|---|---|---|---|---|
| Display | 4% | 6% | -1% | 5% | -1% | ||
| Display P3 Coverage (%) | 37.59 | 38.91 4% | 39.98 6% | 37.34 -1% | 39.48 5% | 37.39 -1% | |
| sRGB Coverage (%) | 56.5 | 58.6 4% | 60.2 7% | 56.2 -1% | 59.2 5% | 56.2 -1% | |
| AdobeRGB 1998 Coverage (%) | 38.84 | 40.2 4% | 41.31 6% | 38.58 -1% | 40.81 5% | 38.63 -1% | |
| Response Times | 10% | -1% | -2% | 18% | -9% | -23% | |
| Response Time Grey 50% / Grey 80% * (ms) | 41 ? | 39 ? 5% | 42 ? -2% | 40 ? 2% | 47 ? -15% | 48 ? -17% | 58 -41% |
| Response Time Black / White * (ms) | 22 ? | 19 ? 14% | 22 ? -0% | 23 ? -5% | 11 ? 50% | 22 ? -0% | 23 -5% |
| PWM Frequency (Hz) | 27000 ? | 10000 ? | 50 ? | 200 ? | 25000 ? | 200 ? | |
| Screen | 3% | -7% | 5% | 7% | 5% | 12% | |
| Brightness middle (cd/m²) | 215 | 243 13% | 209 -3% | 249 16% | 262 22% | 223 4% | 253 18% |
| Brightness (cd/m²) | 217 | 233 7% | 200 -8% | 234 8% | 250 15% | 220 1% | 246 13% |
| Brightness Distribution (%) | 92 | 75 -18% | 88 -4% | 89 -3% | 83 -10% | 88 -4% | 86 -7% |
| Black Level * (cd/m²) | 0.68 | 0.45 34% | 0.56 18% | 0.44 35% | 0.47 31% | 0.44 35% | |
| Contrast (:1) | 316 | 540 71% | 373 18% | 566 79% | 474 50% | 575 82% | |
| Colorchecker dE 2000 * | 9.14 | 11.69 -28% | 12.21 -34% | 11.71 -28% | 10.72 -17% | 9.2 -1% | |
| Colorchecker dE 2000 max. * | 15.46 | 20.08 -30% | 20.66 -34% | 19.51 -26% | 17.7 -14% | 17.68 -14% | |
| Greyscale dE 2000 * | 10.08 | 13.12 -30% | 13.48 -34% | 13.13 -30% | 10.07 -0% | 11.81 -17% | 11.05 -10% |
| Gamma | 2.07 106% | 2.24 98% | 2.34 94% | 2.57 86% | 2.36 93% | 2.32 95% | 2.55 86% |
| CCT | 10158 64% | 16905 38% | 15364 42% | 15273 43% | 10532 62% | 13530 48% | 11451 57% |
| Color Space (Percent of AdobeRGB 1998) (%) | 36 | 37 3% | 38 6% | 36 0% | 38 6% | 36 0% | |
| Color Space (Percent of sRGB) (%) | 56 | 59 5% | 60 7% | 56 0% | 59 5% | 56 0% | |
| Media totale (Programma / Settaggio) | 6% /
4% | -1% /
-3% | 1% /
3% | 13% /
10% | 0% /
3% | -4% /
4% |
* ... Meglio usare valori piccoli
Sfarfallio dello schermo / PWM (Pulse-Width Modulation)
| flickering dello schermo / PWM rilevato | 27000 Hz | ≤ 90 % settaggio luminosita' | 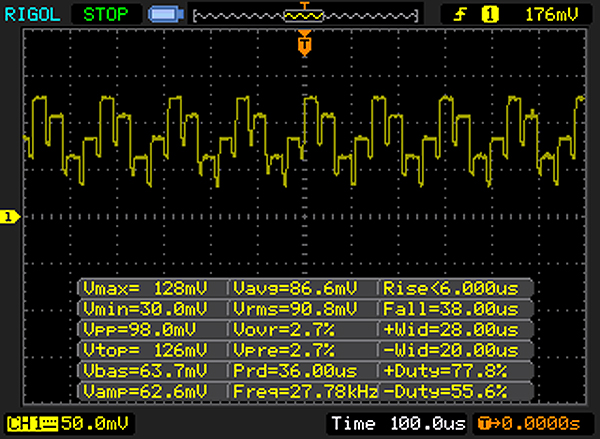 |
Il display sfarfalla a 27000 Hz (Probabilmente a causa dell'uso di PWM) Flickering rilevato ad una luminosita' di 90 % o inferiore. Non dovrebbe verificarsi flickering o PWM sopra questo valore di luminosita'. La frequenza di 27000 Hz è abbastanza alta, quindi la maggioranza degli utenti sensibili al PWM non dovrebbero notare alcun flickering. In confronto: 52 % di tutti i dispositivi testati non utilizza PWM per ridurre la luminosita' del display. Se è rilevato PWM, una media di 7750 (minimo: 5 - massimo: 343500) Hz è stata rilevata. | |||
Tempi di risposta del Display
| ↔ Tempi di risposta dal Nero al Bianco | ||
|---|---|---|
| 22 ms ... aumenta ↗ e diminuisce ↘ combinato | ↗ 18 ms Incremento | 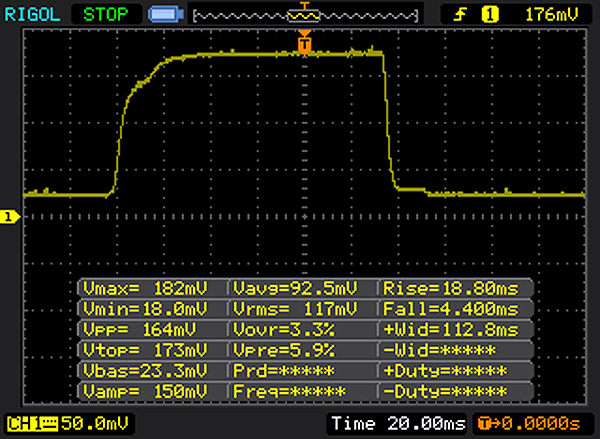 |
| ↘ 4 ms Calo | ||
| Lo schermo mostra buoni tempi di risposta durante i nostri tests, ma potrebbe essere troppo lento per i gamers competitivi. In confronto, tutti i dispositivi di test variano da 0.1 (minimo) a 240 (massimo) ms. » 49 % di tutti i dispositivi è migliore. Questo significa che i tempi di risposta rilevati sono peggiori rispetto alla media di tutti i dispositivi testati (19.8 ms). | ||
| ↔ Tempo di risposta dal 50% Grigio all'80% Grigio | ||
| 41 ms ... aumenta ↗ e diminuisce ↘ combinato | ↗ 21 ms Incremento | 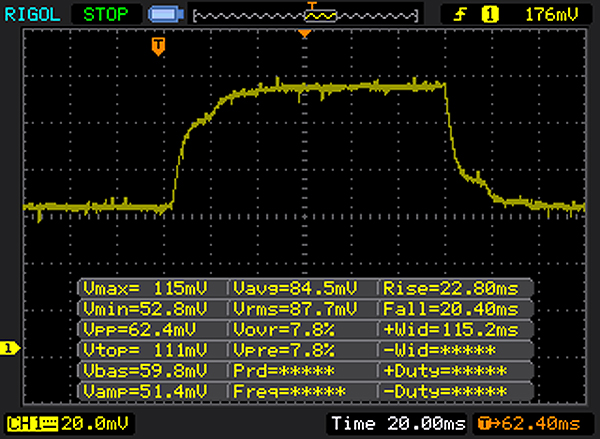 |
| ↘ 20 ms Calo | ||
| Lo schermo mostra tempi di risposta lenti nei nostri tests e sarà insoddisfacente per i gamers. In confronto, tutti i dispositivi di test variano da 0.165 (minimo) a 636 (massimo) ms. » 65 % di tutti i dispositivi è migliore. Questo significa che i tempi di risposta rilevati sono peggiori rispetto alla media di tutti i dispositivi testati (31 ms). | ||
| Cinebench R15 | |
| CPU Single 64Bit | |
| Acer Spin 5 SP513-52N-54SF | |
| HP 15-bs103ng | |
| Acer Extensa 2540-580K | |
| HP 15-ay116ng | |
| Lenovo IdeaPad V110-15IKB 80TH001SGE | |
| Asus ASUSPRO P541UA-GQ1532 | |
| HP 15-ba077ng | |
| Acer Aspire 3 A315-21-651Y | |
| Lenovo Ideapad 110-15ACL 80TJ00H0GE | |
| CPU Multi 64Bit | |
| Acer Spin 5 SP513-52N-54SF | |
| HP 15-bs103ng | |
| Acer Extensa 2540-580K | |
| HP 15-ay116ng | |
| Lenovo IdeaPad V110-15IKB 80TH001SGE | |
| HP 15-ba077ng | |
| Asus ASUSPRO P541UA-GQ1532 | |
| Lenovo Ideapad 110-15ACL 80TJ00H0GE | |
| Acer Aspire 3 A315-21-651Y | |
| Cinebench R11.5 | |
| CPU Multi 64Bit | |
| HP 15-bs103ng | |
| Acer Extensa 2540-580K | |
| HP 15-ay116ng | |
| Lenovo IdeaPad V110-15IKB 80TH001SGE | |
| HP 15-ba077ng | |
| Acer Aspire 3 A315-21-651Y | |
| CPU Single 64Bit | |
| HP 15-bs103ng | |
| Acer Extensa 2540-580K | |
| HP 15-ay116ng | |
| Lenovo IdeaPad V110-15IKB 80TH001SGE | |
| HP 15-ba077ng | |
| Acer Aspire 3 A315-21-651Y | |
| Cinebench R10 | |
| Rendering Multiple CPUs 32Bit | |
| HP 15-bs103ng | |
| Acer Spin 5 SP513-52N-54SF | |
| HP 15-ay116ng | |
| Acer Extensa 2540-580K | |
| Lenovo IdeaPad V110-15IKB 80TH001SGE | |
| Asus ASUSPRO P541UA-GQ1532 | |
| HP 15-ba077ng | |
| Lenovo Ideapad 110-15ACL 80TJ00H0GE | |
| Acer Aspire 3 A315-21-651Y | |
| Rendering Single 32Bit | |
| Acer Spin 5 SP513-52N-54SF | |
| HP 15-bs103ng | |
| Acer Extensa 2540-580K | |
| HP 15-ay116ng | |
| Lenovo IdeaPad V110-15IKB 80TH001SGE | |
| Asus ASUSPRO P541UA-GQ1532 | |
| HP 15-ba077ng | |
| Acer Aspire 3 A315-21-651Y | |
| Lenovo Ideapad 110-15ACL 80TJ00H0GE | |
| Geekbench 3 | |
| 32 Bit Multi-Core Score | |
| HP 15-bs103ng | |
| Acer Spin 5 SP513-52N-54SF | |
| Acer Extensa 2540-580K | |
| HP 15-ay116ng | |
| HP 15-ba077ng | |
| Lenovo IdeaPad V110-15IKB 80TH001SGE | |
| Asus ASUSPRO P541UA-GQ1532 | |
| Lenovo Ideapad 110-15ACL 80TJ00H0GE | |
| Acer Aspire 3 A315-21-651Y | |
| 32 Bit Single-Core Score | |
| Acer Spin 5 SP513-52N-54SF | |
| Acer Extensa 2540-580K | |
| HP 15-bs103ng | |
| HP 15-ay116ng | |
| Lenovo IdeaPad V110-15IKB 80TH001SGE | |
| HP 15-ba077ng | |
| Asus ASUSPRO P541UA-GQ1532 | |
| Acer Aspire 3 A315-21-651Y | |
| Lenovo Ideapad 110-15ACL 80TJ00H0GE | |
| Geekbench 4.0 | |
| 64 Bit Multi-Core Score | |
| Acer Spin 5 SP513-52N-54SF | |
| HP 15-bs103ng | |
| Acer Extensa 2540-580K | |
| HP 15-ay116ng | |
| Lenovo IdeaPad V110-15IKB 80TH001SGE | |
| Asus ASUSPRO P541UA-GQ1532 | |
| HP 15-ba077ng | |
| Lenovo Ideapad 110-15ACL 80TJ00H0GE | |
| Acer Aspire 3 A315-21-651Y | |
| 64 Bit Single-Core Score | |
| Acer Spin 5 SP513-52N-54SF | |
| HP 15-bs103ng | |
| Acer Extensa 2540-580K | |
| HP 15-ay116ng | |
| Lenovo IdeaPad V110-15IKB 80TH001SGE | |
| Asus ASUSPRO P541UA-GQ1532 | |
| HP 15-ba077ng | |
| Acer Aspire 3 A315-21-651Y | |
| Lenovo Ideapad 110-15ACL 80TJ00H0GE | |
| Geekbench 4.4 | |
| 64 Bit Multi-Core Score | |
| Acer Spin 5 SP513-52N-54SF | |
| HP 15-bs103ng | |
| Acer Extensa 2540-580K | |
| Lenovo IdeaPad V110-15IKB 80TH001SGE | |
| Asus ASUSPRO P541UA-GQ1532 | |
| Acer Aspire 3 A315-21-651Y | |
| 64 Bit Single-Core Score | |
| Acer Spin 5 SP513-52N-54SF | |
| HP 15-bs103ng | |
| Acer Extensa 2540-580K | |
| Lenovo IdeaPad V110-15IKB 80TH001SGE | |
| Asus ASUSPRO P541UA-GQ1532 | |
| Acer Aspire 3 A315-21-651Y | |
| JetStream 1.1 - 1.1 Total | |
| Acer Spin 5 SP513-52N-54SF (Edge 41) | |
| HP 15-bs103ng (Edge 41) | |
| Acer Extensa 2540-580K (Edge 41) | |
| HP 15-ay116ng (Edge 38) | |
| Lenovo IdeaPad V110-15IKB 80TH001SGE (Edge 40) | |
| Asus ASUSPRO P541UA-GQ1532 (Edge 40) | |
| HP 15-ba077ng (Edge 38) | |
| Acer Aspire 3 A315-21-651Y (Edge 41) | |
| Asus ASUSPRO P541UA-GQ1532 (Chromium 59.0.3071.86 (Linux)) | |
| Lenovo Ideapad 110-15ACL 80TJ00H0GE (Edge 38) | |
| PCMark 7 Score | 5549 punti | |
| PCMark 8 Home Score Accelerated v2 | 3752 punti | |
| PCMark 8 Creative Score Accelerated v2 | 4518 punti | |
| PCMark 8 Work Score Accelerated v2 | 4642 punti | |
| PCMark 10 Score | 3228 punti | |
Aiuto | ||
| PCMark 8 | |
| Home Score Accelerated v2 | |
| Acer Extensa 2540-580K | |
| HP 15-ay116ng | |
| Asus ASUSPRO P541UA-GQ1532 | |
| Lenovo IdeaPad V110-15IKB 80TH001SGE | |
| HP 15-ba077ng | |
| Acer Aspire 3 A315-21-651Y | |
| Lenovo Ideapad 110-15ACL 80TJ00H0GE | |
| Work Score Accelerated v2 | |
| Acer Extensa 2540-580K | |
| HP 15-ay116ng | |
| Lenovo IdeaPad V110-15IKB 80TH001SGE | |
| Acer Aspire 3 A315-21-651Y | |
| HP 15-ba077ng | |

| Acer Extensa 2540-580K Kingston RBUSC180DS37256GH | Lenovo IdeaPad V110-15IKB 80TH001SGE Ramxel S121 RTNRB256RFM4KWDL | HP 15-ba077ng SanDisk Z400s SD8SNAT-256G | HP 15-ay116ng Samsung CM871a MZNTY256HDHP | Lenovo Ideapad 110-15ACL 80TJ00H0GE Seagate Mobile HDD 1TB ST1000LM035 | Asus ASUSPRO P541UA-GQ1532 SK Hynix HFS128G32TND | |
|---|---|---|---|---|---|---|
| CrystalDiskMark 3.0 | -16% | -31% | 4% | -93% | -26% | |
| Read Seq (MB/s) | 473.9 | 477.4 1% | 447.4 -6% | 501 6% | 92.1 -81% | 514 8% |
| Write Seq (MB/s) | 467.1 | 284.2 -39% | 243.3 -48% | 483.9 4% | 88.5 -81% | 133.5 -71% |
| Read 512 (MB/s) | 318.3 | 356.3 12% | 333.4 5% | 413.8 30% | 32.94 -90% | 333.7 5% |
| Write 512 (MB/s) | 441.3 | 282.3 -36% | 283.1 -36% | 294.9 -33% | 26.71 -94% | 133.7 -70% |
| Read 4k (MB/s) | 33.06 | 24.15 -27% | 20.99 -37% | 34.91 6% | 0.372 -99% | 30.67 -7% |
| Write 4k (MB/s) | 77.7 | 71.9 -7% | 62.7 -19% | 95.7 23% | 0.283 -100% | 74.7 -4% |
| Read 4k QD32 (MB/s) | 310.1 | 283.7 -9% | 143.1 -54% | 370.9 20% | 0.921 -100% | 287.2 -7% |
| Write 4k QD32 (MB/s) | 317.1 | 257.3 -19% | 138 -56% | 243.6 -23% | 0.473 -100% | 134.1 -58% |
| 3DMark 06 Standard Score | 9984 punti | |
| 3DMark 11 Performance | 1769 punti | |
| 3DMark Ice Storm Standard Score | 65670 punti | |
| 3DMark Cloud Gate Standard Score | 6693 punti | |
| 3DMark Fire Strike Score | 994 punti | |
| 3DMark Fire Strike Extreme Score | 473 punti | |
| 3DMark Time Spy Score | 384 punti | |
Aiuto | ||
| 3DMark 11 - 1280x720 Performance GPU | |
| HP 15-ba077ng | |
| Acer Extensa 2540-580K | |
| Asus VivoBook S15 S510UA | |
| HP 15-ay116ng | |
| Asus ASUSPRO P541UA-GQ1532 | |
| Acer Aspire 3 A315-21-651Y | |
| Lenovo Ideapad 110-15ACL 80TJ00H0GE | |
| Lenovo IdeaPad V110-15IKB 80TH001SGE | |
| 3DMark | |
| 1280x720 Cloud Gate Standard Graphics | |
| Asus VivoBook S15 S510UA | |
| Acer Extensa 2540-580K | |
| HP 15-ba077ng | |
| HP 15-ay116ng | |
| Lenovo IdeaPad V110-15IKB 80TH001SGE | |
| Acer Aspire 3 A315-21-651Y | |
| 1920x1080 Fire Strike Graphics | |
| HP 15-ba077ng | |
| Acer Extensa 2540-580K | |
| Asus VivoBook S15 S510UA | |
| HP 15-ay116ng | |
| Lenovo IdeaPad V110-15IKB 80TH001SGE | |
| Acer Aspire 3 A315-21-651Y | |
| basso | medio | alto | ultra | |
|---|---|---|---|---|
| StarCraft 2 (2010) | 181.4 | 54.6 | 30.6 | 17.7 |
| Tomb Raider (2013) | 88.5 | 43.7 | 27.3 | 12.5 |
| BioShock Infinite (2013) | 53.8 | 30.3 | 25.9 | 9.2 |
| Rise of the Tomb Raider (2016) | 18.9 | 12.2 | 6.4 | 4.2 |
| FIFA 18 (2017) | 70.6 | 36.5 | 28.3 | 25.8 |
| Need for Speed Payback (2017) | 14.7 | 8.7 | ||
| Star Wars Battlefront 2 (2017) | 23.4 | 6.7 |
Rumorosità
| Idle |
| 30.3 / 30.3 / 30.3 dB(A) |
| DVD |
| 35.3 / dB(A) |
| Sotto carico |
| 34.7 / 37.4 dB(A) |
 | ||
30 dB silenzioso 40 dB(A) udibile 50 dB(A) rumoroso |
||
min: | ||
| Acer Extensa 2540-580K i5-7200U, HD Graphics 620 | Lenovo IdeaPad V110-15IKB 80TH001SGE Pentium 4415U, HD Graphics 610 | HP 15-ba077ng A12-9700P, Radeon R7 (Bristol Ridge) | HP 15-ay116ng i5-7200U, HD Graphics 620 | Asus ASUSPRO P541UA-GQ1532 6006U, HD Graphics 520 | Acer Aspire 3 A315-21-651Y A6-9220, Radeon R4 (Stoney Ridge) | Lenovo Ideapad 110-15ACL 80TJ00H0GE A8-7410, Radeon R5 (Beema/Carrizo-L) | |
|---|---|---|---|---|---|---|---|
| Noise | 0% | 1% | -2% | -5% | 3% | 3% | |
| off /ambiente * (dB) | 30.3 | 30.5 -1% | 30.6 -1% | 30.5 -1% | 30 1% | 30.4 -0% | 30.4 -0% |
| Idle Minimum * (dB) | 30.3 | 30.5 -1% | 31.5 -4% | 31.3 -3% | 32.1 -6% | 30.4 -0% | 30.9 -2% |
| Idle Average * (dB) | 30.3 | 30.5 -1% | 31.8 -5% | 31.3 -3% | 32.6 -8% | 31.6 -4% | 30.9 -2% |
| Idle Maximum * (dB) | 30.3 | 31.6 -4% | 31.8 -5% | 31.3 -3% | 32.6 -8% | 31.6 -4% | 31 -2% |
| Load Average * (dB) | 34.7 | 34.3 1% | 31.4 10% | 35.6 -3% | 35.7 -3% | 31.9 8% | 31.8 8% |
| Load Maximum * (dB) | 37.4 | 34.8 7% | 33.4 11% | 36.15 3% | 40 -7% | 31.9 15% | 31.9 15% |
* ... Meglio usare valori piccoli
(+) La temperatura massima sul lato superiore è di 34 °C / 93 F, rispetto alla media di 34.3 °C / 94 F, che varia da 21.2 a 62.5 °C per questa classe Office.
(+) Il lato inferiore si riscalda fino ad un massimo di 33.2 °C / 92 F, rispetto alla media di 36.8 °C / 98 F
(+) In idle, la temperatura media del lato superiore è di 24 °C / 75 F, rispetto alla media deld ispositivo di 29.5 °C / 85 F.
(+) I poggiapolsi e il touchpad sono piu' freddi della temperatura della pelle con un massimo di 23.9 °C / 75 F e sono quindi freddi al tatto.
(+) La temperatura media della zona del palmo della mano di dispositivi simili e'stata di 27.5 °C / 81.5 F (+3.6 °C / 6.5 F).
| Acer Extensa 2540-580K i5-7200U, HD Graphics 620 | Lenovo IdeaPad V110-15IKB 80TH001SGE Pentium 4415U, HD Graphics 610 | HP 15-ba077ng A12-9700P, Radeon R7 (Bristol Ridge) | HP 15-ay116ng i5-7200U, HD Graphics 620 | Asus ASUSPRO P541UA-GQ1532 6006U, HD Graphics 520 | Acer Aspire 3 A315-21-651Y A6-9220, Radeon R4 (Stoney Ridge) | Lenovo Ideapad 110-15ACL 80TJ00H0GE A8-7410, Radeon R5 (Beema/Carrizo-L) | |
|---|---|---|---|---|---|---|---|
| Heat | 5% | 1% | 2% | -4% | -6% | -8% | |
| Maximum Upper Side * (°C) | 34 | 32.5 4% | 34.8 -2% | 33.8 1% | 32.6 4% | 30.5 10% | 32.9 3% |
| Maximum Bottom * (°C) | 33.2 | 31.7 5% | 38.3 -15% | 36.6 -10% | 30.7 8% | 33 1% | 34.5 -4% |
| Idle Upper Side * (°C) | 26.1 | 24.7 5% | 23.2 11% | 23.6 10% | 28.9 -11% | 30.2 -16% | 31.4 -20% |
| Idle Bottom * (°C) | 25.7 | 24 7% | 23.3 9% | 23.8 7% | 30 -17% | 30.4 -18% | 28 -9% |
* ... Meglio usare valori piccoli
Acer Extensa 2540-580K analisi audio
(-) | altoparlanti non molto potenti (69.8 dB)
Bassi 100 - 315 Hz
(-) | quasi nessun basso - in media 25% inferiori alla media
(±) | la linearità dei bassi è media (12% delta rispetto alla precedente frequenza)
Medi 400 - 2000 Hz
(+) | medi bilanciati - solo only 3.1% rispetto alla media
(+) | medi lineari (6.9% delta rispetto alla precedente frequenza)
Alti 2 - 16 kHz
(+) | Alti bilanciati - appena 4.4% dalla media
(±) | la linearità degli alti è media (7.9% delta rispetto alla precedente frequenza)
Nel complesso 100 - 16.000 Hz
(±) | la linearità complessiva del suono è media (24.2% di differenza rispetto alla media
Rispetto alla stessa classe
» 70% di tutti i dispositivi testati in questa classe è stato migliore, 8% simile, 22% peggiore
» Il migliore ha avuto un delta di 7%, medio di 21%, peggiore di 53%
Rispetto a tutti i dispositivi testati
» 73% di tutti i dispositivi testati in questa classe è stato migliore, 6% similare, 21% peggiore
» Il migliore ha avuto un delta di 4%, medio di 23%, peggiore di 134%
Apple MacBook 12 (Early 2016) 1.1 GHz analisi audio
(+) | gli altoparlanti sono relativamente potenti (83.6 dB)
Bassi 100 - 315 Hz
(±) | bassi ridotti - in media 11.3% inferiori alla media
(±) | la linearità dei bassi è media (14.2% delta rispetto alla precedente frequenza)
Medi 400 - 2000 Hz
(+) | medi bilanciati - solo only 2.4% rispetto alla media
(+) | medi lineari (5.5% delta rispetto alla precedente frequenza)
Alti 2 - 16 kHz
(+) | Alti bilanciati - appena 2% dalla media
(+) | alti lineari (4.5% delta rispetto alla precedente frequenza)
Nel complesso 100 - 16.000 Hz
(+) | suono nel complesso lineare (10.2% differenza dalla media)
Rispetto alla stessa classe
» 7% di tutti i dispositivi testati in questa classe è stato migliore, 2% simile, 91% peggiore
» Il migliore ha avuto un delta di 5%, medio di 18%, peggiore di 53%
Rispetto a tutti i dispositivi testati
» 5% di tutti i dispositivi testati in questa classe è stato migliore, 1% similare, 94% peggiore
» Il migliore ha avuto un delta di 4%, medio di 23%, peggiore di 134%
| Off / Standby | |
| Idle | |
| Sotto carico |
|
Leggenda:
min: | |
| Acer Extensa 2540-580K i5-7200U, HD Graphics 620 | Lenovo IdeaPad V110-15IKB 80TH001SGE Pentium 4415U, HD Graphics 610 | HP 15-ba077ng A12-9700P, Radeon R7 (Bristol Ridge) | HP 15-ay116ng i5-7200U, HD Graphics 620 | Asus ASUSPRO P541UA-GQ1532 6006U, HD Graphics 520 | Acer Aspire 3 A315-21-651Y A6-9220, Radeon R4 (Stoney Ridge) | Lenovo Ideapad 110-15ACL 80TJ00H0GE A8-7410, Radeon R5 (Beema/Carrizo-L) | |
|---|---|---|---|---|---|---|---|
| Power Consumption | 10% | -7% | 10% | -15% | 6% | 4% | |
| Idle Minimum * (Watt) | 4.5 | 2.8 38% | 4.4 2% | 3.2 29% | 6.9 -53% | 4.6 -2% | 5.4 -20% |
| Idle Average * (Watt) | 6.7 | 6.8 -1% | 6.8 -1% | 6.3 6% | 8.9 -33% | 7.3 -9% | 6.8 -1% |
| Idle Maximum * (Watt) | 7.4 | 8.2 -11% | 8.9 -20% | 7.4 -0% | 9.6 -30% | 8.7 -18% | 7.3 1% |
| Load Average * (Watt) | 29 | 24 17% | 30.9 -7% | 24 17% | 19 34% | 20 31% | 21.1 27% |
| Load Maximum * (Watt) | 29 | 26.3 9% | 31 -7% | 29 -0% | 27 7% | 21.6 26% | 25.5 12% |
* ... Meglio usare valori piccoli
| Acer Extensa 2540-580K i5-7200U, HD Graphics 620, 48 Wh | Lenovo IdeaPad V110-15IKB 80TH001SGE Pentium 4415U, HD Graphics 610, 32 Wh | HP 15-ba077ng A12-9700P, Radeon R7 (Bristol Ridge), 41 Wh | HP 15-ay116ng i5-7200U, HD Graphics 620, 41 Wh | Asus ASUSPRO P541UA-GQ1532 6006U, HD Graphics 520, 34.5 Wh | Acer Aspire 3 A315-21-651Y A6-9220, Radeon R4 (Stoney Ridge), 37 Wh | Lenovo Ideapad 110-15ACL 80TJ00H0GE A8-7410, Radeon R5 (Beema/Carrizo-L), 24 Wh | Asus ASUSPRO P541UA-GQ1532 6006U, HD Graphics 520, 34.5 Wh | |
|---|---|---|---|---|---|---|---|---|
| Autonomia della batteria | -52% | -30% | -15% | -52% | -49% | -58% | -17% | |
| Reader / Idle (h) | 18.9 | 12.4 -34% | 14.5 -23% | |||||
| H.264 (h) | 7.7 | 4.6 -40% | 7.2 -6% | |||||
| WiFi v1.3 (h) | 8.1 | 3.9 -52% | 4.9 -40% | 6.9 -15% | 3.9 -52% | 4.1 -49% | 3.4 -58% | 6.7 -17% |
| Load (h) | 1.8 | 1.7 -6% | 1.5 -17% |
Pro
Contro
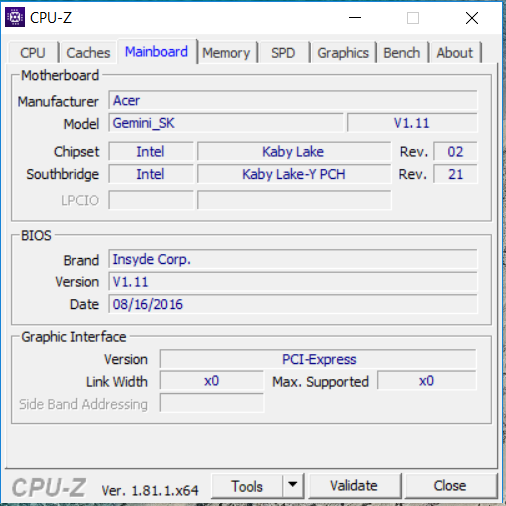
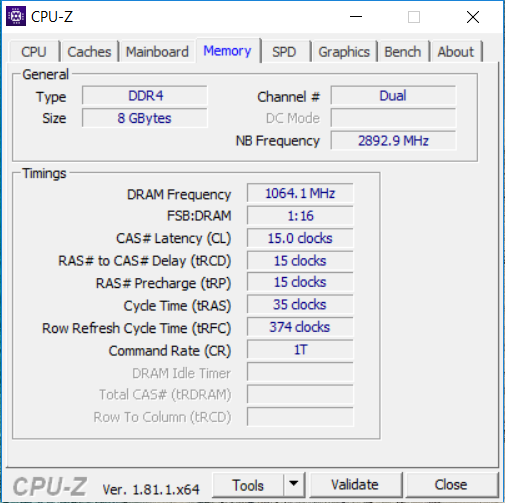
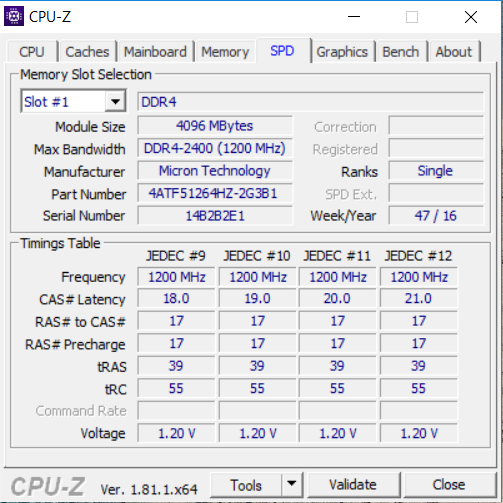
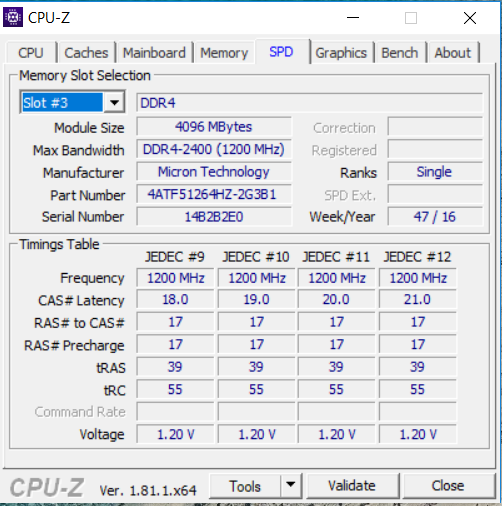
L'Acer Extensa 2540-580K ha una potente CPU, un veloce SSD e RAM dual-channel. Il dispositivo non si scalda in nessuna circostanza ed è silenzioso. Pertanto, l'Extensa ha features ed attributi che lo associano alla maggioranza di portatili da ufficio.
Con l'Extensa 2540, Acer realizza un dispositivo duraturo che troverà il suo audience. Il display è il principale punto debole per la maggioranza di potenziali acquirenti.
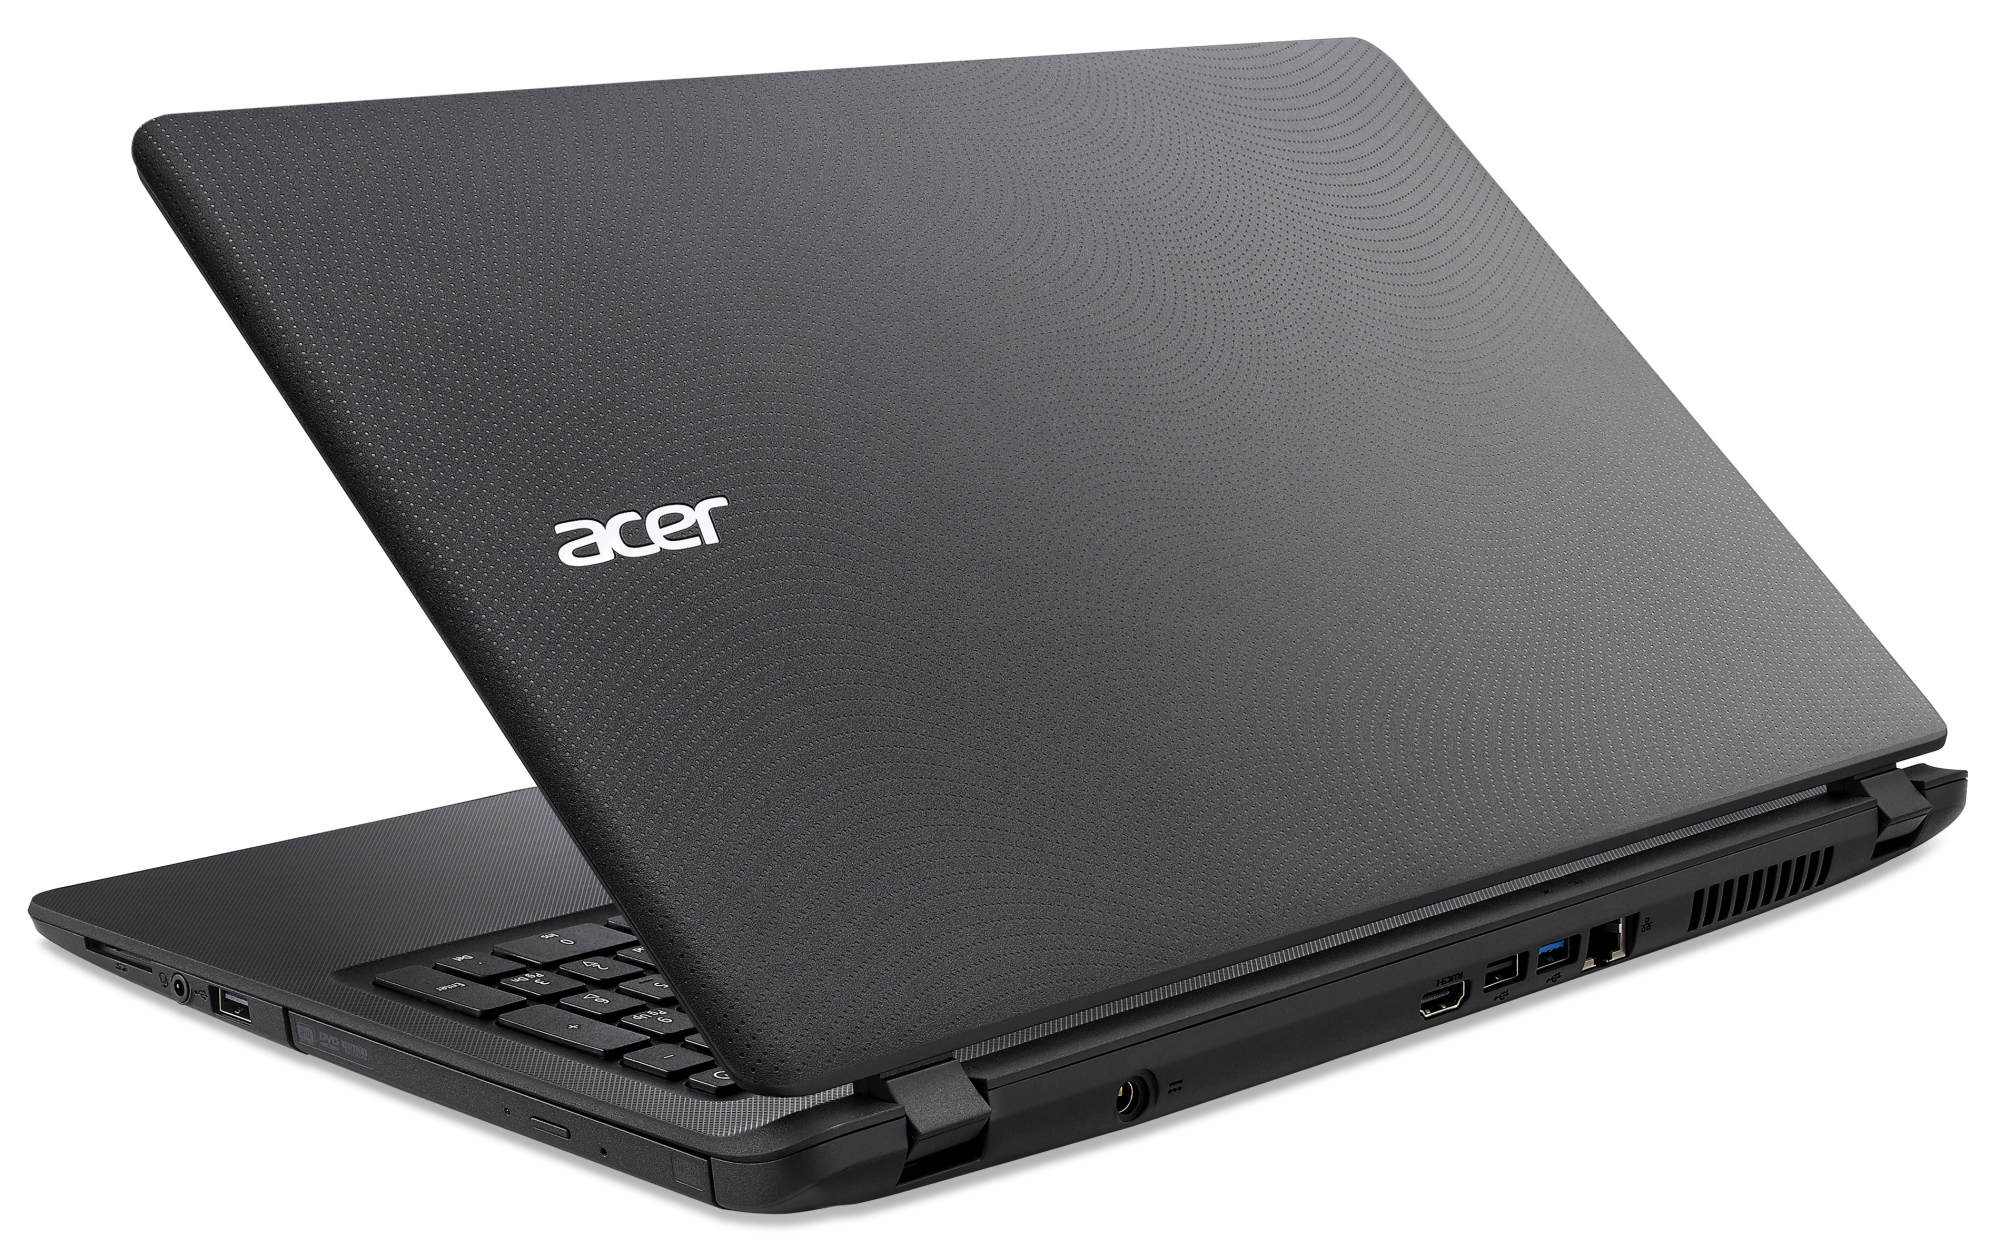
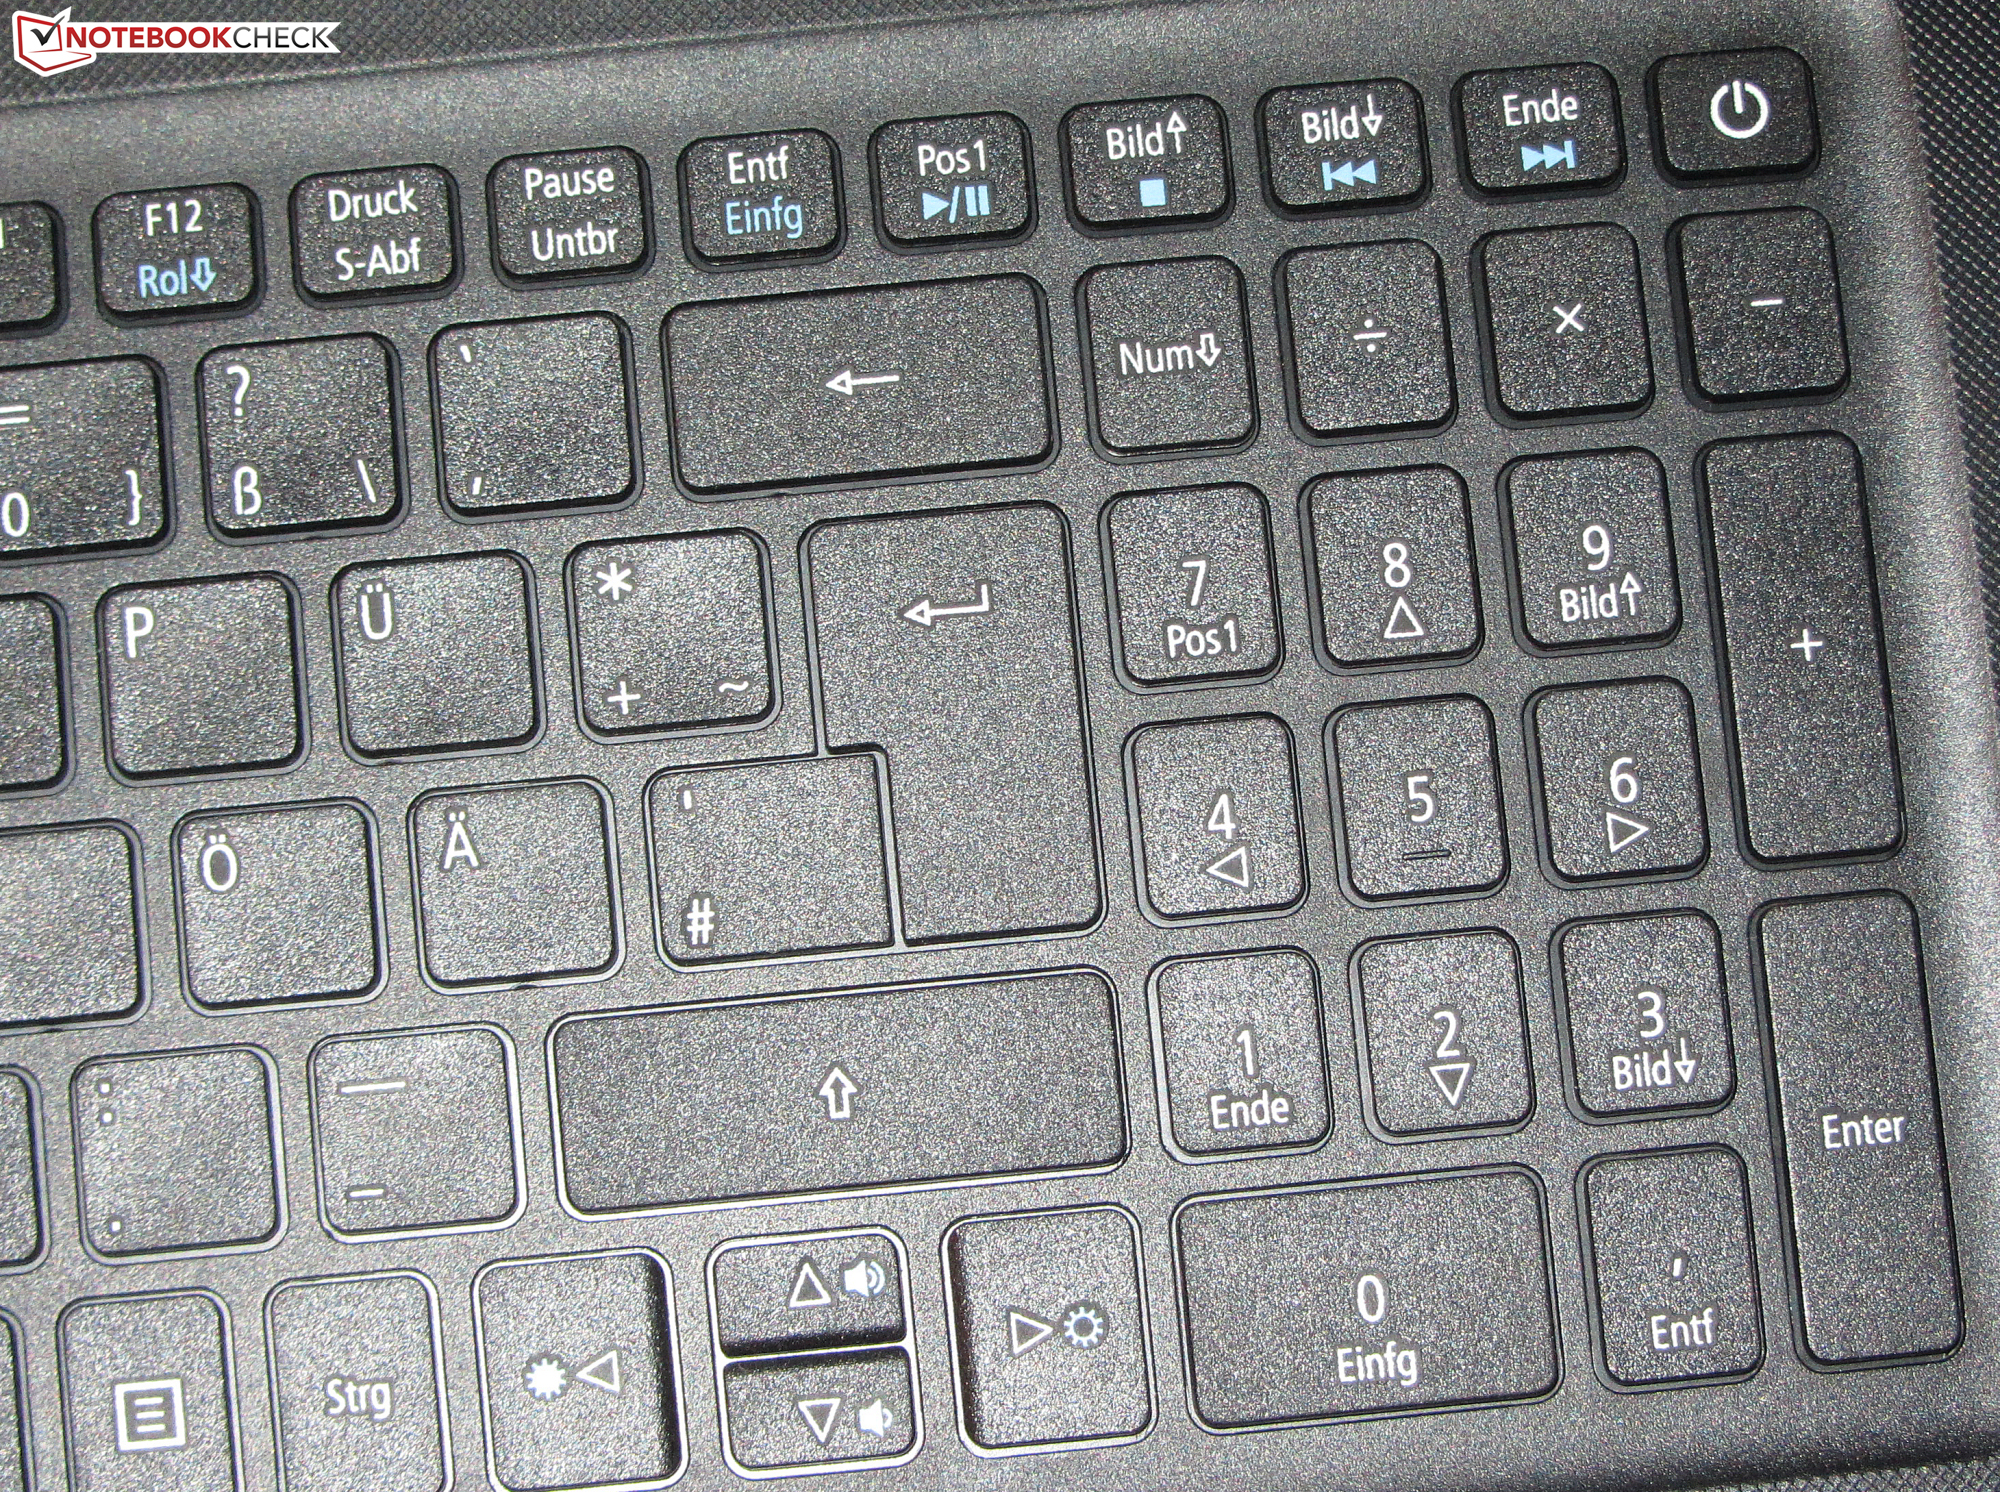
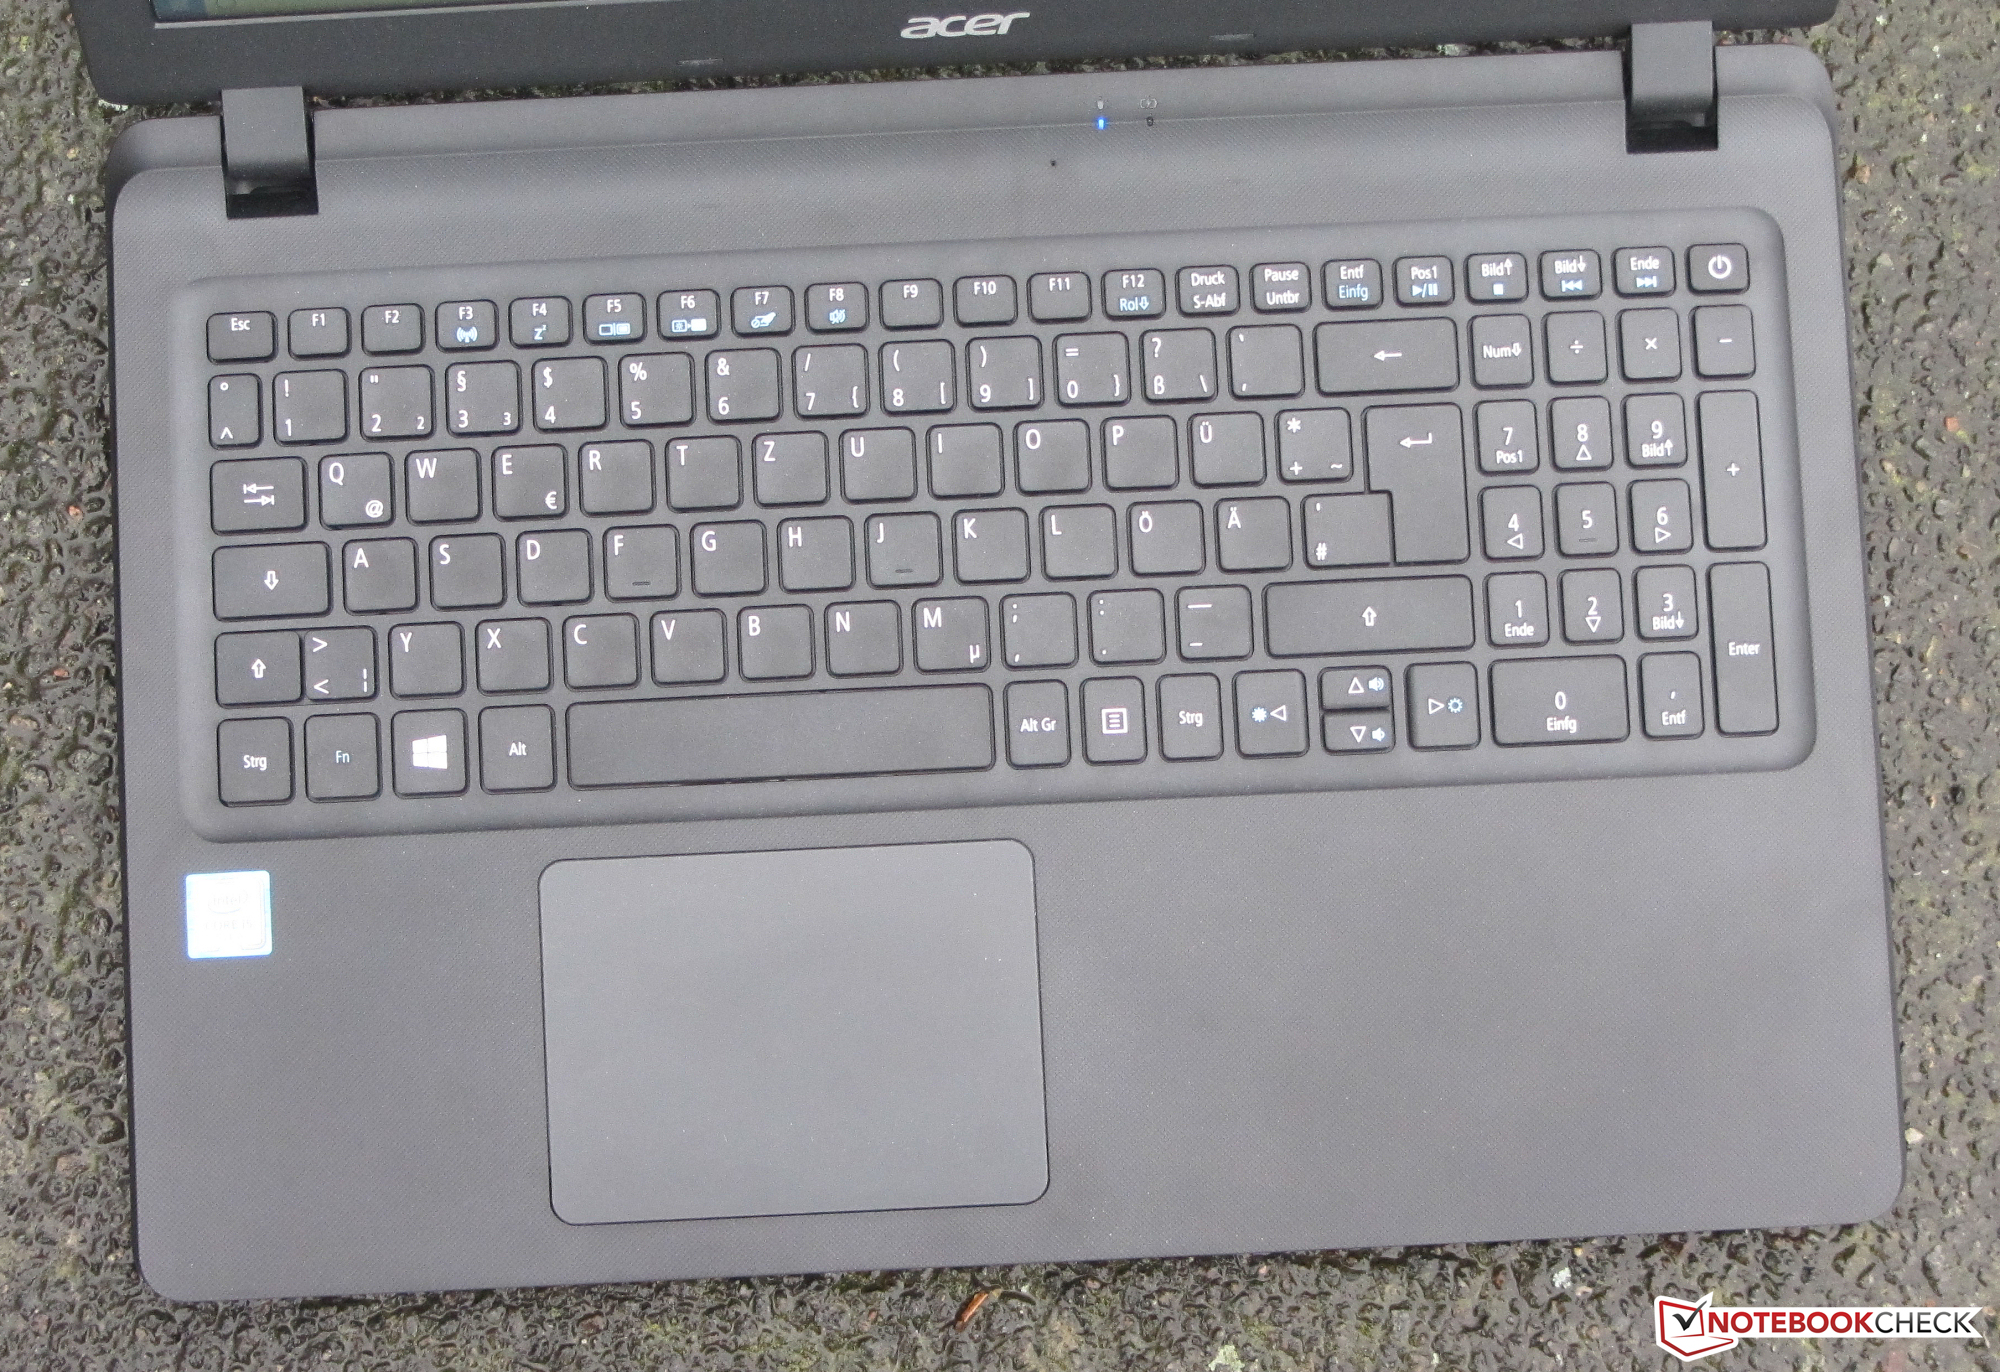
Per fortuna, Acer dota il portatile di una cover di manutenzione, dietro la quale si trovano SSD e RAM. Di conseguenza, la sostituzione o l'upgrade non dovrebbe presentare problemi. La tastiera, grosso modo è ok. Tuttavia, avremmo voluto una retroilluminazione. Con questa possibilità Acer avrebbe realizzato un pacchetto da ufficio migliore, cosa che Extensa dovrebbe essere. L'ottima autonomia aggiunge valore al portatile.
Il punto debole del dispositivo - come accade spesso - è il display. Acer usa un pannello scuro con contrasto ed angoli di visuale limitati, cosa che non va bene nemmeno per un portatile da 400 Euro ($470).
Con questo modello, Acer punta ai professionisti, e quindi c'è preinstallata una versione di Windows 10 Pro. La versione pro incrementa il prezzo del dispositivo, il che lo rende poco appetibile agli utenti comuni. Acer non offre una alternativa con dotazioni simili ma con Windows 10 Home. L'Extensa 2540-56GC è molto vicino come tipologia. Tuttavia monta solo un display HD (1366x768).
Update 13.12.2017: Acer ci ha informati che il modello recensito non è più disponibile ed è stato sostituito da un modello identico Extensa 2540-54C0.
Nota: si tratta di una recensione breve, con alcune sezioni non tradotte, per la versione integrale in inglese guardate qui.
Acer Extensa 2540-580K
- 12/12/2017 v6 (old)
Sascha Mölck