Recensione breve del Portatile Lenovo V110-15IKB (Pentium 4415U, SSD, HD-Display)
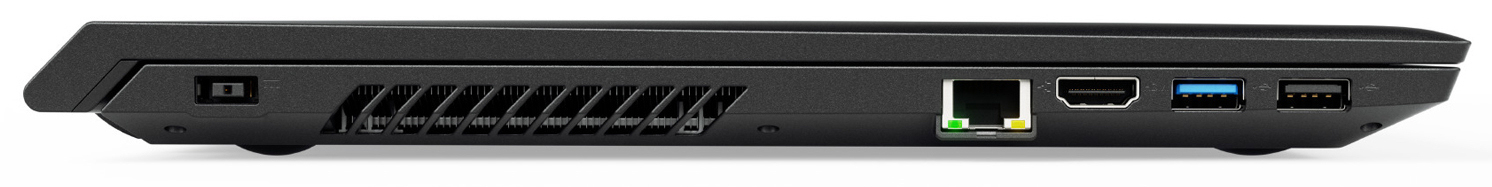
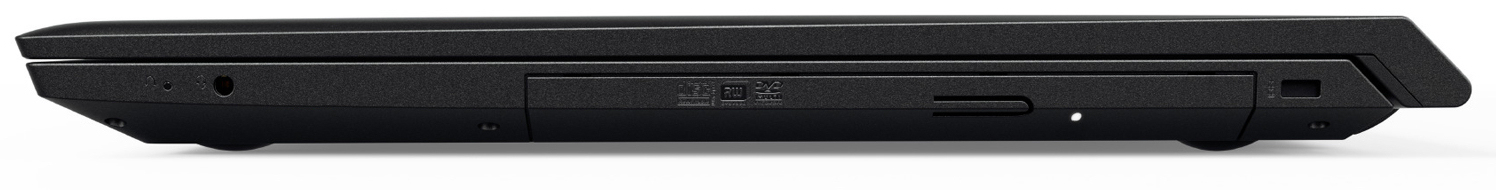
Connectivity

| SD Card Reader | |
| average JPG Copy Test (av. of 3 runs) | |
| HP 15-ba077ng (Toshiba Exceria Pro SDXC 64 GB UHS-II) | |
| Lenovo Ideapad 110-15ACL 80TJ00H0GE (Toshiba Exceria Pro SDXC 64 GB UHS-II) | |
| Lenovo IdeaPad V110-15IKB 80TH001SGE (Toshiba Exceria Pro SDXC 64 GB UHS-II) | |
| HP 250 G5 SP X0N33EA | |
| Toshiba Satellite Pro R50-C-16V (Toshiba Exceria Pro SDXC 64 GB UHS-II) | |
| Acer Aspire ES1-533-P7WA (Toshiba Exceria Pro SDXC 64 GB UHS-II) | |
| maximum AS SSD Seq Read Test (1GB) | |
| Lenovo Ideapad 110-15ACL 80TJ00H0GE (Toshiba Exceria Pro SDXC 64 GB UHS-II) | |
| HP 15-ba077ng (Toshiba Exceria Pro SDXC 64 GB UHS-II) | |
| Acer Aspire ES1-533-P7WA (Toshiba Exceria Pro SDXC 64 GB UHS-II) | |
| Lenovo IdeaPad V110-15IKB 80TH001SGE (Toshiba Exceria Pro SDXC 64 GB UHS-II) | |
| Toshiba Satellite Pro R50-C-16V (Toshiba Exceria Pro SDXC 64 GB UHS-II) | |
| |||||||||||||||||||||||||
Distribuzione della luminosità: 75 %
Al centro con la batteria: 245 cd/m²
Contrasto: 540:1 (Nero: 0.45 cd/m²)
ΔE ColorChecker Calman: 11.69 | ∀{0.5-29.43 Ø4.71}
ΔE Greyscale Calman: 13.12 | ∀{0.09-98 Ø4.96}
59% sRGB (Argyll 1.6.3 3D)
37% AdobeRGB 1998 (Argyll 1.6.3 3D)
40.2% AdobeRGB 1998 (Argyll 3D)
58.6% sRGB (Argyll 3D)
38.91% Display P3 (Argyll 3D)
Gamma: 2.24
CCT: 16905 K
| Lenovo IdeaPad V110-15IKB 80TH001SGE TN LED, 1366x768, 15.6" | HP 15-ba077ng TN LED, 1920x1080, 15.6" | Acer Aspire ES1-533-P7WA TN LED, 1920x1080, 15.6" | Lenovo Ideapad 110-15ACL 80TJ00H0GE TN LED, 1366x768, 15.6" | HP 250 G5 SP X0N33EA TN, 1920x1080, 15.6" | Toshiba Satellite Pro R50-C-16V TN LED, 1366x768, 15.6" | |
|---|---|---|---|---|---|---|
| Display | 3% | -2% | -4% | -6% | 4% | |
| Display P3 Coverage (%) | 38.91 | 39.98 3% | 38.04 -2% | 37.39 -4% | 36.51 -6% | 40.6 4% |
| sRGB Coverage (%) | 58.6 | 60.2 3% | 57.2 -2% | 56.2 -4% | 55 -6% | 61.2 4% |
| AdobeRGB 1998 Coverage (%) | 40.2 | 41.31 3% | 39.3 -2% | 38.63 -4% | 37.72 -6% | 41.95 4% |
| Response Times | -12% | -16% | -35% | -10% | -56% | |
| Response Time Grey 50% / Grey 80% * (ms) | 39 ? | 42 ? -8% | 43 ? -10% | 58 -49% | 40 ? -3% | 68 ? -74% |
| Response Time Black / White * (ms) | 19 ? | 22 ? -16% | 23 ? -21% | 23 -21% | 22 ? -16% | 26 ? -37% |
| PWM Frequency (Hz) | 10000 ? | 50 ? | 200 ? | 217 ? | ||
| Screen | -7% | -7% | 7% | -2% | 1% | |
| Brightness middle (cd/m²) | 243 | 209 -14% | 201 -17% | 253 4% | 219 -10% | 226 -7% |
| Brightness (cd/m²) | 233 | 200 -14% | 202 -13% | 246 6% | 222 -5% | 217 -7% |
| Brightness Distribution (%) | 75 | 88 17% | 92 23% | 86 15% | 85 13% | 91 21% |
| Black Level * (cd/m²) | 0.45 | 0.56 -24% | 0.67 -49% | 0.44 2% | 0.39 13% | 0.58 -29% |
| Contrast (:1) | 540 | 373 -31% | 300 -44% | 575 6% | 562 4% | 390 -28% |
| Colorchecker dE 2000 * | 11.69 | 12.21 -4% | 10.36 11% | 9.2 21% | 12.67 -8% | 9.84 16% |
| Colorchecker dE 2000 max. * | 20.08 | 20.66 -3% | 18.88 6% | 17.68 12% | 20.99 -5% | 16.77 16% |
| Greyscale dE 2000 * | 13.12 | 13.48 -3% | 11.06 16% | 11.05 16% | 13.82 -5% | 11.1 15% |
| Gamma | 2.24 98% | 2.34 94% | 2.56 86% | 2.55 86% | 2.63 84% | 2.35 94% |
| CCT | 16905 38% | 15364 42% | 11368 57% | 11451 57% | 15633 42% | 11979 54% |
| Color Space (Percent of AdobeRGB 1998) (%) | 37 | 38 3% | 36 -3% | 36 -3% | 35 -5% | 39 5% |
| Color Space (Percent of sRGB) (%) | 59 | 60 2% | 57 -3% | 56 -5% | 55 -7% | 61 3% |
| Media totale (Programma / Settaggio) | -5% /
-6% | -8% /
-7% | -11% /
-1% | -6% /
-3% | -17% /
-6% |
* ... Meglio usare valori piccoli
Sfarfallio dello schermo / PWM (Pulse-Width Modulation)
| flickering dello schermo / PWM rilevato | 10000 Hz | ≤ 20 % settaggio luminosita' | 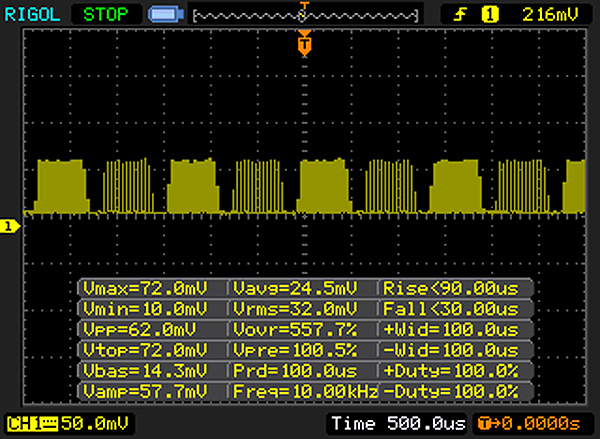 |
Il display sfarfalla a 10000 Hz (Probabilmente a causa dell'uso di PWM) Flickering rilevato ad una luminosita' di 20 % o inferiore. Non dovrebbe verificarsi flickering o PWM sopra questo valore di luminosita'. La frequenza di 10000 Hz è abbastanza alta, quindi la maggioranza degli utenti sensibili al PWM non dovrebbero notare alcun flickering. In confronto: 52 % di tutti i dispositivi testati non utilizza PWM per ridurre la luminosita' del display. Se è rilevato PWM, una media di 7757 (minimo: 5 - massimo: 343500) Hz è stata rilevata. | |||
Tempi di risposta del Display
| ↔ Tempi di risposta dal Nero al Bianco | ||
|---|---|---|
| 19 ms ... aumenta ↗ e diminuisce ↘ combinato | ↗ 14 ms Incremento | 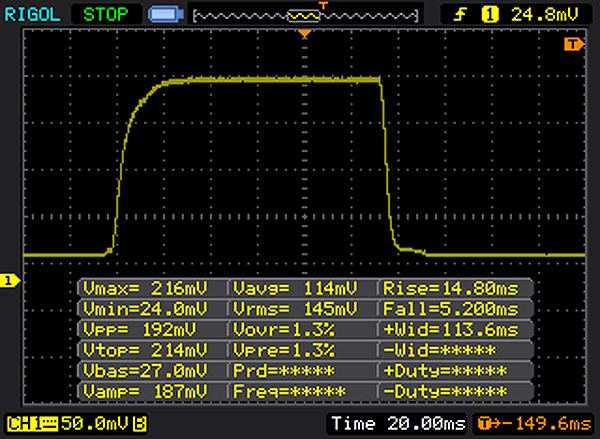 |
| ↘ 5 ms Calo | ||
| Lo schermo mostra buoni tempi di risposta durante i nostri tests, ma potrebbe essere troppo lento per i gamers competitivi. In confronto, tutti i dispositivi di test variano da 0.1 (minimo) a 240 (massimo) ms. » 42 % di tutti i dispositivi è migliore. Questo significa che i tempi di risposta rilevati sono simili alla media di tutti i dispositivi testati (19.8 ms). | ||
| ↔ Tempo di risposta dal 50% Grigio all'80% Grigio | ||
| 39 ms ... aumenta ↗ e diminuisce ↘ combinato | ↗ 21 ms Incremento | 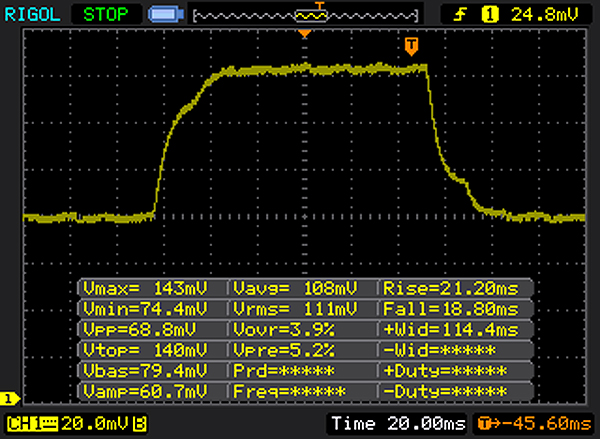 |
| ↘ 18 ms Calo | ||
| Lo schermo mostra tempi di risposta lenti nei nostri tests e sarà insoddisfacente per i gamers. In confronto, tutti i dispositivi di test variano da 0.165 (minimo) a 636 (massimo) ms. » 59 % di tutti i dispositivi è migliore. Questo significa che i tempi di risposta rilevati sono peggiori rispetto alla media di tutti i dispositivi testati (31 ms). | ||
| Geekbench 4.4 | |
| 64 Bit Multi-Core Score | |
| Asus X510UA-BR305T | |
| Lenovo IdeaPad V110-15IKB 80TH001SGE | |
| 64 Bit Single-Core Score | |
| Asus X510UA-BR305T | |
| Lenovo IdeaPad V110-15IKB 80TH001SGE | |
| PCMark 7 Score | 4795 punti | |
| PCMark 8 Home Score Accelerated v2 | 3230 punti | |
| PCMark 8 Creative Score Accelerated v2 | 3514 punti | |
| PCMark 8 Work Score Accelerated v2 | 4224 punti | |
| PCMark 10 Score | 2492 punti | |
Aiuto | ||

| Lenovo IdeaPad V110-15IKB 80TH001SGE Ramxel S121 RTNRB256RFM4KWDL | HP 15-ba077ng SanDisk Z400s SD8SNAT-256G | Acer Aspire ES1-533-P7WA Toshiba MQ01ABD100 | Lenovo Ideapad 110-15ACL 80TJ00H0GE Seagate Mobile HDD 1TB ST1000LM035 | HP 250 G5 SP X0N33EA SanDisk Z400s SD8SNAT-256G | Toshiba Satellite Pro R50-C-16V TOSHIBA MQ01ABD075 | |
|---|---|---|---|---|---|---|
| CrystalDiskMark 3.0 | -19% | -91% | -91% | -5% | -92% | |
| Read Seq (MB/s) | 477.4 | 447.4 -6% | 107.6 -77% | 92.1 -81% | 509 7% | 96.5 -80% |
| Write Seq (MB/s) | 284.2 | 243.3 -14% | 96.6 -66% | 88.5 -69% | 322.1 13% | 77.9 -73% |
| Read 512 (MB/s) | 356.3 | 333.4 -6% | 22.5 -94% | 32.94 -91% | 321.2 -10% | 20.82 -94% |
| Write 512 (MB/s) | 282.3 | 283.1 0% | 24.23 -91% | 26.71 -91% | 289.4 3% | 19.83 -93% |
| Read 4k (MB/s) | 24.15 | 20.99 -13% | 0.474 -98% | 0.372 -98% | 20.99 -13% | 0.342 -99% |
| Write 4k (MB/s) | 71.9 | 62.7 -13% | 1.089 -98% | 0.283 -100% | 88 22% | 0.836 -99% |
| Read 4k QD32 (MB/s) | 283.7 | 143.1 -50% | 0.861 -100% | 0.921 -100% | 141.3 -50% | 0.595 -100% |
| Write 4k QD32 (MB/s) | 257.3 | 138 -46% | 0.991 -100% | 0.473 -100% | 228.5 -11% | 0.706 -100% |
| 3DMark 05 Standard | 11469 punti | |
| 3DMark 06 Standard Score | 6869 punti | |
| 3DMark Vantage P Result | 3715 punti | |
| 3DMark 11 Performance | 1005 punti | |
| 3DMark Ice Storm Standard Score | 50537 punti | |
| 3DMark Cloud Gate Standard Score | 4422 punti | |
| 3DMark Fire Strike Score | 566 punti | |
| 3DMark Fire Strike Extreme Score | 272 punti | |
Aiuto | ||
| 3DMark | |
| 1280x720 Ice Storm Standard Graphics | |
| Lenovo V320-17IKB 81AH0002GE | |
| Lenovo ThinkPad E570-20H6S02M00 | |
| Asus Vivobook F556UQ-XO626D | |
| Lenovo IdeaPad V110-15IKB 80TH001SGE | |
| HP 15-ba077ng | |
| HP Pavilion 15-aw004ng | |
| HP 250 G5 SP X0N33EA | |
| Lenovo Yoga 510-14IKB | |
| 1280x720 Cloud Gate Standard Graphics | |
| HP Pavilion 15-aw004ng | |
| Lenovo V320-17IKB 81AH0002GE | |
| HP 15-ba077ng | |
| Lenovo ThinkPad E570-20H6S02M00 | |
| HP 250 G5 SP X0N33EA | |
| Asus Vivobook F556UQ-XO626D | |
| Lenovo IdeaPad V110-15IKB 80TH001SGE | |
| Lenovo Yoga 510-14IKB | |
| HP 15-bw077ax | |
| 1920x1080 Fire Strike Graphics | |
| HP Pavilion 15-aw004ng | |
| HP 15-ba077ng | |
| Lenovo V320-17IKB 81AH0002GE | |
| Lenovo Yoga 510-14IKB | |
| Lenovo ThinkPad E570-20H6S02M00 | |
| HP 15-bw077ax | |
| Lenovo IdeaPad V110-15IKB 80TH001SGE | |
| Asus Vivobook F556UQ-XO626D | |
| basso | medio | alto | ultra | |
|---|---|---|---|---|
| World of Warcraft (2005) | 125.5 | 61.2 | ||
| Deus Ex Human Revolution (2011) | 50.7 | 29.4 | ||
| The Elder Scrolls V: Skyrim (2011) | 27.8 | 18.6 | 13.6 | |
| Anno 2070 (2011) | 66 | 29.3 | 17.9 | |
| Diablo III (2012) | 39.4 | 25.8 | 22.4 | |
| Counter-Strike: GO (2012) | 94.2 | 70.4 | 42.8 | |
| Tomb Raider (2013) | 50.8 | 23.7 | 16 | |
| BioShock Infinite (2013) | 39.1 | 20.4 | 17.7 | |
| GRID: Autosport (2014) | 106 | 32.7 | ||
| Sims 4 (2014) | 168.9 | 32.5 | ||
| F1 2014 (2014) | 61 | 42 | ||
| Metal Gear Solid V (2015) | 38.5 | 25.2 | ||
| Dota 2 Reborn (2015) | 52.5 | 34.9 | ||
| World of Warships (2015) | 47.3 | 28.8 | ||
| Rainbow Six Siege (2015) | 22.4 | 16.2 | ||
| Overwatch (2016) | 27 | 19.2 | ||
| Battlefield 1 (2016) | 16.1 | 8.9 | ||
| Farming Simulator 17 (2016) | 66.1 | 41.1 | ||
| Resident Evil 7 (2017) | 18.9 | |||
| For Honor (2017) | 13.5 | |||
| Rocket League (2017) | 48.9 | |||
| Team Fortress 2 (2017) | 57.7 | 55.8 | ||
| FIFA 18 (2017) | 35.1 |
Rumorosità
| Idle |
| 30.5 / 30.5 / 31.6 dB(A) |
| Sotto carico |
| 34.3 / 34.8 dB(A) |
 | ||
30 dB silenzioso 40 dB(A) udibile 50 dB(A) rumoroso |
||
min: | ||
(+) La temperatura massima sul lato superiore è di 32.5 °C / 91 F, rispetto alla media di 34.3 °C / 94 F, che varia da 21.2 a 62.5 °C per questa classe Office.
(+) Il lato inferiore si riscalda fino ad un massimo di 31.7 °C / 89 F, rispetto alla media di 36.8 °C / 98 F
(+) In idle, la temperatura media del lato superiore è di 22 °C / 72 F, rispetto alla media deld ispositivo di 29.5 °C / 85 F.
(+) I poggiapolsi e il touchpad sono piu' freddi della temperatura della pelle con un massimo di 30.8 °C / 87.4 F e sono quindi freddi al tatto.
(-) La temperatura media della zona del palmo della mano di dispositivi simili e'stata di 27.5 °C / 81.5 F (-3.3 °C / -5.9 F).
Lenovo IdeaPad V110-15IKB 80TH001SGE analisi audio
(-) | altoparlanti non molto potenti (70.2 dB)
Bassi 100 - 315 Hz
(-) | quasi nessun basso - in media 27.4% inferiori alla media
(±) | la linearità dei bassi è media (8.2% delta rispetto alla precedente frequenza)
Medi 400 - 2000 Hz
(±) | medi ridotti - circa 11.8% inferiori alla media
(±) | linearità dei medi adeguata (12.9% delta rispetto alla precedente frequenza)
Alti 2 - 16 kHz
(±) | alti elevati - circa 9.5% superiori alla media
(±) | la linearità degli alti è media (10.4% delta rispetto alla precedente frequenza)
Nel complesso 100 - 16.000 Hz
(-) | suono nel complesso non lineare (42.4% di differenza rispetto alla media
Rispetto alla stessa classe
» 99% di tutti i dispositivi testati in questa classe è stato migliore, 0% simile, 1% peggiore
» Il migliore ha avuto un delta di 7%, medio di 21%, peggiore di 53%
Rispetto a tutti i dispositivi testati
» 95% di tutti i dispositivi testati in questa classe è stato migliore, 0% similare, 4% peggiore
» Il migliore ha avuto un delta di 4%, medio di 23%, peggiore di 134%
Apple MacBook 12 (Early 2016) 1.1 GHz analisi audio
(+) | gli altoparlanti sono relativamente potenti (83.6 dB)
Bassi 100 - 315 Hz
(±) | bassi ridotti - in media 11.3% inferiori alla media
(±) | la linearità dei bassi è media (14.2% delta rispetto alla precedente frequenza)
Medi 400 - 2000 Hz
(+) | medi bilanciati - solo only 2.4% rispetto alla media
(+) | medi lineari (5.5% delta rispetto alla precedente frequenza)
Alti 2 - 16 kHz
(+) | Alti bilanciati - appena 2% dalla media
(+) | alti lineari (4.5% delta rispetto alla precedente frequenza)
Nel complesso 100 - 16.000 Hz
(+) | suono nel complesso lineare (10.2% differenza dalla media)
Rispetto alla stessa classe
» 7% di tutti i dispositivi testati in questa classe è stato migliore, 2% simile, 90% peggiore
» Il migliore ha avuto un delta di 5%, medio di 18%, peggiore di 53%
Rispetto a tutti i dispositivi testati
» 5% di tutti i dispositivi testati in questa classe è stato migliore, 1% similare, 94% peggiore
» Il migliore ha avuto un delta di 4%, medio di 23%, peggiore di 134%
| Off / Standby | |
| Idle | |
| Sotto carico |
|
Leggenda:
min: | |
Pro
Contro
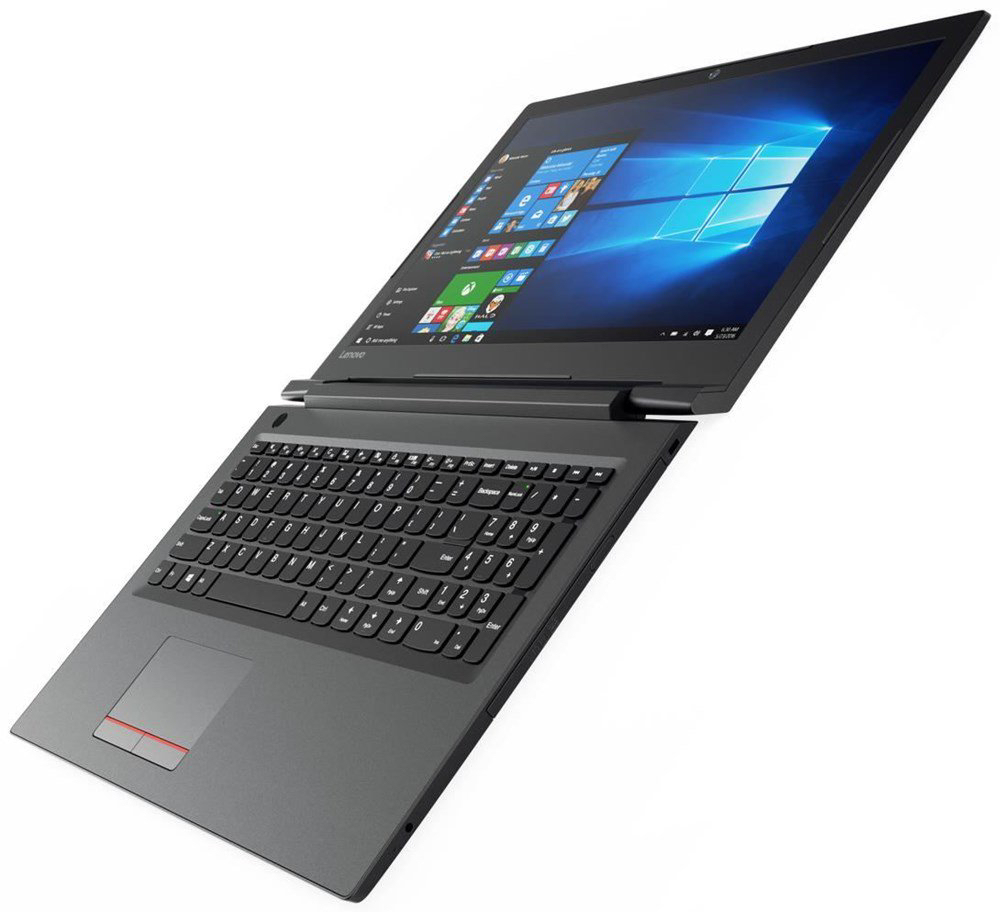
Il Lenovo V110-15IKB ha tutto ciò che occorre ad un portatile per casa ed ufficio: un processore abbastanza potente, un veloce SSD, e memoria di lavoro che opera in modalità dual-channel. C'è anche una tastiera decente. Dovete sborsare circa 400 Euro ($400) per averlo.
Questo portatile Lenovo da 15.6" ha un ottimo rapporto prezzo-performance.
Il prezzo relativamente basso si paga in alcuni punti. Lo schermo non vincerà alcun premio. E' scuro, il contrasto è basso, e anche gli angoli di visuale sono limitati. L'autonomia in Wi-Fi e la scarsa robustezza del case limitano l'utilizzo mobile. Al di là di questo Lenovo fornisce solo un anno di garanzia. Il prezzo basso giustifica il rumore della ventola, ci sono dispositivi costosi altrettanto rumorosi. Tuttavia, non dovrebbe mai succedere nei portatili.
Nota: si tratta di una recensione breve, con alcune sezioni non tradotte, per la versione originale in inglese guardate qui.
Lenovo IdeaPad V110-15IKB 80TH001SGE
- 10/10/2017 v6 (old)
Sascha Mölck