Recensione breve del notebook HP 15-ba077ng
| SD Card Reader | |
| average JPG Copy Test (av. of 3 runs) | |
| HP Pavilion 15-aw004ng W8Y60EA | |
| Acer Aspire E15 E5-553G-109A | |
| HP 15-ba077ng | |
| HP 250 G5 SP X0N33EA | |
| Lenovo Ideapad 310-15IKB | |
| Dell Latitude 15-3570 | |
| HP 15-ay116ng | |
| Acer Aspire ES1-533-P7WA | |
| Asus F555UB-XO043T | |
| maximum AS SSD Seq Read Test (1GB) | |
| HP Pavilion 15-aw004ng W8Y60EA | |
| Acer Aspire E15 E5-553G-109A | |
| HP 15-ba077ng | |
| Acer Aspire ES1-533-P7WA | |
| HP 15-ay116ng | |
| Asus F555UB-XO043T | |
| Lenovo Ideapad 310-15IKB | |
| Dell Latitude 15-3570 | |
| Networking | |
| iperf3 transmit AX12 | |
| Acer Aspire E15 E5-553G-109A | |
| Acer Aspire ES1-533-P7WA | |
| HP 15-ba077ng | |
| iperf3 receive AX12 | |
| Acer Aspire E15 E5-553G-109A | |
| Acer Aspire ES1-533-P7WA | |
| HP 15-ba077ng | |
| iperf Server (receive) TCP 1 m | |
| Lenovo Ideapad 310-15IKB | |
| HP 250 G5 SP X0N33EA (jseb) | |
| HP Pavilion 15-aw004ng W8Y60EA | |
| HP 15-ay116ng (jseb) | |
| iperf Client (transmit) TCP 1 m | |
| Lenovo Ideapad 310-15IKB | |
| HP Pavilion 15-aw004ng W8Y60EA | |
| HP 250 G5 SP X0N33EA (jseb) | |
| HP 15-ay116ng (jseb) | |
| |||||||||||||||||||||||||
Distribuzione della luminosità: 88 %
Al centro con la batteria: 209 cd/m²
Contrasto: 373:1 (Nero: 0.56 cd/m²)
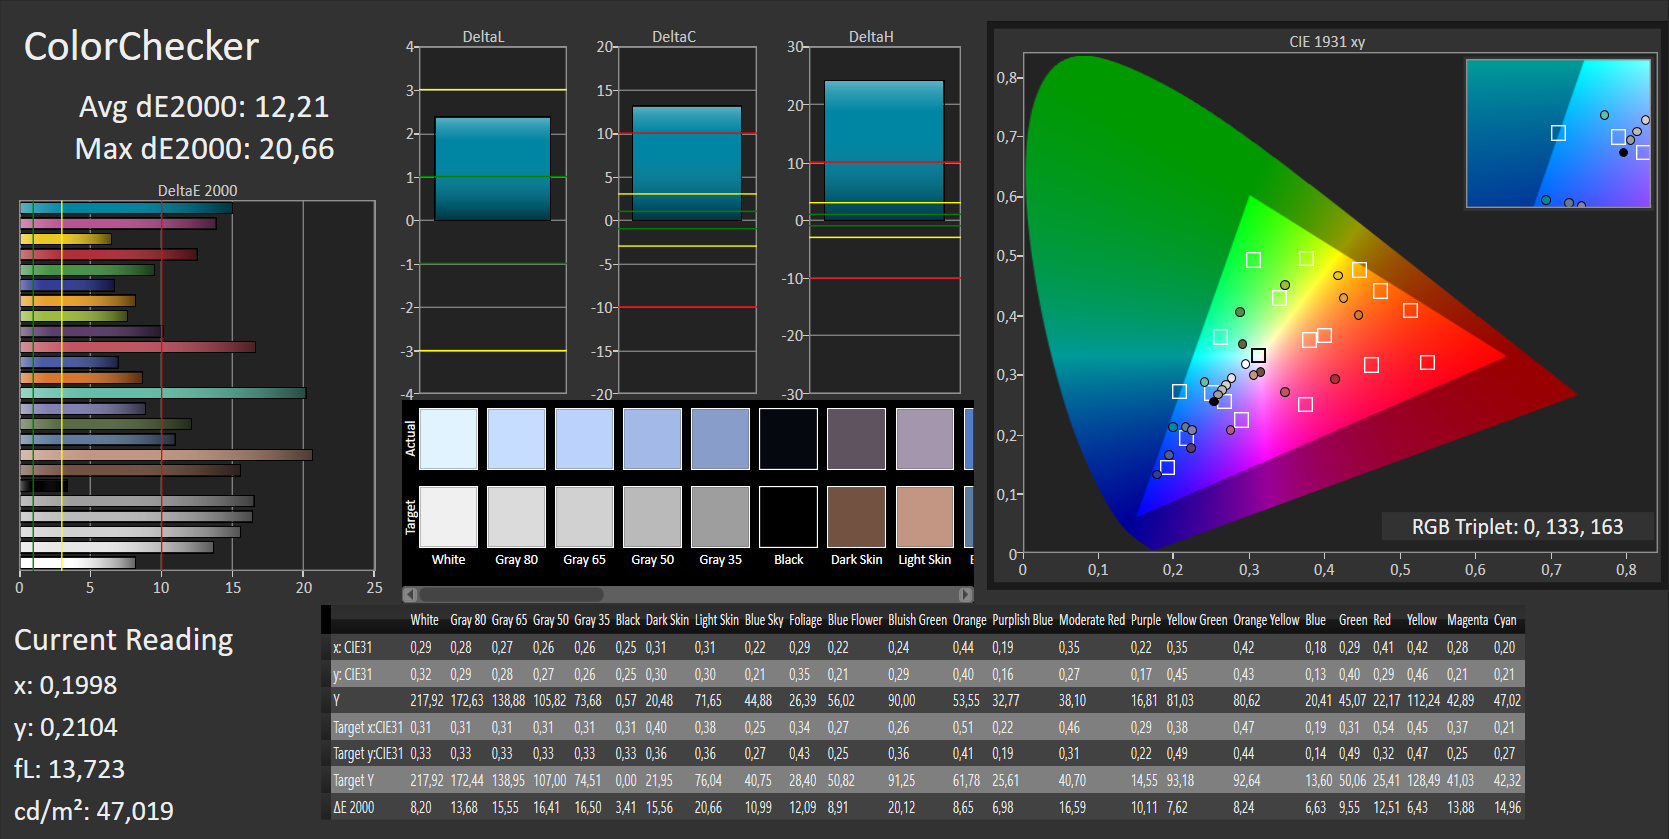
ΔE ColorChecker Calman: 12.21 | ∀{0.5-29.43 Ø4.72}
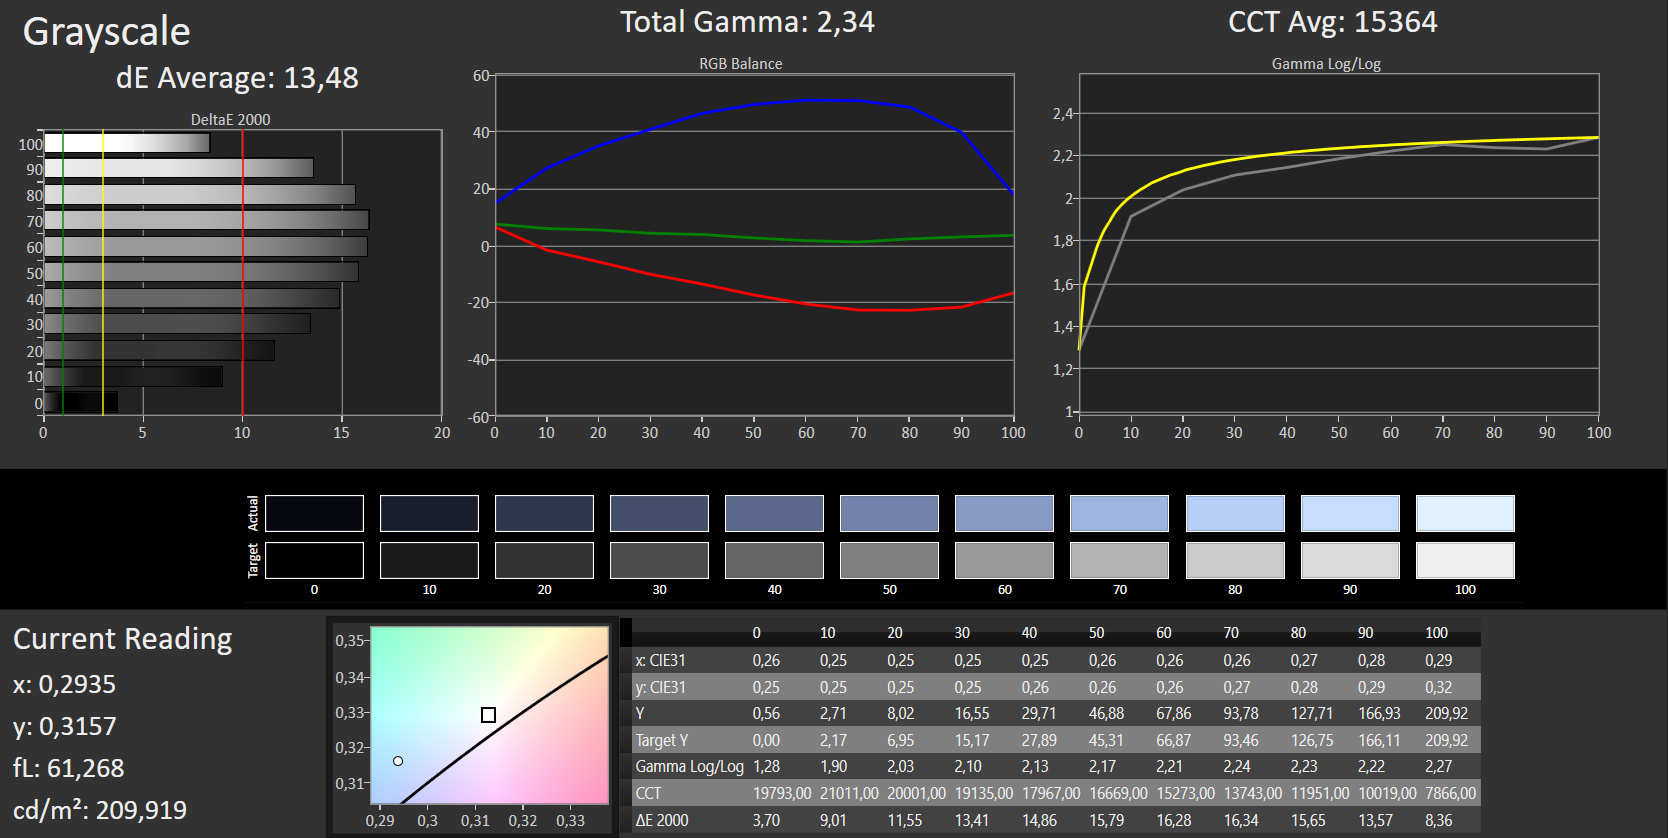
ΔE Greyscale Calman: 13.48 | ∀{0.09-98 Ø4.97}
60% sRGB (Argyll 1.6.3 3D)
38% AdobeRGB 1998 (Argyll 1.6.3 3D)
41.31% AdobeRGB 1998 (Argyll 3D)
60.2% sRGB (Argyll 3D)
39.98% Display P3 (Argyll 3D)
Gamma: 2.34
CCT: 15364 K
| HP 15-ba077ng TN LED, 1920x1080, 15.6" | Lenovo Ideapad 310-15IKB TN LED, 1920x1080, 15.6" | HP 15-ay116ng TN LED, 1920x1080, 15.6" | Asus F555UB-XO043T TN LED, 1366x768, 15.6" | Acer Aspire ES1-533-P7WA TN LED, 1920x1080, 15.6" | Acer Aspire E15 E5-553G-109A TN LED, 1920x1080, 15.6" | Dell Latitude 15-3570 TN LED, 1366x768, 15.6" | |
|---|---|---|---|---|---|---|---|
| Display | -5% | -7% | -4% | -5% | -1% | 2% | |
| Display P3 Coverage (%) | 39.98 | 38.07 -5% | 37.34 -7% | 38.22 -4% | 38.04 -5% | 39.72 -1% | 40.61 2% |
| sRGB Coverage (%) | 60.2 | 57.3 -5% | 56.2 -7% | 57.5 -4% | 57.2 -5% | 59.2 -2% | 61.1 1% |
| AdobeRGB 1998 Coverage (%) | 41.31 | 39.34 -5% | 38.58 -7% | 39.49 -4% | 39.3 -5% | 41.07 -1% | 41.96 2% |
| Response Times | 2% | 0% | -17% | -4% | 17% | -28% | |
| Response Time Grey 50% / Grey 80% * (ms) | 42 ? | 43 ? -2% | 40 ? 5% | 46 ? -10% | 43 ? -2% | 42.4 ? -1% | 37 ? 12% |
| Response Time Black / White * (ms) | 22 ? | 21 ? 5% | 23 ? -5% | 27 ? -23% | 23 ? -5% | 14.6 ? 34% | 37 ? -68% |
| PWM Frequency (Hz) | 50 ? | 50 ? | 28740 | ||||
| Screen | 20% | 11% | 18% | -1% | 9% | -1% | |
| Brightness middle (cd/m²) | 209 | 185 -11% | 249 19% | 214 2% | 201 -4% | 224 7% | 202 -3% |
| Brightness (cd/m²) | 200 | 184 -8% | 234 17% | 205 2% | 202 1% | 201 0% | 211 6% |
| Brightness Distribution (%) | 88 | 95 8% | 89 1% | 82 -7% | 92 5% | 75 -15% | 88 0% |
| Black Level * (cd/m²) | 0.56 | 0.28 50% | 0.44 21% | 0.46 18% | 0.67 -20% | 0.46 18% | 0.62 -11% |
| Contrast (:1) | 373 | 661 77% | 566 52% | 465 25% | 300 -20% | 487 31% | 326 -13% |
| Colorchecker dE 2000 * | 12.21 | 8.07 34% | 11.71 4% | 6.52 47% | 10.36 15% | 10.5 14% | 12.35 -1% |
| Colorchecker dE 2000 max. * | 20.66 | 14.83 28% | 19.51 6% | 9.1 56% | 18.88 9% | 16.8 19% | 19.9 4% |
| Greyscale dE 2000 * | 13.48 | 8.83 34% | 13.13 3% | 7.05 48% | 11.06 18% | 11.23 17% | 13.46 -0% |
| Gamma | 2.34 94% | 2.47 89% | 2.57 86% | 2.41 91% | 2.56 86% | 2.12 104% | 2.44 90% |
| CCT | 15364 42% | 10628 61% | 15273 43% | 8623 75% | 11368 57% | 11096 59% | 15217 43% |
| Color Space (Percent of AdobeRGB 1998) (%) | 38 | 36.2 -5% | 36 -5% | 36.6 -4% | 36 -5% | 38 0% | 39 3% |
| Color Space (Percent of sRGB) (%) | 60 | 57 -5% | 56 -7% | 57.8 -4% | 57 -5% | 59 -2% | 61 2% |
| Media totale (Programma / Settaggio) | 6% /
13% | 1% /
6% | -1% /
9% | -3% /
-2% | 8% /
8% | -9% /
-4% |
* ... Meglio usare valori piccoli
Sfarfallio dello schermo / PWM (Pulse-Width Modulation)
| flickering dello schermo / PWM rilevato | 50 Hz | ≤ 70 % settaggio luminosita' | 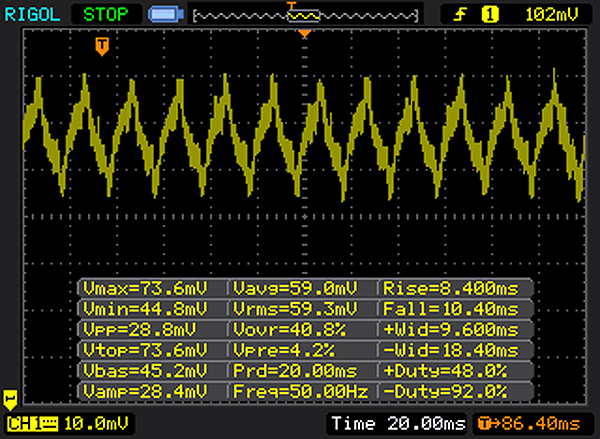 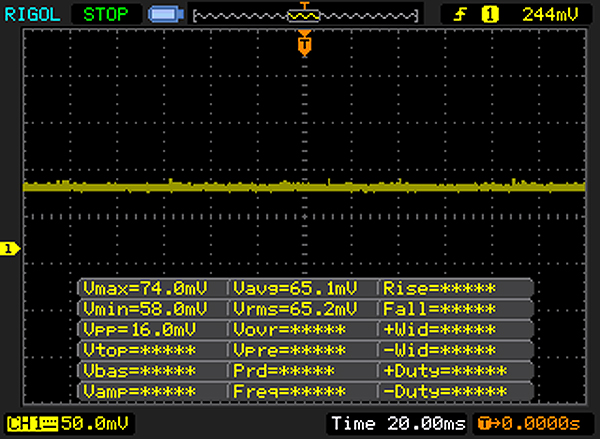 |
Il display sfarfalla a 50 Hz (Probabilmente a causa dell'uso di PWM) Flickering rilevato ad una luminosita' di 70 % o inferiore. Non dovrebbe verificarsi flickering o PWM sopra questo valore di luminosita'. La frequenza di 50 Hz è molto bassa, quindi il flickering potrebbe causare stanchezza agli occhi e mal di testa con un utilizzo prolungato. In confronto: 52 % di tutti i dispositivi testati non utilizza PWM per ridurre la luminosita' del display. Se è rilevato PWM, una media di 7784 (minimo: 5 - massimo: 343500) Hz è stata rilevata. | |||
Tempi di risposta del Display
| ↔ Tempi di risposta dal Nero al Bianco | ||
|---|---|---|
| 22 ms ... aumenta ↗ e diminuisce ↘ combinato | ↗ 6 ms Incremento | 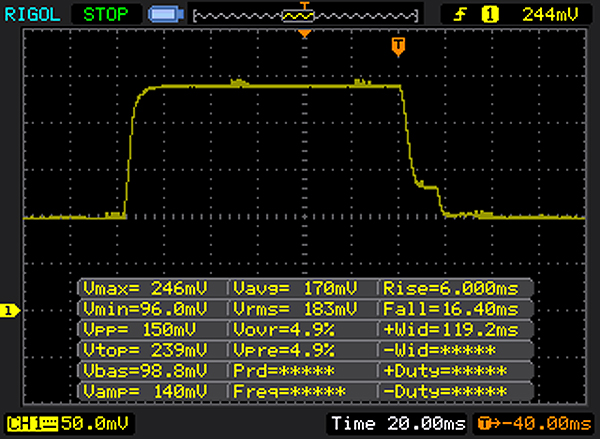 |
| ↘ 16 ms Calo | ||
| Lo schermo mostra buoni tempi di risposta durante i nostri tests, ma potrebbe essere troppo lento per i gamers competitivi. In confronto, tutti i dispositivi di test variano da 0.1 (minimo) a 240 (massimo) ms. » 48 % di tutti i dispositivi è migliore. Questo significa che i tempi di risposta rilevati sono peggiori rispetto alla media di tutti i dispositivi testati (19.9 ms). | ||
| ↔ Tempo di risposta dal 50% Grigio all'80% Grigio | ||
| 42 ms ... aumenta ↗ e diminuisce ↘ combinato | ↗ 21 ms Incremento | 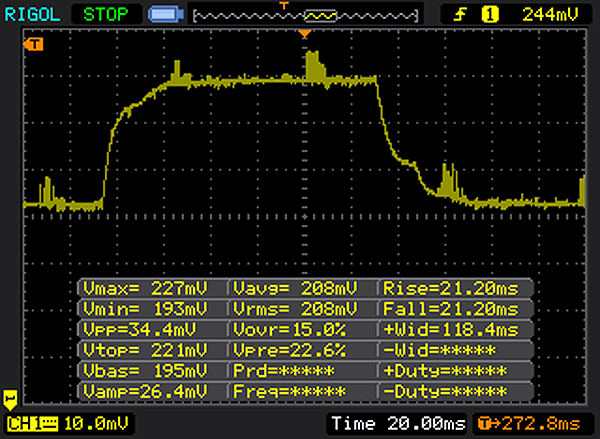 |
| ↘ 21 ms Calo | ||
| Lo schermo mostra tempi di risposta lenti nei nostri tests e sarà insoddisfacente per i gamers. In confronto, tutti i dispositivi di test variano da 0.165 (minimo) a 636 (massimo) ms. » 67 % di tutti i dispositivi è migliore. Questo significa che i tempi di risposta rilevati sono peggiori rispetto alla media di tutti i dispositivi testati (31.1 ms). | ||

| Geekbench 4.0 | |
| 64 Bit Single-Core Score | |
| HP 15-ay116ng | |
| HP 15-ba077ng | |
| Acer Aspire ES1-533-P7WA | |
| 64 Bit Multi-Core Score | |
| HP 15-ay116ng | |
| HP 15-ba077ng | |
| Acer Aspire ES1-533-P7WA | |
| JetStream 1.1 - 1.1 Total | |
| HP 15-ay116ng | |
| Lenovo Ideapad 310-15IKB | |
| Asus F555UB-XO043T | |
| HP 15-ba077ng | |
| Lenovo B50-70 MCC2GGE | |
| Lenovo Ideapad 500-15ACZ | |
| Lenovo ThinkPad E560 20EV000MGE | |
| Acer Aspire ES1-533-P7WA | |
| PCMark 7 Score | 4258 punti | |
| PCMark 8 Home Score Accelerated v2 | 2777 punti | |
| PCMark 8 Creative Score Accelerated v2 | 2413 punti | |
| PCMark 8 Work Score Accelerated v2 | 2773 punti | |
Aiuto | ||
| PCMark 8 | |
| Home Score Accelerated v2 | |
| Lenovo Ideapad 310-15IKB | |
| Dell Latitude 15-3570 | |
| HP 250 G5 SP X0N33EA | |
| HP 15-ay116ng | |
| Asus F555UB-XO043T | |
| Asus F555LJ-XX110H | |
| Lenovo ThinkPad E560 20EV000MGE | |
| HP Pavilion 15-aw004ng W8Y60EA | |
| Acer Aspire E15 E5-553G-109A | |
| Acer Aspire E5-552G-F62G | |
| HP 15-ba077ng | |
| Lenovo B50-70 MCC2GGE | |
| Acer Aspire ES1-533-P7WA | |
| Work Score Accelerated v2 | |
| HP 15-ay116ng | |
| Dell Latitude 15-3570 | |
| HP 250 G5 SP X0N33EA | |
| Asus F555UB-XO043T | |
| Lenovo ThinkPad E560 20EV000MGE | |
| HP Pavilion 15-aw004ng W8Y60EA | |
| Acer Aspire E15 E5-553G-109A | |
| Asus F555LJ-XX110H | |
| Acer Aspire E5-552G-F62G | |
| Lenovo B50-70 MCC2GGE | |
| HP 15-ba077ng | |

| HP 15-ba077ng SanDisk Z400s SD8SNAT-256G | HP 15-ay116ng Samsung CM871a MZNTY256HDHP | Asus F555UB-XO043T Seagate Momentus SpinPoint M8 ST1000LM024 | Acer Aspire ES1-533-P7WA Toshiba MQ01ABD100 | Acer Aspire E15 E5-553G-109A Liteonit CV3-8D128 | Dell Latitude 15-3570 Samsung CM871 MZNLF128HCHP | |
|---|---|---|---|---|---|---|
| CrystalDiskMark 3.0 | 62% | -88% | -89% | -4% | -37% | |
| Read Seq (MB/s) | 447.4 | 501 12% | 108.5 -76% | 107.6 -76% | 348.6 -22% | 453.2 1% |
| Write Seq (MB/s) | 243.3 | 483.9 99% | 106.2 -56% | 96.6 -60% | 311.8 28% | 137.7 -43% |
| Read 512 (MB/s) | 333.4 | 413.8 24% | 34.52 -90% | 22.5 -93% | 295.9 -11% | 308.5 -7% |
| Write 512 (MB/s) | 283.1 | 294.9 4% | 42.45 -85% | 24.23 -91% | 185.8 -34% | 134.1 -53% |
| Read 4k (MB/s) | 20.99 | 34.91 66% | 0.391 -98% | 0.474 -98% | 23.76 13% | 19.06 -9% |
| Write 4k (MB/s) | 62.7 | 95.7 53% | 0.855 -99% | 1.089 -98% | 44.94 -28% | 21.31 -66% |
| Read 4k QD32 (MB/s) | 143.1 | 370.9 159% | 0.774 -99% | 0.861 -99% | 171.6 20% | 93.5 -35% |
| Write 4k QD32 (MB/s) | 138 | 243.6 77% | 0.852 -99% | 0.991 -99% | 143.2 4% | 23.3 -83% |
| 3DMark 06 Standard Score | 7654 punti | |
| 3DMark Vantage P Result | 5568 punti | |
| 3DMark 11 Performance | 1881 punti | |
| 3DMark Ice Storm Standard Score | 43345 punti | |
| 3DMark Cloud Gate Standard Score | 5173 punti | |
| 3DMark Fire Strike Score | 1096 punti | |
| 3DMark Fire Strike Extreme Score | 521 punti | |
| 3DMark Time Spy Score | 398 punti | |
Aiuto | ||
| 3DMark 11 - 1280x720 Performance GPU | |
| Acer Aspire E5-552G-F62G | |
| Acer Aspire E15 E5-553G-109A | |
| HP Pavilion 15-aw004ng W8Y60EA | |
| Asus F555UB-XO043T | |
| HP 15-ba077ng | |
| MSI CX72-7QL | |
| Razer Blade Stealth QHD i7-7500U | |
| Acer Aspire E5-774-54HJ | |
| Lenovo Ideapad 310-15IKB | |
| HP 15-ay116ng | |
| Dell Latitude 15-3570 | |
| HP 250 G5 SP X0N33EA | |
| Acer Aspire ES1-533-P7WA | |
| 3DMark | |
| 1280x720 Cloud Gate Standard Graphics | |
| HP Pavilion 15-aw004ng W8Y60EA | |
| Acer Aspire E15 E5-553G-109A | |
| Acer Aspire E5-552G-F62G | |
| MSI CX72-7QL | |
| Asus F555UB-XO043T | |
| Razer Blade Stealth QHD i7-7500U | |
| HP 15-ba077ng | |
| Lenovo Ideapad 310-15IKB | |
| HP 15-ay116ng | |
| HP 250 G5 SP X0N33EA | |
| Dell Latitude 15-3570 | |
| 1920x1080 Fire Strike Graphics | |
| HP Pavilion 15-aw004ng W8Y60EA | |
| Acer Aspire E15 E5-553G-109A | |
| Asus F555UB-XO043T | |
| HP 15-ba077ng | |
| MSI CX72-7QL | |
| Razer Blade Stealth QHD i7-7500U | |
| Lenovo Ideapad 310-15IKB | |
| HP 15-ay116ng | |
| GFXBench | |
| on screen Car Chase Onscreen | |
| HP Pavilion 15-aw004ng W8Y60EA | |
| HP 15-ba077ng | |
| 1920x1080 Car Chase Offscreen | |
| HP Pavilion 15-aw004ng W8Y60EA | |
| HP 15-ba077ng | |
| GFXBench 3.1 | |
| on screen Manhattan ES 3.1 Onscreen | |
| HP 15-ba077ng | |
| HP Pavilion 15-aw004ng W8Y60EA | |
| 1920x1080 Manhattan ES 3.1 Offscreen | |
| HP Pavilion 15-aw004ng W8Y60EA | |
| HP 15-ba077ng | |
| GFXBench 3.0 | |
| on screen Manhattan Onscreen OGL | |
| HP 15-ba077ng | |
| HP Pavilion 15-aw004ng W8Y60EA | |
| 1920x1080 1080p Manhattan Offscreen | |
| HP Pavilion 15-aw004ng W8Y60EA | |
| HP 15-ba077ng | |
| GFXBench (DX / GLBenchmark) 2.7 | |
| T-Rex Onscreen | |
| HP Pavilion 15-aw004ng W8Y60EA | |
| HP 15-ba077ng | |
| 1920x1080 T-Rex Offscreen | |
| HP Pavilion 15-aw004ng W8Y60EA | |
| HP 15-ba077ng | |
| Geekbench 4.0 - Compute OpenCL Score | |
| HP 15-ba077ng | |
| HP 15-ay116ng | |
| Acer Aspire ES1-533-P7WA | |
| LuxMark v2.0 64Bit | |
| Sala GPUs-only | |
| HP Pavilion 15-aw004ng W8Y60EA | |
| MSI CX72-7QL | |
| HP 15-ba077ng | |
| Room GPUs-only | |
| HP Pavilion 15-aw004ng W8Y60EA | |
| MSI CX72-7QL | |
| HP 15-ba077ng | |
| basso | medio | alto | ultra | |
|---|---|---|---|---|
| Diablo III (2012) | 70 | 54.6 | 45.5 | 41.3 |
| Tomb Raider (2013) | 74.1 | 36.9 | 28.1 | 12.7 |
| BioShock Infinite (2013) | 60.9 | 37.8 | 32.6 | 10.7 |
| Battlefield 4 (2013) | 44.1 | 29.6 | 20.4 | 7.7 |
| Thief (2014) | 15.3 | 12.6 | 12.3 | |
| GRID: Autosport (2014) | 91.3 | 40.6 | 21.6 | |
| Sims 4 (2014) | 122.3 | 44.8 | 23.2 | |
| F1 2014 (2014) | 62 | 41 | 31 | |
| Dragon Age: Inquisition (2014) | 29.9 | 27.3 | 16.7 | |
| Battlefield Hardline (2015) | 37.7 | 32.1 | 12.9 | |
| GTA V (2015) | 41.5 | 38.1 | 10 | |
| Dirt Rally (2015) | 79 | 27.3 | 15.2 | |
| Metal Gear Solid V (2015) | 45.5 | 36.4 | 14.3 | |
| World of Warships (2015) | 47.1 | 35.4 | 20.9 | |
| Anno 2205 (2015) | 26.1 | 14.4 | 6.7 | |
| Star Wars Battlefront (2015) | 22.9 | 21.2 | 10.5 | |
| Rainbow Six Siege (2015) | 47.1 | 20.8 | 14.7 | |
| Rise of the Tomb Raider (2016) | 22.5 | 14.2 | 7.1 | |
| XCOM 2 (2016) | 18.4 | 6.9 | 4.9 | |
| Far Cry Primal (2016) | 15 | 9 | 8 | |
| Deus Ex Mankind Divided (2016) | 15.5 | 11.6 | 6.4 | |
| Battlefield 1 (2016) | 23.3 | 16.7 | 8.3 | |
| Civilization 6 (2016) | 30.5 | 14.6 | 7.6 | |
| Farming Simulator 17 (2016) | 63.2 | 47.5 | 22 | |
| Titanfall 2 (2016) | 34 | 30.3 | 10.5 |
| BioShock Infinite - 1280x720 Very Low Preset | |
| Asus F555UB-XO043T | |
| HP Pavilion 15-aw004ng W8Y60EA | |
| MSI CX72-7QL | |
| HP 15-ba077ng | |
| Lenovo Ideapad 310-15IKB | |
| Acer Aspire E5-774-54HJ | |
| HP 15-ay116ng | |
| HP 250 G5 SP X0N33EA | |
| Acer Aspire ES1-533-P7WA | |
| Tomb Raider - 1024x768 Low Preset | |
| HP Pavilion 15-aw004ng W8Y60EA | |
| HP 15-ba077ng | |
| HP 15-ay116ng | |
| Battlefield 4 - 1024x768 Low Preset | |
| MSI CX72-7QL | |
| HP Pavilion 15-aw004ng W8Y60EA | |
| HP 15-ba077ng | |
| Acer Aspire E5-552G-F62G | |
| HP 15-ay116ng | |
| HP 250 G5 SP X0N33EA | |
| Sims 4 - 1024x768 Low Preset | |
| MSI CX72-7QL | |
| Razer Blade Stealth QHD i7-7500U | |
| HP 15-ba077ng | |
| Diablo III - 1366x768 Medium / low | |
| MSI CX72-7QL | |
| HP 15-ba077ng | |
| Titanfall 2 - 1280x720 Low / Disabled AF:Trilinear | |
| Acer Aspire E5-774-54HJ | |
| HP 15-ba077ng | |
| Battlefield 1 - 1280x720 Low Preset | |
| Acer Aspire E15 E5-553G-109A | |
| Acer Aspire E5-774-54HJ | |
| HP 15-ba077ng | |
| World of Warships - 1366x768 Low Preset AF:Trilinear | |
| MSI CX72-7QL | |
| Razer Blade Stealth QHD i7-7500U | |
| HP 15-ba077ng | |
Rumorosità
| Idle |
| 31.5 / 31.8 / 31.8 dB(A) |
| DVD |
| 37.2 / dB(A) |
| Sotto carico |
| 31.4 / 33.4 dB(A) |
 | ||
30 dB silenzioso 40 dB(A) udibile 50 dB(A) rumoroso |
||
min: | ||
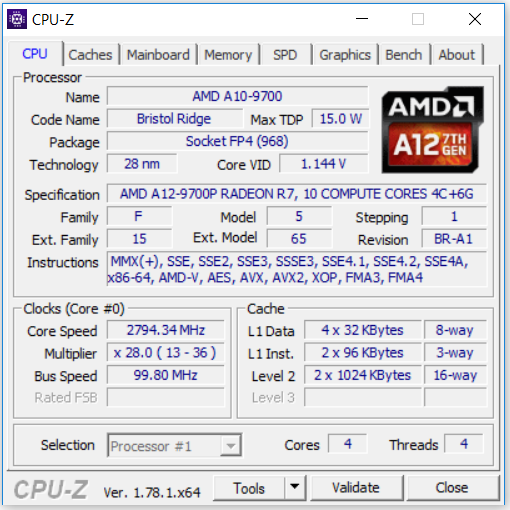
| HP 15-ba077ng A12-9700P, Radeon R7 (Bristol Ridge) | Lenovo Ideapad 310-15IKB i5-7200U, HD Graphics 620 | HP 15-ay116ng i5-7200U, HD Graphics 620 | Acer Aspire E15 E5-553G-109A A12-9700P, Radeon R8 M445DX | HP Pavilion 15-aw004ng W8Y60EA A10-9600P, Radeon R8 M445DX | Asus F555UB-XO043T 6200U, GeForce 940M | Dell Latitude 15-3570 6200U, HD Graphics 520 | |
|---|---|---|---|---|---|---|---|
| Noise | -3% | -3% | -1% | -10% | -16% | -1% | |
| off /ambiente * (dB) | 30.6 | 29 5% | 30.5 -0% | 30.5 -0% | 31.2 -2% | 31 -1% | |
| Idle Minimum * (dB) | 31.5 | 30.6 3% | 31.3 1% | 31.4 -0% | 31.7 -1% | 34 -8% | 31 2% |
| Idle Average * (dB) | 31.8 | 30.6 4% | 31.3 2% | 31.4 1% | 31.9 -0% | 34 -7% | 31 3% |
| Idle Maximum * (dB) | 31.8 | 30.6 4% | 31.3 2% | 31.9 -0% | 31.9 -0% | 34.2 -8% | 31 3% |
| Load Average * (dB) | 31.4 | 36.8 -17% | 35.6 -13% | 33.7 -7% | 41 -31% | 38.9 -24% | 34.2 -9% |
| Load Maximum * (dB) | 33.4 | 38.2 -14% | 36.15 -8% | 33.8 -1% | 42.7 -28% | 43.6 -31% | 34.3 -3% |
| Witcher 3 ultra * (dB) | 40.6 |
* ... Meglio usare valori piccoli
(+) La temperatura massima sul lato superiore è di 34.8 °C / 95 F, rispetto alla media di 34.3 °C / 94 F, che varia da 21.2 a 62.5 °C per questa classe Office.
(+) Il lato inferiore si riscalda fino ad un massimo di 38.3 °C / 101 F, rispetto alla media di 36.8 °C / 98 F
(+) In idle, la temperatura media del lato superiore è di 22.4 °C / 72 F, rispetto alla media deld ispositivo di 29.5 °C / 85 F.
(+) I poggiapolsi e il touchpad raggiungono la temperatura massima della pelle (34 °C / 93.2 F) e quindi non sono caldi.
(-) La temperatura media della zona del palmo della mano di dispositivi simili e'stata di 27.5 °C / 81.5 F (-6.5 °C / -11.7 F).
| HP 15-ba077ng A12-9700P, Radeon R7 (Bristol Ridge) | Lenovo Ideapad 310-15IKB i5-7200U, HD Graphics 620 | HP 15-ay116ng i5-7200U, HD Graphics 620 | Acer Aspire E15 E5-553G-109A A12-9700P, Radeon R8 M445DX | HP Pavilion 15-aw004ng W8Y60EA A10-9600P, Radeon R8 M445DX | Asus F555UB-XO043T 6200U, GeForce 940M | Acer Aspire ES1-533-P7WA Pentium N4200, HD Graphics 505 | Dell Latitude 15-3570 6200U, HD Graphics 520 | |
|---|---|---|---|---|---|---|---|---|
| Heat | -6% | 1% | -25% | -7% | -13% | -11% | -26% | |
| Maximum Upper Side * (°C) | 34.8 | 34.1 2% | 33.8 3% | 36.8 -6% | 33.4 4% | 33.2 5% | 33.3 4% | 36.1 -4% |
| Maximum Bottom * (°C) | 38.3 | 35.6 7% | 36.6 4% | 56.5 -48% | 32.9 14% | 44 -15% | 39.4 -3% | 47 -23% |
| Idle Upper Side * (°C) | 23.2 | 26.7 -15% | 23.6 -2% | 27.1 -17% | 27.7 -19% | 28.2 -22% | 27.3 -18% | 31.7 -37% |
| Idle Bottom * (°C) | 23.3 | 27 -16% | 23.8 -2% | 29.8 -28% | 29.4 -26% | 28.1 -21% | 29.2 -25% | 32.9 -41% |
* ... Meglio usare valori piccoli
HP 15-ba077ng analisi audio
(±) | potenza degli altiparlanti media ma buona (74 dB)
Bassi 100 - 315 Hz
(-) | quasi nessun basso - in media 28.4% inferiori alla media
(±) | la linearità dei bassi è media (12.3% delta rispetto alla precedente frequenza)
Medi 400 - 2000 Hz
(+) | medi bilanciati - solo only 2.7% rispetto alla media
(±) | linearità dei medi adeguata (8.1% delta rispetto alla precedente frequenza)
Alti 2 - 16 kHz
(+) | Alti bilanciati - appena 3.8% dalla media
(+) | alti lineari (6.6% delta rispetto alla precedente frequenza)
Nel complesso 100 - 16.000 Hz
(±) | la linearità complessiva del suono è media (22.4% di differenza rispetto alla media
Rispetto alla stessa classe
» 59% di tutti i dispositivi testati in questa classe è stato migliore, 9% simile, 32% peggiore
» Il migliore ha avuto un delta di 7%, medio di 21%, peggiore di 53%
Rispetto a tutti i dispositivi testati
» 65% di tutti i dispositivi testati in questa classe è stato migliore, 6% similare, 29% peggiore
» Il migliore ha avuto un delta di 4%, medio di 24%, peggiore di 134%
Apple MacBook 12 (Early 2016) 1.1 GHz analisi audio
(+) | gli altoparlanti sono relativamente potenti (83.6 dB)
Bassi 100 - 315 Hz
(±) | bassi ridotti - in media 11.3% inferiori alla media
(±) | la linearità dei bassi è media (14.2% delta rispetto alla precedente frequenza)
Medi 400 - 2000 Hz
(+) | medi bilanciati - solo only 2.4% rispetto alla media
(+) | medi lineari (5.5% delta rispetto alla precedente frequenza)
Alti 2 - 16 kHz
(+) | Alti bilanciati - appena 2% dalla media
(+) | alti lineari (4.5% delta rispetto alla precedente frequenza)
Nel complesso 100 - 16.000 Hz
(+) | suono nel complesso lineare (10.2% differenza dalla media)
Rispetto alla stessa classe
» 7% di tutti i dispositivi testati in questa classe è stato migliore, 2% simile, 91% peggiore
» Il migliore ha avuto un delta di 5%, medio di 18%, peggiore di 53%
Rispetto a tutti i dispositivi testati
» 5% di tutti i dispositivi testati in questa classe è stato migliore, 1% similare, 94% peggiore
» Il migliore ha avuto un delta di 4%, medio di 24%, peggiore di 134%
| Off / Standby | |
| Idle | |
| Sotto carico |
|
Leggenda:
min: | |
| HP 15-ba077ng A12-9700P, Radeon R7 (Bristol Ridge) | Lenovo Ideapad 310-15IKB i5-7200U, HD Graphics 620 | HP 15-ay116ng i5-7200U, HD Graphics 620 | Acer Aspire E15 E5-553G-109A A12-9700P, Radeon R8 M445DX | HP Pavilion 15-aw004ng W8Y60EA A10-9600P, Radeon R8 M445DX | Asus F555UB-XO043T 6200U, GeForce 940M | Acer Aspire ES1-533-P7WA Pentium N4200, HD Graphics 505 | Dell Latitude 15-3570 6200U, HD Graphics 520 | |
|---|---|---|---|---|---|---|---|---|
| Power Consumption | 2% | 16% | -62% | -37% | -21% | 5% | 5% | |
| Idle Minimum * (Watt) | 4.4 | 3.5 20% | 3.2 27% | 7.2 -64% | 5.5 -25% | 4.7 -7% | 5.3 -20% | 4.9 -11% |
| Idle Average * (Watt) | 6.8 | 6.1 10% | 6.3 7% | 10.3 -51% | 8.2 -21% | 6.5 4% | 8.8 -29% | 7.2 -6% |
| Idle Maximum * (Watt) | 8.9 | 7 21% | 7.4 17% | 11.9 -34% | 9.5 -7% | 6.8 24% | 9.7 -9% | 7.5 16% |
| Load Average * (Watt) | 30.9 | 31.2 -1% | 24 22% | 48.2 -56% | 44.5 -44% | 42.7 -38% | 18 42% | 25.4 18% |
| Load Maximum * (Watt) | 31 | 42.9 -38% | 29 6% | 63 -103% | 58 -87% | 59 -90% | 18.2 41% | 28 10% |
| Witcher 3 ultra * (Watt) | 51.8 |
* ... Meglio usare valori piccoli
| HP 15-ba077ng A12-9700P, Radeon R7 (Bristol Ridge), 41 Wh | Lenovo Ideapad 310-15IKB i5-7200U, HD Graphics 620, 30 Wh | HP 15-ay116ng i5-7200U, HD Graphics 620, 41 Wh | Acer Aspire E15 E5-553G-109A A12-9700P, Radeon R8 M445DX, 40 Wh | HP 250 G5 SP X0N33EA 6200U, HD Graphics 520, 41 Wh | HP Pavilion 15-aw004ng W8Y60EA A10-9600P, Radeon R8 M445DX, 41 Wh | Asus F555UB-XO043T 6200U, GeForce 940M, 37 Wh | Acer Aspire ES1-533-P7WA Pentium N4200, HD Graphics 505, 36 Wh | Dell Latitude 15-3570 6200U, HD Graphics 520, 65 Wh | |
|---|---|---|---|---|---|---|---|---|---|
| Autonomia della batteria | -19% | 26% | -37% | 6% | -18% | 20% | 10% | 58% | |
| Reader / Idle (h) | 12.4 | 10.2 -18% | 14.5 17% | 6 -52% | 10.6 -15% | 9.3 -25% | 17.1 38% | ||
| H.264 (h) | 4.6 | 7.2 57% | 5.2 13% | 3.2 -30% | |||||
| WiFi v1.3 (h) | 4.9 | 3.8 -22% | 6.9 41% | 4.3 -12% | 5.8 18% | 4.3 -12% | 5.9 20% | 5.4 10% | 9 84% |
| Load (h) | 1.7 | 1.4 -18% | 1.5 -12% | 0.9 -47% | 1.8 6% | 1.6 -6% | 2.6 53% |
Pro
Contro
L'APU AMD installata offre potenza più che sufficienti per applicazioni da ufficio e navigazione di internet. Inoltre, è possibile giocare a qualche gioco senza requisiti particolarmente elevati o un po' datati. Il laptop non fa molto rumore e si scalda appena.
Con il suo 15-ba077ng, HP offre un sistema home-office a prezzo interessante.
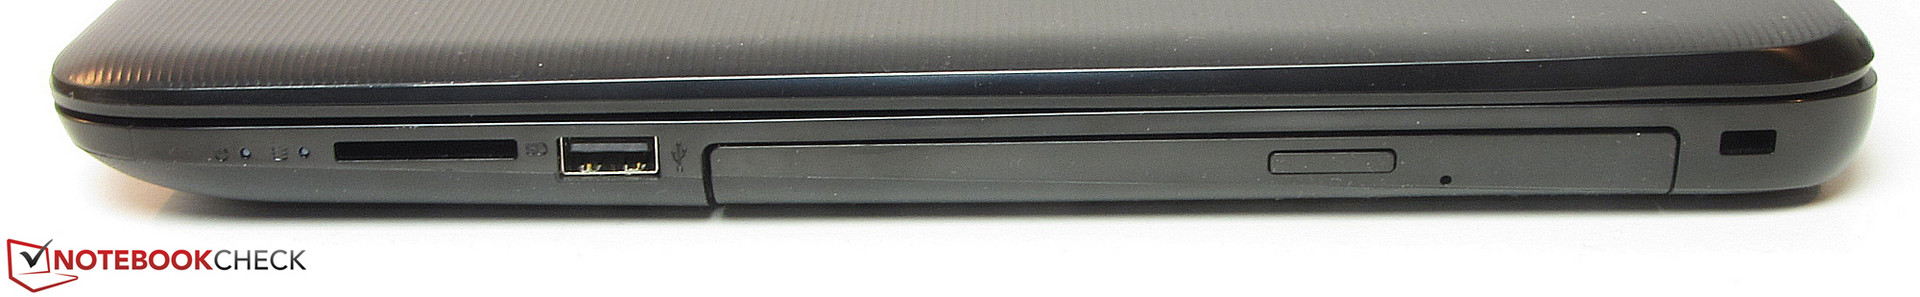
Un veloce SSD garantisce interessanti tempistiche. L'SSD può essere sostituito, ma occorre smontare il case perché non è presente uno sportello per la manutenzione. La tastiera e la scarsa autoonmia della batteria confermano che questo laptop è più adatto all'utilizzo in casa. Il display Full HD opaco non emozionerà nessuno: è scuro, il contrasto è scarso e gli angoli di visualizzazione piuttosto ridotti.
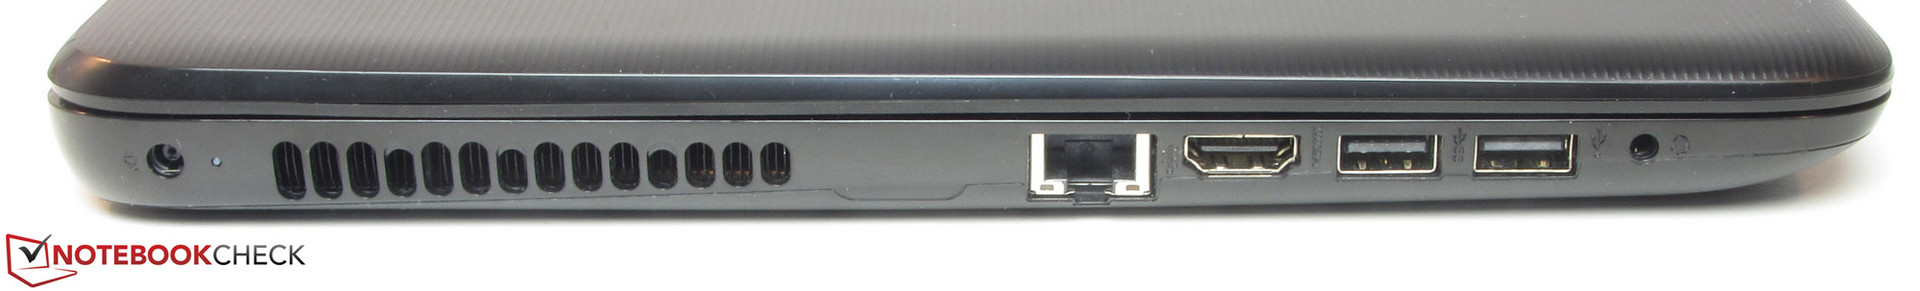
I tagli fatti da HP non sono visibili a una prima occhiata. Si nota subito il prezzo di circa 450 Euro (~$482). HP include solo un anno di garanzia, mentre molti altri produttori offrono due anni anche sui dispositivi di fascia più bassa. Non sono stati inseriti un modulo WiFi che supporta lo standard ac, né una porta Gigabit Ethernet. HP offre solo una porta Fast Ethernet, e non è presente neppure una porta USB Type-C. Come se non bastasse, lo schermo ha esibito PWM flickering a soli 50 Hz con funzionamento a batteria (ma non quando è collegato alla corrente).
Test e benchmark che abbiamo svolto mostrano chiaramente perché i laptop dotati di APU AMD hanno una chance sul mercato solo quando sono offerti a un prezzo di molto inferiore rispetto alla concorrenza dotata di chip Intel: le prestazioni dei processori AMD sono inferiori e richiedono più potenza. Ciò comporta un'autonomia della batteria di molto inferiore. Le prestazioni in qualche modo più elevate della iGPU Radeon non portano all'utente nessun vantaggio pratico. AMD dovrà fare un ottimo lavoro con le nuove APU Ryzen per diminuire il gap con Intel e diventare nuovamente competitiva nel settore laptop.
HP 15-ba077ng
- 01/23/2017 v6 (old)
Sascha Mölck