Notebookcheck Logo

AMD Radeon R7 (Bristol Ridge)
AMD Radeon R7 (Bristol Ridge)

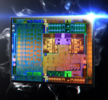
L'AMD Radeon R7 (Bristol Ridge) è una scheda grafica integrata per le più veloci APUs mobile AMD Carrizo. Al suo lancio, la R7 è disponibile sul modello top FX9830P con 512 GCN unità shader ed un core clock da 900 MHz. Le specifiche tecniche non differiscono rispetto alla AMD Radeon R7 della Carrizo, ma il clock è fino a 100 MHz superiore. In base al sistema di raffreddamento e al TDP configurabile (12-45 Watts), le performance possono differire abbastanza. Le prestazioni dipendono anche dalla memoria (migliori performance con la dual-channel DDR4).

Architettura e Features

Stando ad AMD, la Radeon R7 consiste di otto cores basati sulla terza generazione GCN (spesso chiamata GCN 1.2 o 2.0 dalla stampa). Di conseguenza è molto simile al chip desktop Tonga e supporta DirectX 12 (FL 12_0). Inoltre, i suoi shaders possono essere usati con Mantle, OpenGL ed OpenCL. L'HSA 1.0 è supportato per lanciare il codice sui cores CPU che GPU simultaneamente.

Rispetto alla generazione Kaveri (Kaveri R7 con GCN 1.1), la nuova compressione del colore in particolare consente un miglior utilizzo della memoria e migliora le prestazioni gaming del 5-7 %. 

Il video decoder migliorato della Carrizo/Bristol Ridge ora include UVD 6 (Unified Video Decoder), che può decodificare HVEC / H.265 fino a 4K con l'hardware. Inoltre, il VCE (Video Codec Engine) è stato migliorato per una migliore transcodifica dell'H.264. Maggiori informazioni sull'architettura e sulle features dell'architettura Bristol Ridge potete trovarle nel nostro articolo di lancio.

Performance

In base al TDP configurabile dei chips Bristol Ridge tra 12 e 45 Watts, possono esserci differenze significative con i giochi. Nel complesso, i risultati sono leggermente migliori rispetto alla Carrizo Radeon R7 grazie ai clocks superiori con modelli paragonabili. Potete sempre usare i banchmarks Kaveri R7 per testare le prestazioni gaming.

Consumo Energetico

In base al TDP (cTDP) configurabile, il chip da 28 nm ha una specifica di 12-45 Watts. Di conseguenza può essere usato su portatili leggeri e sottili e anche si dispositivi di dimensioni medie o All-in-Ones (AiO).

Radeon R (Stoney / Bristol Ridge) Serie

Radeon R7 (Bristol Ridge) 512 @ 0.9 GHz64/128 Bit
Radeon R5 (Bristol Ridge) 384 @ 0.8 GHz64/128 Bit
Radeon R5 (Stoney Ridge) 192 @ 0.8 GHz64 Bit
Radeon R4 (Stoney Ridge) 192 @ 0.6 GHz64 Bit
Radeon R2 (Stoney Ridge) 128 @ 0.6 GHz64 Bit
Nome in codiceBristol Ridge
ArchitetturaGCN 1.2
Pipelines512 - unified
Velocità del core900 (Boost) MHz
Larghezza del bus di memoria64/128 Bit
Memoria condivisasi
APIDirectX 12 (FL 12_0), OpenGL 4.4
Consumo di corrente12-45 Watt
Transistor Count2.4 Billion
tecnologia28 nm
CaratteristicheUVD 6, VCE
Dimensione del portatilemisura media
Data dell'annuncio01.06.2016
CPU in Radeon R7 (Bristol Ridge)GPU Base SpeedGPU Boost / Turbo
AMD FX-9830P4 x 3000 MHz, 25-45 W? MHz900 MHz
AMD PRO A12-9830B4 x 3000 MHz, 25-45 W? MHz900 MHz
AMD FX-9800P4 x 2700 MHz, 15 W? MHz758 MHz
min. - max.? MHz758 - 900 MHz

Benchmark

Performance Rating - 3DMark 11 + Fire Strike + Time Spy
0.5 pt (1%)
AMD Radeon HD 8180
0.06605 -86%
...
0.415 -10%
0.42 -9%
0.4255 -8%
0.4259 -8%
0.4323 -6%
0.4332 -6%
0.4514 -2%
AMD Radeon R5 (Carrizo)
0.456 -1%
0.4574 -1%
AMD Radeon R7 (Bristol Ridge)
0.4615
0.4628 0%
0.4656 1%
0.4662 1%
0.4765 3%
0.4833 5%
Intel HD Graphics 630
0.4861 5%
AMD Radeon R7 M260
0.4861 5%
0.4922 7%
0.508 10%
...
21.1 4472%
max:
33.3 7116%
0%
100%
3DMark - 3DMark Time Spy Score
min: 338     media: 364.7     media: 358 (1%)     massimo: 398 Points
3DMark - 3DMark Time Spy Graphics
min: 325     media: 343.7     media: 347 (1%)     massimo: 359 Points
113 -67%
...
274 -20%
281 -18%
Intel UHD Graphics 617
299 -13%
312 -9%
320 -7%
328.8 -4%
329 -4%
334 -3%
Intel UHD Graphics 24EUs (Alder Lake-N)
336.2 -2%
AMD Radeon R7 (Bristol Ridge)
343.7
Intel UHD Graphics Xe 16EUs (Tiger Lake-H)
344.7 0%
349 2%
Intel HD Graphics 630
368 7%
371.8 8%
377 10%
381 11%
389.1 13%
397 16%
409.5 19%
...
19434 5554%
max:
36485 10515%
0%
100%
3DMark - 3DMark Ice Storm Unlimited Graphics
min: 34845     media: 49654     media: 52245.5 (6%)     massimo: 59281 Points
3DMark - 3DMark Ice Storm Extreme Graphics
min: 32062     media: 34971     media: 32389 (4%)     massimo: 40461 Points
3DMark - 3DMark Fire Strike Standard Score
min: 667     media: 938     media: 866 (2%)     massimo: 1230 Points
3DMark - 3DMark Ice Storm Graphics
min: 44545     media: 48082     media: 46007 (6%)     massimo: 53693 Points
3DMark 11 - 3DM11 Performance Score
min: 1737     media: 1859     media: 1794 (2%)     massimo: 2130 Points
3DMark 11 - 3DM11 Performance GPU
min: 1820     media: 1913     media: 1852 (2%)     massimo: 2210 Points
171.8 -91%
...
1807 -6%
1819 -5%
1823 -5%
1831 -4%
1843 -4%
1846 -4%
1858 -3%
AMD Radeon R7 M260
1891 -1%
1903 -1%
AMD Radeon R7 (Bristol Ridge)
1913
1916 0%
1926 1%
Qualcomm Adreno 685
1927 1%
1934 1%
Qualcomm Adreno 680
1936 1%
1942 2%
1969 3%
1981 4%
1985 4%
...
59943 3033%
max:
106023 5442%
0%
100%
3DMark Vantage
3DM Vant. Perf. total +
3DM Vant. Perf. GPU no PhysX +
3DMark 06 3DMark 06 - Standard 1280x1024 +
3DMark 06
min: 5635     media: 6645     media: 6644.5 (9%)     massimo: 7654 Points
Unigine Valley 1.0 - Unigine Valley 1.0 DX
3.5 fps (1%)
Cinebench R10 Cinebench R10 Shading (32bit) +
Cinebench R11.5 Cinebench R11.5 OpenGL 64 Bit +
Cinebench R11.5 - Cinebench R11.5 OpenGL 64 Bit
min: 18.06     media: 20.1     media: 18.3 (6%)     massimo: 25.65 fps
Cinebench R15
Cinebench R15 OpenGL 64 Bit +
Cinebench R15 OpenGL Ref. Match 64 Bit +
Cinebench R15 - Cinebench R15 OpenGL Ref. Match 64 Bit
98 % (98%)
GFXBench - GFXBench Car Chase Offscreen
23.8 fps (3%)
GFXBench 3.1 - GFXBench Manhattan ES 3.1 Offscreen
24.3 fps (1%)
GFXBench (DX / GLBenchmark) 2.7
GFXBench T-Rex HD Offscreen C24Z16 +
LuxMark v2.0 64Bit - LuxMark v2.0 Room GPU
min: 175     media: 178.5     media: 178.5 (1%)     massimo: 182 Samples/s
LuxMark v2.0 64Bit - LuxMark v2.0 Sala GPU
min: 358     media: 362.5     media: 362.5 (1%)     massimo: 367 Samples/s
ComputeMark v2.1 - ComputeMark v2.1 Result
min: 1093     media: 1346     media: 1450 (2%)     massimo: 1495 punti
Power Consumption - The Witcher 3 Power Consumption - external Monitor *
29.1 Watt (4%)
Clock Speed - GPU Clock Witcher 3 ultra
472 MHz (19%)
- Valori di benchmark per questa scheda grafica
- Valori medi di benchmark per questa scheda grafica
* Numeri più piccoli rappresentano prestazioni supeiori

Benchmarks per i giochi

I seguenti benchmarks deirivano dai benchmarks dei portatili recensiti. Le prestazioni dipendono dalla scheda grafica utilizzata, dal clock rate, dal processore, dai settaggi di sistema, dai drivers, e dai sistemi operativi. Quindi i risultati non sono rappresentativi per i portatili con questa GPU. Per informazioni dettagliate sui risultati del benchmark, cliccate sul numero di fps.

basso 1280x720
13.1  fps    + Confronta
» Il Benchmark indica che il gioco non è utilizzabile con i settaggi testati.
basso 1280x720
13.8  fps    + Confronta
» Il Benchmark indica che il gioco non è utilizzabile con i settaggi testati.
basso 1280x720
46.2  fps    + Confronta
alto 1920x1080
34  fps    + Confronta
» Giocabile con tutti i portatili testati con dettagli basso.
Dirt 4

Dirt 4

2017
basso 1280x720
40.9  fps    + Confronta
» Giocabile con tutti i portatili testati con dettagli basso.
basso 1280x720
57  fps    + Confronta
medio 1920x1080
33.2  fps    + Confronta
alto 1920x1080
18.1  fps    + Confronta
» Giocabile con tutti i portatili testati con dettagli basso.
basso 1280x720
11.9  fps    + Confronta
medio 1920x1080
5.3  fps    + Confronta
» Il Benchmark indica che il gioco non è utilizzabile con i settaggi testati.
For Honor

For Honor

2017
basso 1280x720
20.6  fps    + Confronta
medio 1920x1080
7.1  fps    + Confronta
» Il Benchmark indica che il gioco non è utilizzabile con i settaggi testati.
basso 1280x720
31.9 36.7 ~ 34 fps    + Confronta
medio 1920x1080
12.2  fps    + Confronta
» Il Benchmark indica che il gioco non è utilizzabile con i settaggi testati.
basso 1280x720
11  fps    + Confronta
medio 1366x768
8.8  fps    + Confronta
» Il Benchmark indica che il gioco non è utilizzabile con i settaggi testati.
basso 1280x720
34  fps    + Confronta
medio 1366x768
30.3  fps    + Confronta
alto 1920x1080
10.5  fps    + Confronta
» Il Benchmark indica che il gioco non è utilizzabile con i settaggi testati.
basso 1280x720
63.2  fps    + Confronta
medio 1366x768
47.5  fps    + Confronta
alto 1920x1080
22  fps    + Confronta
» Giocabile con tutti i portatili testati con dettagli medio.
basso 1280x720
23.3  fps    + Confronta
medio 1366x768
16.7  fps    + Confronta
alto 1920x1080
8.3  fps    + Confronta
» Il Benchmark indica che il gioco non è utilizzabile con i settaggi testati.
basso 1024x768
30.5  fps    + Confronta
medio 1366x768
14.6  fps    + Confronta
alto 1920x1080
7.6  fps    + Confronta
» Il Benchmark indica che il gioco non è utilizzabile con i settaggi testati.
basso 1280x720
10 15.5 ~ 13 fps    + Confronta
medio 1366x768
7 11.6 ~ 9 fps    + Confronta
alto 1920x1080
6.4  fps    + Confronta
» Il Benchmark indica che il gioco non è utilizzabile con i settaggi testati.
basso 1280x720
16.9  fps    + Confronta
medio 1366x768
11.7  fps    + Confronta
» Il Benchmark indica che il gioco non è utilizzabile con i settaggi testati.
basso 1280x768
8  fps    + Confronta
» Il Benchmark indica che il gioco non è utilizzabile con i settaggi testati.
basso 1280x720
17.4  fps    + Confronta
medio 1366x768
10.6  fps    + Confronta
» Il Benchmark indica che il gioco non è utilizzabile con i settaggi testati.
basso 1280x720
15  fps    + Confronta
medio 1920x1080
9  fps    + Confronta
alto 1920x1080
8  fps    + Confronta
» Il Benchmark indica che il gioco non è utilizzabile con i settaggi testati.
XCOM 2

XCOM 2

2016
basso 1280x720
18.4  fps    + Confronta
medio 1920x1080
6.9  fps    + Confronta
alto 1920x1080
4.9  fps    + Confronta
» Il Benchmark indica che il gioco non è utilizzabile con i settaggi testati.
basso 1024x768
18 20.6 21.6 22.5 ~ 21 fps    + Confronta
medio 1366x768
11 12.4 13.2 14.2 ~ 13 fps    + Confronta
alto 1920x1080
6.2 7 7.1 ~ 7 fps    + Confronta
» Il Benchmark indica che il gioco non è utilizzabile con i settaggi testati.
basso 1024x768
47.1  fps    + Confronta
medio 1366x768
20.8  fps    + Confronta
alto 1920x1080
14.7  fps    + Confronta
» Giocabile con tutti i portatili testati con dettagli basso.
basso 1024x768
16  fps    + Confronta
medio 1366x768
13.2  fps    + Confronta
» Il Benchmark indica che il gioco non è utilizzabile con i settaggi testati.
basso 1024x768
22.9  fps    + Confronta
medio 1366x768
21.2  fps    + Confronta
alto 1920x1080
10.5  fps    + Confronta
» Il Benchmark indica che il gioco non è utilizzabile con i settaggi testati.
Anno 2205

Anno 2205

2015
basso 1024x768
26.1  fps    + Confronta
medio 1366x768
14.4  fps    + Confronta
alto 1920x1080
6.7  fps    + Confronta
» Il Benchmark indica che il gioco non è utilizzabile con i settaggi testati.
basso 1366x768
47.1  fps    + Confronta
medio 1366x768
35.4  fps    + Confronta
alto 1920x1080
20.9  fps    + Confronta
» Giocabile con tutti i portatili testati con dettagli medio.
basso 1024x768
45.5  fps    + Confronta
medio 1366x768
36.4  fps    + Confronta
alto 1920x1080
14.3  fps    + Confronta
» Giocabile con tutti i portatili testati con dettagli medio.
basso 1280x720
47.9  fps    + Confronta
alto 1920x1080
16  fps    + Confronta
ultra 1920x1080
13.9  fps    + Confronta
» Giocabile con tutti i portatili testati con dettagli basso.
basso 1280x720
9 12 ~ 11 fps    + Confronta
medio 1366x768
3 11 ~ 7 fps    + Confronta
» Il Benchmark indica che il gioco non è utilizzabile con i settaggi testati.
basso 1024x768
11.9 14 ~ 13 fps    + Confronta
medio 1366x768
7.6 9.2 ~ 8 fps    + Confronta
» Il Benchmark indica che il gioco non è utilizzabile con i settaggi testati.
basso 1024x768
79  fps    + Confronta
medio 1366x768
27.3  fps    + Confronta
alto 1920x1080
15.2  fps    + Confronta
» Giocabile con tutti i portatili testati con dettagli basso.
GTA V

GTA V

2015
basso 1024x768
41.5  fps    + Confronta
medio 1366x768
38.1  fps    + Confronta
alto 1920x1080
10  fps    + Confronta
» Giocabile con tutti i portatili testati con dettagli medio.
basso 1024x768
37.7  fps    + Confronta
medio 1366x768
32.1  fps    + Confronta
alto 1920x1080
12.9  fps    + Confronta
» Giocabile con tutti i portatili testati con dettagli basso.
basso 1024x768
29.9  fps    + Confronta
medio 1366x768
27.3  fps    + Confronta
alto 1920x1080
16.7  fps    + Confronta
» Il Benchmark indica che il gioco non è utilizzabile con i settaggi testati.
basso 1024x768
16  fps    + Confronta
» Il Benchmark indica che il gioco non è utilizzabile con i settaggi testati.
F1 2014

F1 2014

2014
basso 1024x768
62  fps    + Confronta
medio 1366x768
41  fps    + Confronta
alto 1920x1080
31  fps    + Confronta
» Giocabile con tutti i portatili testati con dettagli medio.
basso 1024x768
32  fps    + Confronta
medio 1366x768
20  fps    + Confronta
» Il Benchmark indica che il gioco non è utilizzabile con i settaggi testati.
basso 1280x720
21.7  fps    + Confronta
medio 1344x756
14.7  fps    + Confronta
» Il Benchmark indica che il gioco non è utilizzabile con i settaggi testati.
Sims 4

Sims 4

2014
basso 1024x768
122.3  fps    + Confronta
medio 1366x768
44.8  fps    + Confronta
alto 1920x1080
23.2  fps    + Confronta
» Giocabile con tutti i portatili testati con dettagli medio.
basso 1024x768
91.3  fps    + Confronta
medio 1366x768
40.6  fps    + Confronta
alto 1920x1080
21.6  fps    + Confronta
» Giocabile con tutti i portatili testati con dettagli medio.
Thief

Thief

2014
basso 1024x768
13 15.3 ~ 14 fps    + Confronta
medio 1366x768
10 12.6 ~ 11 fps    + Confronta
alto 1366x768
8 12.3 ~ 10 fps    + Confronta
» Il Benchmark indica che il gioco non è utilizzabile con i settaggi testati.
basso 1024x768
28.7 29 32.5 44.1 ~ 34 fps    + Confronta
medio 1366x768
20.1 20.7 22.8 29.6 ~ 23 fps    + Confronta
alto 1366x768
12.6 13.7 15.2 20.4 ~ 15 fps    + Confronta
ultra 1920x1080
5.1 5.6 7.7 ~ 6 fps    + Confronta
» Il Benchmark indica che il gioco non è utilizzabile con i settaggi testati.
basso 1024x768
48  fps    + Confronta
medio 1366x768
29  fps    + Confronta
alto 1366x768
15  fps    + Confronta
» Giocabile con tutti i portatili testati con dettagli basso.
basso 1024x768
11  fps    + Confronta
medio 1366x768
11  fps    + Confronta
alto 1366x768
6  fps    + Confronta
» Il Benchmark indica che il gioco non è utilizzabile con i settaggi testati.
basso 1024x768
16  fps    + Confronta
medio 1366x768
12  fps    + Confronta
» Il Benchmark indica che il gioco non è utilizzabile con i settaggi testati.
basso 1280x720
43 45.4 46.2 46.8 60.9 62 ~ 51 fps    + Confronta
medio 1366x768
26 26.9 27.9 27.9 35.8 37.8 ~ 30 fps    + Confronta
alto 1366x768
22.5 22.7 23 30.3 32.6 ~ 26 fps    + Confronta
ultra 1920x1080
7.8 7.8 10.7 10.9 ~ 9 fps    + Confronta
» Giocabile con tutti i portatili testati con dettagli basso.
basso 1024x768
54.9 74.1 ~ 65 fps    + Confronta
medio 1366x768
29.8 36.9 ~ 33 fps    + Confronta
alto 1366x768
20.9 28.1 ~ 25 fps    + Confronta
ultra 1920x1080
10.7 12.7 ~ 12 fps    + Confronta
» Giocabile con tutti i portatili testati con dettagli basso.
basso 1024x768
70  fps    + Confronta
medio 1366x768
54.6  fps    + Confronta
alto 1366x768
45.5  fps    + Confronta
ultra 1920x1080
41.3  fps    + Confronta
» Giocabile con tutti i portatili testati con dettagli ultra.
basso 1280x720
28  fps    + Confronta
medio 1366x768
19  fps    + Confronta
alto 1366x768
13  fps    + Confronta
» Il Benchmark indica che il gioco non è utilizzabile con i settaggi testati.
basso 1024x768
36  fps    + Confronta
medio 1366x768
29  fps    + Confronta
alto 1366x768
15  fps    + Confronta
» Giocabile con tutti i portatili testati con dettagli basso.
bassomedioaltoultraQHD4K
Ark Survival Evolved13.1
Playerunknown's Battlegrounds (PUBG)13.8
Team Fortress 246.234
Dirt 440.9
Rocket League5733.218.1
Ghost Recon Wildlands11.95.3
For Honor20.67.1
Resident Evil 73412.2
Dishonored 2118.8
Titanfall 23430.310.5
Farming Simulator 1763.247.522
Battlefield 123.316.78.3
Civilization VI30.514.67.6
Deus Ex Mankind Divided1396.4
Mirror's Edge Catalyst16.911.7
Ashes of the Singularity8
The Division17.410.6
Far Cry Primal1598
XCOM 218.46.94.9
Rise of the Tomb Raider21137
Rainbow Six Siege47.120.814.7
Just Cause 31613.2
Star Wars Battlefront22.921.210.5
Anno 220526.114.46.7
World of Warships47.135.420.9
Metal Gear Solid V45.536.414.3
Dota 2 Reborn47.91613.9
Batman: Arkham Knight117
The Witcher 3138
Dirt Rally7927.315.2
GTA V41.538.110
Battlefield Hardline37.732.112.9
Dragon Age: Inquisition29.927.316.7
Call of Duty: Advanced Warfare16
F1 2014624131
Alien: Isolation3220
Middle-earth: Shadow of Mordor21.714.7
Sims 4122.344.823.2
GRID: Autosport91.340.621.6
Thief141110
Battlefield 43423156
Batman: Arkham Origins482915
Company of Heroes 211116
Metro: Last Light1612
BioShock Infinite5130269
Tomb Raider65332512
Diablo III7054.645.541.3
The Elder Scrolls V: Skyrim281913
Batman: Arkham City362915
< 30 fps
< 60 fps
< 120 fps
≥ 120 fps
25
17
6
1
29
13

29
3

4
1


Per conoscere altri giochi che potrebbero essere utilizzabili e per una lista completa di tutti i giochi e delle schede grafiche visitate la nostra Gaming List

v1.26
log 24. 17:02:17

#0 no ids found in url (should be separated by "_") +0s ... 0s

#1 not redirecting to Ajax server +0s ... 0s

#2 did not recreate cache, as it is less than 5 days old! Created at Mon, 22 Apr 2024 05:40:21 +0200 +0.001s ... 0.001s

#3 no comparison url found in template nbc.compare_page_1 needed +0.048s ... 0.049s

#4 no comparison url found in template nbc.compare_page_1 needed +0s ... 0.049s

#5 no comparison url found in template nbc.compare_page_1 needed +0s ... 0.049s

#6 no comparison url found in template nbc.compare_page_1 needed +0s ... 0.049s

#7 composed specs +0s ... 0.049s

#8 did output specs +0s ... 0.049s

#9 start showIntegratedCPUs +0s ... 0.049s

#10 getting avg benchmarks for device 7442 +0.031s ... 0.081s

#11 got single benchmarks 7442 +0.024s ... 0.105s

#12 got avg benchmarks for devices +0s ... 0.105s

#13 min, max, avg, median took s +0.591s ... 0.695s

#14 before gaming benchmark output +0s ... 0.695s

#15 Got 178 rows for game benchmarks. +0.012s ... 0.707s

#16 composed SQL query for gamebenchmarks +0s ... 0.708s

#17 got data and put it in $dataArray +0.033s ... 0.741s

#18 benchmarks composed for output. +1.167s ... 1.908s

#19 no comparison url found in template nbc.compare_page_1 needed +0.004s ... 1.912s

#20 return log +0s ... 1.912s

Recensioni Notebook con AMD Radeon R7 (Bristol Ridge) la scheda grafica

Recensione breve del Portatile Lenovo ThinkPad A275 (A12-9800B, 256GB)

Recensione breve del Portatile Lenovo ThinkPad A275 (A12-9800B, 256GB)

Futuro incerto. Lenovo ha creato una versione AMD dell'X270. Eccelle in termini di dispositivi di input, sicurezza e portabilità. Tuttavia, la stabilità e qual...
AMD PRO A12-9800B | AMD Radeon R7 (Bristol Ridge) | 12.50" | 1.6 kg
Recensione breve del Portatile HP 15-bw075ax (A12-9720P, Radeon R7)
Recensione breve del Portatile HP 15-bw075ax (A12-9720P, Radeon R7)

Acque agitate. L'HP 15-bw07ax usa la più nuova APU high-end AMD, l'A12-9720P. Tuttavia, l'APU potrebbe essere un po' troppo nuova - e il sistema resta instabile...
AMD A12-9720P | AMD Radeon R7 (Bristol Ridge) | 15.60" | 1.9 kg
Recensione breve del Portatile HP EliteBook 755 G4 (AMD PRO A12-9800B)
Recensione breve del Portatile HP EliteBook 755 G4 (AMD PRO A12-9800B)

Performance adeguate? La serie EliteBook HP ha dispositivi business per clienti esigenti. Nella recensione dell'EliteBook 755 G4, vedrete come si comporta e se...
AMD PRO A12-9800B | AMD Radeon R7 (Bristol Ridge) | 15.60" | 1.8 kg
Recensione breve del Portatile HP EliteBook 725 G4 (A12-9800B, Full-HD)
Recensione breve del Portatile HP EliteBook 725 G4 (A12-9800B, Full-HD)

Bristol Ridge business. Il 12,5 pollici Elitebook HP è alimentato da un processore AMD APU. Così, HP appartiene a uno dei pochi produttori che utilizzano ancora...
AMD PRO A12-9800B | AMD Radeon R7 (Bristol Ridge) | 12.50" | 1.3 kg
Recensione breve del notebook HP 15-ba077ng

Recensione breve del notebook HP 15-ba077ng

Ufficio low-cost. Con il suo 15-ba077ng, HP offre un laptop di tipo home-office. La sua scarsa rumorosità, le basse temperature e il veloce disco SSD sono il su...
AMD A12-9700P | AMD Radeon R7 (Bristol Ridge) | 15.60" | 2 kg

Asus VivoBook S15 S510QR-BR011T: AMD FX-9800P, 15.60", 1.7 kg
  Recensioni esterne » Asus VivoBook S15 S510QR-BR011T

Lenovo ThinkPad A275: AMD PRO A12-9800B, 12.50", 1.6 kg
  Recensioni esterne » Lenovo ThinkPad A275

Lenovo Ideapad 320-15ABR-80XS007XGE: AMD A12-9720P, 15.60", 2.2 kg
  Recensioni esterne » Lenovo Ideapad 320-15ABR-80XS007XGE

HP Pavilion 15-cd0000nu: AMD A12-9720P, 15.60", 2 kg
  Recensioni esterne » HP Pavilion 15-cd0000nu

HP Envy 15-bq015nd x360: AMD A12-9720P, 15.60", 2.2 kg
  Recensioni esterne » HP Envy 15-bq015nd x360

HP EliteBook 755 G4 Z2W11EA: AMD PRO A12-9800B, 15.60", 1.8 kg
  Recensioni esterne » HP EliteBook 755 G4 Z2W11EA

HP EliteBook 745 G4 Z2W06EA: AMD PRO A12-9800B, 14.00", 1.5 kg
  Recensioni esterne » HP EliteBook 745 G4 Z2W06EA

Lenovo Ideapad 310-15ABR 80ST: AMD A12-9700P, 15.60", 2.2 kg
  Recensioni esterne » Lenovo Ideapad 310-15ABR 80ST

Asus X555QG: AMD FX-9800P, 15.60", 2.2 kg
  Recensioni esterne » Asus X555QG

Please share our article, every link counts!

Classe 1

GeForce RTX 2080 Super Mobile

Classe 2

M1 Max 32-Core GPU *
GeForce RTX 2070 Super Mobile
M1 Max 24-Core GPU *
Radeon RX 5700M *
M1 Pro 16-Core GPU *
Radeon PRO W6600M *
GeForce RTX 2070 Super Max-Q
M1 Pro 14-Core GPU *
Quadro P4200
Quadro P5000 Max-Q *
GeForce RTX 3050 4GB Laptop GPU
Quadro P4000 Max-Q
Radeon RX 580X (Laptop) *
Radeon RX 580 (Laptop)
Radeon Pro 5300M
Radeon RX 5300M
Quadro P3000 Max-Q *
Radeon Pro WX 7100 *
Radeon RX 570X (Laptop) *
Radeon RX 570 (Laptop) *
Radeon RX 470 (Laptop) *

Classe 3

GeForce GTX 1050 Ti Mobile
Radeon 680M
Quadro P2000 Max-Q
Radeon R9 M395X
GeForce GTX 1050 Ti Max-Q *
WX Vega M GL
Radeon R9 M485X
GeForce GTX 1050 Max-Q *
Radeon 660M
Radeon RX 560X (Laptop)
Radeon RX 560 (Laptop)
Radeon Pro 560X
Radeon Pro 560
Radeon Pro 460
Radeon Pro WX 4130 *
Quadro P620 *
Radeon RX 550X (Laptop)
Radeon Pro 555X
Radeon Pro 555
Radeon Pro 455
Quadro P600
Radeon RX 540X *
Radeon Pro WX 2100 *
Radeon Pro WX 3100 *
Radeon Pro 450
Radeon 630
Radeon 540X *
Quadro P520
Quadro P500 *
Iris Plus Graphics G7 (Ice Lake 64 EU) *
Vega 10 *
Iris Pro Graphics 580
Vega 9
FirePro W5130M
UHD Graphics Xe G4 48EUs *
UHD Graphics 32EUs
UHD Graphics Xe 32EUs (Tiger Lake-H) *
UHD Graphics 750
Vega 7
Radeon R7 M465
Vega 8
Iris Plus Graphics G4 (Ice Lake 48 EU)
Quadro M600M
FirePro W4190M
Radeon R7 M445
UHD Graphics 24EUs (Alder Lake-N) *
Radeon R7 M340
Radeon 610M *
UHD Graphics G1 (Ice Lake 32 EU)
UHD Graphics Xe 16EUs (Tiger Lake-H) *
Radeon R5 (Bristol Ridge)
Adreno 690 *
Adreno 685 *
Adreno 680 *

Classe 4

UHD Graphics 730
Radeon R5 M315 *
Radeon R5 M420 *
UHD Graphics 617
UHD Graphics 615
Radeon R4 (Stoney Ridge)
Radeon R2 (Stoney Ridge)
HD Graphics (Broadwell)

Classe 5

Posizione approssimativa dell'adattatore grafico

> Recensioni e prove di notebook, tablets e smartphones > Info Techniche / Tips > Confronto delle schede video > AMD Radeon R7 (Bristol Ridge)
Klaus Hinum (Update: 2017-03-30)