Intel Iris Graphics 5100

L'Intel Iris Graphics 5100 (GT3), chiamata anche HD Graphics 5100, è una scheda grafica integrata inclusa in alcuni processori Haswell del 2013. Rappresenta la configurazione più potente dell'unità grafica integrata (40 execution units), ma non ha l'eDRAM aggiuntiva cache della Iris Pro Graphics 5200. Il clock base può effettuare l'overclock automatico utilizzando la tecnologia Turbo Boost. In base al modello di processore, il clock base e turbo clock possono differire, e conseguentemente le prestazioni grafiche possono variare tra diversi modelli di CPU.
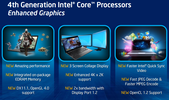
In confronto alla HD 4000, il core grafico è stato modificato notevolmente. La GPU supporta DirectX 11.1, OpenCL 1.2 ed OpenGL 4.0. Sfrutta anche un decoder migliorato per video 4K ed il potente encoder Quick Sync.
Le prestazioni della Iris Graphics 5100 sono di circa il 20 percento superiori alla HD Graphics 5000, che possiamo trovare nelle CPUs ULV della classe da 15W. Nello scenario migliore, l'IGP corrisponde ad una GeForce GT 640M LE dedicata. In altri casi, tuttavia, le prestazioni sono appena al livello della GeForce GT 620M a causa della banda di memoria limitata. I giochi attuali (del 2013) risultano fluidi con dettagli medi o bassi e con una risoluzione da 1.024 x 768 o 1.366 x 768 pixels.
Grazie al processo di produzione in 22nm 3D Tri-Gate, il consumo energetico dovrebbe essere relativamente contenuto. L'Iris Graphics 5100 la troviamo nei modelli ULV dual-core Haswell nella fascia da 28 Watt di TDP.
Iris Serie
| |||||||||||||
| Nome in codice | Haswell GT3 | ||||||||||||
| Architettura | Gen. 7.5 Haswell | ||||||||||||
| iGPU | Integrated Graphics | ||||||||||||
| Pipelines | 40 - unified | ||||||||||||
| Velocità del core | 200 - 1200 (Boost) MHz | ||||||||||||
| Larghezza del bus di memoria | 64/128 Bit | ||||||||||||
| Memoria condivisa | si | ||||||||||||
| API | DirectX 11.1, Shader 5.0, OpenGL 4.0 | ||||||||||||
| tecnologia | 22 nm | ||||||||||||
| Caratteristiche | QuickSync | ||||||||||||
| Data dell'annuncio | 05.06.2013 | ||||||||||||
| ||||||||||||||||||||||||
Benchmark
3DM Vant. Perf. total +
Cinebench R15 OpenGL 64 Bit +
GFXBench T-Rex HD Offscreen C24Z16 +
* Numeri più piccoli rappresentano prestazioni supeiori
Benchmarks per i giochi
I seguenti benchmarks deirivano dai benchmarks dei portatili recensiti. Le prestazioni dipendono dalla scheda grafica utilizzata, dal clock rate, dal processore, dai settaggi di sistema, dai drivers, e dai sistemi operativi. Quindi i risultati non sono rappresentativi per i portatili con questa GPU. Per informazioni dettagliate sui risultati del benchmark, cliccate sul numero di fps.

Horizon Zero Dawn
2020
Gears Tactics
2020
Fall Guys
2020
X-Plane 11.11
2018
Metal Gear Solid V
2015
Mad Max
2015
Dota 2 Reborn
2015
The Witcher 3
2015
Dirt Rally
2015
GTA V
2015
Battlefield Hardline
2015
Evolve
2015
F1 2014
2014
The Evil Within
2014
Ryse: Son of Rome
2014
Alien: Isolation
2014
Fifa 15
2014
Risen 3: Titan Lords
2014
GRID: Autosport
2014
Thief
2014
X-Plane 10.25
2013
Call of Duty: Ghosts
2013
Battlefield 4
2013
F1 2013
2013
Fifa 14
2013
Total War: Rome II
2013
Saints Row IV
2013
Company of Heroes 2
2013
Metro: Last Light
2013
BioShock Infinite
2013
SimCity
2013
Tomb Raider
2013
Crysis 3
2013
Dead Space 3
2013
Far Cry 3
2012
Assassin´s Creed III
2012
Hitman: Absolution
2012
Dishonored
2012
Fifa 13
2012
F1 2012
2012
Borderlands 2
2012
Counter-Strike: GO
2012
Sleeping Dogs
2012
Diablo III
2012
Anno 2070
2011
Dirt 3
2011Per conoscere altri giochi che potrebbero essere utilizzabili e per una lista completa di tutti i giochi e delle schede grafiche visitate la nostra Gaming List
Recensioni Notebook con Intel Iris Graphics 5100 la scheda grafica

Recensione del Notebook Apple MacBook Pro Retina 13 Late 2013
Recensione Completa dell'Ultrabook Asus Zenbook Infinity UX301LA
Acer Aspire V3-371-380A: Intel Core i3-4158U, 13.30", 1.5 kg
Recensioni esterne » Acer Aspire V3-371-380A
Acer Aspire V3-371-38ZG: Intel Core i3-4158U, 13.30", 1.5 kg
Recensioni esterne » Acer Aspire V3-371-38ZG
Acer Aspire V3-371-34N3: Intel Core i3-4158U, 13.30", 1.5 kg
Recensioni esterne » Acer Aspire V3-371-34N3
Apple MacBook Pro Retina 13 inch 2014-07: Intel Core i5-4278U, 13.30", 1.5 kg
Recensioni esterne » Apple MacBook Pro Retina 13 inch 2014-07
Asus ASUSPRO Advanced Bu401La: Intel Core i7-4558U, 14.00", 1.6 kg
Recensioni esterne » Asus ASUSPRO Advanced Bu401La
Asus ASUSPRO Advanced B551LA-CR026G: Intel Core i7-4558U, 15.60", 2.5 kg
Recensioni esterne » Asus ASUSPRO Advanced B551LA-CR026G
Asus UX301LA-DE002P: Intel Core i7-4558U, 13.30", 1.4 kg
Recensioni esterne » Asus UX301LA-DE002P
Asus UX301LA-DE002H: Intel Core i7-4558U, 13.30", 1.2 kg
Recensioni esterne » Asus UX301LA-DE002H
Apple MacBook Pro Retina 13 inch 2013-10: Intel Core i5-4258U, 13.30", 1.6 kg
Recensioni esterne » Apple MacBook Pro Retina 13 inch 2013-10
Asus UX301LA-DE022H: Intel Core i7-4558U, 13.30", 1.4 kg
Recensioni esterne » Asus UX301LA-DE022H
Asus UX301: Intel Core i5-4200U, 13.30", 1.4 kg
Recensioni esterne » Asus UX301
Asus Zenbook UX301: unknown, 13.30", 1.4 kg
Recensioni esterne » Asus Zenbook Infinity


