AMD Radeon R7 M360

L'AMD Radeon R7 M360 è una scheda grafica dedicata di fascia medio bassa per portatili, annunciata a metà 2015. Si basa su una nuova derivazione del chip Tonga e di conseguenza supporta DirectX 12, Vulkan e FreeSync. Il core ha un clock relativamente alto da 1015 MHz, tuttavia, il collo di bottiglia potrebbe essere l'utilizzo della lenta memoria grafica 64-bit DDR3.
Performance
Le prestazioni della R7-M360 dovrebbero attestarsi tra una Radeon R5 M255 (solo 320 shaders) ed una Radeon R7 M260 (più veloce interfaccia di memoria 128-bit DDR3, ma core clock inferiore). Pertanto, i giochi molto pesanti come Dragon Age: Inquisition o Evolve sono utilizzabili solo con settaggi grafici minimi.
I 384 shaders possono essere usati con OpenCL 1.2 per calcoli generici (come 10 compute units).
Features
Le features della R7-M360 includono il decoding video per MPEG-4 AVC/H.264, VC-1, MPEG-2, e Flash direttamente dalla GPU AMD. Ora sono compatibili anche i videos HD Multi-View Codec (MVC) e MPEG-4 part 2 (DivX, xVid).
La Serie R7 supporta anche lo switching grafico automatico tra la GPU integrata e la GPU dedicata. L'Enduro, è la tecnologia che sostituisce l'AMD Dynamic Switchable Graphics ed è simile alla Nvidia Optimus. Inoltre, la M375 può supportare direttamente più monitors usando la tecnologia Eyefinity se l'Enduro è disabilitata.
Altre features includono lo ZeroCore per la riduzione dei consumi quando il display è spento ed il Power Gating per ridurre la potenza della aree del chip non utilizzate.
Il processore audio HD integrato è in grado di trasmettere Audio HD (TrueHD o DTS Master Audio) tramite HDMI e DisplayPort (i.e., per videos Blu-Ray). In aggiunta, consente l'output audio simultaneamente ed in parallelo verso più dispositivi con la nuova feature Discrete Digital Multipoint Audio (DDMA).
Radeon R7 M300 Serie
| |||||||||||||
| Architettura | GCN 2.0 | ||||||||||||
| Pipelines | 384 - unified | ||||||||||||
| Velocità del core | 1125 MHz | ||||||||||||
| Velocità della memoria | 2000 MHz | ||||||||||||
| Larghezza del bus di memoria | 64 Bit | ||||||||||||
| Tipo di memoria | DDR3 | ||||||||||||
| Max. quantità di memoria | 4 GB | ||||||||||||
| Memoria condivisa | no | ||||||||||||
| API | DirectX 12, OpenGL 4.3 | ||||||||||||
| tecnologia | 28 nm | ||||||||||||
| Caratteristiche | DirectX 12, Mantle, OpenGL 4.3, OpenCL 1.2, Vulkan | ||||||||||||
| Data dell'annuncio | 06.05.2015 | ||||||||||||
| Link alla pagina del produttore | www.amd.com | ||||||||||||
Benchmark
3DM Vant. Perf. total +
Cinebench R15 OpenGL 64 Bit +
GFXBench T-Rex HD Offscreen C24Z16 +
* Numeri più piccoli rappresentano prestazioni supeiori
Benchmarks per i giochi
I seguenti benchmarks deirivano dai benchmarks dei portatili recensiti. Le prestazioni dipendono dalla scheda grafica utilizzata, dal clock rate, dal processore, dai settaggi di sistema, dai drivers, e dai sistemi operativi. Quindi i risultati non sono rappresentativi per i portatili con questa GPU. Per informazioni dettagliate sui risultati del benchmark, cliccate sul numero di fps.

Dishonored 2
2016
Titanfall 2
2016
Farming Simulator 17
2016
Mafia 3
2016
FIFA 17
2016
No Man's Sky
2016
Doom
2016
Need for Speed 2016
2016
Hitman 2016
2016
The Division
2016
Far Cry Primal
2016
XCOM 2
2016
Rainbow Six Siege
2015
Just Cause 3
2015
Fallout 4
2015
Anno 2205
2015
FIFA 16
2015
World of Warships
2015
Metal Gear Solid V
2015
Mad Max
2015
The Witcher 3
2015
Dirt Rally
2015
GTA V
2015
Battlefield Hardline
2015
Evolve
2015
The Crew
2014
Far Cry 4
2014
F1 2014
2014
The Evil Within
2014
Ryse: Son of Rome
2014
Alien: Isolation
2014
Fifa 15
2014
Sims 4
2014
Risen 3: Titan Lords
2014
GRID: Autosport
2014
Watch Dogs
2014
Thief
2014
Battlefield 4
2013
Metro: Last Light
2013
BioShock Infinite
2013
Tomb Raider
2013
Crysis 3
2013
Counter-Strike: GO
2012
Diablo III
2012
Anno 2070
2011Per conoscere altri giochi che potrebbero essere utilizzabili e per una lista completa di tutti i giochi e delle schede grafiche visitate la nostra Gaming List
Recensioni Notebook con AMD Radeon R7 M360 la scheda grafica


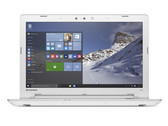
Recensione Breve del Portatile Lenovo IdeaPad 500-15ISK

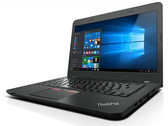
Recensione Breve del portatile Lenovo ThinkPad E460 (Core i5, Radeon R7 M360)

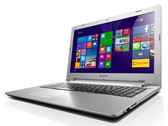
Recensione Breve del Portatile Lenovo Z51-70
Dell Latitude 15 E5570-X2DCY: Intel Core i7-6600U, 15.60", 2.1 kg
Recensioni esterne » Dell Latitude 15 E5570-X2DCY
Lenovo IdeaPad 500-15ISK-80NT00LMMH: Intel Core i5-6200U, 15.60", 2.3 kg
Recensioni esterne » Lenovo IdeaPad 500-15ISK-80NT00LMMH
HP Pavilion 15-ab111ng: AMD A10-8700P, 15.60", 2.2 kg
Recensioni esterne » HP Pavilion 15-ab111ng
Lenovo Ideapad 500-15ISK-80NT00UDGE: Intel Core i5-6200U, 15.60", 2.3 kg
Recensioni esterne » Lenovo Ideapad 500-15ISK-80NT00UDGE
Lenovo ThinkPad E460-20EUS00000: Intel Core i5-6200U, 14.00", 1.8 kg
Recensioni esterne » Lenovo ThinkPad E460-20EUS00000
HP Pavilion 15-ab218nh: Intel Core i3-6100U, 15.60", 2.3 kg
Recensioni esterne » HP Pavilion 15-ab218nh
Lenovo Ideapad 500-15ISK-80NT00D8GE: Intel Core i7-6500U, 15.60", 2.3 kg
Recensioni esterne » Lenovo Ideapad 500-15ISK-80NT00D8GE


