AMD Radeon R5 (Stoney Ridge)

L'AMD Radeon R5 (Stoney Ridge) è un adattatore grafico per le APUs dual-core mobile Stoney Ridge meno potenti. Al suo lancio, è stato usato nell'AMD A9-9410 ed ha 3 Compute Cores attivi (384 shaders). In base al modello, il clock massimo è di 800 MHz. Le prestazioni possono variare molto in base alla configurazione del TDP e della memoria di sistema. Rispetto alla Radeon R5 delle serie Bristol Ridge, ha solo 3 invece di 6 GCN cores (ed è la configurazione completa del chip Stoney Ridge).
Architettura e Features
La Radeon R5 monta tre cores della terza generazione GCN (spesso chiamata GCN 1.2 o 2.0 dalla stampa). Questo significa che è molto simile al chip desktop Tonga e supporta DirectX 12 (FL 12_0), ma i cores possono essere usati anche da Mantle, OpenGL, ed OpenCL. La GPU supporta anche lo standard HSA 1.0 e quindi usa la connessione con i cores CPU in modo molto efficiente. Le specifiche tecniche sono identiche al predecessore Carrizo.
L'unità video include l'UVD 6 (Unified Video Decoder), che può decodificare anche l'HEVC/H.265 e 4K con supporto dell'hardware. Maggiori dettagli sono disponibili nel nostro articolo dedicato alla Stoney Ridge.
Consumo Energetico
In base al modello e alla configurazione del TDP (cTDP), il chip da 28 nm si attesta tra 10 e 25 Watts. Questo significa che può essere usato anche su portatili sottili e leggeri.
Radeon R (Stoney / Bristol Ridge) Serie
| ||||||||||||||||
| Nome in codice | Stoney Ridge | |||||||||||||||
| Architettura | GCN 1.2/2.0 | |||||||||||||||
| iGPU | integrated graphics | |||||||||||||||
| Pipelines | 192 - unified | |||||||||||||||
| Velocità del core | 800 (Boost) MHz | |||||||||||||||
| Larghezza del bus di memoria | 64 Bit | |||||||||||||||
| Memoria condivisa | si | |||||||||||||||
| API | DirectX 12 (FL 12_0), OpenGL 4.4 | |||||||||||||||
| Consumo di corrente | 12-45 Watt | |||||||||||||||
| tecnologia | 28 nm | |||||||||||||||
| Caratteristiche | UVD 6, VCE | |||||||||||||||
| Dimensione del portatile | misura media | |||||||||||||||
| Data dell'annuncio | 01.06.2016 | |||||||||||||||
| ||||||||||||||||||||||||
Benchmark
3DM Vant. Perf. total +
Cinebench R15 OpenGL 64 Bit +
GFXBench T-Rex HD Offscreen C24Z16 +
* Numeri più piccoli rappresentano prestazioni supeiori
Benchmarks per i giochi
I seguenti benchmarks deirivano dai benchmarks dei portatili recensiti. Le prestazioni dipendono dalla scheda grafica utilizzata, dal clock rate, dal processore, dai settaggi di sistema, dai drivers, e dai sistemi operativi. Quindi i risultati non sono rappresentativi per i portatili con questa GPU. Per informazioni dettagliate sui risultati del benchmark, cliccate sul numero di fps.

Dirt Rally 2.0
2019
Far Cry New Dawn
2019
Metro Exodus
2019
Apex Legends
2019
Just Cause 4
2018
Darksiders III
2018
Farming Simulator 19
2018
Hitman 2
2018
Forza Horizon 4
2018
F1 2018
2018
Monster Hunter World
2018
Far Cry 5
2018
X-Plane 11.11
2018
Fortnite
2018
Destiny 2
2017
ELEX
2017
The Evil Within 2
2017
FIFA 18
2017
Ark Survival Evolved
2017
F1 2017
2017
Team Fortress 2
2017
Dirt 4
2017
Rocket League
2017
Prey
2017
For Honor
2017
Resident Evil 7
2017
Farming Simulator 17
2016
Civilization 6
2016
Overwatch
2016
Hitman 2016
2016
The Division
2016
Rainbow Six Siege
2015
World of Warships
2015
Metal Gear Solid V
2015
Dota 2 Reborn
2015
The Witcher 3
2015
Dirt Rally
2015
F1 2014
2014
Alien: Isolation
2014
Sims 4
2014
Risen 3: Titan Lords
2014
GRID: Autosport
2014
X-Plane 10.25
2013
Company of Heroes 2
2013
Metro: Last Light
2013
BioShock Infinite
2013
Tomb Raider
2013
Dead Space 3
2013
Counter-Strike: GO
2012
Diablo III
2012
Batman: Arkham City
2011
Mafia 2
2010
StarCraft 2
2010Per conoscere altri giochi che potrebbero essere utilizzabili e per una lista completa di tutti i giochi e delle schede grafiche visitate la nostra Gaming List
Recensioni Notebook con AMD Radeon R5 (Stoney Ridge) la scheda grafica


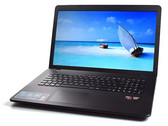
Recensione breve del Portatile Asus VivoBook X751BP (AMD A9-9420, HD+)

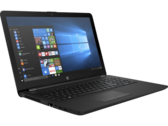
Recensione Breve del Portatile HP 15 BW077AX (A9-9420, Radeon R5)

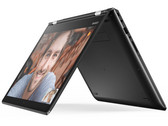
Recensione breve del Convertibile Lenovo Yoga 510-14AST (A9-9410, HD)
Lenovo Chromebook 3 11, A6-9220C: AMD A6-9220C, 11.60", 1.1 kg
Recensioni esterne » Lenovo Chromebook 3 11, A6-9220C
HP 14-BW017AU : AMD A9-9420, 14.00", 1.9 kg
Recensioni esterne » HP 14-BW017AU
Asus K543BA-GQ749: AMD A9-9425, 15.60", 2 kg
Recensioni esterne » Asus K543BA-GQ749
HP 14-dk0013ns: AMD A9-9425, 14.00", 1.5 kg
Recensioni esterne » HP 14-dk0013ns
Lenovo Ideapad S145-14AST-81ST002BMH: AMD A9-9425, 14.00", 1.6 kg
Recensioni esterne » Lenovo Ideapad S145-14AST-81ST002BMH
HP 15-DB0109N: AMD A9-9425, 15.60", 1.8 kg
Recensioni esterne » HP 15-DB0109N
Dell Inspiron 11 3195 2-in-1: AMD A9-9420e, 11.60", 1.2 kg
Recensioni esterne » Dell Inspiron 11 3195 2-in-1
HP 14-cm0002ns: AMD A9-9425, 14.00", 1.5 kg
Recensioni esterne » HP 14-cm0002ns
Lenovo 14w (no touch): AMD A6-9220C, 14.00", 1.5 kg
Recensioni esterne » Lenovo 14w (no touch)
Lenovo Ideapad 320-15AST-80XV00V2SP: AMD A9-9420, 15.60", 2.2 kg
Recensioni esterne » Lenovo Ideapad 320-15AST-80XV00V2SP
Lenovo Ideapad 320-15AST-80XV00V4SP: AMD A9-9420, 15.60", 2.2 kg
Recensioni esterne » Lenovo Ideapad 320-15AST-80XV00V4SP
Lenovo Ideapad 320-15AST-80XV0100SP: AMD A9-9420, 15.60", 2.2 kg
Recensioni esterne » Lenovo Ideapad 320-15AST-80XV0100SP
Lenovo Ideapad 320-15AST-80XV00V3SP: AMD A9-9420, 15.60", 2.2 kg
Recensioni esterne » Lenovo Ideapad 320-15AST-80XV00V3SP
Lenovo Yoga 510-14AST: AMD A9-9410, 14.00", 1.8 kg
Recensioni esterne » Lenovo Yoga 510-14AST
HP 15-bw077ax: AMD A9-9420, 15.60", 1.9 kg
Recensioni esterne » HP 15-bw077ax
Dell Inspiron 15 3565-7923: AMD A9-9410, 15.60", 2.3 kg
Recensioni esterne » Dell Inspiron 15 3565-7923
HP 15-ba110ur: AMD A9-9410, 15.60", 2 kg
Recensioni esterne » HP 15-ba110ur
HP Envy x360 15-ar002na: AMD A9-9410, 15.60", 2 kg
Recensioni esterne » HP Envy x360 15-ar002na


