Le prestazioni di ray-tracing sono eccezionali grazie ai 76 core dedicati, mentre i 320 core Tensor possono essere utilizzati per il DLSS 3.
Le prestazioni di gioco senza DLSS sono ideali per il 4k con circa 60fps e il 2k con frame rate più elevati nei giochi impegnativi senza effetti di ray tracing (ad esempio F1 22 o Cyberpunk 2077). Con il ray tracing, si raccomanda l'uso di DLSS. Rispetto alla concorrenza, le prestazioni senza DLSS e ray tracing sono leggermente migliori rispetto al significativamente più economico AMD Radeon RX 7900 XT .
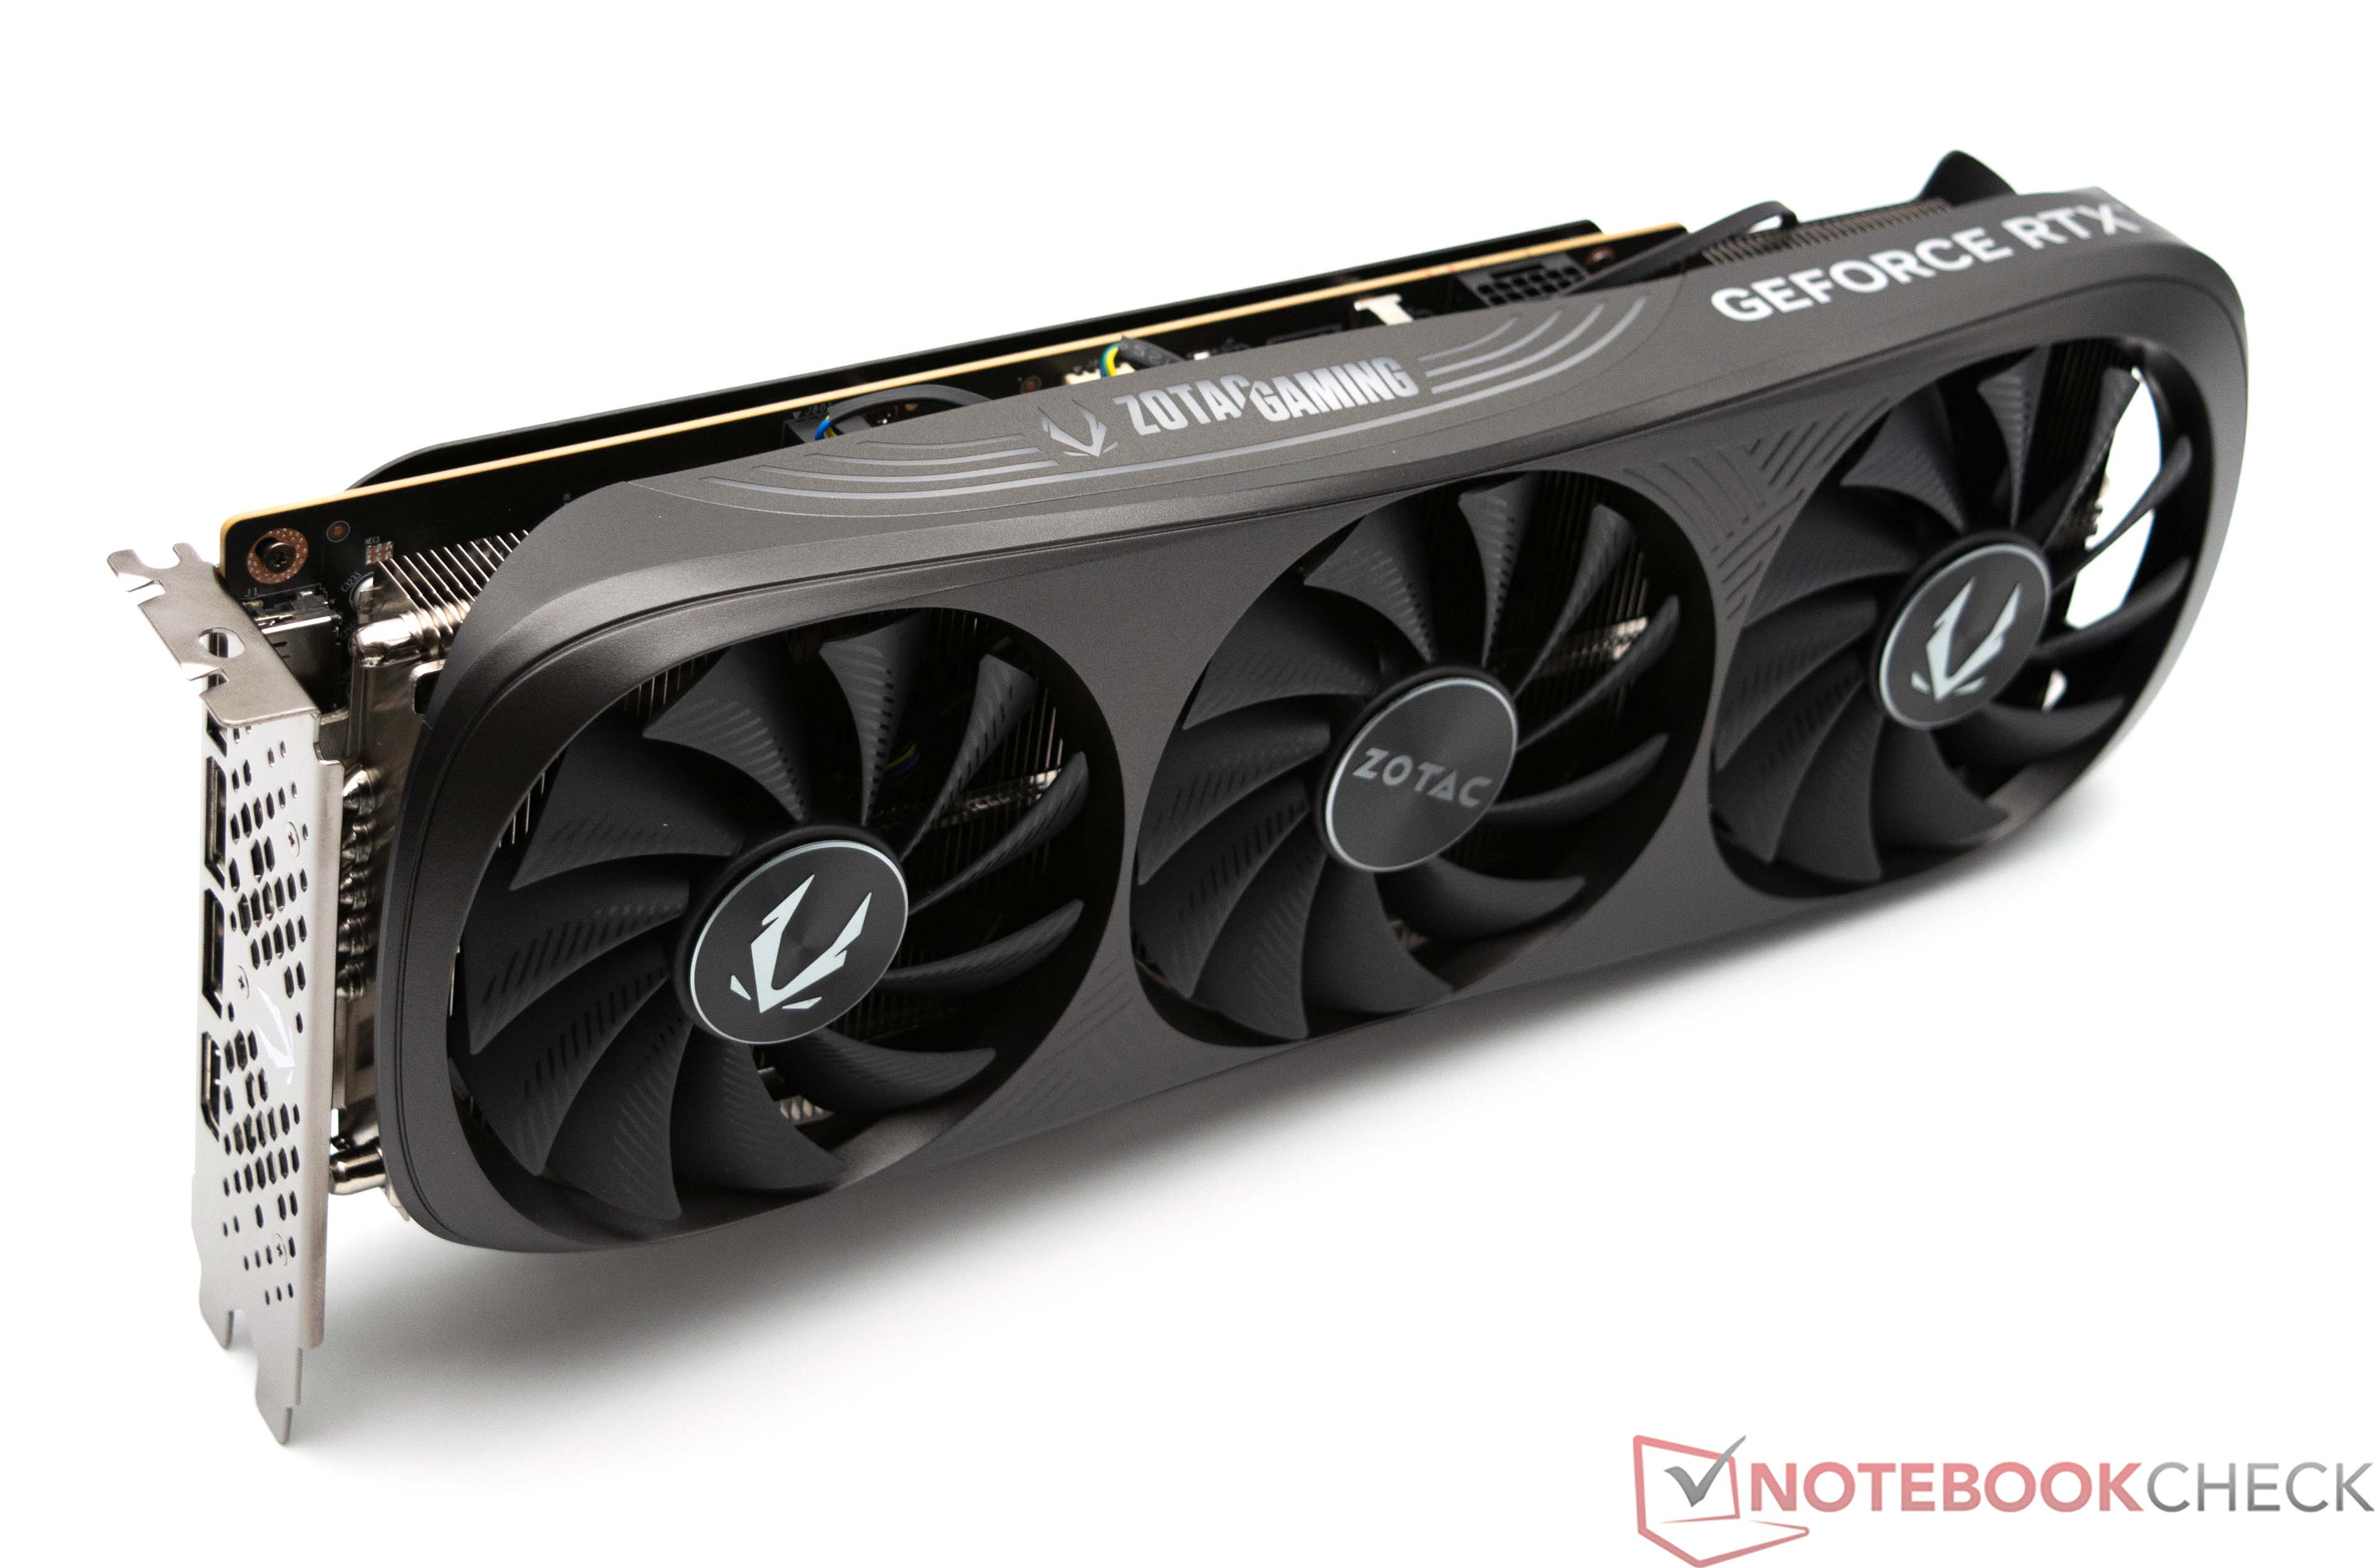
Le schede RTX 4080 attualmente disponibili sono molto grandi (2,5 o 3 slot) e utilizzano il nuovo connettore 12VHPWR (che ha causato alcuni problemi con gli adattatori).
Il chip AD103 è prodotto presso TSMC in 5nm (4N con EUV) ed è specificato con un TGP (Total Graphics Power) di 320 watt (Nvidia raccomanda almeno un alimentatore da 750 watt).
GeForce RTX 4000 Serie Nome in codice AD103-400-A1 Architettura Ada Lovelace Pipelines 10240 - unified TMUs 320 ROPs 112 Raytracing Cores 80 Tensor / AI Cores 320 Velocità del core 2295 - 2550 (Boost) MHz Theoretical Performance 52.22 TFLOPS FP16, 52.22 TFLOPS FP32, 816 TFLOPS FP64 AI GPU 836 TOPS INT8 Cache L2: 64 MB Velocità della memoria 23000 effective = 1438 MHz Larghezza del bus di memoria 256 Bit Tipo di memoria GDDR6X Max. quantità di memoria 16 GB Memoria condivisa no Memory Bandwidth 736.3 GB/s API DirectX 12 Ultimate (12_2), Shader 6.7, OpenGL 4.6, OpenCL 3.0, Vulkan 1.3 Consumo di corrente 320 Watt Transistor Count 45.900 Milioni Die Size 379 mm² tecnologia 5 nm PCIe PCIe 4.0 x16 Displays 4 Displays (max.), HDMI 2.1, DisplayPort 1.4a Data dell'annuncio 31.01.2024
Performance Rating - 3DMark 11 + Fire Strike + Time Spy
AMD Radeon HD 8180
...
NVIDIA GeForce RTX 5070
NVIDIA GeForce RTX 4080 Super
AMD Radeon RX 9070 XT
NVIDIA GeForce RTX 5080
NVIDIA GeForce RTX 5070 Ti
NVIDIA GeForce RTX 5090
3DMark - 3DMark Speed Way Score
min: 7277 media: 7337 media: 7356 (50%) massimo: 7378 Points
GPU TDP ? TDP 320 W 100% 100%
...
NVIDIA GeForce RTX 5070
AMD Radeon RX 9070
NVIDIA RTX PRO 5000 Blackwell Generation Laptop
AMD Radeon RX 9070 XT
NVIDIA GeForce RTX 4080 Super
NVIDIA GeForce RTX 5070 Ti
NVIDIA GeForce RTX 5080
NVIDIA GeForce RTX 5090
3DMark - 3DMark Wild Life Unlimited
...
NVIDIA GeForce RTX 4080 Super
3DMark - 3DMark Wild Life Extreme Unlimited
...
NVIDIA GeForce RTX 4080 Super
3DMark - 3DMark Solar Bay
Apple A13 Bionic GPU
...
NVIDIA GeForce RTX 5070
AMD Radeon RX 9070
AMD Radeon RX 9070 XT
NVIDIA GeForce RTX 5070 Ti
NVIDIA GeForce RTX 4080 Super
NVIDIA GeForce RTX 5080
NVIDIA GeForce RTX 5090
3DMark - 3DMark Fire Strike Standard Score
min: 45427 media: 45776 media: 45767 (69%) massimo: 46135 Points
GPU TDP ? TDP 320 W 99% 100%
...
AMD Radeon RX 9070 GRE
NVIDIA GeForce RTX 5070
NVIDIA GeForce RTX 4080 Super
AMD Radeon RX 9070
AMD Radeon RX 9070 XT
NVIDIA GeForce RTX 5070 Ti
NVIDIA GeForce RTX 5080
NVIDIA GeForce RTX 5090
...
3DMark - 3DMark Fire Strike Standard Graphics
min: 58368 media: 59039 media: 59075 (54%) massimo: 59674 Points
GPU TDP ? TDP 320 W 98% 100%
AMD Radeon HD 8180
...
AMD Radeon RX 9070 GRE
NVIDIA GeForce RTX 5070
NVIDIA GeForce RTX 4080 Super
AMD Radeon RX 9070
AMD Radeon RX 9070 XT
NVIDIA GeForce RTX 5070 Ti
NVIDIA GeForce RTX 5080
...
3DMark - 3DMark Ice Storm Graphics
min: 623960 media: 714523 media: 712491 (79%) massimo: 807119 Points
GPU TDP ? TDP 320 W 82% 100%
PowerVR SGX531
...
AMD Radeon RX 9060 XT 16GB
NVIDIA GeForce RTX 4080 Super
NVIDIA GeForce RTX 5070
NVIDIA GeForce RTX 5070 Ti
NVIDIA GeForce RTX 5080
NVIDIA GeForce RTX 5090
3DMark - 3DMark Time Spy Score
min: 27079 media: 27286 media: 27111 (70%) massimo: 27669 Points
GPU TDP ? TDP 320 W 99% 100%
...
NVIDIA GeForce RTX 5070
AMD Radeon RX 9070 GRE
AMD Radeon RX 9070
NVIDIA GeForce RTX 5070 Ti
NVIDIA GeForce RTX 4080 Super
AMD Radeon RX 9070 XT
NVIDIA GeForce RTX 5080
NVIDIA GeForce RTX 5090
3DMark - 3DMark Time Spy Graphics
min: 28049 media: 28344 media: 28378 (58%) massimo: 28605 Points
GPU TDP ? TDP 320 W 98% 100%
...
NVIDIA RTX PRO 5000 Blackwell Generation Laptop
AMD Radeon RX 9070
NVIDIA GeForce RTX 5070 Ti
NVIDIA GeForce RTX 4080 Super
AMD Radeon RX 9070 XT
NVIDIA GeForce RTX 5080
NVIDIA GeForce RTX 5090
3DMark - 3DMark Ice Storm Unlimited Graphics
min: 760629 media: 837697 media: 870270 (88%) massimo: 882191 Points
GPU TDP ? TDP 320 W 87% 100%
PowerVR SGX531
...
NVIDIA GeForce RTX 5060 Ti
NVIDIA GeForce RTX 5060
NVIDIA GeForce RTX 4080 Super
NVIDIA GeForce RTX 5070
NVIDIA GeForce RTX 5090
NVIDIA GeForce RTX 5080
NVIDIA GeForce RTX 5070 Ti
...
3DMark - 3DMark Ice Storm Extreme Graphics
min: 571282 media: 640225 media: 667521 (78%) massimo: 681871 Points
GPU TDP ? TDP 320 W 85% 100%
...
NVIDIA GeForce RTX 4080 Super
NVIDIA GeForce RTX 5070
NVIDIA GeForce RTX 5070 Ti
NVIDIA GeForce RTX 5080
NVIDIA GeForce RTX 5090
...
NVIDIA GeForce RTX 5080
3DMark - 3DMark Cloud Gate Score
min: 80761 media: 84553 media: 86181 (81%) massimo: 86716 Points
GPU TDP ? TDP 320 W 93% 100%
...
NVIDIA GeForce RTX 5060
NVIDIA GeForce RTX 4080 Super
AMD Radeon RX 9070
AMD Radeon RX 9060 XT 16GB
NVIDIA GeForce RTX 5070
NVIDIA GeForce RTX 5070 Ti
...
NVIDIA GeForce RTX 5090
3DMark - 3DMark Cloud Gate Graphics
min: 174309 media: 185738 media: 187847 (46%) massimo: 195058 Points
GPU TDP ? TDP 320 W 91% 100%
...
AMD Radeon RX 6650 XT
NVIDIA GeForce RTX 5060
AMD Radeon RX 6750 XT
NVIDIA Titan RTX
NVIDIA GeForce RTX 4080 Super
AMD Radeon RX 6800
AMD Radeon RX 9070
AMD Radeon RX 9060 XT 16GB
...
NVIDIA GeForce RTX 5090
3DMark - 3DMark Night Raid
min: 94035 media: 98903 media: 99666 (94%) massimo: 103007 Points
GPU TDP ? TDP 320 W 93% 100%
...
NVIDIA GeForce RTX 5070
NVIDIA GeForce RTX 5070 Ti
AMD Radeon RX 9070 XT
AMD Radeon RX 9070
NVIDIA GeForce RTX 4080 Super
3DMark - 3DMark Night Raid Graphics Score
min: 215298 media: 232956 media: 235474 (91%) massimo: 248095 Points
GPU TDP ? TDP 320 W 89% 100%
...
NVIDIA GeForce RTX 5070
NVIDIA GeForce RTX 5070 Ti
AMD Radeon RX 9070 XT
NVIDIA GeForce RTX 5080
AMD Radeon RX 9070
NVIDIA GeForce RTX 5090
NVIDIA GeForce RTX 4080 Super
3DMark 11 - 3DM11 Performance Score
min: 57532 media: 59122 media: 59568 (72%) massimo: 60267 Points
GPU TDP ? TDP 320 W 96% 100%
...
AMD Radeon RX 9060 XT 16GB
NVIDIA GeForce RTX 4080 Super
NVIDIA GeForce RTX 5070
AMD Radeon RX 9070
NVIDIA GeForce RTX 5070 Ti
AMD Radeon RX 9070 XT
NVIDIA GeForce RTX 5080
NVIDIA GeForce RTX 5090
3DMark 11 - 3DM11 Performance GPU
min: 84210 media: 86347 media: 87055 (67%) massimo: 87776 Points
GPU TDP ? TDP 320 W 96% 100%
...
NVIDIA GeForce RTX 5070
NVIDIA GeForce RTX 5070 Ti
NVIDIA GeForce RTX 4080 Super
AMD Radeon RX 9070
AMD Radeon RX 9070 XT
NVIDIA GeForce RTX 5080
NVIDIA GeForce RTX 5090
3DMark Vantage + 3DMark Vantage - 3DM Vant. Perf. total
min: 139305 media: 141652 media: 141652 (41%) massimo: 143998 Points
...
NVIDIA GeForce RTX 5070
AMD Radeon RX 9070
NVIDIA GeForce RTX 4080 Super
NVIDIA GeForce RTX 5070 Ti
AMD Radeon RX 9070 XT
NVIDIA GeForce RTX 5080
3DM Vant. Perf. GPU no PhysX + 3DMark Vantage - 3DM Vant. Perf. GPU no PhysX
min: 151574 media: 155185 media: 155185 (85%) massimo: 158796 Points
...
NVIDIA GeForce RTX 5070
NVIDIA GeForce RTX 4080 Super
AMD Radeon RX 9070
NVIDIA GeForce RTX 5070 Ti
AMD Radeon RX 9070 XT
NVIDIA GeForce RTX 5080
3DMark 05 - 3DMark 05 - Standard
min: 87139 media: 87172 media: 87171.5 (95%) massimo: 87204 Points
Intel Graphics Media Accelerator (GMA) 500
...
NVIDIA GeForce RTX 5060
NVIDIA GeForce RTX 5070
NVIDIA GeForce RTX 5070 Ti
NVIDIA GeForce GTX 1060 (Desktop)
NVIDIA GeForce RTX 5080
NVIDIA GeForce RTX 5090
NVIDIA GeForce GTX 1650 Super (Desktop)
NVIDIA GeForce RTX 4080 Super
3DMark 06 3DMark 06 - Standard 1280x1024 + 3DMark 06
min: 73603 media: 74741 media: 74741 (98%) massimo: 75879 Points
SIS Mirage 3 671MX
...
AMD Radeon RX 9060 XT 16GB
AMD Radeon RX 9070
NVIDIA GeForce RTX 4080 Super
Unigine Valley 1.0 - Unigine Valley 1.0 DX
min: 269.4 media: 276.3 media: 277.1 (84%) massimo: 282.3 fps
GPU TDP ? TDP 320 W 96% 100%
...
NVIDIA GeForce RTX 5070
NVIDIA GeForce RTX 5080
NVIDIA GeForce RTX 5070 Ti
NVIDIA GeForce RTX 4080 Super
NVIDIA GeForce RTX 5090
...
Blender - Blender 3.3 Classroom CUDA *
min: 14 media: 70 media: 97 (14%) massimo: 99 Seconds
GPU TDP ? TDP 320 W 115% 100%
NVIDIA GeForce RTX 5090
...
NVIDIA GeForce RTX 4080 Super
NVIDIA GeForce RTX 3050 4GB Laptop GPU
...
Blender - Blender 3.3 Classroom OPTIX *
min: 8 media: 8.7 media: 9 (3%) massimo: 9 Seconds
GPU TDP ? TDP 320 W 100% 100%
NVIDIA GeForce RTX 5090
NVIDIA GeForce RTX 5080
NVIDIA GeForce RTX 4080 Super
NVIDIA GeForce RTX 5070 Ti
NVIDIA RTX PRO 5000 Blackwell Generation Laptop
NVIDIA GeForce RTX 5070
...
SPECviewperf 12 + SPECviewperf 12 - specvp12 sw-03
min: 116 media: 123.5 media: 123.5 (31%) massimo: 131 fps
...
AMD Radeon Pro Vega 56
NVIDIA Quadro P4000 Max-Q
NVIDIA GeForce RTX 4080 Super
AMD Radeon RX 5700 (Desktop)
AMD Radeon RX 5600 XT (Desktop)
Nvidia RTX A2000
AMD Radeon RX 5700 XT (Desktop)
...
specvp12 snx-02 + SPECviewperf 12 - specvp12 snx-02
min: 24.5 media: 24.6 media: 24.6 (4%) massimo: 24.7 fps
...
AMD Radeon RX 580 (Desktop)
AMD Radeon RX Vega 56
NVIDIA GeForce RTX 5070 Ti
NVIDIA Quadro P520
NVIDIA GeForce RTX 4080 Super
NVIDIA Quadro M600M
NVIDIA GeForce RTX 5080
AMD FirePro W4100
AMD FirePro W5130M
NVIDIA Quadro P500
...
specvp12 showcase-01 + SPECviewperf 12 - specvp12 showcase-01
min: 296 media: 316 media: 316 (55%) massimo: 336 fps
...
NVIDIA RTX A6000
NVIDIA GeForce RTX 5070
NVIDIA GeForce RTX 4080 Super
NVIDIA GeForce RTX 5080
NVIDIA GeForce RTX 5090
specvp12 mediacal-01 + SPECviewperf 12 - specvp12 mediacal-01
...
4x NVIDIA RTX A6000
NVIDIA RTX A6000
AMD Radeon Pro W6800
AMD Radeon RX 9060 XT 16GB
NVIDIA GeForce RTX 5070 Ti
NVIDIA GeForce RTX 4080 Super
NVIDIA GeForce RTX 5080
AMD Radeon RX 9070
NVIDIA GeForce RTX 5090
AMD Radeon RX 9070 XT
...
specvp12 maya-04 + SPECviewperf 12 - specvp12 maya-04
min: 317 media: 317.5 media: 317.5 (87%) massimo: 318 fps
...
AMD Radeon RX 9070
NVIDIA GeForce RTX 5070
NVIDIA GeForce RTX 5070 Ti
NVIDIA GeForce RTX 5090
NVIDIA GeForce RTX 5080
NVIDIA GeForce RTX 4080 Super
specvp12 energy-01 + SPECviewperf 12 - specvp12 energy-01
min: 60.4 media: 60.5 media: 60.5 (54%) massimo: 60.6 fps
...
NVIDIA GeForce RTX 5070
AMD Radeon 660M
AMD Radeon RX 5600 XT (Desktop)
NVIDIA GeForce RTX 5070 Ti
NVIDIA GeForce RTX 4080 Super
AMD Radeon RX 9070
AMD Radeon RX 9070 XT
NVIDIA GeForce RTX 5080
NVIDIA GeForce RTX 5090
specvp12 creo-01 + SPECviewperf 12 - specvp12 creo-01
min: 120 media: 121 media: 121 (48%) massimo: 122 fps
...
NVIDIA GeForce RTX 5080
Nvidia RTX A2000
NVIDIA GeForce RTX 5090
NVIDIA GeForce RTX 4080 Super
4x NVIDIA RTX A6000
AMD Radeon RX 6750 XT
...
specvp12 catia-04 + SPECviewperf 12 - specvp12 catia-04
min: 236 media: 237 media: 237 (37%) massimo: 238 fps
...
4x NVIDIA RTX A6000
AMD Radeon RX 6650 XT
NVIDIA GeForce RTX 5070 Ti
NVIDIA RTX A6000
NVIDIA GeForce RTX 4080 Super
NVIDIA Titan RTX
NVIDIA GeForce RTX 5080
AMD Radeon Pro W6800
AMD Radeon RX 6750 XT
...
AMD Radeon RX 9070
specvp12 3dsmax-05 + SPECviewperf 12 - specvp12 3dsmax-05
min: 485 media: 490 media: 490 (74%) massimo: 495 fps
AMD FirePro W4190M
...
NVIDIA GeForce RTX 5070
AMD Radeon RX 9070
AMD Radeon RX 9070 XT
NVIDIA GeForce RTX 4080 Super
NVIDIA GeForce RTX 5070 Ti
NVIDIA GeForce RTX 5080
NVIDIA GeForce RTX 5090
SPECviewperf 13 specvp13 sw-04 + SPECviewperf 13 - specvp13 sw-04
min: 185 media: 186 media: 186 (50%) massimo: 187 fps
Intel Iris Plus Graphics G7 (Ice Lake 64 EU)
...
NVIDIA GeForce RTX 5090
AMD Radeon Pro W6800
NVIDIA GeForce RTX 5080
NVIDIA GeForce RTX 4080 Super
4x NVIDIA RTX A6000
NVIDIA RTX A6000
NVIDIA RTX PRO 5000 Blackwell Generation Laptop
...
specvp13 snx-03 + SPECviewperf 13 - specvp13 snx-03
min: 43.8 media: 44.2 media: 44.2 (5%) massimo: 44.5 fps
...
NVIDIA GeForce RTX 5070
AMD Radeon RX 570 (Desktop)
AMD Radeon RX 580 (Desktop)
AMD Radeon RX Vega 56
NVIDIA GeForce RTX 5070 Ti
NVIDIA GeForce RTX 4080 Super
NVIDIA GeForce RTX 5080
NVIDIA Quadro P520
AMD Radeon 610M
NVIDIA GeForce RTX 5090
...
AMD Radeon RX 9070 XT
specvp13 showcase-02 + SPECviewperf 13 - specvp13 showcase-02
min: 295 media: 314 media: 314 (53%) massimo: 333 fps
Intel UHD Graphics 24EUs (Alder Lake-N)
...
NVIDIA RTX A6000
NVIDIA GeForce RTX 5070
NVIDIA RTX PRO 5000 Blackwell Generation Laptop
NVIDIA GeForce RTX 4080 Super
NVIDIA GeForce RTX 5070 Ti
NVIDIA GeForce RTX 5080
NVIDIA GeForce RTX 5090
specvp13 medical-02 + SPECviewperf 13 - specvp13 medical-02
min: 144 media: 144.5 media: 144.5 (25%) massimo: 145 fps
...
NVIDIA GeForce RTX 5070 Ti
AMD Radeon RX 6800
NVIDIA GeForce RTX 4080 Super
AMD Radeon RX 6750 XT
NVIDIA GeForce RTX 5080
AMD Radeon RX 6700 XT
4x NVIDIA RTX A6000
...
AMD Radeon RX 9070 XT
specvp13 maya-05 + SPECviewperf 13 - specvp13 maya-05
min: 750 media: 759 media: 758.5 (86%) massimo: 767 fps
Intel UHD Graphics 24EUs (Alder Lake-N)
...
NVIDIA GeForce RTX 5070
AMD Radeon RX 9070
NVIDIA GeForce RTX 5070 Ti
AMD Radeon RX 9070 XT
NVIDIA GeForce RTX 5080
NVIDIA GeForce RTX 5090
NVIDIA GeForce RTX 4080 Super
...
specvp13 energy-02 + SPECviewperf 13 - specvp13 energy-02
min: 93.3 media: 93.5 media: 93.5 (30%) massimo: 93.7 fps
...
NVIDIA GeForce RTX 5070 Ti
AMD Radeon Pro W6800
AMD Radeon RX 9060 XT 16GB
NVIDIA GeForce RTX 4080 Super
NVIDIA GeForce RTX 5080
4x NVIDIA RTX A6000
NVIDIA RTX A6000
...
Intel UHD Graphics 24EUs (Alder Lake-N)
specvp13 creo-02 + SPECviewperf 13 - specvp13 creo-02
min: 560 media: 565 media: 564.5 (82%) massimo: 569 fps
Intel Iris Plus Graphics G7 (Ice Lake 64 EU)
...
NVIDIA GeForce RTX 5070
NVIDIA GeForce RTX 5070 Ti
NVIDIA RTX PRO 5000 Blackwell Generation Laptop
NVIDIA GeForce RTX 4080 Super
NVIDIA GeForce RTX 5080
NVIDIA GeForce RTX 5090
AMD Radeon RX 9070
AMD Radeon RX 9070 XT
...
AMD Radeon RX 9070 XT
specvp13 catia-05 + SPECviewperf 13 - specvp13 catia-05
min: 345 media: 346.5 media: 346.5 (38%) massimo: 348 fps
Intel UHD Graphics 24EUs (Alder Lake-N)
...
NVIDIA GeForce RTX 5070 Ti
NVIDIA RTX PRO 2000 Blackwell Generation Laptop
NVIDIA GeForce RTX 4080 Super
NVIDIA GeForce RTX 5080
4x NVIDIA RTX A6000
NVIDIA RTX A6000
NVIDIA Titan RTX
...
AMD Radeon RX 9070 XT
specvp13 3dsmax-06 + SPECviewperf 13 - specvp13 3dsmax-06
min: 489 media: 493 media: 493 (77%) massimo: 497 fps
Intel UHD Graphics 24EUs (Alder Lake-N)
...
NVIDIA RTX PRO 5000 Blackwell Generation Laptop
NVIDIA GeForce RTX 5070
AMD Radeon RX 9070
AMD Radeon RX 9070 XT
NVIDIA GeForce RTX 4080 Super
NVIDIA GeForce RTX 5080
NVIDIA GeForce RTX 5090
SPECviewperf 2020 specvp2020 solidworks-05 4k + SPECviewperf 2020 - specvp2020 solidworks-05 4k
...
NVIDIA GeForce RTX 4080 Super
AMD Radeon Pro W6800
NVIDIA GeForce RTX 5080
NVIDIA GeForce RTX 5090
specvp2020 snx-04 4k + SPECviewperf 2020 - specvp2020 snx-04 4k
min: 36.5 media: 36.6 media: 36.6 (4%) massimo: 36.7 fps
...
AMD Radeon RX Vega 7
NVIDIA GeForce RTX 5070
AMD Radeon 610M
AMD Radeon VII
NVIDIA GeForce RTX 5070 Ti
NVIDIA GeForce RTX 4080 Super
NVIDIA GeForce RTX 5080
AMD Radeon 660M
NVIDIA GeForce RTX 5090
AMD Radeon 680M
...
specvp2020 medical-03 4k + SPECviewperf 2020 - specvp2020 medical-03 4k
min: 28.4 media: 28.6 media: 28.6 (18%) massimo: 28.7 fps
Intel UHD Graphics Xe 32EUs (Tiger Lake-H)
...
NVIDIA GeForce RTX 5070
Nvidia RTX A2000
NVIDIA GeForce RTX 4080 Super
AMD Radeon RX 6700 XT
NVIDIA GeForce RTX 5070 Ti
AMD Radeon RX 6750 XT
4x NVIDIA RTX A6000
...
AMD Radeon RX 9070 XT
specvp2020 maya-06 4k + SPECviewperf 2020 - specvp2020 maya-06 4k
min: 457 media: 470 media: 470 (67%) massimo: 483 fps
Intel UHD Graphics Xe G4 48EUs
...
NVIDIA RTX PRO 5000 Blackwell Generation Laptop
AMD Radeon RX 9070
AMD Radeon RX 9070 XT
NVIDIA GeForce RTX 5070
NVIDIA GeForce RTX 4080 Super
NVIDIA GeForce RTX 5070 Ti
NVIDIA GeForce RTX 5080
NVIDIA GeForce RTX 5090
specvp2020 energy-03 4k + SPECviewperf 2020 - specvp2020 energy-03 4k
min: 93.6 media: 93.7 media: 93.7 (20%) massimo: 93.7 fps
...
NVIDIA GeForce RTX 5070
AMD Radeon RX 9060 XT 16GB
NVIDIA GeForce RTX 5070 Ti
AMD Radeon Pro W6800
AMD Radeon RX 6800
NVIDIA GeForce RTX 4080 Super
NVIDIA GeForce RTX 5080
AMD Radeon RX 9070
...
specvp2020 creo-03 4k + SPECviewperf 2020 - specvp2020 creo-03 4k
min: 138 media: 139.5 media: 139.5 (63%) massimo: 141 fps
Intel UHD Graphics Xe G4 48EUs
...
NVIDIA GeForce RTX 5070 Ti
NVIDIA Titan RTX
AMD Radeon RX 9060 XT 16GB
NVIDIA GeForce RTX 5080
NVIDIA GeForce RTX 4080 Super
NVIDIA GeForce RTX 5090
NVIDIA RTX PRO 5000 Blackwell Generation Laptop
AMD Radeon RX 9070
AMD Radeon RX 9070 XT
specvp2020 catia-06 4k + SPECviewperf 2020 - specvp2020 catia-06 4k
min: 75.9 media: 76.1 media: 76.1 (50%) massimo: 76.3 fps
...
4x NVIDIA RTX A6000
NVIDIA GeForce RTX 5070 Ti
NVIDIA GeForce RTX 4080 Super
AMD Radeon Pro W6800
AMD Radeon RX 6800
NVIDIA GeForce RTX 5080
NVIDIA RTX A6000
AMD Radeon RX 9060 XT 16GB
NVIDIA Titan RTX
...
specvp2020 3dsmax-07 4k + SPECviewperf 2020 - specvp2020 3dsmax-07 4k
min: 185 media: 187.5 media: 187.5 (63%) massimo: 190 fps
...
NVIDIA GeForce RTX 5070
NVIDIA RTX PRO 5000 Blackwell Generation Laptop
AMD Radeon Pro W6800
NVIDIA GeForce RTX 5070 Ti
NVIDIA GeForce RTX 4080 Super
NVIDIA GeForce RTX 5080
NVIDIA GeForce RTX 5090
Basemark GPU 1.2 - Basemark GPU 1.2 Vulkan Official Medium Offscreen 1080
min: 2833 media: 3066 media: 3066 (33%) massimo: 3299 fps
...
AMD Radeon RX 9070 XT
NVIDIA GeForce RTX 5070
NVIDIA GeForce RTX 5070 Ti
NVIDIA GeForce RTX 4080 Super
NVIDIA GeForce RTX 5080
NVIDIA GeForce RTX 5090
Basemark GPU 1.2 - Basemark GPU 1.2 Vulkan Official High Offscreen 2160
...
AMD Radeon RX 9070
AMD Radeon RX 9070 XT
NVIDIA GeForce RTX 5070
NVIDIA GeForce RTX 5070 Ti
NVIDIA GeForce RTX 4080 Super
NVIDIA GeForce RTX 5080
NVIDIA GeForce RTX 5090
Geekbench 6.7 - Geekbench 6.7.1 GPU OpenCL
min: 253443 media: 256625 media: 256624 (65%) massimo: 259806 punti
IMG BXM-8-256
...
NVIDIA GeForce RTX 5070
NVIDIA RTX PRO 5000 Blackwell Generation Laptop
NVIDIA GeForce RTX 5070 Ti
NVIDIA GeForce RTX 4080 Super
NVIDIA GeForce RTX 5080
NVIDIA GeForce RTX 5090
Geekbench 6.7 - Geekbench 6.7.1 GPU Vulkan
min: 219087 media: 219700 media: 219700 (55%) massimo: 220312 punti
IMG BXM-8-256
...
NVIDIA RTX PRO 3000 Blackwell Generation Laptop
NVIDIA GeForce RTX 5070
NVIDIA GeForce RTX 4080 Super
NVIDIA GeForce RTX 5070 Ti
NVIDIA GeForce RTX 5080
NVIDIA GeForce RTX 5090
LuxMark v2.0 64Bit - LuxMark v2.0 Room GPU
min: 10075 media: 10282 media: 10136 (36%) massimo: 10636 Samples/s
GPU TDP ? TDP 320 W 100% 95%
AMD Radeon HD 8180
...
NVIDIA GeForce RTX 5070
NVIDIA GeForce RTX 5070 Ti
NVIDIA GeForce RTX 4080 Super
NVIDIA GeForce RTX 5080
NVIDIA GeForce RTX 5090
4x NVIDIA RTX A6000
LuxMark v2.0 64Bit - LuxMark v2.0 Sala GPU
min: 22634 media: 23440 media: 23374 (41%) massimo: 24311 Samples/s
GPU TDP ? TDP 320 W 100% 95%
...
NVIDIA GeForce RTX 5070
NVIDIA GeForce RTX 5070 Ti
NVIDIA GeForce RTX 4080 Super
NVIDIA GeForce RTX 5080
NVIDIA GeForce RTX 5090
4x NVIDIA RTX A6000
ComputeMark v2.1 - ComputeMark v2.1 Result
min: 65045 media: 65879 media: 65378 (54%) massimo: 67215 punti
GPU TDP ? TDP 320 W 98% 100%
...
AMD Radeon RX 9070 XT
NVIDIA GeForce RTX 5070 Ti
NVIDIA GeForce RTX 4080 Super
NVIDIA GeForce RTX 5080
NVIDIA GeForce RTX 5090
Power Consumption - Furmark Stress Test Power Consumption - external Monitor *
min: 425 media: 445.3 media: 433 (58%) massimo: 490 Watt
GPU TDP ? TDP 320 W 100% 109%
...
AMD Radeon RX 6750 XT
AMD Radeon VII
NVIDIA Titan RTX
NVIDIA GeForce RTX 5070 Ti
NVIDIA GeForce RTX 4080 Super
AMD Radeon Pro W6800
AMD Radeon RX 9070 XT
...
NVIDIA GeForce RTX 5090
0 15 30 45 60 75 90 105 120 135 150 165 180 195 210 225 240 255 270 285 300 315 330 345 360 375 390 405 420 435 450 465 480 495 510 525 Tooltip Zotac RTX 4080 Super Trinity Black Edition: Ø425 (411-445)
Gigabyte GeForce RTX 4080 Super Gaming OC 125% PT, BIOS OC: Ø425 (416-452)
Gigabyte GeForce RTX 4080 Super Gaming OC 125% PT, BIOS OC: Ø490 (484-529)
KFA2 GeForce RTX 4080 Super SG: Ø441 (426-452)
Power Consumption - The Witcher 3 Power Consumption - external Monitor *
min: 433 media: 477.5 media: 479 (67%) massimo: 519 Watt
GPU TDP ? TDP 320 W 125% 100%
Qualcomm Adreno 690
...
AMD Radeon RX 6750 XT
AMD Radeon RX 9070 GRE
NVIDIA GeForce RTX 5080
NVIDIA GeForce RTX 4080 Super
AMD Radeon RX 9070 XT
...
4x NVIDIA RTX A6000
0 15 30 45 60 75 90 105 120 135 150 165 180 195 210 225 240 255 270 285 300 315 330 345 360 375 390 405 420 435 450 465 480 495 510 525 540 555 570 Tooltip Gigabyte GeForce RTX 4080 Super Gaming OC 125% PT, BIOS OC: Ø433 (419-463)
Gigabyte GeForce RTX 4080 Super Gaming OC 125% PT, BIOS OC: Ø469 (457-489)
KFA2 GeForce RTX 4080 Super SG: Ø489 (481-502)
Zotac RTX 4080 Super Trinity Black Edition: Ø519 (504-582)
Power Consumption - Power Efficiency - Witcher 3 ultra external Monitor
min: 0.514 media: 0.5 media: 0.5 (43%) massimo: 0.538 fps per Watt
GPU TDP ? TDP 320 W 97% 100%
...
NVIDIA GeForce RTX 2070 Super Max-Q
NVIDIA GeForce RTX 4080 Super
NVIDIA GeForce RTX 5060
...
Emissions Witcher 3 Fan Noise + Emissions - Witcher 3 Fan Noise
min: 40.6 media: 42.3 media: 42.3 (60%) massimo: 44 dB(A)
...
AMD Radeon R7 M340
NVIDIA GeForce RTX 4080 Super
NVIDIA GeForce RTX 5080
...
- Valori di benchmark per questa scheda grafica
- Valori medi di benchmark per questa scheda grafica
* Numeri più piccoli rappresentano prestazioni supeiori
I seguenti benchmarks deirivano dai benchmarks dei portatili recensiti. Le prestazioni dipendono dalla scheda grafica utilizzata, dal clock rate, dal processore, dai settaggi di sistema, dai drivers, e dai sistemi operativi. Quindi i risultati non sono rappresentativi per i portatili con questa GPU. Per informazioni dettagliate sui risultati del benchmark, cliccate sul numero di fps.
» Giocabile con tutti i portatili testati con dettagli ultra.
Additional Benchmarks
Low Preset (FSR off) 1280x720
248 [X] Intel Core i9-14900K 3.2GHz
GeForce RTX 4080 Super
min:
90.8 fps, max:
323 fps
238 [X] Intel Core i9-14900K 3.2GHz
GeForce RTX 4080 Super
min:
27.2 fps, max:
317 fps
Ray Tracing Ultra Preset (DLSS off) 1920x1080
99.2 [X] Intel Core i9-14900K 3.2GHz
GeForce RTX 4080 Super
min:
77.2 fps, max:
143.4 fps
100.1 [X] Intel Core i9-14900K 3.2GHz
GeForce RTX 4080 Super
min:
76.1 fps, max:
141.3 fps
Ray Tracing Ultra Preset + DLSS3 Quality + FG 3840x2160
116.2 [X] Intel Core i9-14900K 3.2GHz
GeForce RTX 4080 Super
min:
103.2 fps, max:
134.8 fps
116.9 [X] Intel Core i9-14900K 3.2GHz
GeForce RTX 4080 Super
min:
101.7 fps, max:
134.3 fps
Steam Deck 1280x800
241 [X] Intel Core i9-14900K 3.2GHz
GeForce RTX 4080 Super
min:
89 fps, max:
313 fps
Ultra Preset (FSR2 on) 1920x1080
203 [X] Intel Core i9-14900K 3.2GHz
GeForce RTX 4080 Super
min:
105.9 fps, max:
278 fps
Ray Tracing Ultra Preset (DLSS off, no Path Tracing) 3840x2160
30.4 [X] Intel Core i9-14900K 3.2GHz
GeForce RTX 4080 Super
min:
24.5 fps, max:
39.7 fps
30.6 [X] Intel Core i9-14900K 3.2GHz
GeForce RTX 4080 Super
min:
23.8 fps, max:
40.5 fps





 - Valori medi di benchmark per questa scheda grafica


