Recensioni Notebook con AMD Radeon 860M la scheda grafica
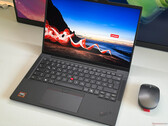
Recensione del Lenovo ThinkPad T14s Gen 7 con processore AMD: Eccellente laptop aziendale con 64 GB di RAM
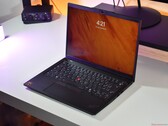
Il nuovo ThinkPad T14s Gen 7 è un notebook aziendale di fascia alta da 14 pollici e Lenovo lo ha dotato di un telaio completamente riprogettato e più leggero. Il nostro modello in prova è dotato di processore AMD Ryzen AI 7 PRO 450, 64 GB di RAM e uno schermo touchscreen IPS opaco.
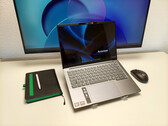
AMD Ryzen AI 7 PRO 450, Radeon 860M, 14", 1.2 kgRecensione del portatile Lenovo IdeaPad Pro 5 14: AMD ci sta prendendo in giro con il Ryzen AI 7 450?
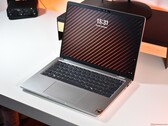
IdeaPad Pro 5 14AGP11 è un subnotebook di alta qualità di Lenovo che, nella configurazione testata, è equipaggiato con un chip a otto core basato su Zen 5. Continui a leggere per scoprire come il Ryzen AI 7 450 si comporta rispetto al suo predecessore e alla concorrenza di Intel.
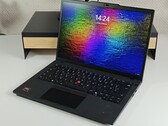
AMD Ryzen AI 7 450, Radeon 860M, 14", 1.4 kgRecensione del portatile Lenovo ThinkPad T14 Gen 6 AMD: AMD Ryzen AI incontra il classico ThinkPad
Sarà anche un modello del 2025, ma la CPU AMD Ryzen AI 300 del Lenovo ThinkPad T14 Gen 6 AMD offre le stesse prestazioni di un chip Ryzen AI 400 più moderno. Con l'aumento dei prezzi, potrebbe valere la pena acquistare il laptop Lenovo più vecchio, nonostante il suo successore sia già stato annunciato.
AMD Ryzen AI 7 PRO 350, Radeon 860M, 14", 1.4 kgRecensione del Lenovo ThinkPad L14 Gen 6 AMD: Questo portatile le farà superare la crisi della memoria
In tempi di aumento dei prezzi, i computer portatili più convenienti diventano più interessanti per un numero maggiore di persone. Il Lenovo ThinkPad L14 Gen 6 AMD è un dispositivo di questo tipo. Questo computer portatile business ha un prezzo complessivamente inferiore, che consente agli acquirenti di ottenere più memoria per meno soldi rispetto ai modelli più costosi.
AMD Ryzen AI 7 PRO 350, Radeon 860M, 14", 1.6 kgRecensione del portatile Dell Pro 14 Plus PB14255: Finalmente abbraccia AMD per la serie Pro
Con la nuova serie Dell Pro, Dell ha finalmente adottato le CPU AMD per la sua linea di laptop business più costosi. Il Dell Pro 14 Plus sostituisce i Dell Latitude 5000 e 7000, offrendo molte funzionalità business in un pacchetto più conveniente rispetto alla serie Dell Pro Premium.
AMD Ryzen AI 7 PRO 350, Radeon 860M, 14", 1.6 kgAsus ExpertBook PM3406: AMD Ryzen AI 7 350, 14.00", 1.4 kg
recensione » Recensione dell'Asus ExpertBook PM3: Laptop da ufficio con AMD, batteria di lunga durata e Copilot+
HP OmniBook 7 Aero 13-bg1077nr: AMD Ryzen AI 7 350, 13.30", 1 kg
recensione » Recensione dell'HP OmniBook 7 Aero 13: Il portatile da 13 pollici più leggero al mondo con oltre 40 TOPS NPU
Lenovo ThinkPad X13 G6 AMD: AMD Ryzen AI 7 PRO 350, 13.30", 1.1 kg
recensione » Recensione del Lenovo ThinkPad X13 G6 AMD: Laptop business compatto con alcune sorprese sgradite
Acer Swift Go 16 AI SFG16-61-R5Y5: AMD Ryzen AI 7 350, 16.00", 1.5 kg
recensione » Recensione dell'Acer Swift Go 16 AI: Prestazioni solide e OLED colorato
Lenovo ThinkPad T16 Gen 4 21QQS06M00: AMD Ryzen AI 7 PRO 350, 16.00", 2 kg
recensione » Recensione del Lenovo ThinkPad T16 Gen 4: Il laptop business di grandi dimensioni con AMD Ryzen Pro convince
Asus ZenBook 14 OLED UM3406K, Ryzen AI 7 350: AMD Ryzen AI 7 350, 14.00", 1.2 kg
recensione » Recensione dell'Asus ZenBook 14 OLED UM3406K: Subnotebook AMD in una serrata battaglia a tre
HP EliteBook 8 G1a 16 AI: AMD Ryzen AI 7 PRO 350, 16.00", 1.9 kg
recensione » Recensione del portatile HP EliteBook 8 G1a 16 AI: Riprogettato dentro e fuori
Asus ExpertCenter PN54-S70012NN: AMD Ryzen AI 7 350, 0.7 kg
recensione » Recensione dell'Asus ExpertCenter PN54 - Mini PC business con AMD Ryzen AI 7 e caratteristiche moderne
Dell 14 Plus 2-in-1: AMD Ryzen AI 7 350, 14.00", 1.6 kg
recensione » Recensione del convertibile Dell 14 Plus 2-in-1: AMD offre un vantaggio chiave rispetto a Intel
Lenovo Yoga Slim 7 14AKP G10: AMD Ryzen AI 7 350, 14.00", 1.2 kg
recensione » Recensione del Lenovo Yoga Slim 7 14 G10: OLED brillante da 1.100 nit, ma problemi di qualità inaspettati
Lenovo IdeaPad 5 2-in-1 14AKP10 83KT0033GE: AMD Ryzen AI 7 350, 14.00", 1.5 kg
recensione » Recensione del portatile Lenovo IdeaPad 5 2-in-1 14AKP10: potente CPU AMD Zen5 con penna e OLED a un prezzo contenuto
Lenovo Yoga Pro 7 14AKP G10: AMD Ryzen AI 7 350, 14.50", 1.6 kg
recensione » Recensione del portatile Lenovo Yoga Pro 7 14 G10: 90 Hz OLED con AdobeRGB
Lenovo IdeaPad Pro 5 14AKP G10: AMD Ryzen AI 7 350, 14.00", 1.4 kg
recensione » Recensione del Lenovo IdeaPad Pro 5 14 G10: Un OLED da 1.100 nit e AMD Zen 5 in un computer portatile per creators
Asus Vivobook 16 M1606K: AMD Ryzen AI 7 350, 16.00", 1.9 kg
recensione » Recensione del portatile Asus Vivobook 16: Le funzioni AI in primo piano: autentico aumento della produttività o pubblicità?
HP ProBook 4 G2a 14: AMD Ryzen AI 7 450, 14.00", 1.4 kg
Recensioni esterne » HP ProBook 4 G2a 14 - Recensioni e Specifiche
HP EliteBook 6 G1a 14: AMD Ryzen AI 7 350, 14.00", 1.4 kg
Recensioni esterne » HP EliteBook 6 G1a 14
Acer Swift Go 16 AI SFG16-61-R5Y5: AMD Ryzen AI 7 350, 16.00", 1.5 kg
Recensioni esterne » Acer Swift Go 16 AI SFG16-61-R5Y5
Acer Aspire 14 AI A14-61M: AMD Ryzen AI 7 350, 14.00", 1.2 kg
Recensioni esterne » Acer Aspire 14 AI A14-61M
HP OmniBook X Flip NGAI 16-ar0000: AMD Ryzen AI 7 350, 16.00", 1.9 kg
Recensioni esterne » HP OmniBook X Flip NGAI 16-ar0000
Acer Aspire 16 AI A16-61M: AMD Ryzen AI 7 350, 16.00", 1.6 kg
Recensioni esterne » Acer Aspire 16 AI A16-61M
HP OmniBook 7 Aero 13-bg1077nr: AMD Ryzen AI 7 350, 13.30", 1 kg
Recensioni esterne » HP OmniBook 7 Aero 13-bg1077nr
Lenovo ThinkPad T14 Gen 6 (AMD): AMD Ryzen AI 7 PRO 350, 14.00", 1.4 kg
Recensioni esterne » Lenovo ThinkPad T14 Gen 6 (AMD)
Lenovo Yoga Pro 7 14AKP G10: AMD Ryzen AI 7 350, 14.50", 1.6 kg
Recensioni esterne » Lenovo Yoga Pro 7 14AKP G10
Dell Pro 14 PC14255: AMD Ryzen AI 7 PRO 350, 14.00", 1.4 kg
Recensioni esterne » Dell Pro 14 PC14255
HP EliteBook 8 G1a 14, Ryzen AI 7 350: AMD Ryzen AI 7 350, 14.00", 1.4 kg
Recensioni esterne » HP EliteBook 8 G1a 14, Ryzen AI 7 350
Asus ExpertBook PM3606: AMD Ryzen AI 7 350, 16.00", 1.9 kg
Recensioni esterne » Asus ExpertBook PM3606
Asus Vivobook S14 M3407KA: AMD Ryzen AI 7 350, 14.00", 1.4 kg
Recensioni esterne » Asus Vivobook S14 M3407KA
LG gram 15Z80T (2025): AMD Ryzen AI 7 350, 15.60", 1.2 kg
Recensioni esterne » LG gram 15Z80T (2025)
Dell 14 Plus 2-in-1: AMD Ryzen AI 7 350, 14.00", 1.6 kg
Recensioni esterne » Dell 14 Plus 2-in-1
Asus ExpertBook PM3406: AMD Ryzen AI 7 350, 14.00", 1.4 kg
Recensioni esterne » Asus ExpertBook PM3406
HP EliteBook 8 G1a 16 AI: AMD Ryzen AI 7 PRO 350, 16.00", 1.9 kg
Recensioni esterne » HP EliteBook 8 G1a 16 AI
Asus Vivobook S14 M5406KA: AMD Ryzen AI 7 350, 14.00", 1.3 kg
Recensioni esterne » Asus Vivobook S14 M5406KA
Lenovo IdeaPad Slim 5 14AKP10: AMD Ryzen AI 7 350, 14.00", 1.4 kg
Recensioni esterne » Lenovo IdeaPad Slim 5 14AKP10
Lenovo IdeaPad Pro 5 14AKP G10: AMD Ryzen AI 7 350, 14.00", 1.4 kg
Recensioni esterne » Lenovo IdeaPad Pro 5 14AKP G10
Acer Swift Go 14 AI OLED SFG14-64: AMD Ryzen AI 7 350, 14.00", 1.3 kg
Recensioni esterne » Acer Swift Go 14 AI OLED SFG14-64
HP OmniBook X Flip NGAI 14-fk0000: AMD Ryzen AI 7 350, 14.00", 1.4 kg
Recensioni esterne » HP OmniBook X Flip Next Gen AI 14-fk0000
Asus VivoBook S 14 OLED M5406WA, Ryzen AI 7 350: AMD Ryzen AI 7 350, 14.00", 1.3 kg
Recensioni esterne » Asus VivoBook S 14 OLED M5406WA, Ryzen AI 7 350
HP Omnibook 7 Aero 13-bg: AMD Ryzen AI 7 350, 13.30", 1 kg
Recensioni esterne » HP Omnibook 7 Aero 13-bg
MSI Venture A16 AI+ A3HMG: AMD Ryzen AI 7 350, 16.00", 1.9 kg
Recensioni esterne » MSI Venture A16 AI+ A3HMG
Asus Vivobook 16 M1607KA: AMD Ryzen AI 7 350, 16.00", 1.9 kg
Recensioni esterne » Asus Vivobook 16 M1607KA
Asus Zenbook S 16 UM5606, Ryzen AI 7 350: AMD Ryzen AI 7 350, 16.00", 1.5 kg
Recensioni esterne » Asus Zenbook S 16 UM5606, Ryzen AI 7 350
Asus Zenbook 14 OLED UM3406KA: AMD Ryzen AI 7 350, 14.00", 1.2 kg
Recensioni esterne » Asus Zenbook 14 OLED UM3406KA
Lenovo ThinkPad T14s Gen 7 21YW0022GE: AMD Ryzen AI 7 PRO 450, 14.00", 1.2 kg
» Verdetto della recensione del Lenovo ThinkPad T14s Gen 7: un serio rivale per l’X1 Carbon?
» Il nuovo ThinkPad T14s Gen 7 di Lenovo è più leggero che mai, ma le prestazioni non migliorano
Lenovo ThinkPad T14 Gen 6 AMD: AMD Ryzen AI 7 PRO 350, 14.00", 1.4 kg
» Lenovo ThinkPad T14 AMD vs. Intel: Le differenze spiegate
» Non aspetti il T14 Gen 7: perché questo ThinkPad AMD più vecchio vale la pena di essere acquistato
Lenovo ThinkPad L14 Gen 6 21SE0022GE: AMD Ryzen AI 7 PRO 350, 14.00", 1.6 kg
» Si ottiene ciò che si paga: Le differenze tra un Lenovo ThinkPad L14 e T14 spiegate
» La versione AMD è finalmente aggiornata: perché questo portatile Lenovo è migliore del ThinkPad E14
Dell Pro 14 Plus PB14255 GH77W: AMD Ryzen AI 7 PRO 350, 14.00", 1.6 kg
» Si dà la zappa sui piedi: Dell non dovrebbe inserire schermi economici in computer portatili da 1.500 euro
» Memoria saldata in controtendenza: Dell non ha ancora implementato Concept Luna nei suoi computer portatili Pro
Asus ExpertBook PM3406: AMD Ryzen AI 7 350, 14.00", 1.4 kg
» Recensione dell'Asus ExpertBook PM3 - Buon portatile da ufficio con garanzia lunga e sicurezza degli aggiornamenti
Dell Pro 14 Plus PB14255 GH77W: AMD Ryzen AI 7 PRO 350, 14.00", 1.6 kg
» Questo portatile Dell è una vittoria davvero grande per AMD
Asus ExpertBook PM3406: AMD Ryzen AI 7 350, 14.00", 1.4 kg
» L'Asus ExpertBook PM3 è una buona alternativa al ThinkPad E14 di Lenovo
HP OmniBook 7 Aero 13-bg1077nr: AMD Ryzen AI 7 350, 13.30", 1 kg
» HP OmniBook 7 Aero 13 ha appena 4 mesi di vita ed è già scontato del 40%
» L'HP OmniBook 7 Aero 13 da 1 kg è impressionante, ma ci sono alcuni compromessi
Lenovo ThinkPad X13 G6 AMD: AMD Ryzen AI 7 PRO 350, 13.30", 1.1 kg
» Il ThinkPad X13 G6 di Lenovo non è altrettanto valido quanto il Dell Pro 13 Premium
» Il ThinkPad X13 G6 di Lenovo è compatto, ma la tastiera e le cerniere del display sono punti deboli
Lenovo ThinkPad T16 Gen 4 21QQS06M00: AMD Ryzen AI 7 PRO 350, 16.00", 2 kg
» Il ThinkPad T16 Gen 4 AMD di Lenovo offre ampi margini di miglioramento
Acer Swift Go 16 AI SFG16-61-R5Y5: AMD Ryzen AI 7 350, 16.00", 1.5 kg
» Esecuzione di AI a livello locale: Acer Swift Go 16 AI testato con Diffusione Stabile, ChatGPT, Gemma3 e altri
Lenovo ThinkPad T16 Gen 4 21QQS06M00: AMD Ryzen AI 7 PRO 350, 16.00", 2 kg
» AMD ThinkPad T16 offre un set completo di funzionalità, tra cui Thunderbolt 4
» Lenovo offre solo il costoso laptop business ThinkPad T16 Gen 4 AMD con schermi da 60 Hz
Asus ZenBook 14 OLED UM3406K, Ryzen AI 7 350: AMD Ryzen AI 7 350, 14.00", 1.2 kg
» Intel ZenBook 14 OLED è dotato di Wi-Fi 7 - ma la versione AMD offre velocità di trasferimento più elevate
» Lo ZenBook 14 è migliore con Intel o AMD quest'anno?
HP EliteBook 8 G1a 16 AI: AMD Ryzen AI 7 PRO 350, 16.00", 1.9 kg
» EliteBook 8 G1a 16: la configurazione touchscreen è da escludere se le interessa l'accuratezza del colore
» HP EliteBook 8 G1a 16 è un aggiornamento significativo rispetto all'EliteBook 865 G10, tranne che in un aspetto chiave
Asus ExpertCenter PN54-S70012NN: AMD Ryzen AI 7 350, 0.7 kg
» Asus ExpertCenter PN54 recensito - cosa può fare davvero il mini PC con AMD Ryzen AI 7 350 nella vita di tutti i giorni
Dell 14 Plus 2-in-1: AMD Ryzen AI 7 350, 14.00", 1.6 kg
» La versione AMD di Dell 14 Plus 2-in-1 è più veloce di quella Intel, ma c'è una fregatura
Lenovo Yoga Slim 7 14AKP G10: AMD Ryzen AI 7 350, 14.00", 1.2 kg
» I nuovi schermi OLED di Lenovo sono eccellenti, ma la qualità del telaio dello Yoga Slim 7 14 lascia molto a desiderare
Lenovo IdeaPad 5 2-in-1 14AKP10 83KT0033GE: AMD Ryzen AI 7 350, 14.00", 1.5 kg
» Attenzione alla variante economica: Il computer portatile convertibile Lenovo IdeaPad 5 2-in-1 mostra i rischi delle configurazioni più economiche