Intel HD Graphics 530
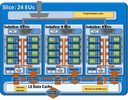
L'Intel HD Graphics 530 (GT2) è un'unità grafica integrata, che si trova su vari processori desktop e notebook della generazione Skylake. La versione "GT2" della GPU Skylake offre 24 Execution Units (EUs) con clock fino a 1150 MHz (in base al modello di CPU). A causa dell'assenza di memoria grafica dedicata o di cache eDRAM, l'HD 530 deve accedere alla memoria principale (2x 64bit DDR3L-1600 / DDR4-2133).
Le esatte prestazioni della HD Graphics 530 dipendono da vari fattori come TDP, L3 Cache, memoria (DDR3/DDR4) e il clock rate massimo del singolo modello. La versione più veloce (Core i7-6700K) compete con la GeForce 920M dedicata ed è in grado di gestire i giochi attuali (2015) con settaggi medi o bassi.
Il motore video rielaborato ora decodifica H.265/HEVC completamente con l'hardware e quindi è molto più efficiente rispetto a prima. E' possibile collegare displays tramite DP 1.2 / eDP 1.3 (max. 3840 x 2160 @ 60 Hz), mentre l'HDMI è limitata alla vecchia versione 1.4a (max. 3840 x 2160 @ 30 Hz). Tuttavia, l'HDMI 2.0 può essere aggiunto utilizzando un converter DisplayPort. Possono essere controllati fino a tre displays simultaneamente.
L'HD Graphics 530 si trova su molti processori notebook e desktop di varie classi TDP (35 - 91 W).
Gen. 9 Serie Nome in codice Skylake GT2 Architettura Gen. 9 Skylake Pipelines 24 - unified Velocità del core 350 - 1150 (Boost) MHz Larghezza del bus di memoria 64/128 Bit Memoria condivisa si API DirectX 12_1, OpenGL 4.4 tecnologia 14 nm Caratteristiche QuickSync Data dell'annuncio 05.08.2015
CPU in HD Graphics 530 GPU Base Speed GPU Boost / Turbo Intel Core i7-6700K 4 x 4000 MHz, 91 W 350 MHz 1150 MHz Intel Core i7-6700 4 x 3400 MHz, 65 W 350 MHz 1150 MHz Intel Core i7-6920HQ 4 x 2900 MHz, 45 W 350 MHz 1050 MHz » show 14 more Intel Core i5-6600K 4 x 3500 MHz, 91 W 350 MHz 1150 MHz Intel Core i7-6820HK 4 x 2700 MHz, 45 W 350 MHz 1050 MHz Intel Core i7-6820HQ 4 x 2700 MHz, 45 W 350 MHz 1050 MHz Intel Core i7-6700T 4 x 2800 MHz, 35 W 350 MHz 1100 MHz Intel Core i7-6700HQ 4 x 2600 MHz, 45 W 350 MHz 1050 MHz Intel Core i5-6500 4 x 3200 MHz, 65 W 350 MHz 1050 MHz Intel Core i5-6600T 4 x 2700 MHz, 35 W 350 MHz 1100 MHz Intel Core i5-6440HQ 4 x 2600 MHz, 45 W 350 MHz 950 MHz Intel Core i5-6300HQ 4 x 2300 MHz, 45 W 350 MHz 950 MHz Intel Core i5-6400 4 x 2700 MHz, 65 W 350 MHz 950 MHz Intel Core i5-6500T 4 x 2500 MHz, 35 W 350 MHz 1100 MHz Intel Core i5-6400T 4 x 2200 MHz, 35 W 350 MHz 950 MHz Intel Core i3-6100H 2 x 2700 MHz, 35 W 350 MHz 900 MHz Intel Pentium G4500T 2 x 3000 MHz, 35 W 350 MHz 950 MHz min. - max. 350 MHz 900 - 1150 MHz
Benchmark Performance Rating - 3DMark 11 + Fire Strike + Time Spy
4.2 pt (5%)
...
AMD Radeon R5 (Bristol Ridge) -2%
AMD FirePro W4190M -1%
Intel UHD Graphics Xe 16EUs (Tiger Lake-H) 2%
AMD Radeon R7 M445 3%
...
3DMark - 3DMark Time Spy Score
271 Points (1%)
...
AMD Radeon R4 (Stoney Ridge) -16%
Intel UHD Graphics 615 2%
Intel UHD Graphics 617 25%
...
3DMark - 3DMark Time Spy Graphics
235 Points (1%)
...
AMD Radeon R4 (Stoney Ridge) -13%
Intel UHD Graphics 615 4%
Intel UHD Graphics 617 27%
...
3DMark - 3DMark Ice Storm Unlimited Graphics
min: 72022 media: 80242 media: 80241.5 (11%) massimo: 88461 Points
...
Intel UHD Graphics 617 -4%
Intel Iris Plus Graphics G4 (Ice Lake 48 EU) 3%
...
3DMark - 3DMark Ice Storm Extreme Graphics
min: 33064 media: 38022 media: 33851 (5%) massimo: 47150 Points
...
NVIDIA Quadro P2000 Max-Q -4%
AMD Radeon R5 (Bristol Ridge) -3%
NVIDIA GeForce GTX 1050 Ti Max-Q 4%
AMD Radeon R6 M340DX 6%
...
NVIDIA GeForce RTX 3080 Laptop GPU 992%
3DMark - 3DMark Cloud Gate Score
min: 5731 media: 7593 media: 7652 (9%) massimo: 10384 Points
...
AMD FirePro W4190M 0%
...
3DMark - 3DMark Cloud Gate Graphics
min: 6155 media: 7859 media: 7500 (3%) massimo: 10598 Points
...
AMD Radeon R5 (Bristol Ridge) 5%
...
3DMark - 3DMark Fire Strike Standard Score
min: 637 media: 876 media: 878 (2%) massimo: 1112 Points
...
Intel UHD Graphics 617 2%
Intel HD Graphics 630 2%
AMD Radeon R5 (Carrizo) 3%
...
3DMark - 3DMark Fire Strike Standard Graphics
min: 672 media: 941 media: 935 (2%) massimo: 1202 Points
...
AMD Radeon R5 M315 -2%
Intel HD Graphics 630 3%
Intel UHD Graphics 617 6%
AMD Radeon R5 (Carrizo) 6%
...
3DMark - 3DMark Ice Storm Graphics
min: 49675 media: 69987 media: 61056.5 (8%) massimo: 93641 Points
...
NVIDIA GeForce RTX 2070 Super Max-Q -4%
Intel Iris Plus Graphics G7 (Ice Lake 64 EU) 1%
NVIDIA Quadro P520 2%
NVIDIA GeForce GTX 1050 Ti Max-Q 5%
NVIDIA Quadro M600M 5%
...
3DMark 11 - 3DM11 Performance Score
min: 1327 media: 1560 media: 1579 (3%) massimo: 1761 Points
...
AMD Radeon HD 6755G2 -3%
...
3DMark 11 - 3DM11 Performance GPU
min: 1162 media: 1355 media: 1362 (2%) massimo: 1549 Points
...
AMD Radeon HD 6720G2 9%
...
3DMark Vantage 3DM Vant. Perf. total + 3DMark Vantage - 3DM Vant. Perf. total
min: 5376 media: 6414 media: 6831 (2%) massimo: 7036 Points
...
...
3DM Vant. Perf. GPU no PhysX + 3DMark Vantage - 3DM Vant. Perf. GPU no PhysX
min: 4345 media: 5173 media: 5520 (4%) massimo: 5653 Points
...
...
3DMark 03 - 3DMark 03 - Standard
16802 Points (9%)
VIA S3 Graphics ProSavage8 -100%
...
...
3DMark 05 - 3DMark 05 - Standard
13920 Points (19%)
Intel Graphics Media Accelerator (GMA) 500 -99%
...
ATI Mobility Radeon HD 5165 -5%
ATI Mobility Radeon HD 5730 -1%
...
3DMark 06 3DMark 06 - Standard 1280x1024 +
min: 8504 media: 10716 media: 11309 (17%) massimo: 11840 Points
...
Intel Iris Plus Graphics G4 (Ice Lake 48 EU) 1%
Intel UHD Graphics G1 (Ice Lake 32 EU) 2%
Intel UHD Graphics Xe G4 48EUs 3%
...
SPECviewperf 11 specvp11 snx-01 + SPECviewperf 11 - specvp11 snx-01
min: 2.38 media: 2.5 media: 2.5 (2%) massimo: 2.54 fps
...
Intel HD Graphics 630 13%
...
specvp11 tcvis-02 + SPECviewperf 11 - specvp11 tcvis-02
min: 3.28 media: 3.4 media: 3.4 (6%) massimo: 3.52 fps
...
AMD Radeon R7 M260 -3%
...
specvp11 sw-02 + SPECviewperf 11 - specvp11 sw-02
min: 16.01 media: 16.7 media: 16.7 (20%) massimo: 17.47 fps
...
AMD Radeon HD 6730M 11%
...
specvp11 proe-05 + SPECviewperf 11 - specvp11 proe-05
min: 2.54 media: 2.7 media: 2.7 (11%) massimo: 2.76 fps
...
NVIDIA GeForce GTX 1050 Ti Mobile 7%
...
specvp11 maya-03 + SPECviewperf 11 - specvp11 maya-03
min: 21.9 media: 22.3 media: 22.2 (17%) massimo: 22.59 fps
...
NVIDIA GeForce GTX 1050 Ti Mobile -9%
Intel HD Graphics 630 10%
...
specvp11 lightwave-01 + SPECviewperf 11 - specvp11 lightwave-01
min: 22.54 media: 23.3 media: 23.3 (25%) massimo: 24.05 fps
...
NVIDIA GeForce GTX 1050 Ti Mobile -6%
AMD Radeon HD 6730M 4%
AMD Radeon HD 6970M 8%
Intel HD Graphics 630 10%
...
specvp11 ensight-04 + SPECviewperf 11 - specvp11 ensight-04
min: 3.2 media: 3.3 media: 3.3 (2%) massimo: 3.39 fps
...
Intel HD Graphics 630 11%
...
Cinebench R10 Cinebench R10 Shading (32bit) + Cinebench R10 - Cinebench R10 Shading (32bit)
min: 7523 media: 8622 media: 8926 (38%) massimo: 9569 punti
Intel Graphics Media Accelerator (GMA) 500 -100%
...
AMD Radeon Pro WX 3100 -2%
NVIDIA GeForce GTX 680M -1%
...
Cinebench R11.5 Cinebench R11.5 OpenGL 64 Bit + Cinebench R11.5 - Cinebench R11.5 OpenGL 64 Bit
min: 35.45 media: 41 media: 40.5 (15%) massimo: 46.98 fps
...
AMD Radeon RX Vega 8 (Ryzen 2000/3000) 0%
AMD Radeon R7 M445 2%
...
Cinebench R15 Cinebench R15 OpenGL 64 Bit + Cinebench R15 - Cinebench R15 OpenGL 64 Bit
min: 34.51 media: 41.7 media: 42.3 (11%) massimo: 47.32 fps
...
Intel UHD Graphics 617 -6%
AMD Radeon RX Vega 10 5%
AMD Radeon R7 M445 10%
AMD Radeon RX Vega 8 (Ryzen 2000/3000) 10%
...
Cinebench R15 OpenGL Ref. Match 64 Bit + Cinebench R15 - Cinebench R15 OpenGL Ref. Match 64 Bit
min: 97.8 media: 97.8 media: 97.8 (98%) massimo: 97.9 %
...
Intel UHD Graphics G1 (Ice Lake 32 EU) 0%
Intel UHD Graphics Xe G4 48EUs 0%
Intel UHD Graphics Xe 32EUs (Tiger Lake-H) 0%
Intel UHD Graphics Xe 750 32EUs (Rocket Lake) 0%
...
GFXBench 3.0 - GFXBench 3.0 Manhattan
50.1 fps (14%)
...
AMD Radeon RX 550X (Laptop) 4%
AMD Radeon RX Vega 9 15%
NVIDIA GeForce GTX 1050 Ti Max-Q 16%
...
GFXBench 3.0 - GFXBench 3.0 Manhattan Offscreen
60.6 fps (5%)
...
Intel HD Graphics 630 -22%
AMD Radeon Pro 560 16%
...
Apple M1 Max 32-Core GPU 1925%
ComputeMark v2.1 - ComputeMark v2.1 Result
868 punti (2%)
...
Intel UHD Graphics Xe 16EUs (Tiger Lake-H) -8%
Intel UHD Graphics 615 -1%
AMD FirePro W5130M 3%
AMD FirePro W4190M 4%
...
Power Consumption - Furmark Stress Test Power Consumption - external Monitor *
52 Watt (8%)
...
AMD Radeon Pro 455 8%
NVIDIA Quadro M600M 14%
Intel UHD Graphics Xe 750 32EUs (Rocket Lake) 16%
AMD Radeon Pro 555 17%
...
Power Consumption - The Witcher 3 Power Consumption - external Monitor *
min: 34.1 media: 36.7 media: 37.1 (5%) massimo: 39 Watt
...
AMD Radeon RX Vega 10 -12%
Intel UHD Graphics Xe 32EUs (Tiger Lake-H) -11%
AMD Radeon RX Vega 7 -9%
Apple M2 10-Core GPU -6%
AMD Radeon RX Vega 8 (Ryzen 2000/3000) 4%
AMD Radeon 680M 9%
AMD Radeon RX Vega 9 10%
Apple M1 Max 32-Core GPU 12%
Intel HD Graphics 630 13%
...
- Valori di benchmark per questa scheda grafica
- Valori medi di benchmark per questa scheda grafica
* Numeri più piccoli rappresentano prestazioni supeiori
Benchmarks per i giochi I seguenti benchmarks deirivano dai benchmarks dei portatili recensiti. Le prestazioni dipendono dalla scheda grafica utilizzata, dal clock rate, dal processore, dai settaggi di sistema, dai drivers, e dai sistemi operativi. Quindi i risultati non sono rappresentativi per i portatili con questa GPU. Per informazioni dettagliate sui risultati del benchmark, cliccate sul numero di fps.
AMD Radeon R5 (Bristol Ridge) -30%
Intel HD Graphics 630 3%
AMD Radeon RX Vega 10 65%
...
» Il Benchmark indica che il gioco non è utilizzabile con i settaggi testati.
...
Intel UHD Graphics 615 -36%
AMD Radeon R5 (Bristol Ridge) -24%
Intel HD Graphics 630 -6%
AMD Radeon RX Vega 10 39%
AMD Radeon RX Vega 8 (Ryzen 2000/3000) 115%
...
» Il Benchmark indica che il gioco non è utilizzabile con i settaggi testati.
...
Intel UHD Graphics 615 -28%
AMD Radeon R5 (Bristol Ridge) -11%
Intel Iris Plus Graphics G7 (Ice Lake 64 EU) 22%
...
» Il Benchmark indica che il gioco non è utilizzabile con i settaggi testati.
...
AMD Radeon R5 (Bristol Ridge) -47%
Intel UHD Graphics 615 -33%
Intel HD Graphics 630 -8%
...
...
Intel UHD Graphics 615 -9%
Intel HD Graphics 630 -9%
AMD Radeon RX Vega 10 52%
...
» Il Benchmark indica che il gioco non è utilizzabile con i settaggi testati.
...
AMD Radeon R5 (Bristol Ridge) -55%
Intel HD Graphics 630 -1%
AMD Radeon RX Vega 10 23%
...
AMD Radeon Pro 555 194%
» Il Benchmark indica che il gioco non è utilizzabile con i settaggi testati.
...
Intel UHD Graphics 615 -54%
Intel UHD Graphics Xe 16EUs (Tiger Lake-H) 38%
Intel UHD Graphics G1 (Ice Lake 32 EU) 38%
Intel Iris Plus Graphics G4 (Ice Lake 48 EU) 46%
...
Intel UHD Graphics Xe 16EUs (Tiger Lake-H) 33%
Intel Iris Plus Graphics G4 (Ice Lake 48 EU) 83%
Intel Iris Plus Graphics G7 (Ice Lake 64 EU) 100%
...
» Il Benchmark indica che il gioco non è utilizzabile con i settaggi testati.
...
AMD Radeon R5 (Bristol Ridge) -33%
Intel HD Graphics 630 9%
AMD Radeon RX Vega 10 74%
...
» Il Benchmark indica che il gioco non è utilizzabile con i settaggi testati.
...
Intel UHD Graphics 615 -34%
AMD Radeon R4 (Stoney Ridge) -27%
AMD Radeon R5 (Bristol Ridge) -14%
Intel HD Graphics 630 5%
...
NVIDIA GeForce RTX 2080 Super Mobile 1991%
» Il Benchmark indica che il gioco non è utilizzabile con i settaggi testati.
Intel UHD Graphics 615 -65%
...
AMD Radeon R5 (Bristol Ridge) -35%
Intel Iris Plus Graphics G4 (Ice Lake 48 EU) -12%
AMD Radeon RX Vega 9 7%
AMD Radeon RX Vega 10 26%
...
...
AMD Radeon R5 (Bristol Ridge) -54%
Intel Iris Plus Graphics G4 (Ice Lake 48 EU) -37%
AMD Radeon RX Vega 9 14%
Intel HD Graphics 630 24%
...
» Giocabile con tutti i portatili testati con dettagli basso.
...
Intel HD Graphics 630 5%
...
Intel HD Graphics 630 28%
...
...
...
» Giocabile con tutti i portatili testati con dettagli basso.
AMD Radeon RX Vega 8 (Ryzen 2000/3000) 66%
AMD FirePro W4190M 120%
AMD Radeon Pro 450 193%
...
» Il Benchmark indica che il gioco non è utilizzabile con i settaggi testati.
...
AMD Radeon R5 (Bristol Ridge) -40%
AMD Radeon RX Vega 10 -13%
Intel HD Graphics 630 8%
...
...
AMD Radeon R5 (Bristol Ridge) -18%
AMD Radeon RX Vega 10 -12%
AMD FirePro W4190M 6%
AMD Radeon Pro WX 3100 24%
AMD Radeon RX Vega 8 (Ryzen 2000/3000) 69%
...
» Il Benchmark indica che il gioco non è utilizzabile con i settaggi testati.
...
» Il Benchmark indica che il gioco non è utilizzabile con i settaggi testati.
...
Intel UHD Graphics G1 (Ice Lake 32 EU) -16%
Intel Iris Plus Graphics G4 (Ice Lake 48 EU) 3%
AMD Radeon RX 560X (Laptop) 6%
Intel Iris Plus Graphics G7 (Ice Lake 64 EU) 8%
...
AMD Radeon Pro 560X 90%
...
Intel UHD Graphics G1 (Ice Lake 32 EU) -18%
Intel Iris Plus Graphics G4 (Ice Lake 48 EU) 3%
Intel Iris Plus Graphics G7 (Ice Lake 64 EU) 12%
AMD Radeon RX 560X (Laptop) 14%
...
AMD Radeon Pro 560X 113%
...
AMD Radeon RX Vega 10 -28%
Intel UHD Graphics 615 -24%
AMD Radeon R5 (Bristol Ridge) -19%
Intel UHD Graphics G1 (Ice Lake 32 EU) 17%
...
AMD Radeon Pro 560X 330%
AMD Radeon R5 (Bristol Ridge) 11%
Intel UHD Graphics G1 (Ice Lake 32 EU) 22%
Intel HD Graphics 630 49%
Intel Iris Plus Graphics G4 (Ice Lake 48 EU) 52%
Intel Iris Plus Graphics G7 (Ice Lake 64 EU) 52%
...
AMD Radeon Pro 560X 602%
» Giocabile con tutti i portatili testati con dettagli alto.
...
AMD Radeon RX Vega 10 -9%
AMD Radeon R5 (Bristol Ridge) -6%
Intel HD Graphics 630 5%
...
» Giocabile con tutti i portatili testati con dettagli basso.
...
AMD Radeon R4 (Stoney Ridge) -43%
Intel UHD Graphics 615 -25%
Intel UHD Graphics 617 11%
Intel Iris Plus Graphics G4 (Ice Lake 48 EU) 11%
...
...
Intel UHD Graphics 617 -14%
Intel Iris Plus Graphics G4 (Ice Lake 48 EU) 8%
Intel HD Graphics 630 12%
...
...
Intel UHD Graphics 617 -12%
Intel HD Graphics 630 6%
Intel UHD Graphics G1 (Ice Lake 32 EU) 13%
Intel Iris Plus Graphics G4 (Ice Lake 48 EU) 27%
...
» Giocabile con tutti i portatili testati con dettagli basso.
...
Intel UHD Graphics 615 -40%
AMD Radeon R5 (Bristol Ridge) -19%
Intel HD Graphics 630 22%
AMD Radeon R7 M340 48%
...
» Il Benchmark indica che il gioco non è utilizzabile con i settaggi testati.
...
AMD Radeon R5 (Bristol Ridge) -57%
AMD Radeon RX Vega 8 (Ryzen 2000/3000) 43%
Apple M1 7-Core GPU 46%
...
» Il Benchmark indica che il gioco non è utilizzabile con i settaggi testati.
Intel HD Graphics 630 15%
...
» Il Benchmark indica che il gioco non è utilizzabile con i settaggi testati.
...
AMD Radeon R5 (Bristol Ridge) -5%
Intel UHD Graphics G1 (Ice Lake 32 EU) -3%
Intel HD Graphics 630 10%
Intel Iris Plus Graphics G4 (Ice Lake 48 EU) 13%
Intel Iris Plus Graphics G7 (Ice Lake 64 EU) 22%
...
» Il Benchmark indica che il gioco non è utilizzabile con i settaggi testati.
...
AMD Radeon R5 (Bristol Ridge) -13%
Intel HD Graphics 630 12%
Intel UHD Graphics G1 (Ice Lake 32 EU) 19%
...
AMD Radeon R5 (Bristol Ridge) -19%
Intel HD Graphics 630 23%
Intel UHD Graphics G1 (Ice Lake 32 EU) 26%
...
» Il Benchmark indica che il gioco non è utilizzabile con i settaggi testati.
...
AMD FirePro W4190M -18%
AMD Radeon R4 (Stoney Ridge) -16%
Intel HD Graphics 630 18%
AMD Radeon R5 (Bristol Ridge) 34%
...
AMD FirePro W4190M -12%
Intel HD Graphics 630 20%
...
» Il Benchmark indica che il gioco non è utilizzabile con i settaggi testati.
Additional Benchmarks
Medium / Off FXAA 1366x768
21.6 [X] MSI GE72 965M Ti Intel Core i7-6700HQ 2.6GHz
HD Graphics 530
min:
15 fps, max:
27 fps
Intel HD Graphics 630 9%
AMD Radeon RX Vega 8 (Ryzen 2000/3000) 86%
AMD Radeon R7 M445 90%
...
» Il Benchmark indica che il gioco non è utilizzabile con i settaggi testati.
Intel HD Graphics 630 35%
AMD Radeon RX Vega 10 75%
AMD Radeon R7 M445 93%
...
» Il Benchmark indica che il gioco non è utilizzabile con i settaggi testati.
...
AMD Radeon RX Vega 10 -13%
AMD Radeon RX Vega 8 (Ryzen 2000/3000) 14%
Intel HD Graphics 630 18%
...
...
Intel HD Graphics 630 14%
...
...
...
...
AMD Radeon R7 M445 -17%
Intel HD Graphics 630 7%
AMD Radeon RX Vega 8 (Ryzen 2000/3000) 29%
...
AMD Radeon Pro 555 290%
AMD Radeon Pro 455 293%
AMD Radeon Pro 560X 364%
...
» Giocabile con tutti i portatili testati con dettagli medio.
Additional Benchmarks
Medium Preset 1920x1080
35.3 [X] MSI GE72 965M Ti Intel Core i7-6700HQ 2.6GHz
HD Graphics 530
min:
32 fps, max:
45 fps
AMD Radeon R4 (Stoney Ridge) -72%
...
Intel HD Graphics 630 14%