Recensioni Notebook con Intel Graphics 4-Core iGPU (Meteor / Arrow Lake) la scheda grafica
Recensione del Ninkear S13: Tablet Windows con Core Ultra 5 nel design del Surface Pro
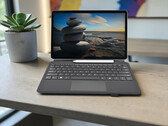
Con Ninkear S13, il produttore lancia un tablet Windows versatile con tastiera staccabile e Intel Core Ultra 5 115U. Il dispositivo combina un fattore di forma produttivo da 13 pollici con un hardware moderno e si rivolge principalmente agli utenti che desiderano lavorare in modo flessibile in movimento. Ma come si comporta il dispositivo 2-in-1 nell'uso quotidiano in termini di prestazioni, display, mobilità e durata della batteria? Il nostro test fornisce le risposte.
Intel Core Ultra 5 115U, Graphics 4-Core iGPU (Arrow Lake), 13", 870 grRecensione del portatile LG Gram Book 15U55T: Troppi angoli tagliati
Puntando alla categoria economica, il Gram Book 15 perde tutti i punti di forza che rendono la serie Gram così speciale. Le poche qualità da riscattare non sono sufficienti a rendere il sistema facilmente raccomandabile.
Intel Core Ultra 7 255U, Graphics 4-Core iGPU (Arrow Lake), 15.6", 1.6 kgRecensione del GMK NucBox K15: economico Mini PC con un design sovradimensionato
L'Intel Core Ultra 5 125U non richiede molto raffreddamento, ma se lo abbina a un design del telaio più grande del solito, il sistema risultante fa appena un rumore.
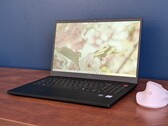
Intel Core Ultra 5 125U, Graphics 4-Core iGPU (Arrow Lake), 885 grRecensione del Minisforum MS-02 Ultra: Workstation come mini PC con Intel Core Ultra, PCIe e rete ad alta velocità
Il Minisforum MS-02 Ultra combina il potente hardware Intel Core Ultra con una gamma eccezionalmente ampia di funzioni in un formato compatto. Grazie alla sua elevata potenza di calcolo, all'accelerazione AI integrata e alle versatili opzioni di espansione e di rete, si rivolge agli utenti più esigenti. MS-02 Ultra 2025 appartiene alla classe superiore dei mini PC? Il nostro test fornisce le risposte.
Intel Core Ultra 9 285HX, Graphics 4-Core iGPU (Arrow Lake), 3.5 kgRecensione del notebook Lenovo ThinkPad X1 Carbon Gen 13: rinuncia all'efficienza con il 5G opzionale e Lunar Lake con Arrow Lake
Abbiamo già testato il Lenovo ThinkPad X1 Carbon Gen 13, ma solo il modello con Intel Lunar Lake e lo schermo OLED. Molti clienti ci chiedono: E la versione Arrow Lake con display IPS, che spesso è più economica e più disponibile? L'abbiamo testata, per vedere quali sono le differenze.
Intel Core Ultra 5 225U, Graphics 4-Core iGPU (Arrow Lake), 14", 1.2 kgHP Omnibook 5 16-af1037nr: Intel Core Ultra 7 255U, 16.00", 1.7 kg
recensione » Recensione del portatile HP Omnibook 5 16: Solo l'essenziale ad un prezzo economico
HP 17t-cn500: Intel Core Ultra 7 255U, 17.30", 2.1 kg
recensione » Recensione del portatile HP 17t-cn500: Grande schermo per la multimedialità di base
HP EliteBook 8 Flip G1i 13: Intel Core Ultra 7 265U, 13.30", 1.4 kg
recensione » Recensione del convertibile HP EliteBook 8 Flip G1i 13: Comodo e super efficiente
Lenovo ThinkPad T14s 2in1 Gen1: Intel Core Ultra 7 255U, 14.00", 1.4 kg
recensione » Recensione del Lenovo ThinkPad T14s 2-in-1 Gen1 - questo nuovo convertibile per il business solleva delle domande
Lenovo IdeaPad 5 2-in-1 16IAL10: Intel Core Ultra 7 255U, 16.00", 2.1 kg
recensione » Recensione del Lenovo IdeaPad 5 2-in-1 16IAL10: Un convertibile con grande schermo e Intel Arrow Lake
Asus ExpertBook B5 B5404CMA: Intel Core Ultra 7 155U, 14.00", 1.3 kg
recensione » Recensione del portatile Asus ExpertBook B5 B5404CMA: Un portatile business convincente con una batteria che dura tutto il giorno, ma che trascura un aspetto importante
Lenovo ThinkPad E16 G3-21SSS00F00: Intel Core Ultra 5 225U, 16.00", 1.7 kg
recensione » Recensione del Lenovo ThinkPad E16 G3 - economico portatile da ufficio migliorato da un display da 120 Hz
Durabook S14I G3: Intel Core Ultra 7 165U, 14.00", 2.7 kg
recensione » Recensione del portatile industriale Durabook S14I: Costruito per gli estremi
HP Envy x360 15 fe1071cl: Intel Core Ultra 7 155U, 15.60", 1.9 kg
recensione » Recensione del convertibile HP Envy x360 15 Core Ultra 7: Deludente per il prezzo
Lenovo ThinkPad L13 2in1 G5 21LNS4AM00: Intel Core Ultra 5 125U, 13.30", 1.3 kg
recensione » Recensione del Lenovo ThinkPad L13 2-in-1 G5 - Un 2-in-1 business con touchscreen opaco
Acer Aspire Spin 14 ASP14-52MTN-51V5: Intel Core Ultra 5 115U, 14.00", 1.6 kg
recensione » Recensione dellAcer Aspire Spin 14: Il folle mondo dei computer portatili 2-in-1
Lenovo ThinkPad X12 Detachable G2: Intel Core Ultra 5 134U, 12.30", 1.1 kg
recensione » Recensione del Lenovo ThinkPad X12 Detachable G2: Il versatile ibrido laptop-tablet per l'uso lavorativo quotidiano
Lenovo ThinkBook 16 G7 IML: Intel Core Ultra 5 125U, 16.00", 1.8 kg
recensione » Recensione del notebook Lenovo ThinkBook 16 G7 IML: economico ma professionale
Lenovo ThinkPad X13 2-in-1 Gen 5: Intel Core Ultra 7 165U, 13.30", 1.3 kg
recensione » Recensione del notebook Lenovo ThinkPad X13 2-in-1 Gen 5: Il successore del convertibile Yoga ad alte prestazioni
Lenovo ThinkPad E14 G6: Intel Core Ultra 7 155U, 14.00", 1.5 kg
recensione » Recensione del portatile Lenovo ThinkPad E14 G6: Risolve molti problemi del modello E14 G5
Lenovo ThinkPad T16 Gen 3 21MN005XGE: Intel Core Ultra 5 125U, 16.00", 2 kg
recensione » Recensione del notebook Lenovo ThinkPad T16 Gen 3: Grande schermo, grande batteria, ma prestazioni non altrettanto buone
Dell Latitude 7450 2-in-1: Intel Core Ultra 7 165U, 14.00", 1.5 kg
recensione » Recensione del portatile 2-in-1 Dell Latitude 7450: Versatile convertibile per il business che offre risultati eccellenti su quasi tutti i fronti
Dell Latitude 7350 Detachable: Intel Core Ultra 7 164U, 13.00", 0.9 kg
recensione » Recensione del Dell Latitude 7350 Detachable: Debutto delle prestazioni del Core Ultra 7 164U
Lenovo ThinkPad T14 G5 21ML005JGE: Intel Core Ultra 7 155U, 14.00", 1.5 kg
recensione » Recensione del portatile Lenovo ThinkPad T14 Gen 5 Intel: La RAM aggiornabile ritorna nella serie T
Lenovo Yoga 7 2-in-1 14IML9: Intel Core Ultra 5 125U, 14.00", 1.6 kg
recensione » Recensione del convertibile Lenovo Yoga 7 2-in-1 14IML9: Di classe per meno di 700 dollari
Lenovo ThinkPad T14s Gen 5 21LS001PGE: Intel Core Ultra 5 125U, 14.00", 1.3 kg
recensione » Recensione del notebook Lenovo ThinkPad T14s Gen 5: Il T-ThinkPad premium con Intel Core Ultra
Dell Latitude 13 7350: Intel Core Ultra 5 135U, 13.30", 1.1 kg
recensione » Recensione del portatile Dell Latitude 13 7350: Debutto delle prestazioni del Core Ultra 5 135U
HP Envy x360 2-in-1 14-fc0078TU: Intel Core Ultra 5 125U, 14.00", 1.4 kg
recensione » Recensione del portatile HP Envy x360 2-in-1 14 (2024): Un'esperienza convertibile quasi premium che ci lascia desiderare di più
Lenovo ThinkPad X1 2in1 G9 21KE004AGE: Intel Core Ultra 7 165U, 14.00", 1.3 kg
recensione » Recensione del Lenovo ThinkPad X1 2in1 G9 - Il convertibile business di fascia alta con OLED a 120 Hz e senza tasti TrackPoint
Lenovo ThinkBook 14 2-in-1 G4 IML: Intel Core Ultra 5 125U, 14.00", 1.6 kg
recensione » Recensione del Lenovo ThinkBook 14 2-in-1 G4 IML: Nuovo look elegante con Meteor Lake-U
Lenovo Yoga 7 2-in-1 16IML9: Intel Core Ultra 5 125U, 16.00", 2.1 kg
recensione » Recensione del convertibile Lenovo Yoga 7 2-in-1 16IML9: Debutto delle prestazioni del Core Ultra 5 125U
Lenovo Yoga Book 9 13IMU9: Intel Core Ultra 7 155U, 13.30", 1.4 kg
recensione » Recensione del Lenovo Yoga Book 9 13IMU9 2-in-1 a doppio schermo: Il Core Ultra 7 155U e l'Arc 4 sono un mix di prodotti
Dell Latitude 9450 2-in-1: Intel Core Ultra 7 165U, 14.00", 1.6 kg
recensione » Recensione di Dell Latitude 9450 2-in-1: Debutto delle prestazioni del Core Ultra 7 165U
Lenovo ThinkPad E16 G3-21SSS00F00: Intel Core Ultra 5 225U, 16.00", 1.7 kg
Recensioni esterne » Lenovo ThinkPad E16 G3-21SSS00F00 - Recensioni e Specifiche
Lenovo ThinkPad X13 G6, Core 7 255U: Intel Core Ultra 7 255U, 13.30", 1 kg
Recensioni esterne » Lenovo ThinkPad X13 G6, Core 7 255U
Lenovo ThinkPad T14 G6 Intel: Intel Core Ultra 5 225U, 14.00", 1.4 kg
Recensioni esterne » Lenovo ThinkPad T14 G6 Intel
HP ProBook 4 G1i 16: Intel Core Ultra 5 225U, 16.00", 1.7 kg
Recensioni esterne » HP ProBook 4 G1i 16
Samsung Galaxy Book5 15 NP750XHD: Intel Core Ultra 7 255U, 15.60", 1.6 kg
Recensioni esterne » Samsung Galaxy Book5 15 NP750XHD
HP Elitebook 6 G1i 13: Intel Core Ultra 5 225U, 13.30", 1.3 kg
Recensioni esterne » HP Elitebook 6 G1i 13
HP Omnibook 5 16-af1037nr: Intel Core Ultra 7 255U, 16.00", 1.7 kg
Recensioni esterne » HP Omnibook 5 16-af1037nr
Lenovo ThinkPad T14s 2in1 Gen1: Intel Core Ultra 7 255U, 14.00", 1.4 kg
Recensioni esterne » Lenovo ThinkPad T14s 2in1 Gen1
Lenovo ThinkPad X13 G6 Intel: Intel Core Ultra 5 225U, 13.30", 1 kg
Recensioni esterne » Lenovo ThinkPad X13 G6 Intel
Dell Pro 14 PC14250: Intel Core Ultra 7 255U, 14.00", 1.4 kg
Recensioni esterne » Dell Pro 14 PC14250
HP EliteBook 8 Flip G1i 13: Intel Core Ultra 7 265U, 13.30", 1.4 kg
Recensioni esterne » HP EliteBook 8 Flip G1i 13
Dynabook Portégé X40-M: Intel Core Ultra 5 225U, 14.00", 1.4 kg
Recensioni esterne » Dynabook Portégé X40-M
Lenovo IdeaPad 5 2-in-1 16IAL10: Intel Core Ultra 7 255U, 16.00", 2.1 kg
Recensioni esterne » Lenovo IdeaPad 5 2-in-1 16IAL10
HP OmniBook 7 AI 14-fr0000: Intel Core Ultra 5 225U, 14.00", 2.5 kg
Recensioni esterne » HP OmniBook 7 AI 14-fr0000
Dell Pro 16 PC16250: Intel Core Ultra 7 265U, 16.00", 1.9 kg
Recensioni esterne » Dell Pro 16 PC16250
Lenovo ThinkPad X13 2-in-1 Gen 5: Intel Core Ultra 7 165U, 13.30", 1.3 kg
Recensioni esterne » Lenovo ThinkPad X13 2-in-1 Gen 5
Acer Swift Neo AI 14 SFN14-54H: Intel Core Ultra 5 115U, 14.00", 1.3 kg
Recensioni esterne » Acer Swift Neo AI 14 SFN14-54H
Acer Swift Lite 14 AI SFL14-51M, Ultra 5 115U: Intel Core Ultra 5 115U, 14.00", 1.3 kg
Recensioni esterne » Acer Swift Lite 14 AI SFL14-51M, Ultra 5 115U
Lenovo ThinkPad T14s Gen 5 21LS001PGE: Intel Core Ultra 5 125U, 14.00", 1.3 kg
Recensioni esterne » Lenovo ThinkPad T14s Gen 5 21LS001PGE
Acer Swift Lite 16 AI SFL16-51M: Intel Core Ultra 7 155U, 16.00", 1.2 kg
Recensioni esterne » Acer Swift Lite 16 AI SFL16-51M
Acer Swift Go 14 OLED SFG14-73, Ultra 5 125U: Intel Core Ultra 5 125U, 14.00", 1.3 kg
Recensioni esterne » Acer Swift Go 14 OLED SFG14-73, Ultra 5 125U
Lenovo ThinkPad L13 G5: Intel Core Ultra 5 125U, 13.30", 1.2 kg
Recensioni esterne » Lenovo ThinkPad L13 G5
HP EliteBook 640 G11: Intel Core Ultra 7 155U, 14.00", 1.4 kg
Recensioni esterne » HP EliteBook 640 G11
HP Pavilion 16-af0075ng: Intel Core Ultra 5 125U, 16.00", 1.8 kg
Recensioni esterne » HP Pavilion 16-af0075ng
Lenovo ThinkPad E14 G6: Intel Core Ultra 7 155U, 14.00", 1.5 kg
Recensioni esterne » Lenovo ThinkPad E14 G6
Acer Chromebook Plus Spin 714-1H, Ultra 5 115U: Intel Core Ultra 5 115U, 14.00", 1.5 kg
Recensioni esterne » Acer Chromebook Plus Spin 714-1H, Ultra 5 115U
Asus ExpertBook CX5403, Ultra 5 115U: Intel Core Ultra 5 115U, 14.00", 1.4 kg
Recensioni esterne » Asus ExpertBook CX5403, Ultra 5 115U
Acer Swift Lite 14 AI SFL14-51M, Ultra 5 125U: Intel Core Ultra 5 125U, 14.00", 1.3 kg
Recensioni esterne » Acer Swift Lite 14 AI SFL14-51M, Ultra 5 125U
HP Probook 440 G11: Intel Core Ultra 5 125U, 14.00", 1.4 kg
Recensioni esterne » HP Probook 440 G11
HP Pavilion 16-af0000ng: Intel Core Ultra 5 125U, 16.00", 1.8 kg
Recensioni esterne » HP Pavilion 16-af0000ng
HP EliteBook 830 G11: Intel Core Ultra 7 155U, 13.30", 1.3 kg
Recensioni esterne » HP EliteBook 830 G11
HP EliteBook 840 G11: Intel Core Ultra 7 155U, 14.00", 1.4 kg
Recensioni esterne » HP EliteBook 840 G11
HP EliteBook 660 G11: Intel Core Ultra 7 155U, 16.00", 1.7 kg
Recensioni esterne » HP EliteBook 660 G11
Lenovo ThinkPad T14 G5, Ultra 5 125U: Intel Core Ultra 5 125U, 14.00", 1.4 kg
Recensioni esterne » Lenovo ThinkPad T14 G5, Ultra 5 125U
Lenovo ThinkPad X12 Detachable G2: Intel Core Ultra 5 134U, 12.30", 1.1 kg
Recensioni esterne » Lenovo ThinkPad X12 Detachable G2
Acer TravelMate P4 Spin 14 TMP414RN-54: Intel Core Ultra 5 125U, 14.00", 1.5 kg
Recensioni esterne » Acer TravelMate P4 Spin 14 TMP414RN-54
Lenovo ThinkPad T16 Gen 3 21MN005XGE: Intel Core Ultra 5 125U, 16.00", 2 kg
Recensioni esterne » Lenovo ThinkPad T16 Gen 3 21MN005XGE
Lenovo ThinkBook 14 G7 IML, Ultra 5 125U: Intel Core Ultra 5 125U, 14.00", 1.4 kg
Recensioni esterne » Lenovo ThinkBook 14 G7 IML, Ultra 5 125U
HP ProBook 460 G11: Intel Core Ultra 5 125U, 16.00", 1.7 kg
Recensioni esterne » HP ProBook 460 G11
Lenovo ThinkPad L14 G5: Intel Core Ultra 7 155U, 14.00", 1.4 kg
Recensioni esterne » Lenovo ThinkPad L14 G5
HP EliteBook 860 G11: Intel Core Ultra 7 155U, 16.00", 1.7 kg
Recensioni esterne » HP EliteBook 860 G11
Acer Swift Lite 14 AI SFL14-51M: Intel Core Ultra 7 155U, 14.00", 1.3 kg
Recensioni esterne » Acer Swift Lite 14 AI SFL14-51M
Dell Latitude 7450 2-in-1: Intel Core Ultra 7 155U, 14.00", 1.1 kg
Recensioni esterne » Dell Latitude 7450 2-in-1
Asus ExpertBook CX5403, Ultra 5 125U: Intel Core Ultra 5 125U, 14.00", 1.4 kg
Recensioni esterne » Asus ExpertBook CX5403, Core 5 125U
Lenovo ThinkBook 14 2-in-1 G4 IML, Ultra 7 155U: Intel Core Ultra 7 155U, 14.00", 1.6 kg
Recensioni esterne » Lenovo ThinkBook 14 2-in-1 G4 IML, Ultra 7 155U
Lenovo ThinkPad L16 G1, Ultra 5 125U: Intel Core Ultra 5 125U, 16.00", 1.8 kg
Recensioni esterne » Lenovo ThinkPad L16 G1, Ultra 5 125U
HP Pavilion 16-af0000: Intel Core Ultra 7 155U, 16.00", 1.8 kg
Recensioni esterne » HP Pavilion 16-af0000
Asus ExpertBook B5404CMA: Intel Core Ultra 7 155U, 14.00", 1.4 kg
Recensioni esterne » Asus ExpertBook B5404CMA
Asus Zenbook S 13 UX5304MA: Intel Core Ultra 7 155U, 13.30", 1 kg
Recensioni esterne » Asus Zenbook S 13 UX5304MA
Lenovo ThinkPad X13 2-in-1 G5: Intel Core Ultra 7 155U, 13.30", 1.3 kg
Recensioni esterne » Lenovo ThinkPad X13 2-in-1 G5
Lenovo ThinkPad T14 G5 21ML005JGE: Intel Core Ultra 7 155U, 14.00", 1.5 kg
Recensioni esterne » Lenovo ThinkPad T14 G5 21ML005JGE
Dell Latitude 5450: Intel Core Ultra 7 155U, 14.00", 1.4 kg
Recensioni esterne » Dell Latitude 5450
Dell Latitude 5550: Intel Core Ultra 7 155U, 15.60", 1.6 kg
Recensioni esterne » Dell Latitude 5550
Dell Latitude 9450 2-in-1: Intel Core Ultra 7 165U, 14.00", 1.6 kg
Recensioni esterne » Dell Latitude 9450 2-in-1
Asus ExpertBook CX5403: Intel Core Ultra 7 155U, 14.00", 1.4 kg
Recensioni esterne » Asus ExpertBook CX5403
Dell Latitude 7350 Detachable 2024: Intel Core Ultra 7 164U, 13.30", 0.9 kg
Recensioni esterne » Dell Latitude 7350 Detachable 2024
Dell Latitude 13 7350, Ultra 7 165U: Intel Core Ultra 7 165U, 13.30", 1.3 kg
Recensioni esterne » Dell Latitude 13 7350, Ultra 7 165U
Lenovo ThinkBook 14 2-in-1 G4 IML: Intel Core Ultra 5 125U, 14.00", 1.6 kg
Recensioni esterne » Lenovo ThinkBook 14 2-in-1 G4 IML
Acer Aspire Vero AV16-51P, Ultra 5 125U: Intel Core Ultra 5 125U, 16.00", 1.8 kg
Recensioni esterne » Acer Aspire Vero AV16-51P, Ultra 5 125U
Dell Latitude 7450: Intel Core Ultra 7 165U, 14.00", 1.5 kg
Recensioni esterne » Dell Latitude 7450
Acer Chromebook Plus Spin 714-1H: Intel Core Ultra 5 125U, 14.00", 1.5 kg
Recensioni esterne » Acer Chromebook Plus Spin 714-1H
Dell Latitude 13 7350: Intel Core Ultra 5 135U, 13.30", 1.1 kg
Recensioni esterne » Dell Latitude 13 7350
Lenovo ThinkPad X1 2in1 G9 21KE004AGE: Intel Core Ultra 7 165U, 14.00", 1.3 kg
Recensioni esterne » Lenovo ThinkPad X1 2in1 G9 21KE004AGE
HP Envy x360 14-fc: Intel Core Ultra 7 155U, 14.00", 1.4 kg
Recensioni esterne » HP Envy x360 14-fc
Asus ZenBook S13 OLED UX5304MA: Intel Core Ultra 7 155U, 13.30", 1 kg
Recensioni esterne » Asus ZenBook S13 OLED UX5304MA
Lenovo Yoga 7 16IML9: Intel Core Ultra 5 125U, 16.00", 2 kg
Recensioni esterne » Lenovo Yoga 7 16IML9
Microsoft Surface Pro 10: Intel Core Ultra 5 135U, 13.00", 0.9 kg
Recensioni esterne » Microsoft Surface Pro 10
Lenovo Yoga Book 9 13IMU9: Intel Core Ultra 7 155U, 13.30", 1.4 kg
Recensioni esterne » Lenovo Yoga Book 9 13IMU9
HP Envy x360 14-fc0000: Intel Core Ultra 5 125U, 14.00", 1.4 kg
Recensioni esterne » HP Envy x360 14-fc0000
Lenovo ThinkBook 14 IML G4: Intel Core Ultra 5 125U, 14.00", 1.6 kg
Recensioni esterne » Lenovo ThinkBook 14 IML G4
Acer Aspire Vero AV16-51P: Intel Core Ultra 7 155U, 16.00", 1.8 kg
Recensioni esterne » Acer Aspire Vero AV16-51P
Ninkear S13, 16+1TB: Intel Core Ultra 5 115U, 13.00", 0.9 kg
» Nuova prospettiva per il lavoro in mobilità: Ninkear S13 come tablet e laptop 2-in-1
LG Gram 15U55T: Intel Core Ultra 7 255U, 15.60", 1.6 kg
» LG Gram Book 15 sacrifica le prestazioni del processore per una ventola molto più silenziosa
» LG Gram Book 15 ha uno dei peggiori schermi IPS della serie
GMK NucBox K15: Intel Core Ultra 5 125U, 0.9 kg
» Il mini PC K15 di GMKtec baratta la compattezza con un funzionamento più silenzioso
Minisforum MS-02 Ultra: Intel Core Ultra 9 285HX, 3.5 kg
» Recensione di Minisforum MS-02 Ultra: Mini PC ad alte prestazioni per professionisti con fino a 256 GB di RAM, 25G LAN e PCIe
Lenovo ThinkPad X1 Carbon Gen 13 21NX008PGE: Intel Core Ultra 5 225U, 14.00", 1.2 kg
» Troppe opzioni di confusione: Perché Lenovo dovrebbe semplificare l'offerta di ThinkPad X1 Carbon
HP Omnibook 5 16-af1037nr: Intel Core Ultra 7 255U, 16.00", 1.7 kg
» HP OmniBook 5 16 vs. Dell 16 Plus: Lunar Lake-V fa la differenza
» HP OmniBook 5 16 non offre nulla di speciale, ma probabilmente è meglio così
HP 17t-cn500: Intel Core Ultra 7 255U, 17.30", 2.1 kg
» La serie economica HP 17t è ora in vendita con uno sconto di oltre la metà, a partire da soli 420 dollari
» Il Core Ultra 7 255U può essere molto più lento del Core Ultra 7 155U, a seconda del portatile
HP EliteBook 8 Flip G1i 13: Intel Core Ultra 7 265U, 13.30", 1.4 kg
» Core Ultra 7 265U vs. Core Ultra 7 165U: Quasi nessuna differenza di prestazioni tra loro
» HP EliteBook 8 Flip G1i 13 è migliore di EliteBook x360 830 G10 sotto quasi tutti i punti di vista
Lenovo ThinkPad T14s 2in1 Gen1: Intel Core Ultra 7 255U, 14.00", 1.4 kg
» Il processore Arrow Lake di Intel è la scelta peggiore per il Lenovo ThinkPad T14s 2-in-1
» Il nuovo convertibile business ThinkPad T14s 2-in-1 di Lenovo soffre per il display a 60 Hz
Lenovo IdeaPad 5 2-in-1 16IAL10: Intel Core Ultra 7 255U, 16.00", 2.1 kg
» Core Ultra 7 255U vs. Core Ultra 155U: i primi benchmark mostrano buoni miglioramenti delle prestazioni multi-thread
» Lenovo IdeaPad 2-in-1 16 con Intel Arrow Lake offre troppo poco per il suo prezzo
Lenovo ThinkPad E16 G3-21SSS00F00: Intel Core Ultra 5 225U, 16.00", 1.7 kg
» Il nuovo ThinkPad E16 G3 di Lenovo è attualmente il miglior computer portatile economico per l'ufficio
Lenovo ThinkPad T14 G5 21ML005JGE: Intel Core Ultra 7 155U, 14.00", 1.5 kg
» Lenovo ThinkPad T14 G5: un portatile business quasi perfetto