Intel HD Graphics (Haswell)

L'Intel HD Graphics (Haswell) è una scheda grafica integrata nei processori con nome in codice Haswell (Celeron e Pentium). Ha succeduto l'Intel HD Graphics nelle CPUs Ivy Bridge ed ha prestazioni leggermente migliori. In base al modello di processore, i clock rates base e turbo possono differire, con conseguenti variazioni delle prestazioni grafiche tra i vari modelli di CPU.
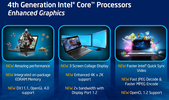
In confronto alla HD 4000, il core grafico è stato notevolmente modificato. La GPU supporta DirectX 11.1, OpenCL 1.2 ed OpenGL 4.0. Inoltre ha un decoder migliorato per videos 4K ed un video encoder Quick Sync (disattivato in molti modelli entry level).
Le prestazioni della HD Graphics (Haswell) sono simili alla vecchia HD Graphics 3000 o alla AMD Radeon HD 8250. Solo qualche gioco più recente come Dota 2 può risultare fluido con dettagli e risoluzione molto bassi.
Grazie al processo di produzione in 22nm 3D Tri-Gate, il consumo energetico dovrebbe essere relativamente basso (gli sviluppi si sono focalizzati sulle prestazioni per Watt). La GPU si può trovare nelle CPUs dual core ULV o normali (37 W).
Produttore | Intel |
HD Graphics Serie | |
Nome in codice | Haswell GT1 |
Architettura | Gen. 7.5 Haswell |
Pipelines | 10 - unified |
Velocità del core | 200 - 1000 (Boost) MHz |
Larghezza del bus di memoria | 64/128 Bit |
Memoria condivisa | si |
DirectX | DirectX 11.1, Shader 5.0 |
tecnologia | 22 nm |
Data dell'annuncio | 01.10.2012 |
CPU in HD Graphics (Haswell) | GPU Base Speed | GPU Boost / Turbo |
---|
Intel Pentium 3560M | 2 x 2400 MHz, 37 W | 400 MHz | 1100 MHz | Intel Pentium 3550M | 2 x 2300 MHz, 37 W | 400 MHz | 1100 MHz | Intel Celeron 2970M | 2 x 2200 MHz, 37 W | 400 MHz | 1100 MHz | » show 10 more | Intel Celeron 2950M | 2 x 2000 MHz, 37 W | 400 MHz | 1100 MHz | Intel Pentium 3558U | 2 x 1700 MHz, 15 W | 200 MHz | 1000 MHz | Intel Pentium 3556U | 2 x 1700 MHz, 15 W | 200 MHz | 1000 MHz | Intel Celeron 2981U | 2 x 1600 MHz, 15 W | 200 MHz | 1000 MHz | Intel Celeron 2980U | 2 x 1600 MHz, 15 W | 200 MHz | 1000 MHz | Intel Celeron 2957U | 2 x 1400 MHz, 15 W | 200 MHz | 1000 MHz | Intel Celeron 2955U | 2 x 1400 MHz, 15 W | 200 MHz | 1000 MHz | Intel Pentium 3561Y | 2 x 1200 MHz, 11.5 W | 200 MHz | 850 MHz | Intel Pentium 3560Y | 2 x 1200 MHz, 11.5 W | 200 MHz | 850 MHz | Intel Celeron 2961Y | 2 x 1100 MHz, 11.5 W | 200 MHz | 850 MHz | min. - max. | | 200 - 400 MHz | 850 - 1100 MHz |
|
Benchmark
Performance Rating - 3DMark 11 + Fire Strike + Time Spy
3.1 pt (3%)
...
Intel HD Graphics (Haswell)
AMD Radeon HD 6450 GDDR5 3%
...
AMD Radeon RX 6800 XT 3069%
3DMark - 3DMark Ice Storm Unlimited Graphics
43493 Points (7%)
MSI CX61 2QC 2970M MS-16GD | 2970M | 8192 MB | 1100 / MHz | | 43493 |
...
AMD Radeon R2 (Stoney Ridge) -13%
Apple A9 / PowerVR GT7600 -1%
Intel HD Graphics (Haswell)
ARM Mali-G72 MP18 1%
Qualcomm Adreno 619L 3%
ARM Mali-G52 MP6 7%
Apple A9X / PowerVR Series 7XT 16%
...
3DMark - 3DMark Cloud Gate Score
min: 2141 media: 2403 media: 2335.5 (3%) massimo: 3011 Points
...
AMD Radeon R2 (Stoney Ridge) -13%
AMD Radeon R4 (Stoney Ridge) -13%
Intel HD Graphics (Haswell)
...
AMD Radeon RX 6800 XT 2884%
3DMark - 3DMark Cloud Gate Graphics
min: 3111 media: 3415 media: 3278 (2%) massimo: 4199 Points
...
AMD Radeon R4 (Stoney Ridge) -10%
AMD Radeon R2 (Stoney Ridge) -3%
Intel HD Graphics (Haswell)
Intel HD Graphics (Broadwell) 18%
...
3DMark - 3DMark Fire Strike Standard Score
min: 300 media: 324 media: 314 (1%) massimo: 383 Points
...
Intel HD Graphics (Haswell)
Intel HD Graphics (Cherry Trail) 20%
...
AMD Radeon RX 6800 XT 11832%
3DMark - 3DMark Fire Strike Standard Graphics
min: 340 media: 371 media: 362.5 (1%) massimo: 433 Points
...
Intel HD Graphics (Haswell)
...
AMD Radeon RX 6800 XT 13306%
3DMark - 3DMark Ice Storm Graphics
min: 29291 media: 34138 media: 34675 (5%) massimo: 40515 Points
...
AMD Radeon HD 6450 GDDR5 -1%
Intel HD Graphics (Haswell)
AMD Radeon R4 (Stoney Ridge) 3%
...
AMD Radeon RX 6800 XT 1229%
3DMark 11 - 3DM11 Performance Score
min: 435 media: 543 media: 544 (1%) massimo: 688 Points
...
Intel HD Graphics (Haswell)
...
AMD Radeon RX 6800 XT 6909%
3DMark 11 - 3DM11 Performance GPU
min: 384 media: 480 media: 484 (1%) massimo: 602 Points
...
Intel HD Graphics (Haswell)
...
3DMark Vantage
3DM Vant. Perf. total +3DMark Vantage - 3DM Vant. Perf. total
min: 2146 media: 2163 media: 2163 (2%) massimo: 2180 Points
...
AMD Radeon R2 (Stoney Ridge) -1%
Intel HD Graphics (Haswell)
...
AMD Radeon RX 6800 XT 4362%
3DM Vant. Perf. GPU no PhysX +3DMark Vantage - 3DM Vant. Perf. GPU no PhysX
min: 1848 media: 1859 media: 1859 (2%) massimo: 1870 Points
...
Intel HD Graphics (Haswell)
AMD Radeon R2 (Stoney Ridge) 4%
...
3DMark 06 3DMark 06 - Standard 1280x1024 +min: 2917 media: 3274 media: 3357.5 (6%) massimo: 3463 Points
...
Intel HD Graphics (Haswell)
ATI Mobility Radeon HD 5470 5%
...
AMD Radeon RX 6800 XT 1340%
Windows 7 Experience Index - Win7 Gaming graphics
6.3 Points (80%)
Intel Graphics Media Accelerator (GMA) 500 -63%
...
ATI Mobility Radeon HD 5145 -1%
Intel HD Graphics (Haswell)
AMD Radeon HD 6540G2 0%
...
Windows 7 Experience Index - Win7 Graphics
4.7 Points (59%)
...
Intel HD Graphics (Haswell)
NVIDIA NVS 2100M 4%
ATI Mobility Radeon HD 5470 5%
ATI Mobility Radeon HD 5145 5%
...
Cinebench R10 Cinebench R10 Shading (32bit) +Cinebench R10 - Cinebench R10 Shading (32bit)
min: 3867 media: 4235 media: 4215.5 (20%) massimo: 4642 punti
Intel Graphics Media Accelerator (GMA) 500 -99%
...
ATI Mobility Radeon HD 5145 -5%
ATI Mobility Radeon HD 5470 -4%
Intel HD Graphics (Haswell)
ATI Mobility Radeon HD 5165 3%
...
AMD Radeon RX 5700 XT (Desktop) 400%
Cinebench R11.5 Cinebench R11.5 OpenGL 64 Bit +Cinebench R11.5 - Cinebench R11.5 OpenGL 64 Bit
min: 9.38 media: 11.4 media: 11.6 (5%) massimo: 12.78 fps
...
ATI Mobility Radeon HD 5145 -9%
Intel HD Graphics (Haswell)
Intel HD Graphics (Broadwell) 12%
...
AMD Radeon RX 6800 XT 1391%
Cinebench R15
Cinebench R15 OpenGL 64 Bit +Cinebench R15 - Cinebench R15 OpenGL 64 Bit
min: 10.28 media: 13.2 media: 13.9 (4%) massimo: 14.59 fps
...
Intel HD Graphics (Haswell)
AMD Radeon R2 (Stoney Ridge) 14%
...
AMD Radeon RX 6800 XT 1930%
Cinebench R15 OpenGL Ref. Match 64 Bit +Cinebench R15 - Cinebench R15 OpenGL Ref. Match 64 Bit
98 % (98%)
...
Intel UHD Graphics 615 0%
Intel Iris Pro Graphics 580 0%
Intel Iris Plus Graphics G7 (Ice Lake 64 EU) 0%
Intel HD Graphics (Haswell)
Intel Iris Plus Graphics G4 (Ice Lake 48 EU) 0%
Intel Iris Plus Graphics 640 0%
Intel UHD Graphics 617 1%
...
GFXBench (DX / GLBenchmark) 2.7
GLBench 2.7 T-Rex HD Offscreen C24Z16 +GFXBench (DX / GLBenchmark) 2.7 - GLBench 2.7 T-Rex HD Offscreen C24Z16
53.5 fps (0%)
MSI CX61 2QC 2970M MS-16GD | 2970M | 8192 MB | 1100 / MHz | | 53.5 |
...
Intel HD Graphics (Broadwell) -12%
Qualcomm Adreno 512 -10%
Intel HD Graphics (Haswell)
PowerVR GM9446 7%
AMD Radeon R4 (Stoney Ridge) 7%
Qualcomm Adreno 616 17%
AMD Radeon RX 5500 XT (Desktop) 19%
...
GLBench 2.7 T-Rex HD Onscreen C24Z16 +GFXBench (DX / GLBenchmark) 2.7 - GLBench 2.7 T-Rex HD Onscreen C24Z16
59.8 fps (2%)
MSI CX61 2QC 2970M MS-16GD | 2970M | 8192 MB | 1100 / MHz | | 59.8 |
...
AMD Radeon Pro 455 0%
Apple A13 Bionic GPU 0%
Intel Iris Plus Graphics 640 0%
AMD Radeon RX 480 (Desktop) 0%
Intel HD Graphics (Haswell)
NVIDIA GeForce 930MX 0%
Apple A12 Bionic GPU 0%
...
GFXBench 3.0 - GFXBench 3.0 Manhattan Offscreen
28.7 fps (3%)
MSI CX61 2QC 2970M MS-16GD | 2970M | 8192 MB | 1100 / MHz | | 28.7 |
...
PowerVR GM9446 -6%
Intel HD Graphics (Haswell)
AMD Radeon R7 M340 0%
Intel Iris Plus Graphics 640 9%
AMD Radeon R5 (Bristol Ridge) 10%
Qualcomm Adreno 616 11%
...
AMD Radeon RX 5700 XT (Desktop) 3088%
GFXBench 3.0 - GFXBench 3.0 Manhattan
45.8 fps (13%)
MSI CX61 2QC 2970M MS-16GD | 2970M | 8192 MB | 1100 / MHz | | 45.8 |
...
ARM Mali-G76 MP4 -6%
Apple A9 / PowerVR GT7600 -1%
Intel HD Graphics (Haswell)
ARM Mali-G72 MP18 6%
Apple A10 Fusion GPU / PowerVR 7%
Qualcomm Adreno 619 8%
ARM Mali-G72 MP12 10%
...
GFXBench - GFXBench Car Chase Offscreen
11.6 fps (3%)
MSI CX61 2QC 2970M MS-16GD | 2970M | 8192 MB | 1100 / MHz | | 11.6 |
...
PowerVR GM9446 -25%
Qualcomm Adreno 512 -24%
ARM Mali-G52 MP2 -19%
AMD Radeon R2 (Stoney Ridge) -10%
Intel HD Graphics (Haswell)
Qualcomm Adreno 616 8%
AMD Radeon R4 (Stoney Ridge) 16%
Qualcomm Adreno 619L 21%
ARM Mali-T880 MP12 29%
ARM Mali-G71 MP8 35%
Intel UHD Graphics 615 39%
...
GFXBench - GFXBench Car Chase Onscreen
20.5 fps (8%)
MSI CX61 2QC 2970M MS-16GD | 2970M | 8192 MB | 1100 / MHz | | 20.5 |
...
Intel UHD Graphics 615 -14%
Apple A10 Fusion GPU / PowerVR -13%
AMD Radeon R4 (Stoney Ridge) -11%
ARM Mali-G52 MP6 -9%
ARM Mali-G72 MP12 -3%
Intel HD Graphics (Haswell)
ARM Mali-G76 MP10 17%
Intel Iris Plus Graphics G7 (Ice Lake 64 EU) 18%
Qualcomm Adreno 619 20%
ARM Mali-G76 MP12 20%
...
NVIDIA GeForce RTX 2080 Super Mobile 1115%
LuxMark v2.0 64Bit - LuxMark v2.0 Room GPU
min: 77 media: 93 media: 93 (1%) massimo: 109 Samples/s
...
Intel HD Graphics (Broadwell) -8%
AMD Radeon R4 (Stoney Ridge) -5%
Intel HD Graphics (Haswell)
...
LuxMark v2.0 64Bit - LuxMark v2.0 Sala GPU
min: 115 media: 140 media: 140 (0%) massimo: 165 Samples/s
...
AMD Radeon R2 (Stoney Ridge) -19%
Intel HD Graphics (Haswell)
...
AMD Radeon RX 6800 XT 19916%
ComputeMark v2.1 - ComputeMark v2.1 Result
min: 355 media: 370 media: 370 (1%) massimo: 385 punti
...
Intel HD Graphics (Haswell)
Intel HD Graphics (Broadwell) 1%
...
Power Consumption - Furmark Stress Test Power Consumption - external Monitor *
43.7 Watt (8%)
MSI CX61 2QC 2970M MS-16GD | 2970M | 8192 MB | 1100 / MHz | | 43.7 |
...
NVIDIA Quadro P520 -15%
AMD Radeon RX Vega 9 -3%
AMD Radeon RX Vega 8 (Ryzen 2000/3000) -3%
Intel HD Graphics (Haswell)
Intel UHD Graphics 630 3%
Intel Iris Plus Graphics 650 18%
...
Power Consumption - The Witcher 3 Power Consumption - external Monitor *
30.5 Watt (5%)
MSI CX61 2QC 2970M MS-16GD | 2970M | 8192 MB | 1100 / MHz | | 30.5 |
...
Intel Iris Plus Graphics G7 (Ice Lake 64 EU) -26%
AMD Radeon RX Vega 7 -12%
Intel Iris Xe Graphics G7 96EUs -9%
Intel HD Graphics (Haswell)
Intel Iris Plus Graphics 640 10%
AMD Radeon RX Vega 8 (Ryzen 2000/3000) 30%
AMD Radeon RX Vega 9 32%
...
AMD Radeon RX 6800 XT 1556%
- Valori di benchmark per questa scheda grafica

- Valori medi di benchmark per questa scheda grafica
* Numeri più piccoli rappresentano prestazioni supeiori
Benchmarks per i giochi
I seguenti benchmarks deirivano dai benchmarks dei portatili recensiti. Le prestazioni dipendono dalla scheda grafica utilizzata, dal clock rate, dal processore, dai settaggi di sistema, dai drivers, e dai sistemi operativi. Quindi i risultati non sono rappresentativi per i portatili con questa GPU. Per informazioni dettagliate sui risultati del benchmark, cliccate sul numero di fps.
...
Intel HD Graphics (Haswell)
AMD Radeon R5 (Bristol Ridge)
...
NVIDIA Titan RTX
4.9 (!) [X] MSI CX61 2QC 2970M MS-16GDIntel Celeron 2970M 2.2GHz
HD Graphics (Haswell)
Si sono verificati dei problemi durante il benchmarking: piccoli problemi grafici min:
1 fps, max:
7 fps
fps
+ Confronta
- Nascondi il confronto
Intel HD Graphics (Haswell)
AMD Radeon R4 (Stoney Ridge) 35%
Intel UHD Graphics 615 55%
AMD Radeon R5 (Bristol Ridge) 86%
...
» Il Benchmark indica che il gioco non è utilizzabile con i settaggi testati.
...
AMD Radeon R4 (Stoney Ridge) -15%
AMD Radeon R5 (Bristol Ridge) -11%
Intel UHD Graphics 615 -8%
Intel HD Graphics (Haswell)
...
Intel HD Graphics (Haswell)
AMD Radeon R5 (Bristol Ridge) 8%
Intel UHD Graphics 615 16%
Intel UHD Graphics G1 (Ice Lake 32 EU) 61%
...
» Il Benchmark indica che il gioco non è utilizzabile con i settaggi testati.
Intel HD Graphics (Haswell)
...
» Il Benchmark indica che il gioco non è utilizzabile con i settaggi testati.
Intel HD Graphics (Haswell)
AMD Radeon R5 (Bristol Ridge) 38%
...
» Il Benchmark indica che il gioco non è utilizzabile con i settaggi testati.
...
AMD Radeon RX Vega 10 -20%
Intel UHD Graphics 615 -16%
AMD Radeon 540X -4%
Intel HD Graphics (Haswell)
AMD Radeon RX Vega 8 (Ryzen 2000/3000) 8%
Intel UHD Graphics G1 (Ice Lake 32 EU) 22%
...
AMD Radeon Pro 560X 176%
AMD Radeon R2 (Stoney Ridge) -35%
AMD Radeon R4 (Stoney Ridge) -21%
Intel HD Graphics (Haswell)
AMD Radeon R5 (Bristol Ridge) 34%
AMD Radeon RX Vega 10 52%
...
AMD Radeon Pro 560X 512%
» Giocabile con tutti i portatili testati con dettagli basso.
Intel HD Graphics (Haswell)
AMD Radeon R4 (Stoney Ridge) 79%
...
» Il Benchmark indica che il gioco non è utilizzabile con i settaggi testati.
...
AMD Radeon R2 (Stoney Ridge) -32%
AMD Radeon R4 (Stoney Ridge) -31%
Intel UHD Graphics 615 -9%
Intel HD Graphics (Haswell)
...
Intel HD Graphics (Haswell)
Intel UHD Graphics 615 1%
AMD Radeon R5 (Bristol Ridge) 43%
...
» Giocabile con tutti i portatili testati con dettagli basso.
...
Intel HD Graphics (Haswell)
...
NVIDIA GeForce GTX 1080 (Desktop)
Intel HD Graphics (Haswell)
AMD FirePro W4190M 33%
AMD Radeon R4 (Stoney Ridge) 37%
...
NVIDIA GeForce GTX 1080 (Desktop) 2816%
» Il Benchmark indica che il gioco non è utilizzabile con i settaggi testati.
Intel HD Graphics (Cherry Trail) -41%
AMD Radeon R4 (Stoney Ridge) -2%
Intel HD Graphics (Haswell)
AMD Radeon R2 (Stoney Ridge) 13%
AMD Radeon R5 (Bristol Ridge) 56%
...
Intel HD Graphics (Haswell)
AMD Radeon R4 (Stoney Ridge) 15%
AMD Radeon R2 (Stoney Ridge) 22%
...
Intel HD Graphics (Haswell)
AMD Radeon RX Vega 10 135%
AMD Radeon R7 M445 168%
...
NVIDIA GeForce GTX 1060 (Desktop) 3837%
» Giocabile con tutti i portatili testati con dettagli basso.
AMD Radeon R4 (Stoney Ridge) -42%
Intel HD Graphics (Haswell)
AMD Radeon R5 (Bristol Ridge) 17%
...
NVIDIA GeForce GTX 1080 (Desktop) 1318%
» Il Benchmark indica che il gioco non è utilizzabile con i settaggi testati.
Intel HD Graphics (Haswell)
Intel UHD Graphics 630 60%
AMD Radeon R5 (Bristol Ridge) 70%
...
Intel HD Graphics (Haswell)
AMD Radeon R5 (Bristol Ridge) 92%
...
NVIDIA GeForce GTX 1080 (Desktop) 2365%
» Il Benchmark indica che il gioco non è utilizzabile con i settaggi testati.
...
AMD Radeon R2 (Stoney Ridge) -33%
AMD Radeon R4 (Stoney Ridge) -21%
Intel HD Graphics (Haswell)
Intel UHD Graphics 615 15%
AMD Radeon R5 (Bristol Ridge) 25%
...
NVIDIA Titan RTX 1049%
AMD Radeon R2 (Stoney Ridge) -8%
Intel HD Graphics (Haswell)
AMD Radeon R4 (Stoney Ridge) 4%
Intel UHD Graphics 615 33%
...
NVIDIA Titan RTX 1740%
» Il Benchmark indica che il gioco non è utilizzabile con i settaggi testati.
...
Intel HD Graphics (Haswell)
AMD Radeon R7 M340
...
Intel HD Graphics (Haswell)
AMD Radeon R5 (Bristol Ridge) 57%
...
» Il Benchmark indica che il gioco non è utilizzabile con i settaggi testati.
Intel HD Graphics (Haswell)
...
» Il Benchmark indica che il gioco non è utilizzabile con i settaggi testati.
Intel HD Graphics (Haswell)
AMD Radeon R5 (Bristol Ridge) 44%
...
» Il Benchmark indica che il gioco non è utilizzabile con i settaggi testati.
Intel HD Graphics (Haswell)
Intel Iris Plus Graphics G4 (Ice Lake 48 EU) 9%
Intel UHD Graphics 615 29%
...
AMD Radeon RX 6800 XT 4560%
Intel HD Graphics (Haswell)
Intel UHD Graphics 615 53%
...
Intel HD Graphics (Haswell)
Intel UHD Graphics 615 112%
AMD Radeon R5 (Bristol Ridge) 148%
AMD Radeon R6 M340DX 160%
...
AMD Radeon RX 6800 XT 10220%
Intel HD Graphics (Haswell)
AMD Radeon R6 M340DX 78%
...
» Il Benchmark indica che il gioco non è utilizzabile con i settaggi testati.
Intel HD Graphics (Cherry Trail) -16%
Intel HD Graphics (Haswell)
AMD Radeon R2 (Stoney Ridge) 49%
...
Intel HD Graphics (Cherry Trail) -21%
Intel HD Graphics (Haswell)
AMD Radeon R2 (Stoney Ridge) 55%
...
» Il Benchmark indica che il gioco non è utilizzabile con i settaggi testati.
Intel HD Graphics (Haswell)
AMD Radeon R5 (Bristol Ridge) 14%
...
NVIDIA Titan X Pascal 1404%
» Il Benchmark indica che il gioco non è utilizzabile con i settaggi testati.
0 (!) [X] MSI CX61 2QC 2970M MS-16GDIntel Celeron 2970M 2.2GHz
HD Graphics (Haswell)
Si sono verificati dei problemi durante il benchmarking: il gioco non si è avviato Black screen: dual core fps
+ Confronta
- Nascondi il confronto
Intel HD Graphics (Cherry Trail)
...
Intel HD Graphics (Haswell)
Intel HD Graphics (Cherry Trail)
Intel HD Graphics (Broadwell)
...
...
AMD Radeon R4 (Stoney Ridge) -28%
AMD Radeon R5 (Bristol Ridge) 0%
Intel HD Graphics (Haswell)
AMD Radeon R6 M340DX 15%
...
NVIDIA GeForce GTX 1080 (Desktop) 468%
...
AMD Radeon R2 (Stoney Ridge) -16%
Intel HD Graphics (Broadwell) -14%
AMD Radeon R4 (Stoney Ridge) -8%
Intel HD Graphics (Haswell)
AMD Radeon HD 6450 GDDR5 20%
AMD Radeon R5 (Bristol Ridge) 21%
...
NVIDIA GeForce GTX 1080 (Desktop) 705%
Intel HD Graphics (Haswell)
AMD Radeon HD 6450 GDDR5 1%
AMD Radeon R5 (Bristol Ridge) 48%
...
NVIDIA GeForce GTX 1080 (Desktop) 1365%
» Giocabile con tutti i portatili testati con dettagli basso.
Intel HD Graphics (Haswell)
Intel UHD Graphics 615 21%
...
AMD Radeon RX 6800 XT 6597%
Intel UHD Graphics 615 -2%
Intel HD Graphics (Haswell)
...
Intel HD Graphics (Haswell)
AMD Radeon R7 M260 29%
...
AMD Radeon RX 6800 XT 9384%
» Il Benchmark indica che il gioco non è utilizzabile con i settaggi testati.
...
AMD Radeon R4 (Stoney Ridge) -7%
Intel HD Graphics (Broadwell) -5%
Intel HD Graphics (Haswell)
AMD Radeon RX Vega 8 (Ryzen 2000/3000) 13%
AMD Radeon R5 (Bristol Ridge) 25%
...
...
Intel HD Graphics (Cherry Trail) -2%
Intel HD Graphics (Haswell)
AMD Radeon R2 (Stoney Ridge) 2%
Intel HD Graphics (Broadwell) 5%
...
NVIDIA GeForce GTX 1060 (Desktop) 1517%
» Giocabile con tutti i portatili testati con dettagli basso.
AMD Radeon R2 (Stoney Ridge) -58%
...
AMD Radeon R4 (Stoney Ridge) -5%
Intel HD Graphics (Haswell)
AMD Radeon R5 (Bristol Ridge) 43%
Intel HD Graphics (Broadwell) 50%
...
AMD Radeon R2 (Stoney Ridge) -56%
Intel HD Graphics (Haswell)
AMD Radeon R4 (Stoney Ridge) 7%
AMD Radeon R5 (Bristol Ridge) 14%
Intel HD Graphics (Broadwell) 46%
...
» Il Benchmark indica che il gioco non è utilizzabile con i settaggi testati.
Intel HD Graphics (Haswell)
...
Intel HD Graphics (Haswell)
...
» Il Benchmark indica che il gioco non è utilizzabile con i settaggi testati.
Intel HD Graphics (Haswell)
...
Intel HD Graphics (Haswell)
...
» Il Benchmark indica che il gioco non è utilizzabile con i settaggi testati.
Intel HD Graphics (Cherry Trail) -13%
Intel HD Graphics (Haswell)
AMD Radeon R2 (Stoney Ridge) 3%
Intel HD Graphics (Broadwell) 28%
AMD Radeon R4 (Stoney Ridge) 39%
...
NVIDIA GeForce GTX 1080 (Desktop) 2423%
Intel HD Graphics (Cherry Trail) -19%
Intel HD Graphics (Haswell)
AMD Radeon R2 (Stoney Ridge) 24%
...
NVIDIA GeForce GTX 1060 (Desktop) 2743%
» Il Benchmark indica che il gioco non è utilizzabile con i settaggi testati.
...
Intel HD Graphics (Cherry Trail) -48%
AMD Radeon R2 (Stoney Ridge) -10%
AMD Radeon R4 (Stoney Ridge) -3%
Intel HD Graphics (Haswell)
Intel HD Graphics (Broadwell) 10%
...
...
Intel HD Graphics (Cherry Trail) -40%
AMD Radeon R2 (Stoney Ridge) -10%
Intel HD Graphics (Haswell)
Intel HD Graphics (Broadwell) 20%
...
» Il Benchmark indica che il gioco non è utilizzabile con i settaggi testati.
Intel HD Graphics (Haswell)
...
Intel HD Graphics (Haswell)
...
» Il Benchmark indica che il gioco non è utilizzabile con i settaggi testati.
...
AMD Radeon R2 (Stoney Ridge) -18%
Intel HD Graphics (Haswell)
AMD Radeon R7 M260 19%
...
NVIDIA GeForce GTX 1060 (Desktop) 1432%
AMD Radeon R2 (Stoney Ridge) -20%
Intel HD Graphics (Haswell)
...
NVIDIA GeForce GTX 1060 (Desktop) 2303%
» Il Benchmark indica che il gioco non è utilizzabile con i settaggi testati.
Intel HD Graphics (Haswell)
...
Intel HD Graphics (Haswell)
AMD Radeon R4 (Stoney Ridge) 40%
...
» Il Benchmark indica che il gioco non è utilizzabile con i settaggi testati.
Intel HD Graphics (Cherry Trail) -5%
Intel HD Graphics (Haswell)
...
Intel HD Graphics (Haswell)
...
» Il Benchmark indica che il gioco non è utilizzabile con i settaggi testati.
...
AMD Radeon 540X -9%
Intel HD Graphics (Broadwell) -8%
Intel HD Graphics (Haswell)
AMD Radeon R7 M260